Preprint
Article

Enhancing Aerodynamic Performance in UAV Design: CFD Analysis

Altmetrics

Downloads

106

Views

61

Comments

0

Submitted:

03 September 2024

Posted:

05 September 2024

You are already at the latest version

Alerts
Abstract
This paper presents a comprehensive study on the design and aerodynamic optimization of a hybrid surveillance drone, conducted within the academic framework of Abu Dhabi University. The research primarily focuses on the comparison between flying wing and conventional aircraft layouts, with an emphasis on reducing drag coefficients and enhancing stall behavior through integrated design strategies. Utilizing SST k-omega viscous model (CFD) simulations, the study evaluates the aerodynamic performance of the drone model, analyzing lift, drag, and pitching moment coefficients against existing models. The paper further explores winglet selection and propeller dynamics, aiming to optimize the lift-to-drag ratio and achieve desired lift-to-weight ratios through careful consideration of propeller-wing interactions. Findings from the study indicate a notable improvement in aerodynamic efficiency, with the new drone model achieving a maximum lift coefficient (Cl, max) of 0.746, a minimum drag coefficient (Cd, min) of 0.039, and a peak lift-to-drag ratio (Cl/Cd) of 8.507. The research contributes significantly to the fields of Aerospace Engineering and Mechanical Engineering, providing a foundation for future advancements in drone design and application.
Keywords: 
Subject: Engineering  -   Mechanical Engineering

1. Introduction

In recent years, the realm of unmanned aerial vehicles (UAVs), particularly hybrid drones, has undergone substantial evolution, propelled by technological advancements and a growing spectrum of application demands. Hybrid drones, which integrate the vertical takeoff and landing (VTOL) capabilities of multirotors with the aerodynamic efficiency and extended range of fixed-wing aircraft, represent a significant leap forward in UAV design [1]. This fusion aims to surmount the limitations inherent in conventional drone designs, offering a versatile platform capable of operating in diverse environments. Previous studies have shed light on several key breakthroughs in this area, including improved energy efficiency, augmented payload capacities, and enhanced operational flexibility [2]. Such advancements underscore the potential of hybrid UAVs to revolutionize industries ranging from logistics and agriculture to surveillance and environmental monitoring. The application of drones in surveillance, particularly, has seen remarkable innovation, with UAVs being increasingly equipped with sophisticated imaging and sensing technologies [3]. These advancements enable drones to perform a wide array of tasks, from urban security patrols to the monitoring of ecological changes, with unparalleled precision and reliability. The capacity for real-time data collection and analysis has not only bolstered the effectiveness of surveillance efforts but has also paved the way for drones to play a pivotal role in disaster response, wildlife conservation, and border security operations.
Moreover, the quest for aerodynamic optimization has emerged as a focal point of UAV research and development [4]. The design intricacies of drone components, including the fuselage, wings, and propellers, are crucial determinants of a UAV’s flight efficiency, maneuverability, and energy consumption. Aerodynamic enhancements, such as the integration of winglets and the optimization of airfoil configurations, have been shown to significantly mitigate vortex drag and improve the lift-to-drag ratio [5]. These improvements have profound implications, not only extending the operational range and flight duration of UAVs but also contributing to their environmental sustainability by curtailing power requirements. Incorporating these insights, the present study seeks to contribute to the burgeoning field of hybrid drone development, with a particular focus on aerodynamic efficiency and surveillance capability. Through the design and optimization of a novel drone model, this research aims to address the dual objectives of enhancing aerodynamic performance and maximizing operational utility in surveillance applications. The integration of advanced CFD simulations, alongside empirical testing, provides a comprehensive understanding of the aerodynamic characteristics of the proposed design, setting the foundation for future innovations in UAV technology [6].
A pivotal aspect of enhancing UAV performance lies in the aerodynamic optimization of its constituent components. Figure 1-1 shows the components of a hybrid drone: the fuselage, wings, and propellers stand out as critical elements where aerodynamic improvements can yield substantial benefits. The fuselage design, for instance, can be optimized to reduce drag and improve airflow around the drone, thereby enhancing efficiency and stability during flight. Similarly, wings, integral to generating lift, offer vast potential for aerodynamic refinement. The adoption of advanced airfoil shapes can significantly increase lift-to-drag ratios, allowing for extended flight durations and reduced energy consumption. Additionally, the design of propellers, which are essential for thrust generation and maneuverability, can be optimized to minimize energy loss and noise, further enhancing the UAV’s operational efficiency. The interplay between these components and their aerodynamic characteristics underscores the multifaceted approach required to elevate UAV performance. Through targeted design interventions, it is possible to achieve a harmonious balance between lift, drag, and thrust, paving the way for UAVs that are not only more capable but also more versatile across a range of applications. This holistic approach to aerodynamic optimization forms a cornerstone of contemporary UAV development, driving advancements that extend the frontier of what is possible in drone technology.
Transitioning from the overarching context of UAV design and its impact on aerodynamic efficiency, the focus shifts to the components of a drone—ranging from its fuselage to the wings and propellers—which harbor substantial potential for optimization. Thoughtful design of these elements can markedly enhance the UAV’s performance, broadening its operational range, flight duration, and overall utility. With a foundation in the principles and current advancements in drone aerodynamics, the discourse moves towards the specific investigation detailed in the next chapter. “Design Geometry” embarks on an in-depth exploration of the novel hybrid drone model, elucidating the structural distinctions that define this design. It concentrates on the integration between flying wing and conventional aircraft layouts, and the aerodynamic advantages such hybridization presents. Through precise design considerations and Wind Tunnel CFD simulations, this section is poised to unveil the blueprint of an optimized UAV, paving the way for a thorough analysis of its aerodynamic characteristics and performance capabilities.

2. Design Geometry

2.1. Detailed Design

The main structural difference between the flying wing and the conventional aircraft layout is the tail and the size of the wings. The flying wing layout consists of a fuselage and wings and is some application, wings only. The main advantage that the flying wing layout possesses over the conventional layout is the lowered drag coefficient. This is because the flying wing has no fuselage and a tail, and it can obtain a 40% theoretical improvement for a specified aspect ratio [7]. In addition, the flying wing has good stall behavior and a low tendency to spin, and manufacturing the flying wing is theoretically less expensive.
However, one of the design requirements is to contain all, if not, most of the drone components such as the battery, control systems components, camera, etc. within the drone to reduce pressure drag induced by parasitical drag. For that reason, the fuselage is included in the design. Figure 2-1 shows the Parameters of a flying wing.

2.1.1. Parameters Definition, Assumptions, and Airfoils Selection

  • Aspect ratio (AR): the ratio between the wingspan and the average width of the wing.
  • Root chord (CR): the length of the chord where the wing joins the fuselage.
  • Tip chord (CT): the length of the chord at the tip of the wing.
  • Taper ratio (λ): the ratio of the tip chord to the root chord.
  • Sweepback angle (Λ): the angle of the leading edge of the wings.
  •  Mean aerodynamic chord (MAC): the average width or chord of the wing
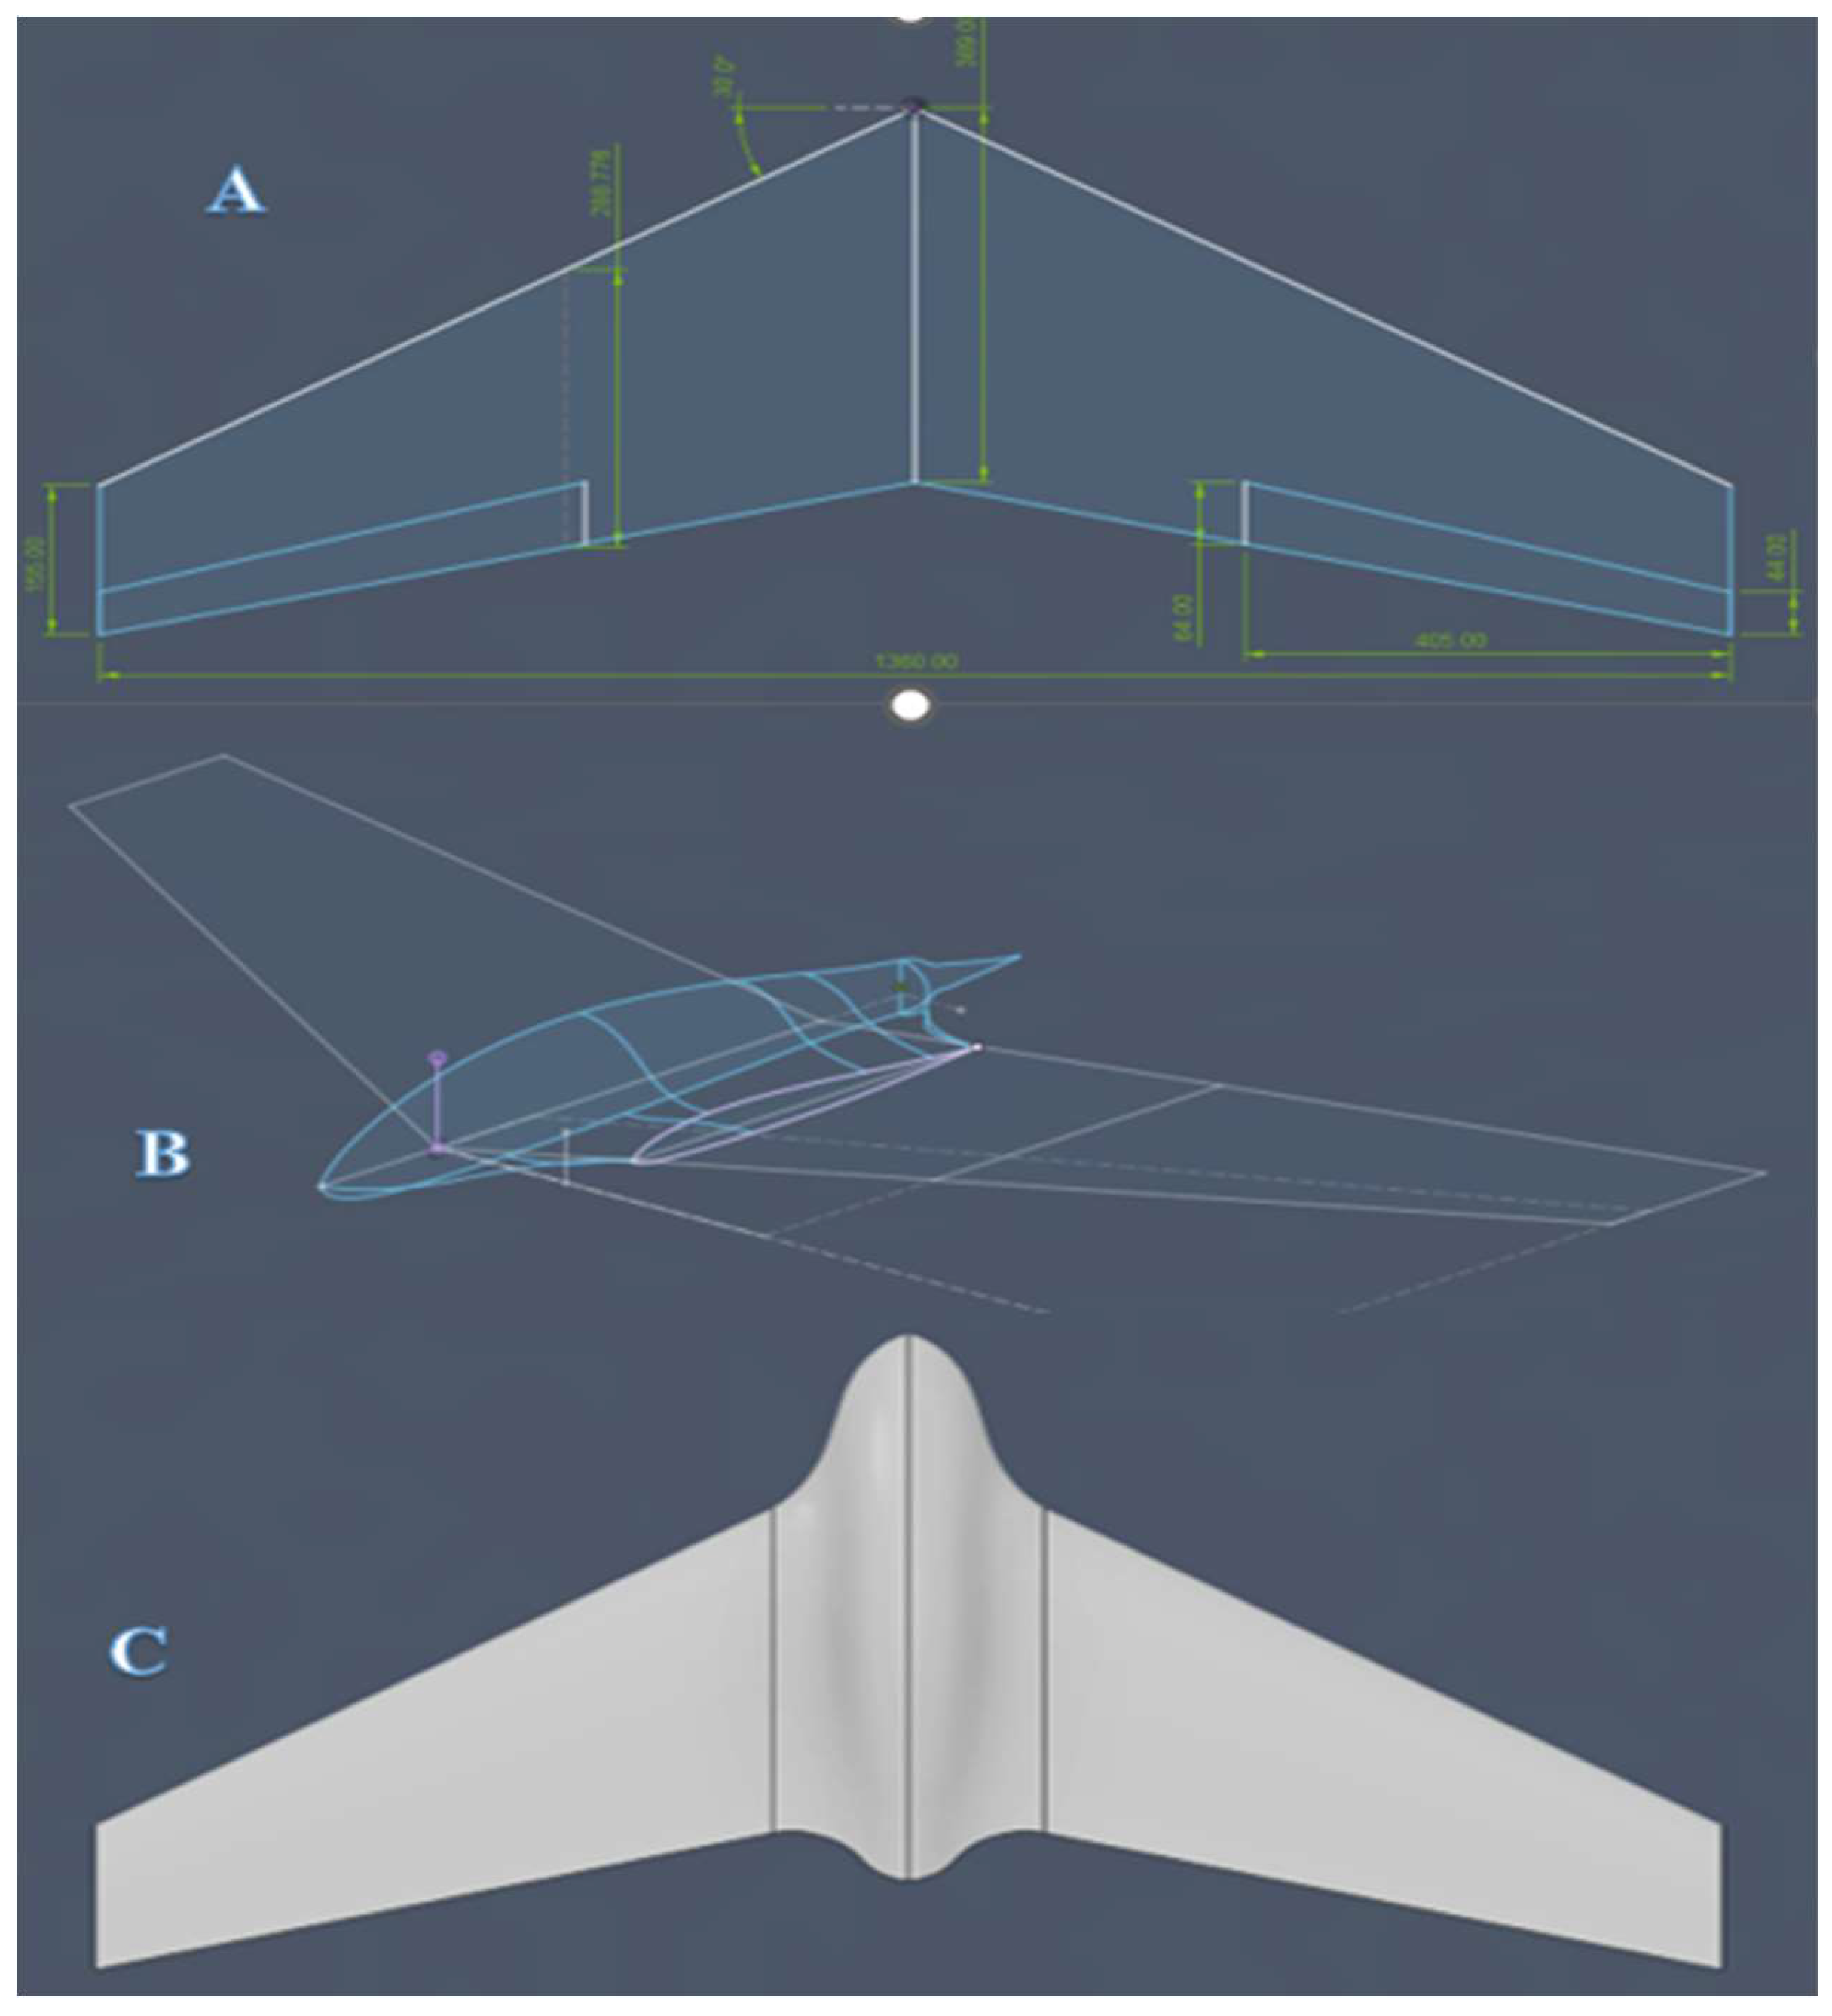
In a study done by Abbas and Abdelrahman in 2015, the panel method generated using MATLAB code was used to study the effects of changing the sweepback angle, aspect ratio, taper ratio, and wingspan on the lift, drag and moment to obtain the parameters that produce the highest lift coefficient, lowest drag coefficient, and max negative moment coefficient slope. It was concluded from the study that the optimum geometrical parameters are an aspect ratio (AR) of 5, a sweepback angle (Λ) of 30 degrees, and a taper ratio (λ) of 0.7 [8]. Table 2-1 below represents the design dimension of the wing and aileron which is also shown in Figure 2-2.

3. Wind Tunnel CFD Simulation

In this section, a CFD wind tunnel analysis will be performed on the base model to generate and plot the information about the lift, drag, and pitching moment coefficients, as well as perform the same analysis on the older existing VTOL glider and compare the lift and drag coefficient values.
Table 3-1 shows the testing parameters for both models:

3.1. Geometric Setup

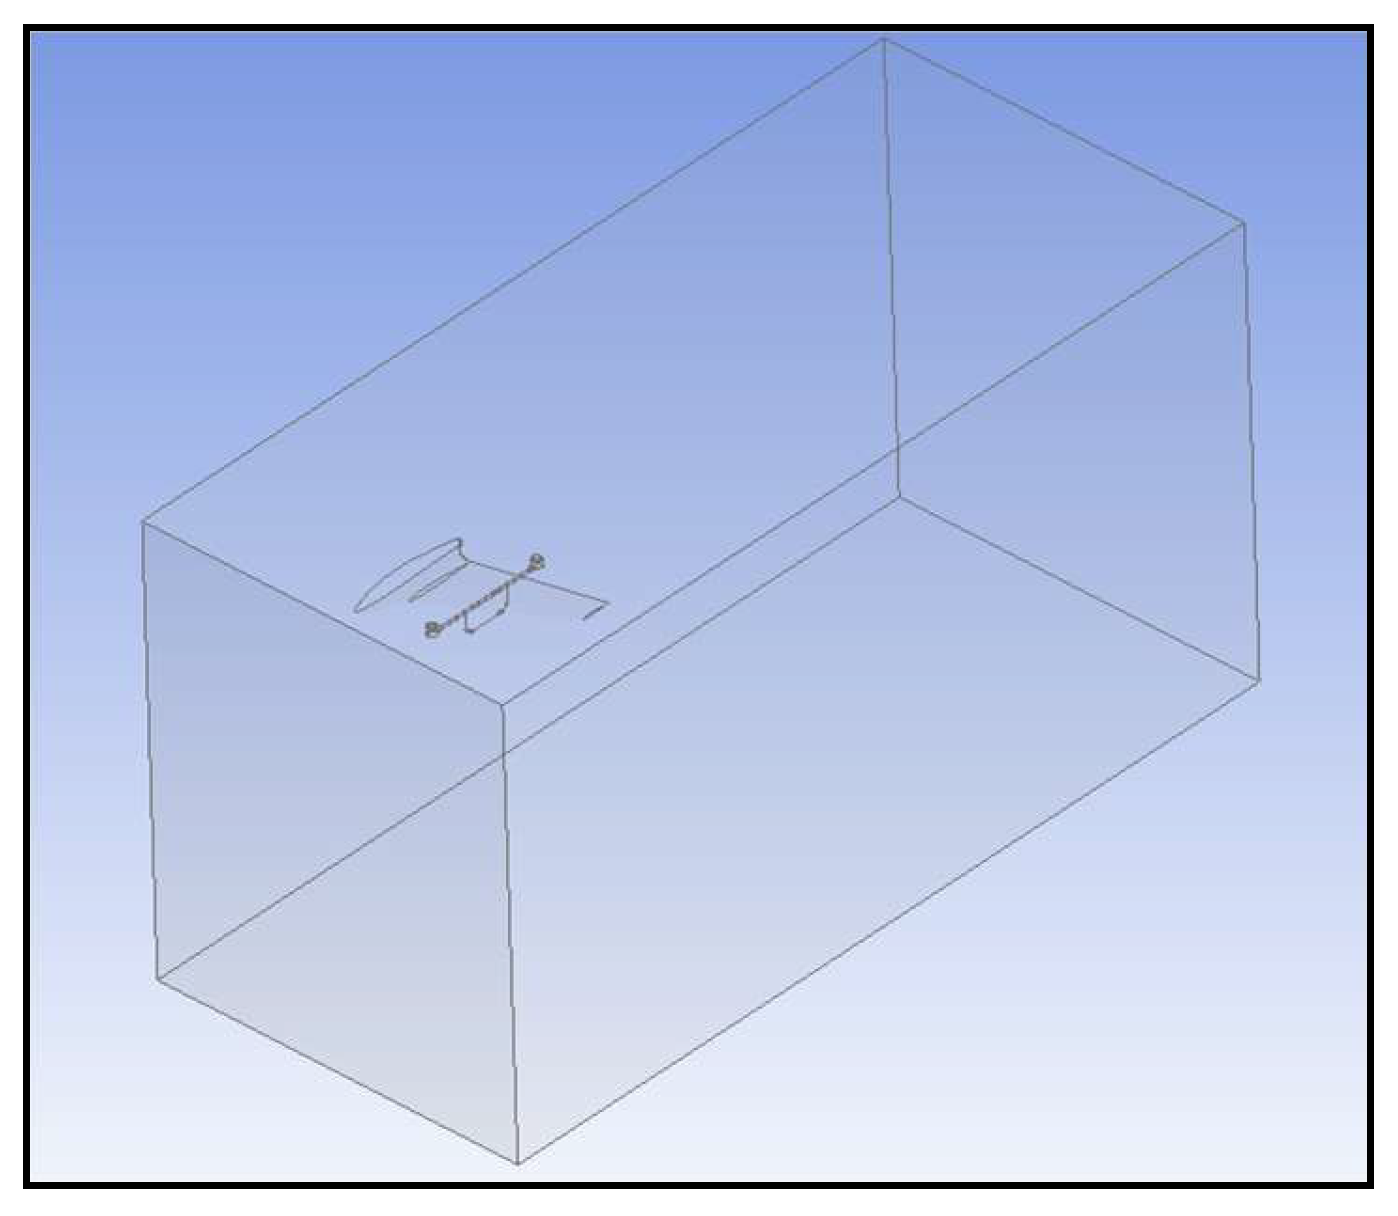
The first step is to import the design from Autodesk Fusion 360 to ANSYS Workbench as a step file as shown in Figure 3-1. The model will be edited in Design Modeler where a “rotate” body transformation is created to change the attack angle of the flying wing model. In addition, an enclosure is created around the model acting as the wind tunnel from which, the body of the flying wing is subtracted, and finally, the axis of symmetry is defined to reduce the size of the model to save time and increase the number of elements.

3.2. Meshing

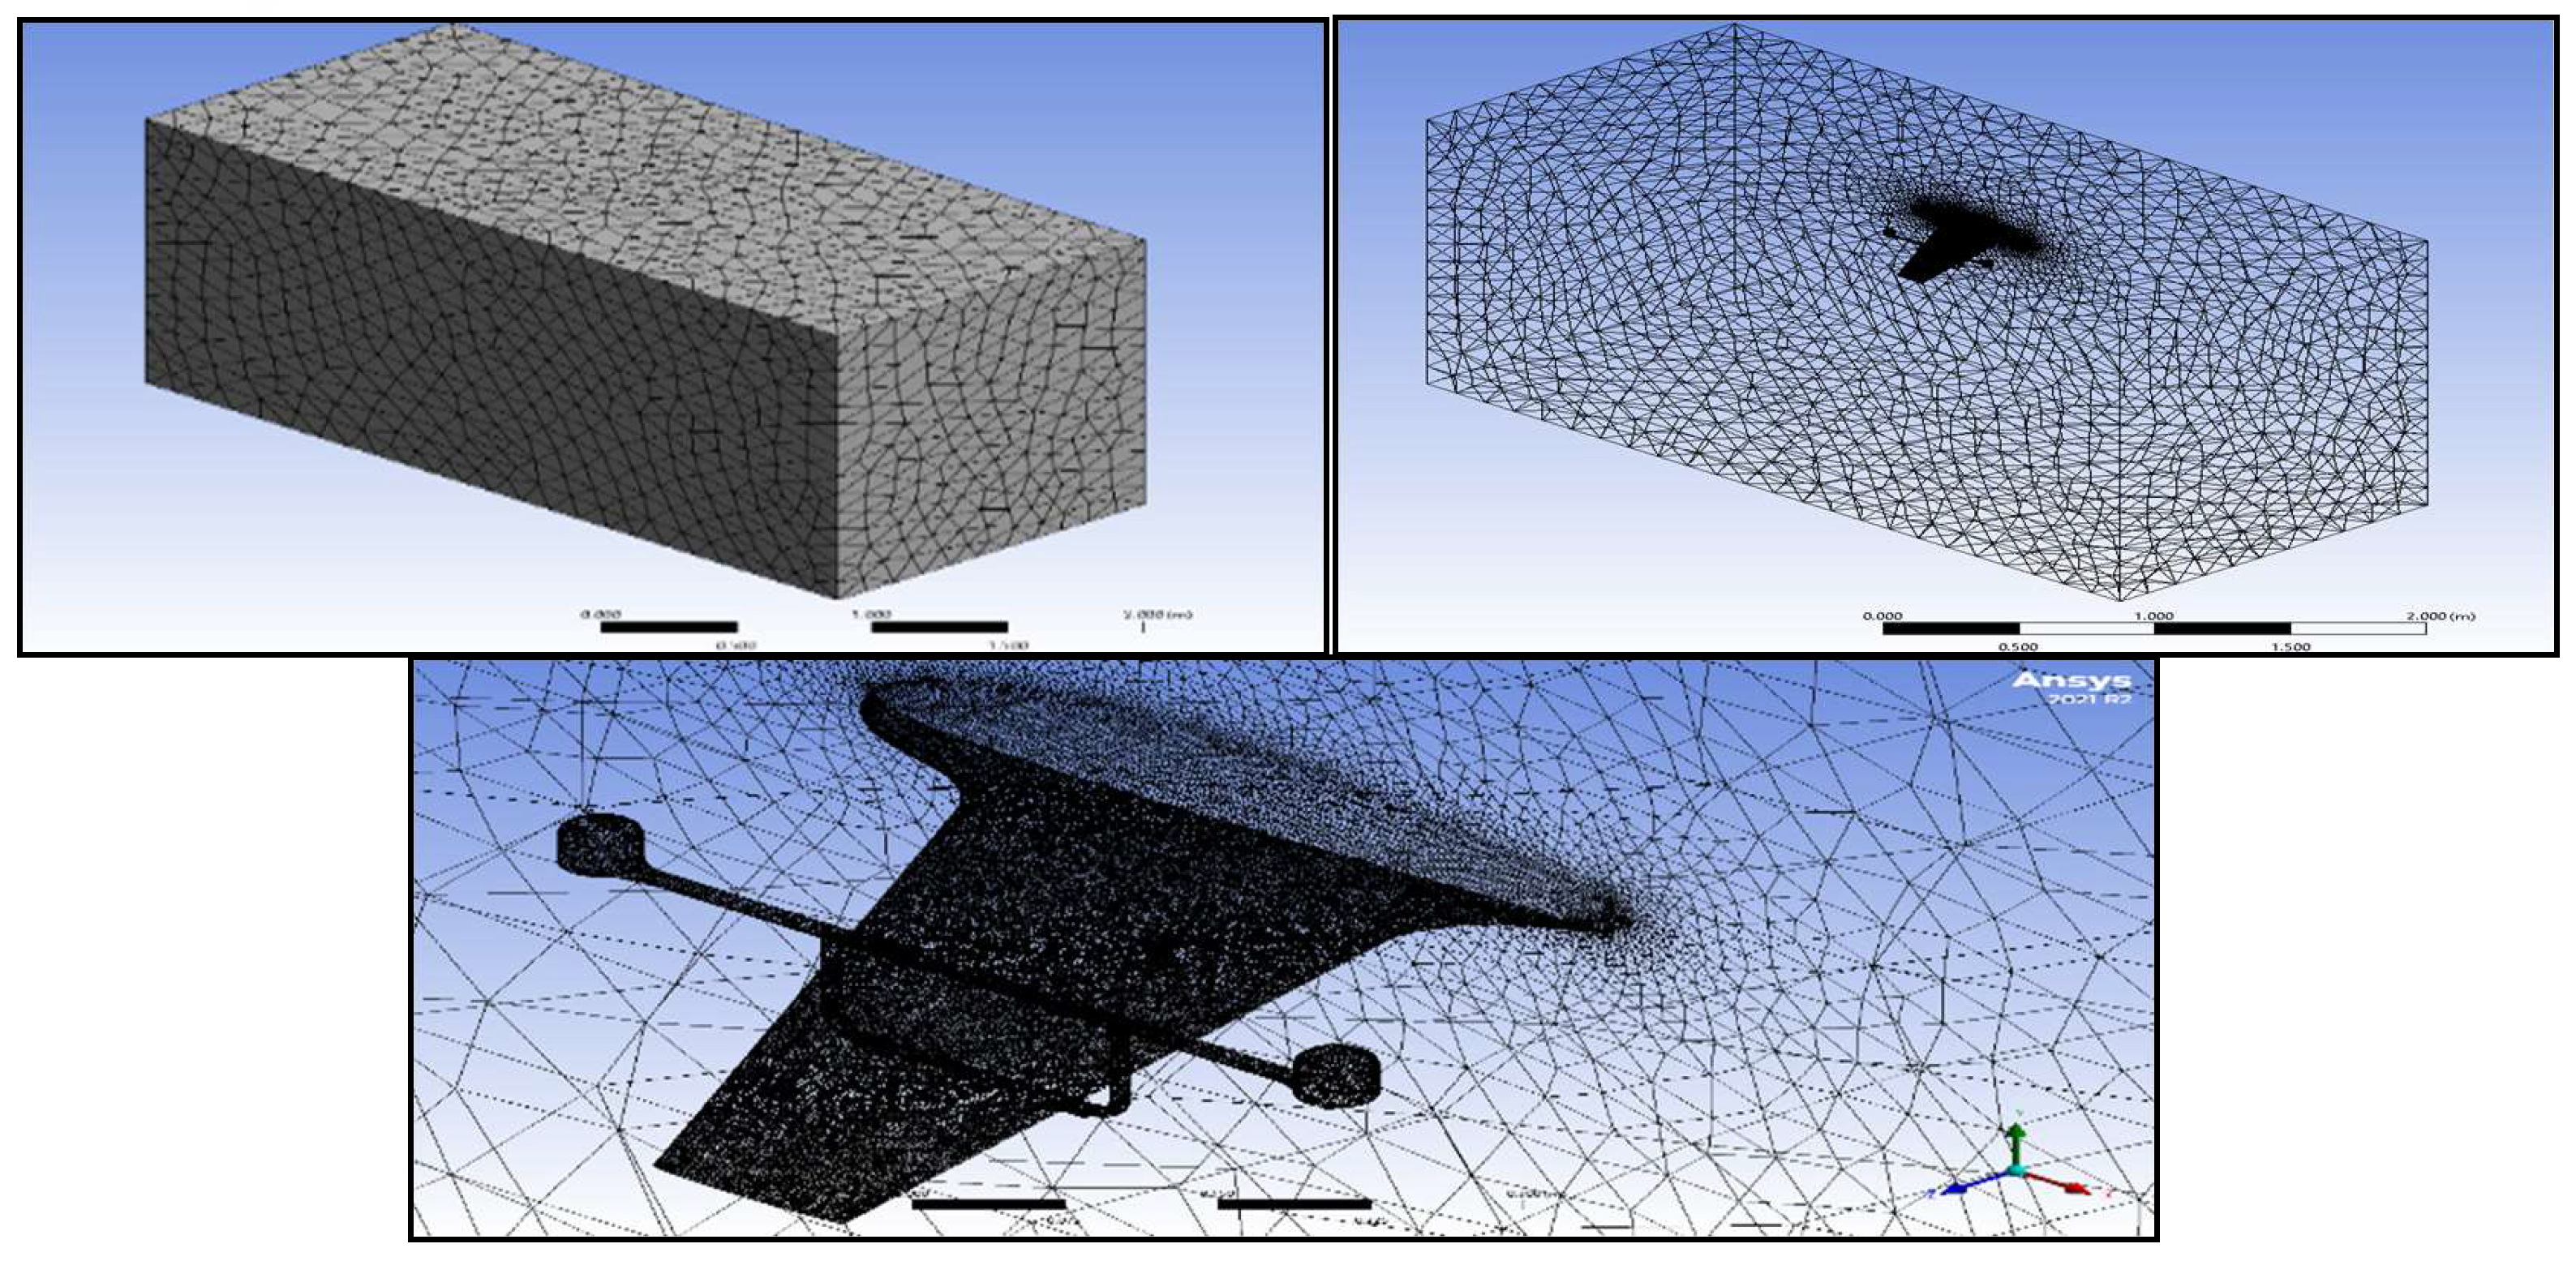
Figure 3-2 shows the element that is used in the meshing process is a linear tetrahedral element. This element is the element used by default in ANSYS for having a high results accuracy balanced with the required computation time. The tetrahedral element in this case has 4 nodes per element and 4 degrees of freedom per node which are velocities in x, y, z, and the pressure. As shown in the mesh quality Graph, almost all the elements are in the range of 0.5 to 1, with an average quality of 0.83 which is acceptable.

3.3. Analysis Setup

3.3.1. Models

k-omega viscous model is one of the most used turbulence models, and it is a part of the RANS (Reynolds-averaged Navier-Stokes) turbulent models that show the turbulent flow effects. It is a model with two equations. That indicates that it also resolves two transport equations (PDEs), which consider the historical effects like convection and diffusion of turbulent energy, in addition to the conservation equations. The two transported variables are the turbulent dissipation rate (ω), which establishes the rate of dissipation per unit of turbulent kinetic energy, and turbulent kinetic energy (k), which establishes the energy in turbulence. The scale of turbulence is another name for ω. The SST (shear stress transport) formulation makes it possible to switch the k- ϵ model in the free stream to prevent the sensitivity problem of k-ω to the free stream turbulence properties. The k-omega SST model offers more accurate flow separation predictions compared to most RANS models and for that, it is the most used model for solving engineering problems [9].
Equation 3-1: Turbulent Kinetic Energy (k) Equation
δ ( ρ k ) δ t + δ ( ρ k u i ) δ x i = P k β ρ ω k + δ δ x i μ + σ k μ t δ k δ x j
Equation 3-2: Specific Rate of Dissipation (ω) Equation
( ρ ω ) t + ( ω u i ) x i = α ω k P k β ρ ω 2 + x j μ + σ ω μ t ω x j + 2 1 F 1 ρ σ ω 2 1 ω k x j ω x j

3.4. CFD Results & Discussion

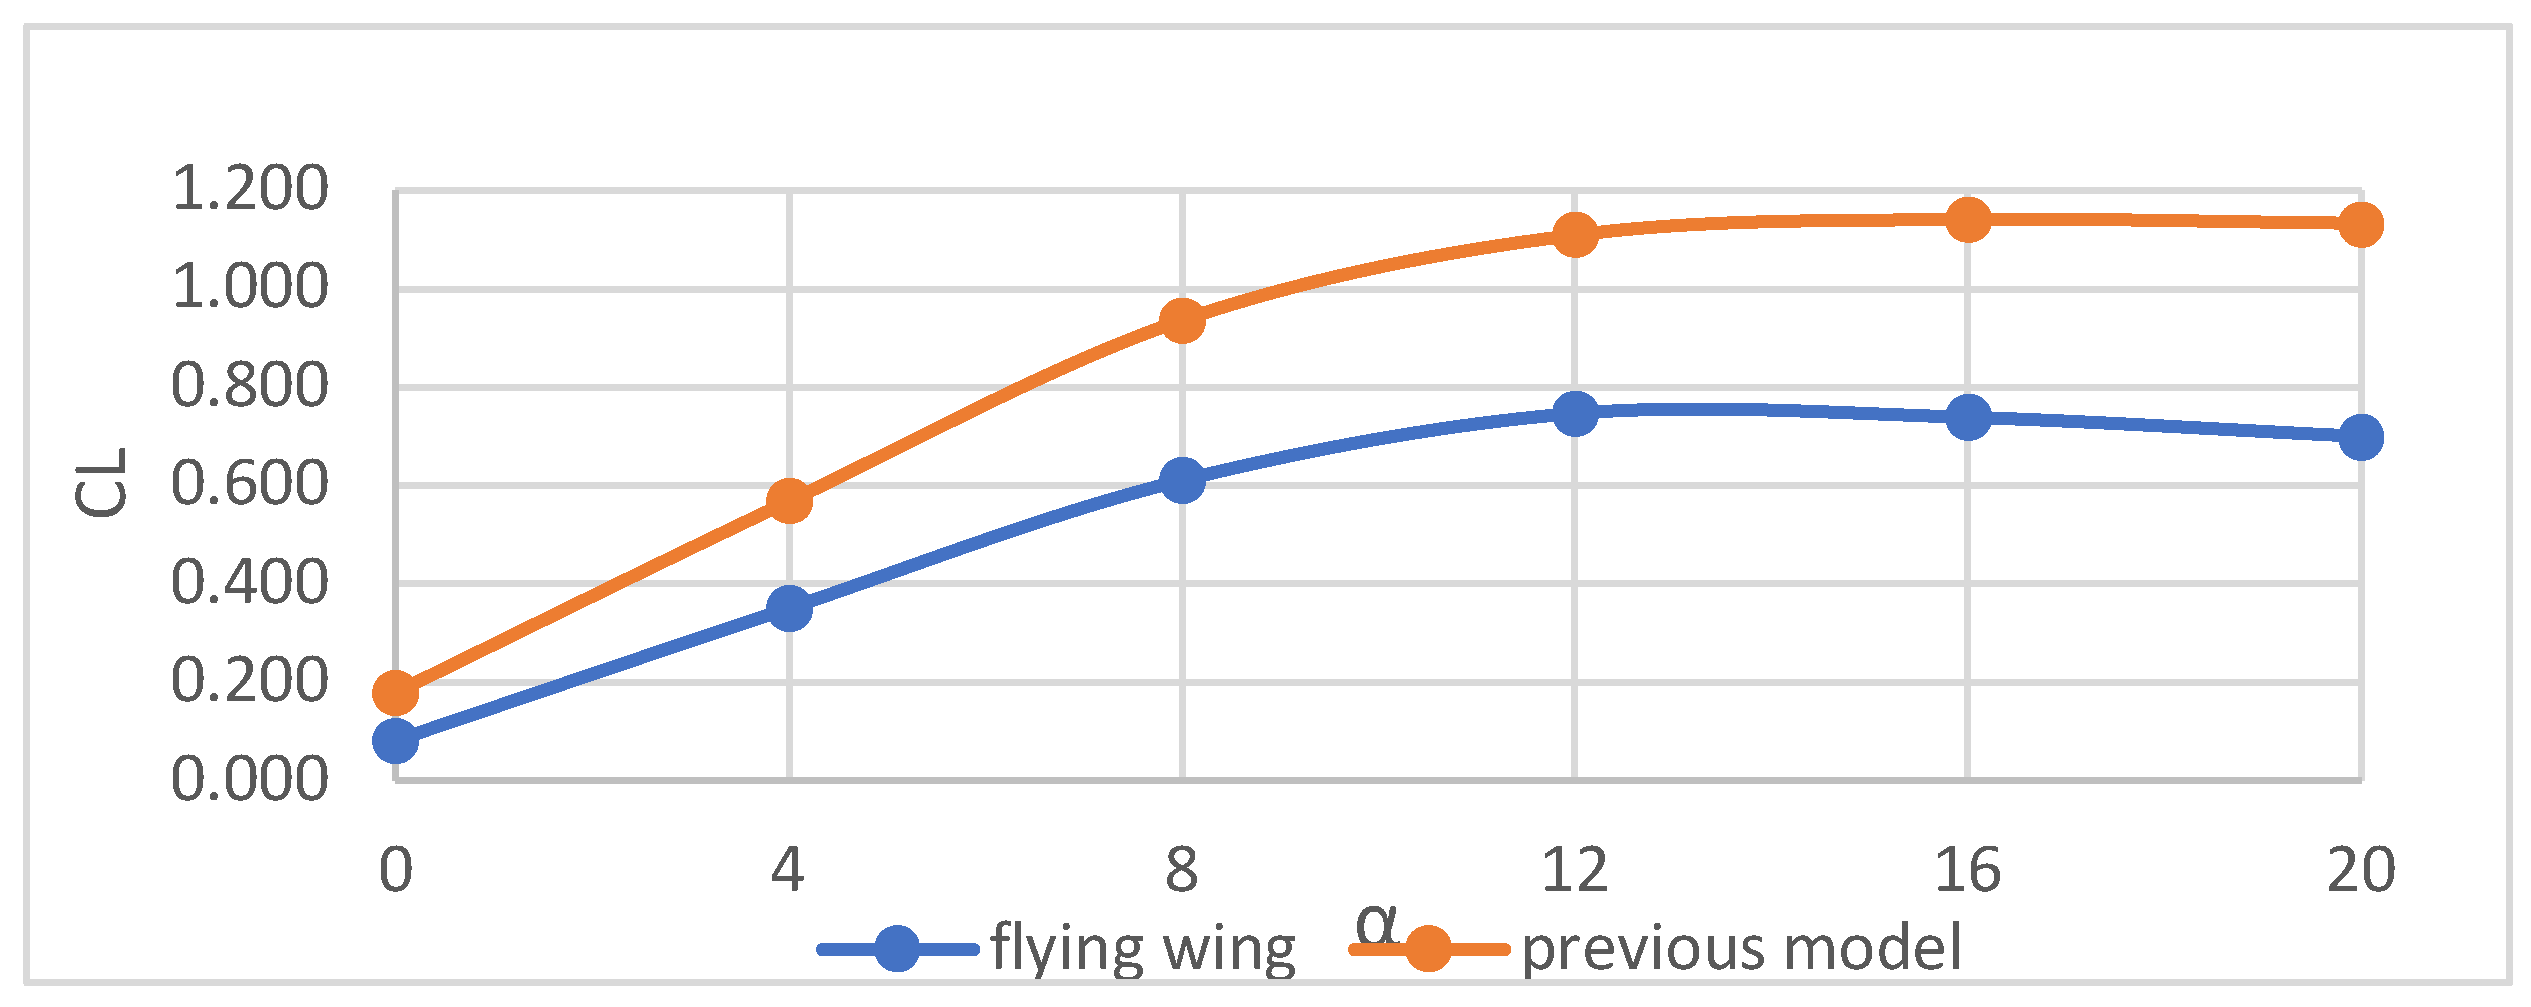
Figure 3-3 shows the lift coefficient (Cl) plotted against the angle of attack (α) obtained from the simulations, and as expected, the previous model had a higher coefficient of lift as it had the glider configuration with a high aspect ratio since increasing the aspect ratio increases the lift. The maximum lift coefficient (Cl, max) for the flying wing model is 0.746 at an attack angle of 12° which is the stall angle, and the maximum lift coefficient of the previous model is 1.14 at an attack angle of 16°. The maximum lift coefficient of the previous model is greater than the new model because the previous model has a greater aspect ratio (AR) since it is a glider and in addition, the airfoil of the flying wing has less camber compared to the previous model since the new model requires low coefficient of moment since there is no tail.
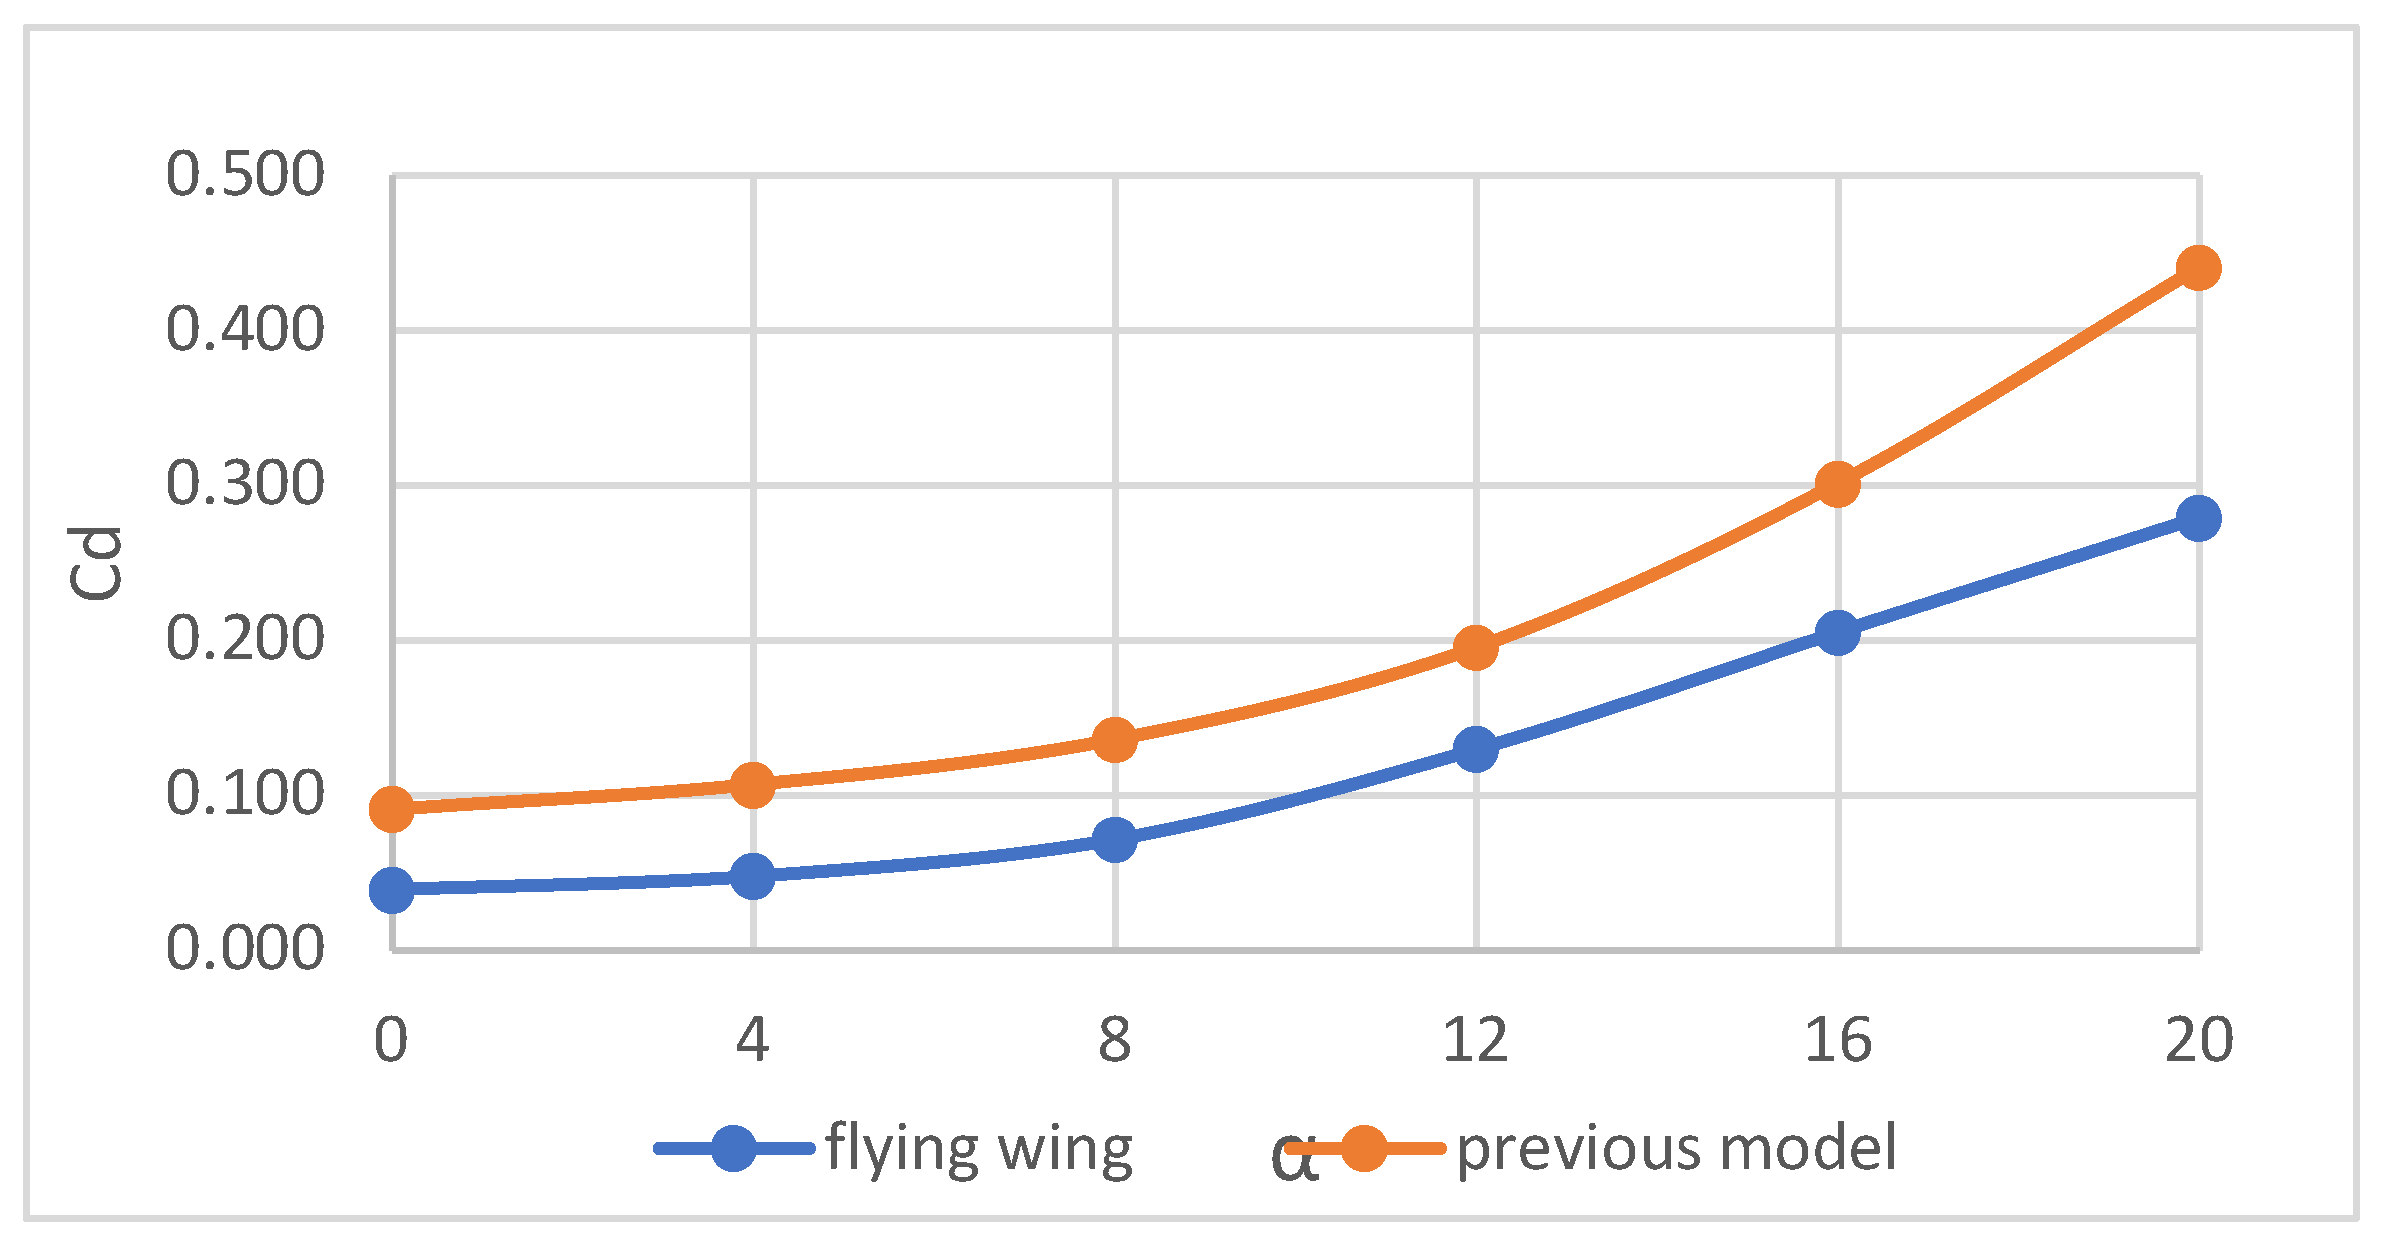
Figure 3-4 shows the drag coefficient (Cd) against the angle of attack (α) for both models obtained from the simulations. As shown in the Graph, the flying wing model had lower drag coefficients with the drag coefficient of (Cd, stall) equal to 0.129 at the angle of stall. On the other hand, the drag coefficient of the previous model at the stall angle is equal to 0.301. The drag coefficient of the flying wing had a minimum value of 0.039 whereas the minimum drag coefficient of the previous is 0.091. The main reason for having a lower drag coefficient for the flying wing model is that the previous model had a lot of components located externally that cause parasitical drag such as the battery, controllers, receivers, etc. as shown in Figure 4-16. Whereas for the flying wing model, the fuselage will be designed to house all the components and in addition to that, the flying wing configuration does not have a tail section which will also lower the skin friction drag.
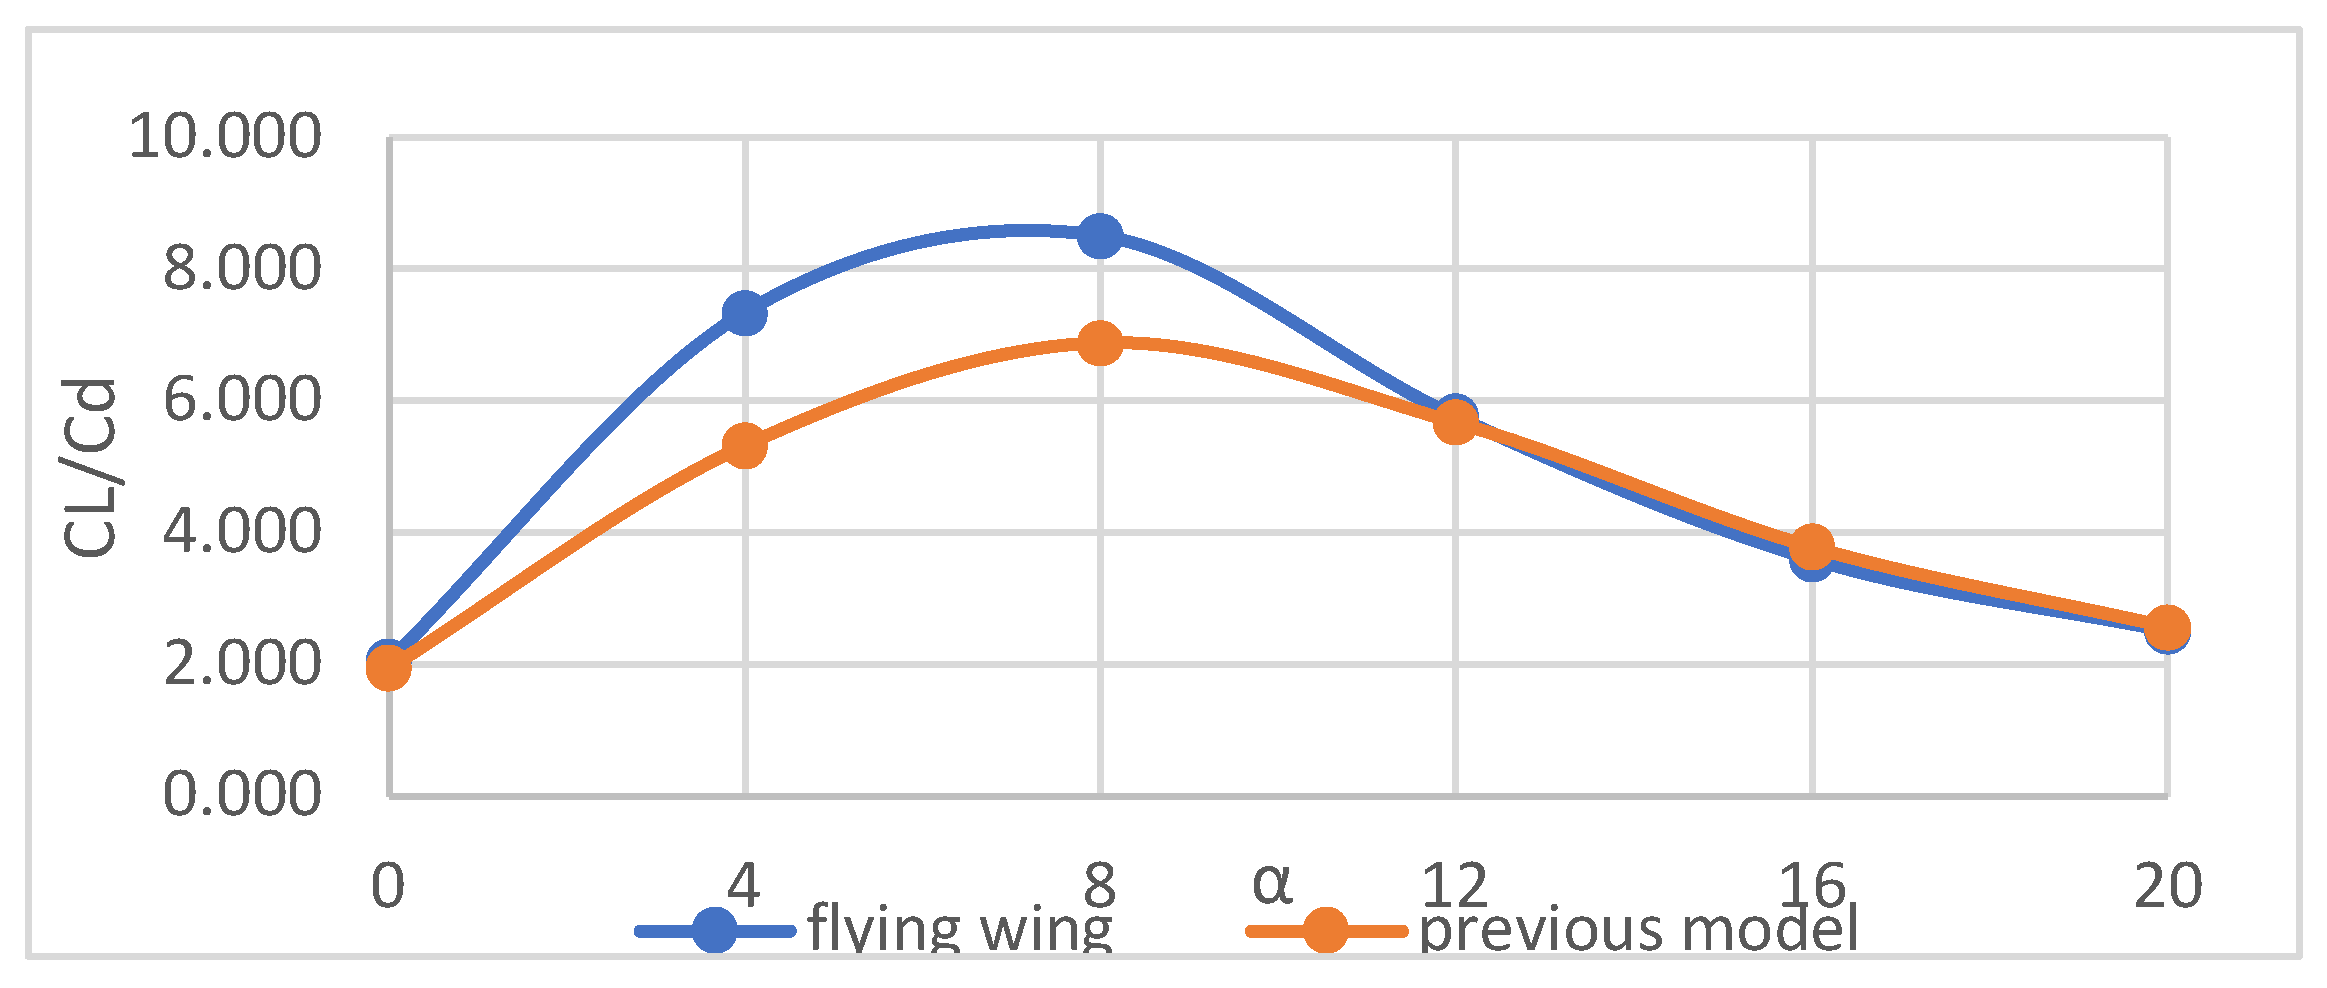
Figure 3-5 shows the lift-to-drag ratio (Cl/Cd) against the angle of attack (α) compared for both models. Since the previous model had better lift coefficients and the flying wing model had better drag coefficients, the best way to decide the overall lift and drag performance is by using the lift-to-drag ratio. And as shown in the Graph, the flying wing model has a more optimum lift-to-drag ratio. The maximum lift-to-drag ratio of the new model is around 8.6 and 6.9 for the previous model.
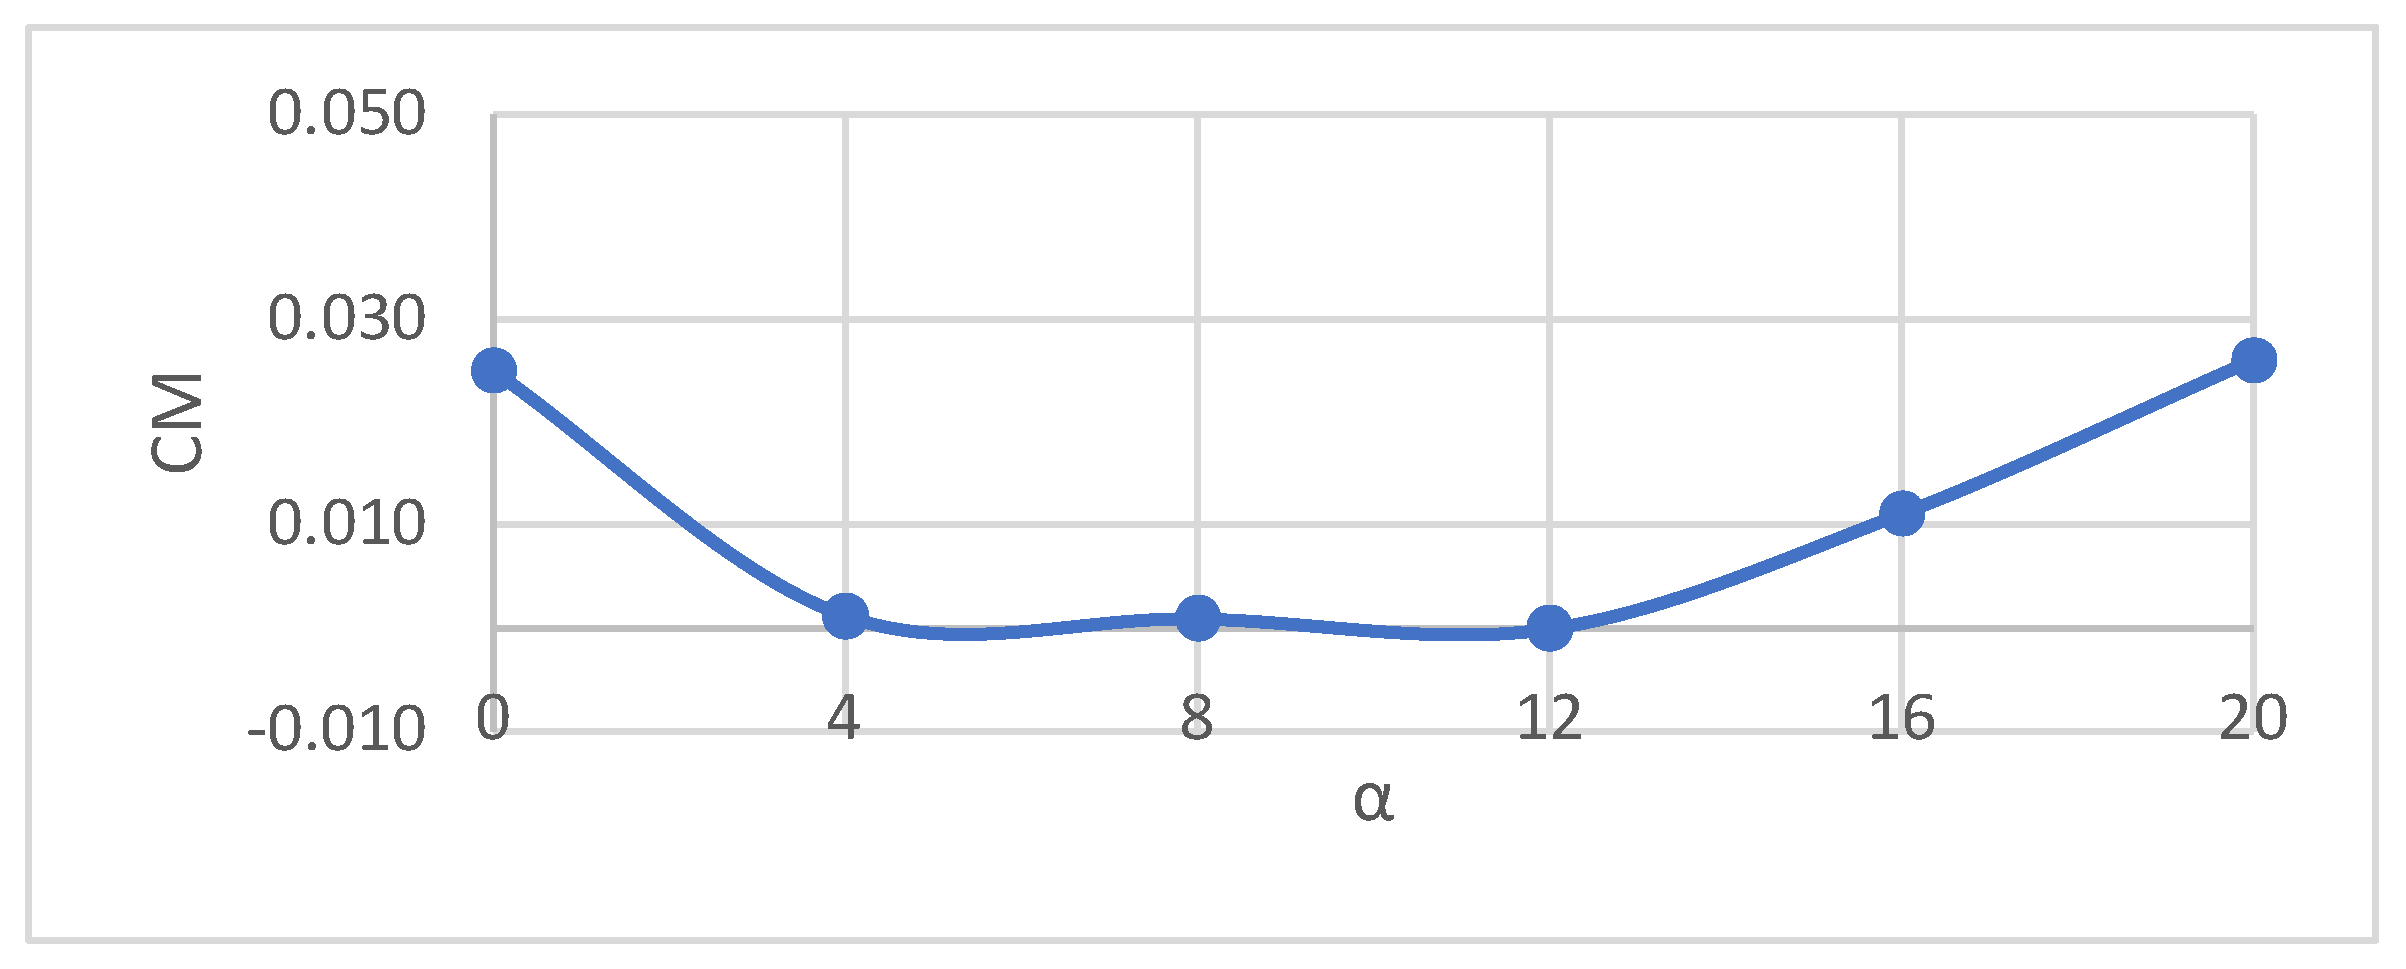
Figure 3-6 shows the pitching moment coefficient (Cm) plotted against the angle of attack. This Figure is very crucial since it determines the longitudinal stability of an aircraft. The pitching moment coefficient is measured from the Aerodynamic Center (AC) which is theoretically located at 25% of the MAC (mean aerodynamic chord) length, and unlike the center of pressure, its coordinates do not change with the variation of the attack angle.
A positive moment coefficient is also called a “tail-heavy” moment which means that the nose of the aircraft points up. A negative moment coefficient is also known as a “nose-heavy” moment. For an aircraft to be stable, the pitching moment vs AoA Graph needs to have a negative slope meaning that as the angle of attack increases, the pitching moment coefficient should decrease. For the case of a tailless aircraft, the moment coefficient needs to be as close to 0 as possible since larger positive values mean a larger tail is needed to counteract the effect. As shown on the moment coefficient vs AoA Graph above, the slope is negative up to the stall angle of 12°, which confirms the stability of the design. In addition, the moment coefficient values are very close to zero and have a small variation. Since now, coefficient values are positive, and the design is tailless, the center of mass needed to be located infront of the center of pressure to balance out the aircraft.
Figure 3-7 above shows the velocity streamlines and body pressure of the flying wing model obtained from the simulations. As illustrated by the streamlines, significant flow separation from the body starts to show at the attack angle of 12° which is the stall angle as seen in both views, and at the angle of attack of 16°, the separated boundary thickness increases. It expands more toward the fuselage, and the flow becomes more turbulent and random. Flow separation is a type of pressure drag that occurs when the angle of attack is too steep, and it is the separation of the boundary layer from the wing surface to form a wake. This flow separation causes a reduction of the lift of the wings. When the wings are at a steep attack angle, the boundary layer on top of the wings will slow down to move from a low to a high-pressure area.

4. Winglet Selection

Winglets are aerodynamic devices where the general purpose is reducing the tip vortex drag induced at the tip of the wings by the significant pressure difference between the upper and lower parts of the wings. The tip-induced vortex rolls up over the wingtips which will reduce the lift at the tip section of the wings. Testing parameters for winglet selection are shown in Table 4-1.
In this chapter, a winglet design will be selected for the flying wing model. The selection methodology will be first, designing 4 different blended-type winglets and then conducting the same wind tunnel CFD simulation from the previous chapter at different velocities and attack angles for each design. The lift-to-drag ratio (Cl/Cd) of the 4 designs will be compared and the best-performing winglet will be selected.
The airflow will be fitted with NACA0006 which is a symmetrical airfoil (0% camber) with 6% thickness at 30% of the chord length a maximum lift coefficient of 0.707 at Re = 200,000 and an attack angle of 8 degrees as shown in Figure 4-1 and Figure 4-2 below.

4.1. Winglet Selection Results & Discussion
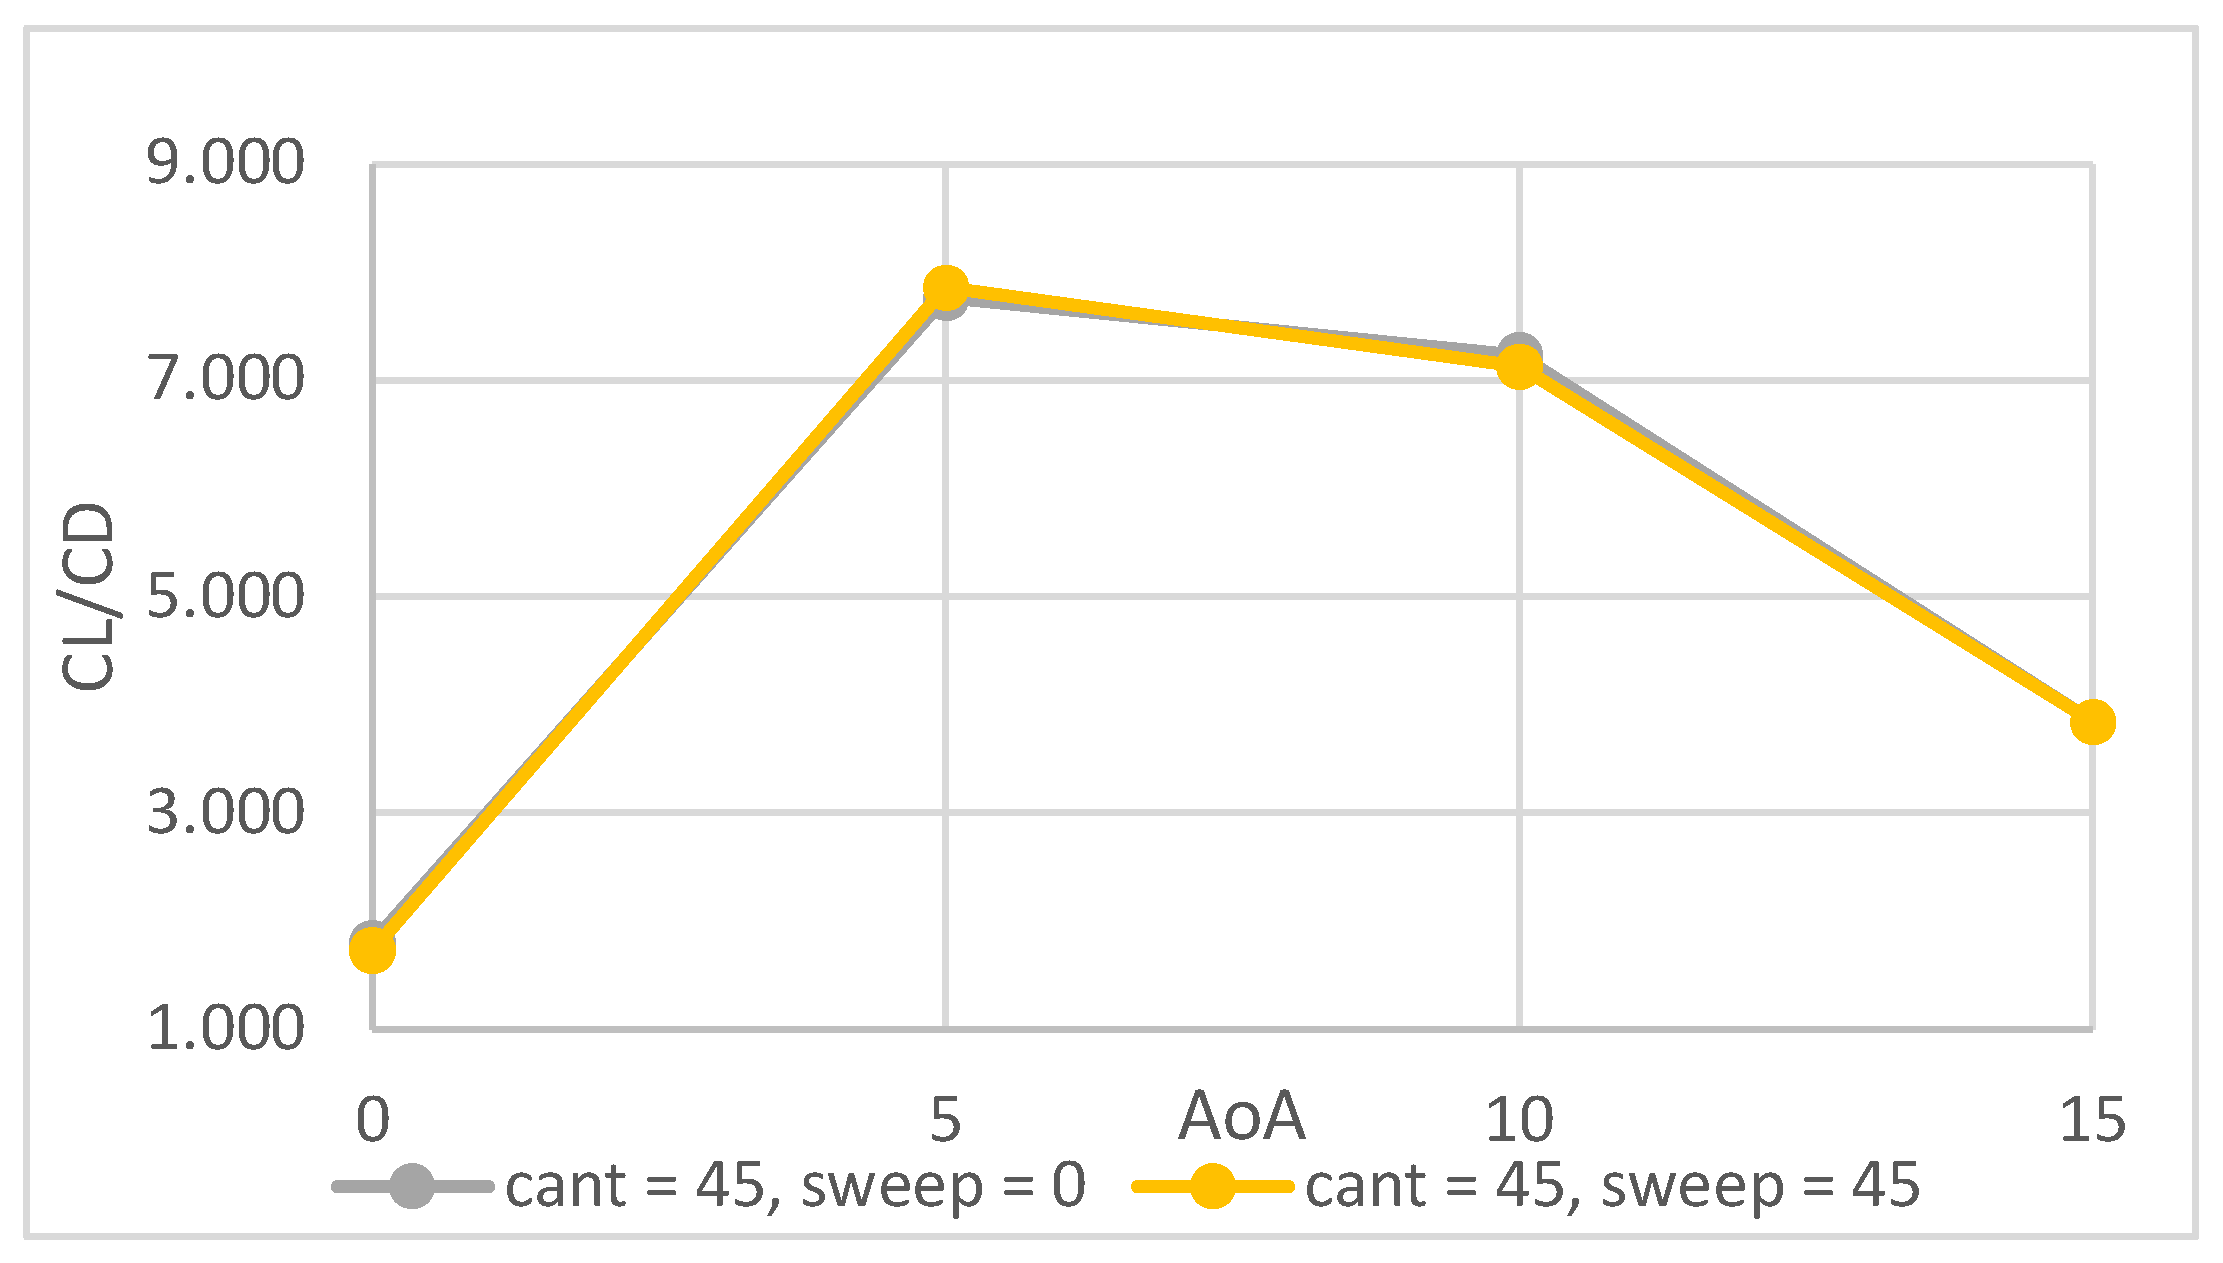
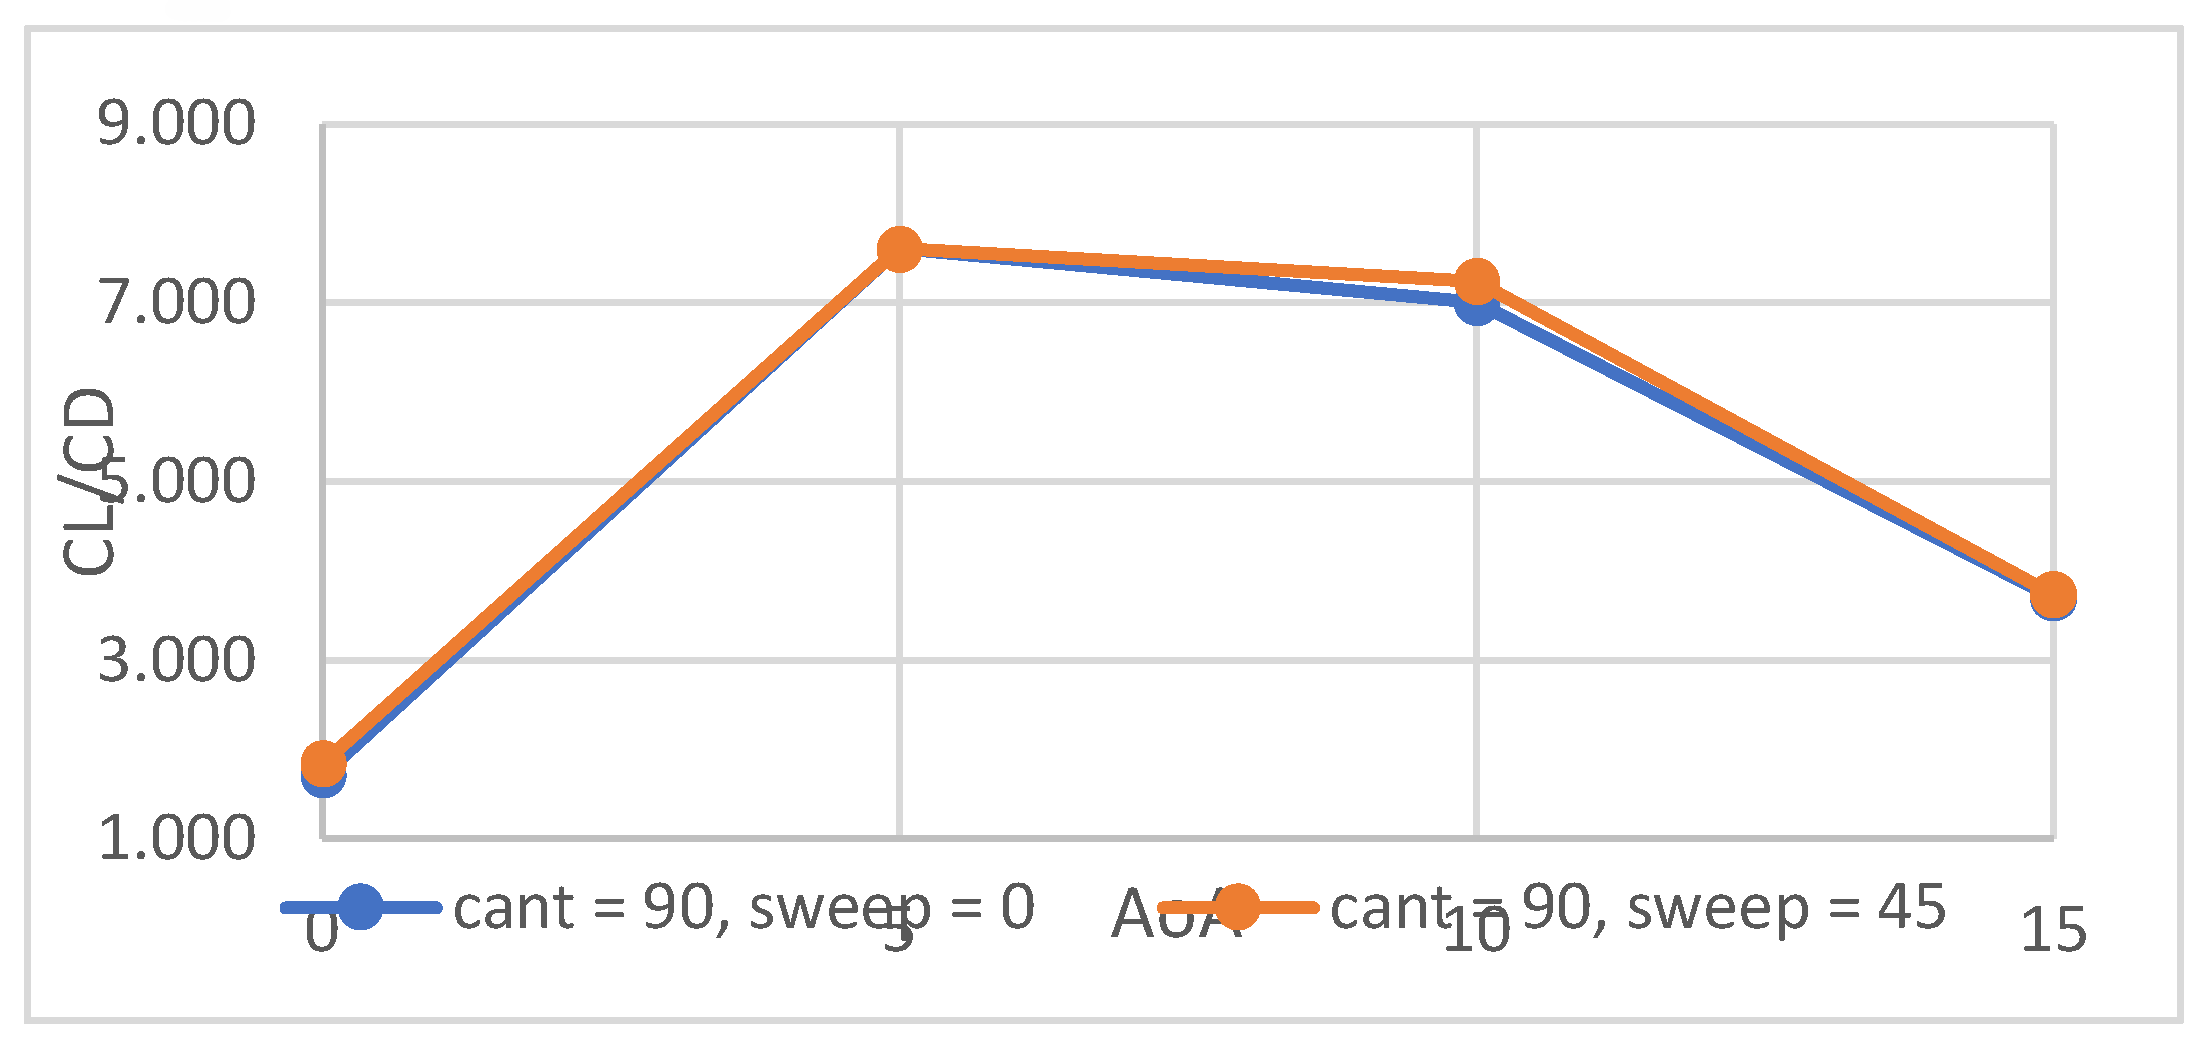
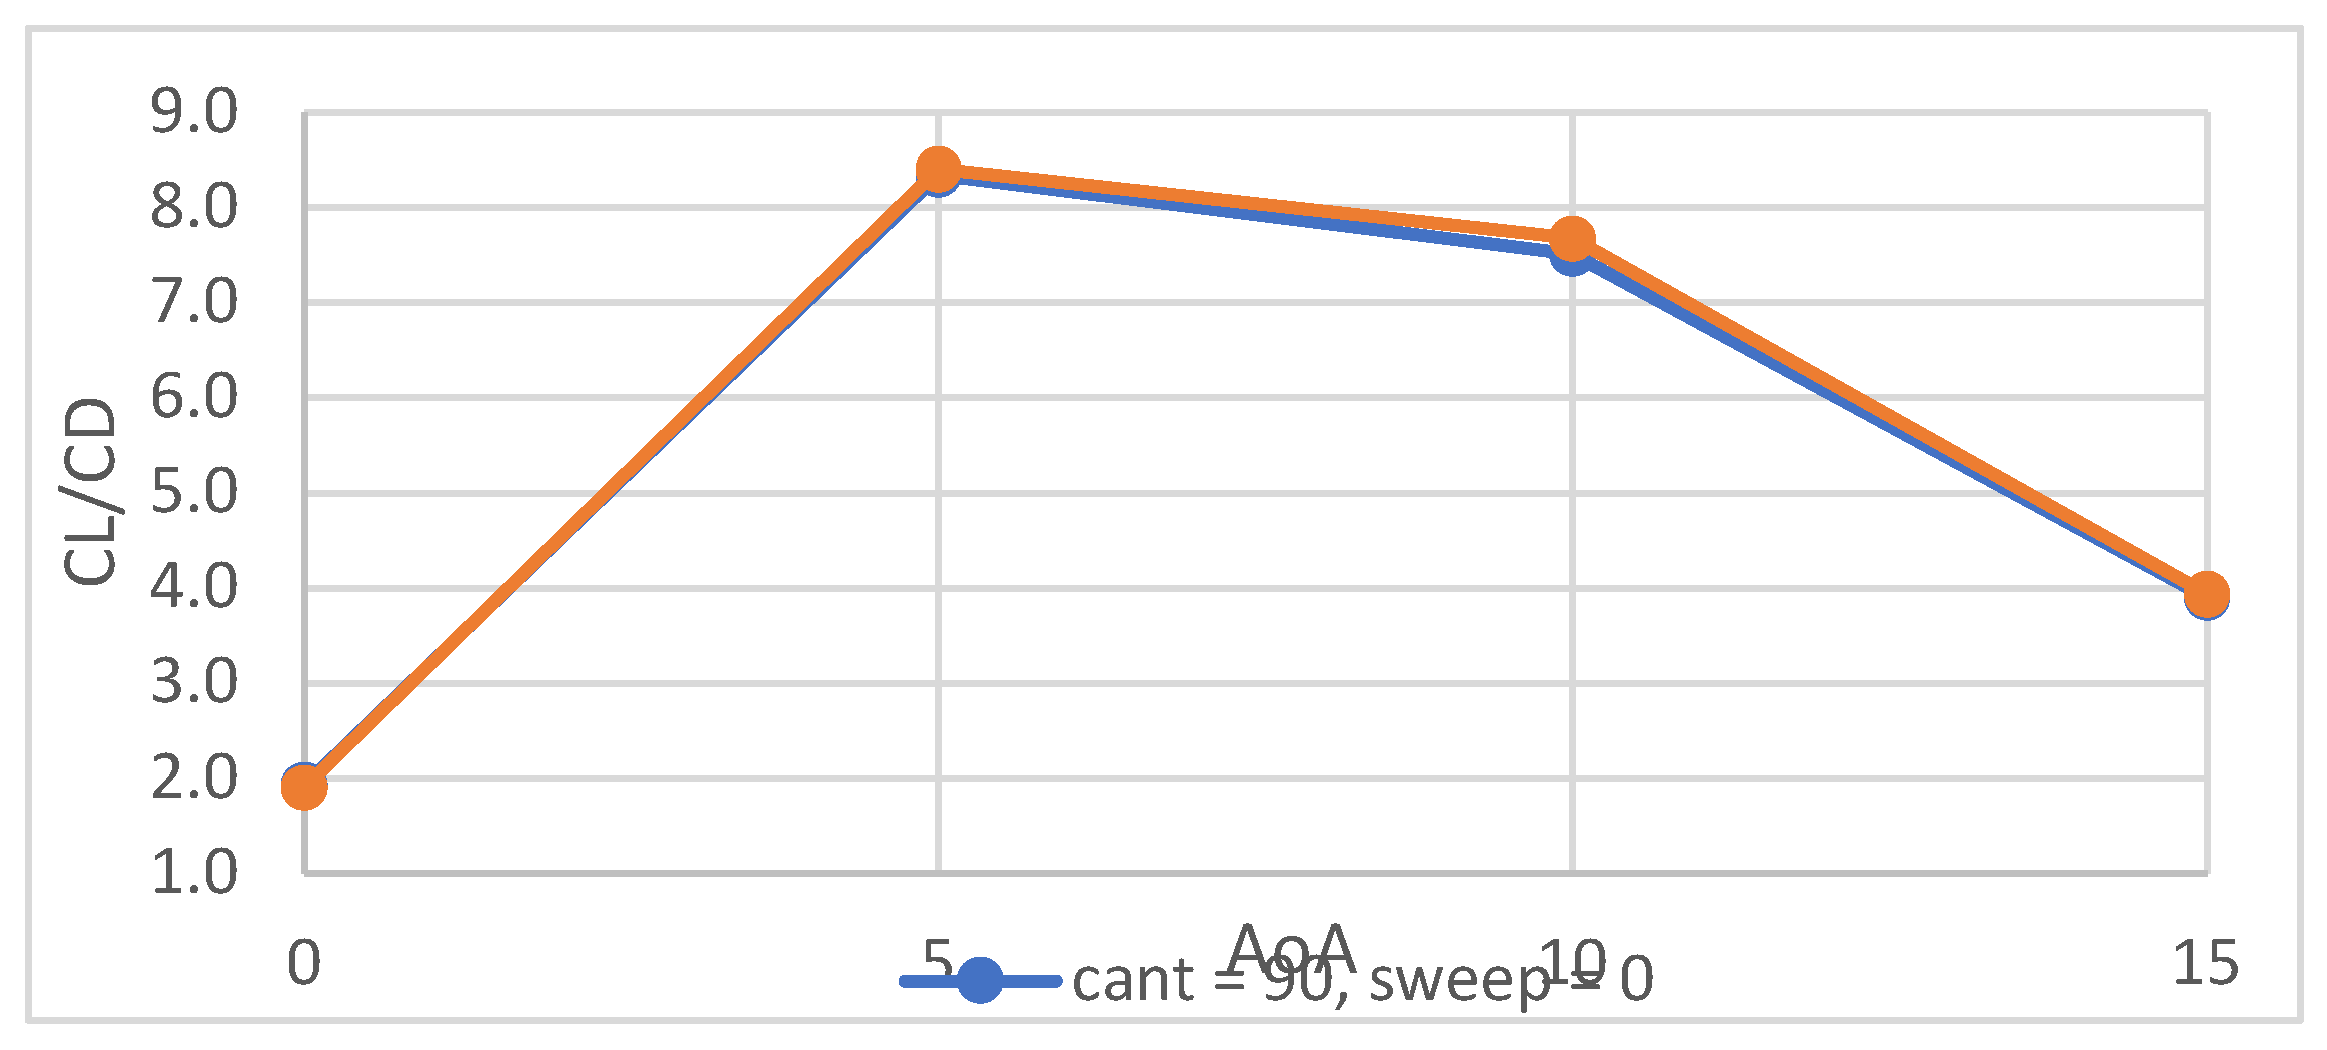
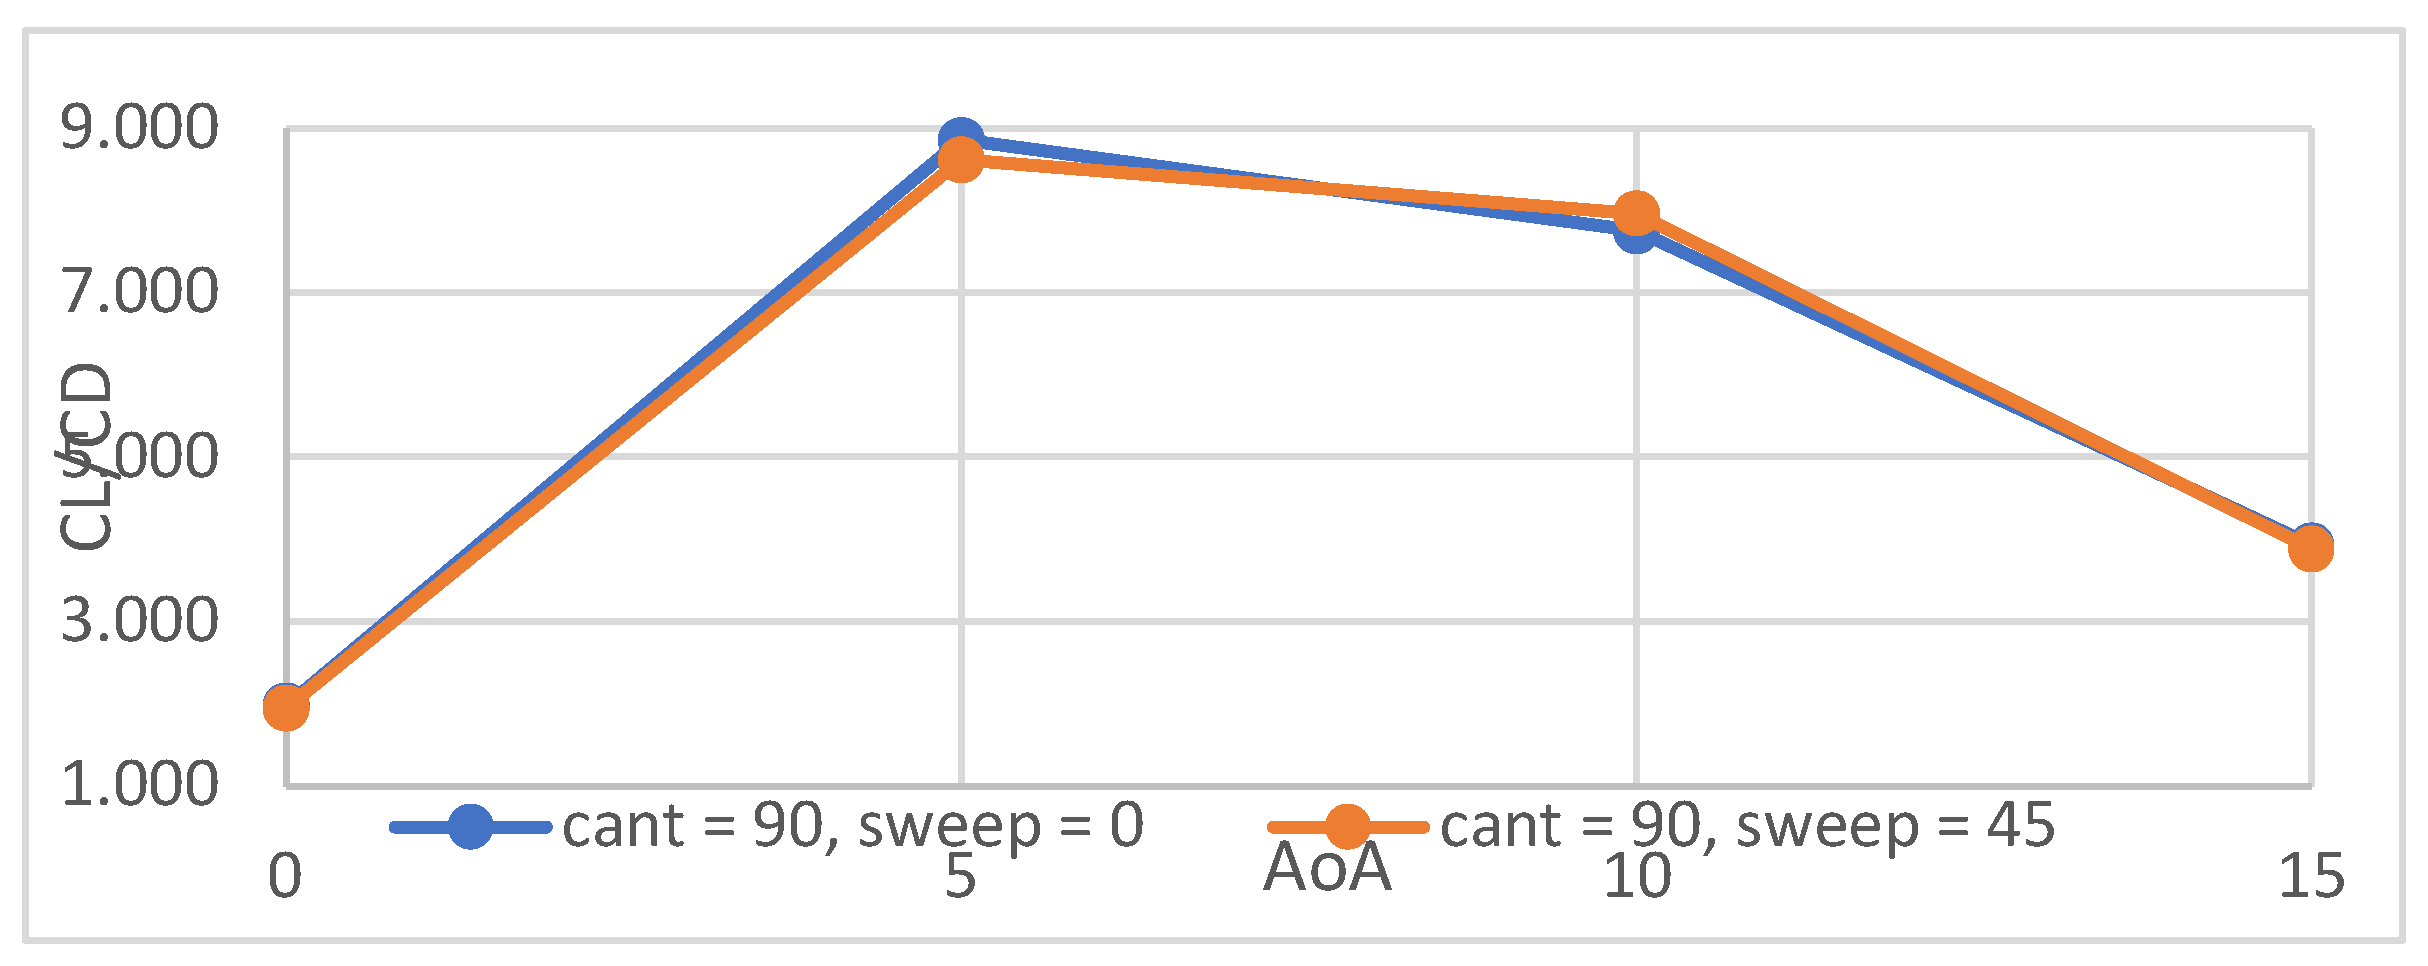
Figure 4-3, Figure 4-4 and Figure 4-5 above show the Cl/Cd at different angles and different speeds for the winglets with 90-degree cant angle and 0-, and 45-degree sweepback angles. Since the results are close to each other, the comparison process is divided into 2 groups which are winglets with cant angle of 90°, and winglets with cant angle of 45°, and the best out of each group will be compared to each other. As shown in the Graphs above, the winglet with 45 degrees of sweep had an overall better performance than the winglet with 0° of sweep at the speed of 8 m/s and 15 m/s at all angles of attack, and for most angles at v = 22 m/s. The winglet with 0 degrees sweeps had a higher Cl/Cd ratio only at the speed of 22 m/s and 5° attack angle.
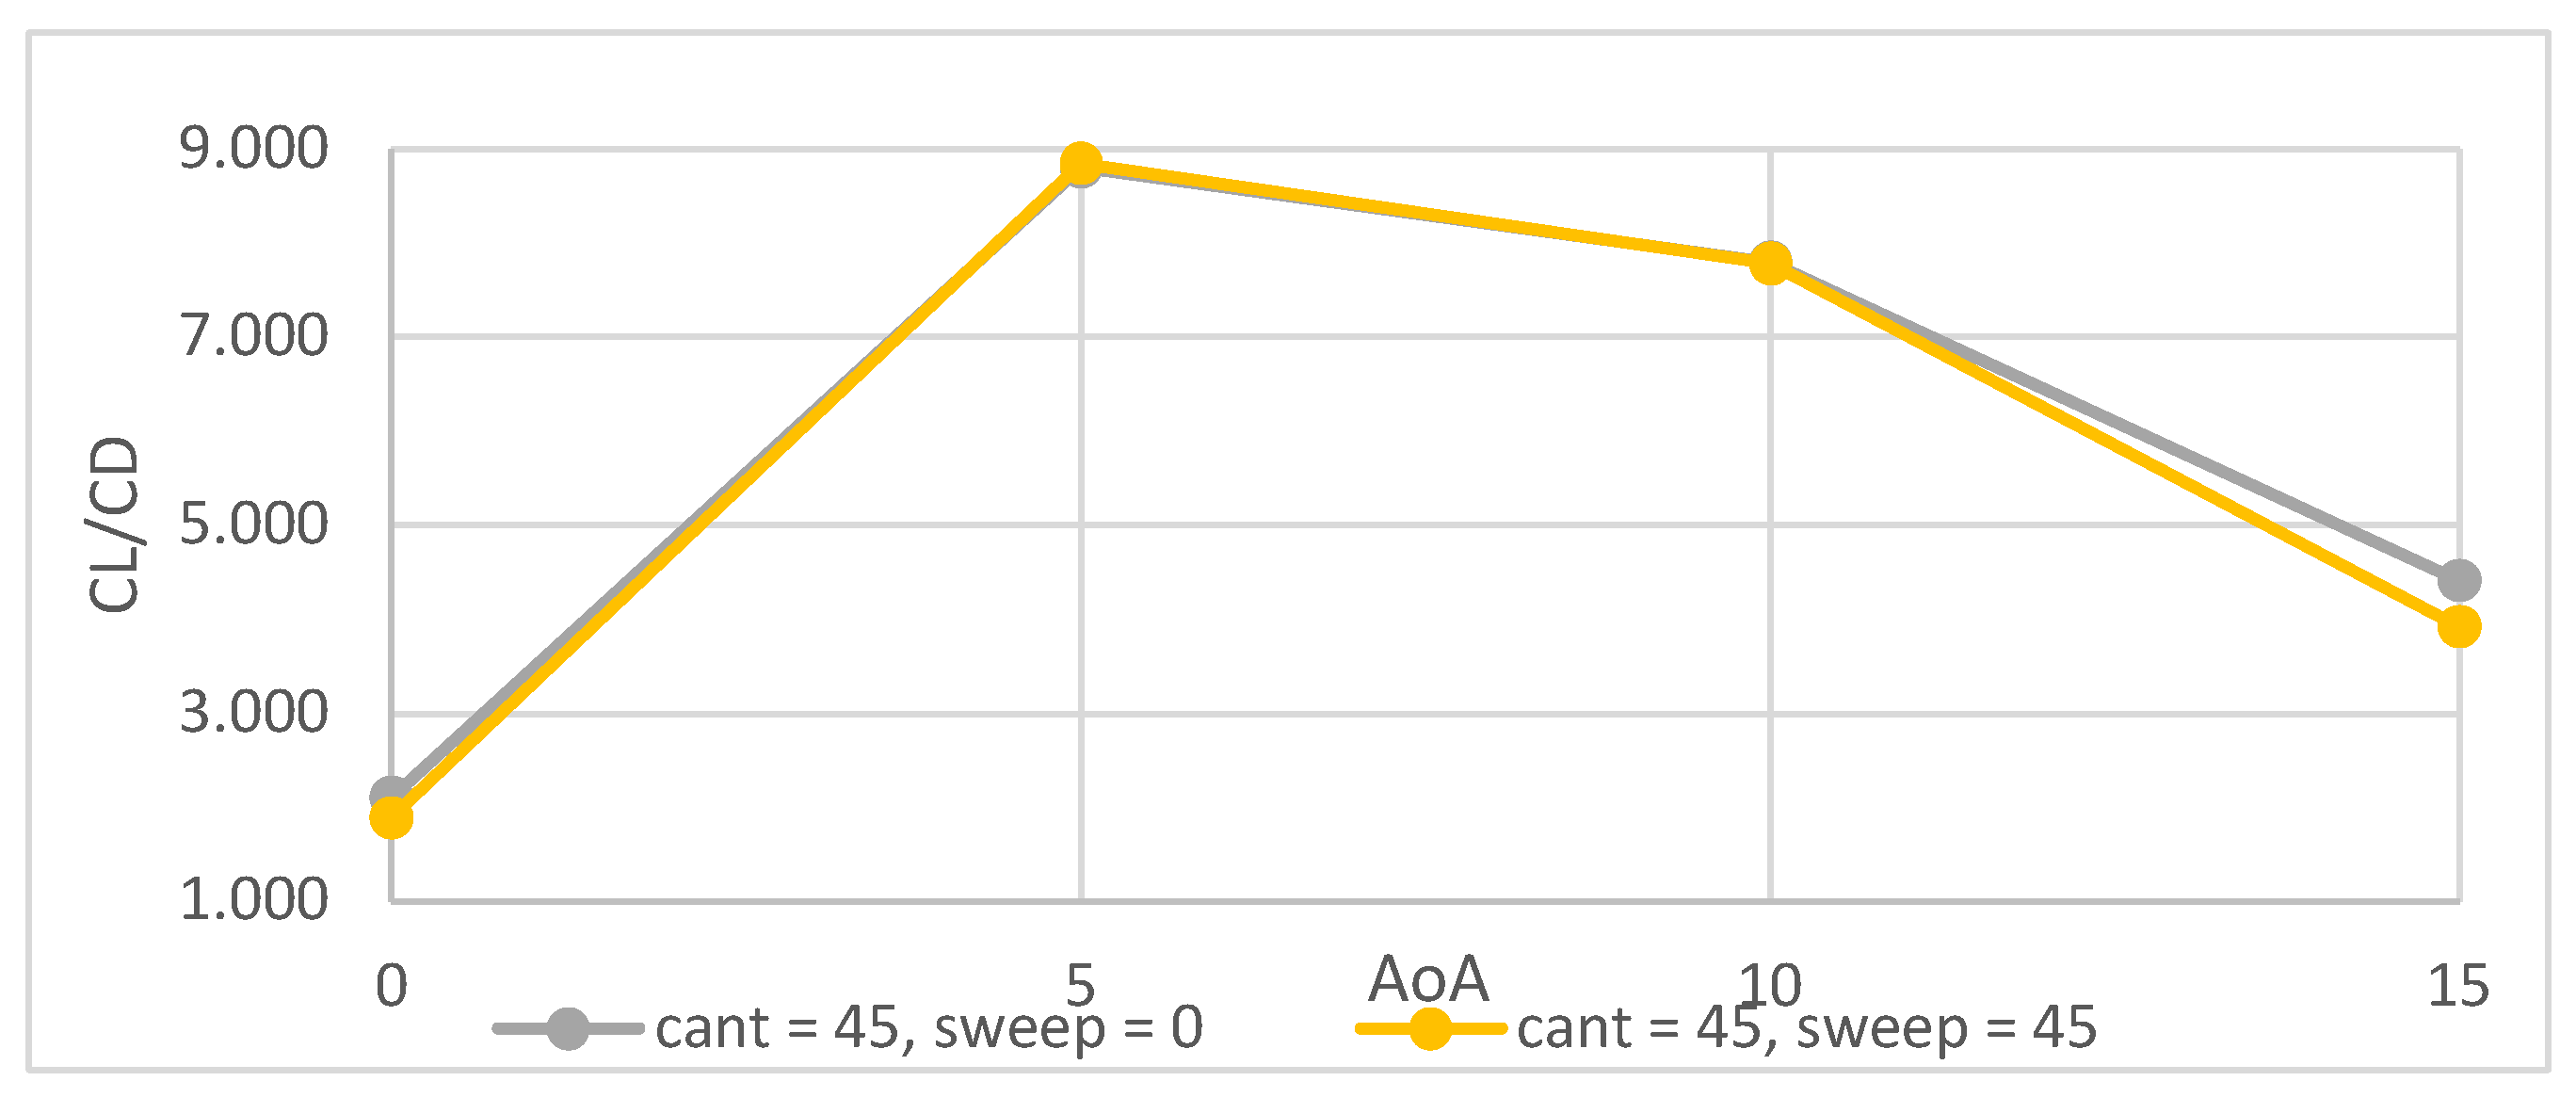
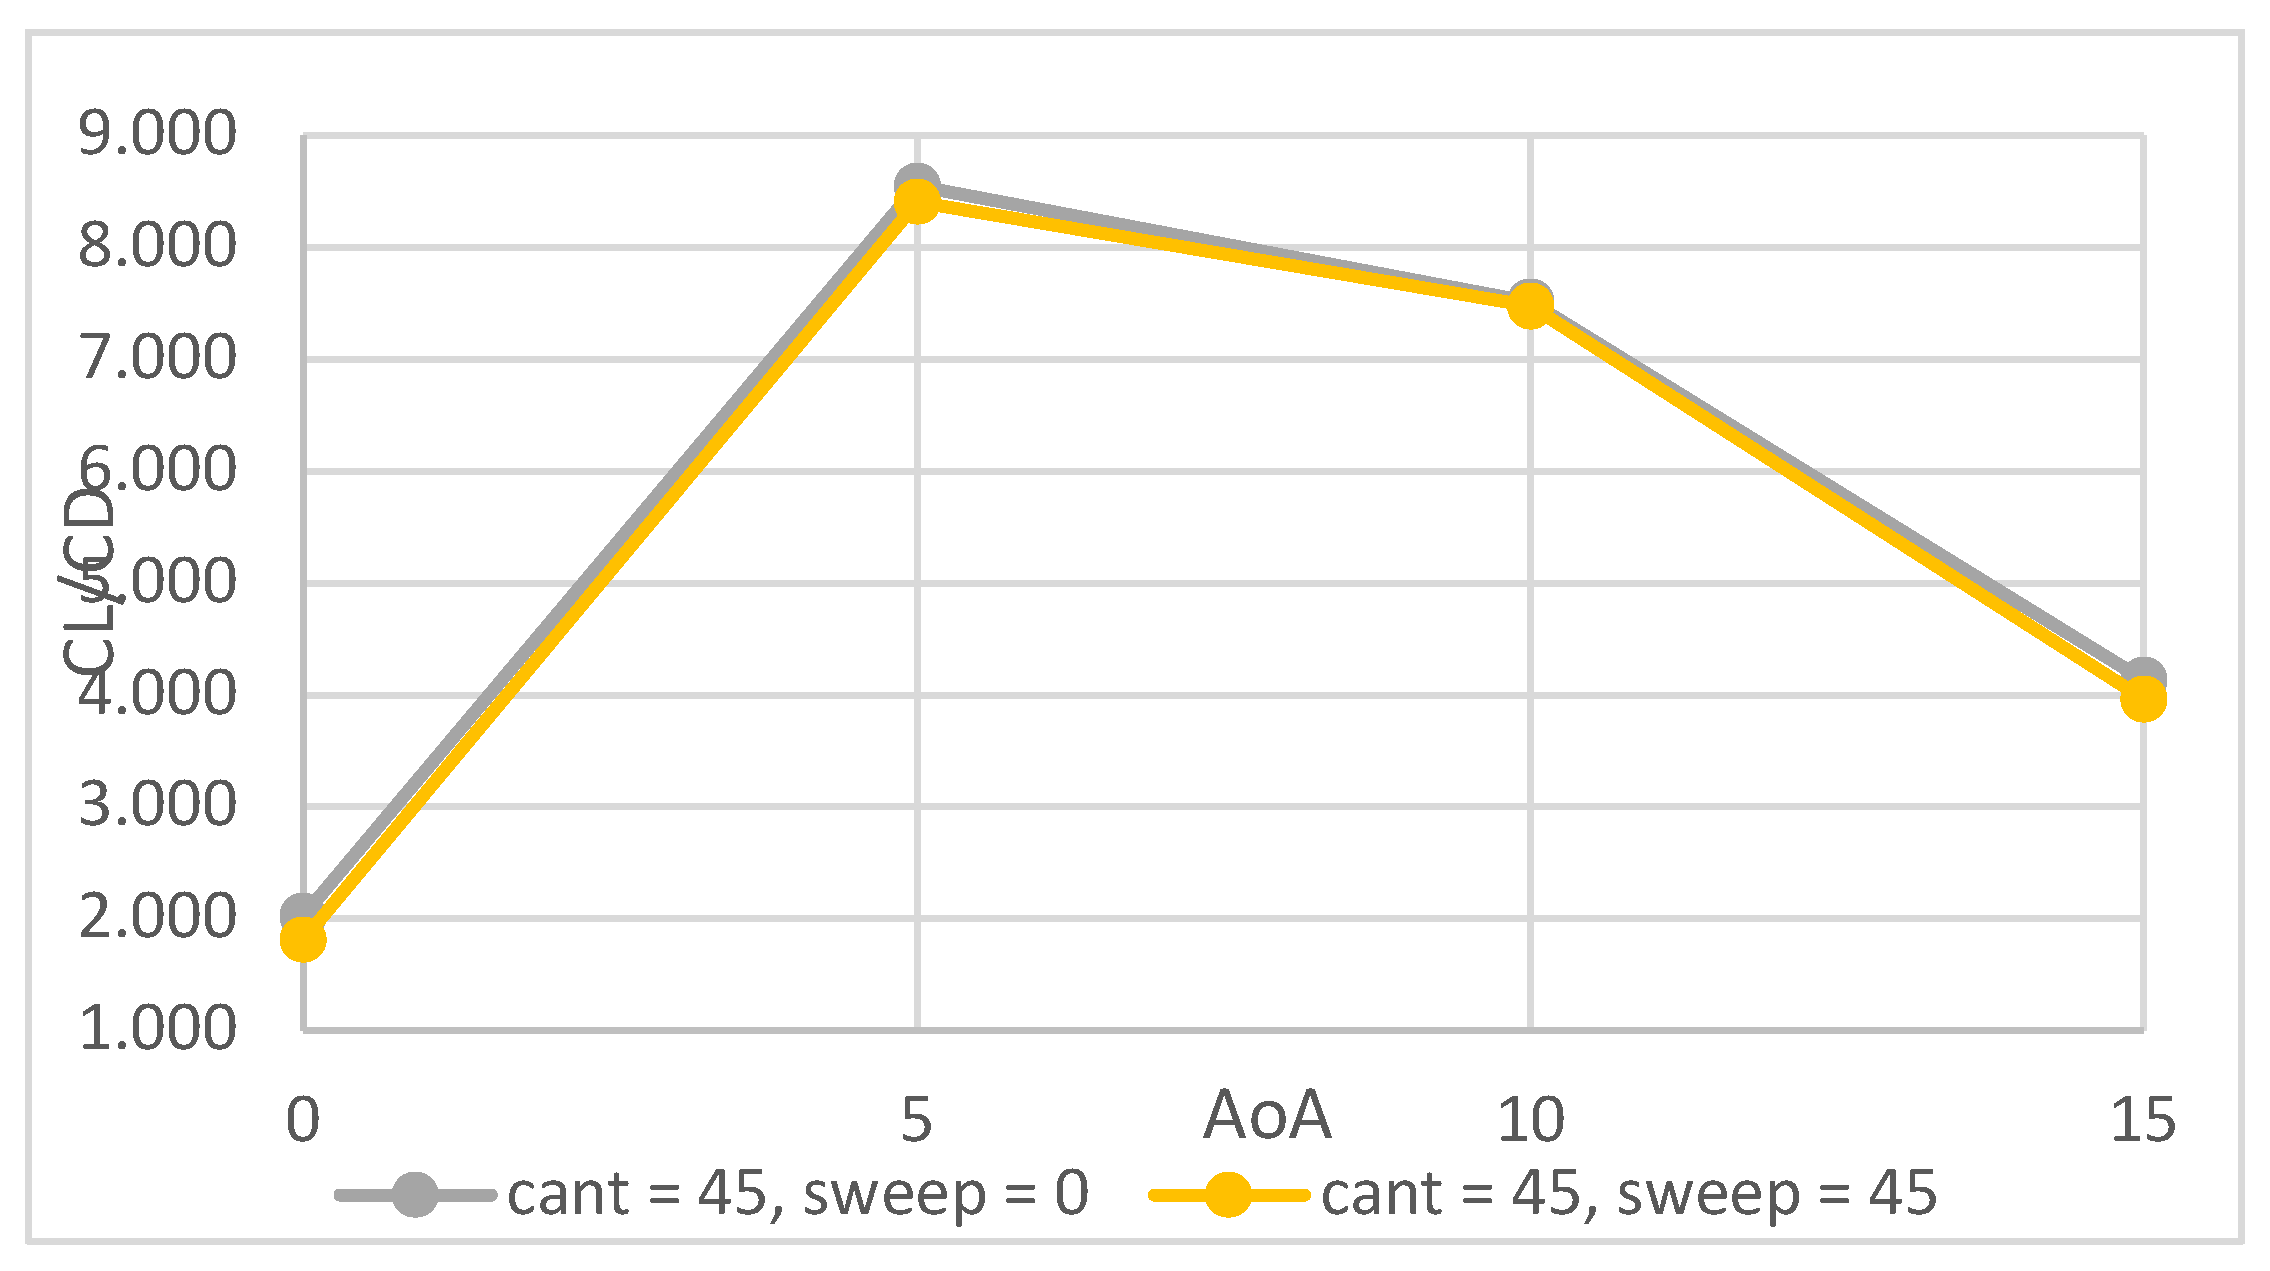
Graph 4-7 show the Cl/Cd at different angles and different speeds for the winglets with cant angle of 45 and sweep angles of 0 and 45 degrees. At the velocity of 8 m/s, both winglets had very similar results at all attack angles, however, at the velocity of 15 m/s, the winglet with a sweep angle of 0° had a higher Cl/Cd at all attack angles. At the velocity of 22 m/s, both winglets had similar results at the attack angles of 5 and 10, but at the attack angles of 0 and 15 degrees, the winglet with a sweep of 0° had a higher lift-to-drag ratio, and therefore, it will be compared with the winglet with 90° cant angle and 45° sweep angle.
Figure 4-7. CL/CD vs AoA Graph for winglets with cant angle of 45° and sweepback angles of 0° and 45° at 8m/s.
Preprints 117104 g004 7
Figure 4-8. CL/CD vs AoA Graph for winglets with cant angle of 45° and sweepback angles of 0° and 45° at 22m/s.
Preprints 117104 g004 8
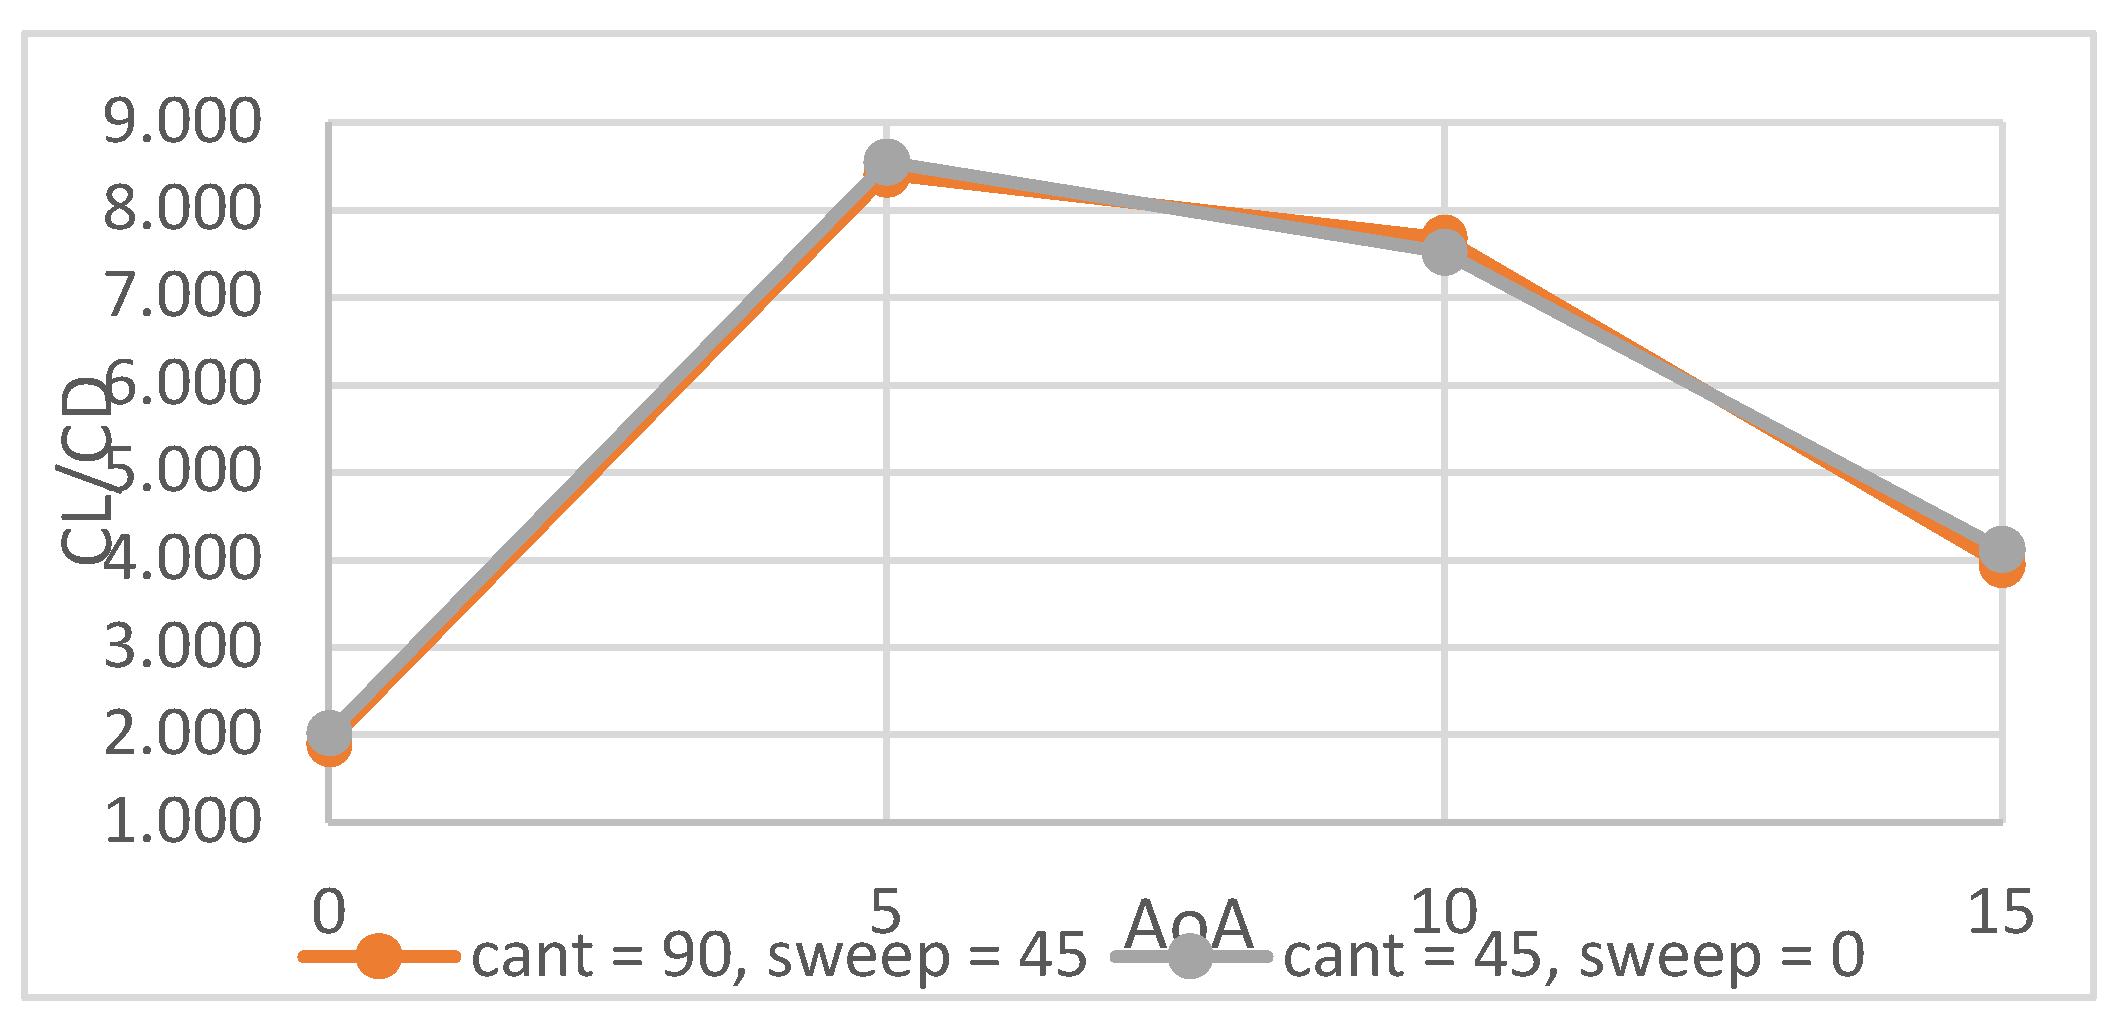
Figure 4-9. CL/CD vs AoA Graph for winglets with cant angle of 90°, sweepback of 45°, and cant angle of 45°, sweepback of 0° at 15m/s s.
Preprints 117104 g004 9
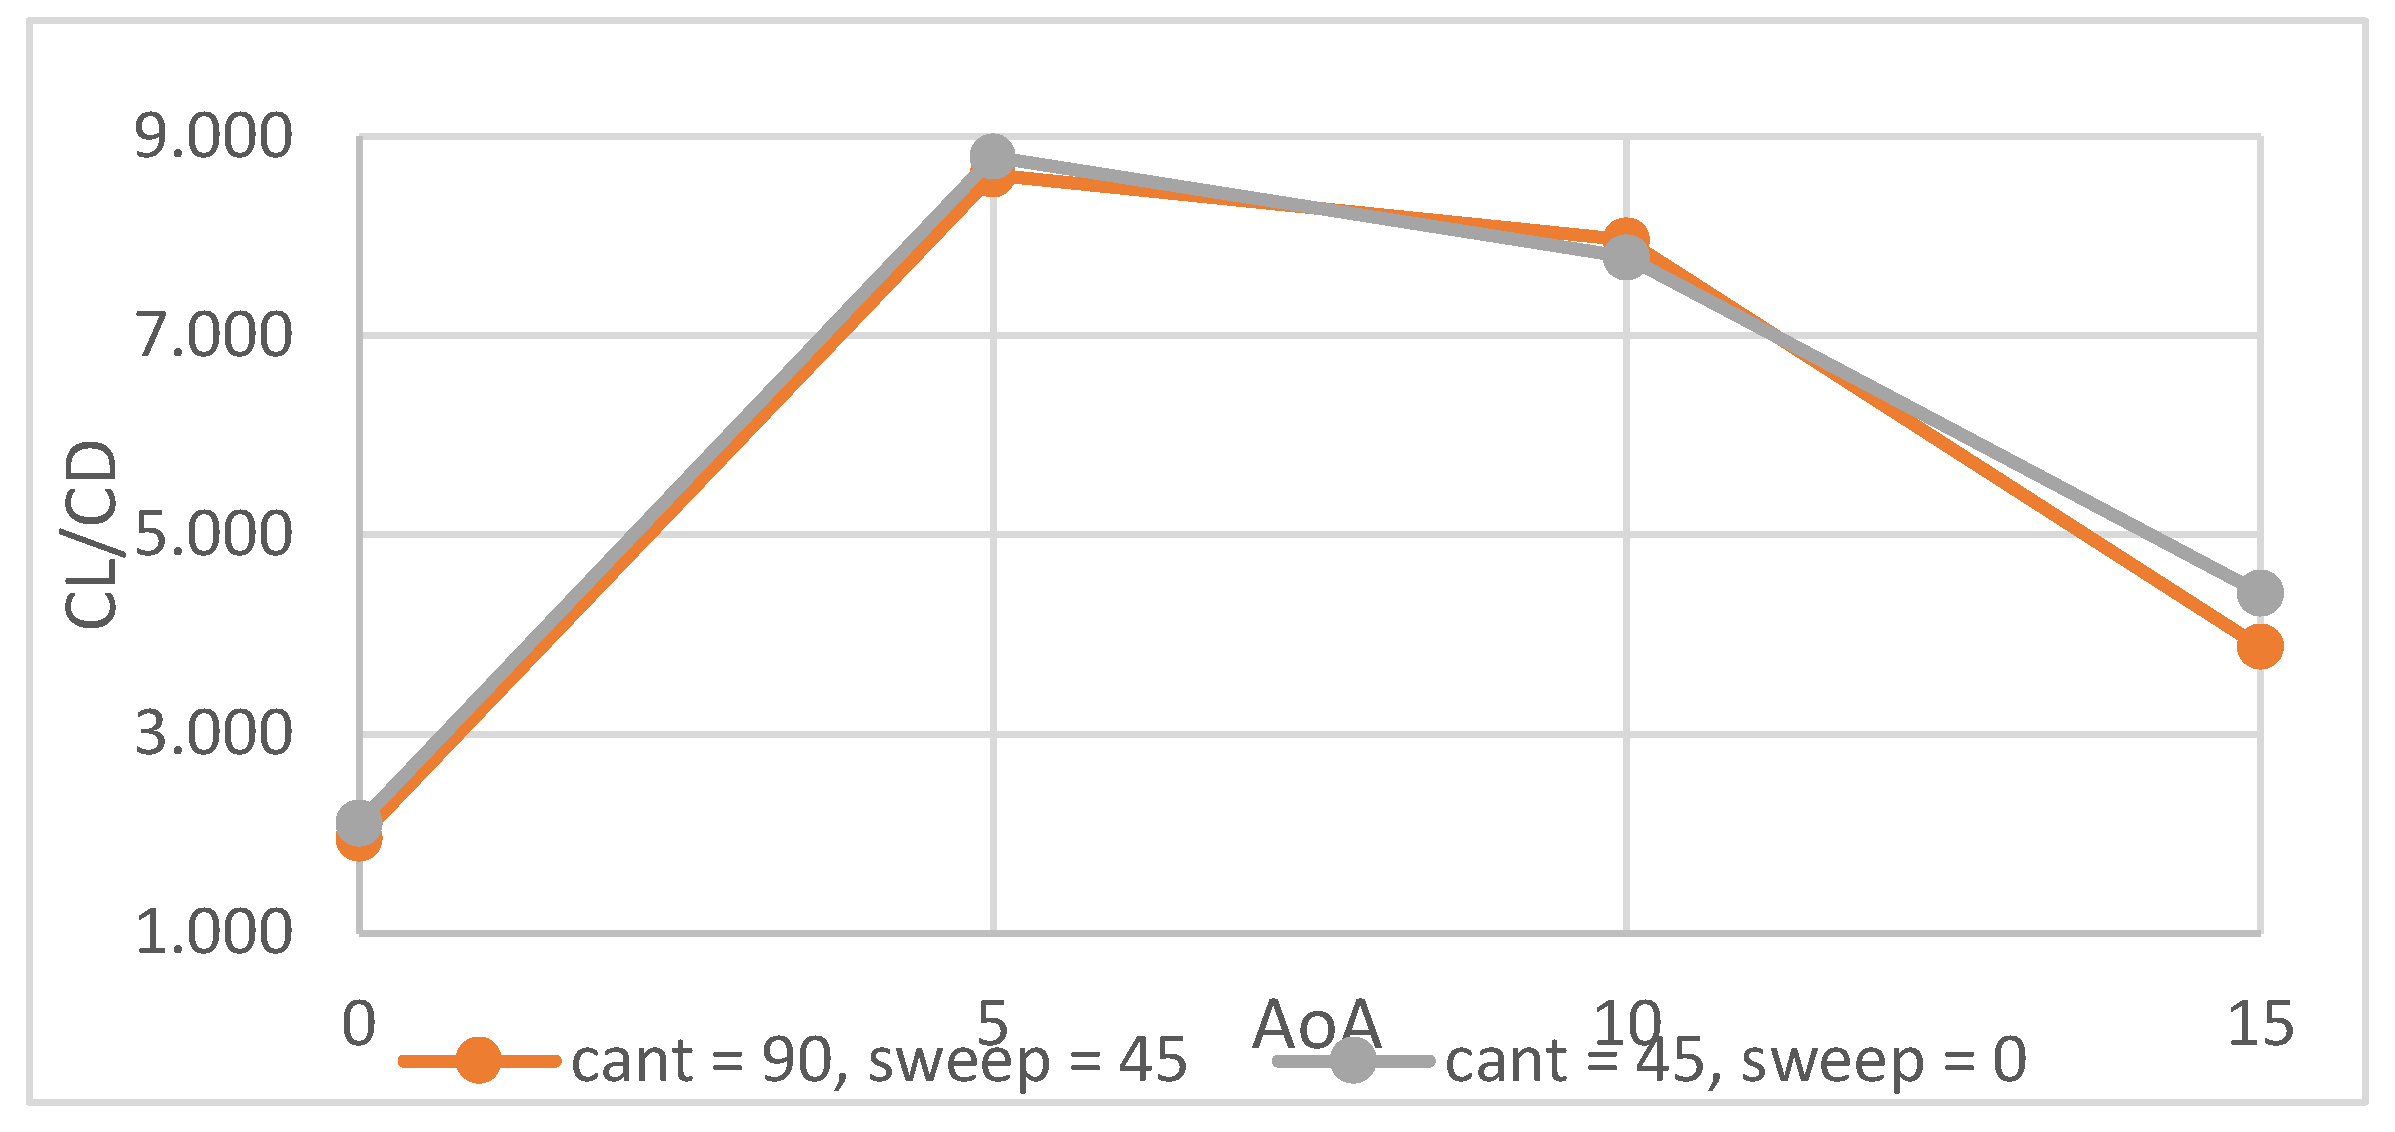
Figure 4-10. CL/CD vs AoA Graph for winglets with cant angle of 90°, sweepback of 45°, and cant angle of 45°, sweepback of 0° at 8m/s.
Preprints 117104 g004 10
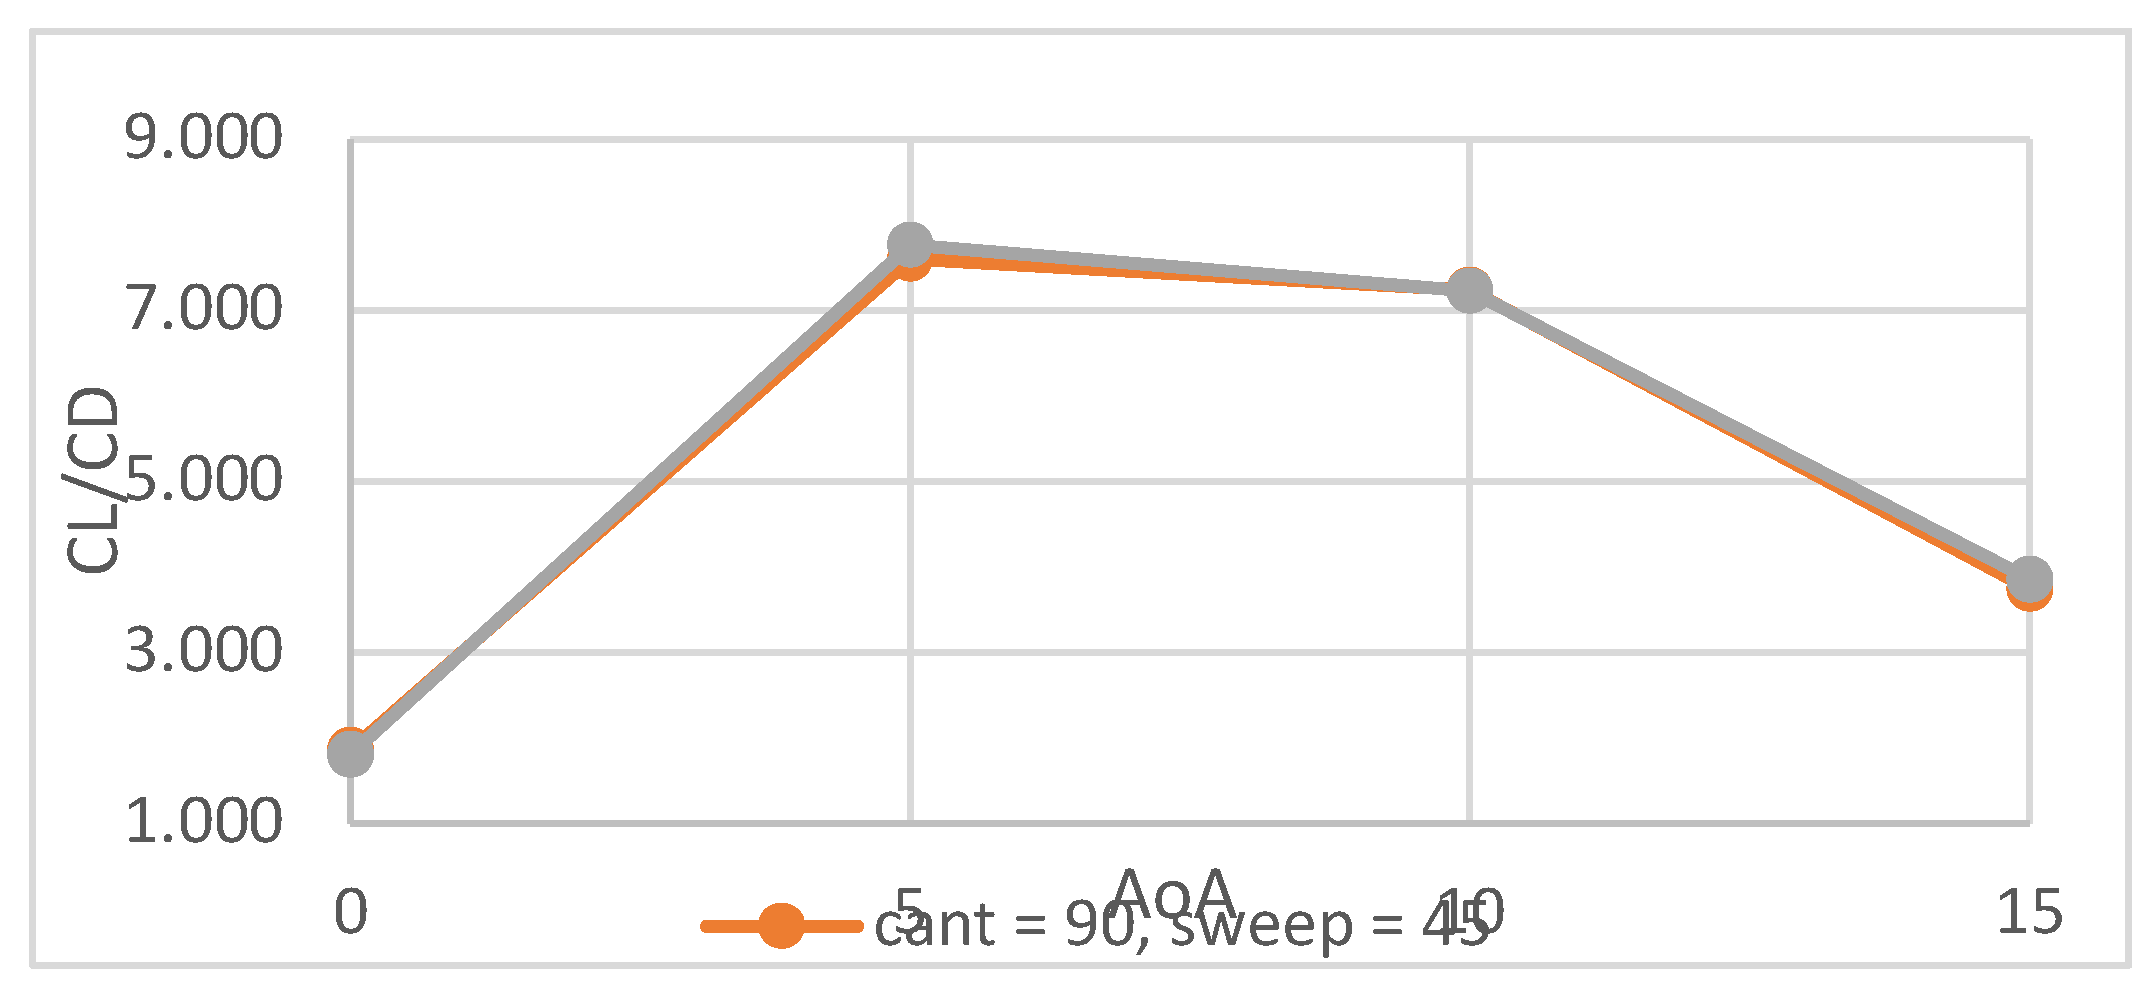
Figure 4-11. CL/CD vs AoA Graph for winglets with cant angle of 90°, sweepback of 45°, and cant angle of 45°, sweepback of 0° at 22m/s.
Preprints 117104 g004 11
The Graphs above show the Cl/Cd of various angles of attack for the winglets with 90° cant and 45° sweep, and 45° cant and 0° sweep. As shown above, the winglet with 90° cant and 45° sweep outperformed its opponent at all the attack angles of every speed except for the attack angle of 10° at the speeds of 15 m/s, and 22 m/s. After comparing the Cl/Cd vs α of the 2 selected winglet candidates, the selected blended-type winglet design is the winglet with cant angle of 45° and a sweep angle of 0°.

5. CFD Analysis of the Propellers

The main objective of this chapter is to conduct a CFD simulation for the selected propeller and plot the lift force against the angular velocity of the propeller to identify the RPMs required to generate the desired lift-to-weight of 2. As well as visualize the effects of the propellers on the wings of the model by conducting a transient simulation for different angular velocities of the propellers, angles of attack, and incoming velocities. The propeller that is selected is a 13-inch carbon fiber propeller with a 4.4 pitch. A CAD of the propeller is created on Autodesk Fusion 360 and exported along with the flying wing design as a step file to ANSYS and in the first simulation in this chapter, the lift of the propellers will be obtained at 2500, 5000, 7500, and 10,000 revolutions per min.

5.1. Geometric Setup

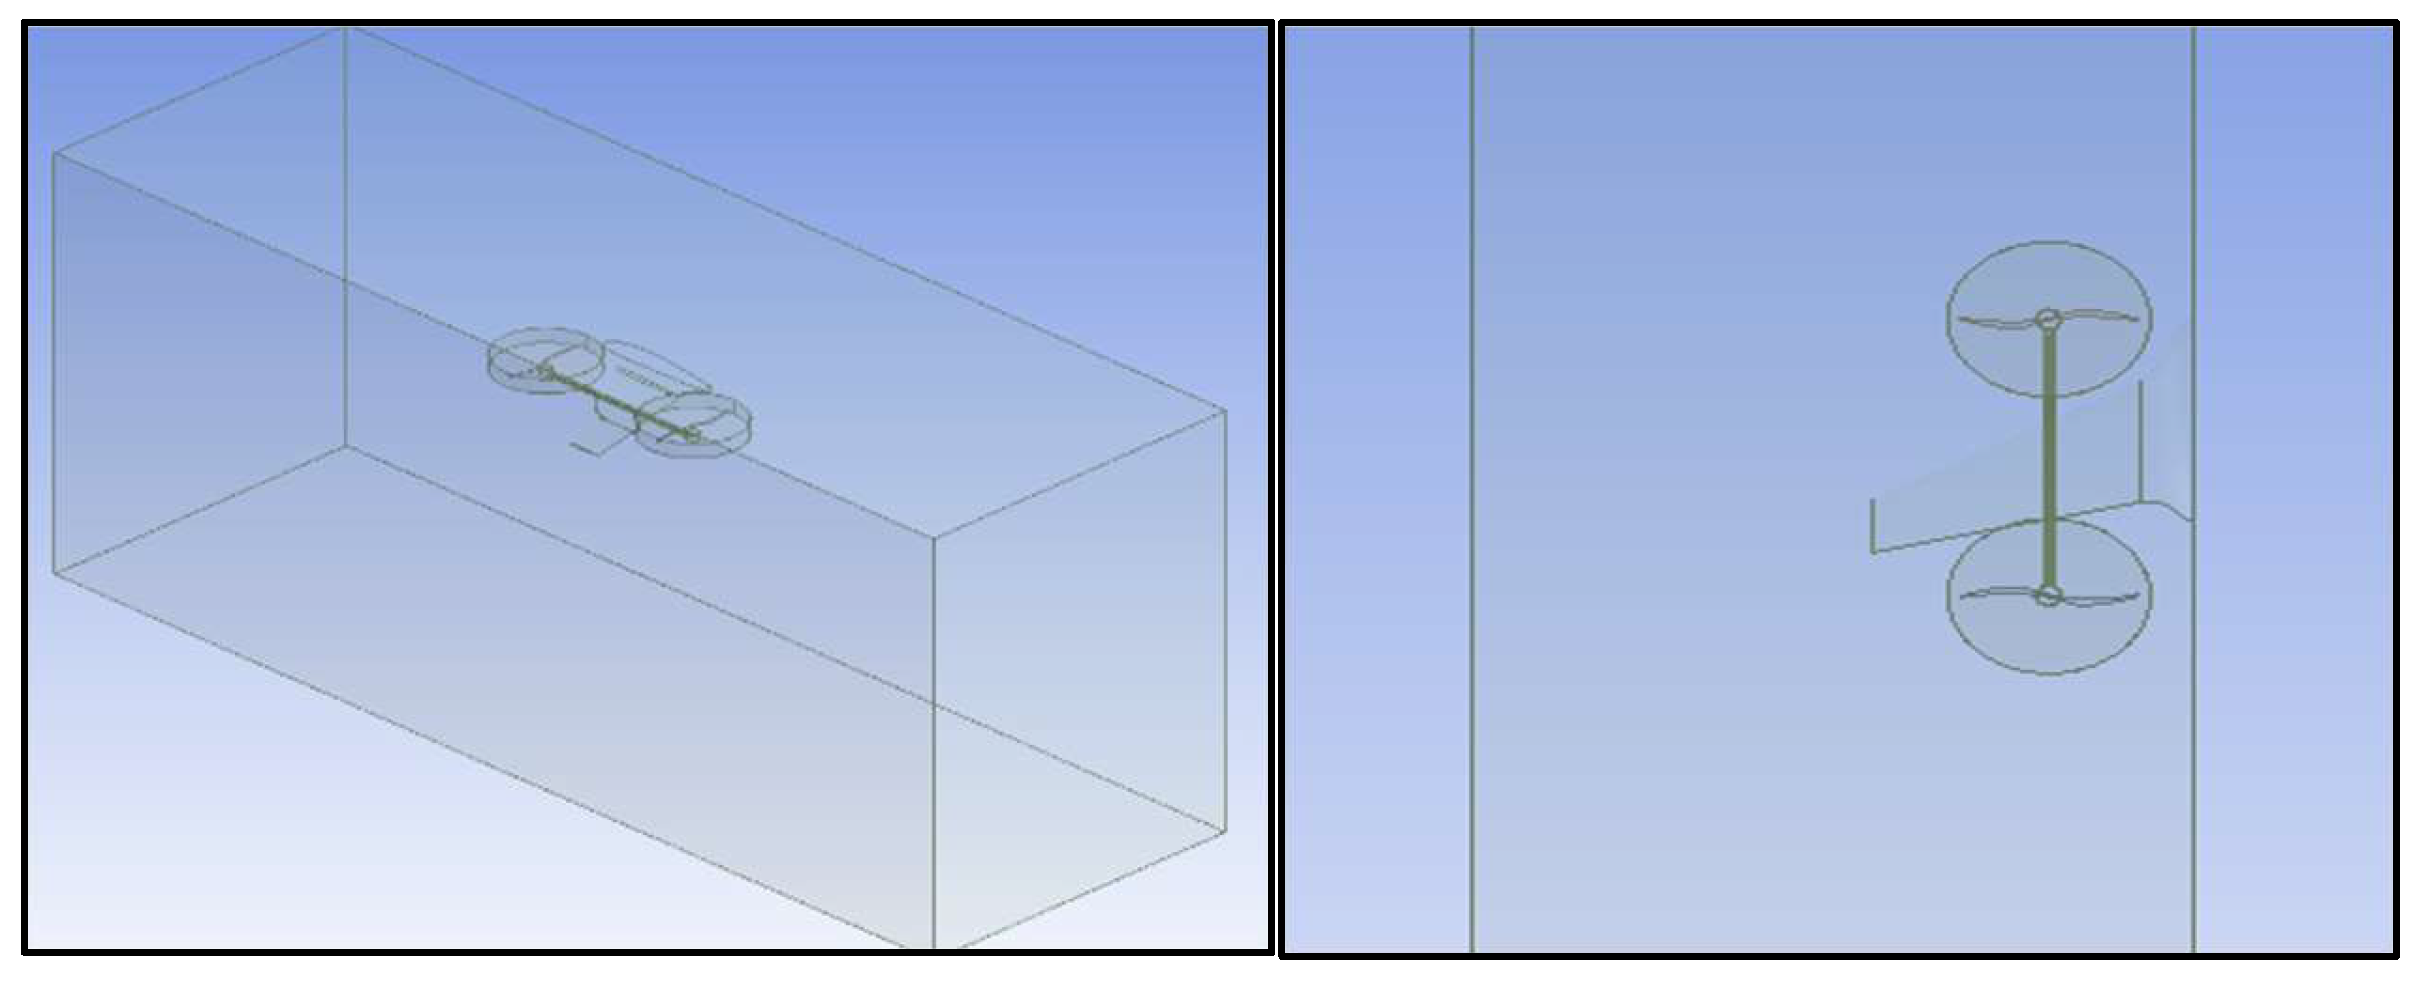
The model is edited in Design Modeler where a rectangular enclosure is added around the model and 2 cylinders are created and placed at the center of rotation of each propeller as the rotational domain. The flying wing model and the propellers are then subtracted from the enclosure and the rotational domain, respectively, without preserving the bodies, and the rotational domain is subtracted from the enclosure with the bodies preserved, and the symmetric axis is specified as shown in Figure 5-1 below.

5.2. Meshing

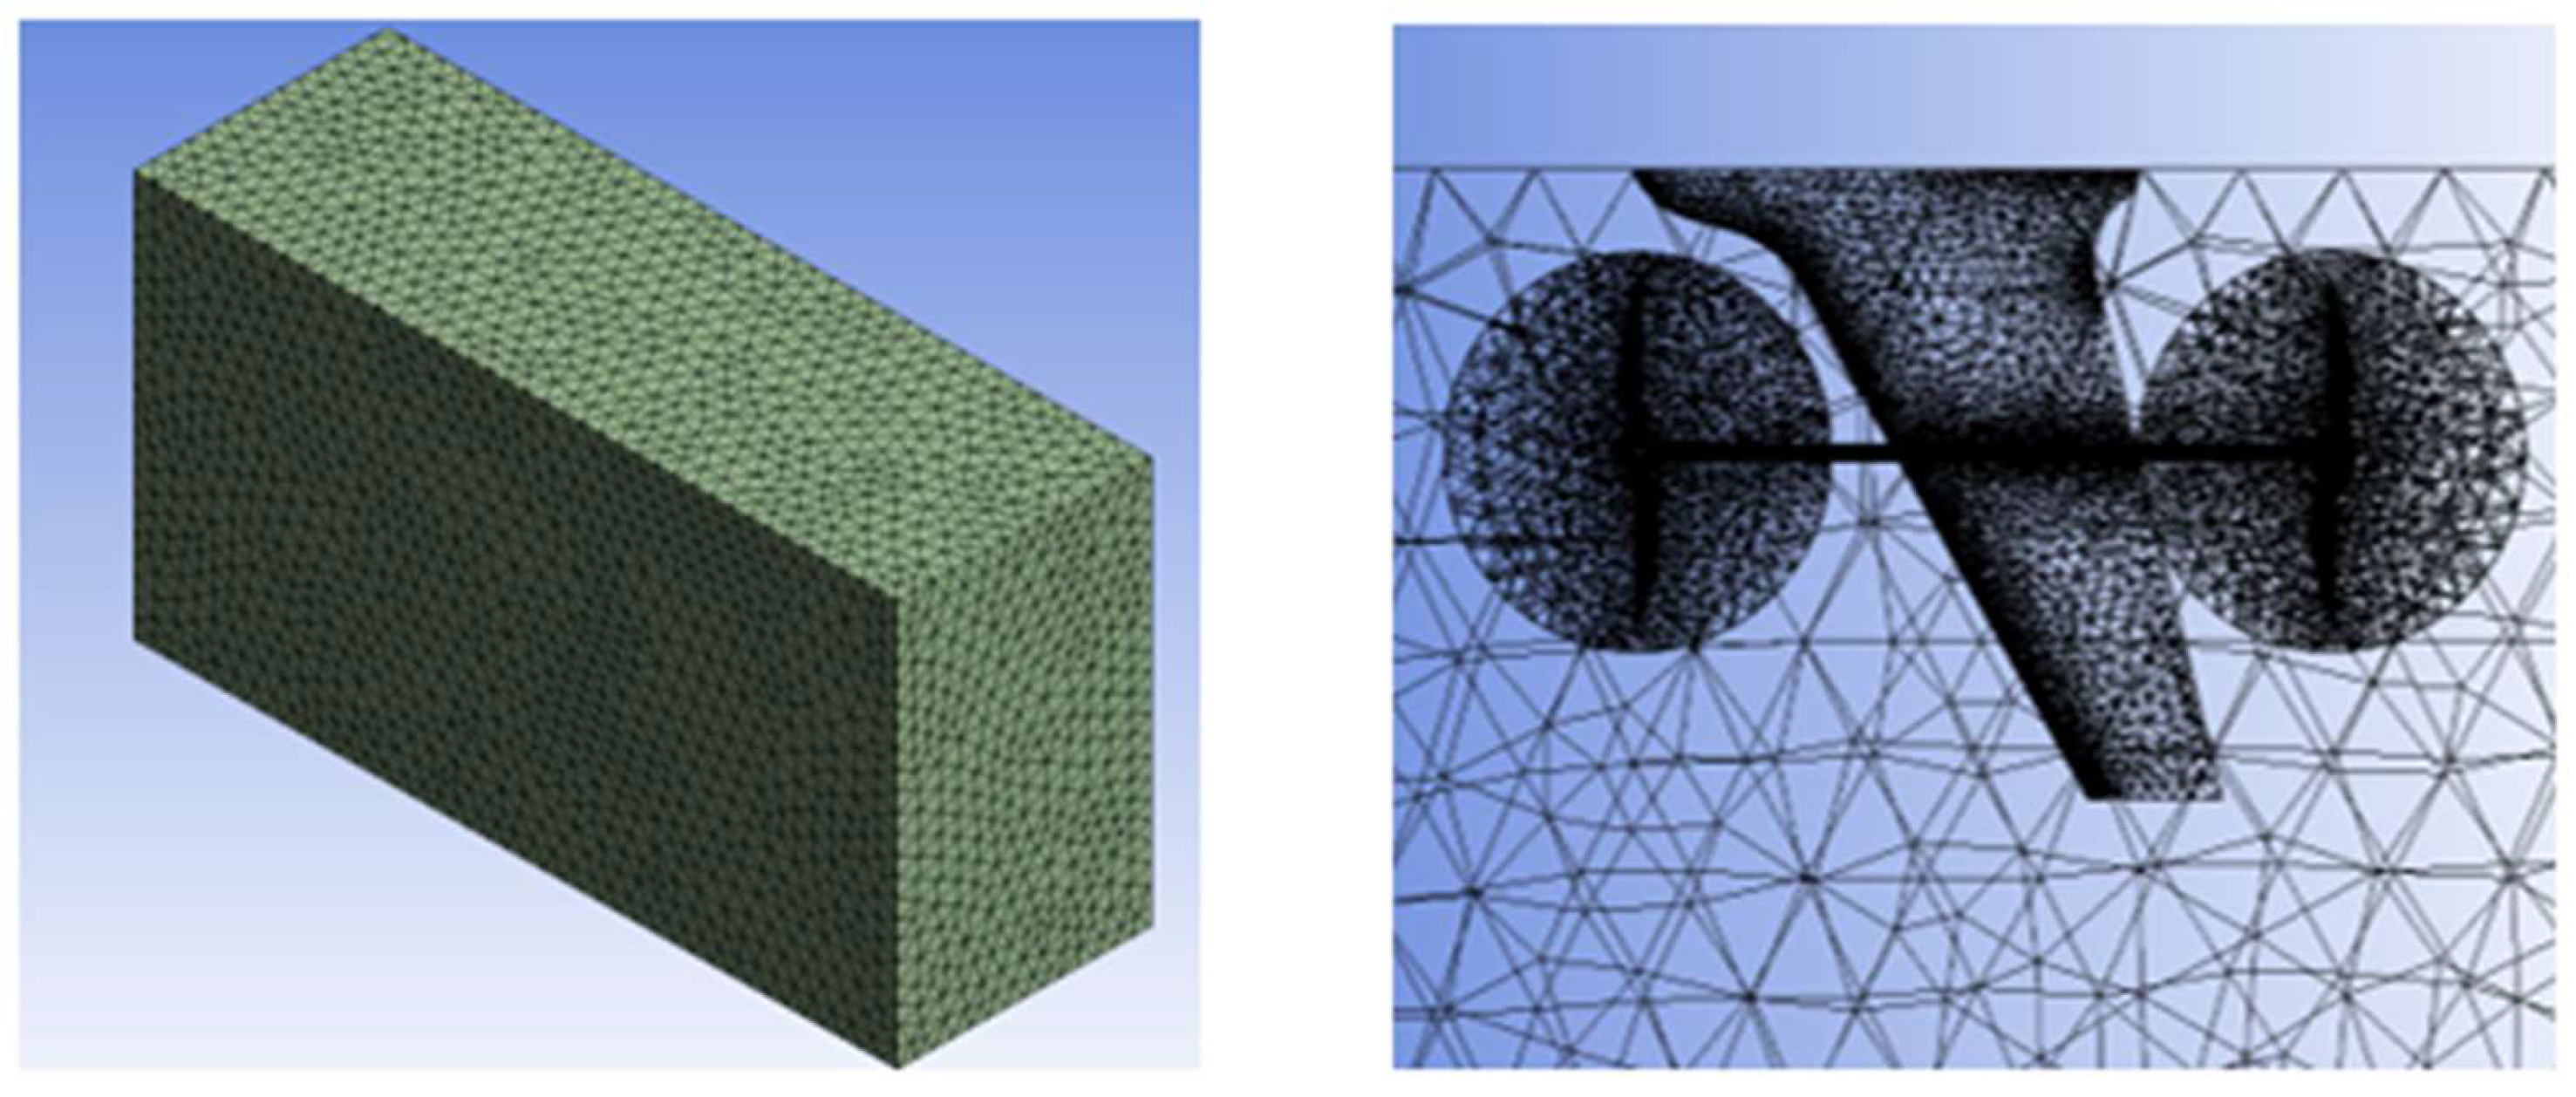
The meshing element is a linear tetrahedral element with 4 nodes per element at 4 degrees of freedom per node (x, y, and z velocities, and pressure) shown in Figure 5-2. The default element size is set to 0.1m and a sizing method is added to the faces of the propellers with the element size set to 0.0025 m to increase the mesh count at the propellers and their rotational domains. The mesh quality is checked following the same criteria mentioned in section 4.2 where the mesh quality, aspect ratio, and skewness are examined and accepted. The mesh statistics are 1,673,934 elements and 304,135 nodes.
Named selections are created to specify the inlet (front, top, and bottom walls), the outlet, the drone body, each propeller, and the symmetry wall.

5.3. Analysis 1 Setup (Lift Force at Different RPMs)

5.3.1. Cell Zone Conditions

  • Rotational domain of propeller 1: set as frame motion, with the center of rotation of -0.095m in the x-axis, and 0.27m in the z-axis, and the axis of rotation is the y-axis (negative), the angular velocity is specified and will be changed for each run.
  • Rotational domain of propeller 2: set as frame motion, with the center of rotation of -0.585m on the x-axis, 0.27m on the z-axis, and the axis of rotation is the y-axis (positive).
The angular velocity is specified and will be changed for each run. The simulation is run with the number of time steps set to 500, a time step size of 0.001, and a max iteration per time step of 20.

5.4. Analysis 1 Results

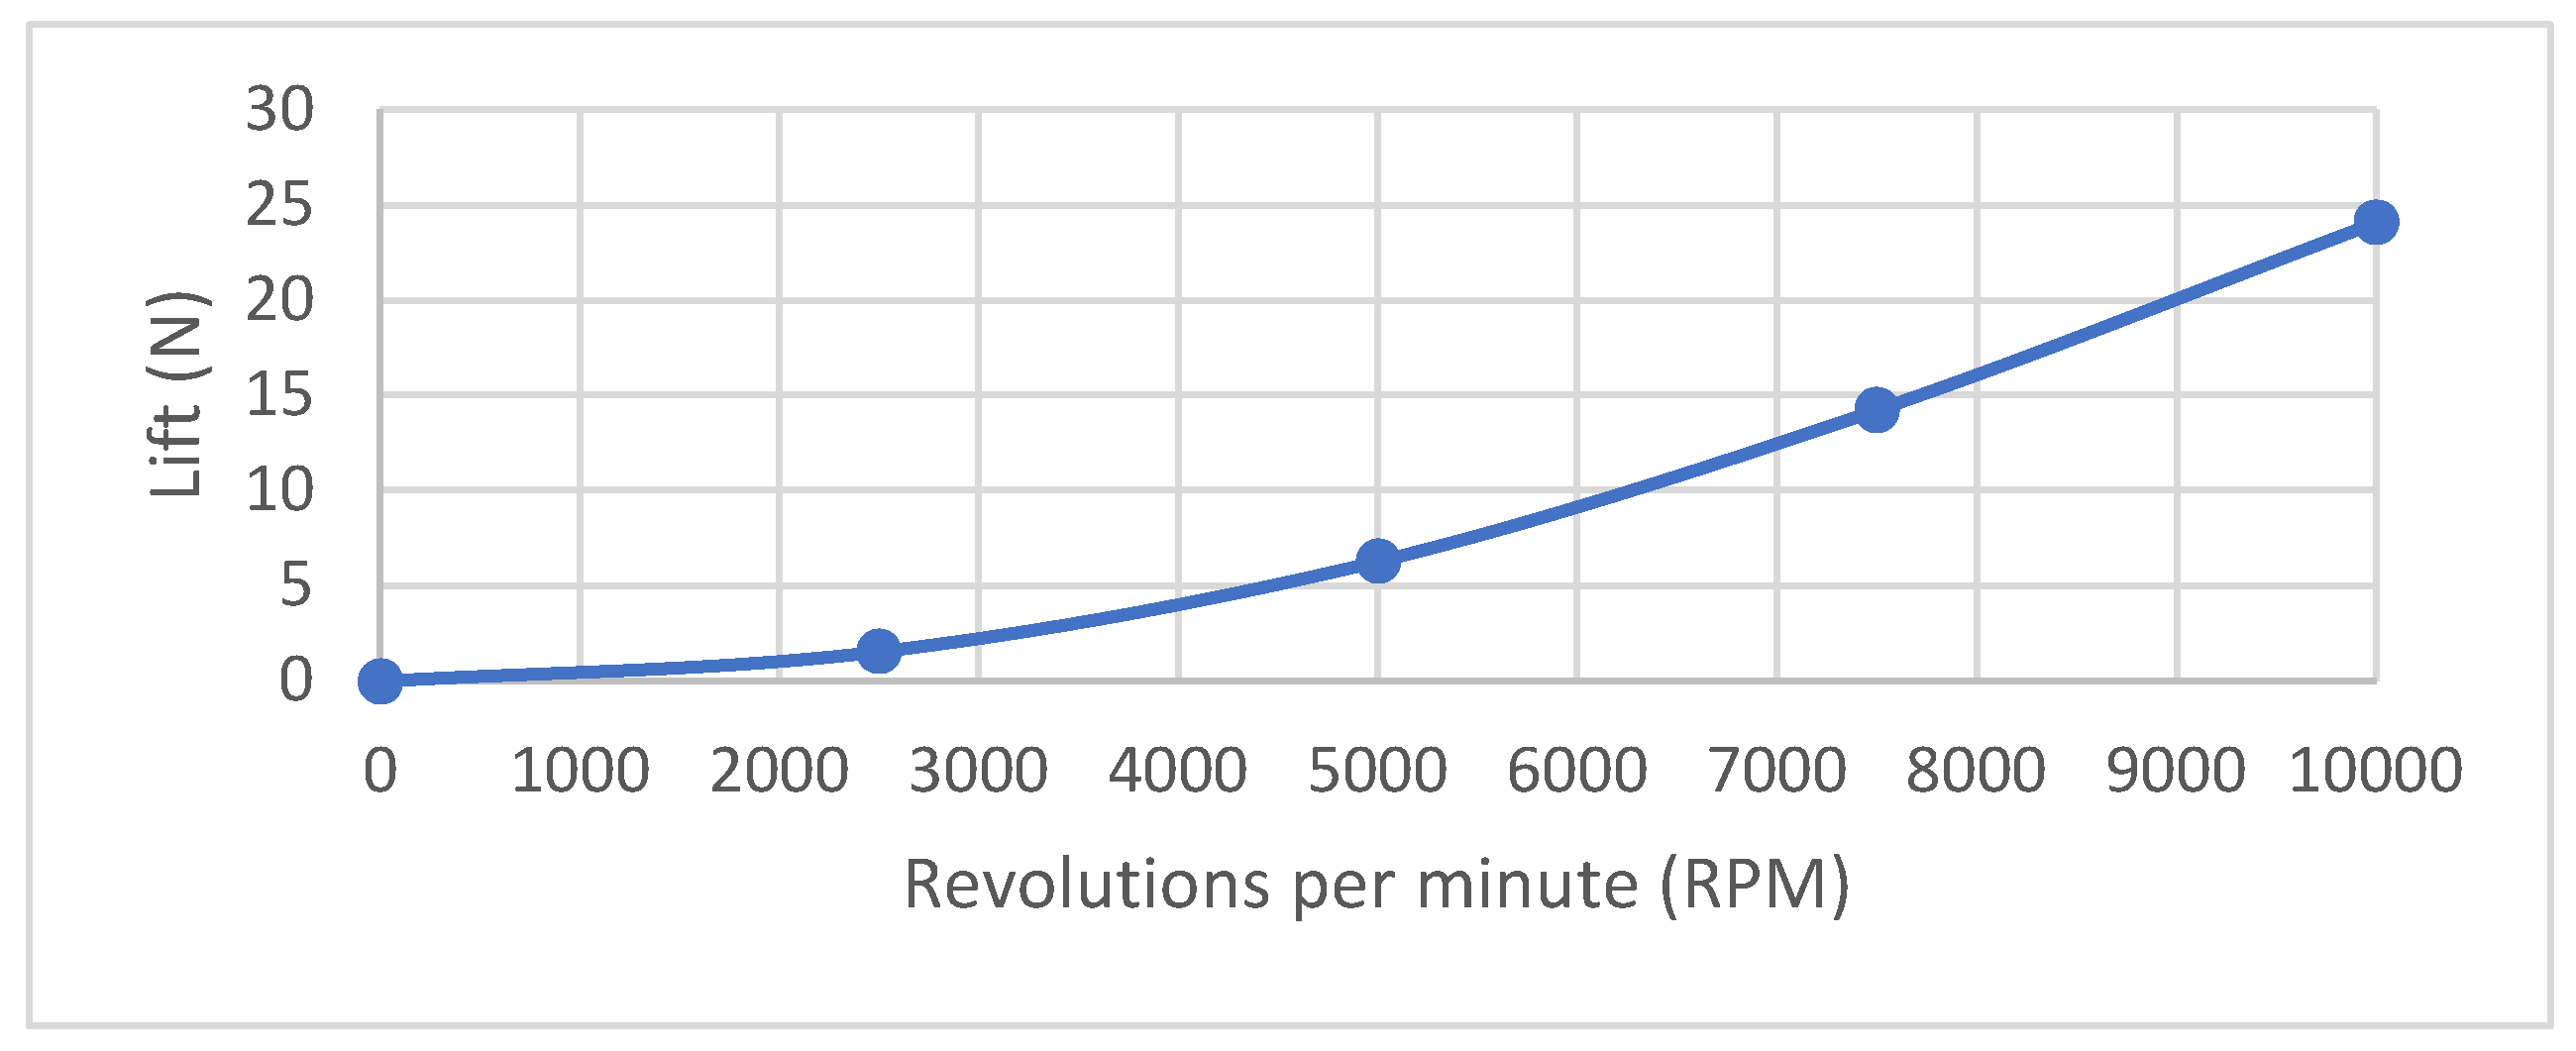
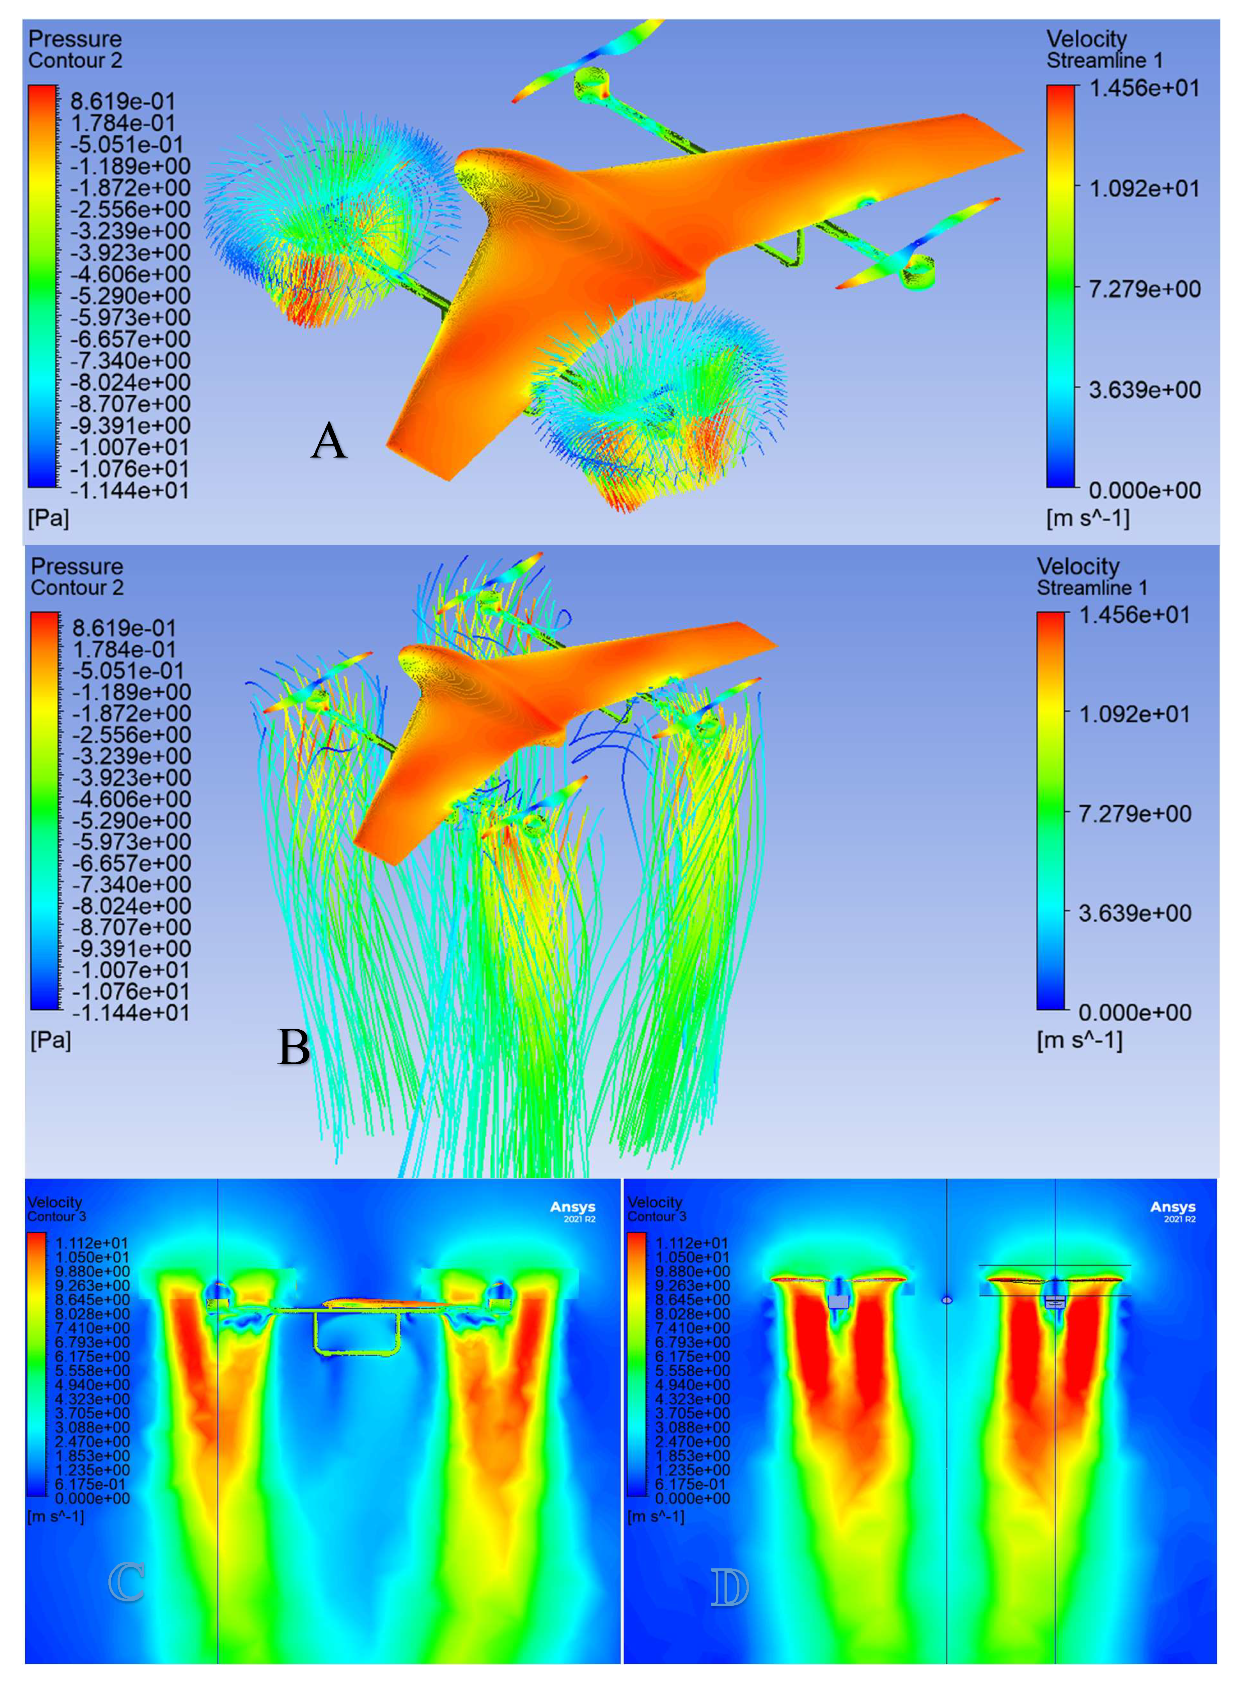
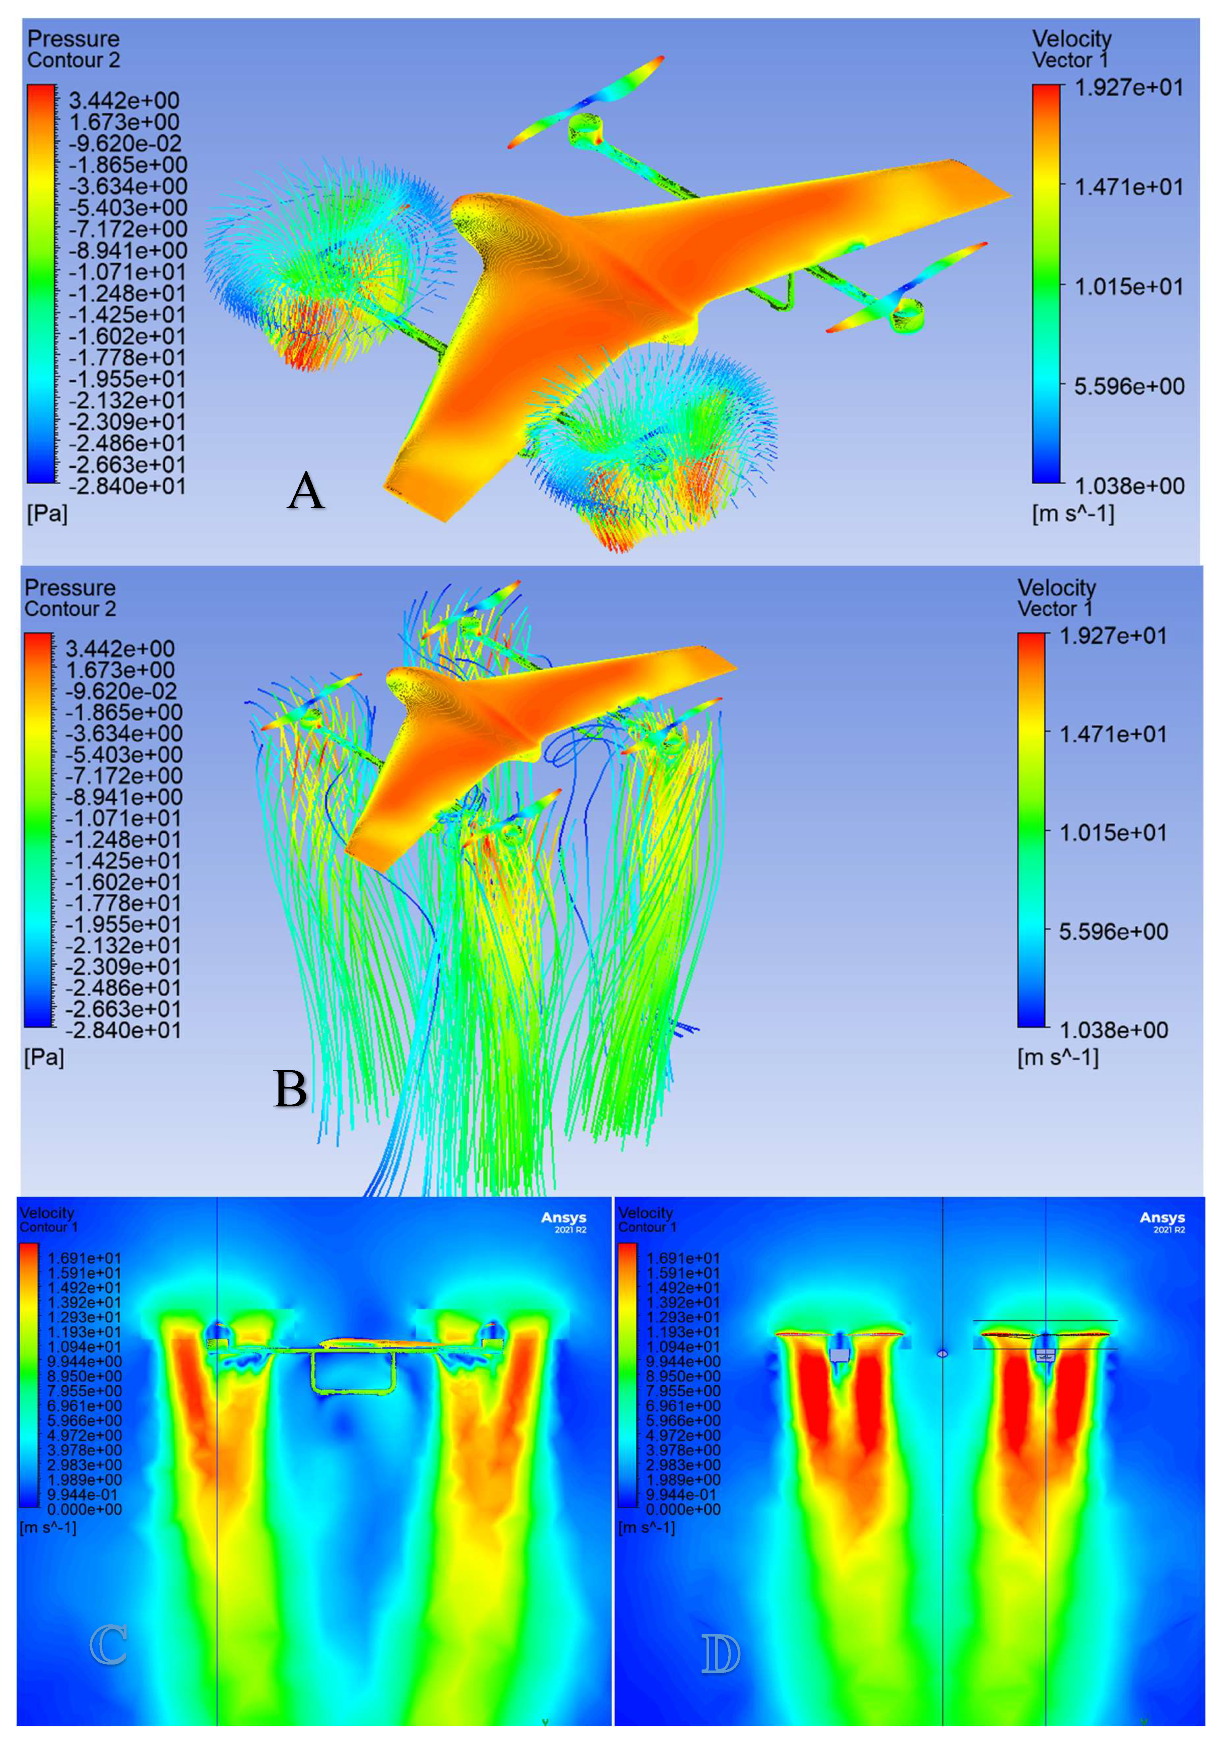
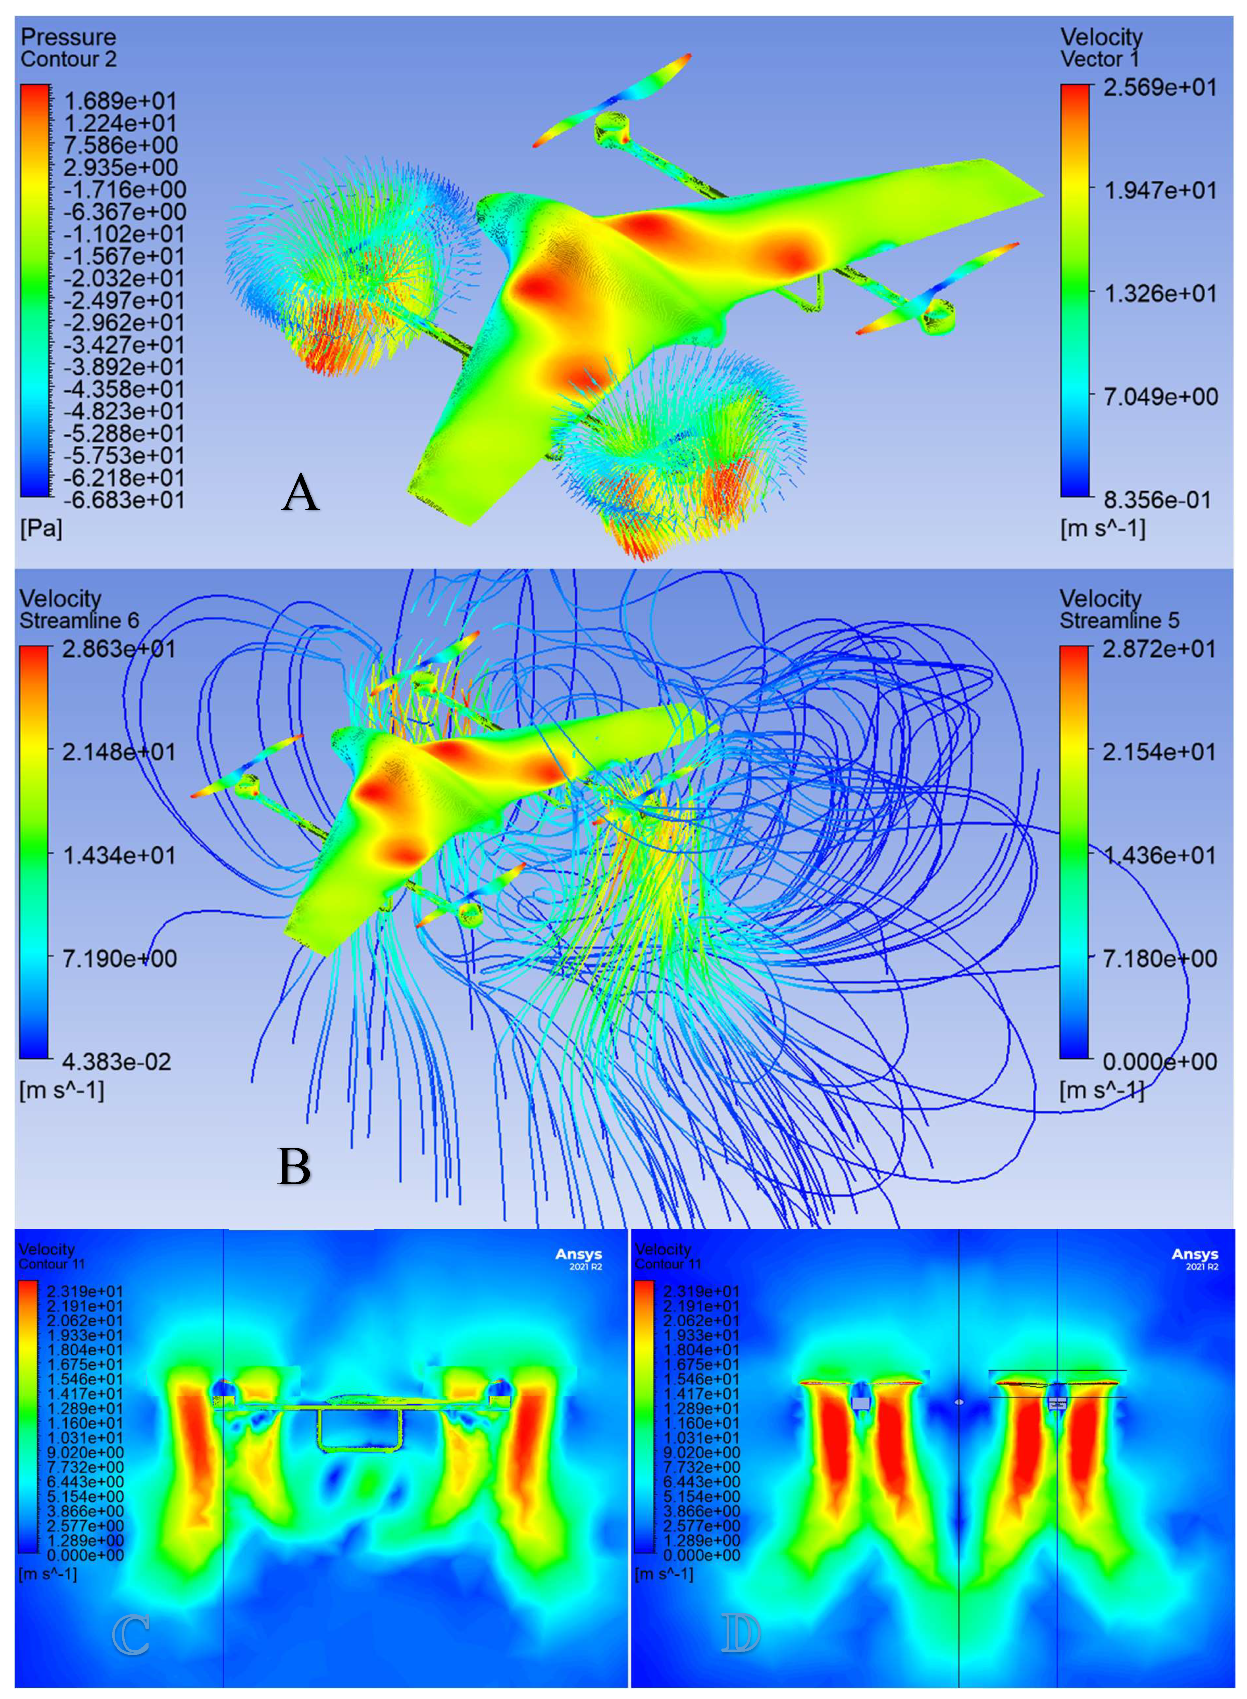
Figure 5-3 shows the lift force of the propellers plotted against the angular velocity in revolutions per minute (RPM). The lift-to-weight ratio that is anticipated is 2:1, meaning that the lift force required per propeller is around 7.5 N (assuming the weight of the drone is 1.5 kg). Therefore, each of the 4 horizontal axis motors should have an angular velocity of around 7000 RPM. In the case of hovering, the propellers need to be rotating at a speed of around 4000 RPM. Results of simulation are shown in Figure 5-4, Figure 5-5 and Figure 5-6 below.
For 2:1 lift-to-weight ratio:
L = 2 W = 2 1.5 9.81 = 29.4   N
29.4 4   p r o p e l l e r s = 7.35   N   p e r   p r o p e l l e r
For hovering (L=W):
L = W = 1.5 9.81 = 14.7   N
14.7 4 = 3.7   N   p e r   p r o p e l l e r

5.5. Analysis 2 Setup (Effects of the Propeller-Body Aerodynamic Interaction)

In the second analysis, the lift coefficient of the flying wing will be obtained for the different attack angles, velocities, and angular velocities of the horizontal axis propeller as shown in Table 5-1. The values will be compared and evaluated to determine the effects of the propellers on the body of the flying wing as well as the optimum climbing speed and propellers’ angular velocity. The same geometry, mesh, energy, viscous models, and cell zone conditions from the first analysis in this chapter are used, however, the boundary conditions will be changed according to the specified parameters.

5.6. Analysis 2 Results

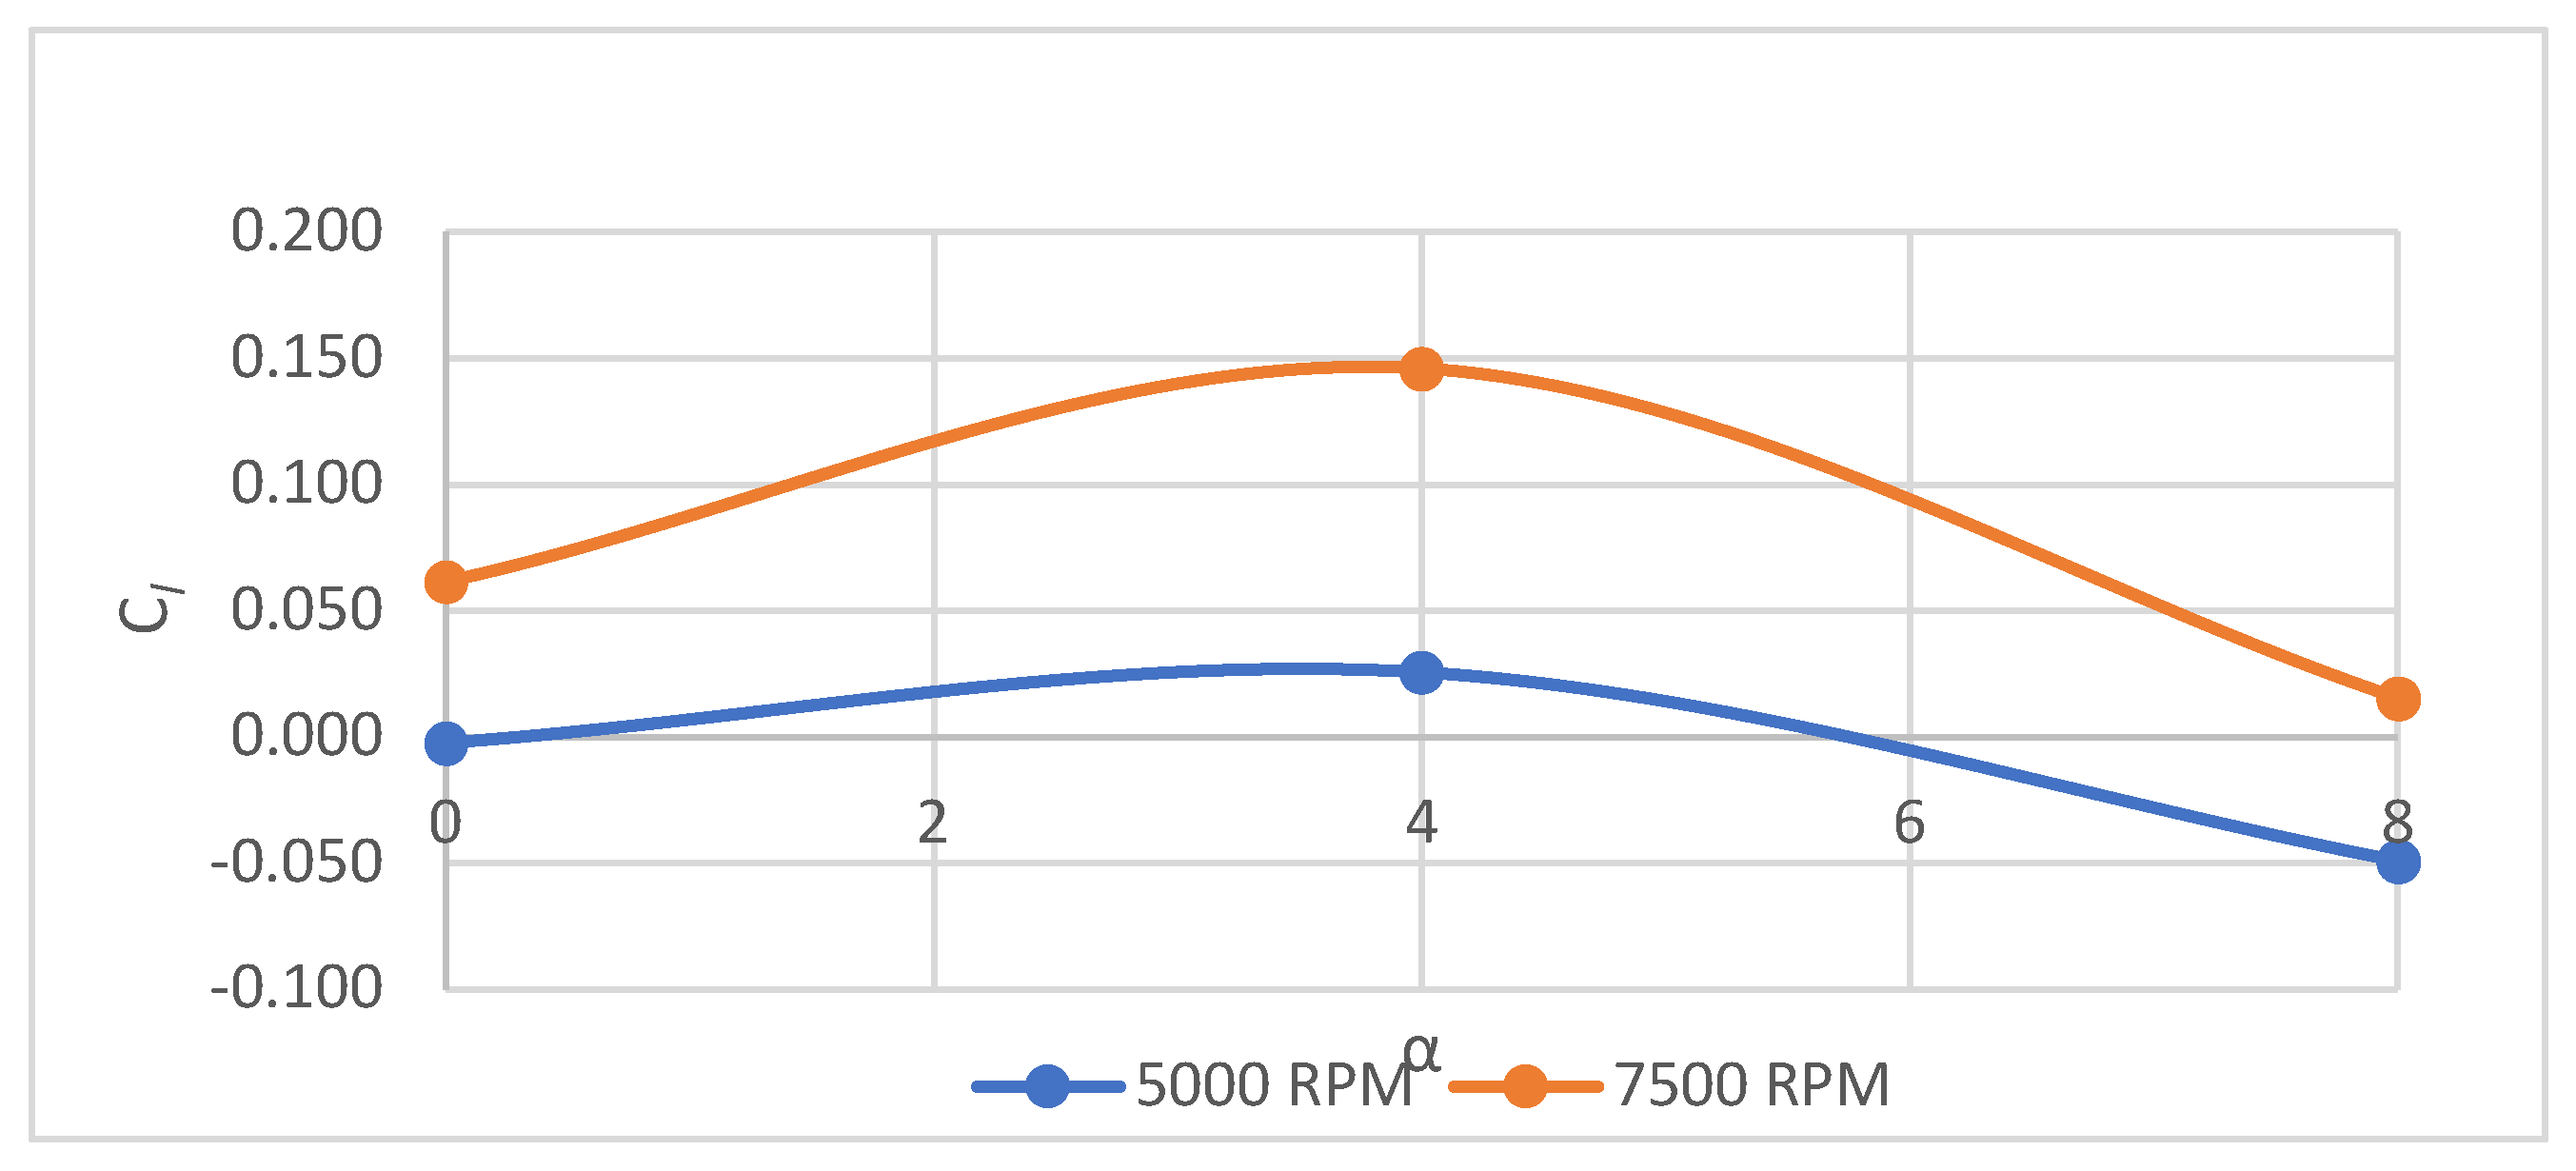
It is noted that for the same attack angle and incoming speed, the lift coefficient varies for the different propeller angular velocities. Figure 5-7 shows the Graph of the lift coefficient of the flying wing body plotted against the angle of attack while the propellers are running at 5000 RPM and 7500 RPM at an incoming speed of 4 m/s or in other words, climbing at 4 m/s. The maximum lift coefficient that was achieved is 0.146 at the attack angle of 4 degrees and an angular velocity of 7500 RPM. The highest lift coefficient achieved during the propeller angular velocity of 5000 RPM is 0.026 at the attack angle of 4 degrees. For both cases, the lift coefficient starts to decrease past the attack angle of 4 degrees.
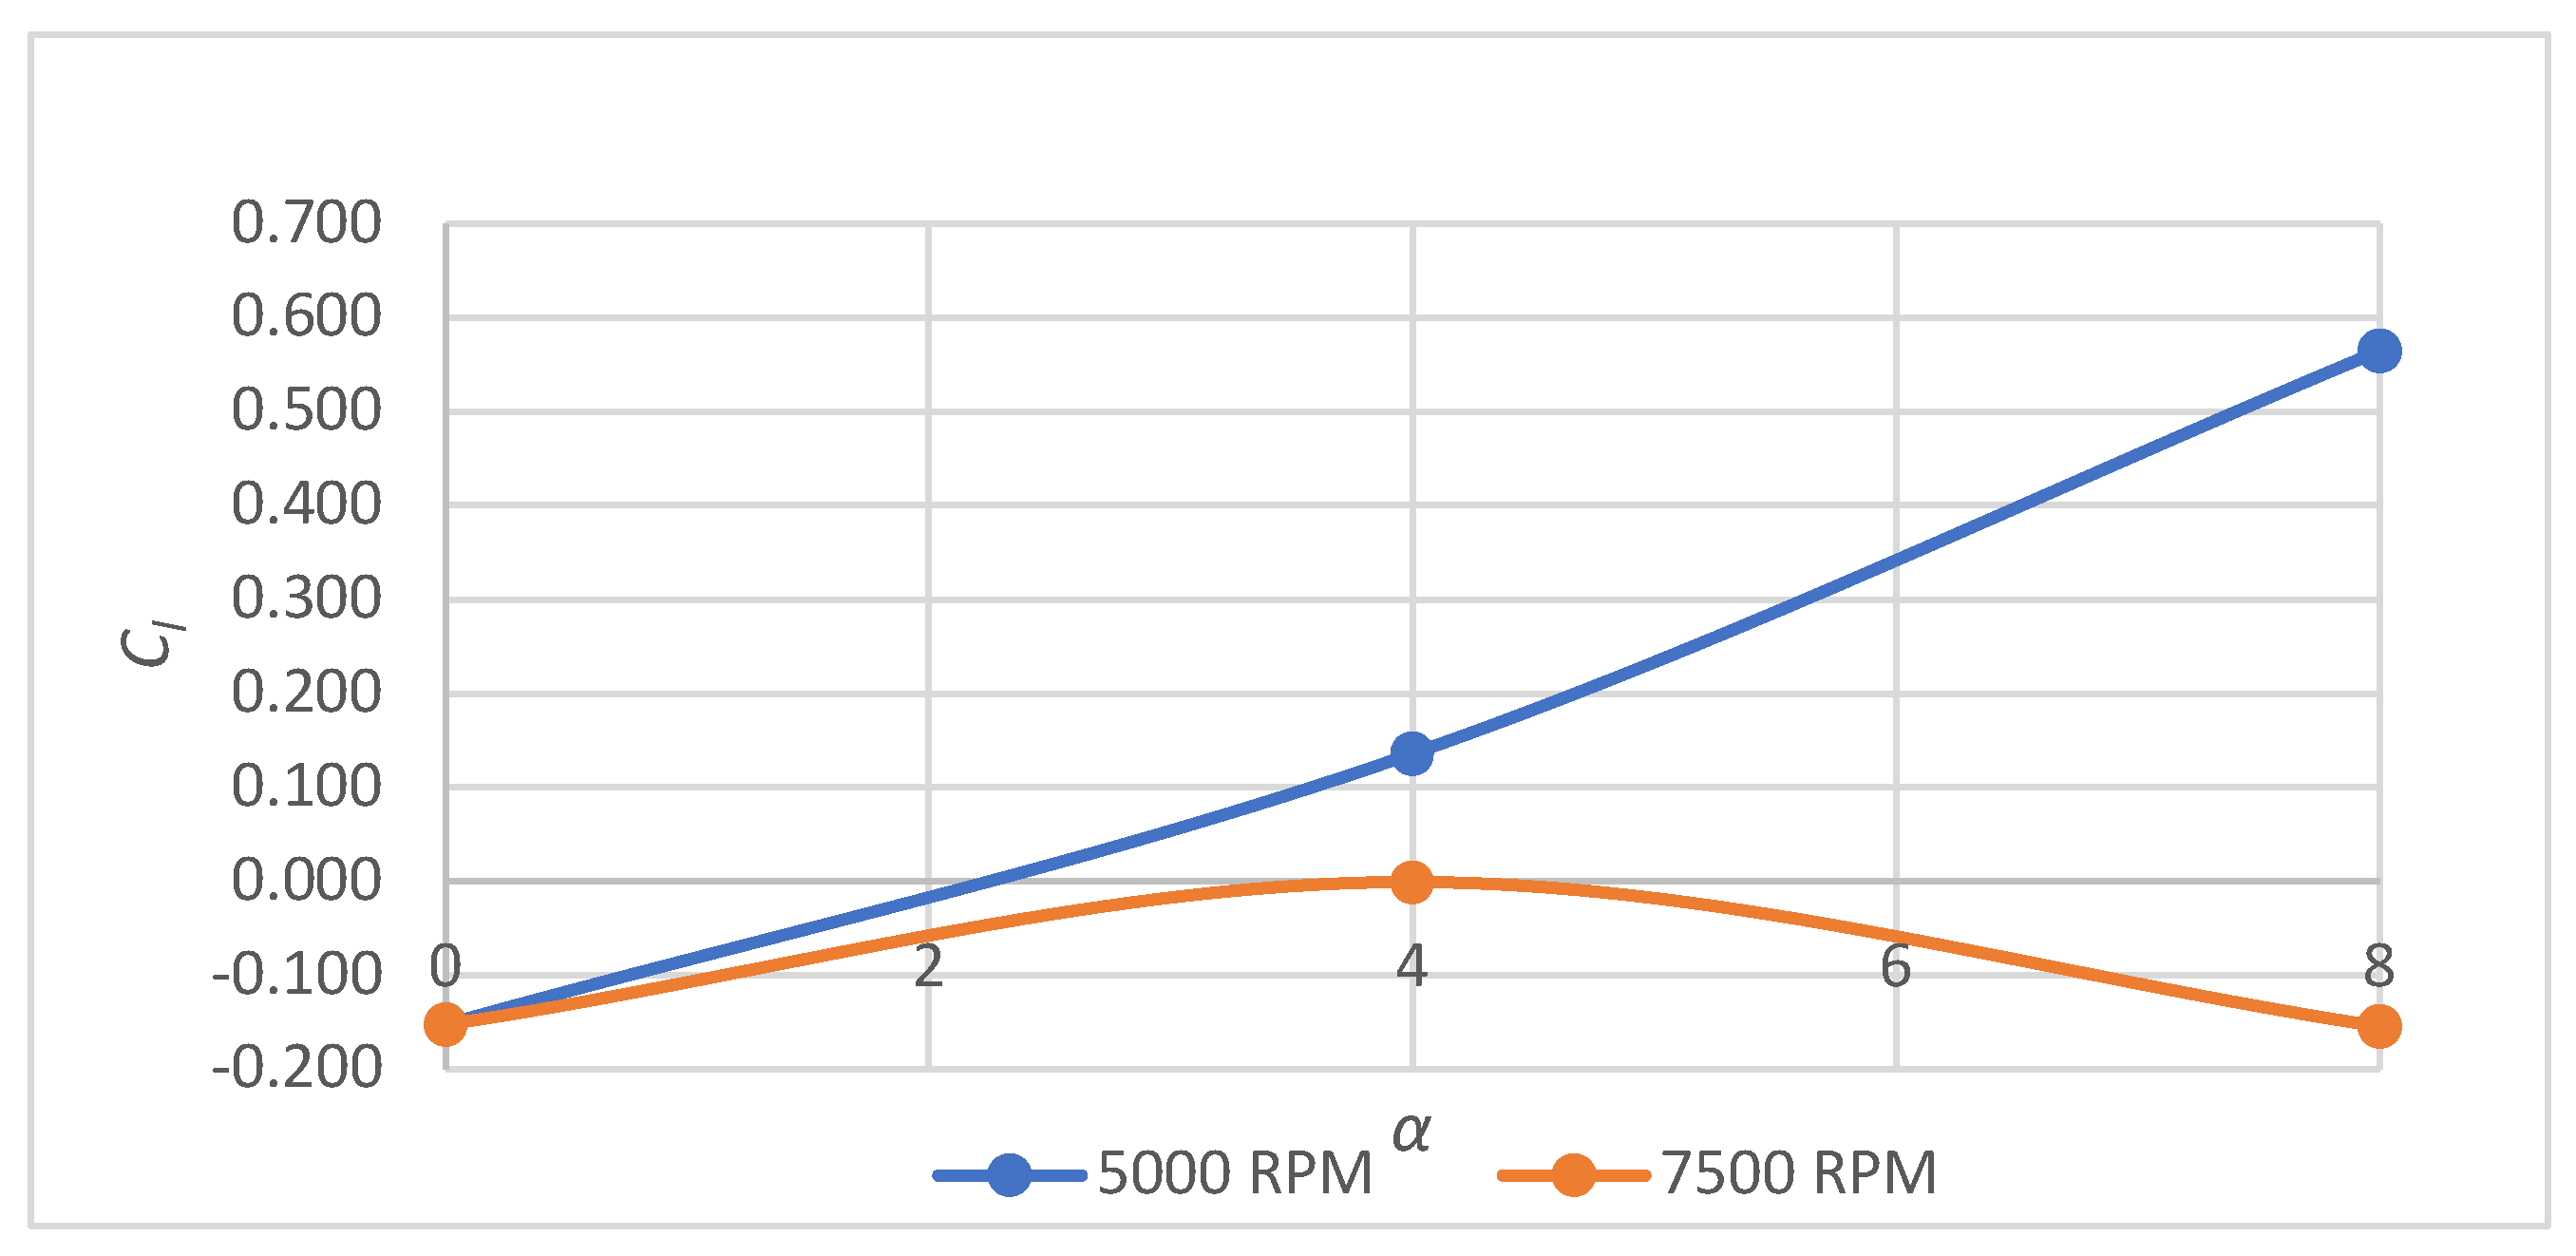
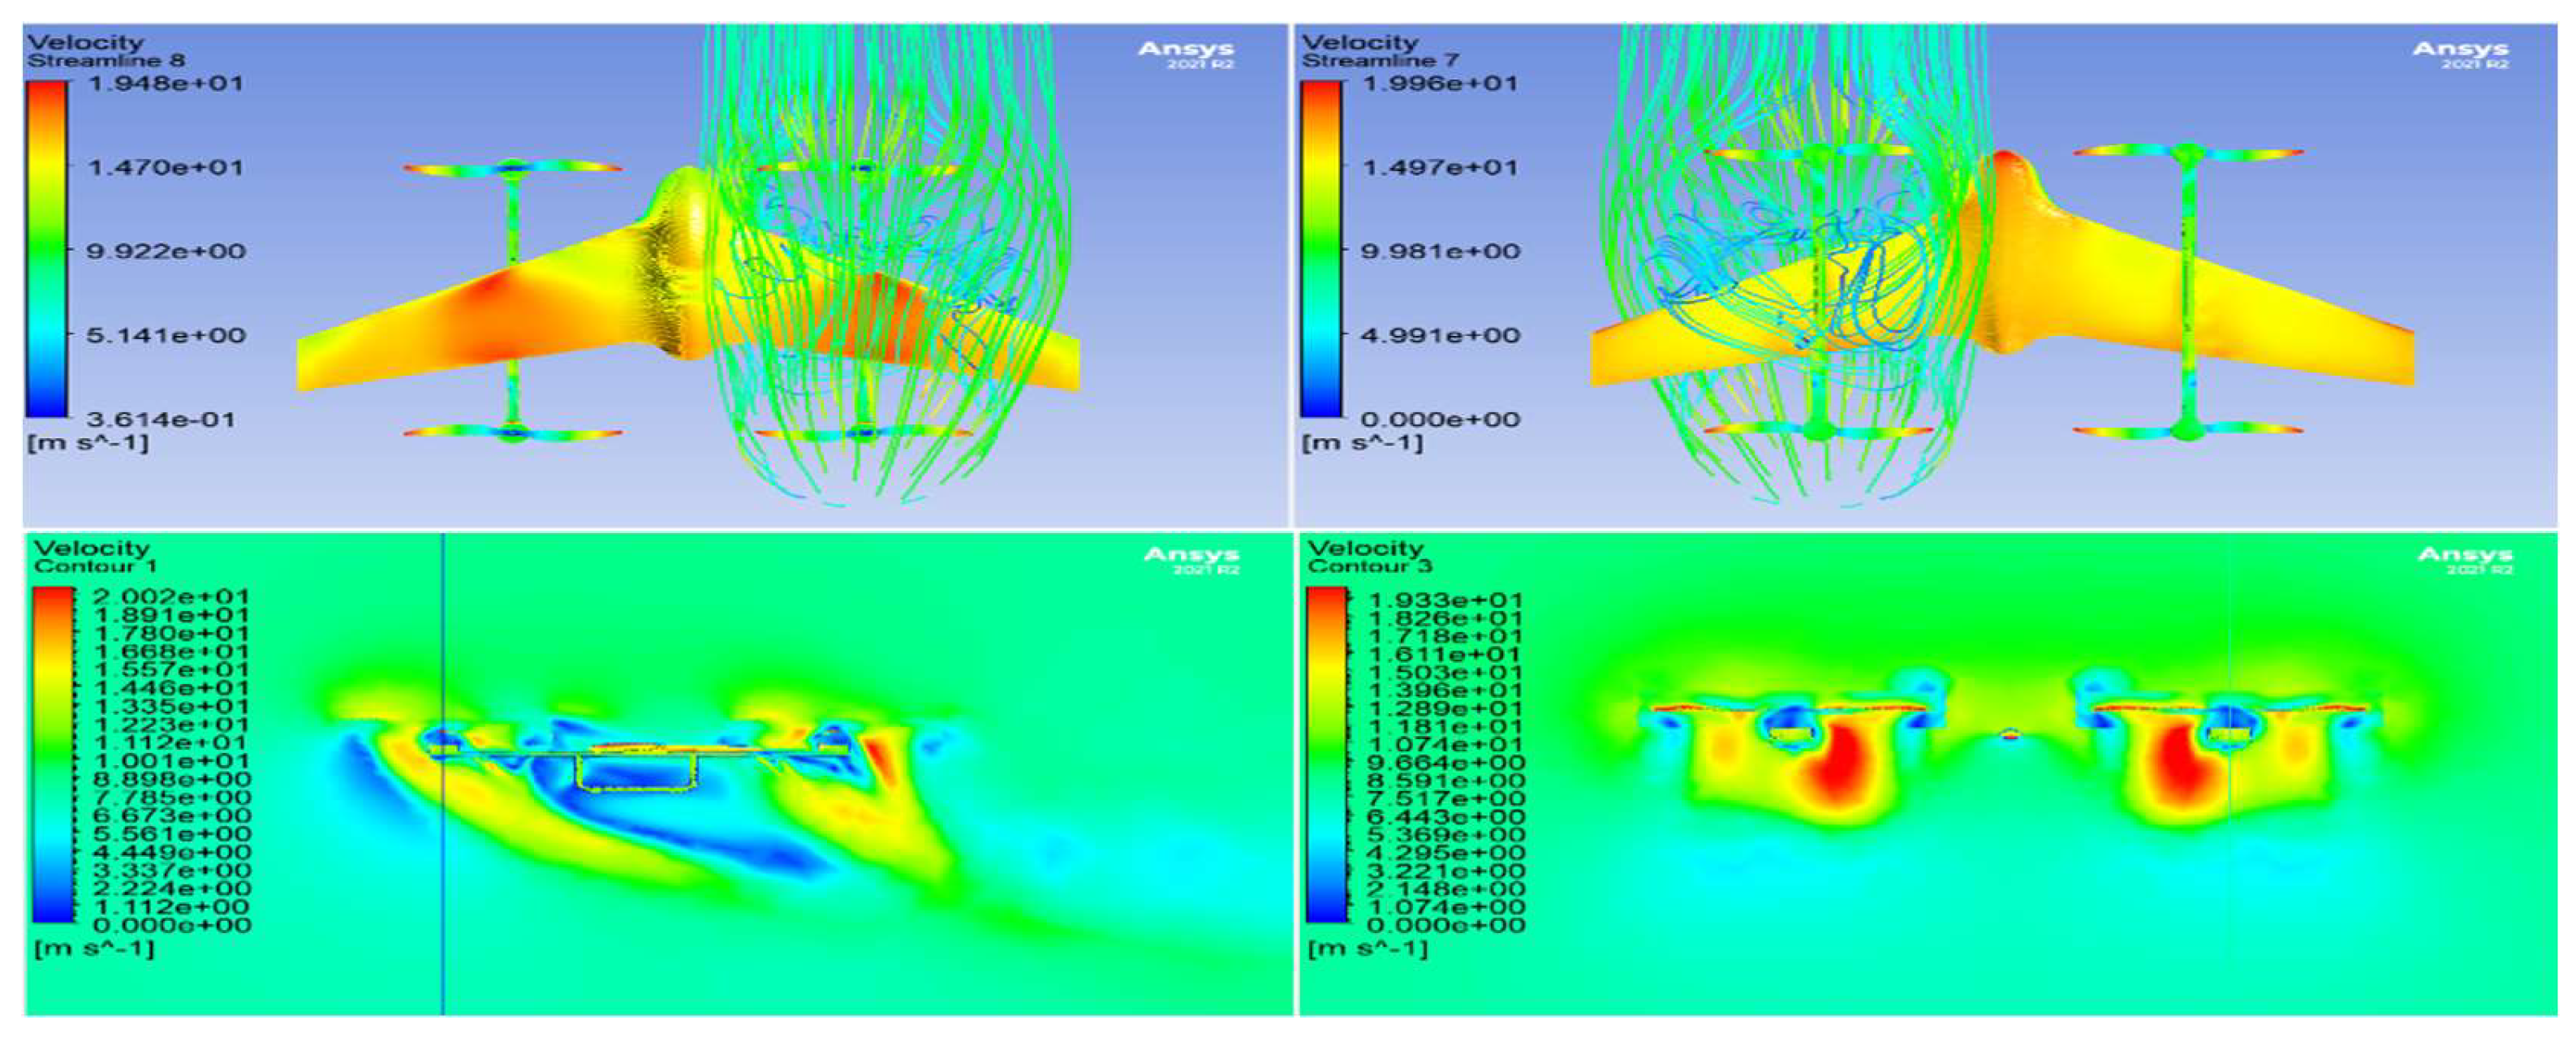
Figure 5-9 shows the coefficient of lift (Cl) of the flying wing at different angles of attack, and propeller rotation speeds of 5000 RPM and 7500 RPM during a climbing velocity of 8 m/s. The highest lift coefficient reached is 0.565 which was achieved at the angle of 8 degrees and propellers angular velocity of 5000 RPM and the highest lift coefficient reached by the rotational speed of 7500 RPM was -0.001 at the attack angle of 4 degrees. The minimum lift coefficient achieved at the climbing velocity of 8 m/s is -0.154 at the attack angle of 8 degrees and the rotational speed of 7500 RPM. The Graph behavior is quite different compared to Figure 6-8 since for both rotational speeds, the lift coefficient increases from 0 to 4 degrees and starts to decrease after that to the attack angle of 8 degrees, whereas, for Figure 6-11, the lift coefficient is increasing from the attack angle 0 degrees to 8 degrees in the case of 5000 RPM.
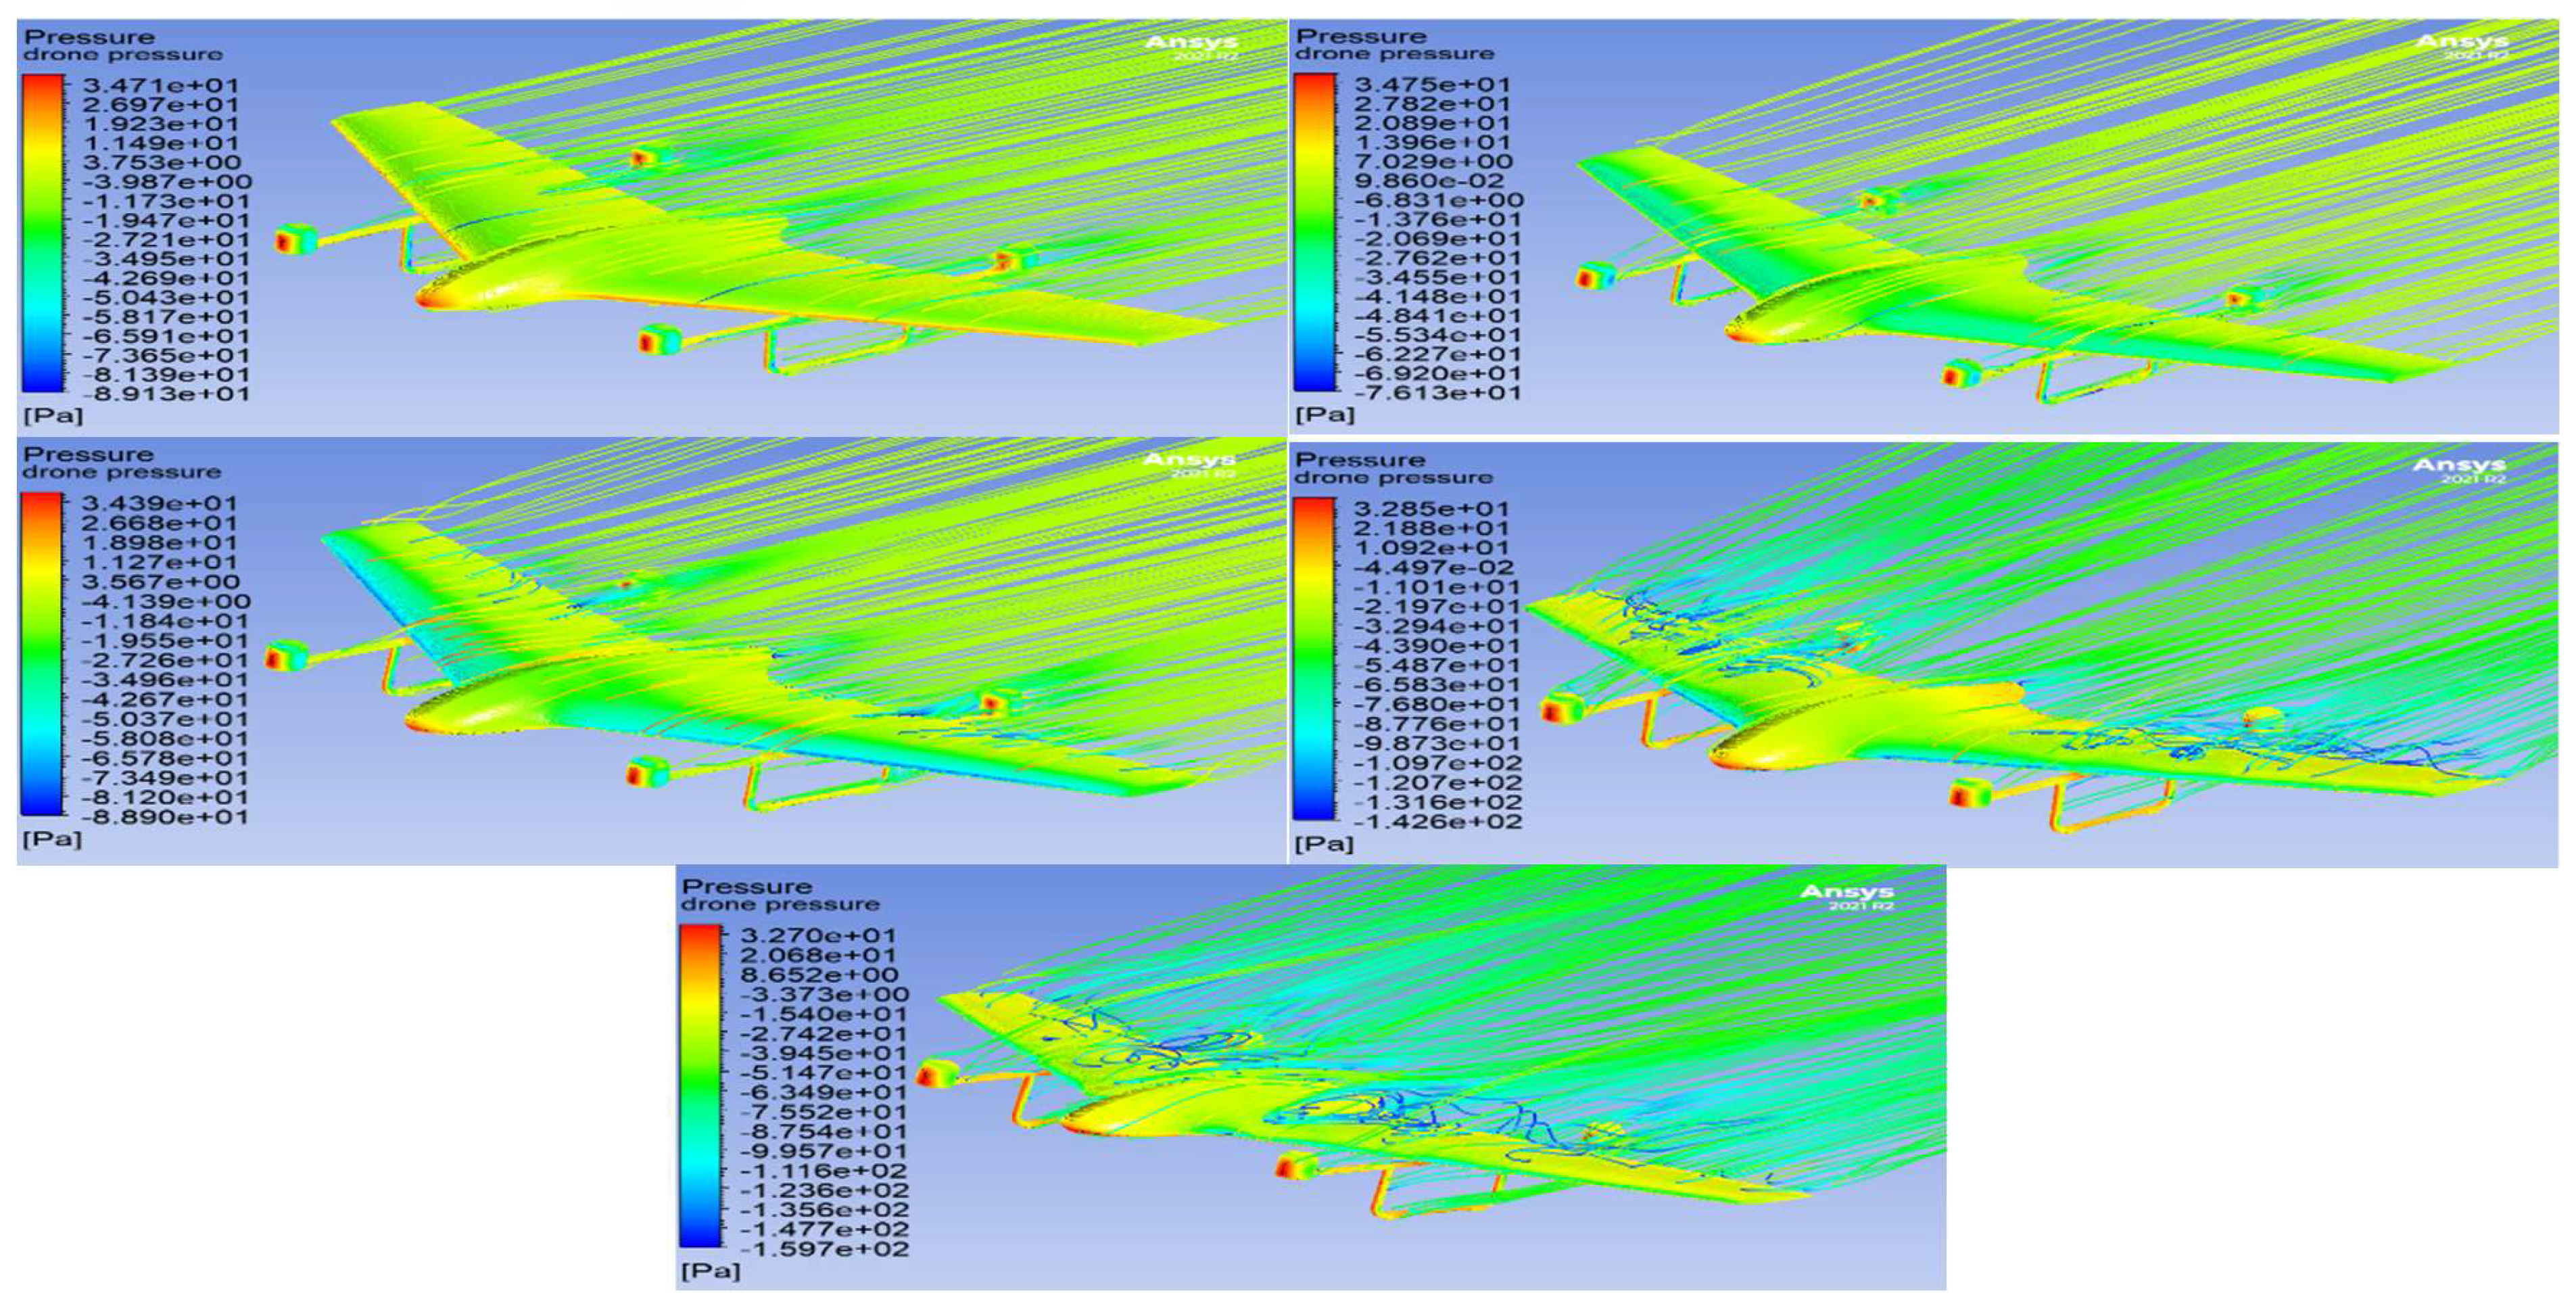
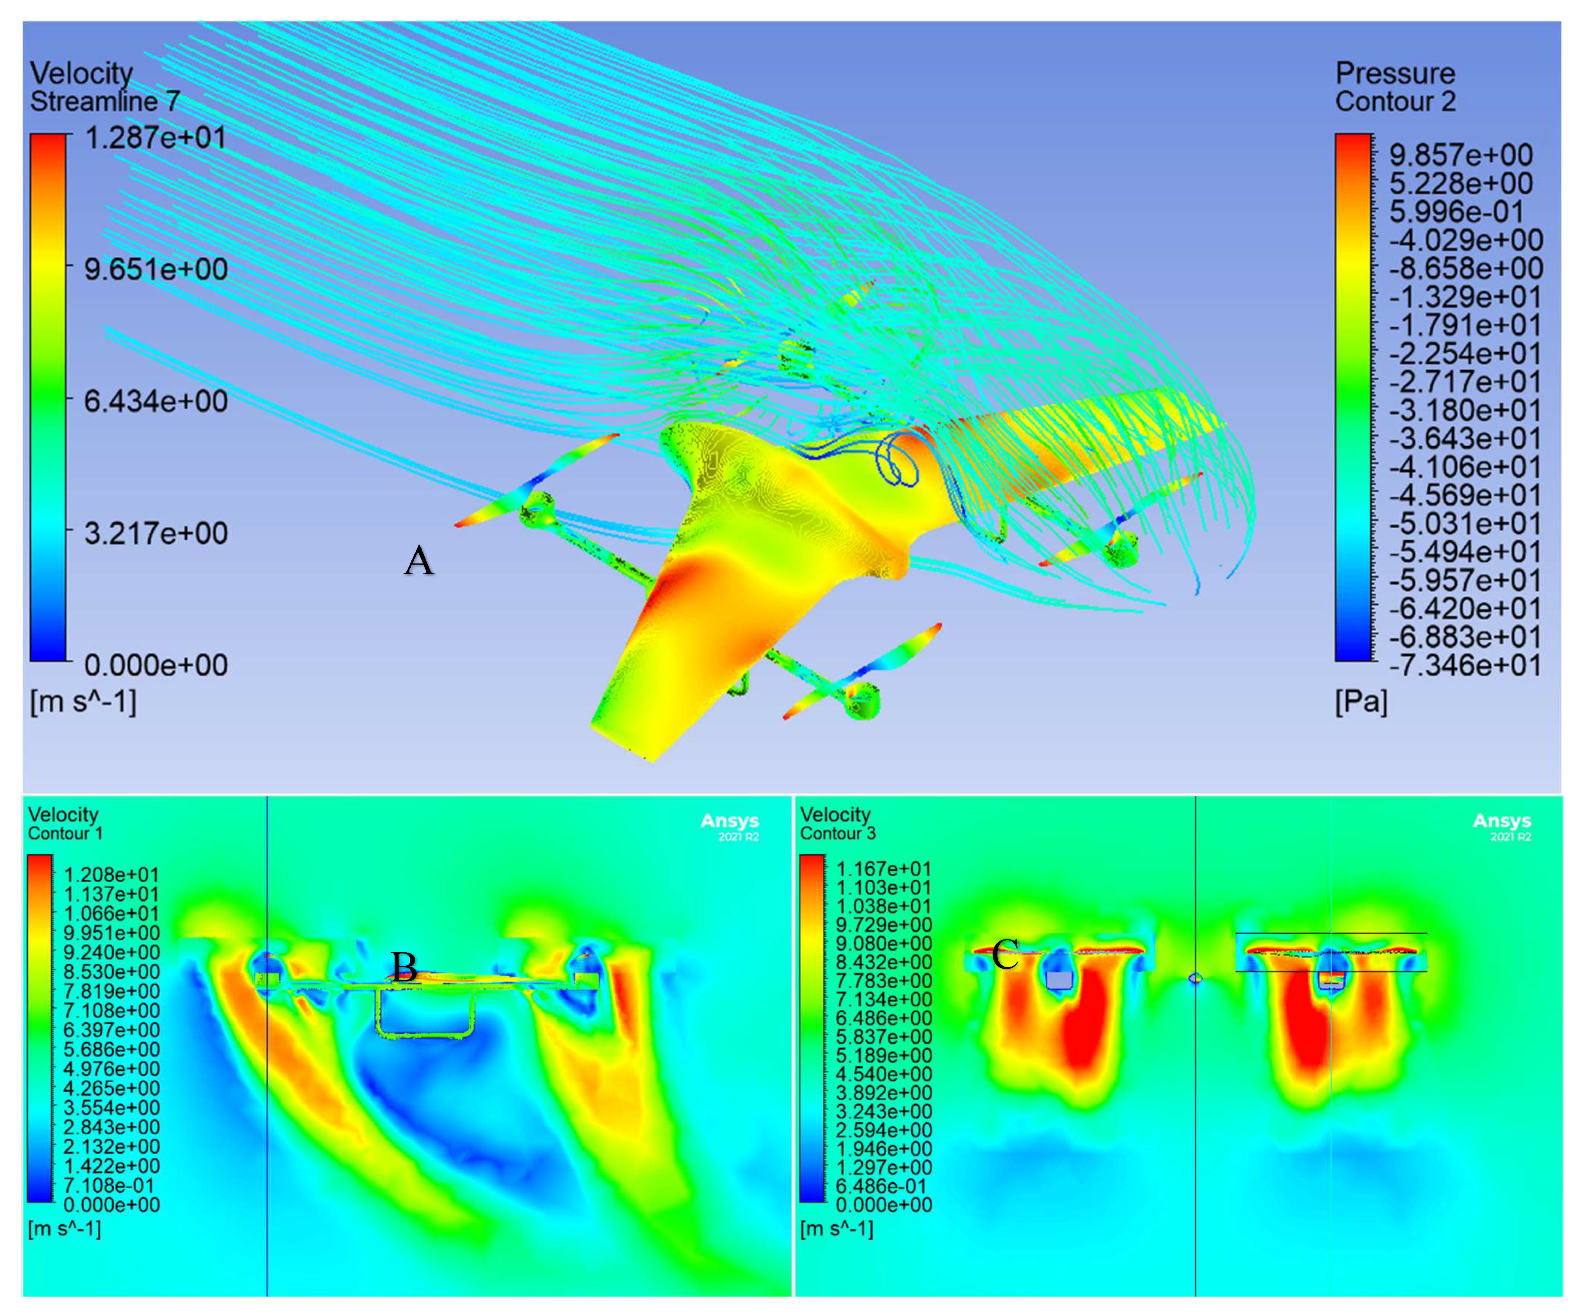
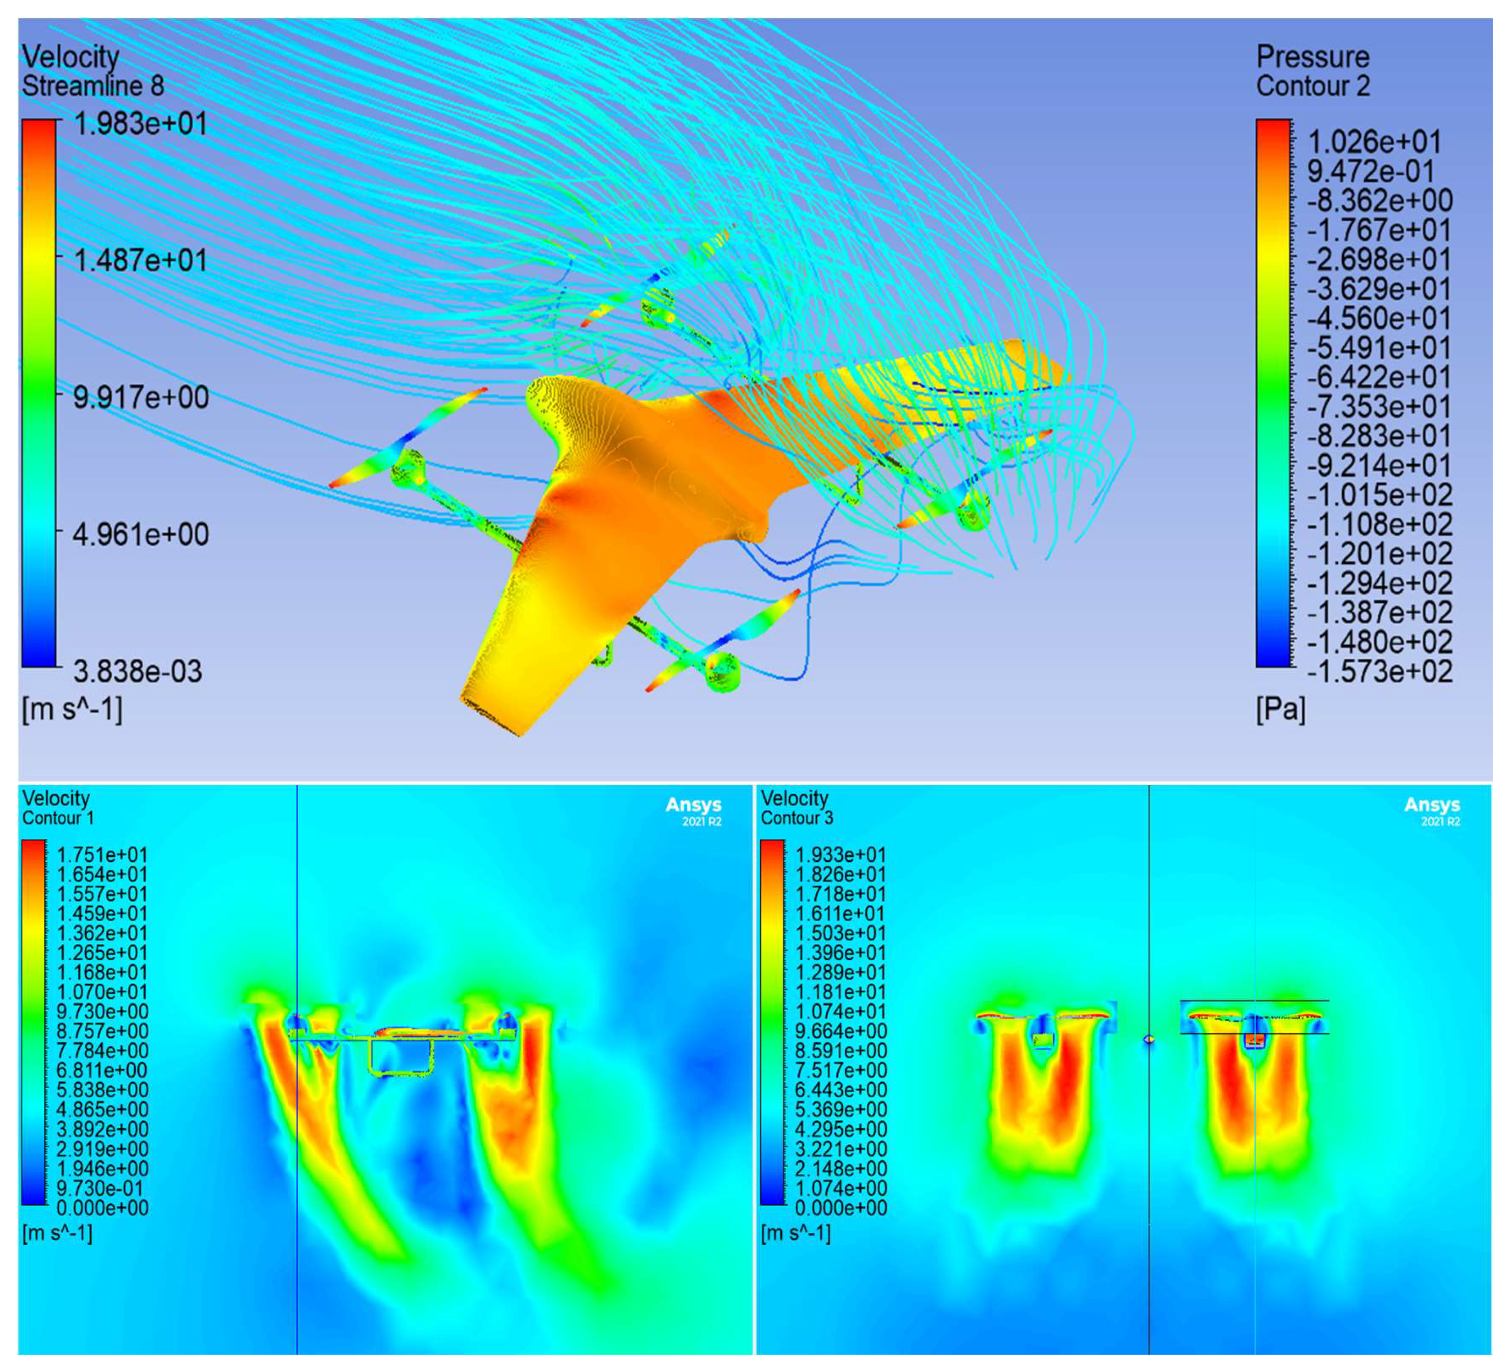
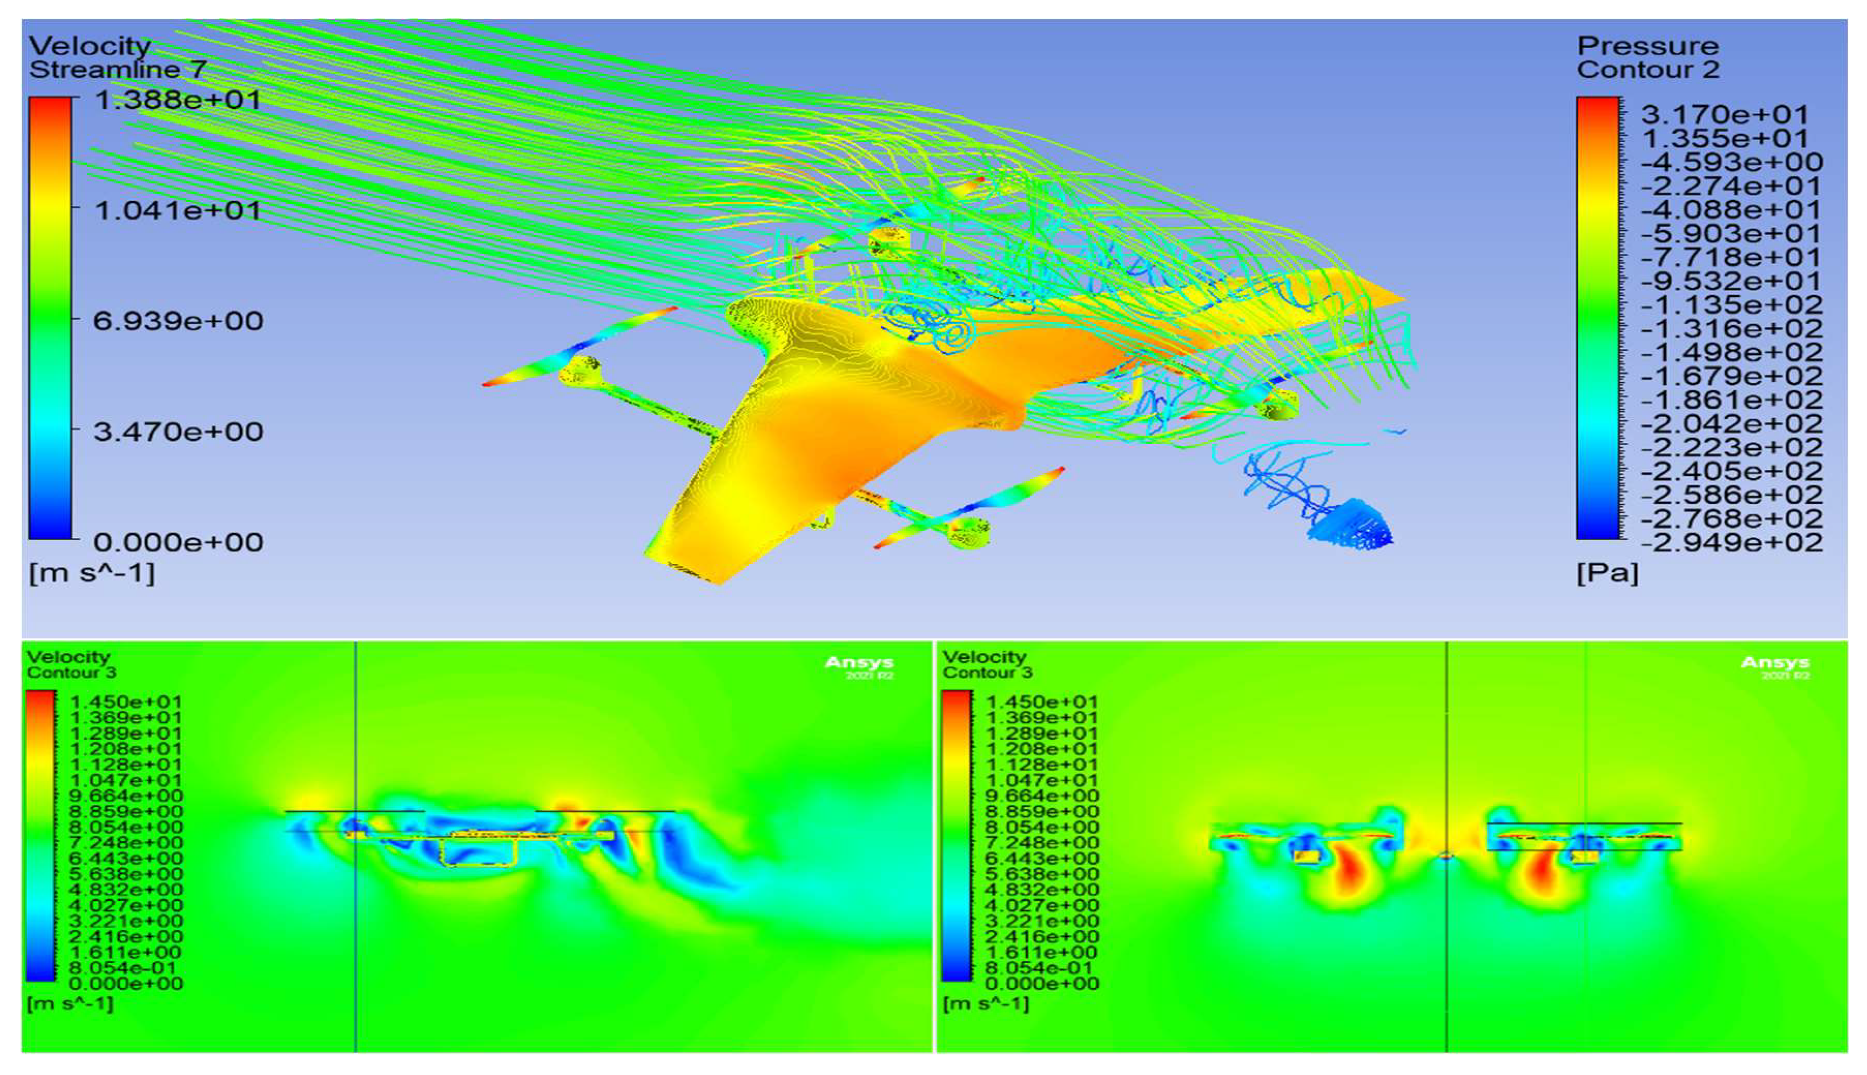
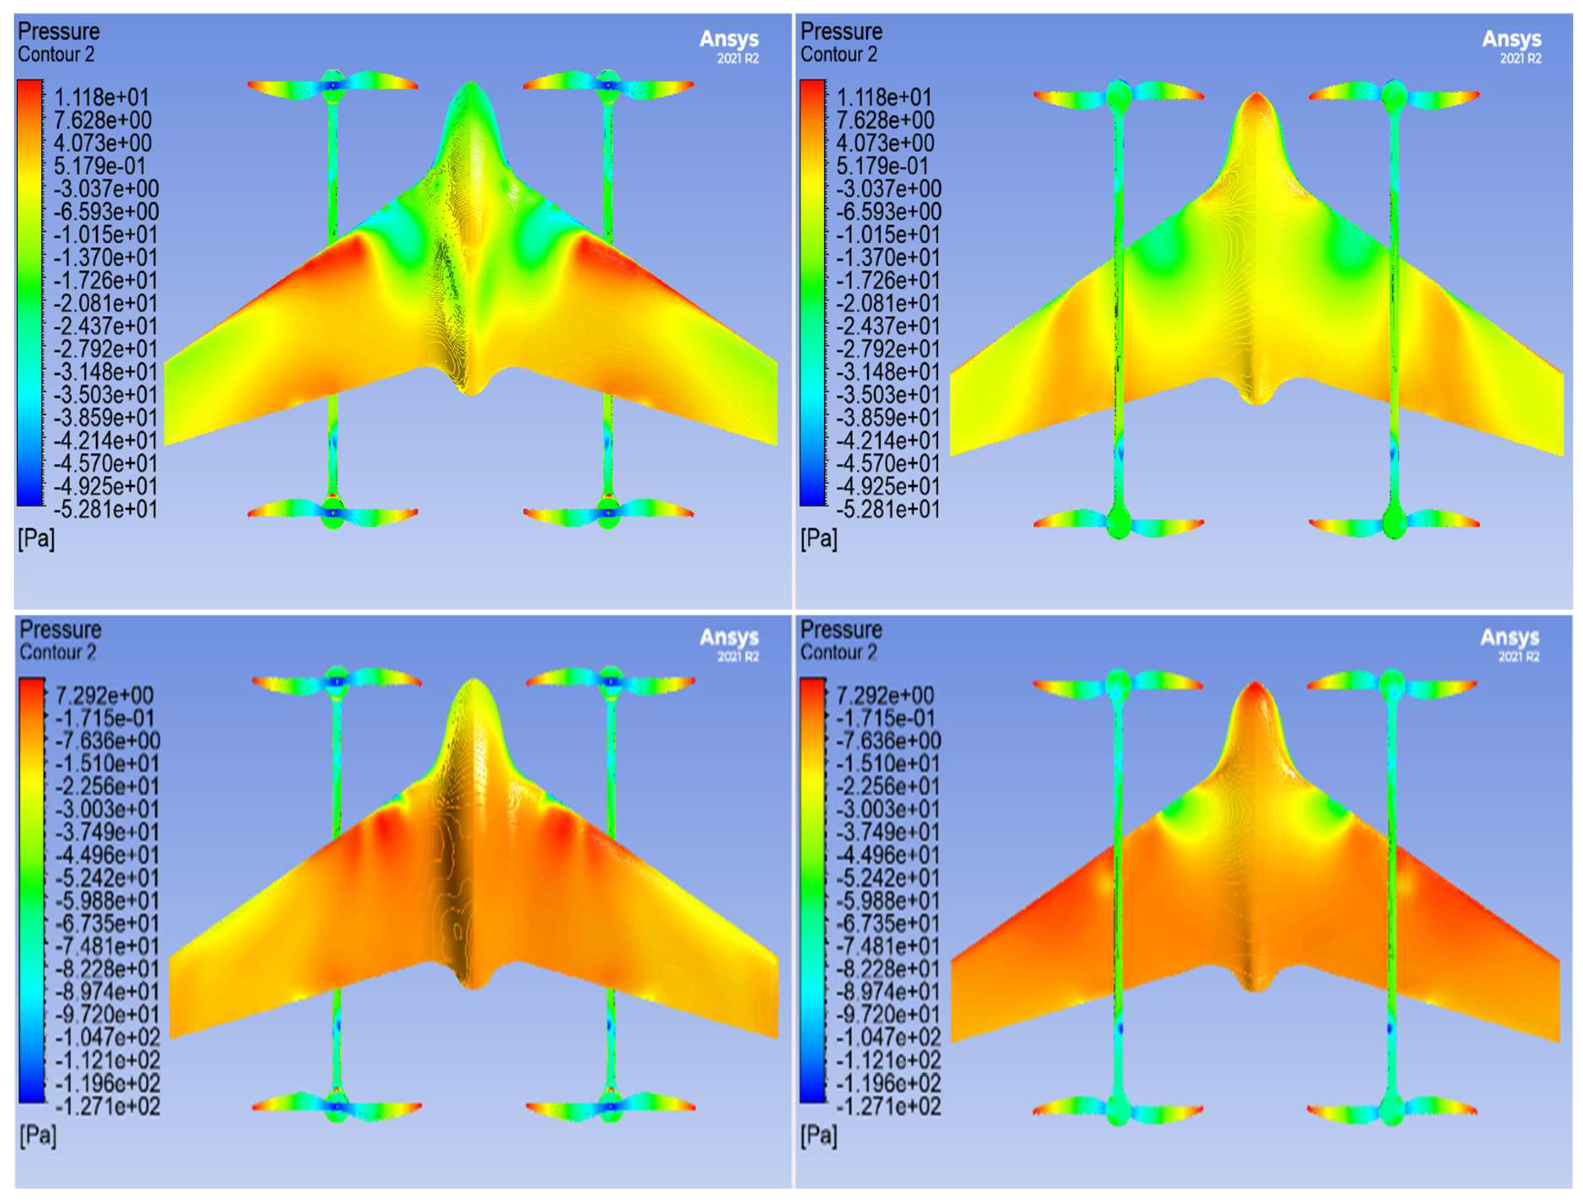
It can be concluded from this analysis that the rotational speed of the horizontal axis propellers has a great effect on the coefficient of lift and the aerodynamic performance of the flying wing. This effect depends on numerous parameters such as the propeller geometry and pitch angle, the direction of rotation, the number of propellers, the position of the propellers about the wings, incoming speed, and the angle of attack [10]. As shown in Figure 5-10 and Figure 5-11, the pressure contours on the wings are different for each case and the most significant visible effect is that there is a great change in the pressure distribution between the root and tip of the wings and the middle section due to the trails of the velocity streamlines flowing over and under the wing mid-section entering or exiting the rotation domain of the propellers.
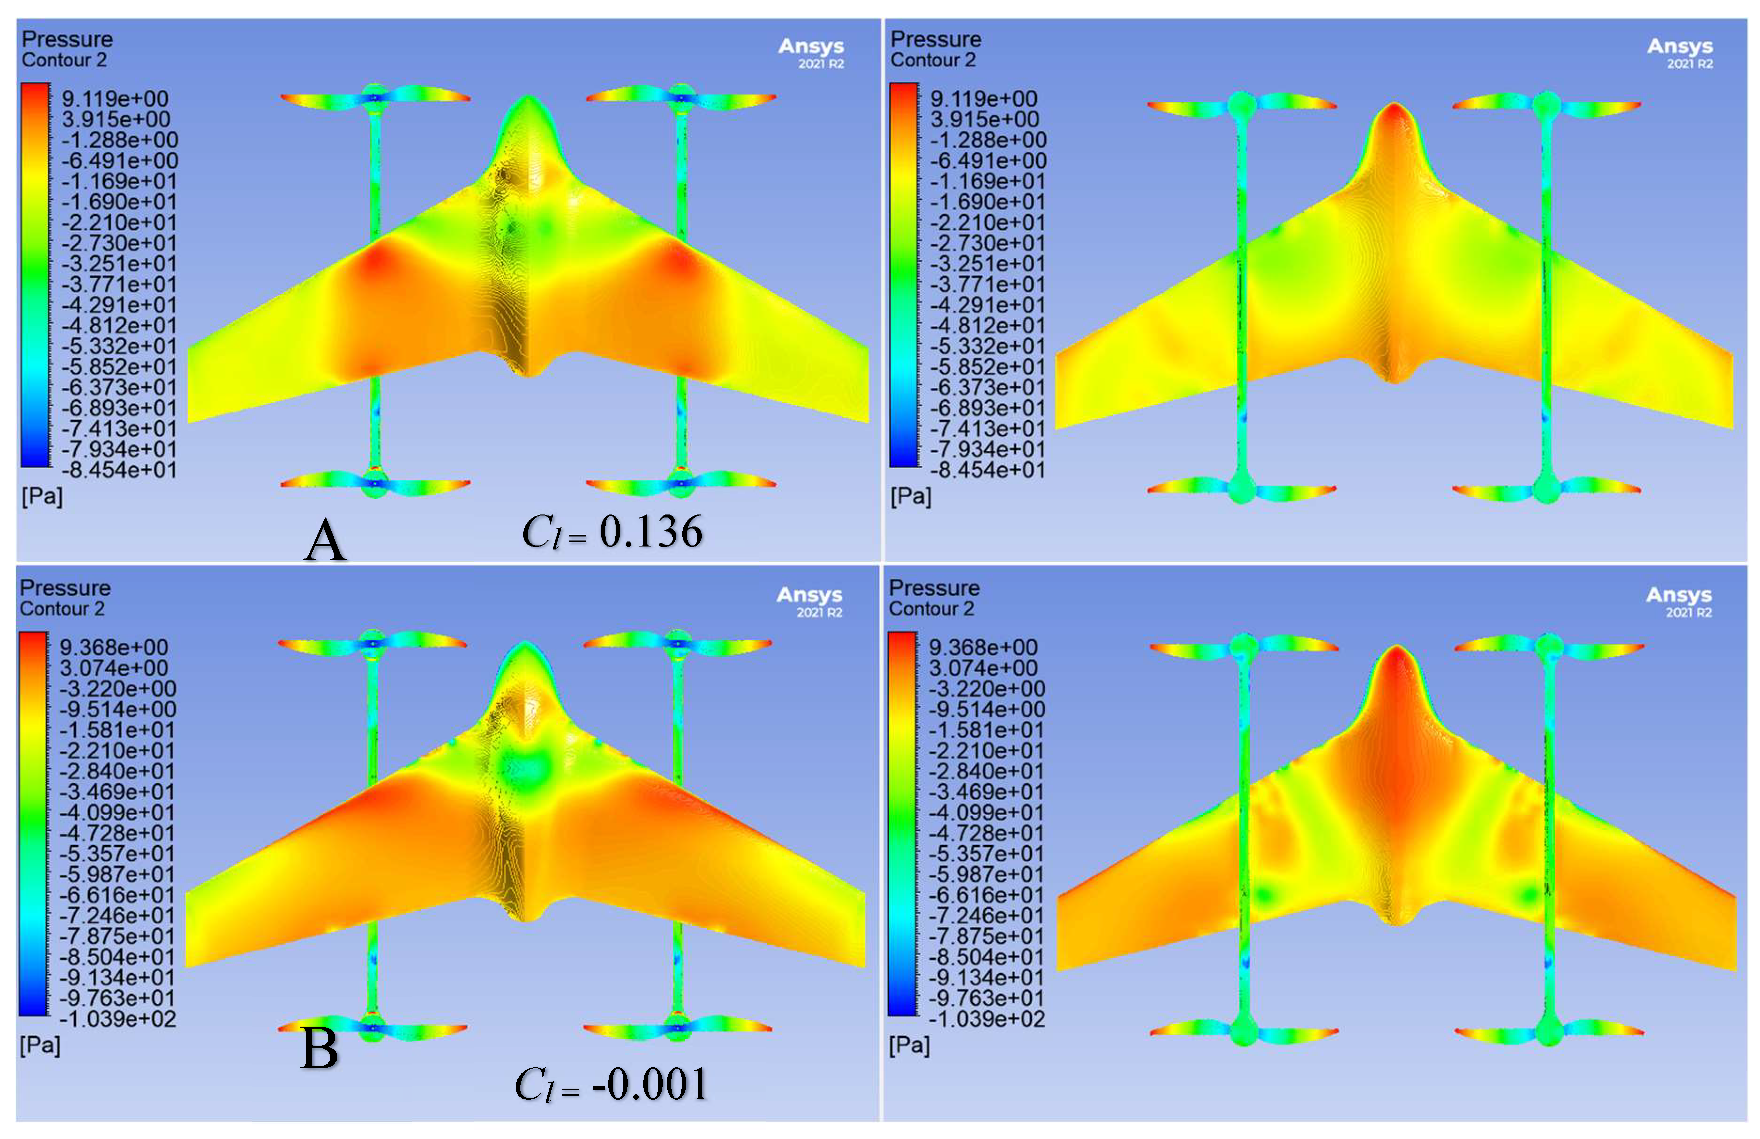
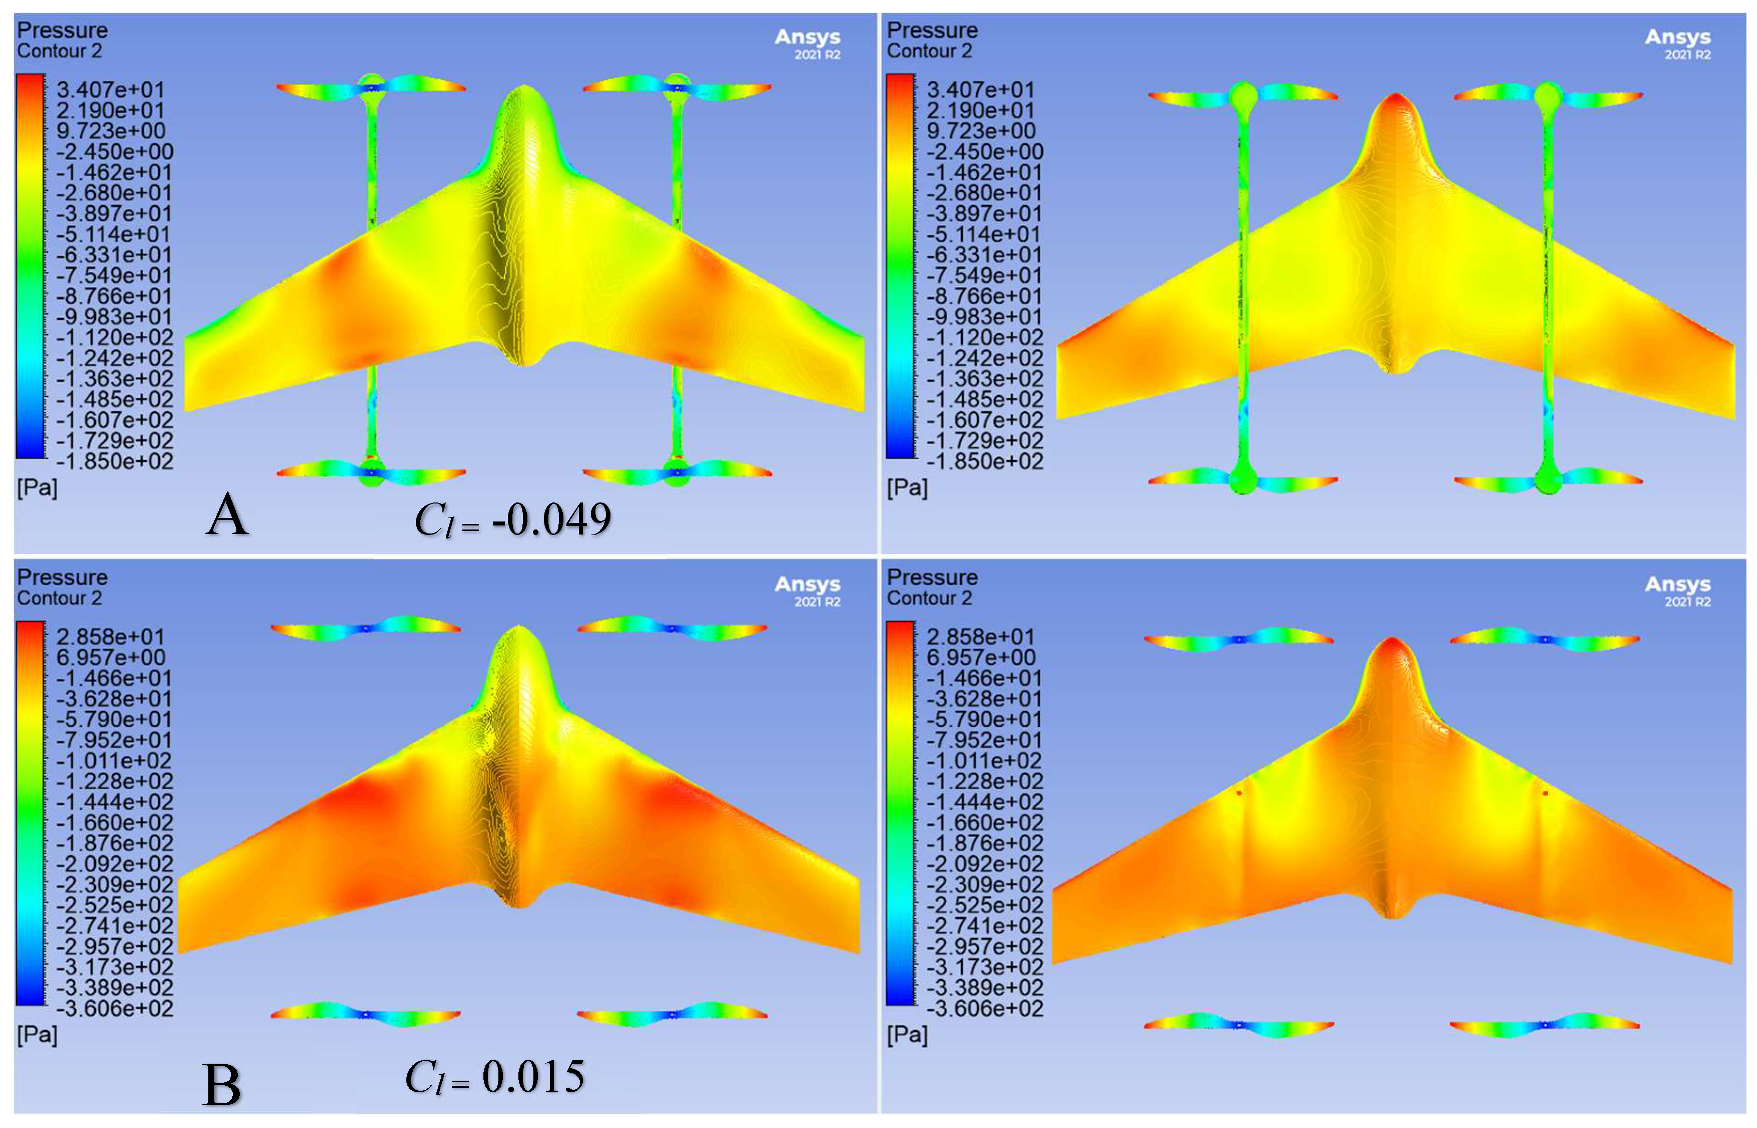
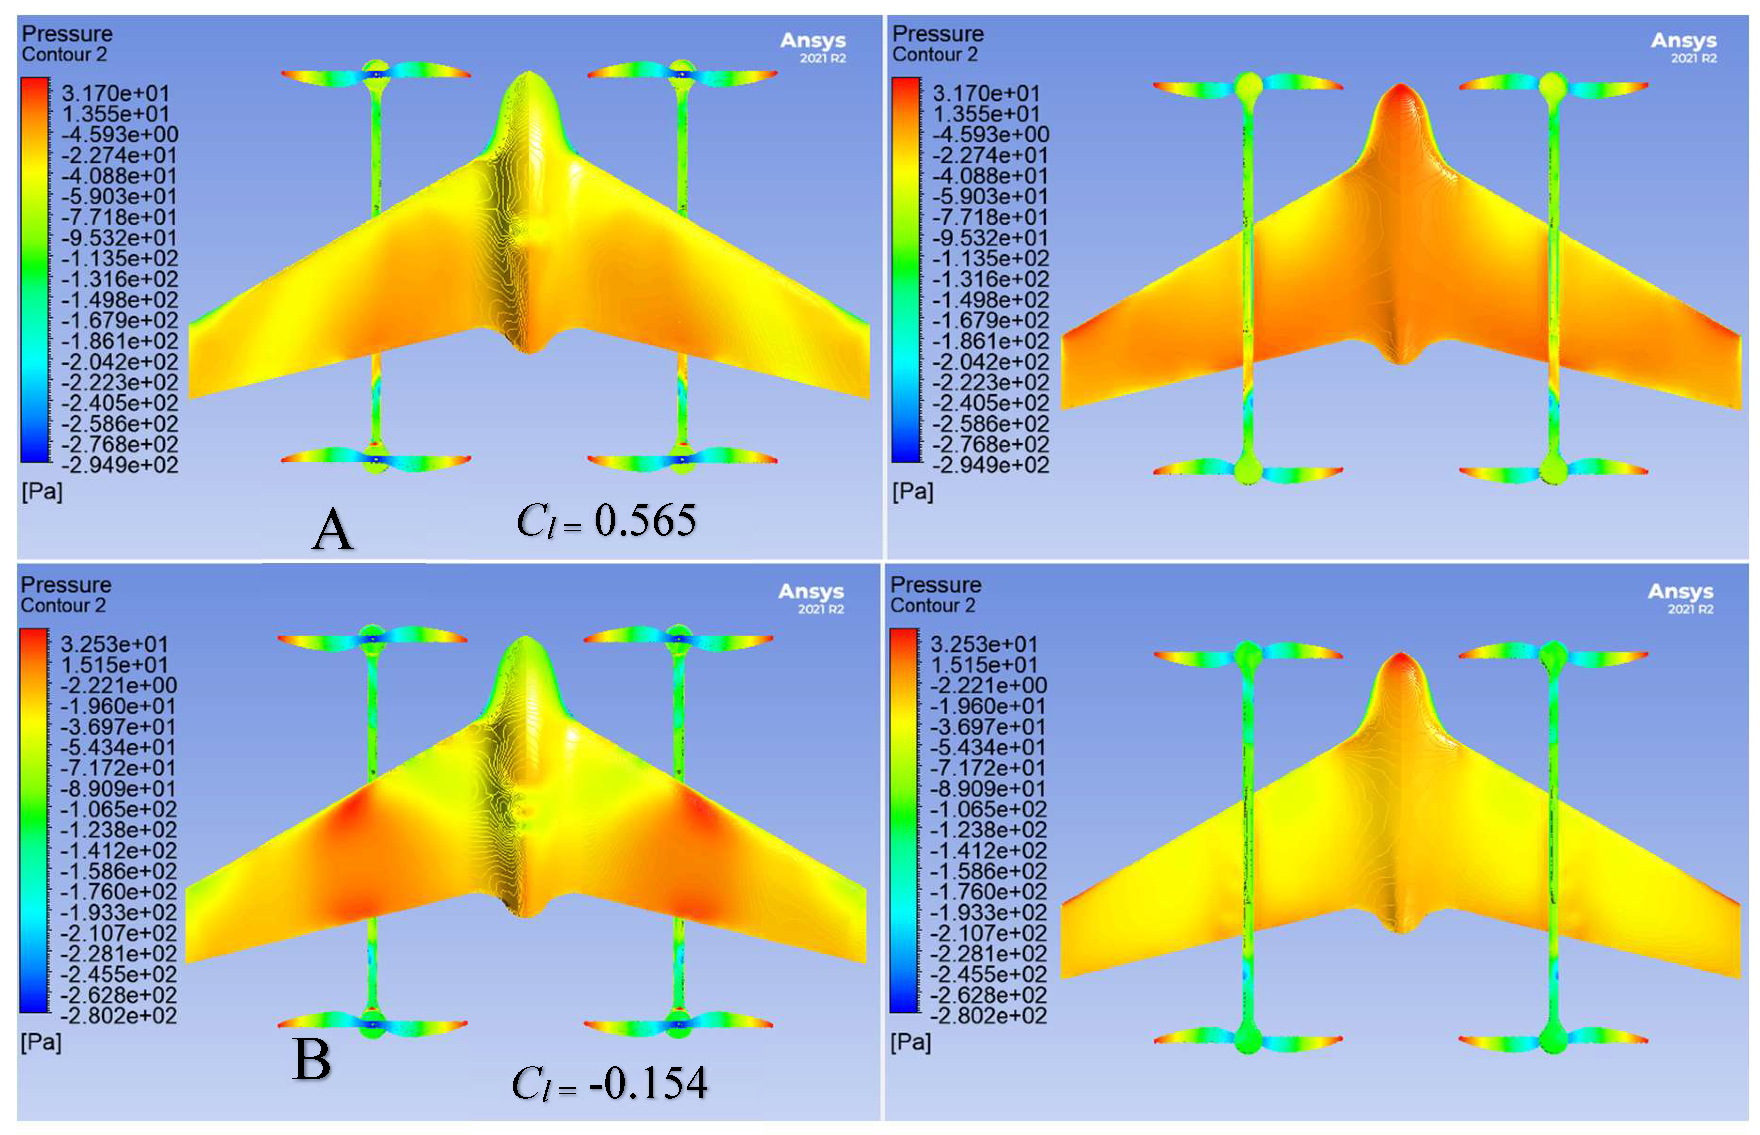
In Figure 5-9 and Figure 5-13, the overall pressure on the upper side of the body is greater than the overall pressure in Figure 5-10, and Figure 5-13, and therefore, the lift coefficient is found to be greater for the cases with lower overall pressure on the upper side of the model than the cases with high overall pressure. This is because for a wing to generate lift, the pressure on the lower wing surface needs to be greater than the upper surface, and since the propellers are rotating, the airflow on both surfaces of the wings is affected by the air turbulence generated from the rotation. The change of the incoming speeds and the attack angle irregularly changes these effects and therefore, numerous analyses need to be conducted to expand the data on the various testing parameters and to determine the optimum climbing configuration.
Figure 5-13, Figure 5-14, Figure 5-15, and Figure 5-16 show the pressure contours on the upper and lower parts of the flying wing model at different incoming air velocities, angle of attack, and rotating speeds of the horizontal axis propellers, and as illustrated, when the overall pressure along the upper wings increases, the lift coefficient decreases, and vice versa. The lift coefficient is significantly higher in case (A) than in (B) because in case (A), the lower part of the wings is at a higher pressure than the upper part compared to case (B) where the upper side of the wings is at a higher pressure than the lower part for the same incoming air velocity and angle of attack.

6. Conclusion

This project has illuminated the challenges associated with designing an aerodynamically efficient drone and has allowed for the practical application of theoretical aerodynamics in real-world scenarios. The objective centered on the study, simulation, analysis, and design of a surveillance drone capable of superior aerodynamic performance, with an operational capacity exceeding 45 minutes. Through various analyses, efforts were concentrated on evaluating and enhancing the lift and drag performance to optimize the model’s aerodynamics and endurance. Utilizing Computational Fluid Dynamics (CFD) and structural analysis, a lift-to-drag ratio surpassing previous models was pursued. Manufacturing and testing were conducted within a constrained budget, achieving notable aerodynamic benchmarks, including a maximum lift coefficient (Cl, max) of 0.746 and a minimum drag coefficient (Cd, min) of 0.039, with the maximum lift-to-drag ratio (Cl/Cd) peaking at 8.507. Further analysis revealed the aerodynamic effects of propeller-wing interaction, establishing optimal rotational velocities for horizontal axis propellers at different climb speeds and angles of attack. Structural integrity tests conducted on various components affirmed the model’s durability, leading to the commencement of manufacturing using PLA material for the structure and structural steel for the rods. The design and production phases were characterized by diligent study, iterative modifications, and adherence to the project timeline, contributing significantly to the academic pursuits in Aerospace at Abu Dhabi University and offering new avenues for Mechanical Engineering students in the aerospace sector. Moving forward, it is imperative to explore several avenues to refine the design and functionality of future drone models. Recommendations include the consideration of reducing the number of propellers and motors, potentially centralizing them to enhance VTOL capabilities while minimizing weight and aerodynamic drag. Such modifications could also contribute to reduced noise pollution. Alternatives to PLA material, such as Styrofoam, should be investigated for their potential to decrease the drone’s weight further, thus facilitating easier lift and maneuverability, despite the manufacturing challenges associated with Styrofoam. Finally, the development of an advanced drone control system is crucial for improving flight capabilities and the range of the camera, which, in turn, could bolster societal trust and widen the drone’s application spectrum.

Acknowledgement

This research was made possible through the support and facilities provided by the College of Engineering (CoE) and the extensive research support from Abu Dhabi University (ADU). The resources and state-of-the-art facilities offered by the CoE, coupled with ADU’s commitment to fostering innovation, have been instrumental in the advancements achieved in this study.

References

  1. Z. ALMHEIRI, R. ALEID and S. SHAM DOL, “Design of Fixed-Wing and Multi-Copter Hybrid Drone System for Human Body Temperature Measurement during COVID-19 Pandemic,” WSEAS TRANSACTIONS on SYSTEMS , vol. 20, no. 1, pp. 31-39, 2021.
  2. V. E, R. A and S. P. , “Design of Hybrid UAV With Multi Rotor Propulsion System,” in International Conference on Advanced Computing and Communication Systems (ICACCS), 2023. [CrossRef]
  3. A. Agarwal, C. Mohanta and S. N. Mehta, “Drone Technologies,” in Drone Technologies, WILEY , 2023, pp. 1-19.
  4. P. He, H. Koyuncuoglu, A. Dhulipalla, H. X. S. Hu and H. Hu, “High-fidelity aerodynamic and aerostructural optimization of UAV propellers using the adjoint method,” in AIAA SCITECH 2023 Forum, 2023. [CrossRef]
  5. A. Q. Abdullah and S. Sham Dol, “Aerodynamic investigation and design of dimpled-surface airfoil for UAV propellers.,” in Advances in Science and Engineering Technology International Conferences (ASET), 2020. [CrossRef]
  6. S. S. Pervaiz, A. Abdullah and S. Sham Bin Dol, “Simulation Study of a Solar Glider Design,” in International Conference on Decision Aid Sciences and Application (DASA), 2020. [CrossRef]
  7. T. V. Milligan, “Theory and Practice of,” Apogee Components, 2000.
  8. M. M. Yassir ABBAS, “Implementation of the panel method to the solution of flow,” INCAS BULLETIN,, Bucharest, Romania, 2015.
  9. “K-Omega and K-Omega SST,” 25 5 2021. [Online]. Available: https://www.simscale.com/docs/simulation-setup/global-settings/k-omega-sst/. [Accessed 8 11 2022].
  10. Pooneh Aref, Mehdi Ghoreyshi, Adam Jirasek, Matthew J. Satchell, Keith Bergeron, “Computational Study of Propeller–Wing,” High Performance Computing Research Center, U.S. Air Force Academy, 2018.
  11. “A Brief History of Drones,” [Online]. Available: https://www.iwm.org.uk/history/a-brief-history-of-drones.
  12. “Gliders - History of Gliders,” [Online]. Available: https://www.softschools.com/inventions/history/gliders_history/203/.
  13. “Performance - 6. Airfoils and Wings,” [Online]. Available: https://archive.aoe.vt.edu/lutze/AOE3104/airfoilwings.pdf. [Accessed 15 November 2022].
  14. B. Wainfan, “Tail Surfaces and Aerodynamic Effects,” 10 January 2011. [Online]. Available: Tail Surfaces and Aerodynamic Effects.
  15. Zev Vallance, Adam Nelessen, Jacob Vincent, Aaron Lostutter, Brandon Perez, “Configuration Selection and Decision Making,” Flagstaff, 2012.
  16. M. S. Arnedo, “Empennage,” 10 January 2022. [Online]. Available: https://eng.libretexts.org/Bookshelves/Aerospace_Engineering/Fundamentals_of_Aerospace_Engineering_(Arnedo)/02%3A_Generalities/2.02%3A_Parts_of_the_aircraft/2.2.03%3A_Empennage.
  17. S. SINGH, “What Are The Different Kinds Of Winglets?,” 19 September 2020. [Online]. Available: https://simpleflying.com/winglets-types/.
  18. İbrahim Halil Güzelbey, Yüksel Eraslan, Mehmet Hanifi Doğru, “Effects of Taper Ratio on Aircraft Wing Aerodynamic Parameters:,” International Mediterranean Science and Engineering Congress, Adana / TURKEY, 2018. [CrossRef]
  19. M. Hepperle, “Basic Design of Flying Wing Models,” 21 5 2018. [Online]. Available: https://mh-aerotools.de/airfoils/flywing1.htm. [Accessed 4 11 2022].
  20. M. Sadraey, “ Wing Design,” in Aircraft Design: A Systems Engineering Approach, John Wiley & Sons, 2012, pp. 161-264.
  21. wordpress, “IFO,” 2022. [Online]. Available: https://blogs.ntu.edu.sg/ps9888-2020-g14/working-principle/.
  22. l. bonk, 27 6 2022. [Online]. Available: https://www.gadgetreview.com/how-are-drones-made.
  23. “basic concepts,” 15 8 2022. [Online]. Available: https://docs.px4.io/main/en/getting_started/px4_basic_concepts.html.
  24. “Propeller Thrust Equation,” 29 7 2022. [Online]. Available: https://www1.grc.nasa.gov/beginners-guide-to-aeronautics/thrust-equation/. [Accessed 18 11 2022].
  25. J. Brian, “Planes with Canards: Advantages and Drawbacks,” 08 Septemper 2022. [Online]. Available: https://www.aeroclass.org/planes-with-canards-advantages-and-drawbacks/.
  26. M. Curry, “Winglets,” 3 March 2008. [Online]. Available: https://www.nasa.gov/centers/dryden/about/Organizations/Technology/Facts/TF-2004-15-DFRC.html.
  27. M. FINLAY, “How Split Scimitar Wing Tips Increase Fuel Efficiency,” 5 October 2019. [Online]. Available: https://simpleflying.com/split-scimitar-winglets/.
  28. “Carbon Fibre Props VS Plastic Propeller,” 25 June 2014. [Online]. Available: https://oscarliang.com/carbon-fibre-props-plastic-propeller/.
  29. B. Custers, “Drones Here, There and Everywhere Introduction and Overview,” 16 October 2016. [Online]. Available: https://link.springer.com/chapter/10.1007/978-94-6265-132-6_1. [CrossRef]
  30. J. Villasenor, “Observations from above: Unmanned Aircraft Systems and Privacy,” 3 December 2013. [Online]. Available: https://heinonline.org/HOL/LandingPage?handle=hein.journals/hjlpp36&div=27&id=&page=.
  31. 31. J. C. Mohanta, A. Keshari and P. S. Yadav, “Recent Advances in Unmanned Aerial Vehicles: A Review,” 25 April 2022. [Online]. Available: https://link.springer.com/epdf/10.1007/s13369-022-06738-0?sharing_token=A8_nsczVxuSh8wZfpbTcjPe4RwlQNchNByi7wbcMAY4EFA2kz9S_rI7J628igsk_h89THnzHHzie3vL-1Qh1bCfnWpLx8W60TQXCvooF6_qNH5zW2Iws2ahH2ZgkSOcabBwL5vHqykKZInQWvzRxxU19wYedsg-01i7HZF0oFwo=.
  32. J. Rennie, “DRONE TYPES: MULTI-ROTOR VS FIXED-WING VS SINGLE ROTOR VS HYBRID VTOL,” AUAV, 8 November 2016. [Online]. Available: https://www.auav.com.au/articles/drone-types/. [Accessed 2022].
  33. J. R. Cherukuri and A. , “Quadcopter,” Devopedia, March 2022. [Online]. Available: https://devopedia.org/quadcopter.
  34. A. Khalid, “MIT is testing drones that can switch between hovering and gliding,” engadgey, 16 July 2019. [Online]. Available: https://www.engadget.com/2019-07-16-mit-is-testing-drones-that-can-switch-between-hovering-and-glid.html.
  35. “Aerodynamic shape optimization,” MDO lab, 2010. [Online]. Available: https://mdolab.engin.umich.edu/wiki/aerodynamic-shape-optimization.html.
  36. S. F. STAFF, “Why Boeing Has Winglets And Airbus Has Sharklets,” Simple Flying, 31 July 2022. [Online]. Available: https://simpleflying.com/boeing-winglets-airbus-sharklets/.
  37. N. V. Nguyen, M. Tyan, J.-W. Lee and S.-H. Kim, “Investigations on stability and control characteristics of a CS-VLA certified aircraft using wind tunnel test data,” Rese, February 2016. [Online]. Available: https://www.researchgate.net/publication/295875067_Investigations_on_stability_and_control_characteristics_of_a_CS-VLA_certified_aircraft_using_wind_tunnel_test_data.
  38. E. Kaygan and C. Ulusoy, “Effectiveness of Twist Morphing Wing on Aerodynamic Performance and Control of an Aircraft,” December 2018. [Online]. Available: https://www.researchgate.net/figure/Effects-of-changing-wing-twist-angle-a-Lift-Coefficient-i-i-i-i-and-b-Drag_fig2_329880861.
  39. N. Hall, “Shape Effects on Drag,” Glenn research center, 28 July 2022. [Online]. Available: https://www1.grc.nasa.gov/beginners-guide-to-aeronautics/shape-effects-on-drag/.
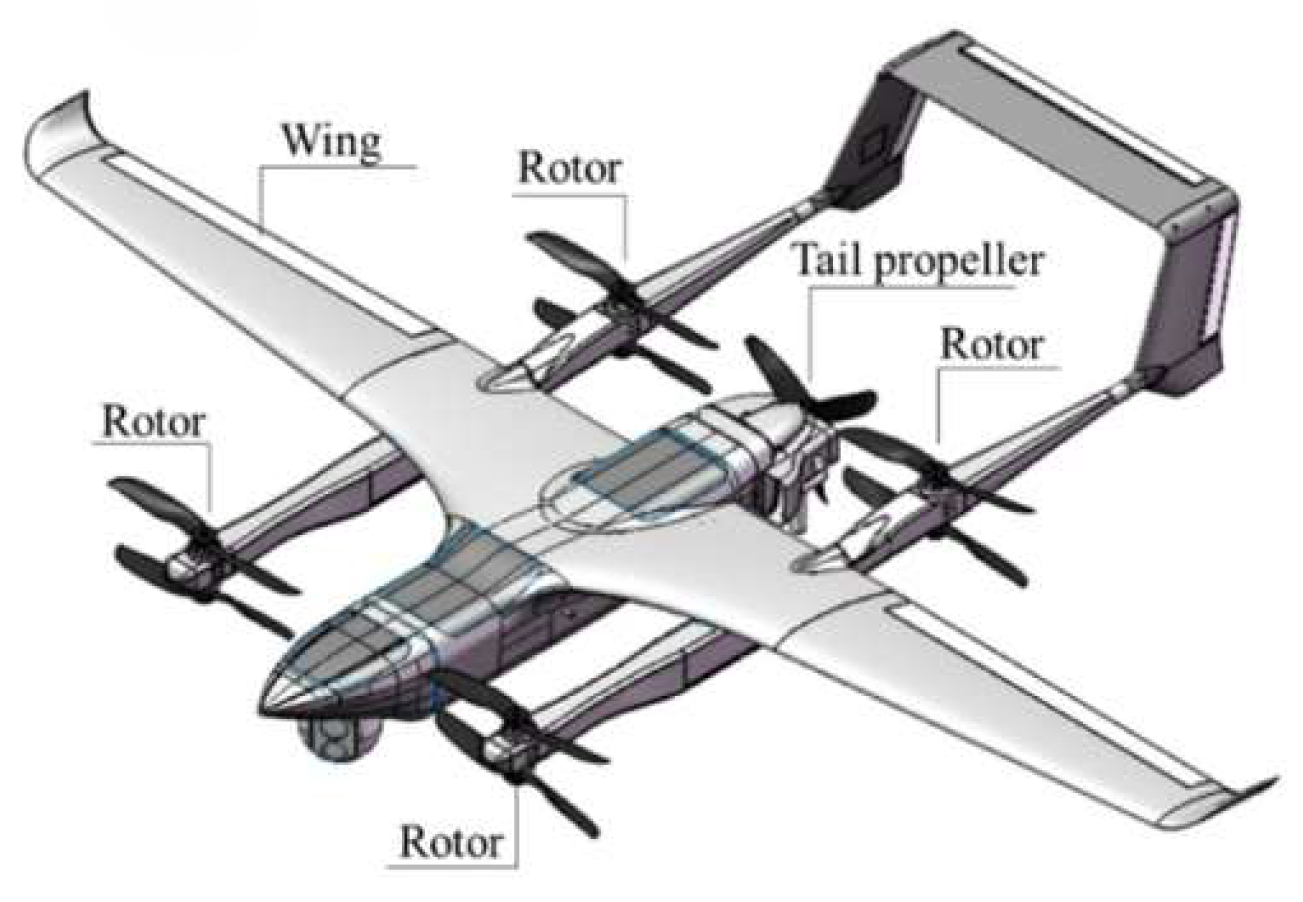
Figure 1-1. Hybrid UAV Components.
Preprints 117104 g001 1
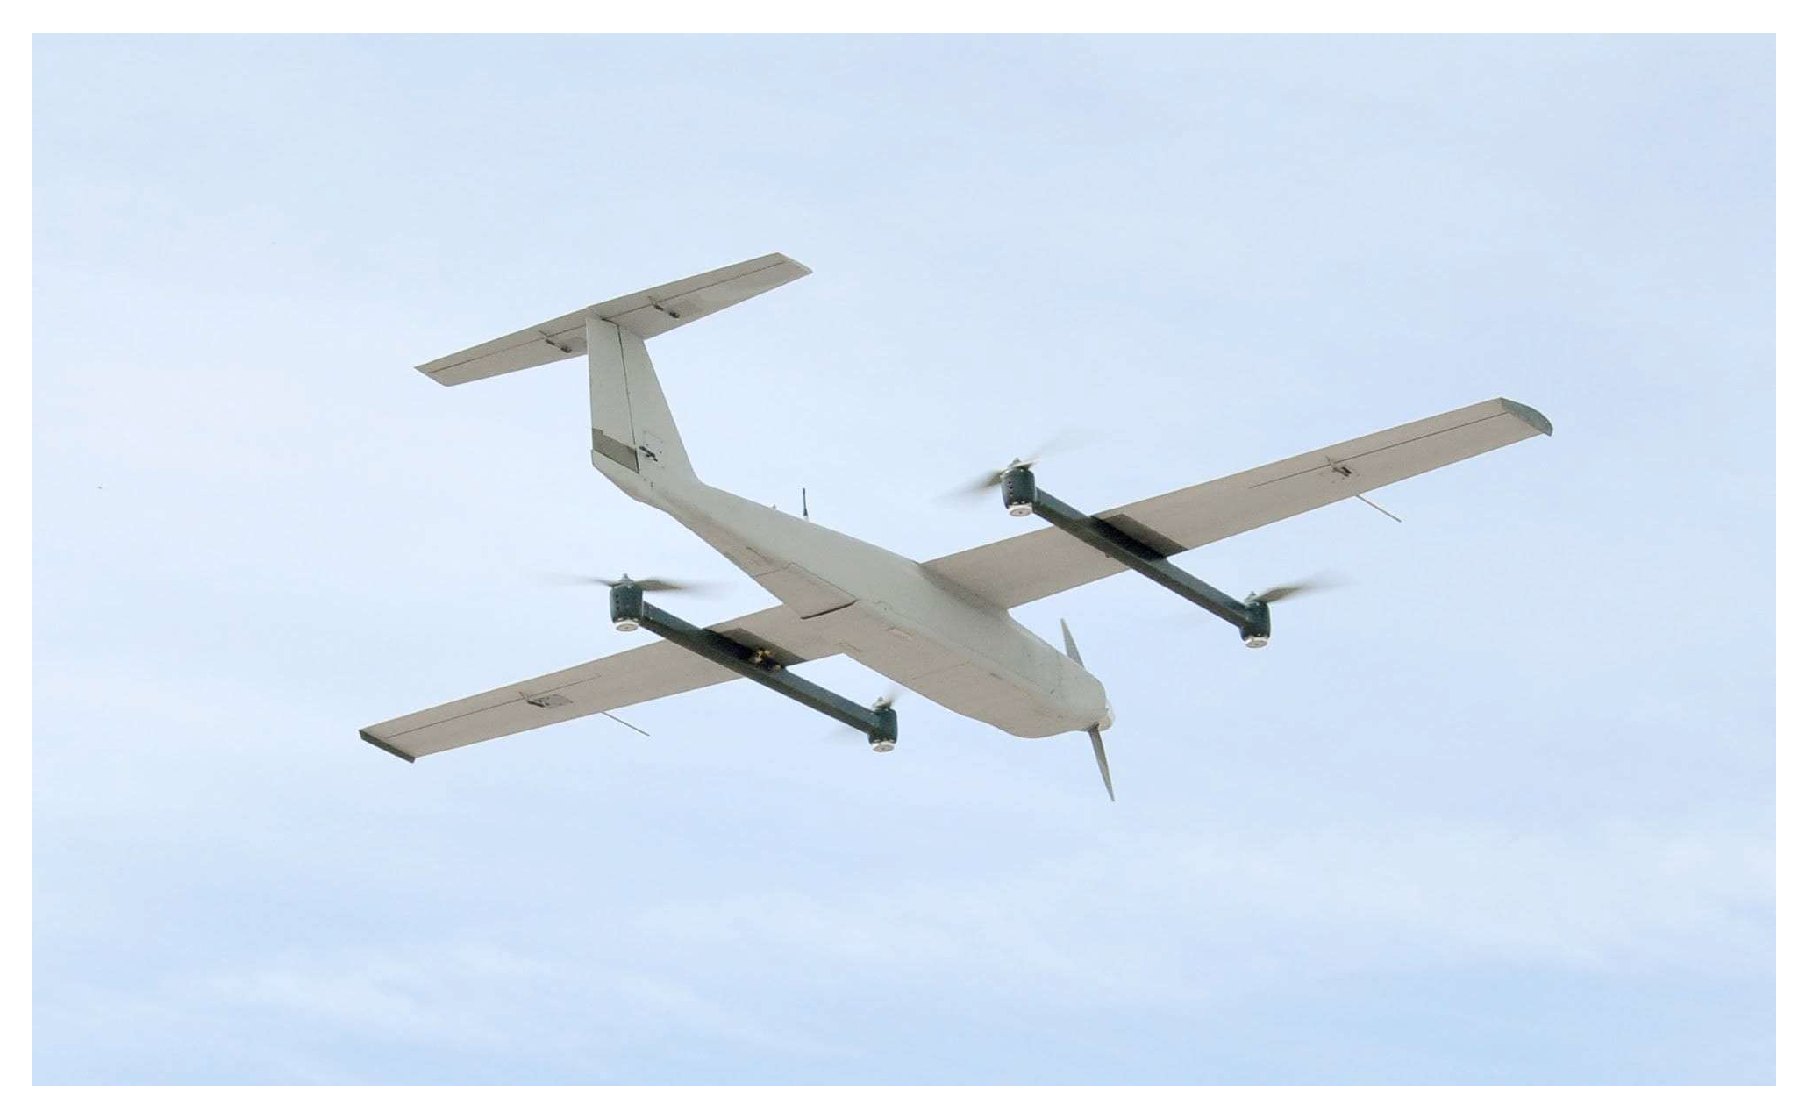
Figure 1-2. Real Hybrid Drone.
Preprints 117104 g001 2
Figure 2-1. Flying wing parameters.
Preprints 117104 g002 1
Figure 2-2. (A) wings and ailerons sketch dimensions. (B) flying wing CAD sketch. (C) flying wing top view.
Preprints 117104 g002 2
Figure 3-1. Isometric view of the geometric setup for the wind tunnel CFD.
Preprints 117104 g003 1
Figure 3-2. generated mesh.
Preprints 117104 g003 2
Figure 3-3. CL vs AoA Graph of the flying wing model and the previous model.
Preprints 117104 g003 3
Figure 3-4. Cd vs AoA Graph of the flying wing and the previous model.
Preprints 117104 g003 4
Figure 3-5. CL/Cd vs AoA Graph of the flying wing and the previous model.
Preprints 117104 g003 5
Figure 3-6. moment coefficient (Cm) of the flying wing.
Preprints 117104 g003 6
Figure 3-7. velocity streamlines at v=8m/s and α= 0° (A), and α= 4° (B). v=8m/s and α= 8° (C), α= 12° (D), and α= 16° (E).
Preprints 117104 g003 7
Figure 4-1. NACA0006 airfoil.
Preprints 117104 g004 1
Figure 4-2. winglet Sweep and Cant angles definition.
Preprints 117104 g004 2
Figure 4-3. CL/CD vs AoA Graph for winglets with cant angle of 90° and sweepback angles of 0° and 45° at 8m/s.
Preprints 117104 g004 3
Figure 4-4. CL/CD vs AoA Graph for winglets with cant angle of 90° and sweepback angles of 0° and 45° at 15m/s.
Preprints 117104 g004 4
Figure 4-5. CL/CD vs AoA Graph for cant angle of 90° and sweepback angles of 0° and 45° at 22m/s.
Preprints 117104 g004 5
Figure 4-6. CL/CD vs AoA Graph for winglets with cant angle of 45° and sweepback angles of 0° and 45° at 15m/s.
Preprints 117104 g004 6
Figure 5-1. Propellers CFD analysis geometric setup.
Preprints 117104 g005 1
Figure 5-2. Propellers CFD analysis meshing and named selections.
Preprints 117104 g005 2
Figure 5-3. analysis 1 results (lift vs RPM).
Preprints 117104 g005 3
Figure 5-4. velocity vectors (A), velocity streamlines (B), and velocity contours right view (C), and front view (D) of the air accelerated by the propellers at 5000 RPM.
Preprints 117104 g005 4
Figure 5-5. velocity vectors (A), velocity streamlines (B), and velocity contours right view (C), and front view (D) of the air accelerated by the propellers at 7500 RPM.
Preprints 117104 g005 5
Figure 5-6. velocity vectors (A), velocity streamlines (B), and velocity contours right view (C), and front view (D) of the air accelerated by the propellers at 10,000 RPM.
Preprints 117104 g005 6
Figure 5-7. Cl of the flying wing vs AoA at propeller angular velocity of 5000 RPM, and 7500 RPM and v = 4 m/s.
Preprints 117104 g005 7
Figure 5-8. (A) velocity streamlines of air entering the rotation zone of the propellers, pressure contours of the body, and velocity contours of air accelerated by the propellers right(B) and front(C) views @ v= 4 m/s, α = 4°, and 5000 RPM.
Preprints 117104 g005 8
Figure 5-9. Cl of the flying wing vs AoA at propeller angular velocity of 5000 RPM, and 7500 RPM and v = 8 m/s.
Preprints 117104 g005 9
Figure 5-10. (A) velocity streamlines of air entering the rotation zone of the propellers, pressure contours of the body, and velocity contours of air accelerated by the propellers (B) right and (C) front views @ v= 4 m/s, α = 4°, and 7500 RPM.
Preprints 117104 g005 10
Figure 5-11. (A) velocity streamlines of air entering the rotation zone of the propellers and pressure contours of the body, and velocity contours of air accelerated by the propellers (B) right and (C) front views @ v= 8 m/s, α = 8°, and 5000 RPM.
Preprints 117104 g005 11
Figure 5-12. velocity streamlines of air entering the rotation zone of the propellers and pressure contours of the body top (A) and bottom (B) views, and velocity contours of air accelerated by the propellers right and (C) front views @ v= 8 m/s, α = 8°, and 7500 RPM.
Preprints 117104 g005 12
Figure 5-13. Pressure contours of the body @ v= 4m/s, α=0°, and propeller angular velocity of 5000 RPM (A), and 7500RPM (B) top and bottom views.
Preprints 117104 g005 13
Figure 5-14. Pressure contours of the body @ v= 8 m/s, α=4°, and propeller angular velocity of 5000 RPM (A), and 7500RPM (B) top and bottom views.
Preprints 117104 g005 14
Figure 5-15. Pressure contours of the body @ v= 4m/s, α=8°, and propeller angular velocity of 5000 RPM (A), and 7500 RPM (B) top and bottom views.
Preprints 117104 g005 15
Figure 5-16. Pressure contours of the body @ v= 8m/s, α=8°, and propeller angular velocity of 5000 RPM (A), and 7500RPM (B) top and bottom views.
Preprints 117104 g005 16
Table 2-1. wings and ailerons Table dimensions Table.
Parameter Value
Wing dimensions
Wingspan (b) 1360 mm
Root chord (CR) 389 mm
Tip chord (CT) 155 mm
Wing area (A) 0.368 m2
Mean aerodynamic chord (MAC) 289 mm
Ailerons dimensions
span 405 mm
Root chord 64 mm
Tip chord 44 mm
Table 3-1. Wind tunnel CFD testing parameters.
Parameter Value
Angle of Attack (α) 0, 4, 8, 12, 16
Wind tunnel velocity (v) 8 m/s
Table 4-1. testing parameters for winglet selection.
Parameter Variation
Cant angle (degrees) 90, 45
Sweepback angle (degrees) 0, 45
Angle of attack (degrees) 0, 5, 10, 15
Velocity (m/s) 8, 15, 22
Table 5-1. propellers CFD analysis 2 testing parameters.
Parameters Variation
Angle of attack (α) (degrees) 0, 4, 8
Velocity (v) (m/s) 4, 8
Revolutions per minute (RPM) 5000, 7500
Disclaimer/Publisher’s Note: The statements, opinions and data contained in all publications are solely those of the individual author(s) and contributor(s) and not of MDPI and/or the editor(s). MDPI and/or the editor(s) disclaim responsibility for any injury to people or property resulting from any ideas, methods, instructions or products referred to in the content.
Copyright: This open access article is published under a Creative Commons CC BY 4.0 license, which permit the free download, distribution, and reuse, provided that the author and preprint are cited in any reuse.
Prerpints.org logo

Preprints.org is a free preprint server supported by MDPI in Basel, Switzerland.

Subscribe

© 2024 MDPI (Basel, Switzerland) unless otherwise stated