2. Material and Methods
Microorganisms, cultivation environment, and conditions. A laboratory intervention experiment was conducted at the Faculty of Chemical Engineering, Ho Chi Minh City University of Technology (HCMUT), Vietnam National University-Ho Chi Minh City (VNU-HCMC). The microbial strain under investigation was the Candida albicans strain (ATCC 24433) purchased from KwikStik Co., Ltd, Vietnam. They were activated and cultured in a self-prepared liquid Hansen medium (comprising 50 g H2SO4, 3 g KH2PO4, 3 g MgSO4.7H2O, 10 g peptone, 20 g agar, 1000 mL distilled water, adjusted to pH 6), at room temperature, aerobic conditions, and shaken at 150 rpm for 24 hours.
Recent studies support the cultivation conditions used in this experiment. For example, the research on the Formulation And Evaluation Of Antifungal Dermal Stick confirms the effective cultivation of
Candida albicans ATCC 24433 under similar conditions [
12]. Another study, Detection of Secondary Metabolites, Proximate Composition (2024), provides insights into the growth parameters of
Candida albicans ATCC 24433 and highlights the importance of precise pH and temperature control [
13]. Additionally, the Bio-inspired crosslinking and matrix-drug interactions study underscores the necessity of maintaining consistent aerobic conditions and shaking for optimal microbial growth [
14].
These references validate the cultivation environment and conditions used in this study, ensuring the reliability and reproducibility of the experimental results.
Bioactive compounds. This study utilized pure tea tree oil (Melaleuca alternifolia) obtained from Thuy Moc Viet Co., Ltd, Vietnam. The chemical components of the tea tree oil were analyzed by the Institute of Materials Science - Vietnam Academy of Science and Technology. Additionally, the antifungal agent Amphotericin B (AMB) was purchased from Maxxcare VP Co., Ltd, India, and used as a positive control in antifungal activity assays and biofilm inhibition studies against Candida albicans.
Due to the hydrophobic nature of tea tree oil (TTO), it was emulsified with sterile distilled water containing 0.5% Tween 80 before being mixed into the culture medium, following the method described by Van Nguyen, H.,
et al (2017) [
15]. However, some adjustments were made to ensure compatibility with experimental conditions, with final concentrations achieved after dilution being 0.1 μL, 1 μL, 2 μL, 5 μL, 10 μL/mL. The entire experiment was conducted at these five concentration thresholds. The AMB antifungal agent used as a positive control was also dissolved in sterile distilled water containing 0.5% Tween 80 and volumes were calculated to achieve final concentrations of 0.1 μg, 1 μg, 2 μg, 5 μg, 10 μg/mL. The overall experimental sequence is illustrated in
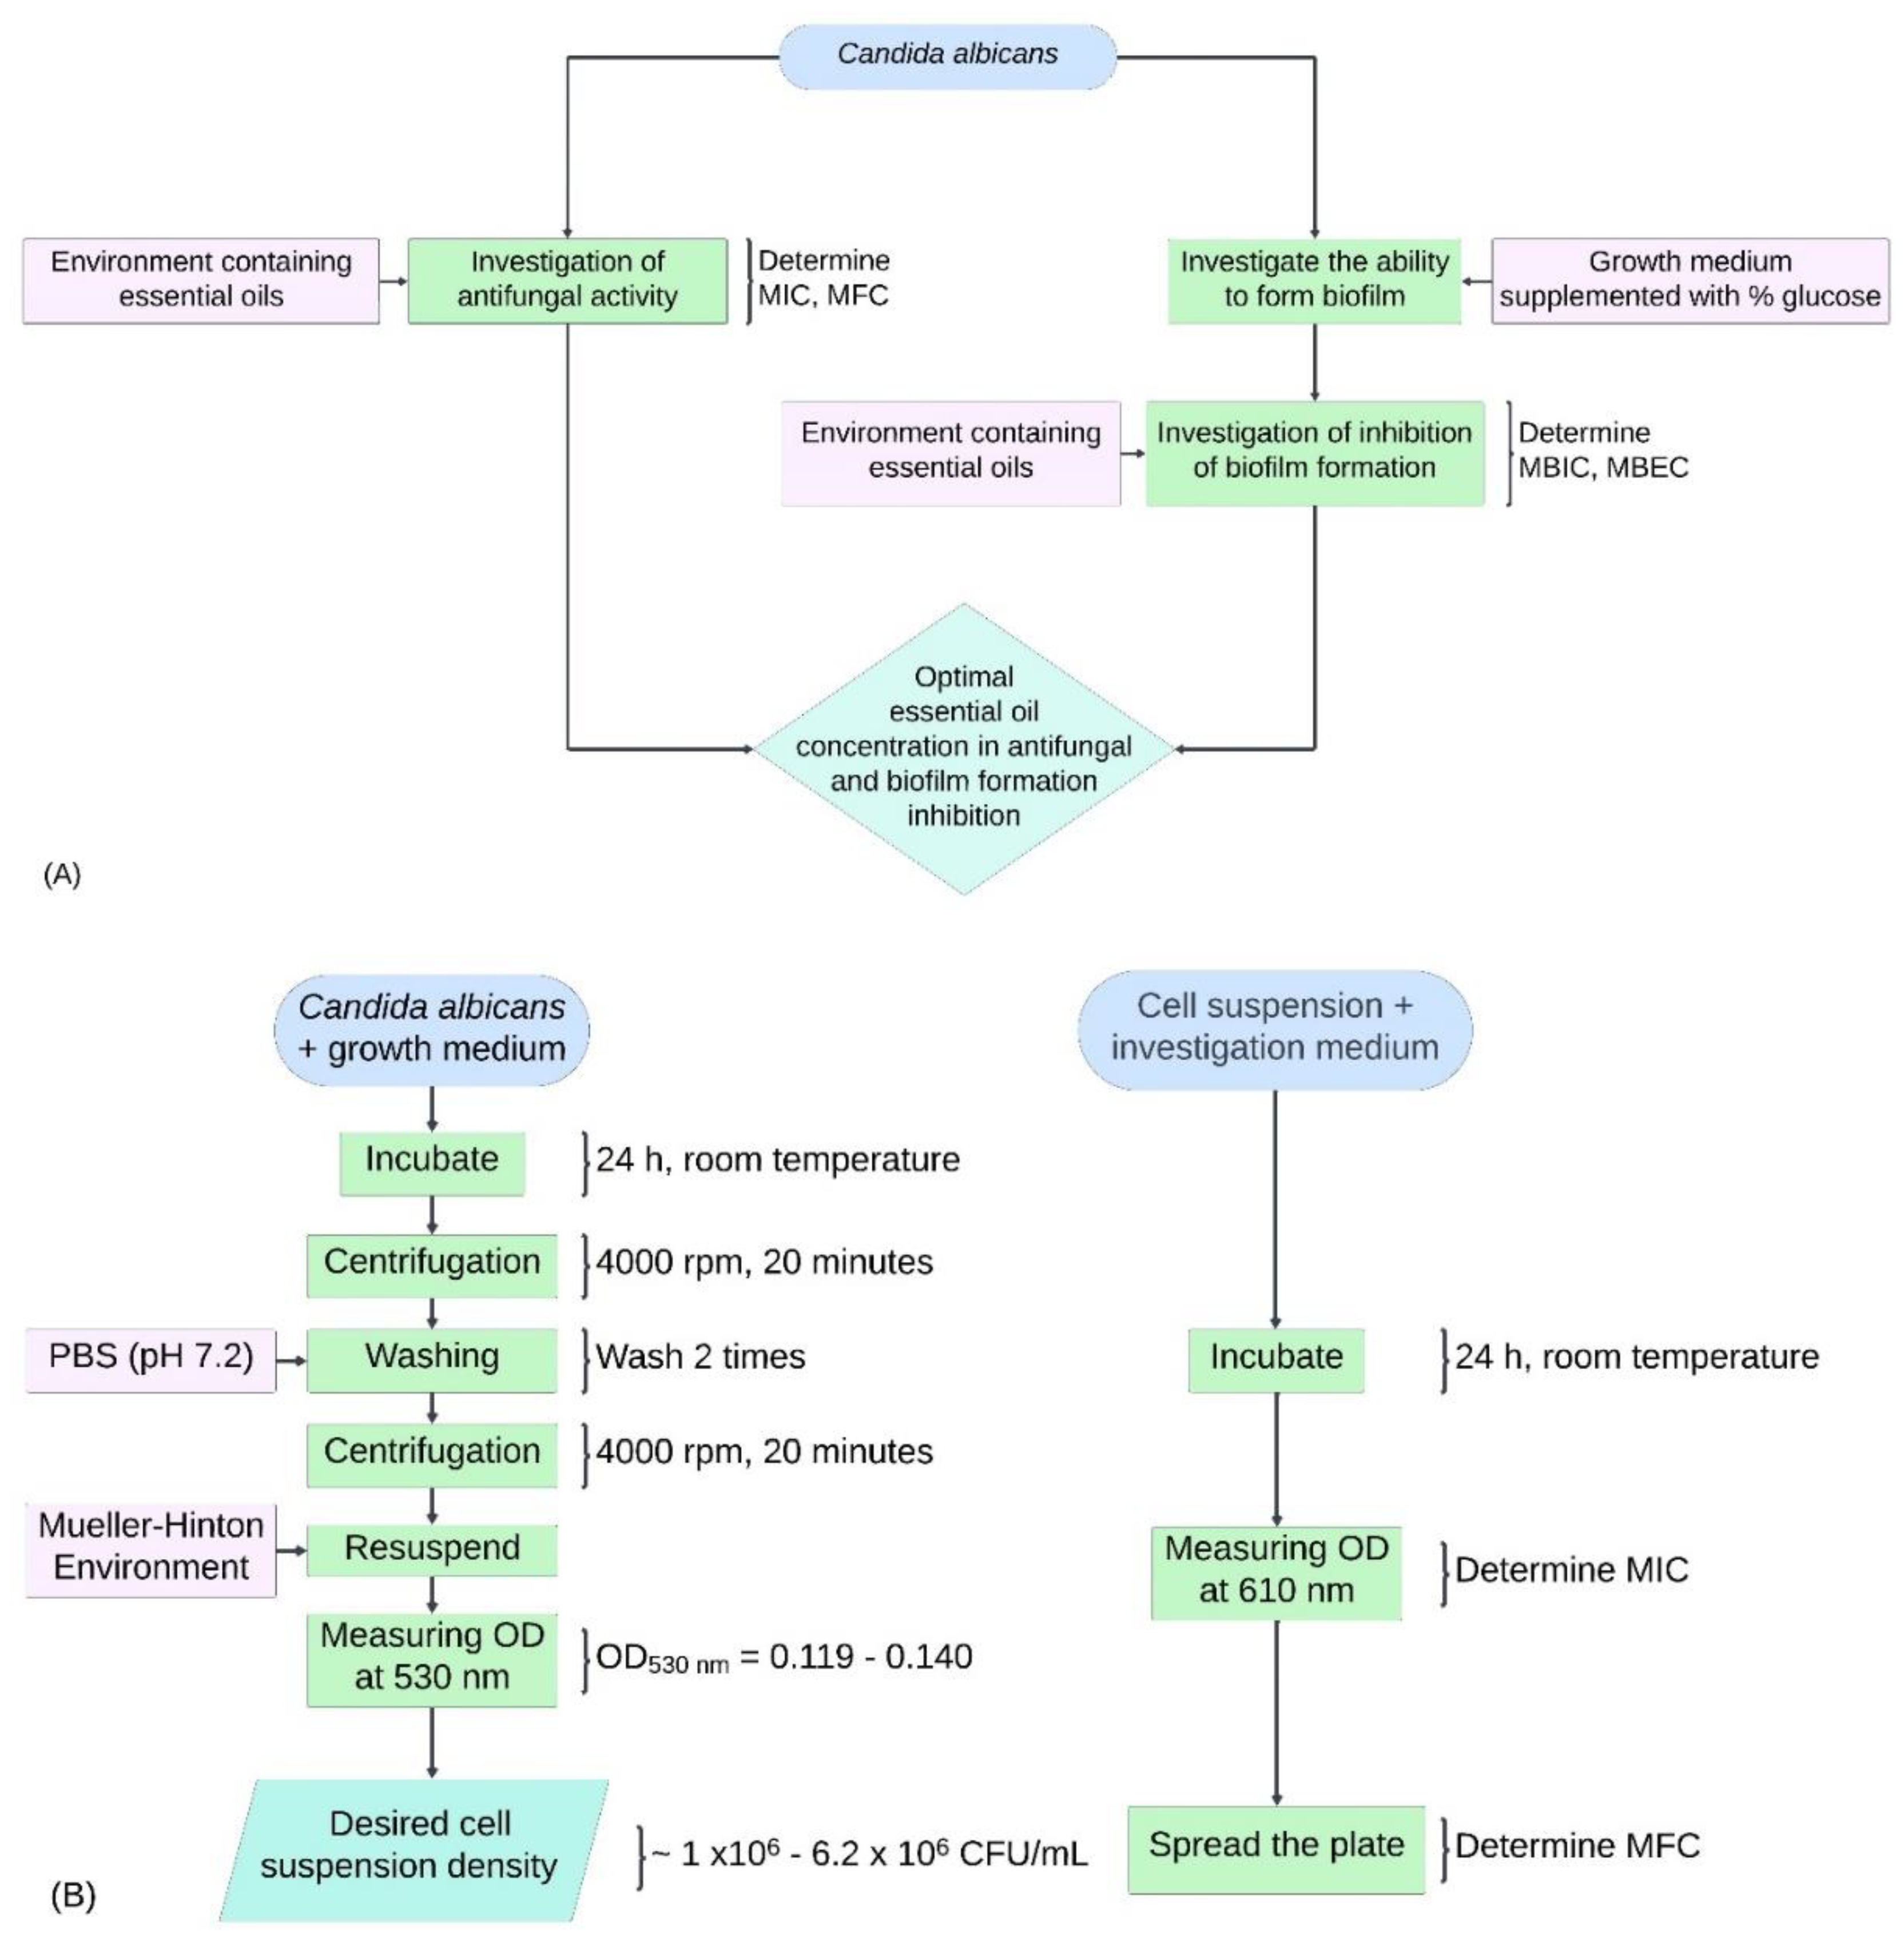
Figure 1A.
Recent studies support the use of tea tree oil and Amphotericin B in antifungal assays. For instance, a comparative evaluation of antifungal action demonstrated that tea tree oil exhibits significant antifungal activity against
Candida albicans [
16]. Additionally, research on the Antifungal activity of 2-chloro-N-phenylacetamide (2024) supports the methodology of emulsifying tea tree oil with Tween 80 for enhanced efficacy [
17]. Another study, Eye Bird View on Natural Plants in the Management of Mucormycosis, highlights the antifungal properties of tea tree oil against various fungal species, including
Candida albicans [
18].
These references provide a solid foundation for the use of tea tree oil and Amphotericin B in antifungal assays against Candida albicans and support the methodologies employed in this study.
Figure 1.
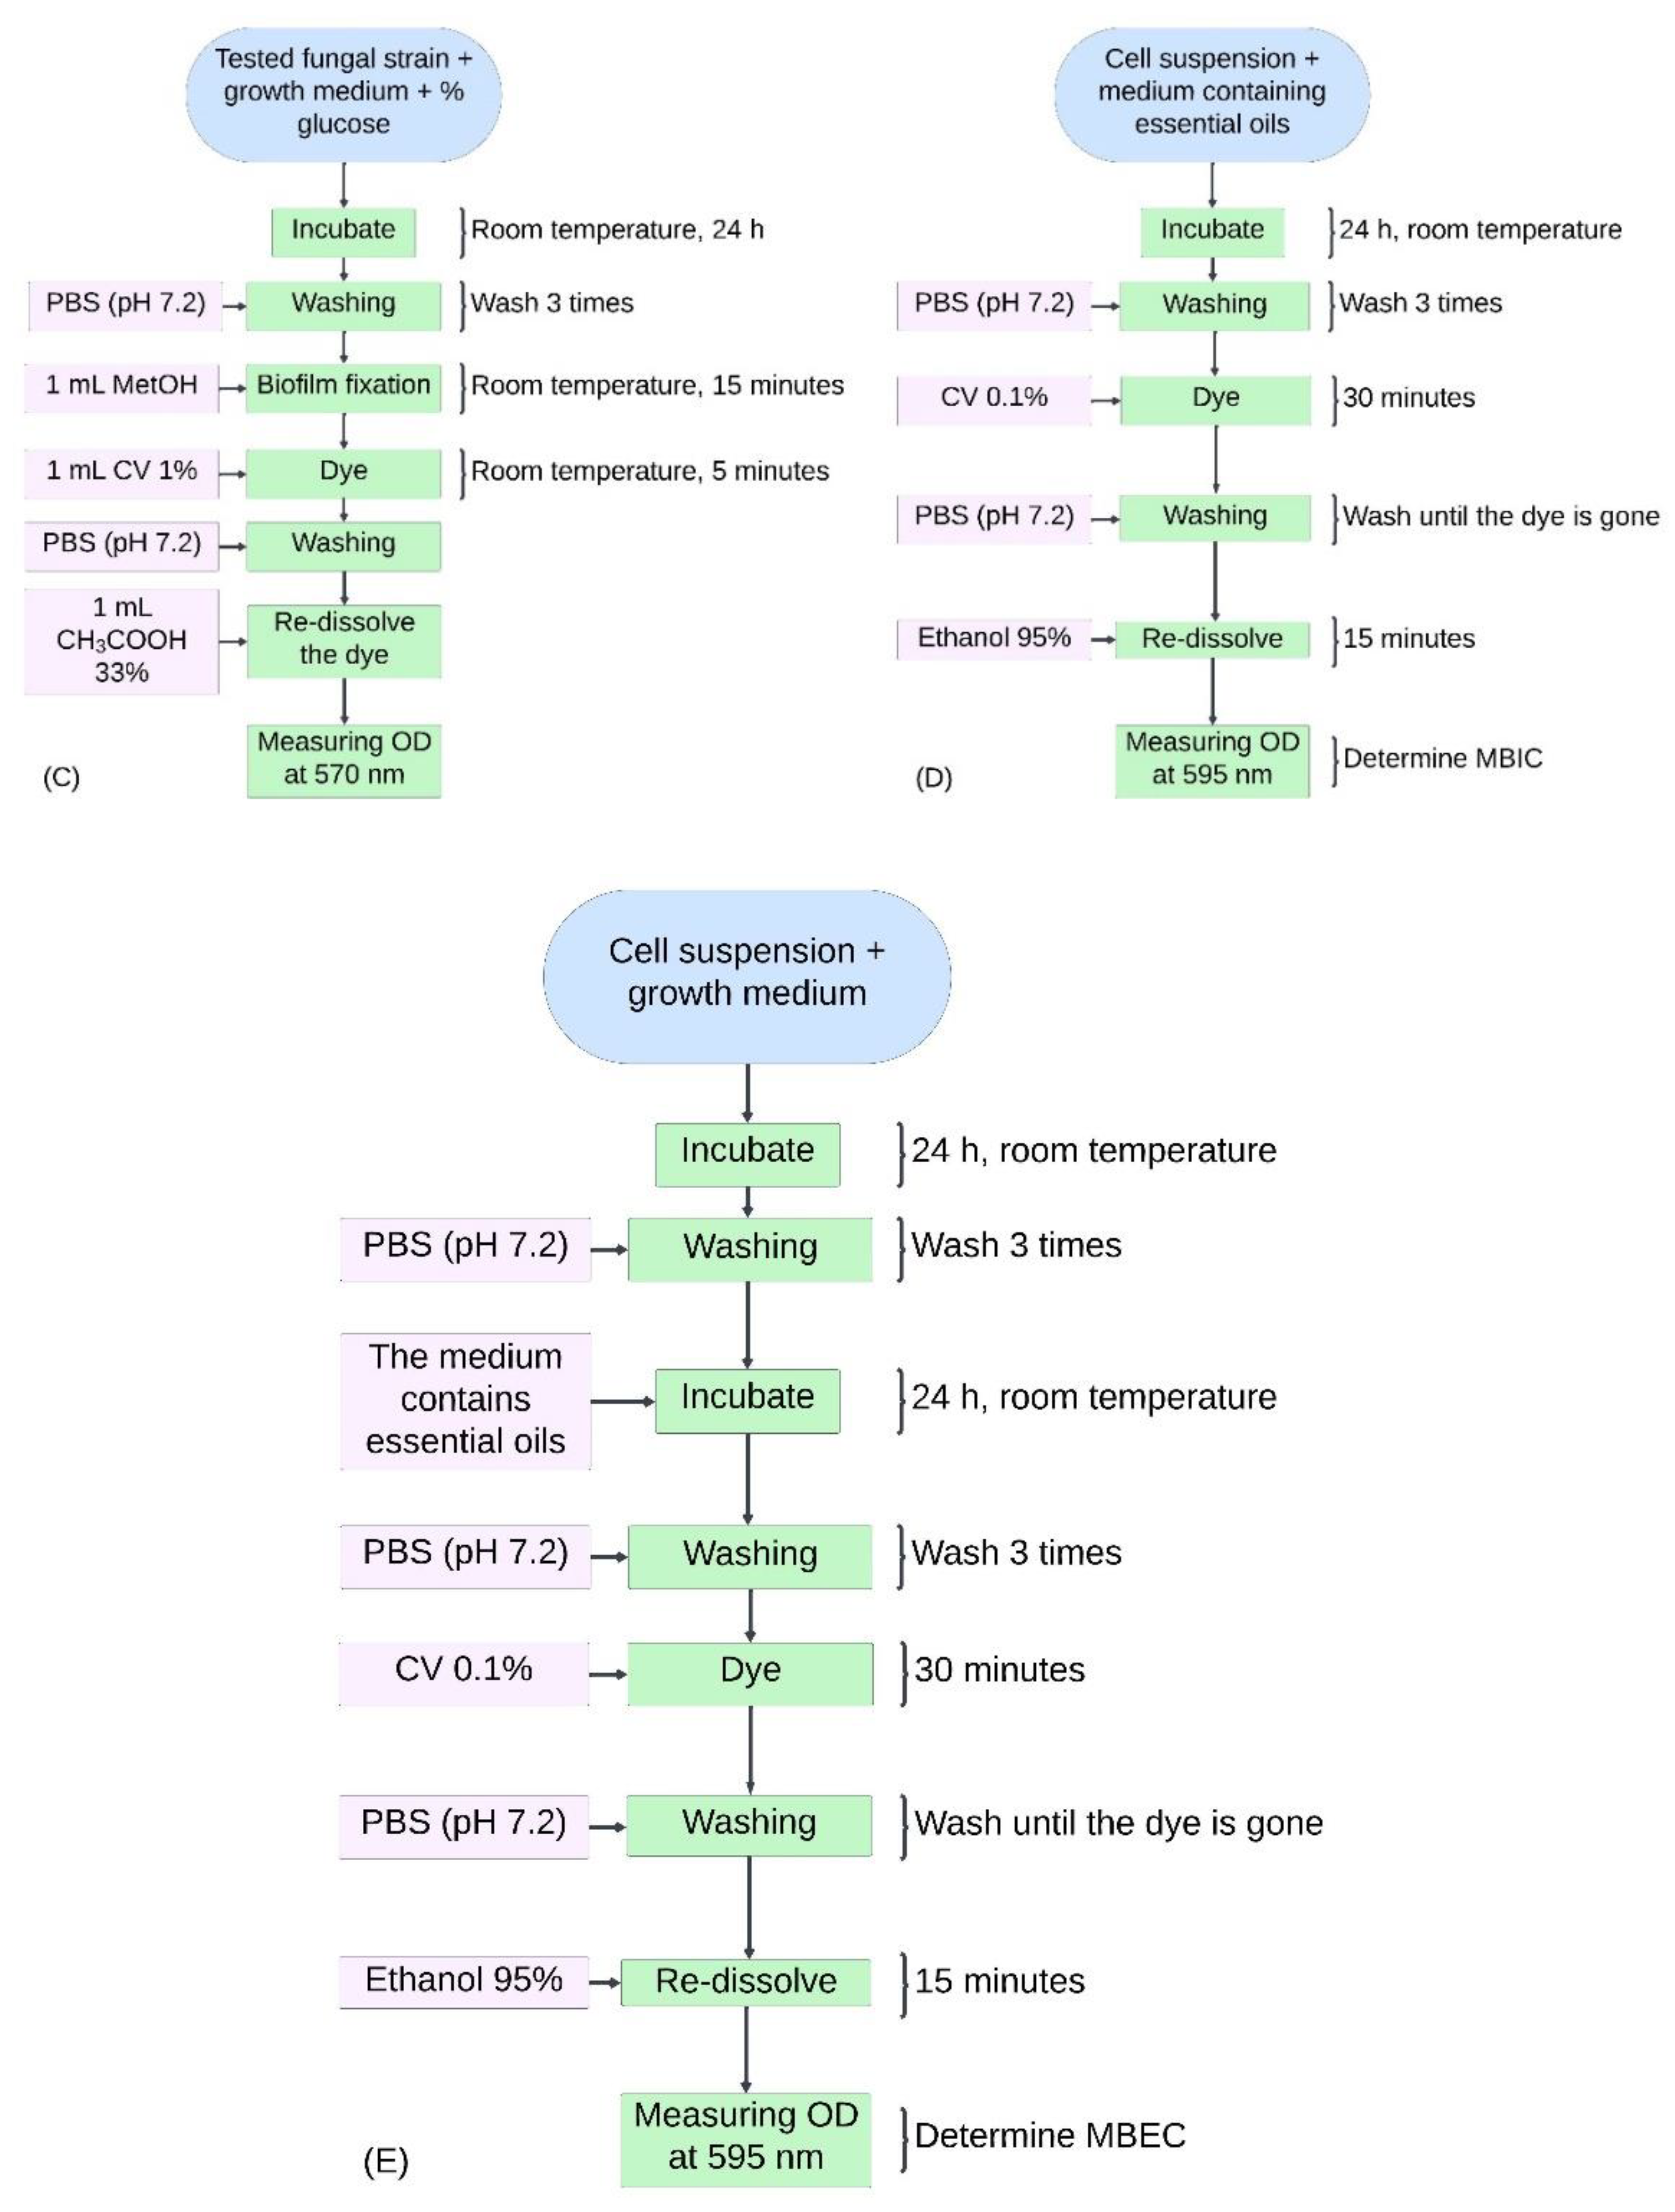
Experimental sequences for this study. (A) General overview of the survey experimental sequence. (B) Diagram investigating the antifungal activity of TTO against Candida albicans. (C) Diagram investigating biofilm formation in Candida albicans. (D) Diagram determining MBIC in the study inhibiting biofilm formation of Candida albicans using TTO. (E) Diagram establishing MBEC in the study inhibiting biofilm formation of Candida albicans using TTO.
Determining the Minimum Inhibitory Concentration (MIC) and Minimum Fungicidal Concentration (MFC). The procedure, illustrated in
Figure 4B, involved a liquid culture dilution method based on Hsu et al.'s descriptions (2013) [
19] with modifications. Initially,
Candida albicans cell suspension was cultured in Hansen medium, incubated for 24 hours at room temperature with shaking at 150 rpm. After centrifugation at 4000 rpm for 20 minutes and a single PBS wash, the fungal pellet was resuspended in Mueller-Hinton medium. Cell density was quantified at OD
530 nm, adjusted to achieve a value within the range of 0.119 to 0.14 [corresponding to approximately 1×10
6 - 6.2×10
6 CFU/mL] [
20,
21].
Following that, 4 mL of Mueller-Hinton medium containing fungal cell suspension was added to each test tube. Then, 1 mL of TTO, emulsified with sterile distilled water containing 0.5% Tween 80, was added to achieve final concentrations of 0.1 μL, 1 μL, 2 μL, 5 μL, 10 μL/mL in the medium. The positive control (AMB) consisted of 4 mL of Mueller-Hinton medium containing fungal cell suspension and 1 mL of AMB mixed in sterile distilled water containing 0.5% Tween 80, resulting in final concentrations of 0.1 μg, 1 μg, 2 μg, 5 μg, 10 μg/mL. The negative control contained 4 mL of Mueller-Hinton medium with fungal cell suspension and 1 mL of sterile distilled water containing 0.5% Tween 80. Blank samples were prepared similarly but without fungal cell suspension. The tubes were then incubated at room temperature for 24 hours. After incubation, the optical density was measured at a wavelength of 610 nm using a UV-VIS spectrophotometer to determine the Minimum Inhibitory Concentration (MIC) of TTO in inhibiting fungal growth.
From the tubes identified as MICs, 50 μL of these samples were spread onto the surface of Hansen medium and incubated at room temperature for 48 hours to determine the Minimum Fungicidal Concentration (MFC) of TTO. The MIC and MFC experiments were conducted independently three times, and the averages were calculated.
MIC is defined as the lowest concentration of TTO or antifungal agent that inhibits the fungal growth, as indicated by a reduction in optical density compared to the control sample [
22,
23]. MIC
80 is the lowest concentration of tea tree oil or antifungal agent causing an 80% reduction in optical density compared to the control sample [
22,
23]. MFC is the lowest concentration of TTO or antifungal agent demonstrating no growth of fungal colonies on the agar surface after 48 hours of incubation [
24,
25].
Recent studies support these methods and definitions. For instance, the research on Antifungal activity of 2-chloro-N-phenylacetamide (2024) discusses the determination of MIC and MFC in
Candida albicans [
17]. Another study, Multifunctional polymeric guanidine and hydantoin (2024), also focuses on MIC and MFC of various polymers against
Candida albicans [
26]. Additionally, the paper Synthesis of Bioactive Nickel Nanoparticles Using Bacterial Strains (2024) provides a detailed methodology for MIC and MFC evaluation [
27].
These references provide a solid foundation for understanding the determination of MIC and MFC in Candida albicans and support the methodologies employed in our investigation.
Investigation of the biofilm-forming ability of Candida albicans. The experimental procedure is illustrated in Figure 1C. Candida albicans strains were cultured in Hansen medium with additional glucose concentrations of 2.5%, 5%, and 10% (w/v) in 2 mL round-bottom Eppendorf tubes.
Materials preparation followed Pereira et al. (2015) [
28] with minor adjustments.
Candida albicans was cultured on agar for 48 hours, then inoculated into Hansen liquid medium at room temperature for 24 hours with shaking at 150 rpm. After centrifugation at 4000 rpm for 20 minutes and two PBS washes, the pellet was resuspended in Hansen medium with glucose concentrations of 2.5%, 5%, and 10% (w/v). The cell density was adjusted to approximately 10
7 CFU/mL [OD
530 nm values between 0.39 and 0.43, equivalent to 1.26×10
7 - 6.49×10
7 CFU/mL] [
21]. Subsequently, 1 mL of the standard inoculum [yeast cell suspension in Hansen medium with 2.5%, 5%, and 10% glucose (w/v)] was aspirated into 2 mL Eppendorf tubes and incubated undisturbed at room temperature for 24 hours.
Biofilm formation capability was assessed by quantifying total biomass using the Crystal Violet (CV) staining method, adapted from Silva et al. (2009) [
29]. After a 24-hour incubation, wells were washed with sterile PBS (pH 7.2) three times to remove residual medium and non-adherent fungal cells. Methanol (1 mL) was added and removed after 15 minutes. Eppendorf tubes were air-dried, followed by the addition of 1 mL CV 1% (v/v) for 5 minutes. After washing with PBS, 33% (v/v) acetic acid (1 mL) was added, and absorbance was read at 570 nm using a UV-VIS spectrophotometer. The experiment was conducted in triplicate, with three parallel samples for each repetition.
Recent studies have supported these methods and findings. For instance, the research by Biofilm Formation and Antifungal Susceptibility Profile of
Candida albicans (2024) provides a comprehensive analysis of biofilm formation and antifungal susceptibility, emphasizing the importance of glucose concentrations in biofilm development [
30]. Additionally, an integrated transcriptomic and metabolomic approach highlights the complex biofilm-forming ability of
Candida albicans and its metabolic interactions [
31]. Furthermore, research on
Candida albicans biofilm heterogeneity underscores that variations in biofilm formation do not significantly impact denture biofilm development [
32].
These studies provide a solid foundation for understanding the biofilm-forming ability of Candida albicans and support the methodologies employed in our investigation.
Biofilm-forming ability, assessed by total biomass quantification, followed Alves et al.'s method (2023) [
33]:
Where:
ODc: The cut-off optical density
ODnc: The mean OD of the negative control
SD: The standard deviations of OD values of negative control samples (ODs)
Positive samples (ODs > ODc) were considered biofilm producers, categorized as:
ODs ≤ ODc: no biofilm producer
ODc < ODs ≤ 2ODc: week biofilm producer
2ODc < ODs ≤ 4ODc: moderate biofilm producer
4ODc < ODs: strong biofilm producer
Determining the Minimum Biofilm Inhibitory Concentration (MBIC) and Minimum Biofilm Eradication Concentration (MBEC). The experimental sequence is depicted in
Figure 1D and
Figure 1E. The cell density in the
Candida albicans yeast suspension for MBIC and MBEC determination should be around 10
7 CFU/mL, [OD
530 nm values between 0.39 and 0.43, approximately 1.26×10
7 - 6.49×10
7 CFU/mL] [
34] and must be re-suspended in Hansen medium (the Hansen medium composition was selected from the
Candida albicans biofilm formation capability assessment experiment).
MBIC and MBEC are defined as the lowest concentration of essential oil that inhibits over 50% of biofilm formation and the lowest concentration of essential oil that eradicates over 50% of pre-formed biofilm, respectively [
35].
MBIC and MBEC were determined following Purwasena et al.'s method (2020) [
35], with adjustments.
Candida albicans yeast cell suspension (900 μL) in 2 mL Eppendorf tubes was prepared. Different concentrations of essential oil (0.1 μL, 1 μL, 2 μL, 5 μL, 10 μL/mL) were added in 100 μL increments. Positive controls (using AMB) were also prepared at concentrations of 0.1 μg, 1 μg, 2 μg, 5 μg, 10 μg/mL. The tubes were statically incubated for 24 hours at room temperature. After incubation, the medium was removed, and tubes were washed with sterile PBS buffer (pH 7.2) three times to eliminate free cells. Biofilms were stained with 0.1% crystal violet for 30 minutes. After staining, crystal violet was removed, and tubes were rinsed with PBS until runoff was colorless. Finally, biofilms were dissolved in 95% ethanol for 15 minutes, and absorbance at 595 nm was measured using a UV-VIS spectrophotometer to determine MBIC and MBEC. The untreated sample contained only the growth medium, sterile distilled water with 0.5% Tween 80, and yeast cell suspension. The negative control contained only the growth medium. The experiment was repeated four times, and average values were obtained.
Recent studies have supported these methods and findings. For instance, the research by Poly-Gamma-Glutamic Acid Nanopolymer Effect against Bacterial Biofilms (2024) explores the MBIC and MBEC of various compounds, highlighting the effectiveness of essential oils against biofilm formation and eradication [
36]. Additionally, studies on Antibacterial and Antibiofilm Potential of Bacterial Cellulose emphasize the importance of biofilm inhibitory and eradication concentrations in microbial control [
37]. Furthermore, the research Shifting from Ammonium to Phosphonium Salts provides insights into the effectiveness of different chemical compounds on biofilm formation and eradication [
38].
These studies provide a solid foundation for understanding the determination of MBIC and MBEC and support the methodologies employed in our investigation.
Statistical analysis. We used Dixon's Q test to identify and remove outliers when analyzing microbial growth or biofilm assay data. For each concentration tested in the assays mentioned above, we calculated the arithmetic mean and standard deviation (SD), which were presented as a relative percentage compared to the control sample (set at 100%). Dixon's Q test was utilized to identify outliers in the data obtained from the biofilm assays [
39]. We performed a one-way analysis of variance (ANOVA) with a significance level of p < 0.05 to assess the statistical significance of the disparities observed between the control and adjuvant effects [
40]. Statistical analysis was conducted using standard protocols for microbial diversity and biofilm formation studies [
41]. The approval of an ethics committee is not necessary for this study.
Recent studies have supported the use of Dixon's Q test and ANOVA for analyzing microbial and biofilm assay data. For example, research on non-thermal plasma and UV radiation's impact on biofilms highlights the effectiveness of Dixon's Q test in identifying outliers [
39]. Additionally, a comprehensive analysis of antibiotic effects on microbial development and gene expression underscores the importance of ANOVA in determining statistical significance [
40]. Moreover, a study on microbial diversity and biofilm formation provides insights into statistical methodologies employed in biofilm research [
41].
These references validate the statistical methods used in our analysis and support the robustness of our experimental results.
3. Results
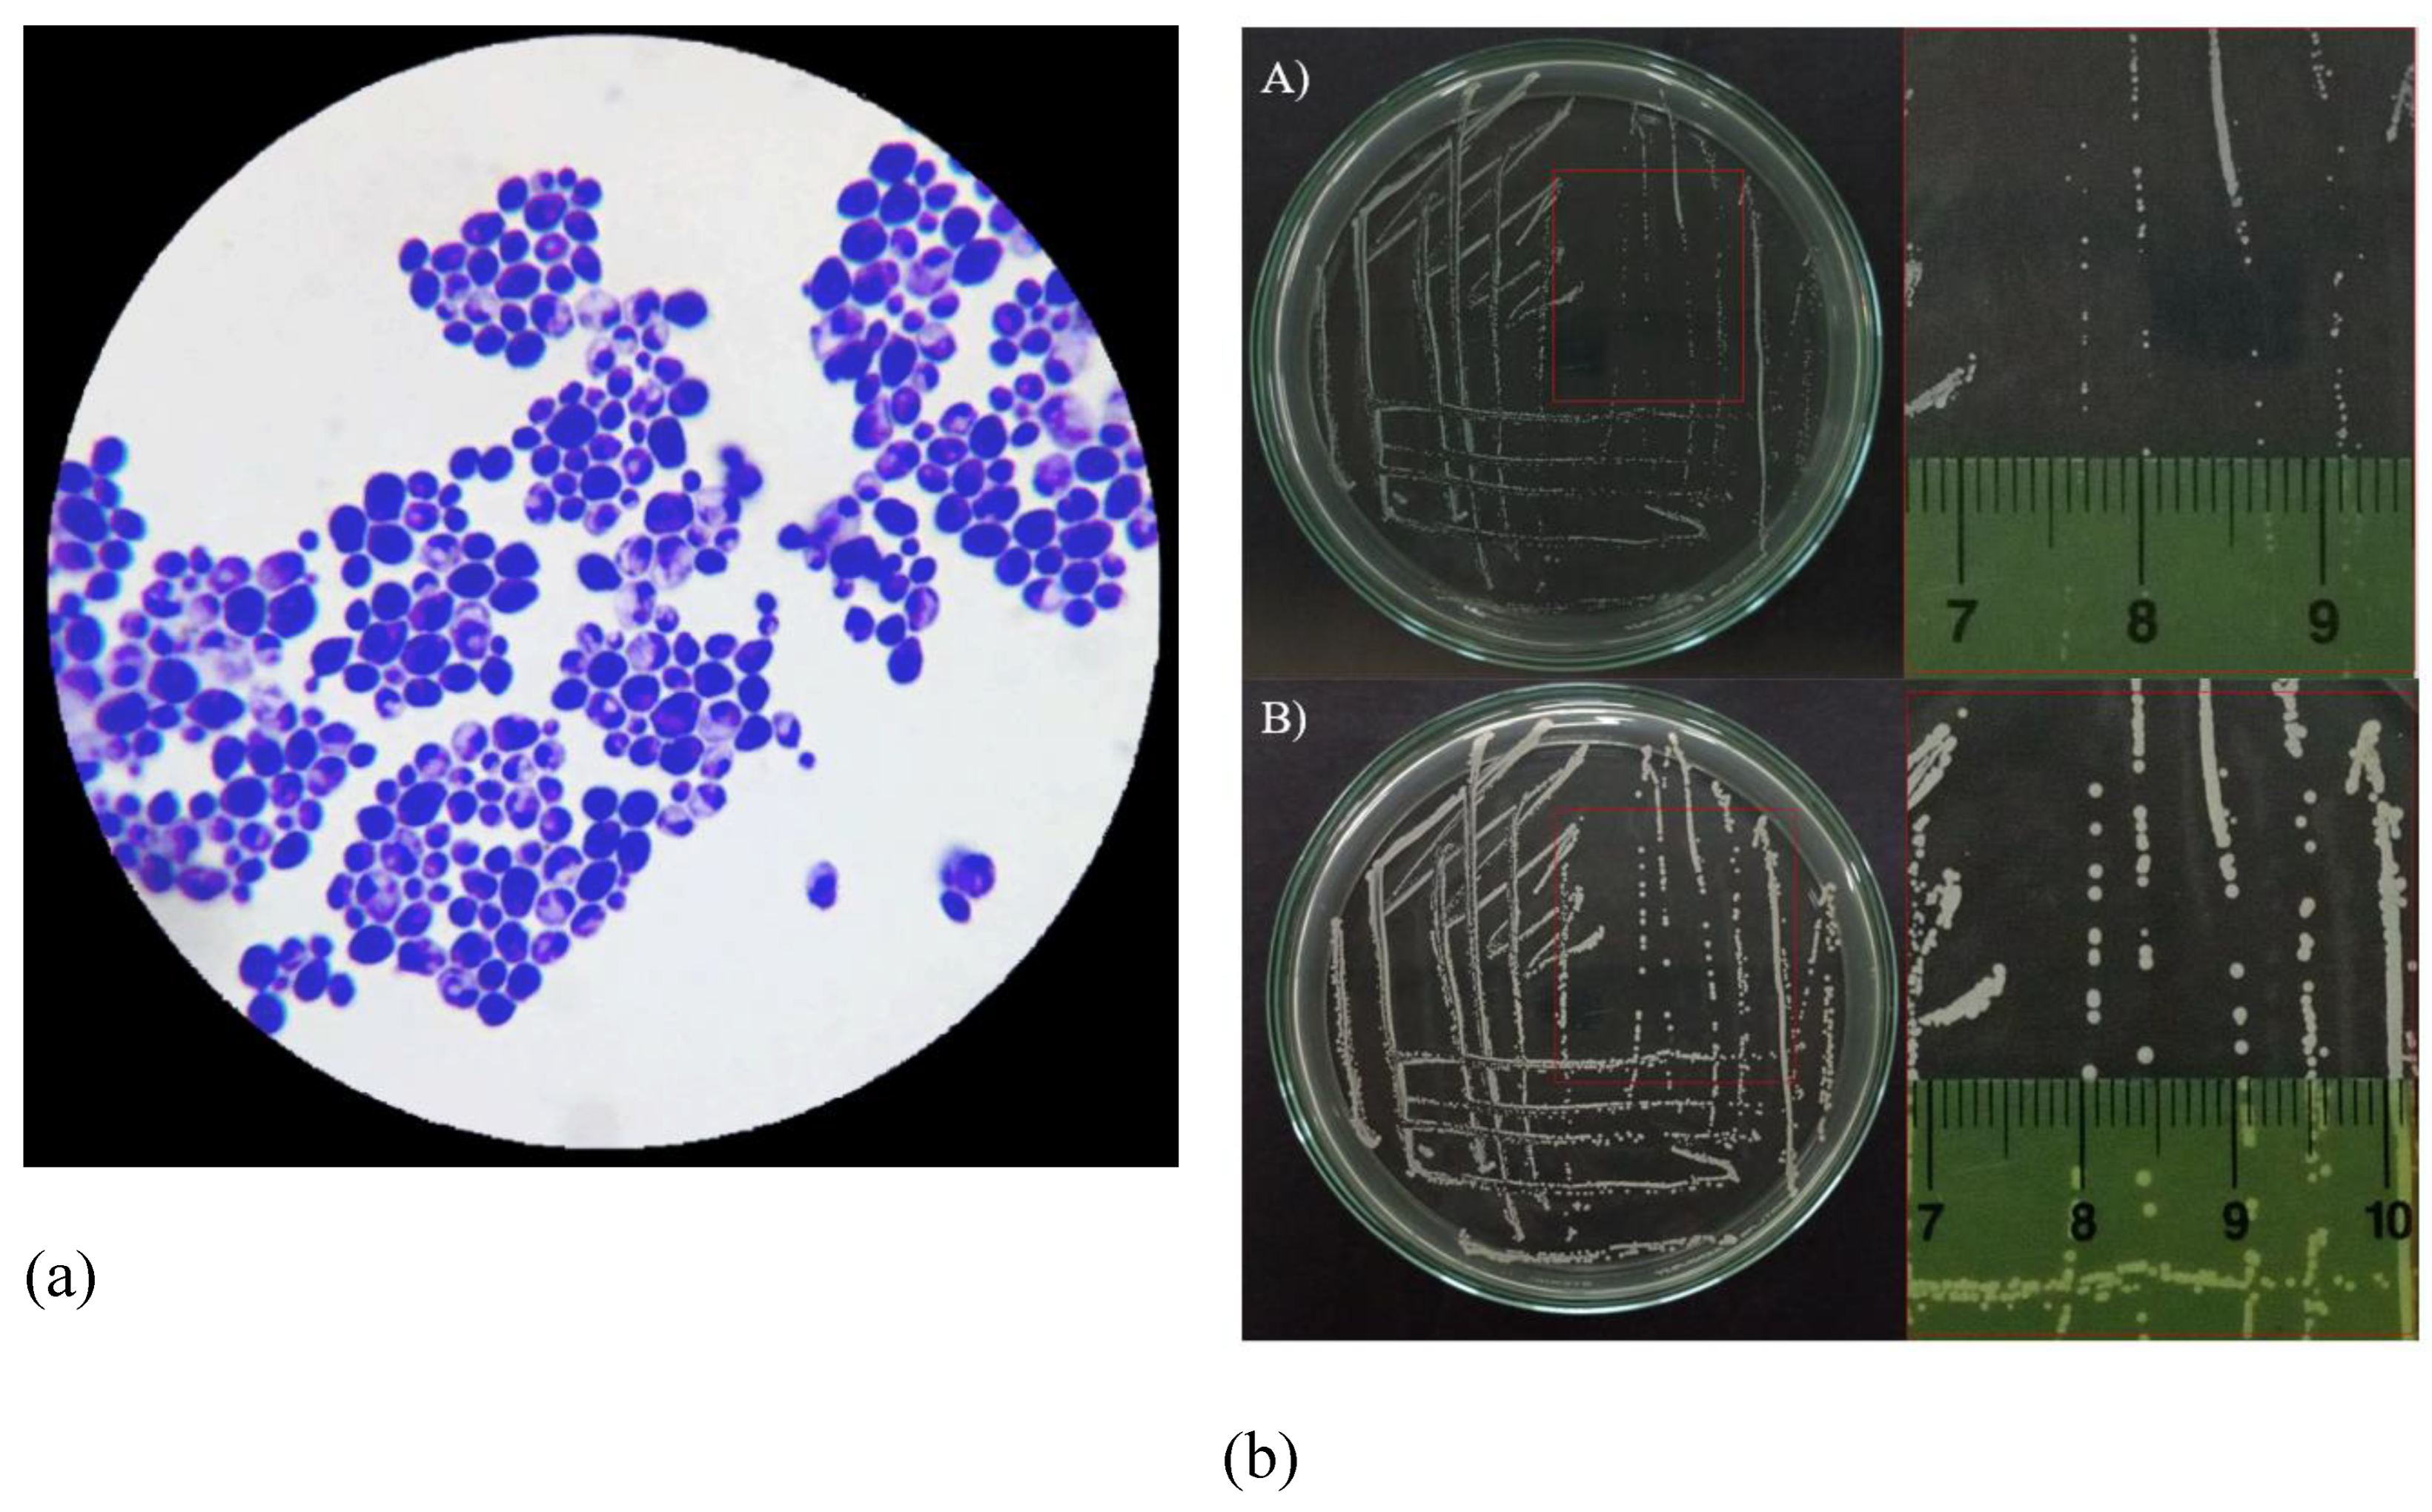
Morphology of Candida albicans. In terms of morphological characteristics, Candida albicans fungal cells were uniformly observed in a yeast form (Figure 2a). Candida albicans cells were streaked on the surface of the Hansen agar medium and incubated at room temperature (Figure 2b). Regarding the macroscopic morphology of Candida albicans, after 24 hours of incubation, Candida albicans colonies grew in circular shapes, appearing opaque white, with an approximate diameter of about 0.5 mm (Figure 2b-A). After 48 hours of incubation, Candida albicans colonies exhibited an increase in diameter (Figure 2b-B).
Investigation of the antifungal activity of TTO against
Candida albicans. The results determined by two criteria, MIC and MFC, are presented in
Figure 3 and
Table 1.
Table 1.
MIC and MFC of the AMB antifungal agent and TTO.
Table 1.
MIC and MFC of the AMB antifungal agent and TTO.
| Bioactive compounds |
MIC |
MIC80
|
MFC |
| AMB |
0.1 /mL |
- |
- |
| TTO |
0.1 /mL |
2 /mL |
10 /mL |
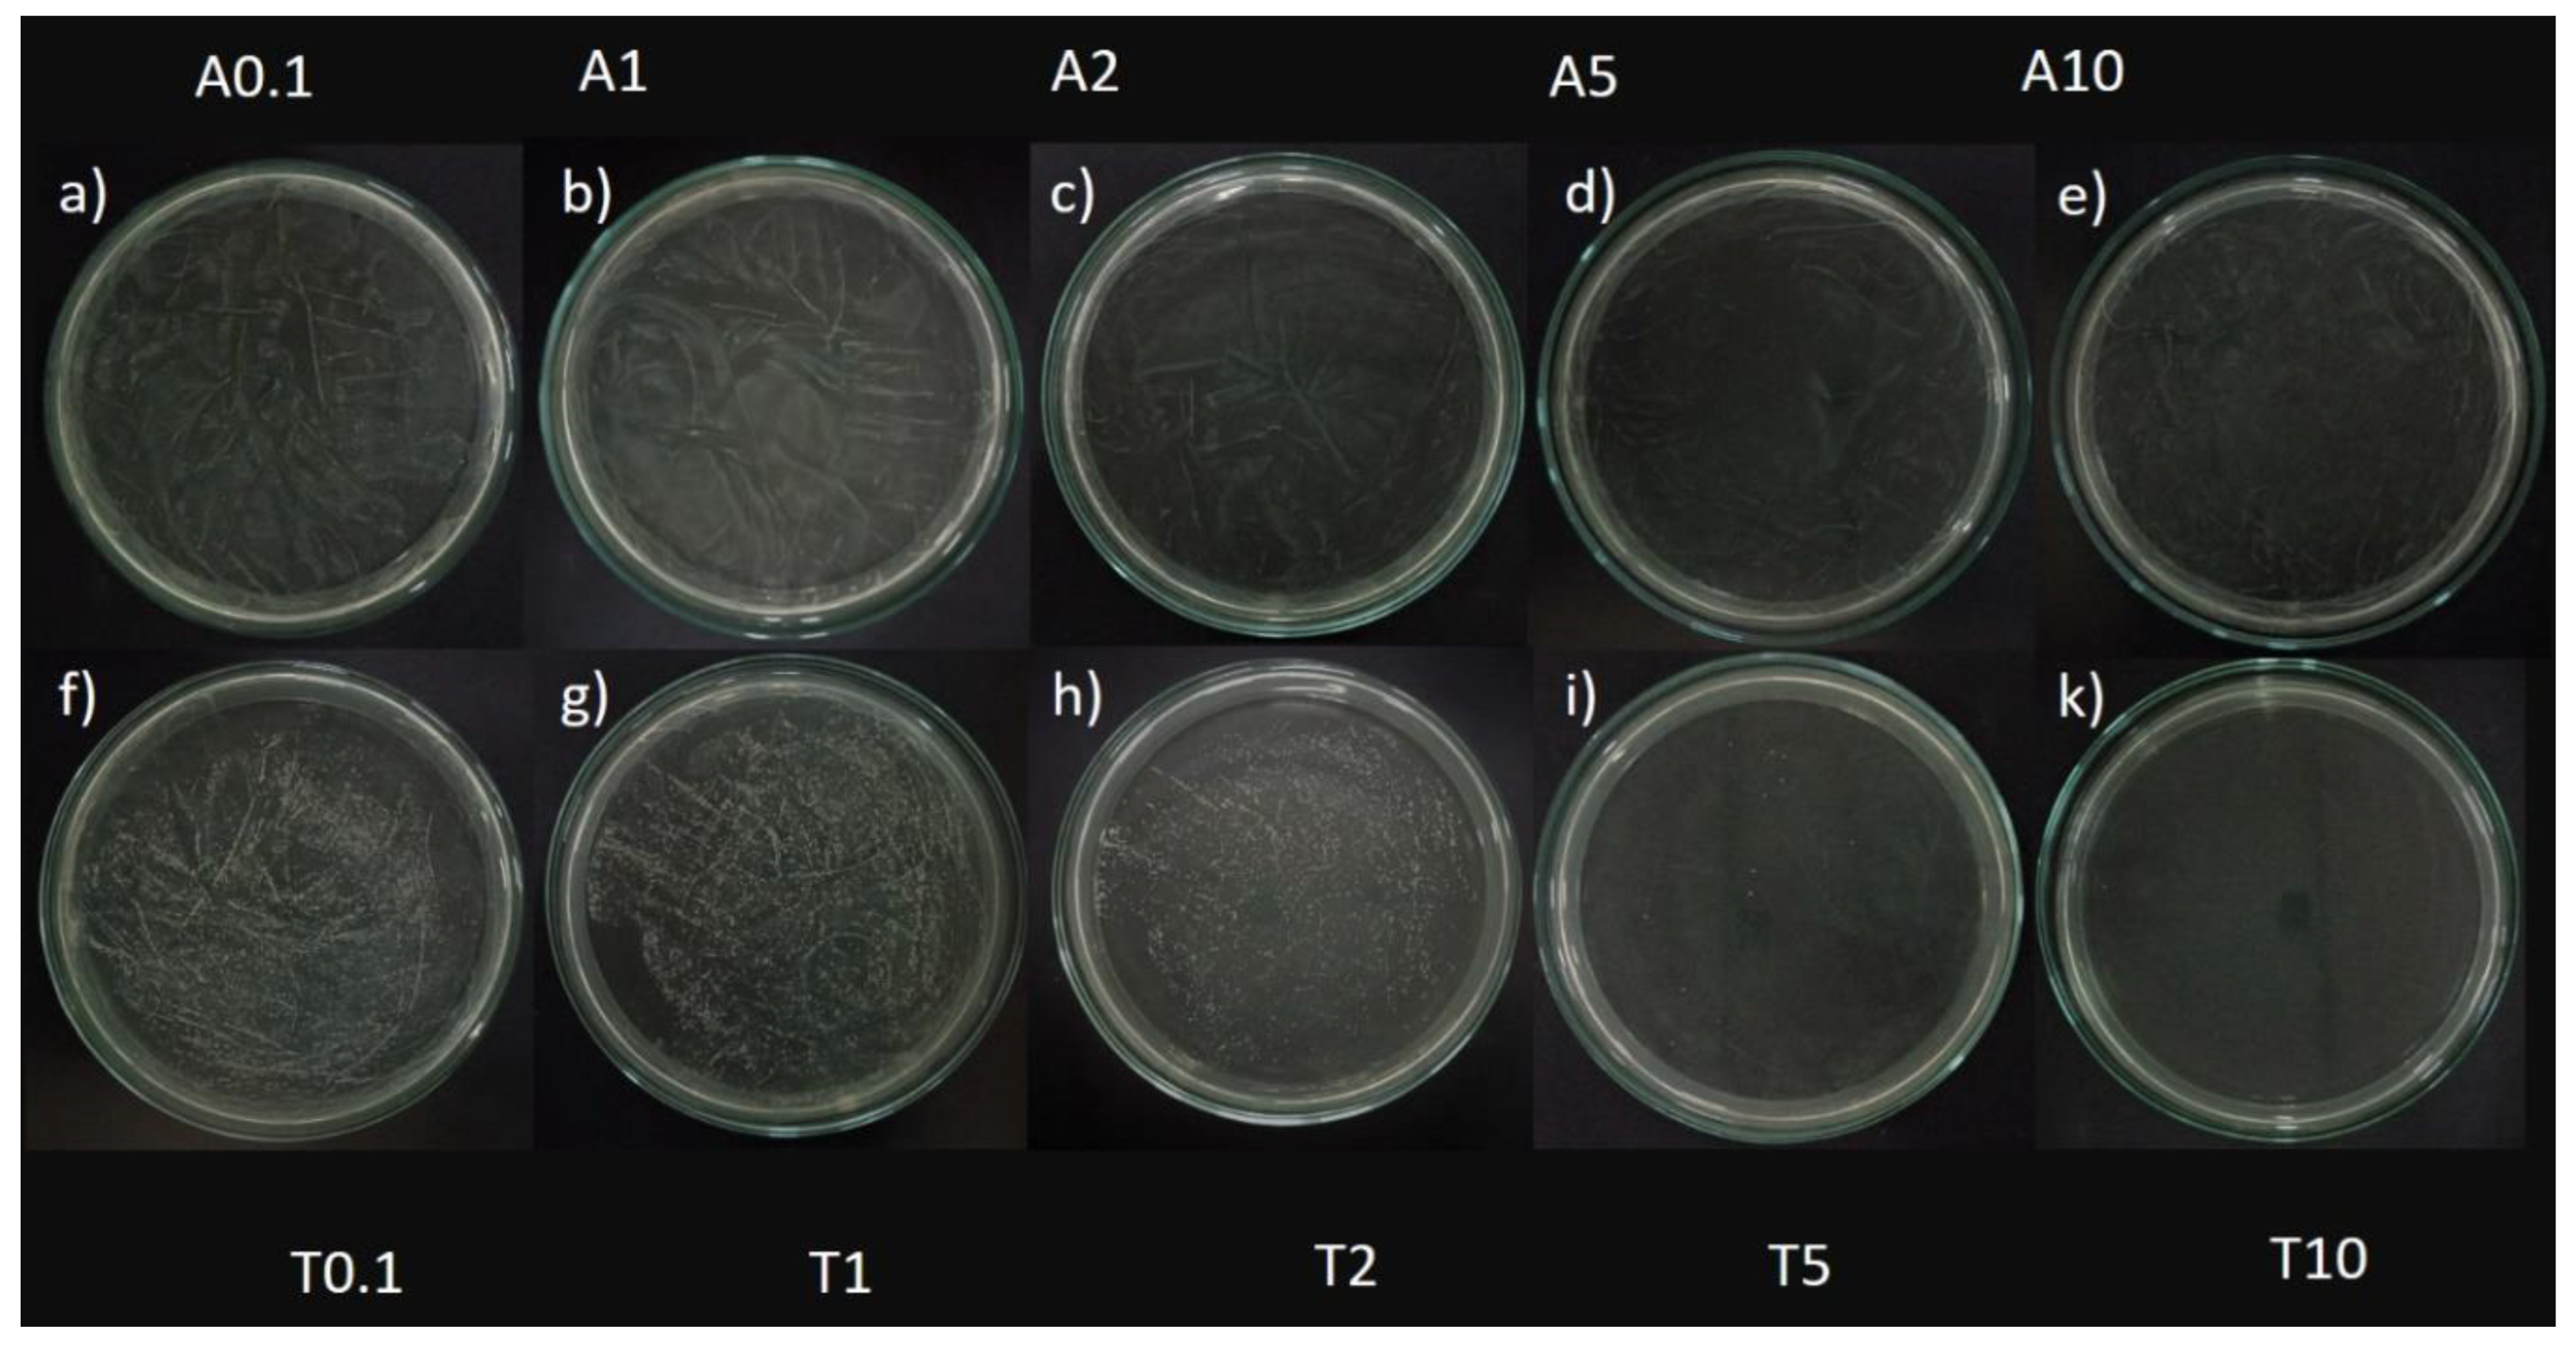
Figure 3 illustrates that both the antifungal agent AMB and TTO at all tested concentrations exhibit a decrease in optical density compared to the negative control (-), indicating MIC values of 0.1 μg/mL for AMB and 0.1 μL/mL for TTO. All concentrations of the positive control (treated with AMB) show a growth inhibition percentage in Candida albicans not exceeding 50%. For the TTO-treated sample, the antifungal activity of the oil follows the pattern of "increasing concentration of the active substance, increasing antifungal activity," similar to the AMB antifungal agent.
Figure 2.
Morphology of Candida albicans. (a) Microscopic morphology of Candida albicans using a simple staining method. (b) Cluster morphology of Candida albicans after A) 24 h and B) 48 h.
Figure 2.
Morphology of Candida albicans. (a) Microscopic morphology of Candida albicans using a simple staining method. (b) Cluster morphology of Candida albicans after A) 24 h and B) 48 h.
Figure 3.
Antifungal activity against Candida albicans of the antifungal agent AMB and TTO at various test concentrations. (A) MFC results are presented as follows: Images labeled a), b), c), d), e) show samples treated with the antifungal agent AMB at concentrations of 0.1, 1, 2, 5, and 10 μg/mL respectively; and f), g), h), i), k) display samples treated with TTO at concentrations of 0.1, 1, 2, 5, and 10 μL/mL respectively. (B) Graphical representation of concentration thresholds inhibiting fungal growth.
Based on the results presented in Figure 3 and Table 1, at a concentration of 2 μL/mL (1824.34 μg/mL), the TTO-treated sample caused a reduction of over 80% in optical density compared to the negative control, specifically inhibiting the growth of Candida albicans by 87.4 ± 0.27%. This concentration is noted as MIC80. The survey results also recorded the MIC of tea tree oil against Candida albicans as 0.1 μL/mL (91.217 μg/mL). Regarding the MFC criterion, only the sample treated with TTO at a concentration of 10 μL/mL (9121.7 μg/mL) showed no formation of fungal clusters on the surface of the Hansen medium after 48 hours of incubation.
Investigation of the biofilm formation capability of Candida albicans. The experiment was conducted with three independent trials, and each trial included three parallel samples. The results of the experiment are shown in Figure 4, Tables 2 and 3.
Table 2.
The mean ODs value at a wavelength of 570 nm.
Table 2.
The mean ODs value at a wavelength of 570 nm.
| Trial |
Symbol |
The mean ODs value at a wavelength of 570 nm |
ODc value |
| Hansen + 2.5% glucose |
NT1 |
2.6390 1.6245 |
1.3127 0.3875 |
| Hansen + 5% glucose |
NT2 |
2.4337 1.5600 |
| Hansen + 10% glucose |
NT3 |
2.2874 1.5124 |
Table 3.
The extent of biofilm formation by Candida albicans in the Hansen medium supplemented with varying percentages of glucose (w/v).
Table 3.
The extent of biofilm formation by Candida albicans in the Hansen medium supplemented with varying percentages of glucose (w/v).
| The extent of biofilm formation |
Trials |
Hansen + 2.5% glucose
(NT1)
|
Hansen + 5% glucose
(NT2)
|
Hansen + 10% glucose
(NT3)
|
No biofilm producer
ODs 1.31 |
- |
- |
- |
Weak biofilm producer
1.31 ODs 2.62 |
- |
+ |
+ |
Moderate biofilm producer
2.62 ODs 5.24 |
+ |
- |
- |
Strong biofilm producer
5.24 ODs |
- |
- |
- |
According to the data presented in Tables 2 and 3, all three experimental trials indicate that the addition of varying percentages of glucose (w/v) to the Hansen medium can stimulate Candida albicans to form biofilm (refer to Table 3). Analyzing the results from Table 3, NT1 exhibits the most proficient biofilm-forming capacity of Candida albicans, achieving a moderate level of biofilm formation, in contrast to the other two trials which demonstrate weaker biofilm formation. This disparity could potentially be attributed to the elevated levels of supplemental D-glucose in the Hansen medium at 5% and 10%, inadvertently acting as an inhibitory factor that impedes biofilm formation. Consequently, there is an observable tendency toward decreased biofilm formation under these conditions.
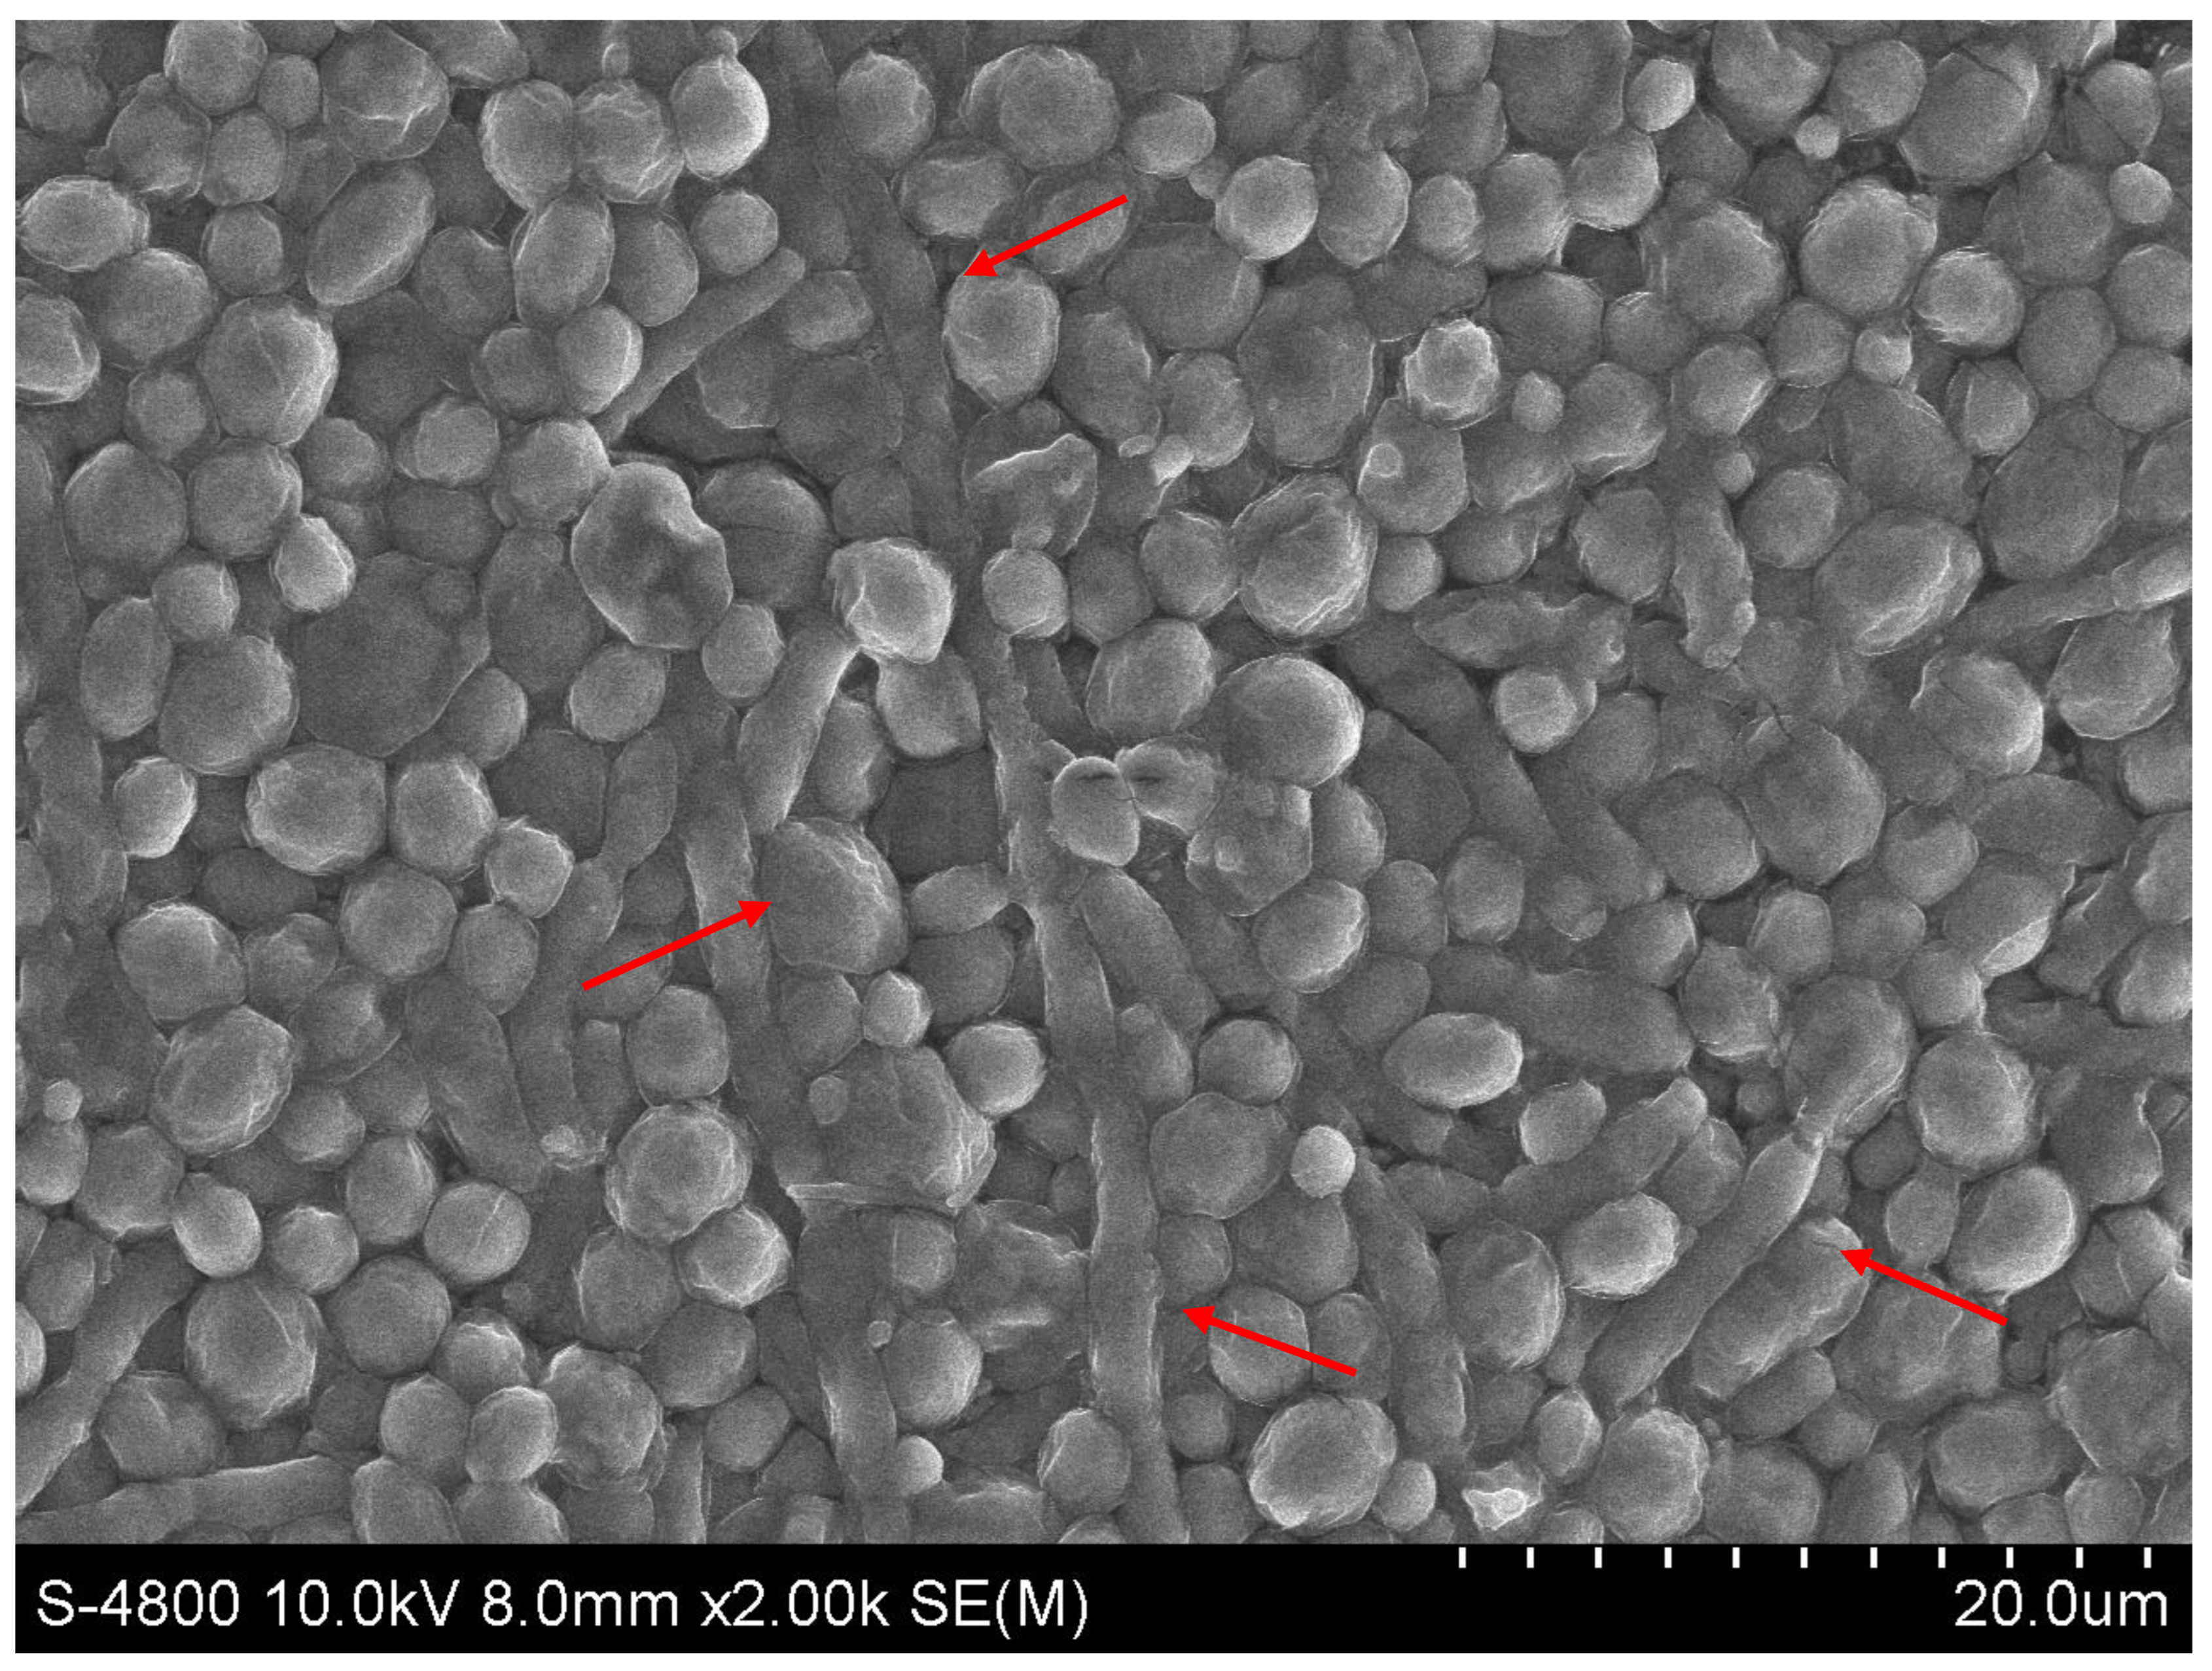
Biofilm formation by Candida albicans on Hansen medium supplemented with 2.5% glucose was documented through electron microscopy (Figure 5). Consequently, the Hansen medium enriched with 2.5% glucose is characterized as having the capacity to foster a moderate level of biofilm formation, establishing a foundation for subsequent investigations.
Figure 4.
Biofilm image of Candida albicans stained with 1% crystal violet in Hansen medium was supplemented with an additional percentage (w/v) of glucose. (a) Hansen + 2.5% glucose; (b) Hansen + 5% glucose; (c) Hansen + 10% glucose.
Figure 4.
Biofilm image of Candida albicans stained with 1% crystal violet in Hansen medium was supplemented with an additional percentage (w/v) of glucose. (a) Hansen + 2.5% glucose; (b) Hansen + 5% glucose; (c) Hansen + 10% glucose.
Figure 5.
Scanning Electron Microscopy (SEM) image of Candida albicans biofilm in the experimental condition of Hansen medium + 2.5% glucose.
Figure 5.
Scanning Electron Microscopy (SEM) image of Candida albicans biofilm in the experimental condition of Hansen medium + 2.5% glucose.
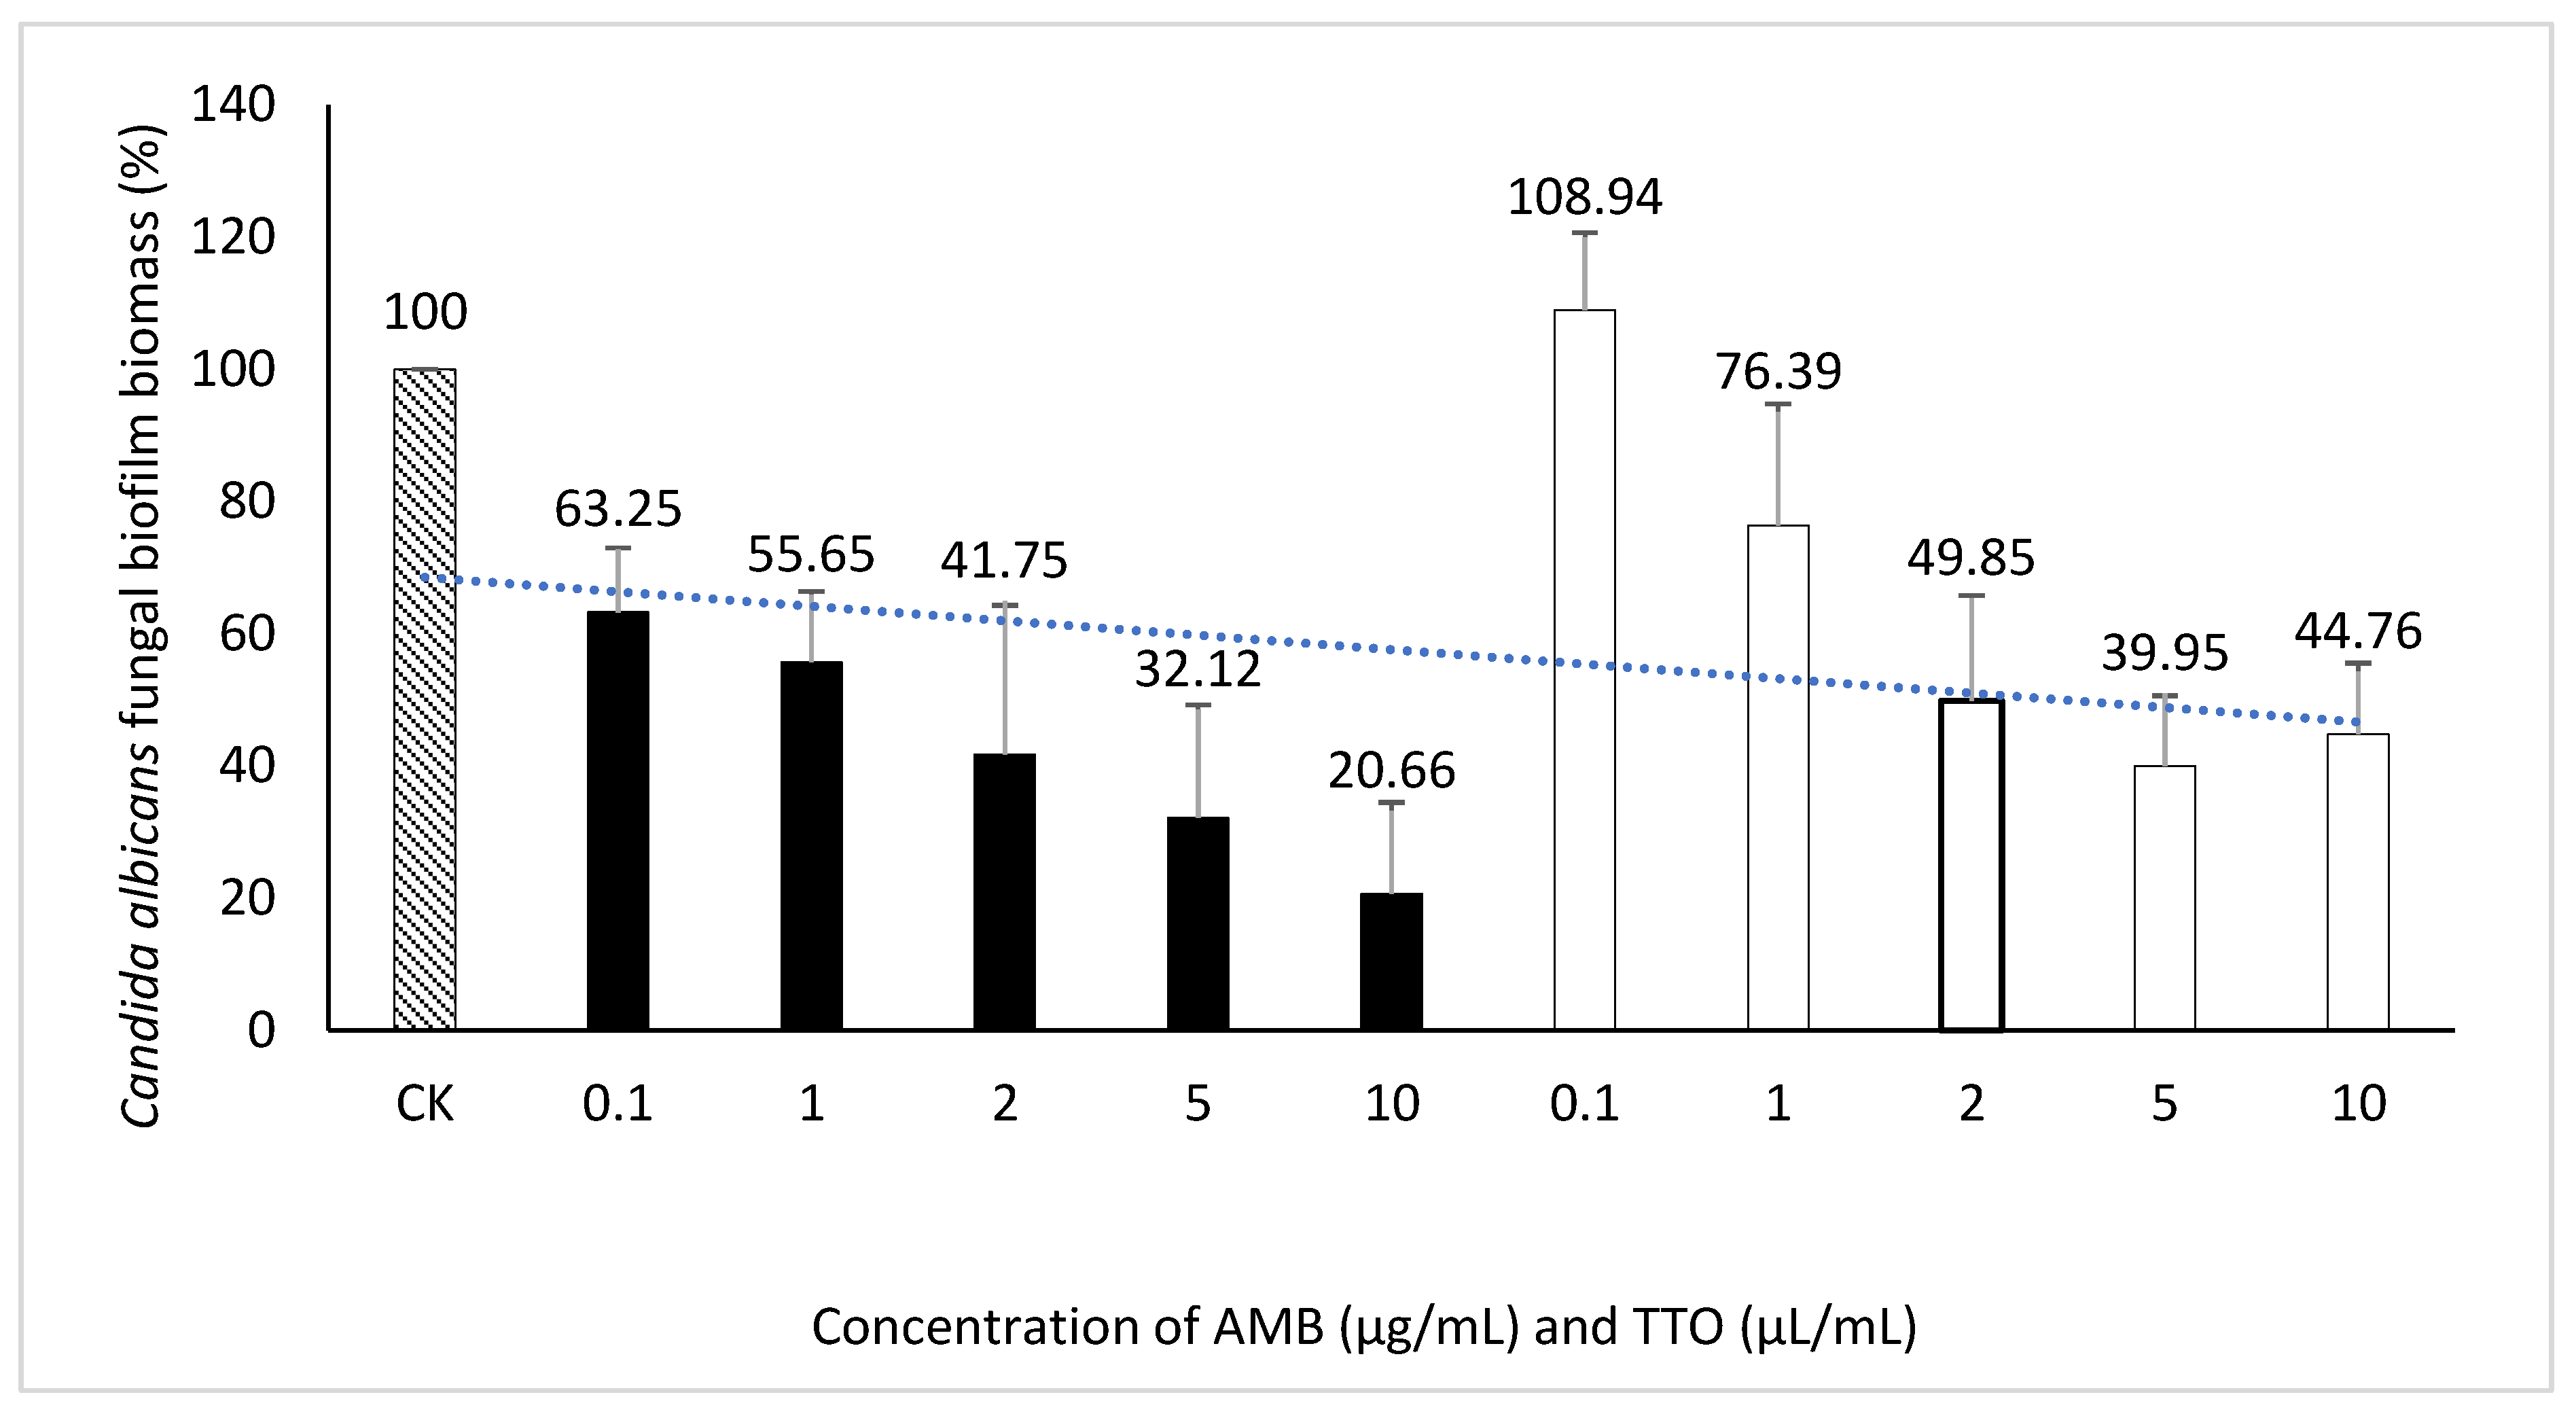
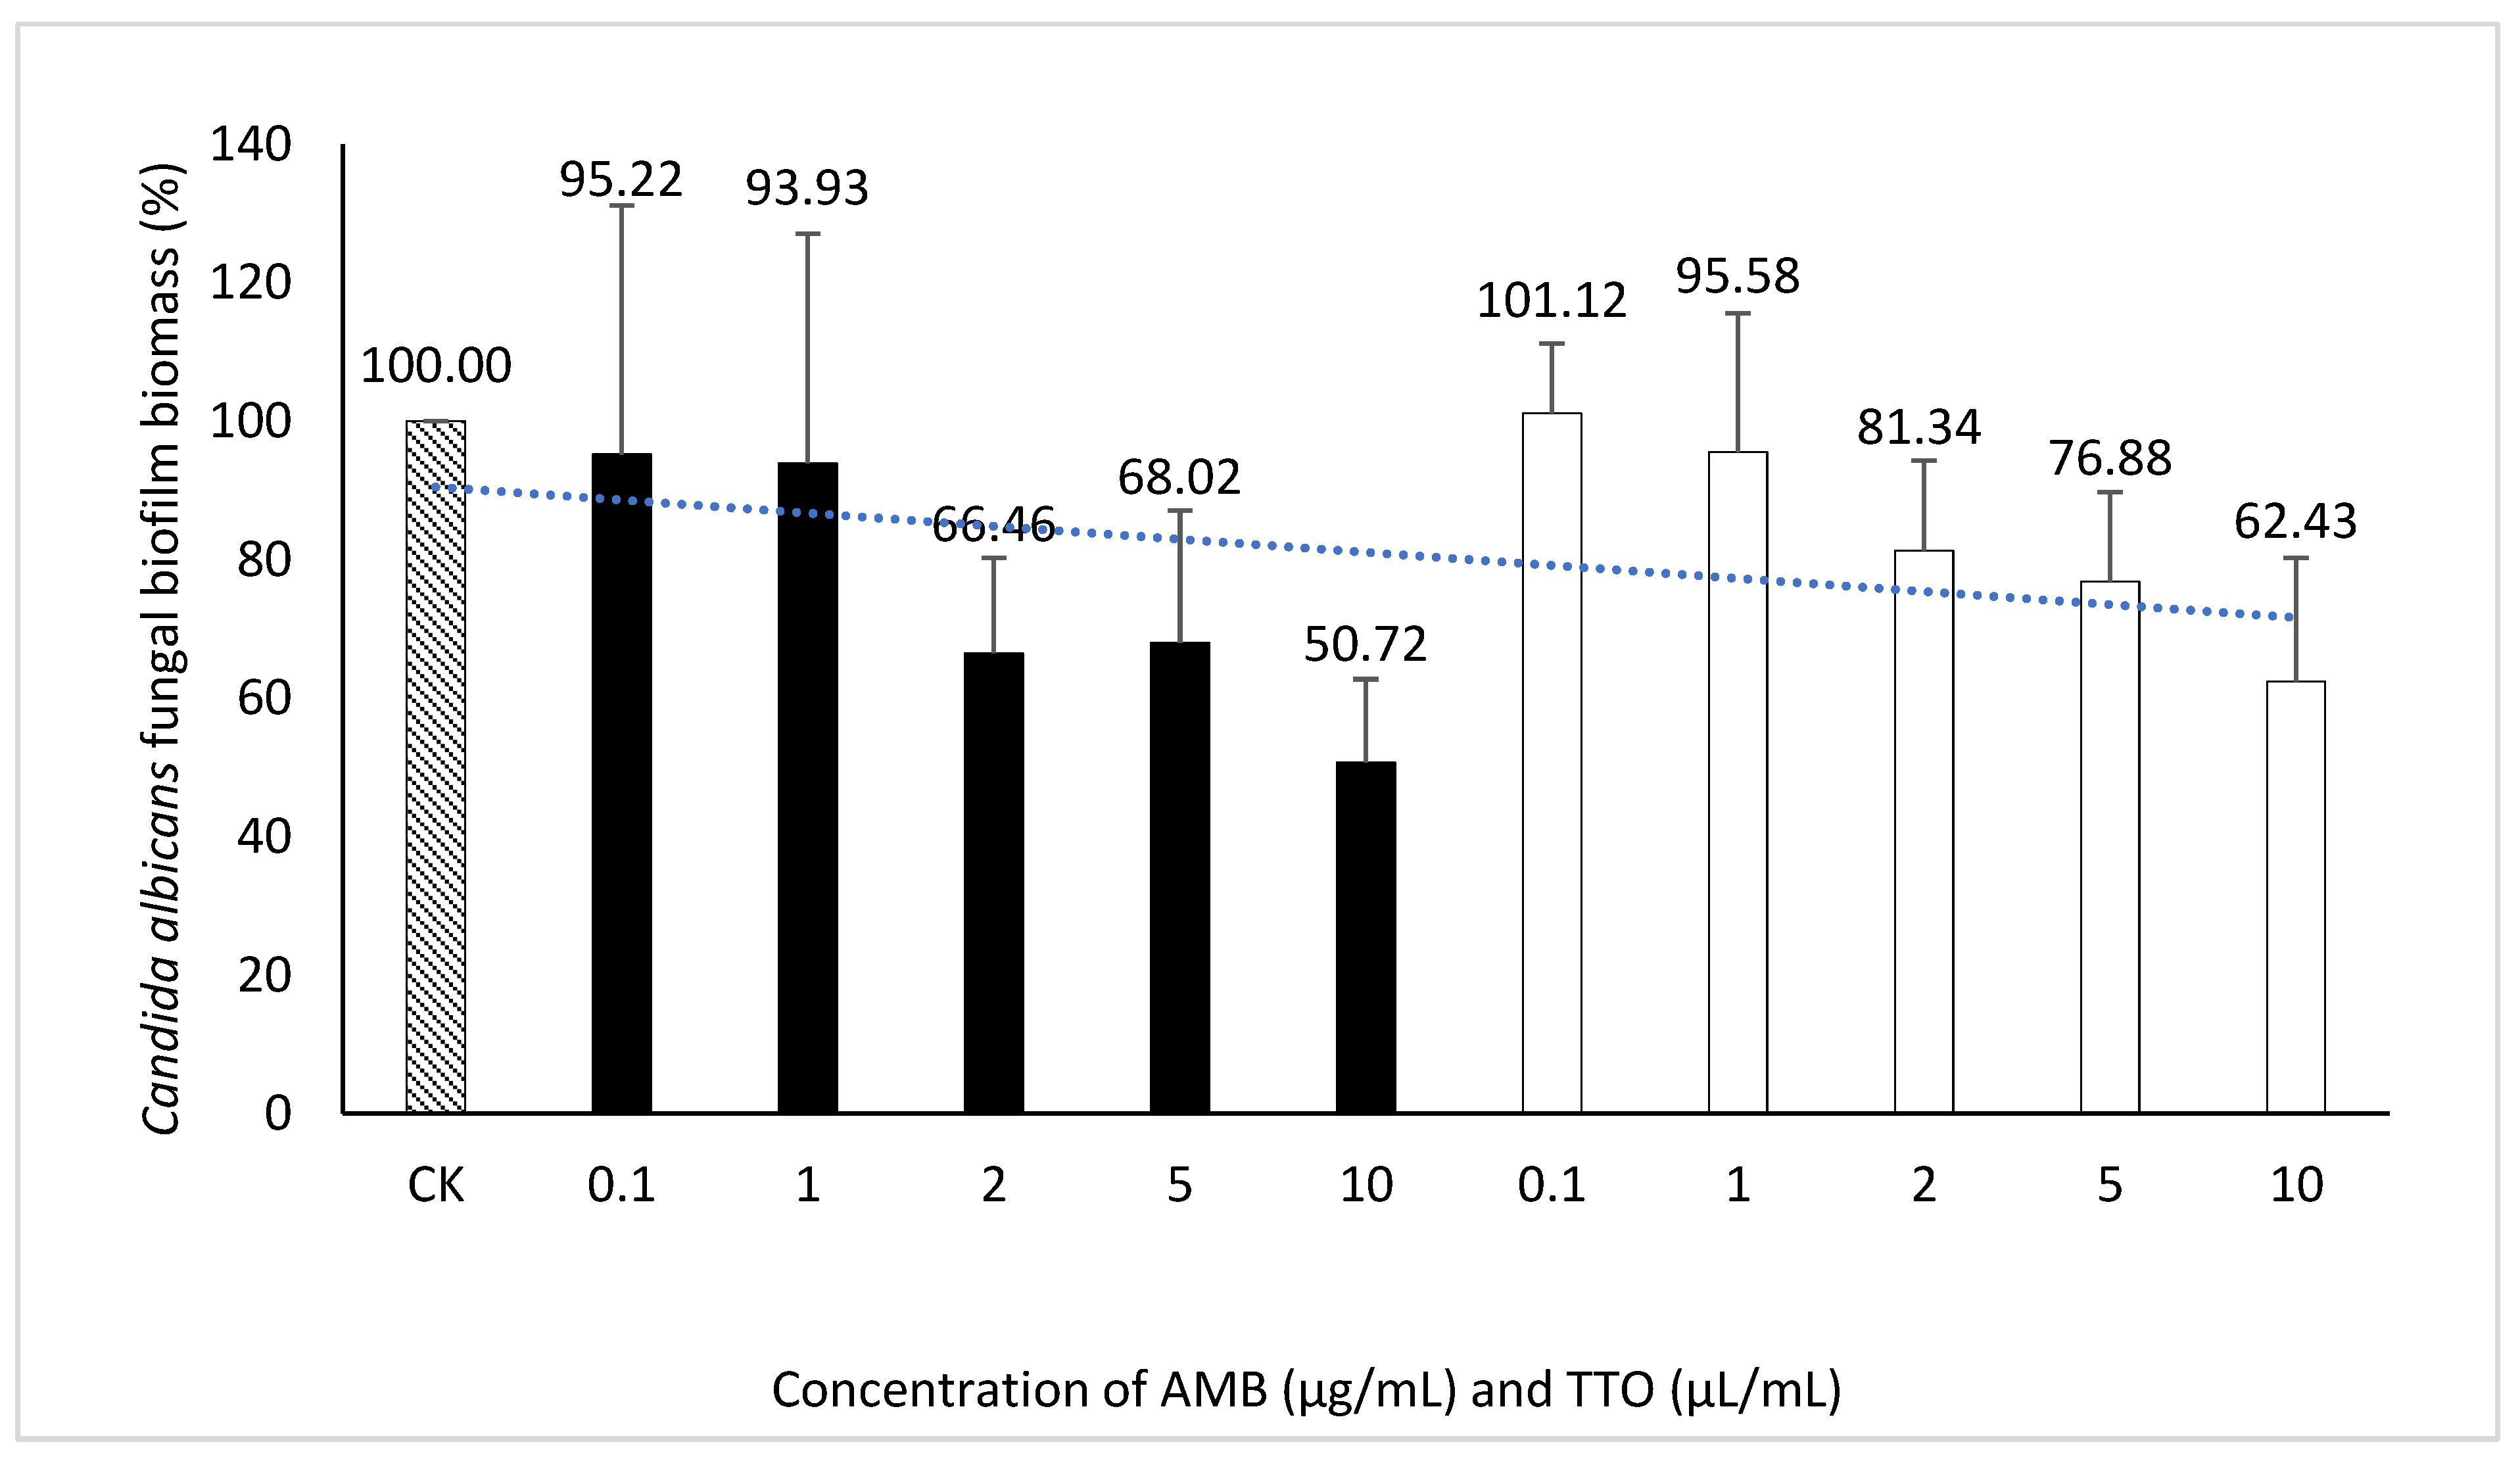
Exploring the inhibitory impact of TTO on Candida albicans biofilm formation. The outcomes presented above provide the basis for the selection of an optimal biofilm-forming environment for Candida albicans in this experiment. Consequently, the "Hansen medium supplemented with 2.5% glucose (w/v)" has been chosen as the experimental condition for biofilm formation. This choice is informed by its superior biofilm-forming capability compared to the other conditions investigated. The trial was carried out concurrently with four parallel samples. The outcomes were assessed using two metrics: MBIC, presented in Figure 6 and Table 4, and MBEC, as demonstrated in Figure 7 and Table 4.
Table 4.
The MBIC and MBEC values for the antifungal agent AMB and TTO were determined in this study.
Table 4.
The MBIC and MBEC values for the antifungal agent AMB and TTO were determined in this study.
| Bioactive compounds |
MBIC |
MBEC |
| AMB |
2 /mL |
- |
| TTO |
2 /mL |
- |
Regarding the MBEC, the findings depicted in Figure 7 reveal an incremental trend in the eradication capacity of pre-formed Candida albicans biofilm with rising concentrations of the bioactive agents (AMB and TTO). However, neither AMB nor TTO exhibited a specific MBEC value, as the biofilm mass at all tested concentrations surpassed 50% when compared to the untreated control. In essence, the biofilm eradication efficacy of both bioactive compounds remained below 50%, precluding the determination of a definitive MBEC value. At a concentration of 10 μg/mL, AMB eradicated only 49.28% of the Candida albicans biofilm mass, while for TTO treatment at the highest concentration of 10 μL/mL, the reduction in biofilm mass after 24 hours of pre-culture was recorded at 62.43 ± 17.82% compared to the untreated control.
Figure 6.
Suppression of Candida albicans biofilm formation by AMB and TTO at different investigated concentrations (following MBIC).
Figure 6.
Suppression of Candida albicans biofilm formation by AMB and TTO at different investigated concentrations (following MBIC).
Figure 7.
Inhibition of Candida albicans biofilm formation by AMB and TTO at different test concentrations (following MBEC).
Figure 7.
Inhibition of Candida albicans biofilm formation by AMB and TTO at different test concentrations (following MBEC).
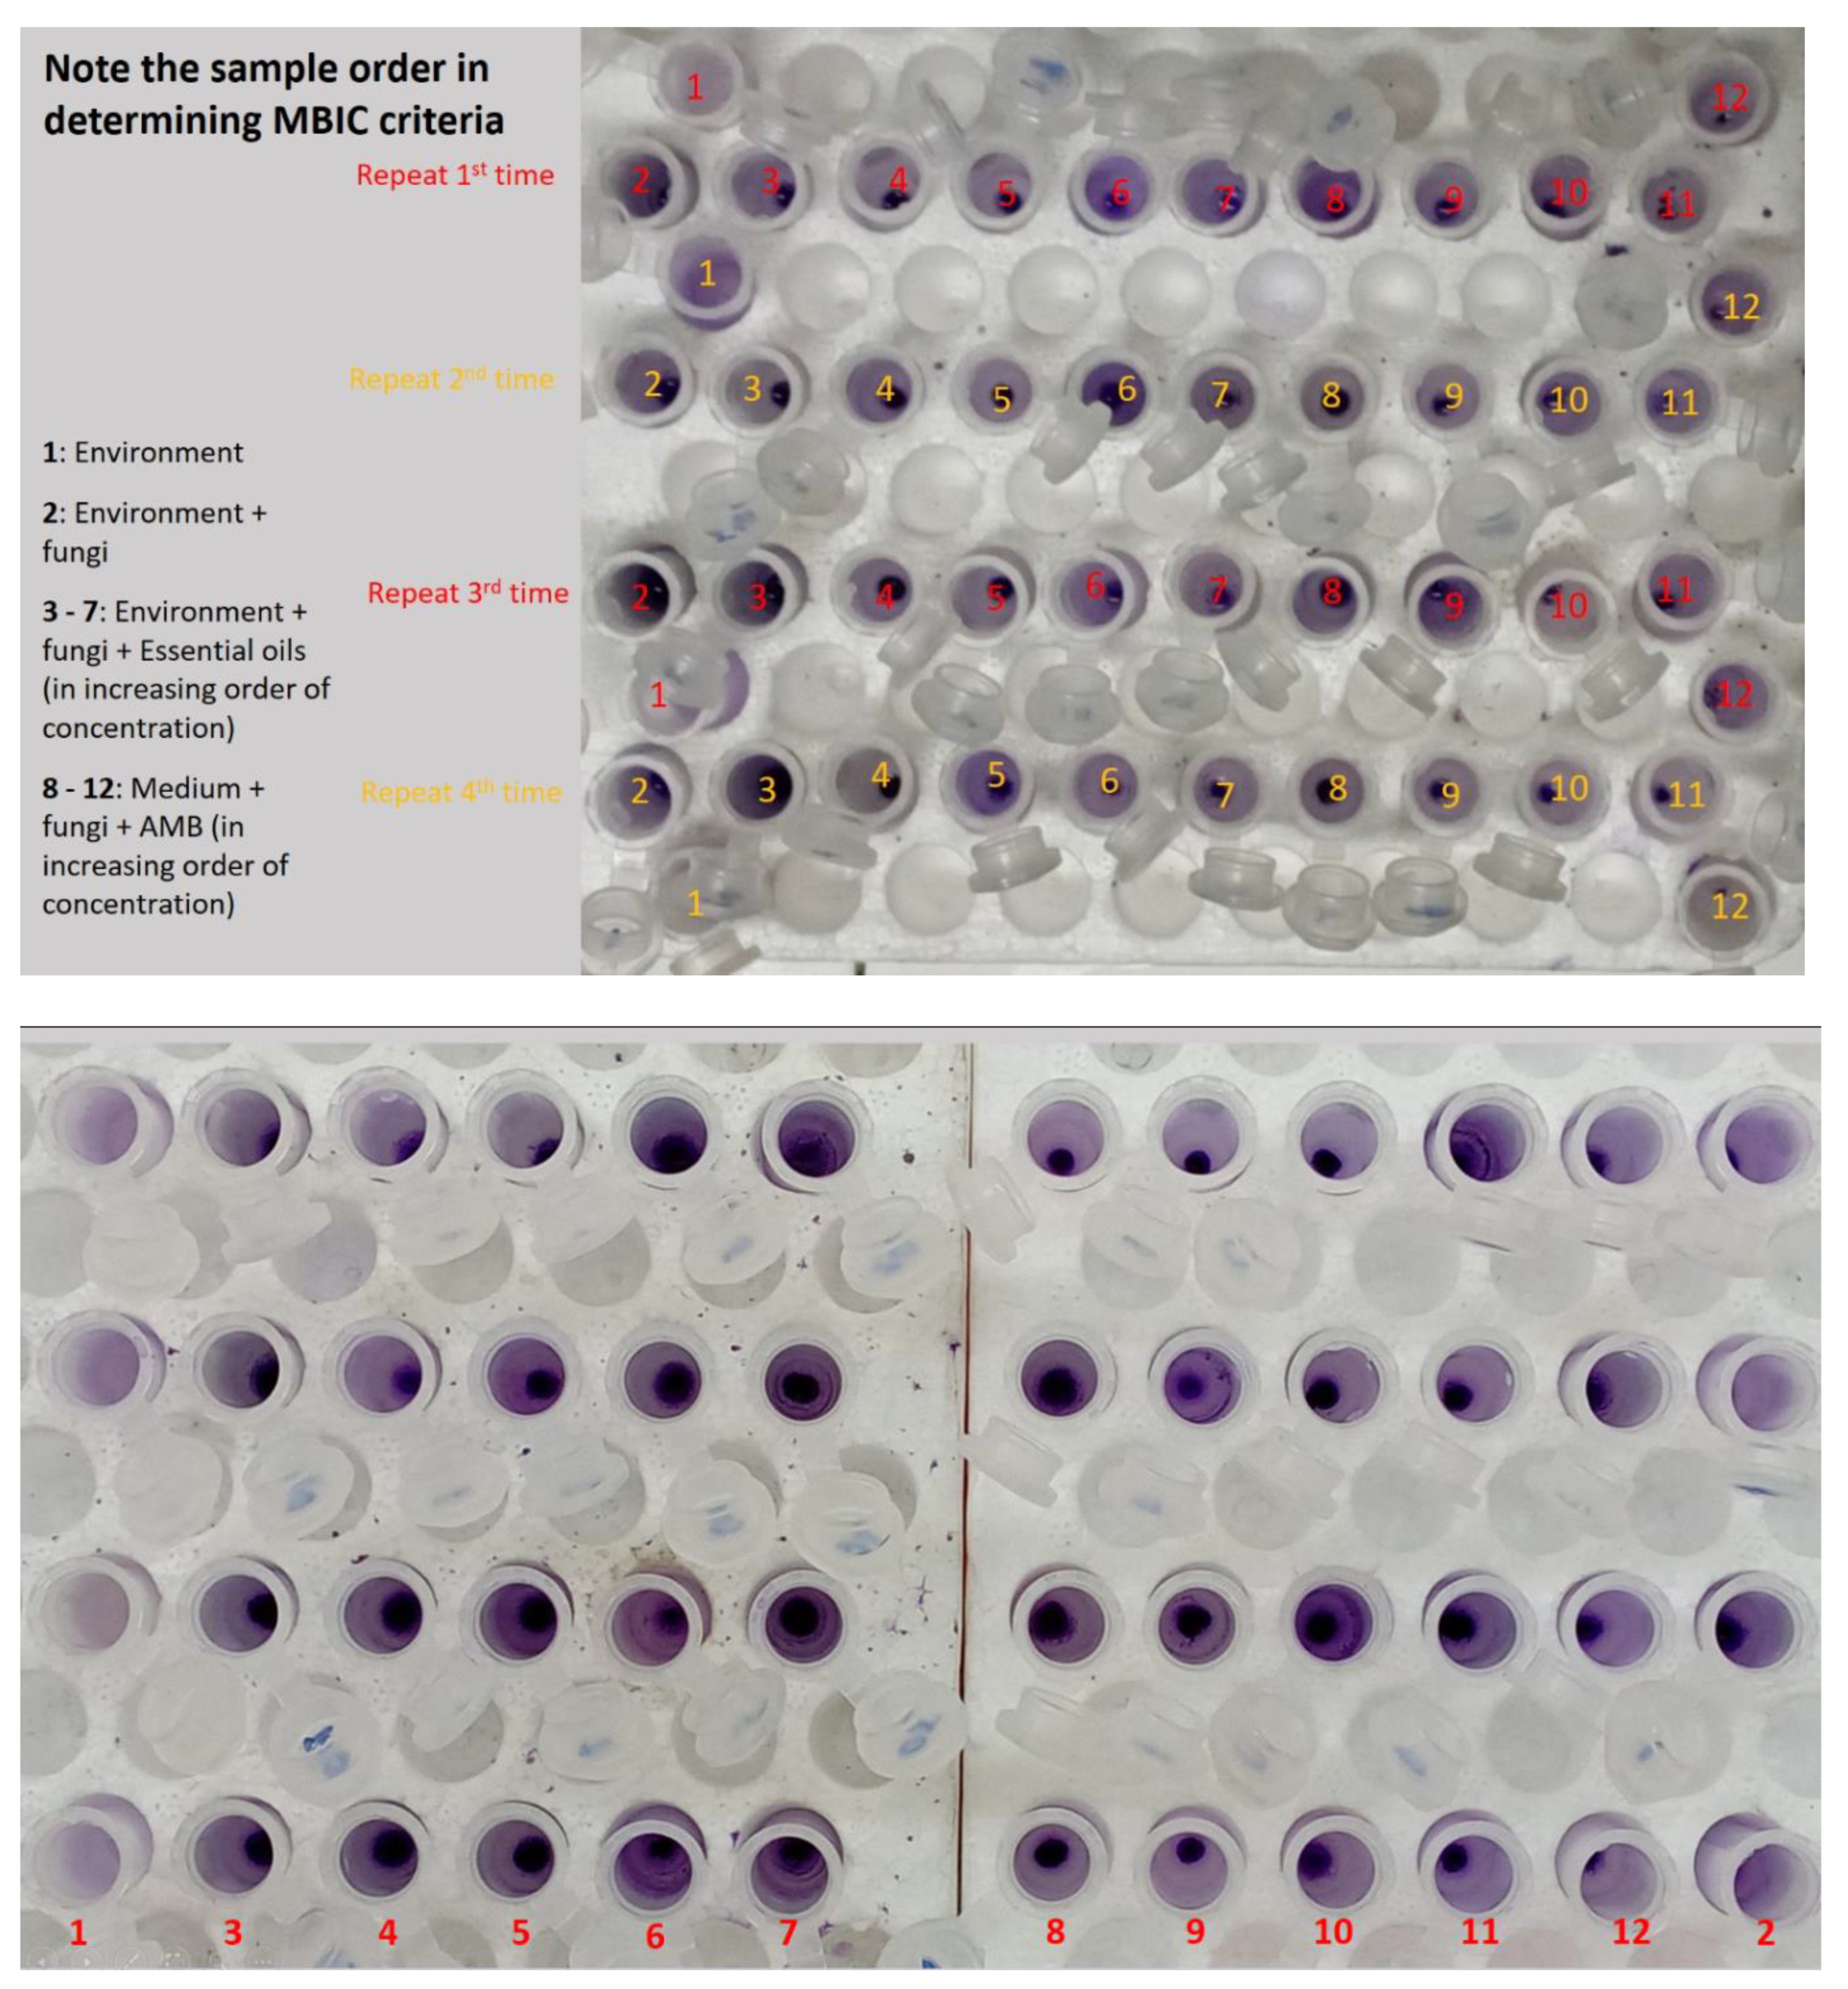
Figure 8.
Biofilm image of Candida albicans to determine MBIC and MBEC. (a) MBIC; (b) MBEC (the note-taking is similar to the MBIC).
Figure 8.
Biofilm image of Candida albicans to determine MBIC and MBEC. (a) MBIC; (b) MBEC (the note-taking is similar to the MBIC).
4. Discussion
Investigation of the antifungal activity against Candida albicans of TTO. The experiments demonstrated that adding sterile distilled water containing 0.5% Tween 80 to Mueller-Hinton medium promotes the growth of
Candida albicans, as opposed to the medium without this supplementation. This observation is consistent with the findings of Carson and Riley, who suggested that Tween 80 serves as a stimulant due to its oleic acid content [
42]. Consequently, the Mueller-Hinton medium supplemented with sterile distilled water containing 0.5% Tween 80 is designated as the negative control for comparison with samples treated with the antifungal agent AMB and TTO.
The MIC of TTO against
Candida albicans was found to be 0.1 μL/mL (91.217 μg/mL) in our study. However, other studies, such as Thosar et al. (2013) [
43], reported a MIC of 0.5 μL/mL for
Candida albicans. Rosato et al. (2008) [
44] demonstrated MIC values ranging from 1.75 to 3.5 mg/mL for various
Candida strains treated with TTO. In contrast, Oro et al. (2015) [
45] reported a lower average MIC of 20.02 μg/mL for
Candida albicans when exposed to TTO. These variations suggest differing sensitivities among
Candida albicans strains.
MFC values for TTO against
Candida albicans exhibit variability among studies. Oro et al. (2015) reported an MFC of 25.33 μg/mL [
45], while Francisconi et al. (2015) found it to be 0.25% TTO [
8]. Noumi et al. (2011) observed different MFC values across
Candida albicans strains, ranging from 5 to >10 mg/mL [
46]. This variation highlights the diverse sensitivity of
Candida albicans strains to TTO, mirroring trends seen in MIC values.
In terms of mechanism, AMB acts by creating pores in the fungal cell membrane, altering permeability, and causing cell death. TTO is thought to penetrate the cell wall and plasma membrane of Candida albicans, disrupting these structures and leading to cell leakage due to its lipophilic nature.
TTO analysis identified eucalyptol (or 1,8-cineole) as the predominant component, comprising 29.41% of the oil. Other notable constituents include terpinolene (8.63%), γ-terpinene (7.92%), α-terpineol (5.67%), and various trace components. The antifungal efficacy of TTO is attributed to the presence of 1,8-cineole, which has been shown in studies to enhance fungal cell membrane permeability [
47,
48]. This facilitates the penetration of other oil components into the cells, influencing internal cellular processes [
47].
Investigation of Candida albicans biofilm formation. The study conducted by Brambilla et al. (2015) revealed an increased biofilm formation of
Candida albicans with the rising percentage of D-glucose in the Trypticase-Soy broth (TSB) medium, ranging from 1.25 to 10% (w/v) [
49]. This finding contrasts with the survey results, given the varying glucose concentrations in the growth media used for
Candida albicans biofilm formation. Specifically, TSB medium contains 2.5 g/L of glucose, while Hansen medium boasts a glucose concentration of up to 50 g/L. Consequently, this discrepancy may have impacted
Candida albicans' biofilm formation in the study, leading to a tendency of reduced biofilm formation in NT2 and NT3 due to the exceptionally high sugar content in the experimental environment, inadvertently resulting in inhibitory effects on
Candida albicans.
Investigating the inhibition of Candida albicans biofilm formation by TTO. The study found a MBIC of the antifungal agent AMB at 2 μg/mL (
Figure 6). Zarei et al. (2014) investigated MBIC on 120
Candida albicans strains, revealing that 65% of them had an MBIC below 10 μg/mL, indicating the overall sensitivity of
Candida albicans strains to AMB. The observed MBIC of 2 μg/mL aligns with the known effectiveness of AMB in inhibiting
Candida albicans biofilm formation under in vitro conditions [
50].
For the TTO-treated sample, the investigation identified an MBIC value of 2 μL/mL (
Figure 6). The diverse terpenes present in tea tree oil modify cell membrane permeability by infiltrating between the fatty-acyl chains of the cell membrane bilayer. This induces changes in membrane permeability, leading to alterations in cell surface and morphology and diminishing adhesion capabilities to
Candida albicans' substrate [
51]. This contributes to the observed reduction in biofilm formation of
Candida albicans when treated with TTO.
The absence of recorded MBEC values for both biological agents (AMB and TTO) in the survey (Table 4) may be attributed to the tea tree oil concentration examined not being sufficiently high to disrupt more than 50% of the pre-cultured biofilm mass within 24 hours. At the highest concentration of tea tree oil in the survey (10 μL/mL), it was observed to disrupt 37.57% of the Candida albicans biofilm mass compared to the untreated sample, as indicated in Figure 7.
There are key limitations to consider in our study interpretation. Firstly, our focus was solely on tea tree oil's antifungal and biofilm inhibitory effects on Candida albicans, without comparison to other treatments or examination of its long-term impact. Secondly, our testing methods may not reflect real-world conditions accurately. Thirdly, the study used only one Candida albicans (ATCC 24433) strain, potentially limiting generalizability. Fourthly, we didn't address the purity of the tea tree oil used, which could affect results. Finally, synergistic effects with other antifungals weren't explored, potentially impacting effectiveness. Hence, acknowledging inevitable measurement errors is crucial.
