Submitted:
05 September 2024
Posted:
05 September 2024
You are already at the latest version
Abstract
Gastrointestinal parasites (GIP) are diverse parasitic organisms known to have coevolved with bacterial populations inside the gut of mammalian hosts. These helminths produce small molecules, peptides and proteins to evade or fight their hosts' immune systems. Small molecules include polar compounds, amino acids, lipids and carbohydrates. Metabolomics is an emerging field of research recently applied to study helminth infections and host-parasite interactions. This review comprehensively discusses metabolomics studies of small molecules of GIP in animals, providing insights into the available tools and techniques, databases, and analytical software. Most metabolomics investigations employed LC-MS, MS or MS/MS, NMR, or a combination thereof. Recent advancements in metabolomics platforms, including artificial intelligence (AI)-assisted software tools and databases, have propelled helminth metabolomics forward, offering new avenues to explore host-parasite interactions, immunomodulation, and the intricacies of parasitism. As our understanding of helminth metabolomics continues to expand, it promises to unveil novel perspectives and enrich the knowledge of these complex host-parasite relationships.
Keywords:
Gastrointestinal parasites
; Small molecules
; Database
; Metabolomics
; Lipidomics
; Artificial intelligence
1. Introduction
Metabolomics is a powerful technique developed to study metabolites (both endogenous and exogenous) in biological samples or organisms [1]. The metabolome represents all low-molecular-weight metabolites or small molecules in biological samples (such as fluid, tissues, blood, and serum) or an organism, including its cellular products. Metabolomics helps to understand the genotype or phenotype of the biological system at the biochemical level, which has immense applications in health and disease research [2]. Metabolomics relies on two major types of protocols to separate and detect metabolites, namely NMR (nuclear magnetic resonance) spectroscopy and mass spectrometry and their associated subtypes, such as gas chromatography-mass spectrometry (GC-MS), liquid chromatography-mass spectrometry (LC-MS), and capillary electrophoresis mass spectrometry (CE-MS) [2,3]. Compared to conventional methods, all these techniques are high throughput systems that can measure many metabolites.
Metabolomics is a relatively new "omics" approach applied in helminth research with immense potential for identifying metabolites in cells, biofluids (including excretory/secretory products, ESP), tissues, and whole organisms [4]. Gastrointestinal parasites (GIP) have coevolved with their hosts for millennia [5]. The host and the parasite have competed for available energy resources and metabolic building blocks throughout this period, significantly impacting each other's metabolic homeostasis [4,6]. Consequently, it is not surprising that parasitic helminth infections were among the first experimental models to which metabolomics was applied. Historically, parasitic helminths’ biological and molecular complexities have posed challenges to therapeutics and diagnostics research. However, the emergence of "omics" technologies has enabled a deeper understanding of parasites at a systems biology level, which is crucial for advancements in preventing and treating helminth infections [7].
Different types of metabolomics workflow are applied based on the choice of experimental approaches (targeted versus untargeted approach) [8]. Unlike the targeted approach, the untargeted study generates more complex data requiring advanced computational methods, such as AI (artificial intelligence) and ML (machine learning) algorithms, to process and interpret data. Advanced AI platforms have been crucial tools in processing and analysing complex untargeted metabolomics data [9,10] , as they can eliminate background noise in peak identification, alignment, and normalisation [10]. Typically, ML algorithms are used to build mathematical models from a data set in a series of steps [10,11]. It has offered countless opportunities, including early disease diagnosis [12], reviewed in-depth by Galal et al. [10]. Thus, the integrated AI-assisted metabolomics technique has helped address many issues with which metabolomics alone cannot.
In this review, we retrieved published metabolomics studies on small molecules from various gastrointestinal parasites, sourcing data from databases such as PubMed, MEDLINE Ovid, Scopus, Google Scholar, and Web of Science. To retrieve relevant literature, we used the following keywords: `metabolomics techniques,’ `lipidomics,’ `targeted metabolomics,’ `untargeted metabolomics,’ `small molecules,’ `helminths-derived small molecules,’ `host-parasite communication,’ `metabolites,’ `lipids,’ `excretory and secretory products,’ and gastrointestinal parasites names. We summarized the AI-assisted metabolomics techniques, databases, and analytical software used for studying various gastrointestinal parasites of animals.
2. Gastrointestinal Parasite Interaction with Animal Hosts Using Small Molecules
Gastrointestinal parasites interact with their host in different ways to survive inside the host or to complete their life cycle [13]. Adult parasites, as well as those in the developmental cycle, excrete/secrete (ES) various small molecules and metabolites to manipulate the host’s immune system [14]. There is a growing interest in how these small molecules and other metabolites and molecular cues intricately communicate with intercellular crosstalk. For instance, helminth-derived ES products (ESP) can activate dendritic cells (DCs), leading to the development of Th2 (T helper type 2) cells and Treg (regulatory T) cells. These cells help the parasite evade immune detection and ensure survival (Figure 1). Short-chain fatty acids (SCFAs) like acetate, butyrate, and propionate, which are not produced by the host but by commensal bacteria, play a role in promoting Treg cells [15] (Figure 1). Hence, dysbiosis can disrupt this pathway, leading to pathogenic outcomes [16,17]. Interestingly, helminths can also synthesise these compounds [18] and promote commensal bacteria, increasing SCFAs production (Figure 1) [19]. Octadecanoic acid from the Nippostrongylus brasiliensis infective larval stage (L3) helps lyse host red blood cells, like its role in Haemonchus contortus [5,20]. Succinic acid in the ESP of adult N. brasiliensis, can induce intestinal tuft cells to initiate Th2 responses and serve as an energy source during anaerobic adaptation [5,21]. Other small molecules include prostaglandins (PGs), such as PGD2 and PGE2, produced by Brugia malayi (filarial parasites) [22] and Onchocerca volvulus [23] and by Schistosoma mansoni (cercariae stage) [24]. One recently explored host-helminth interaction method uses extracellular vesicle (EVs) microRNAs to influence the host immune system [25]. For example, microRNAs secreted by Schistosoma mansoni (e.g., sma-microRNA-10) can manipulate the NF-κB pathway to influence the fate of host T-cells. Schistosoma species like S. mansoni produce over 200 miRNAs [26], and a detailed discussion of this subject is beyond the scope of the current review.
3. Metabolomic Techniques Used for Studying GIP Isolated from Animal Hosts
An analysis of the available literature on GIP metabolomics highlights the diverse range of analytical and identification tools utilized (Table 1). The most commonly employed techniques include liquid chromatography-mass spectrometry (LC-MS), gas chromatography-mass spectrometry (GC-MS), capillary electrophoresis mass spectrometry (CE-MS), and nuclear magnetic resonance spectroscopy (NMR) [3]. Additionally, some studies have utilized advanced techniques such as Raman and Fourier transform infrared (FTIR) spectroscopies, atmospheric pressure matrix-assisted laser desorption/ionization mass spectrometry imaging (AP-SMALDI MSI), ultrahigh-performance liquid chromatography-mass spectrometry (UHPLC/MS), and high-resolution mass spectrometry (HRMS). The LC-MS is a widely used analytical technique in global metabolite profiling. LC-MS is even better when high-resolution accurate mass (HRAM) detection is applied [27-29], as it can detect and identify a broader range of metabolites in quantity and physicochemical properties [30]. However, we came across only one study using an HRAM detector, whereby Ferreira et al. [31] identified 20 lipids from the life cycle (eggs, miracidia, and cercariae) of S. mansoni. Out of 28 metabolomics studies (Table 1), the maximum number of studies (eight) used UHPLC/MS.
Unlike HPLC, the column used in the UHPLC has a particle size of ≤2 μm, allowing more flexible and efficient separation owing to high back pressure [32]. GC-MS is the second most used technique with six studies (Table 1). For instance, ESPs of adult Trichuris muris and Nippostrongylus brasiliensis were analysed (targeted) for their metabolites using GC-MS [33,34]. However, one of the disadvantages of using GC-MS is that often derivatisation of analytes is required to enhance the resolution and sensitivity [35]. Moreover, GC-MS is relatively slow and large, and thermally-unstable analytes are not suitable for analysis using this technique [35], and more about this technique has been reviewed elsewhere [36-38]. Metabolomics studies using NMR are rapid and non-destructive, and no derivatisation is required, unlike GC-MS [35]. Metabolites of Echinococcus multilocularis (metacestode larval stage) and adult N. brasiliensis ESP were analysed using proton NMR (H1NMR) [39,40]. NMR is also not ideal for sensitivity, and it gives convoluted spectra and often more than one peak per component [35]. Recent publications by Whitman et al. [41] and Kokova and Mayboroda [42] have provided an excellent review of GC-MS and NMR methodologies and their applications in helminths metabolomics, respectively.
Matrix-assisted laser desorption/ionisation-MS imaging (MALDI-MSI) is often used in metabolomics studies [43,44]. Three studies analysed (both targeted and untargeted) somatic extracts of Schistosoma mansoni using MALDI-MSI (Table 1) [43-45]. One of the advantages of the MALDI technique, such as atmospheric pressure-SMALDI-MSI (AP-SMALDI-MSI) over the classical LC-MS-based lipidomic method, is that the spatial distribution of a wide variety of compounds can be determined immediately from the tissue in a semi-quantitative manner. Kadesch et al. [45] performed the untargeted analysis of the tissue- and sex-specific lipids of adult S. mansoni using AP-SMALDI-MSI and identified 320 lipids (Table 1). However, some isobaric lipid species (possessing exactly or nearly the same mass), like phosphatidylethanolamines (PEs) and phosphatidylcholines (PCs), are not easily discriminated based on MSI data and must be identified using fragmentation experiments [45]. The MALDI platform is more commonly applied to analyze polymer samples [46,47], but in metabolomics, it reveals metabolite distribution in a tissue sample [48]. The mass spectrometry with electrospray ionization (ESI) efficiency scales in both positive and negative modes unified in a single system has enabled comparative analysis of IE values across ionisation modes [49].
Many metabolomics studies prefer LC coupled with MS/ESI(+/-) since more compounds are expected to ionise in the positive mode. Moreover, negative mode (ESI –) reduces background noise [50,51]. Lipidomics analysis of somatic tissue extract of S. mansoni [52], Trichinella papuae [53], and Haemonchus contortus [54] have applied both positive and negative ESI modes (Table 1) and identified more than 1000 lipids. However, there is a lack of proper guidelines on which ESI mode to proceed when compound(s) ionise in both modes [49]. One of the main challenges in helminth metabolomics is to confirm the definite source of metabolites, as it can be influenced by multiple factors, including the host, strains, sex of helminths, isolation timing of metabolites from the host apart from different technical platforms, and experimental conditions applied [55]. Metabolomics in helminths is still an emerging field of science, and methodologies, techniques, software, and bioinformatics tools are evolving.
4. Different Metabolomics Study Approaches and Metabolite Identification Levels
4.1. Approaches
Metabolomics studies generally employ three methods to analyse metabolites: untargeted, targeted, and metabolic fingerprinting [70]. This review focused on the first two approaches (Figure 2). Metabolic fingerprinting (exometabolomics) examines extracellular metabolites produced in response to biotic or abiotic stresses [71,72]. Of the 28 metabolomics studies in Table 1, 16 used targeted, 11 used untargeted methods, and only one focused on metabolic fingerprinting [59]. Metabolic fingerprinting was performed using either NMR, FT-IR or MS [35]. For example, the metabolic fingerprinting of A. lumbricoides by Melo et al. [59] was conducted using high-resolution mass spectrometry (HRMS), in which nine biomarkers were identified from eggs and L1 and L2 larval stages. Like protein-based antigens, small molecule biomarkers can guide the development of diagnostics to detect helminth infection. Yeshi et al. [33] analysed metabolites of T. muris and N. brasiliensis infective stages with the highest resolution mass spectrometry (Q-Exactive Orbitrap MS).
Of the three major approaches, the targeted approach is widely used in metabolomics, as it can precisely quantify the known metabolites, although it has low detection limits [35]. In targeted metabolomics, methods are established using standard metabolites. Method standardisation is followed by sample preparation and metabolite extraction from somatic tissue extracts or ESP. Samples are analyzed, and the data output quantifies those metabolites where standards are available or for which standard methods are established. One of the limitations of targeted analysis is that the standards should be available in purified form for spiking or developing an in-house compound spectra library [73]. Since compound standards are limited in numbers, and many are expensive, developing an in-house standard library is often impossible. Another disadvantage is that discovering novel metabolites is difficult since the targeted approach only identifies targeted metabolites.
Untargeted analysis requires complex bioinformatics or computational methods, including various AI-based algorithms, and most of the detected peaks are not identifiable. In untargeted metabolomics, metabolites/lipids are initially extracted from the sample (somatic/ESP) and subsequently analysed by analytical instruments (e.g., LC-MS and GC-MS). Acquired LC-MS/GC-MS data are in three dimensions (3D), the mass-to-charge ratio (m/z), retention time (rt), and abundance. Artificial intelligence (AI)/ML is applied at this stage to transform a large amount of complex spectral data into smaller sets of features that can be further statistically analysed. An open-source IDEOM software [33,74] is commonly used to pre-process raw data (3D) into 2D format with aligned peak values (m/z and rt) and peak intensity/abundance. An IDEOM [75,76] is an Excel template that provides a graphical user interface (GUI) for mzMatch and XCMS data.
Following the pre-processing stage, putative identification of metabolites is achieved by searching the m/z values for the peaks of interest in metabolite databases, which are discussed in the following sections. Other open-source algorithms used for pre-processing are MZmine 2 [77], MetAlign [78], and MS-Dial [79], but none of these algorithms are yet accepted as standard/ideal algorithms in metabolomics. Few recent studies have highlighted the presence of false positives and low-quality peaks because of poor integration in many processed metabolomics data, which may affect the downstream statistical analyses [72,80].
Consequently, quality control (QC) measures have been incorporated into metabolomics studies to improve data quality and reliability. One such example is pooling a small volume from all samples (pooled QC) as applied in the metabolomics study of N. brasiliensis and T. muris infective stage [33]. Taking a pooled QC may remove false positives, but there is also the risk of getting some correct features removed. Moreover, it is also challenging to discriminate between true and false positives while analysing complex samples with higher risks of contamination (>50%) [81]. Therefore, advanced AI/ML-driven algorithms for peak-picking and filtration, such as comprehensive peak characterization (CPC) algorithm [82], MetaClean [83], NeatMS [84], and NPFimg [85], are available, and these algorithms are discussed in-depth elsewhere [9,10].
In both targeted and untargeted analysis, the types and numbers of metabolites identified depend on multiple factors, including sample preparation, quantification level, experimental objectives and conditions applied, accuracy and precision, and the number of metabolites detected [86]. A valid basis for identifying and characterizing metabolites is still debated, and the consensus is continuously evolving. Shulaev has reviewed the advantages and limitations of different metabolomics approaches in detail [35].
4.2. Metabolite Databases and Metabolite Identification Levels
4.2.1. Metabolite Databases
This stage of metabolomics study is the most critical step, and it often relies on various metabolite databases and spectral libraries that may contain both in silico and experimental spectra, including the human metabolome database (HMDB) [87], MassBank [88], the Metabolite and Tandem MS Database (Metlin 2) [89], global natural product social molecular networking (GNPS) [90], MetaCyc [91], and others (Table 1). Both spectral and structural databases in metabolomics that appeared in 2020 are reviewed by Misra [92]. HMDB [93], the Metlin MS 2 [94], the in-house Metabolomics Australia Metabolite Library (MAML), the Mass Hunter Library (MHL), and the NIST library (Table 1) are the most widely used databases in GIP metabolomics studies.
The Metabolite and Tandem MS Database (Metlin MS 2) and HMDB are the primary databases that identify polar metabolites. For example, the Metlin MS 2 database has more than 85,000 MS/MS compound spectra in positive and negative ionization modes, constituting over 4,000,000 curated HR-MS/MS data, approximately 1% of PubChem’s compounds [95]. For non-polar metabolites/lipids identification and pathway analysis, the LipidMAPS structure Database is widely referred to (Table 1) as it contains about 30,000 human endogenous lipids and 12,000 plant lipids and lipid metabolism and pathways based on MS/MS spectra [96]. Popular databases such as Kyoto Encyclopaedia of Genes and Genomics (KEGG) [97] and MetaCyc [97] are used to determine metabolic pathways. Although the two databases are quite similar regarding the number of reactions occurring in pathways, MetaCyc contains a broader set of databases, enabling relationships between compounds and enzymes, spontaneous identification of reactions, and the expected range of pathways. Their comparative features have been described elsewhere [98].
There are a few molecular databases for helminths, including WormBook (http://www.wormbook.org/), WormBase (https://wormbase.org//#012-34-5), and Wormatlas (https://www.wormatlas.org/). However, these databases primarily focus on the biological aspects, including biochemistry, genomics, and proteomics of the model nematode Caenorhabditis elegans. They do not specifically cater to GIP. While C. elegans is a free-living nematode, parasitic nematodes are infectious and live inside their animal or plant host, so their metabolic pathways and metabolome compositions are expected to differ. Since there are no helminth-specific small molecule databases, there is an urgent need for a single repository.
GIP hosts-specific metabolome or animal tissue-derived metabolites databases are very scarce. The animal metabolite database (AMDB, https://amdb.online) [99] and the livestock metabolome database (LMDB, https://lmdb.ca) [100] are examples of existing animal metabolome databases. Unlike HMDB, these two databases contain less metabolite information from the limited number of animal species. The AMDB contain only 168 metabolites from 50 animal species [99], while the LMDB contains slightly more metabolites, including 768 from bovine, 412 from porcine, 285 from ovine, 167 from caprine, and 109 from equine [100].
4.2.2. Metabolite Identification Levels
The metabolite identification protocol proposed by the Chemical Analysis Working Group (CAWG) was the most widely applied in all metabolomics studies of GI helminth. The CAWG established the Metabolomics Standards Initiative (MSI) in 2005, following earlier efforts to standardize metabolic reporting [101]. This working group identified four different levels of metabolite identification: MSI-level 1 to MSI-level 4 [102]. MSI-level 1 reports metabolites whose mass and retention time matched with internal standards. MSI-level 2 identification is putative and shows only probable structure acquired via fragmentation data from the literature, libraries, and databases. MSI-level 3 reports only putatively characterized compound classes, and MSI-level 4 reports only unknown compounds [103]. In MSI-levels 2, 3, and 4 identifications, there is no requirement to match data with authentic standards, and instead, mass and ion fragmentation patterns are compared to the available compound libraries or databases.
More detailed criteria for different identification confidence levels in HRMS-based metabolomics analysis can be found in Schymanski et al. [104]. Maximum studies, i.e., 19 out of 28, level 1 identification of metabolites (Table 1). The rest of the studies achieved only level 2 identification. Yeshi et al. [33] recently reported 55 polar metabolites through MSI-level 1 identification from the infective stages of T. muris and N. brasiliensis using HRMS (Q-Exactive Orbitrap MS/HPLC). Additionally, 322 lipids were putatively (MSI-level 2) identified. Wangchuk et al. [21] also identified 51 metabolites (35 polar and 16 lipids) from the adult ESP of T. muris via targeted analysis using GC-MS, of which 17 compounds were associated with various pharmacological properties. Many metabolomics studies reported putative metabolites and rarely compared their data with authentic standards due to the unavailability of these standards [103]. With the growing number of metabolomics studies and the revolution in metabolomics techniques and technologies (discussed below), greater opportunities exist for achieving higher identification rates.
5. Artificial Intelligence (AI)-Assisted Software and Statistical Tools for Metabolomics Data Analysis
The software and the statistical tools used in metabolomics studies largely depend on mass spectrometry and spectroscopy analytical platforms used for running samples, processing the raw spectra, analysing the masses, and identifying the molecules. The whole helminth metabolomics process can be achieved in four general steps: (i) raw data acquisition, (ii) pre-processing, (iii) post-processing, and (iv) statistical analysis and result interpretation [105]. Raw data are obtained as chromatograms (liquid chromatography), mass spectra (mass spectrometry), or NMR data. Raw data must go through pre-processing before they are further analysed.
Pre-processing usually involves alignment, binning, normalisation, and scaling processes to minimise analytical errors, reduce data points, and bring data in alignment with subsequent statistical assumptions [42]. For instance, in mass spectrometry, before pre-processing, MS data has to be converted into an open format, such as mzML, mzXML, and netCDF [105]. A recent review by Misra [92] on metabolomics tools that appeared in 2020 reported six different software tools applied in pre-processing the LC-MS/MS data. The open-source cross-platforms MAVEN [106] and MZmine 2 [107] and open-source software IDEOM [75] are a few other examples that Misra did not report. Software tools such as MetaboliteDetector, MET-IDEA, metaMS, MSeasy, and SpectConnect are used with GC-MS; for additional details, refer to the review by Spicer et al. [105]. The XCMS and MeltDB are applicable for pre-processing LC-MS and GC-MS data [108]. Gas chromatography-mass spectrometry uses the NIST database (https://www.nist.gov/srd) for compound identification. Chen et al. [65] used XCMS software to process UHPLC-MS in their metabolomic studies of adult N. brasiliensis (Table 1). IDEOM has automated noise filtering and annotation procedures and can identify metabolites with high confidence levels [75]. Recent metabolomics studies on infective stages of T. muris, N. brasiliensis [33], and N. americanus [64] have applied IDEOM software to process MS data (Table 1).
Before further statistical analysis, metabolomics data must go through post-processing, often called data pre-treatment [105]. At this stage, data usually undergo filtration, imputation, normalisation, centering, scaling, and transformation. According to Armitage et al. [109], up to 40% of metabolomics data may comprise missing values; thus, imputation (i.e., filling in missing values) is required. Normalisation, scaling, and transformation minimise variations in the metabolite concentrations between samples (technical variations) but not necessarily biological variations. Numerous post-processing tools, including those with R language packages and those that are web-based, are discussed in detail in Spicer et al. [105] and Misra [92].
After post-processing, metabolomics data (from MS, LC-MS, or NMR) are analysed statistically, and the selection of tools depends on the study design. Statistical analysis is either supervised (e.g., PLS-DA–partial least squares discriminant analysis and OPLS-DA – orthogonal projections to latent structures discriminant analysis) or unsupervised (e.g., principal component analysis, PCA). Subsequently, various multivariate and univariate statistical tests are performed. Numerous statistical analysis software tools are powered by various programming languages (e.g., Python, R, C/C++, and Java) and web-based tools [92,105]. For example, MetaboAnalyst 6.0 (http://www.metaboanalyst.ca) [110] is a convenient free web-based statistical tool that can perform pre-processing and statistical analysis and generate results for interpretation. Metabolomics data from five different helminth species (A. caninum, N. americanus, N. brasiliensis, T. canis, and T. muris) were analysed using MetaboAnalyst 3.0 (Table 1). MetaboAanlyst 6.0 contains a suite of analytical tools applicable for both MS and NMR data, and it also enables enrichment and pathway analysis and advanced translational studies [105,110].
6. Conclusions
In the gastrointestinal parasites (GIP) metabolomics studies reported so far, most studies (16 out of 28 included) applied a targeted approach, followed by an untargeted approach (11 studies) and only one applied metabolic fingerprinting. One of the limitations of targeted analysis is that the standards should be available in purified form for spiking or developing an in-house compound spectra library. GIP metabolomics data were mainly acquired with liquid chromatography-mass spectrometry (LC-MS), gas chromatography-mass spectrometry (GC-MS), capillary electrophoresis mass spectrometry (CE-MS), and nuclear magnetic resonance spectroscopy (NMR). Very recently, advanced techniques such as Raman and Fourier transform infrared (FTIR) spectroscopies, atmospheric pressure matrix-assisted laser desorption/ionization mass spectrometry imaging (AP-SMALDI MSI), ultrahigh-performance liquid chromatography-mass spectrometry (UHPLC/MS), and high-resolution mass spectrometry (HRMS) have been applied. The Metabolite and Tandem MS Database (Metlin MS 2) and HMDB are the primary databases applied to identify polar metabolites and lipid MAPS databases for lipids.
With the emergence of many artificial intelligence (AI)/machine learning (ML)-assisted software and tools, there has been a significant advance in the helminths’ metabolomics, particularly in untargeted metabolomics, enabling measurements of many metabolites, even at the trace level. Over the past decade, AI/ML advancement has accelerated significant discoveries in metabolomics platforms, taking the quality and reliability of data to the next level. However, ‘omics’ technology has only recently been applied to study small molecules produced by helminths. Even though there are limited metabolomics studies involving helminths, this field is gaining momentum, as many identified metabolites are associated with their immunomodulatory roles during infection or in host-parasite interactions. One of the main bottlenecks in metabolomics studies on GIP is difficulty getting/collecting live worm samples from the hosts/ or host body. The worms must be retrieved from the host body/specific organ as quickly as possible to keep them alive. Apart from WormBook and WormBase databases and a few GIP hosts-specific databases, there are no other molecular databases for GIP, and these databases primarily focus on the model nematode Caenorhabditis elegans and do not specifically cater to other GIPs. Thus, future research should focus on under-studied parasitic helminths and work towards developing a single repository of GIP-specific small molecule databases.
Informed Consent Statement: Not applicable.
Author Contributions
Conceptualization, P.W. and K.Y.; writing—original draft preparation, K.Y.; writing—review and editing, P.W.; funding acquisition, P.W. All authors have read and agreed to the published version of the manuscript.
Funding
This work was funded by the National Health and Medical Research Council (NHMRC) Ideas Grant (APP1183323) to P.W.
Institutional Review Board Statement
Not applicable.
Data Availability Statement
No new data were created or analyzed in this study.
Conflicts of Interest
The authors declare no conflict of interest.
References
- Zakeri, A.; Hansen, E.P.; Andersen, S.D.; Williams, A.R.; Nejsum, P. Immunomodulation by helminths: Intracellular pathways and extracellular vesicles. Front Immunol 2018, 9, 1–21. [Google Scholar] [CrossRef]
- Gowda, G.A.N.; Zhang, S.; Gu, H.; Asiago, V.; Shanaiah, N.; Raftery, D. Metabolomics-based methods for early disease diagnostics. Expert Review of Molecular Diagnostics 2008, 8, 617–633. [Google Scholar] [CrossRef]
- Perez de Souza, L.; Alseekh, S.; Scossa, F.; Fernie, A.R. Ultra-high-performance liquid chromatography high-resolution mass spectrometry variants for metabolomics research. Nat Methods 2021, 18, 733–746. [Google Scholar] [CrossRef] [PubMed]
- Ryan, S.M.; Eichenberger, R.M.; Ruscher, R.; Giacomin, P.R.; Loukas, A. Harnessing helminth-driven immunoregulation in the search for novel therapeutic modalities. PLoS Pathog 2020, 16, 1–20. [Google Scholar] [CrossRef] [PubMed]
- Yeshi, K.; Ruscher, R.; Loukas, A.; Wangchuk, P. Immunomodulatory and biological properties of helminth-derived small molecules: Potential applications in diagnostics and therapeutics. Frontiers in Parasitology 2022, 1. [Google Scholar] [CrossRef]
- Yeshi, K.; Ruscher, R.; Hunter, L.; Daly, N.L.; Loukas, A.; Wangchuk, P. Revisiting inflammatory bowel disease: pathology, treatments, challenges and emerging therapeutics including drug leads from natural products. J Clin Med 2020, 9. [Google Scholar] [CrossRef]
- Preidis, G.A.; Hotez, P.J. The newest ″omics″–metagenomics and metabolomics–enter the battle against the neglected tropical diseases. PLoS Neglected Trop. Dis. 2015, 9, e0003382. [Google Scholar] [CrossRef]
- Newgard, C.B. Metabolomics and Metabolic Diseases: Where Do We Stand? Cell Metab 2017, 25, 43–56. [Google Scholar] [CrossRef]
- Petrick, L.M.; Shomron, N. AI/ML-driven advances in untargeted metabolomics and exposomics for biomedical applications. Cell Rep Phys Sci 2022, 3. [Google Scholar] [CrossRef]
- Galal, A.; Talal, M.; Moustafa, A. Applications of machine learning in metabolomics: Disease modeling and classification. Front Genet 2022, 13, 1017340. [Google Scholar] [CrossRef]
- Dhall, D.; Kaur, R.; Juneja, M. Machine learning: A review of the algorithms and its applications. In Proceedings of the ICRIC 2019; 2020; pp. 47–63. [Google Scholar]
- Zhang, J.D.; Xue, C.; Kolachalama, V.B.; Donald, W.A. Interpretable Machine Learning on Metabolomics Data Reveals Biomarkers for Parkinson’s Disease. ACS Central Science 2023, 9, 1035–1045. [Google Scholar] [CrossRef] [PubMed]
- Loke, P.; Harris, N.L. Networking between helminths, microbes, and mammals. Cell Host Microbe 2023, 31, 464–471. [Google Scholar] [CrossRef]
- Hotez, P.J.; Brindley, P.J.; Bethony, J.M.; King, C.H.; Pearce, E.J.; Jacobson, J. Helminth infections: the great neglected tropical diseases. J Clin Invest 2008, 118, 1311–1321. [Google Scholar] [CrossRef] [PubMed]
- Arpaia, N.; Campbell, C.; Fan, X.; Dikiy, S.; van der Veeken, J.; deRoos, P.; Liu, H.; Cross, J.R.; Pfeffer, K.; Coffer, P.J.; Rudensky, A.Y. Metabolites produced by commensal bacteria promote peripheral regulatory T-cell generation. Nature 2013, 504, 451–455. [Google Scholar] [CrossRef]
- Maslowski, K.M.; Vieira, A.T.; Ng, A.; Kranich, J.; Sierro, F.; Di, Y.; Schilter, H.C.; Rolph, M.S.; Mackay, F.; Artis, D.; et al. Regulation of inflammatory responses by gut microbiota and chemoattractant receptor GPR43. Nature 2009, 461, 1282–1286. [Google Scholar] [CrossRef]
- Trompette, A.; Gollwitzer, E.S.; Yadava, K.; Sichelstiel, A.K.; Sprenger, N.; Ngom-Bru, C.; Blanchard, C.; Junt, T.; Nicod, L.P.; Harris, N.L.; Marsland, B.J. Gut microbiota metabolism of dietary fiber influences allergic airway disease and hematopoiesis. Nat Med 2014, 20, 159–166. [Google Scholar] [CrossRef]
- Tielens, A.G.M.; van Grinsven, K.W.A.; Henze, K.; van Hellemond, J.J.; Martin, W. Acetate formation in the energy metabolism of parasitic helminths and protists. Int. J. Parasitol. 2010, 40, 387–397. [Google Scholar] [CrossRef]
- Zaiss, Mario M. ; Rapin, A.; Lebon, L.; Dubey, Lalit K.; Mosconi, I.; Sarter, K.; Piersigilli, A.; Menin, L.; Walker, Alan W.; Rougemont, J.; et al. The Intestinal Microbiota Contributes to the Ability of Helminths to Modulate Allergic Inflammation. Immunity 2015, 43, 998–1010. [Google Scholar] [CrossRef]
- Ward, P.F. Aspects of helminth metabolism. Parasitology 1982, 84, 177–194. [Google Scholar] [CrossRef] [PubMed]
- Wangchuk, P.; Kouremenos, K.; Eichenberger, R.M.; Pearson, M.; Susianto, A.; Wishart, D.S.; McConville, M.J.; Loukas, A. Metabolomic profiling of the excretory-secretory products of hookworm and whipworm. Metabolomics 2019, 15, 1–15. [Google Scholar] [CrossRef]
- Liu, L.X.; Buhlmann, J.E.; Weller, P.F. Release of prostaglandin E2bymicrofilariae of Wuchereria bancrofti and Brugia malayi. Am. J. Trop. Med. Hyg. 1992, 46, 520–523. [Google Scholar] [CrossRef] [PubMed]
- Brattig, N.W.; Schwohl, A.; Rickert, R.; Büttner, D.W. The filarial parasite Onchocerca volvulus generates the lipid mediator prostaglandin E2. Microbes Infect. 2006, 8, 873–879. [Google Scholar] [CrossRef]
- Ramaswamy, K.; Kumar, P.; He, Y.-X. A Role for Parasite-Induced PGE2 in IL-10-Mediated Host Immunoregulation by Skin Stage Schistosomula of Schistosoma mansoni1. The Journal of Immunology 2000, 165, 4567–4574. [Google Scholar] [CrossRef] [PubMed]
- Ofir-Birin, Y.; Regev-Rudzki, N. Extracellular vesicles in parasite survival. Science 2019, 363, 817–818. [Google Scholar] [CrossRef] [PubMed]
- Zhu, L.; Liu, J.; Cheng, G. Role of microRNAs in schistosomes and schistosomiasis. Front Cell Infect Microbiol 2014, 4, 165. [Google Scholar] [CrossRef]
- Rochat, B. Proposed confidence scale and ID score in the identification of known-unknown compounds using high resolution MS data. J. Am. Soc. Mass Spectrom. 2017, 28, 709–723. [Google Scholar] [CrossRef]
- Gika, H.G.; Theodoridis, G.A.; Plumb, R.S.; Wilson, I.D. Current practice of liquid chromatography-mass spectrometry in metabolomics and metabonomics. J. Pharm. Biomed. Anal. 2014, 87, 12–25. [Google Scholar] [CrossRef]
- Cajka, T.; Vaclavikova, M.; Dzuman, Z.; Vaclavik, L.; Ovesna, J.; Hajslova, J. Rapid LC-MS-based metabolomics method to study the Fusarium infection of barley. J. Sep. Sci. 2014, 37, 912–919. [Google Scholar] [CrossRef]
- Pezzatti, J.; Boccard, J.; Codesido, S.; Gagnebin, Y.; Joshi, A.; Picard, D.; Gonzalez-Ruiz, V.; Rudaz, S. Implementation of liquid chromatography-high resolution mass spectrometry methods for untargeted metabolomic analyses of biological samples: A tutorial. Anal Chim Acta 2020, 1105, 28–44. [Google Scholar] [CrossRef]
- Ferreira, M.S.; de Oliveira, D.N.; de Oliveira, R.N.; Allegretti, S.M.; Catharino, R.R. Screening the life cycle of Schistosoma mansoni using high-resolution mass spectrometry. Anal Chim Acta 2014, 845, 62–69. [Google Scholar] [CrossRef]
- Plumb, R.; Castro-Perez, J.; Granger, J.; Beattie, I.; Joncour, K.; Wright, A. Ultra-performance liquid chromatography coupled to quadrupole-orthogonal time-of-flight mass spectrometry. Rapid Commun Mass Spectrom 2004, 18, 2331–2337. [Google Scholar] [CrossRef]
- Yeshi, K.; Creek, D.J.; Anderson, D.; Ritmejerytė, E.; Becker, L.; Loukas, A.; Wangchuk, P. Metabolomes and lipidomes of the infective stages of the gastrointestinal nematodes, Nippostrongylus brasiliensis and Trichuris muris. Metabolites 2020, 10, 1–31. [Google Scholar] [CrossRef] [PubMed]
- Wangchuk, P.; Kouremenos, K.; Eichenberger, R.M.; Pearson, M.; Susianto, A.; Wishart, D.S.; McConville, M.J.; Loukas, A. Metabolomic profiling of the excretory-secretory products of hookworm and whipworm. Metabolomics 2019, 15, 1–15. [Google Scholar] [CrossRef] [PubMed]
- Shulaev, V. Metabolomics technology and bioinformatics. Brief Bioinform 2006, 7, 128–139. [Google Scholar] [CrossRef] [PubMed]
- Dettmer, K.; Aronov, P.A.; Hammock, B.D. Mass spectrometry-based metabolomics. Mass Spectrom Rev 2007, 6, 51–78. [Google Scholar] [CrossRef]
- Dunn, W.B. Current trends and future requirements for the mass spectrometric investigation of microbial, mammalian and plant metabolomes. Phys Biol 2008, 5, 1–24. [Google Scholar] [CrossRef]
- Lei, Z.; Huhman, D.V.; Sumner, L.W. Mass spectrometry strategies in metabolomics. J Biol Chem 2011, 286, 25435–25442. [Google Scholar] [CrossRef]
- Ginger, C.D.; Fairbairn, D. Lipid metabolism in helminth parasites. I. The lipids of Hymenolepis diminuta (cestoda). J Parasitol 1966, 52, 1086–1096. [Google Scholar] [CrossRef]
- Nadjsombati, M.S.; McGinty, J.W.; Lyons-Cohen, M.R.; Jaffe, J.B.; DiPeso, L.; Schneider, C.; Miller, C.N.; Pollack, J.L.; Nagana Gowda, G.A.; Fontana, M.F.; et al. Detection of succinate by intestinal tuft cells triggers a type 2 innate immune circuit. Immunity 2018, 49, 33–41. [Google Scholar] [CrossRef]
- Whitman, J.D.; Sakanari, J.A.; Mitreva, M. Areas of metabolomic exploration for helminth infections. ACS Infect Dis 2021, 7, 206–214. [Google Scholar] [CrossRef]
- Kokova, D.; Mayboroda, O.A. Twenty Years on: Metabolomics in helminth research. Trends Parasitol 2019, 35, 282–288. [Google Scholar] [CrossRef] [PubMed]
- Ferreira, M.S.; de Oliveira, D.N.; de Oliveira, R.N.; Allegretti, S.M.; Vercesi, A.E.; Catharino, R.R. Mass spectrometry imaging: a new vision in differentiating Schistosoma mansoni strains. J Mass Spectrom 2014, 49, 86–92. [Google Scholar] [CrossRef]
- Ferreira, M.S.; de Oliveira, R.N.; de Oliveira, D.N.; Esteves, C.Z.; Allegretti, S.M.; Catharino, R.R. Revealing praziquantel molecular targets using mass spectrometry imaging: an expeditious approach applied to Schistosoma mansoni. Int J Parasitol 2015, 45, 385–391. [Google Scholar] [CrossRef]
- Kadesch, P.; Quack, T.; Gerbig, S.; Grevelding, C.G.; Spengler, B. Tissue- and sex-specific lipidomic analysis of Schistosoma mansoni using high-resolution atmospheric pressure scanning microprobe matrix-assisted laser desorption/ionization mass spectrometry imaging. PLoS Negl Trop Dis 2020, 14, 1–17. [Google Scholar] [CrossRef] [PubMed]
- Nielen, M.W. MALDI time-of-flight mass spectrometry of synthetic polymers. Mass Spectrom Rev 1999, 18, 309–344. [Google Scholar] [CrossRef]
- Li, L.; Winefordner, J.D.E. MALDI mass spectrometry for synthetic polymer analysis. chemical analysis: a eeries of monographs on analytical chemistry and its applications, John Wiley & Sons, Inc, Hoboken, New Jersey, USA. 2009.
- Khalil, S.M.; Pretzel, J.; Becker, K.; Spengler, B. High-resolution AP-SMALDI mass spectrometry imaging of Drosophila melanogaster. Int J Mass Spectrom 2017, 416, 1–19. [Google Scholar] [CrossRef]
- Liigand, P.; Kaupmees, K.; Haav, K.; Liigand, J.; Leito, I.; Girod, M.; Antoine, R.; Kruve, A. Think Negative: Finding the best electrospray ionization/MS mode for your analyte. Anal Chem 2017, 89, 5665–5668. [Google Scholar] [CrossRef]
- Cech, N.B.; Enke, C.G. Practical implications of some recent studies in electrospray ionization fundamentals. Mass Spectrom Rev 2001, 20, 362–387. [Google Scholar] [CrossRef]
- Cole, R.B. Electrospray and MALDI Mass Spectrometry: fundamentals, instrumentation, practicalities, and biological applications; Wiley: Hoboken. 2010.
- Giera, M.; Kaisar, M.M.M.; Derks, R.J.E.; Steenvoorden, E.; Kruize, Y.C.M.; Hokke, C.H.; Yazdanbakhsh, M.; Everts, B. The Schistosoma mansoni lipidome: Leads for immunomodulation. Anal Chim Acta 2018, 1037, 107–118. [Google Scholar] [CrossRef]
- Mangmee, S.; Adisakwattana, P.; Tipthara, P.; Simanon, N.; Sonthayanon, P.; Reamtong, O. Lipid profile of Trichinella papuae muscle-stage larvae. Sci Rep 2020, 10, 1–11. [Google Scholar] [CrossRef]
- Wang, T.; Nie, S.; Ma, G.; Korhonen, P.K.; Koehler, A.V.; Ang, C.S.; Reid, G.E.; Williamson, N.A.; Gasser, R.B. The developmental lipidome of Haemonchus contortus. Int J Parasitol 2018, 48, 887–895. [Google Scholar] [CrossRef] [PubMed]
- Wangchuk, P.; Lavers, O.; Wishart, D.S.; Loukas, A. Excretory/secretory metabolome of the zoonotic roundworm parasite Toxocara canis. Biomolecules 2020, 10, 1–18. [Google Scholar] [CrossRef] [PubMed]
- Wangchuk, P.; Shepherd, C.; Constantinoiu, C.; Ryan, R.Y.M.; Kouremenos, K.A.; Becker, L.; Jones, L.; Buitrago, G.; Giacomin, P.; Wilson, D.; et al. Hookworm-derived metabolites suppress pathology in a mouse model of colitis and inhibit secretion of key inflammatory cytokines in primary human leukocytes. Infect. Immun. 2019, 87, 1–19. [Google Scholar] [CrossRef] [PubMed]
- Wang, T.; Nie, S.; Ma, G.; Vlaminck, J.; Geldhof, P.; Williamson, N.A.; Reid, G.E.; Gasser, R.B. Quantitative lipidomic analysis of Ascaris suum. PLoS Negl Trop Dis 2020, 14, 1–19. [Google Scholar] [CrossRef]
- Greichus, A.; Greichus, Y.A. Chemical composition and volatile fatty acid production of male Ascaris lumbricoides before and after starvation. Exp Parasitol 1966, 19, 85–90. [Google Scholar] [CrossRef]
- Melo, C.F.; Esteves, C.Z.; de Oliveira, R.N.; Guerreiro, T.M.; de Oliveira, D.N.; Lima, E.O.; Mine, J.C.; Allegretti, S.M.; Catharino, R.R. Early developmental stages of Ascaris lumbricoides featured by high-resolution mass spectrometry. Parasitol Res 2016, 115, 4107–4114. [Google Scholar] [CrossRef]
- Smith, V.P.; Selkirk, M.E.; Gounaris, K. Identification and composition of lipid classes in surface and somatic preparationss of adult Brugia malayi. Mol Biochem Parasitol 1996, 78, 105–116. [Google Scholar] [CrossRef]
- Becker, A.-C.; Willenberg, I.; Springer, A.; Schebb, N.H.; Steinberg, P.; Strube, C. Fatty acid composition of free-living and parasitic stages of the bovine lungworm Dictyocaulus viviparus. Mol Biochem Parasitol 2017, 216, 39–44. [Google Scholar] [CrossRef]
- Wangchuk, P.; Constantinoiu, C.; Eichenberger, R.M.; Field, M.; Loukas, A. Characterization of tapeworm metabolites and their reported biological activities. Molecules 2019, 24, 1–13. [Google Scholar] [CrossRef]
- Ritler, D.; Rufener, R.; Li, J.V.; Kämpfer, U.; Müller, J.; Bühr, C.; Schürch, S.; Lundström-Stadelmann, B. In vitro metabolomic footprint of the Echinococcu multilocularis metacestode. Sci Rep. [CrossRef]
- Wangchuk, P.; Anderson, D.; Yeshi, K.; Loukas, A. Identification of small molecules of the infective stage of human hookworm using LCMS-based metabolomics and lipidomics protocols. ACS Infect Dis 2021, 7, 3264–3276. [Google Scholar] [CrossRef]
- Chen, Y.; Zhang, M.; Ding, X.; Yang, Y.; Chen, Y.; Zhang, Q.; Fan, Y.; Dai, Y.; Wang, J. Mining anti-Inflammation molecules from Nippostrongylus brasiliensis-derived products through the metabolomics approach. Front Cell Infect Microbiol 2021, 11, 1–13. [Google Scholar] [CrossRef] [PubMed]
- Joachim, A.; Ryll, M.; Daugschies, A. Fatty acid patterns of different stages of Oesophagostomum dentatum and Oesophagostomum quadrispinulatum as revealed by gas chromatography. Int J Parasitol 2000, 30, 819–827. [Google Scholar] [CrossRef]
- Retra, K.; deWalick, S.; Schmitz, M.; Yazdanbakhsh, M.; Tielens, A.G.; Brouwers, J.F.; van Hellemond, J.J. The tegumental surface membranes of Schistosoma mansoni are enriched in parasite-specific phospholipid species. Int J Parasitol 2015, 45, 629–636. [Google Scholar] [CrossRef] [PubMed]
- Minematsu, T.; Yamazaki, S.; Uji, Y.; Okabe, H.; Korenaga, M.; Tada, I. Analysis of polyunsaturated fatty acid composition of Strongyloides ratti in relation to development. J Helminthol 1990, 64, 303–309. [Google Scholar] [CrossRef] [PubMed]
- Learmonth, M.P.; Euerby, M.R.; Jacobs, D.E.; Gibbons, W.A. Metabolite mapping of Toxocara canis using one- and two-dimensional proton magnetic resonance spectroscopy. Mol Biochem Parasitol 1987, 25, 293–298. [Google Scholar] [CrossRef]
- Fiehn, O. Metabolomics—The link between genotypes and phenotypes. Plant Mol Biol 2002, 48, 155–171. [Google Scholar] [CrossRef]
- Silva, L.P.; Northen, T.R. Exometabolomics and MSI: deconstructing how cells interact to transform their small molecule environment. Curr Opin Biotechnol 2015, 34, 209–216. [Google Scholar] [CrossRef]
- Mapelli, V.; Olsson, L.; Nielsen, J. Metabolic footprinting in microbiology: methods and applications in functional genomics and biotechnology. Trends in Biotechnology 2008, 26, 490–497. [Google Scholar] [CrossRef]
- Ribbenstedt, A.; Ziarrusta, H.; Benskin, J.P. Development, characterization and comparisons of targeted and non-targeted metabolomics methods. PLoS One 2018, 13, e0207082. [Google Scholar] [CrossRef]
- Srivastava, A.; Creek, D.J. Using the IDEOM Workflow for LCMS-Based Metabolomics Studies of Drug Mechanisms. Methods Mol Biol 2020, 2104, 419–445. [Google Scholar] [CrossRef]
- Creek, D.J.; Jankevics, A.; Burgess, K.E.; Breitling, R.; Barrett, M.P. IDEOM: An Excel interface for analysis of LC-MS-based metabolomics data. Bioinformatics 2012, 28, 1048–1049. [Google Scholar] [CrossRef]
- Creek, D.J.; Jankevics, A.; Burgess, K.E.; Breitling, R.; Barrett, M.P. IDEOM: an Excel interface for analysis of LC-MS-based metabolomics data. Bioinformatics 2012, 28, 1048–1049. [Google Scholar] [CrossRef] [PubMed]
- Pluskal, T.; Castillo, S.; Villar-Briones, A.; Oresic, M. MZmine 2: modular framework for processing, visualizing, and analyzing mass spectrometry-based molecular profile data. BMC Bioinformatics 2010, 11, 395. [Google Scholar] [CrossRef]
- Lommen, A. MetAlign: interface-driven, versatile metabolomics tool for hyphenated full-scan mass spectrometry data preprocessing. Anal Chem 2009, 81, 3079–3086. [Google Scholar] [CrossRef] [PubMed]
- Tsugawa, H.; Cajka, T.; Kind, T.; Ma, Y.; Higgins, B.; Ikeda, K.; Kanazawa, M.; VanderGheynst, J.; Fiehn, O.; Arita, M. MS-DIAL: data-independent MS/MS deconvolution for comprehensive metabolome analysis. Nat Methods 2015, 12, 523–526. [Google Scholar] [CrossRef]
- Myers, O.D.; Sumner, S.J.; Li, S.; Barnes, S.; Du, X. Detailed Investigation and Comparison of the XCMS and MZmine 2 Chromatogram Construction and Chromatographic Peak Detection Methods for Preprocessing Mass Spectrometry Metabolomics Data. Anal Chem 2017, 89, 8689–8695. [Google Scholar] [CrossRef]
- Mahieu, N.G.; Patti, G.J. Systems-Level Annotation of a Metabolomics Data Set Reduces 25 000 Features to Fewer than 1000 Unique Metabolites. Anal Chem 2017, 89, 10397–10406. [Google Scholar] [CrossRef] [PubMed]
- Pirttilä, K.; Balgoma, D.; Rainer, J.; Pettersson, C.; Hedeland, M.; Brunius, C. Comprehensive Peak Characterization (CPC) in Untargeted LC-MS Analysis. Metabolites 2022, 12. [Google Scholar] [CrossRef]
- Chetnik, K.; Petrick, L.; Pandey, G. MetaClean: a machine learning-based classifier for reduced false positive peak detection in untargeted LC-MS metabolomics data. Metabolomics 2020, 16, 117. [Google Scholar] [CrossRef]
- Gloaguen, Y.; Kirwan, J.A.; Beule, D. Deep Learning-Assisted Peak Curation for Large-Scale LC-MS Metabolomics. Anal Chem 2022, 94, 4930–4937. [Google Scholar] [CrossRef]
- Jirayupat, C.; Nagashima, K.; Hosomi, T.; Takahashi, T.; Tanaka, W.; Samransuksamer, B.; Zhang, G.; Liu, J.; Kanai, M.; Yanagida, T. Image Processing and Machine Learning for Automated Identification of Chemo-/Biomarkers in Chromatography-Mass Spectrometry. Anal Chem 2021, 93, 14708–14715. [Google Scholar] [CrossRef] [PubMed]
- Dunn, W.B.; Broadhurst, D.I.; Atherton, H.J.; Goodacre, R.; Griffin, J.L. Systems level studies of mammalian metabolomes: the roles of mass spectrometry and nuclear magnetic resonance spectroscopy. Chem Soc Rev 2011, 40, 387–426. [Google Scholar] [CrossRef]
- Wishart, D.S.; Tzur, D.; Knox, C.; Eisner, R.; Guo, A.C.; Young, N.; Cheng, D.; Jewell, K.; Arndt, D.; Sawhney, S.; et al. HMDB: the Human Metabolome Database. Nucleic Acids Res 2007, 35, D521–D526. [Google Scholar] [CrossRef] [PubMed]
- Horai, H.; Arita, M.; Kanaya, S.; Nihei, Y.; Ikeda, T.; Suwa, K.; Ojima, Y.; Tanaka, K.; Tanaka, S.; Aoshima, K.; et al. MassBank: a public repository for sharing mass spectral data for life sciences. J Mass Spectrom 2010, 45, 703–714. [Google Scholar] [CrossRef]
- Xue, J.; Guijas, C.; Benton, H.P.; Warth, B.; Siuzdak, G. METLIN MS(2) molecular standards database: a broad chemical and biological resource. Nat Methods 2020, 17, 953–954. [Google Scholar] [CrossRef] [PubMed]
- Aron, A.T.; Gentry, E.C.; McPhail, K.L.; Nothias, L.F.; Nothias-Esposito, M.; Bouslimani, A.; Petras, D.; Gauglitz, J.M.; Sikora, N.; Vargas, F.; et al. Reproducible molecular networking of untargeted mass spectrometry data using GNPS. Nat Protoc 2020, 15, 1954–1991. [Google Scholar] [CrossRef]
- Karp, P.D.; Riley, M.; Paley, S.M.; Pellegrini-Toole, A. The MetaCyc Database. Nucleic Acids Res 2002, 30, 59–61. [Google Scholar] [CrossRef]
- Misra, B.B. New software tools, databases, and resources in metabolomics: updates from 2020. Metabolomics 2021, 17, 1–24. [Google Scholar] [CrossRef]
- Wishart, D.S.; Jewison, T.; Guo, A.C.; Wilson, M.; Knox, C.; Liu, Y.; Djoumbou, Y.; Mandal, R.; Aziat, F.; Dong, E.; et al. HMDB 3.0--The human metabolome database in 2013. Nucleic Acids Res 2013, 41, D801–D807. [Google Scholar] [CrossRef]
- Smith, C.A.O.M., G. Want, E.J.; Want, E.J.; Qin, C.; Trauger, S.A.; Brandon, T.R.; Custodio, D.E.; Abagyan, R.; Siuzdak, G. METLIN: a metabolite mass spectral database. Ther Drug Monit 2005, 27, 747–751. [Google Scholar] [CrossRef]
- Xue, J.; Guijas, C.; Benton, H.P.; Warth, B.; Siuzdak, G. METLIN MS2 molecular standards database: A broad chemical and biological resource. Nat Methods 2020, 17, 953–954. [Google Scholar] [CrossRef] [PubMed]
- Marco-Ramell, A.; Palau-Rodriguez, M.; Alay, A.; Tulipani, S.; Urpi-Sarda, M.; Sanchez-Pla, A.; Andres-Lacueva, C. Evaluation and comparison of bioinformatic tools for the enrichment analysis of metabolomics data. BMC Bioinformatics 2018, 19, 1–11. [Google Scholar] [CrossRef]
- Kanehisa, M.; Goto, S. KEGG: Kyoto Encyclopedia of Genes and Genomes. Nucleic Acids Res 2000, 28, 27–30. [Google Scholar] [CrossRef]
- Altman, T.; Travers, M.; Kothari, A.; Caspi, R.; Karp, P.D. A systematic comparison of the MetaCyc and KEGG pathway databases. BMC Bioinformatics.
- Yanshole, V.V.; Melnikov, A.D.; Yanshole, L.V.; Zelentsova, E.A.; Snytnikova, O.A.; Osik, N.A.; Fomenko, M.V.; Savina, E.D.; Kalinina, A.V.; Sharshov, K.A.; et al. Animal Metabolite Database: Metabolite Concentrations in Animal Tissues and Convenient Comparison of Quantitative Metabolomic Data. Metabolites 2023, 13. [Google Scholar] [CrossRef] [PubMed]
- Goldansaz, S.A.; Guo, A.C.; Sajed, T.; Steele, M.A.; Plastow, G.S.; Wishart, D.S. Livestock metabolomics and the livestock metabolome: A systematic review. PLOS ONE 2017, 12, e0177675. [Google Scholar] [CrossRef] [PubMed]
- Fiehn, O.; Robertson, D.; Griffin, J.; van der Werf, M.; Nikolau, B.; Morrison, N.; Sumner, L.W.; Goodacre, R.; Hardy, N.W.; Taylor, C.; et al. The metabolomics standards initiative (MSI). Metabolomics 2007, 3, 175–178. [Google Scholar] [CrossRef]
- Sumner, L.W.; Amberg, A.; Barrett, D.; Beale, M.H.; Beger, R.; Daykin, C.A.; Fan, T.W.; Fiehn, O.; Goodacre, R.; Griffin, J.L.; et al. Proposed minimum reporting standards for chemical analysis Chemical Analysis Working Group (CAWG) Metabolomics Standards Initiative (MSI). Metabolomics 2007, 3, 211–221. [Google Scholar] [CrossRef]
- Salek, R.M.; Steinbeck, C.; Viant, M.R.; Goodacre, R.; Dunn, W.B. The role of reporting standards for metabolite annotation and identification in metabolomic studies. Gigascience, :13.
- Schymanski, E.L.; Jeon, J.; Gulde, R.; Fenner, K.; Ruff, M.; Singer, H.P.; Hollender, J. Identifying small molecules via high resolution mass spectrometry: Communicating confidence. Environ Sci Technol 2014, 48, 2097–2098. [Google Scholar] [CrossRef]
- Spicer, R.; Salek, R.M.; Moreno, P.; Canueto, D.; Steinbeck, C. Navigating freely-available software tools for metabolomics analysis. Metabolomics 2017, 13, 1–16. [Google Scholar] [CrossRef]
- Clasquin, M.F.; Melamud, E.; Rabinowitz, J.D. LC-MS data processing with MAVEN: a metabolomic analysis and visualization engine. Curr Protoc Bioinformatics, :11.
- Pluskal, T.; Castillo, S.; Villar-Briones, A.; Orešič, M. MZmine 2: modular framework for processing, visualizing, and analyzing mass spectrometry-based molecular profile data. BMC Bioinformatics.
- Kessler, N.; Neuweger, H.; Bonte, A.; Langenkämper, G.; Niehaus, K.; Nattkemper, T.W.; Goesmann, A. MeltDB 2.0-advances of the metabolomics software system. Bioinformatics 2013, 29, 2452–2459. [Google Scholar] [CrossRef]
- Armitage, E.G.; Godzien, J.; Alonso-Herranz, V.; López-Gonzálvez, Á.; Barbas, C. Missing value imputation strategies for metabolomics data. Electrophoresis 2015, 36, 3050–3060. [Google Scholar] [CrossRef] [PubMed]
- Xia, J.; Sinelnikov, I.V.; Han, B.; Wishart, D.S. MetaboAnalyst 3.0—making metabolomics more meaningful. Nucleic Acids Res 2015, 43, W251–W257. [Google Scholar] [CrossRef] [PubMed]
Figure 1.
Host-pathogen recognition systems during GI helminth infections. The host innate immune system responds to the injury by releasing alarmins (e.g. IL-33, TSLP), initiating a type 2 (Th2) immune response. However, GI helminths may block the release of alarmins or their receptors, e.g., IL-33R (or ST2). Toll-like receptors (TLRs) may recognize pathogen-associated molecular patterns (PAMPs). These PAMPs can be presented directly by helminths or indirectly by bacteria passing through the injured epithelium. In such cases, helminths secrete immune modulators that block the Th1 response driven by IL-12.
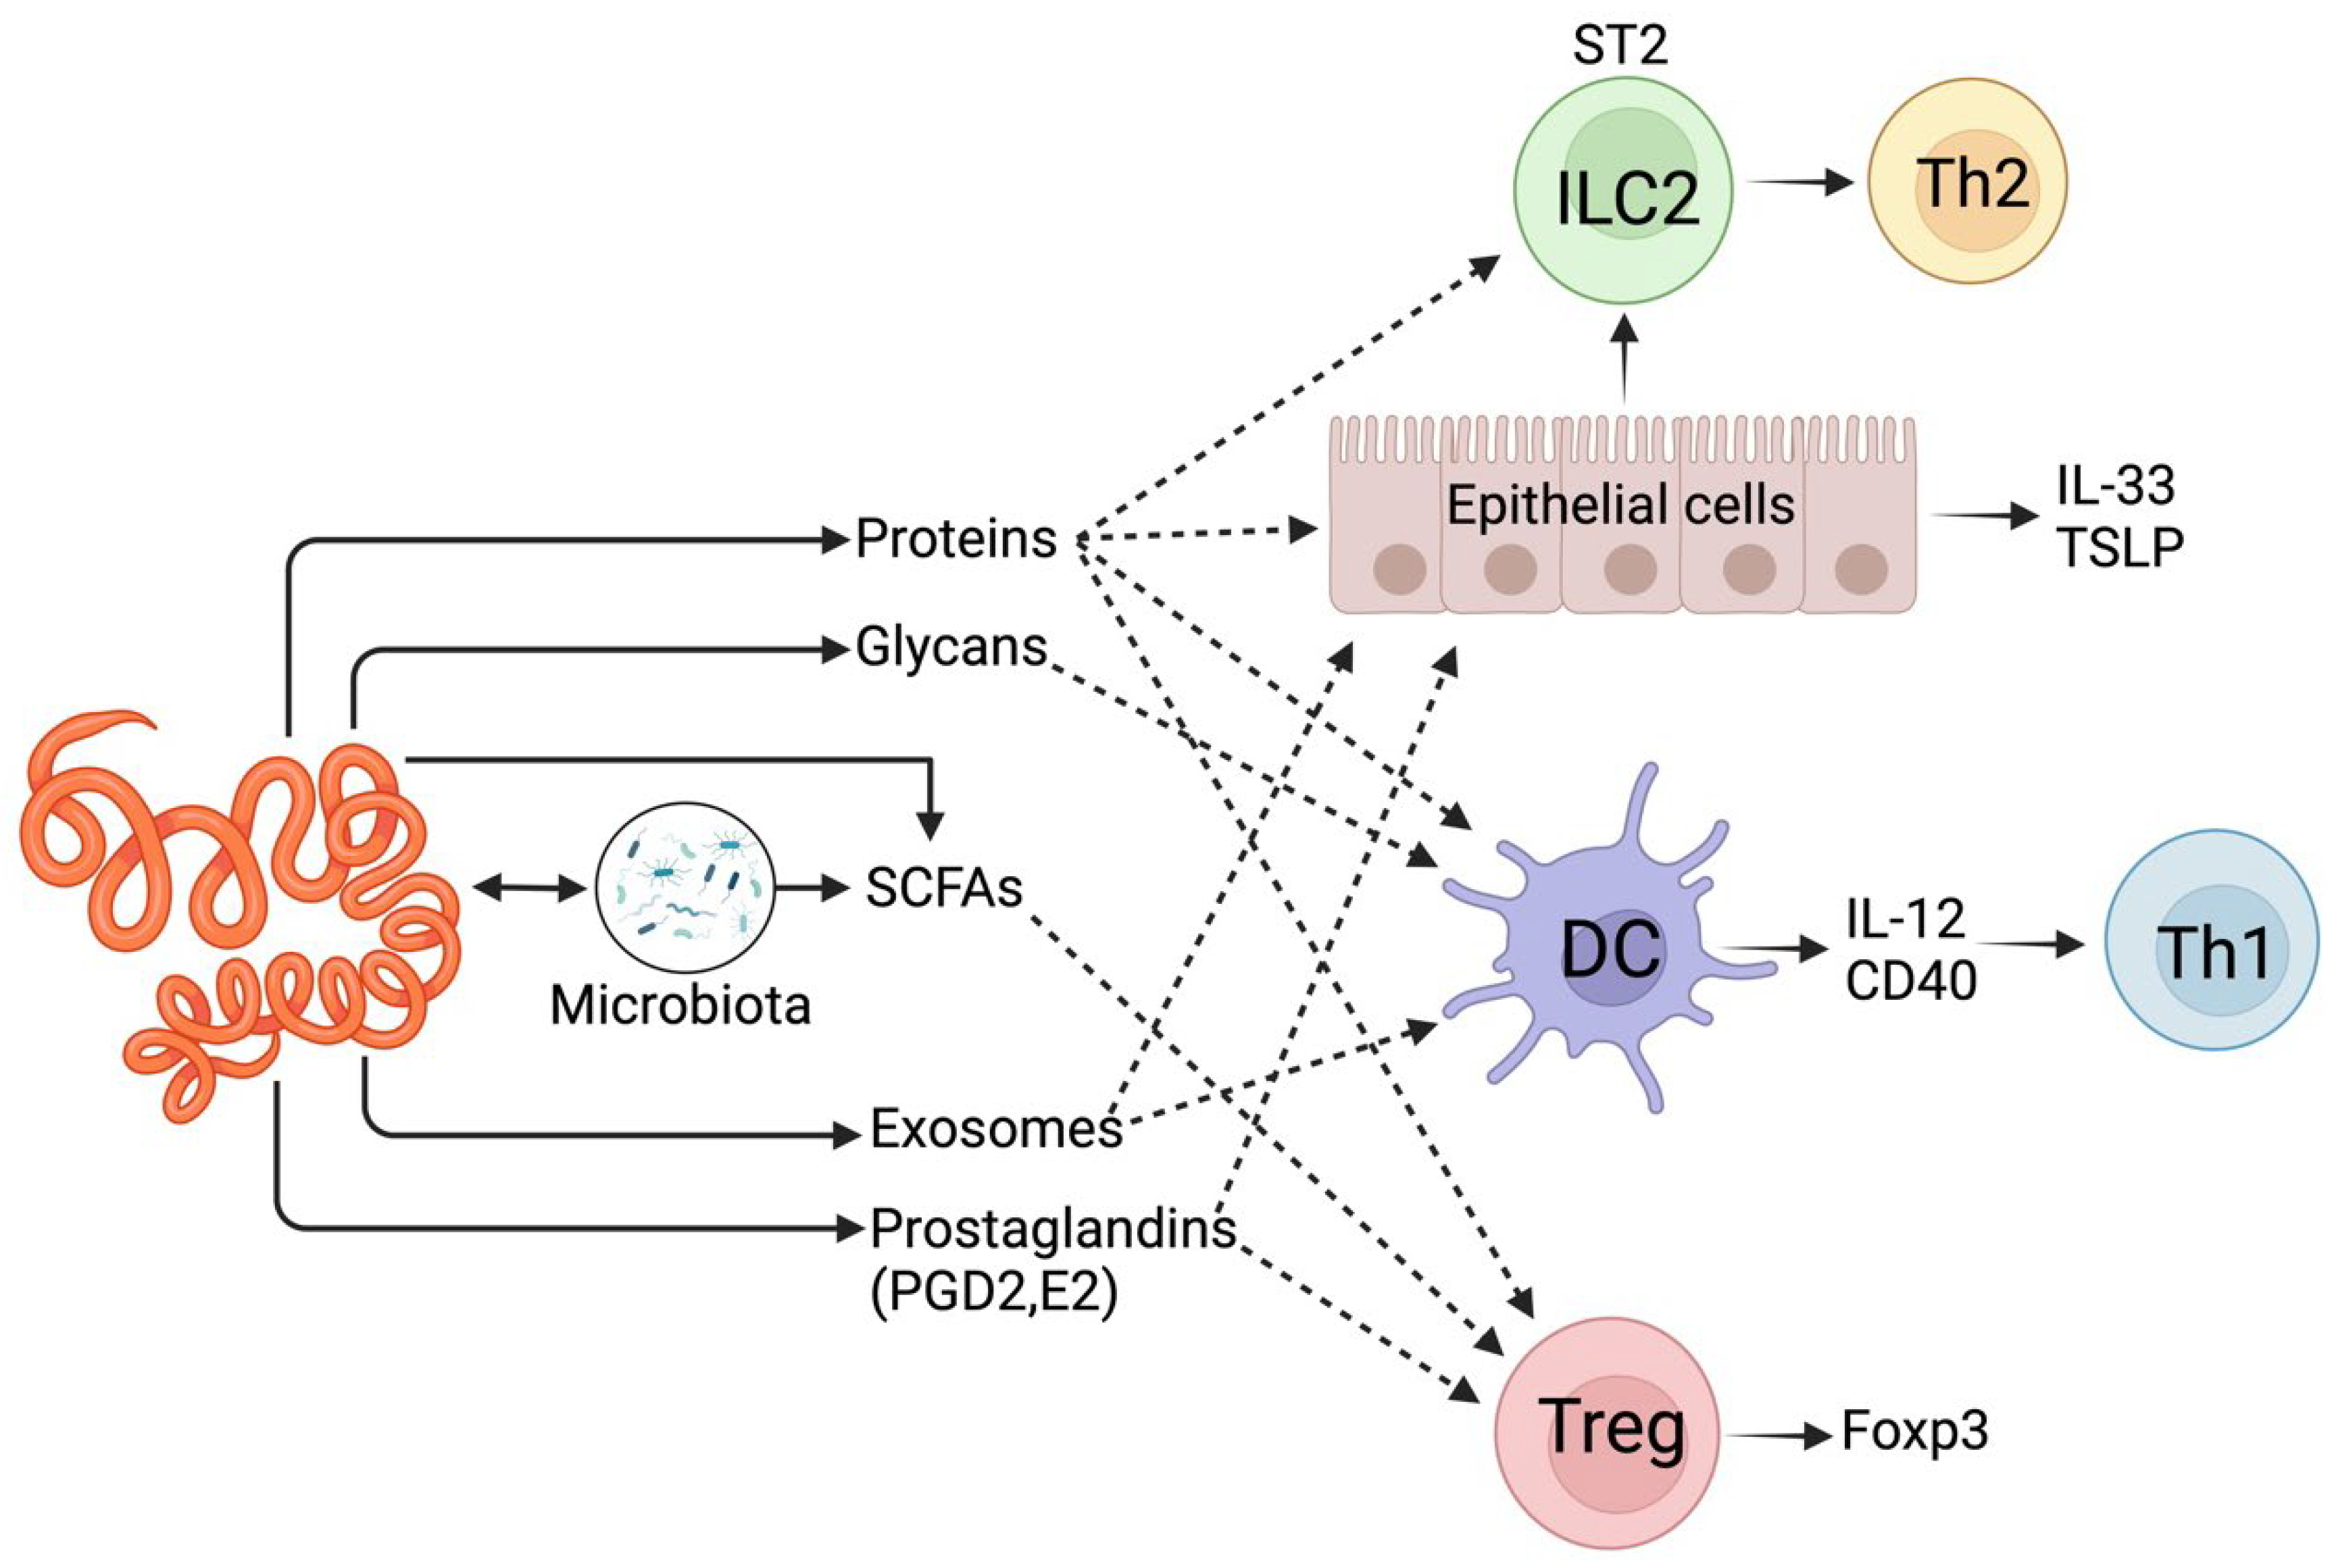
Figure 2.
A generic LC/MS-based workflow for targeted and untargeted metabolomics studies [21,33,56]. A. In targeted metabolomics, initially targeted methods are established using standard metabolites. Method standardisation is followed by sample preparation. Samples are analysed, and the data output quantifies those metabolites whose standards are available or for which standard methods are established. B. In the untargeted analysis, molecules are first extracted from the sample and subsequently analysed by LC-MS. An open-source software such as IDEOM is used to process acquired LC-MS data. Putative identification of metabolites is achieved by searching the m/z values for the peaks of interest in metabolite databases (Kyoto Encyclopaedia of Genes and Genomes, KEGG; MetaCyc for polar metabolites; Lipid MAPS for lipids, NIST database). The untargeted approach in metabolomics yields many putative metabolites (a few hundred to thousands).
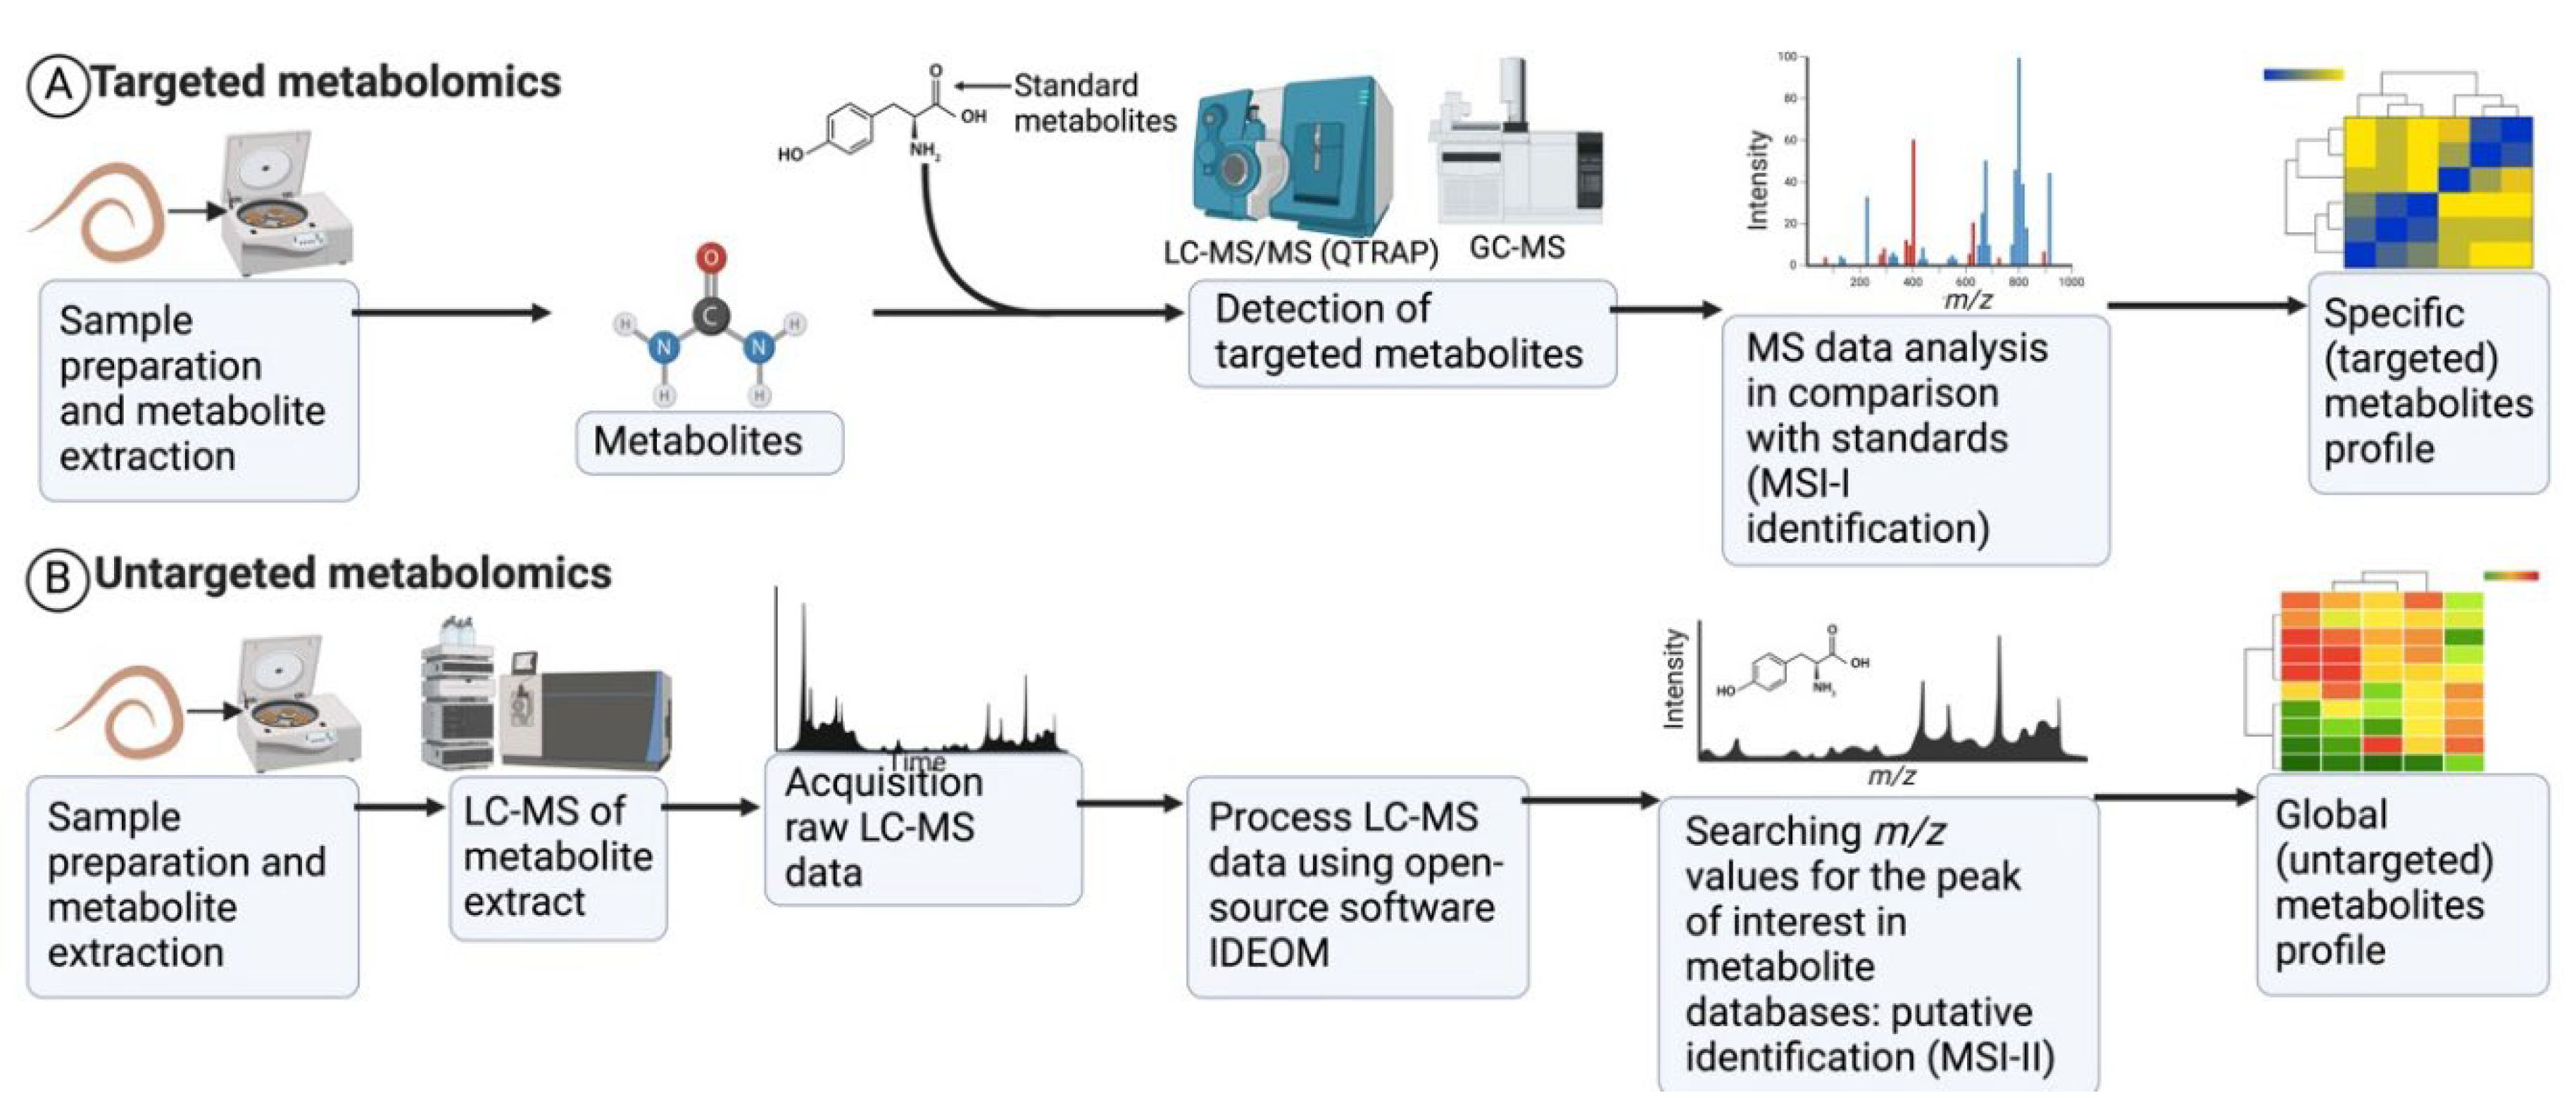

Table 1.
Metabolomics approaches, analytical platforms, identification database and software used to study small molecules of gastrointestinal parasites.
Table 1.
Metabolomics approaches, analytical platforms, identification database and software used to study small molecules of gastrointestinal parasites.
| Helminth species and family | Life cycle stage | Host | Sample analyzed | Study approach | Metabolite types | MSI identification level | Analytical instruments/platforms used | Databases/software used | Ref |
|---|---|---|---|---|---|---|---|---|---|
| Ancylostoma caninum (Ancylostomatidae) | Adult | Dog | SE, ESP | Targeted | Polar metabolites & lipids | Level 1 | GC-MS & LC-MS |
Database: MAML Software: Agilent MassHunter (v.7); MetaboAnalyst (v.3.0) |
[56] |
| Ascaris suum (Ascarididae) | L3, L4, adult | Swine | SE | Untargeted | Lipids | Level 2 | UHPLC-MS/MS | Database: LipidSearch (v.4.2.23) | [57] |
| Ascaris lumbricoides (Ascarididae) | Adult | Human and swine | ESP | Targeted | Lipids | Level 1 | GLC | Lipids were identified by matching retention times with standards | [58] |
| Eggs, L1, L3 | SE | Fingerprint | Biomarkers (pheromones/steroidal prohormones) | Level 2 | HRMS |
Database: Lipid MAPS; HMDB (v 3.6); METLIN Software: MetaboAnalyst (v.3.0) |
[59] | ||
| Brugia malayi (Onchocercidae) | Adult | Dogs and wild felids | Cuticle | Targeted | Lipids | Level 1 | TLC & GC | Lipids were identified by matching retention times with standards | [60] |
| Dictyocaulus viviparus (Dictyocaulidae) | Eggs, L1-L3, preadult, adult | Cattle | SE | Targeted | Lipids | Level 1 | GC | Lipids were identified matching retention times with standards Software: Chem Station B.01.03. |
[61] |
| Dipylidium caninum (Dipylidiidae) | Adult | Dog | ESP | Targeted | Polar metabolites & lipids | Level 1 | GC-MS |
Database: MHL; KEGG; NIST library; MAML Software: MetaboAnalyst (v.4.0) |
[62] |
| Echinococcus multilocularis (Taeniidae) | Larval metacestode | Fox | CS | Untargeted | Polar metabolites | Level 1 | 1H NMR |
Database: HMDB Software: Chenomx NMR Suit (v 8.2); STOCSY |
[63] |
| Haemonchus contortus (Trichostrongylidae) | Eggs, L3, xL3, L4, adult | Goats and sheep | SE | Untargeted | Lipids | Level 2 | UHPLC-ESI(+)-MS/MS-Orbitrap |
Database: LipidSearch (v.4.1.30 SPI) Software: R package |
[54] |
|
Hymenolepis diminuta (Hymenolepididae) |
Infective stage | Rodents (rats) | SE | Targeted | Lipids | Level 1 | TLC, CC, & GLC | NA | [39] |
| Necator americanus (Ancylostomatidae) | L3 | Human | SE, ESP | Untargeted | Polar metabolites | Level 1 | Q-Exactive Orbitrap & MS/HPLC |
Database: KEGG; MetaCyc; CTS; Lipid MAPS; PubChem; HMDB Software: IDEOM; MetaboAnalyst (v.3.0) |
[64] |
| Lipids | Level 2 | ||||||||
| Nippostrongylus brasiliensis (Heligmonellidae) | Adult | Rodents (rats) | ESP | Targeted | Polar metabolites & lipids | Level 1 | 1H NMR |
Database: GenBank; NCBI GEO Software: STAR; Chenomx NMR Suite (v.5.1) |
[40] |
| L3 | SE, ESP | Untargeted | Polar metabolites | Level 1 | Q-Exactive Orbitrap & MS/HPLC |
Database: KEGG, MetaCyc; Lipid MAPS; PubChem CID; HMDB; CTS Software: IDEOM; MetaboAnalyst (v.3.0) |
[33,34] |
||
| Lipids | Level 2 | ||||||||
| Adult | ESP | Targeted | Polar metabolites & lipids | Level 1 | GC-MS |
Database: MAML; MHL; KEGG Software: Agilent MassHunter (v.7) |
|||
| Adult | ESP | Untargeted | Polar metabolites | Level 1 | UHPLC-MS |
Database: HMDB; PubChem CID Software: XCMS; MetaboAnalyst; R package |
[65] | ||
| Intestinal content | |||||||||
| Oesophagostomum dentatum; O. quadrispinulatum (Strongylidae) | L3, L4, adult | Common livestock (goats, sheep, and swine) | SE | Untargeted | Lipids | Level 1 | GC |
Lipids identification: Matching retention times with standards Software: MIDI system package (v. 3.30) |
[66] |
| Schistosoma mansoni (Schistosomatidae) | Adult | Human | SE | Targeted | Lipids | Level 1 | MALDI MSI (+) |
Database: METLIN; Lipid MAPS Software: Uscrambler (v.9.7); Mass Frontier (v.6.0) |
[43] |
| Eggs, miracidia, cercariae | SE | Untargeted | Lipids | Level 2 | ESI(+)-HRMS |
Database: Lipid MAPS; METLIN Software: Unscrambler (v.9.7) |
[31] | ||
| Adult | SE | Untargeted | Lipids | Level 2 | MALDI-MSI(+) |
Database: Lipid MAPS; METLIN Software: Unscrambler (v.9.7) |
[44] | ||
| Adult | TS | Targeted | Lipids | Level 2 | HPLC-MS (Sciex 4000QTRAP) | Lipids were identified by universal HPLC-MS method Software: Markerview (v.1.0) |
[67] | ||
| Eggs, cercariae, adult | SE, ESP | Targeted | Lipids | Level 2 | LC-MS/MS (QTrap) (ESI-) |
Software: LipidBlast; FiehnO lipid database in MS-DIAL (v2.74) Software: R package |
[52] | ||
| Targeted | Lipids | GC-MS | |||||||
| Targeted | Lipids | LC-MS/MS (QToF) (ESI+) | |||||||
| Adult | SE | Untargeted | Lipids | Level 2 | AP-SMALDI MSI |
Database: SwissLipids; LipidMatch (v2.0.2) Software: Lipid Data Analyzer (v2.6.2) |
[45] | ||
| Strongyloides ratti (Strongylidae) | L1, L3, free-living | Rodent (rats) | SE | Targeted | Lipids | Level 1 | GC-MS | Lipids were identified by matching retention times with standards. | [68] |
| Trichuris muris (Trichuridae) | Embryonated eggs | Rodents (mice) | SE | Untargeted | Polar metabolites | Level 1 | Q-Exactive Orbitrap & MS/HPLC |
Database: KEGG; MetaCyc; Lipid MAPS; PubChem CID; HMDB; CTS Software: IDEOM; MetaboAnalyst (v.3.0) |
[33] |
| Lipids | Level 2 | ||||||||
| Adult | ESP | Targeted | Polar metabolites & lipids | Level 1 | GC-MS |
Database: MAML; MHL; KEGG Software: Agilent MassHunter (v.7); MetaboAnalyst (v.3.0) |
[21] | ||
| Trichinella papuae (Tricinellidae) | L1 (muscle-stage) | Swine | SE | Untargeted | Lipids | Level 2 | ESI(+/-) UPLC-MS/MS |
Database: Lipid MAPS; LipidBlast Software: Progenesis QI (v.2.1; QuickGO |
[53] |
| Toxocara canis (Toxocaridae) | Adult | Dog | ESP | Targeted | Polar metabolites & lipids | Level 1 | GC-MS & LC-MS |
Database: Agilent MassHunter (v.7); MAML Software: MetaboAnalyst (v.3.0) |
[55] |
| Adult | SE | Untargeted | Polar metabolites & lipids | Level 1 | 1H NMR | NA | [69] |
Abbreviations: Analytical techniques: AP-SMALDI MSI – atmospheric pressure (AP) matrix-assisted laser desorption/ionisation (MALDI) mass spectrometry imaging (MSI); CC – column chromatography; ESI(+/-) – electrospray ionisation positive/negative mode; GC – gas chromatography; GLC – gas liquid chromatography; 1H NMR – proton nuclear magnetic resonance; HPLC – high performance liquid chromatography; HRMS – high-resolution mass spectrometry; NA – Not available; LC – liquid chromatography; MS – mass spectrometry; Q-TOF – quadrupole time-of-flight; Qtrap – quadrupole ion trap; TLC – thin layer chromatography; UHPLC – ultra high performance liquid chromatography. Databases: CTS – the chemical translation services; HMDB – human metabolome database; KEGG – Kyoto encyclopedia of genes and genomics; MHL – mass hunter library; MAML – the in-house metabolomics Australia metabolite library; Matlab – matrix laboratory; MetaCyc – metabolic pathways and enzymes database; METLIN – metabolite and chemical entity database; NIST – the national institute of standards and technology. Software: STAR – Spliced Transcripts Alignment to a Resonance; STOCSY – statistical total correlation spectroscopy; IDEOM – an excel interface for analysis of LC-MS-based metabolomics data
Disclaimer/Publisher’s Note: The statements, opinions and data contained in all publications are solely those of the individual author(s) and contributor(s) and not of MDPI and/or the editor(s). MDPI and/or the editor(s) disclaim responsibility for any injury to people or property resulting from any ideas, methods, instructions or products referred to in the content. |
© 2024 by the authors. Licensee MDPI, Basel, Switzerland. This article is an open access article distributed under the terms and conditions of the Creative Commons Attribution (CC BY) license (http://creativecommons.org/licenses/by/4.0/).
Copyright: This open access article is published under a Creative Commons CC BY 4.0 license, which permit the free download, distribution, and reuse, provided that the author and preprint are cited in any reuse.


