Preprint
Article

High-Frequency Test of Electric Locomotive Arrester and Its PHM Design

Altmetrics

Downloads

50

Views

23

Comments

0

A peer-reviewed article of this preprint also exists.

Submitted:

06 September 2024

Posted:

06 September 2024

You are already at the latest version

Alerts
Abstract
The zinc oxide (ZnO) arrester is positioned on locomotive roof preventing other onboard electrical equipment from the harm caused by external and internal overvoltages. A number of locomotive arrester burnout and explosion accidents occur during traction supply network harmonic resonance causing train stoppages and power outages in the network. This study firstly carries out high-frequency tests to investigate the wide frequency band electrical characteristics of the locomotive arrester, explaining that the arrester is prone to fault during resonance. Consequently, a prognostics and health management (PHM) for locomotive arrester is proposed providing on online monitoring, fault warning and health assessment solutions, which is beneficial to the operation and maintenance of arresters in the future. The testing method and PHM scheme presented in this paper can be not only applied to the arrester, also readily expanded to other high-voltage electrical equipment on the electric locomotive.
Keywords: 
Subject: Engineering  -   Electrical and Electronic Engineering

1. Introduction

The high-voltage electrical system of electric locomotive, consisting of pantographs, insulators, potential transformers, arresters, circuit breakers, and traction transformers, transfers electrical energy to the traction drive system to propel the train [1]. The arrester is positioned on locomotive roof to mitigate the increase in voltage of the safeguarded equipment [2], preventing them from the harm caused by external and internal overvoltages [3,4]. The zinc oxide (ZnO) valve plates are commonly used in locomotive arresters due to their superior pressure-sensitive features [5]. In recent years, as reported in some literature electric locomotives have experienced arrester burnout or explosion accidents during operation, especially when harmonic resonance of the traction supply network happens [6,7]. Such events have resulted in severe consequences, including train stoppages and power outages in the traction supply network, which have negatively impacted the safe and stable operation of the railway system. Therefore, it is crucial to carry out relevant studies for revealing the fault mechanism of locomotive arresters, and implementing specific health management measures, which should be beneficial for achieving the maintenance mode transformation from traditional planned maintenance to state maintenance and preventive maintenance.
Existing studies mainly investigate the fault characteristics and mechanisms of arresters in the power grid when exposed to fundamental power frequency (50 Hz considered in this work) overvoltage or thunder impulse [8,9,10,11]. However, this is distinct from the situations of the locomotive arrester faults. References [12] and [13] indicate that electric locomotive arresters are at certain risk of burnout or explosion in the presence of high frequency harmonic resonance in the traction supply network. Moreover, studies based on some tests point out that the primary cause of locomotive arrester faults is that the arrester is exposed to high-frequency and high-amplitude resonance overvoltage from the traction supply network for a relatively long duration [14]. This leads to an enormous increase in arrester leakage current so as to exacerbate heating and break the thermal equilibrium, resulting in heat accumulation. As a result, the thermal capacity limit of the arrester is surpassed. It should be noted that the frequency band of the resonant overvoltage in the traction supply network, typically ranging from several hundreds to several thousands hertz [15,16,17], is much higher than the counterpart of general overvoltages in the grid. Although this explanation of the locomotive arrester faults is reasonable, there is a lack of detailed tests about the electrical characteristics of the ZnO arrester operating under the high-frequency harmonic over-voltage, which will further reveal the arrester burnout and explosion mechanism.
On the other hand, a combination of planned maintenance and post repair is currently adopted for locomotive arresters [18]. In practical engineering, there exists some inadequate or excessive maintenance. With the continuous advancements in sensor, microprocessor, and other technologies relevant to online monitoring, the prognostics and health management (PHM) is with increasing application prospect for realizing intelligent operation and maintenance of locomotive arresters [19,20].
Currently available techniques for evaluating the electrical equipment health status, which is the key information of the PHM, are primarily model-based and data-driven methodologies [21]. The model-based prediction methods rely on physical or mathematical model of the target, i.e., electrical equipment. This model is usually developed by analytical solutions which is based on a comprehensive understanding of the operation and fault mechanisms of the equipment. Under the prerequisite of reasonable and comprehensive modelling, this kind of methods exhibit robust specificity and high reliability. Nevertheless, the modelling is generally not a trivial task, and the model validation poses challenges. Furthermore, the model must be adjusted to follow the changes on the target. For example, the model of an arrester cannot be directly used for an insulator, even if they have certain similarities. Besides, the fact is that for different types of arresters the model still requires modification. This means limited adaptability and inadequate generalization capability.
Alternatively, based on the acquisition of monitoring signals associated with electrical equipment deterioration, the data-driven methods can evaluate the equipment operation state, warn its faults, and even forecast its remaining life based on some modern intelligent algorithms. Typically, there are mainly two approaches to implement a data-driven PHM system. First, the equipment health state is predicted by statistical method based on the fault probability distribution derived from a substantial quantity of operation and maintenance data [22]. However, all the data must conform to strict requirements of both sample size and temporal dimension. Besides, since it is with few links to the equipment operation principle, this approach generally fails to elucidate the events associated with the equipment faults. The second is state parameter monitoring based approach [23]. Operation state as well as residual life of the equipment can be evaluated through comparing the monitoring data with the failure thresholds which are typically come out of the insight to the equipment physical properties usually acquired from sufficient tests. This means that test data covering the entire equipment life cycle is required for understanding the ageing pattern or performance decline of the equipment. However, this is not always satisfied. On the whole, for the time being, research on PHM of electric locomotive high-voltage equipment is just in its infancy. Specifically, less attention has been paid on locomotive arrester PHM.
As mentioned above, regarding the accidents of locomotive arrester burnout and explosion, this study simulates the high-frequency overvoltage of the traction supply network, which allows to investigate the wide frequency band electrical characteristics of the arrester, explaining that it is prone to fault during resonance. Subsequently, a PHM for locomotive arrester is proposed based on online monitoring design as well as fault warning and health evaluation algorithms, which is beneficial to the operation and maintenance of arresters in the future.
The rest of this article is organized as follows. Section 2 presents a concise analysis of the static volt-ampere characteristics and equivalent circuit models of the arrester. Then high-frequency tests of a typical model of locomotive arrester as well as its ZnO valve plates are performed. The tested results under fundamental and harmonic voltages as well as their combinations explain how the operational properties of arrester are affected by variations in voltage amplitude and frequency. A PHM method for locomotive arrester is proposed in Section 3 including an online monitoring scheme for acquiring and preprocessing relevant data, and the fault warning and health assessment algorithms. Section 4 draws the conclusion.

2. Electrical Characteristics of Locomotive Arrester Based on High-frequency Tests

2.1. Equivalent Circuit Model of ZnO Arrester

The primary element of the arrester valve plate is ZnO, with some auxiliary additives such as Bi2O3, Sb2O3, MnO2, Cr2O3, and other elements in tiny quantities [24]. The static volt-ampere characteristics of a ZnO arrester can be assessed by monitoring the variations in voltage and leakage current. Its power loss characteristics can refer to the standard model of solid dielectric loss.
The volt-ampere characteristics of the ZnO valve plate, depicted in Figure 1a, can be divided into three regions [25]. Region I known as the high voltage region or pre-breakdown zone, is characterized by a significantly high resistance, which can reach several hundred megaohms. Within this region, there exists a nearly linear correlation between the voltage and the leakage current. Moreover, the leakage current remains at a level of only a few microamperes. Thus, this area is also referred to as the linear region. Region II is called the breakdown region, where the volt-ampere characteristics of the ZnO valve plate generally exhibit nonlinear changes, hence it is also referred to as the nonlinear region. Region III is recognized as the high current area, where the non-linear properties of the volt-ampere characteristics vanish. The ZnO valve plate exhibits a reduced impedance, resembling a linear resistor.
Figure 1b depicts a three branches parallel equivalent circuit model utilized for describing solid dielectric losses. In this model, u and i represent the voltage applied to the arrester and the resulted leakage current. The capacitor C stands for the branch responsible for instantaneous charging current (ic) caused by lossless polarization. The resistor r and capacitor ΔC are connected in series forming the absorption current (ia) branch which is induced by lossy polarization. The conduction current (ig) branch is represented by the resistance R.
When an ac voltage is applied, the current in the dielectric equivalent circuit can be separated into active and reactive components [2]. This allows to create a simplified equivalent circuit model, as depicted in Figure 1c. The leakage current, denoted as I ˙ , that is produced by the voltage phasor U ˙ at any given frequency can be separated into resistive component I ˙ R and capacitive component I ˙ C . These components can be represented by their equivalent circuit models, which are a resistor Rp and a capacitor Cp, respectively.

2.2. Test Scheme Design

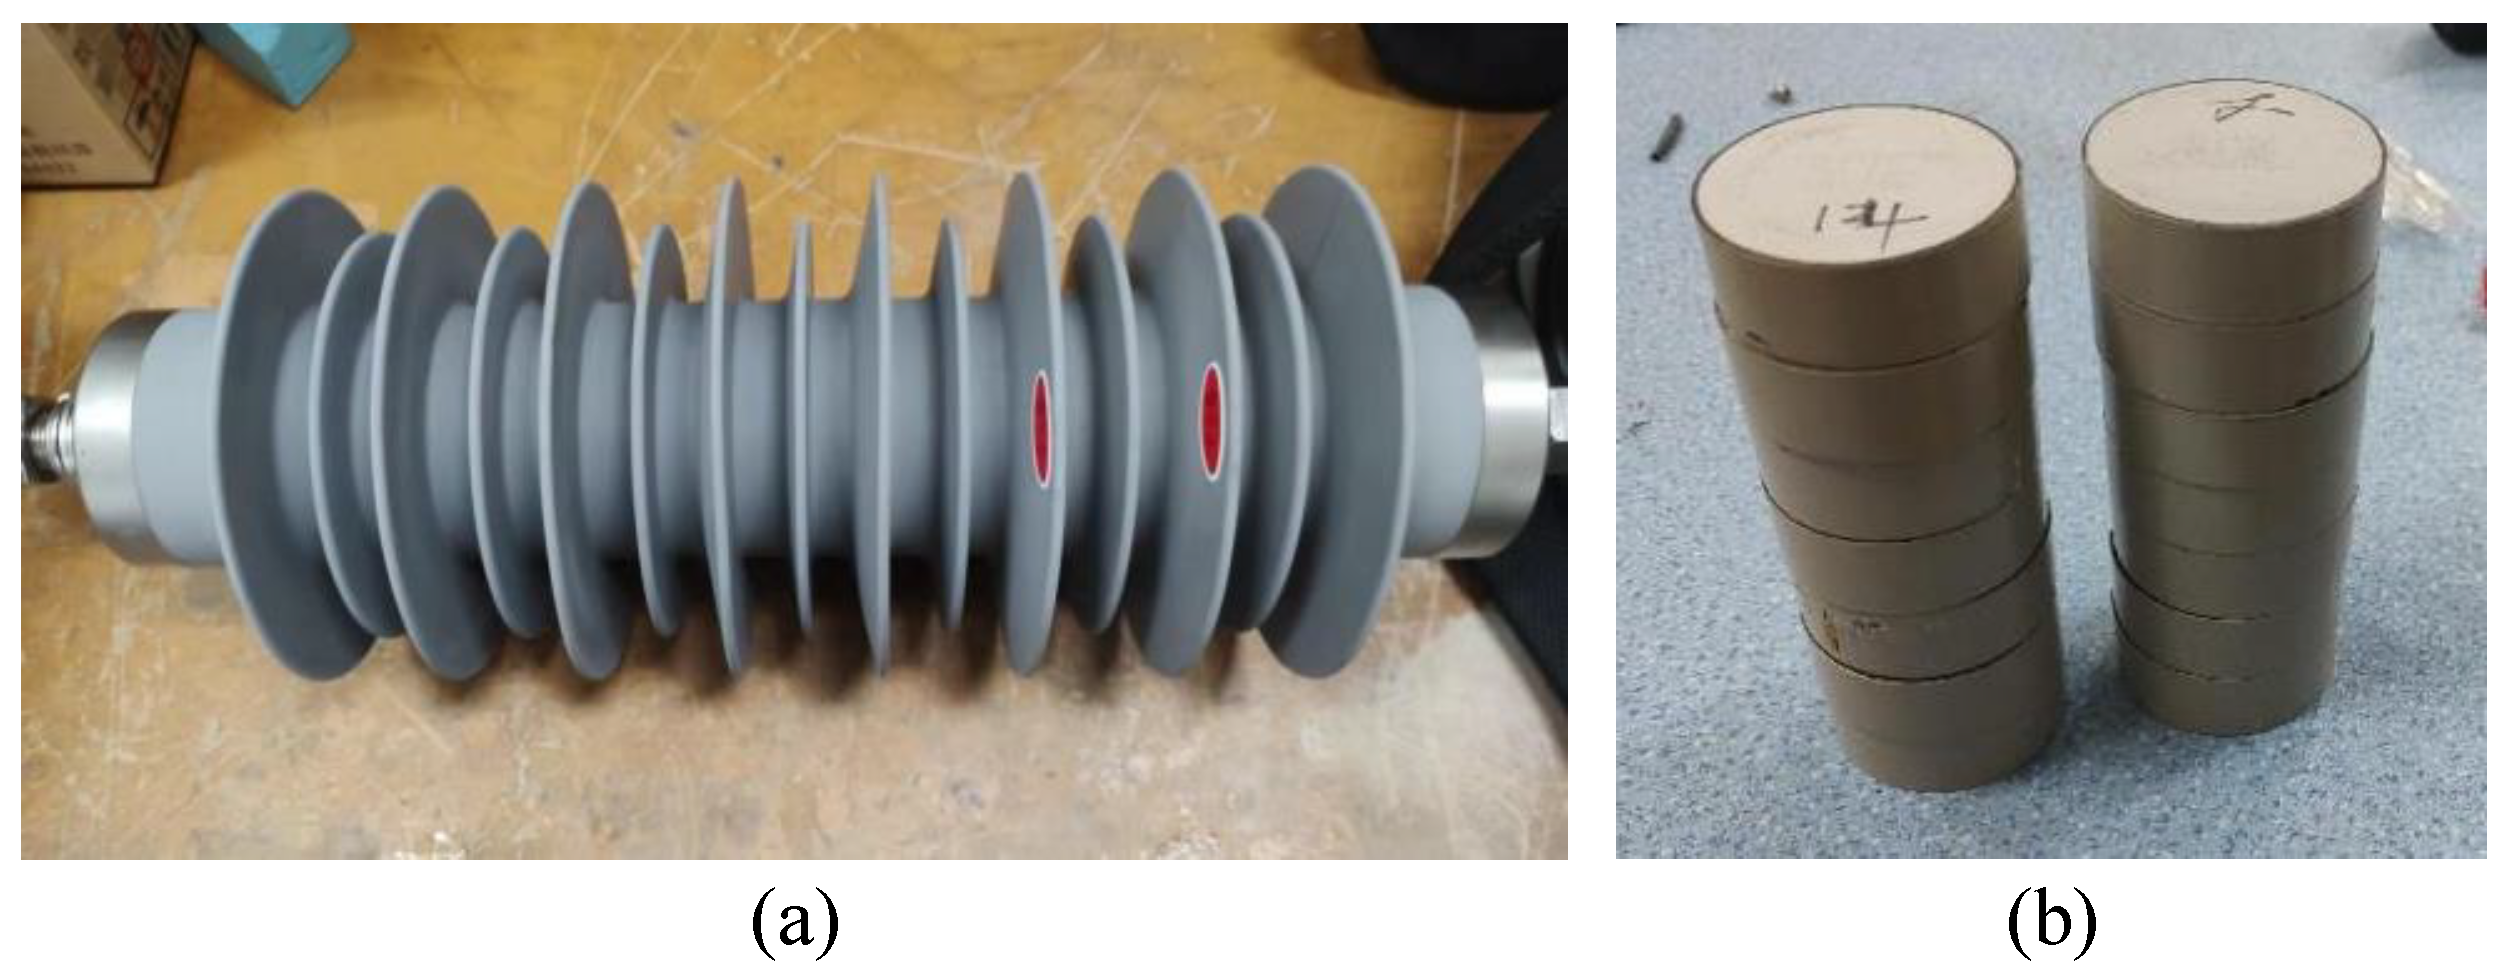
The experimental circuit for testing the locomotive arrester as well as its ZnO valve plates under a wide frequency band is designed as shown in Figure 2a. A programable power source is used to provide voltage excitation in the range of 0-5000 Hz. This voltage excitation is applied on the tested object, i.e., the arrester or valve plate, after an amplification step through a boost transformer with a turn ratio of 400 V : 200 kV (at 50 Hz). A resistance-capacitance (R-C) voltage divider, with a rated voltage of 100kV as well as a transformation ratio of 12775 : 1, is employed for voltage measurement. A current sensor, with a rated measurement range 0-100 mA and a ±0.05% precision, is used for the leakage current acquisition. A digital scope and a host PC with electrical analyzing software carry out the data sampling and analyzing tasks. According to this design, the experimental circuit is established in the high voltage laboratory as shown in Figure 2b. As shown in Figure 3, the YH10WT-42/105 arrester with its ZnO valve plates, a typical arrester model of Chinese electrical locomotives, is adopted as the tested object. Detailed parameters of the tested locomotive arrester are given in Table 1. By respectively applying fundamental voltage, harmonic voltage, and combination voltage on the arrester and valve plates, three sets of tests are carried out as presented in following subsections.

2.3. Test 1: Electrical Characteristics of Arrester under Fundamental Voltage

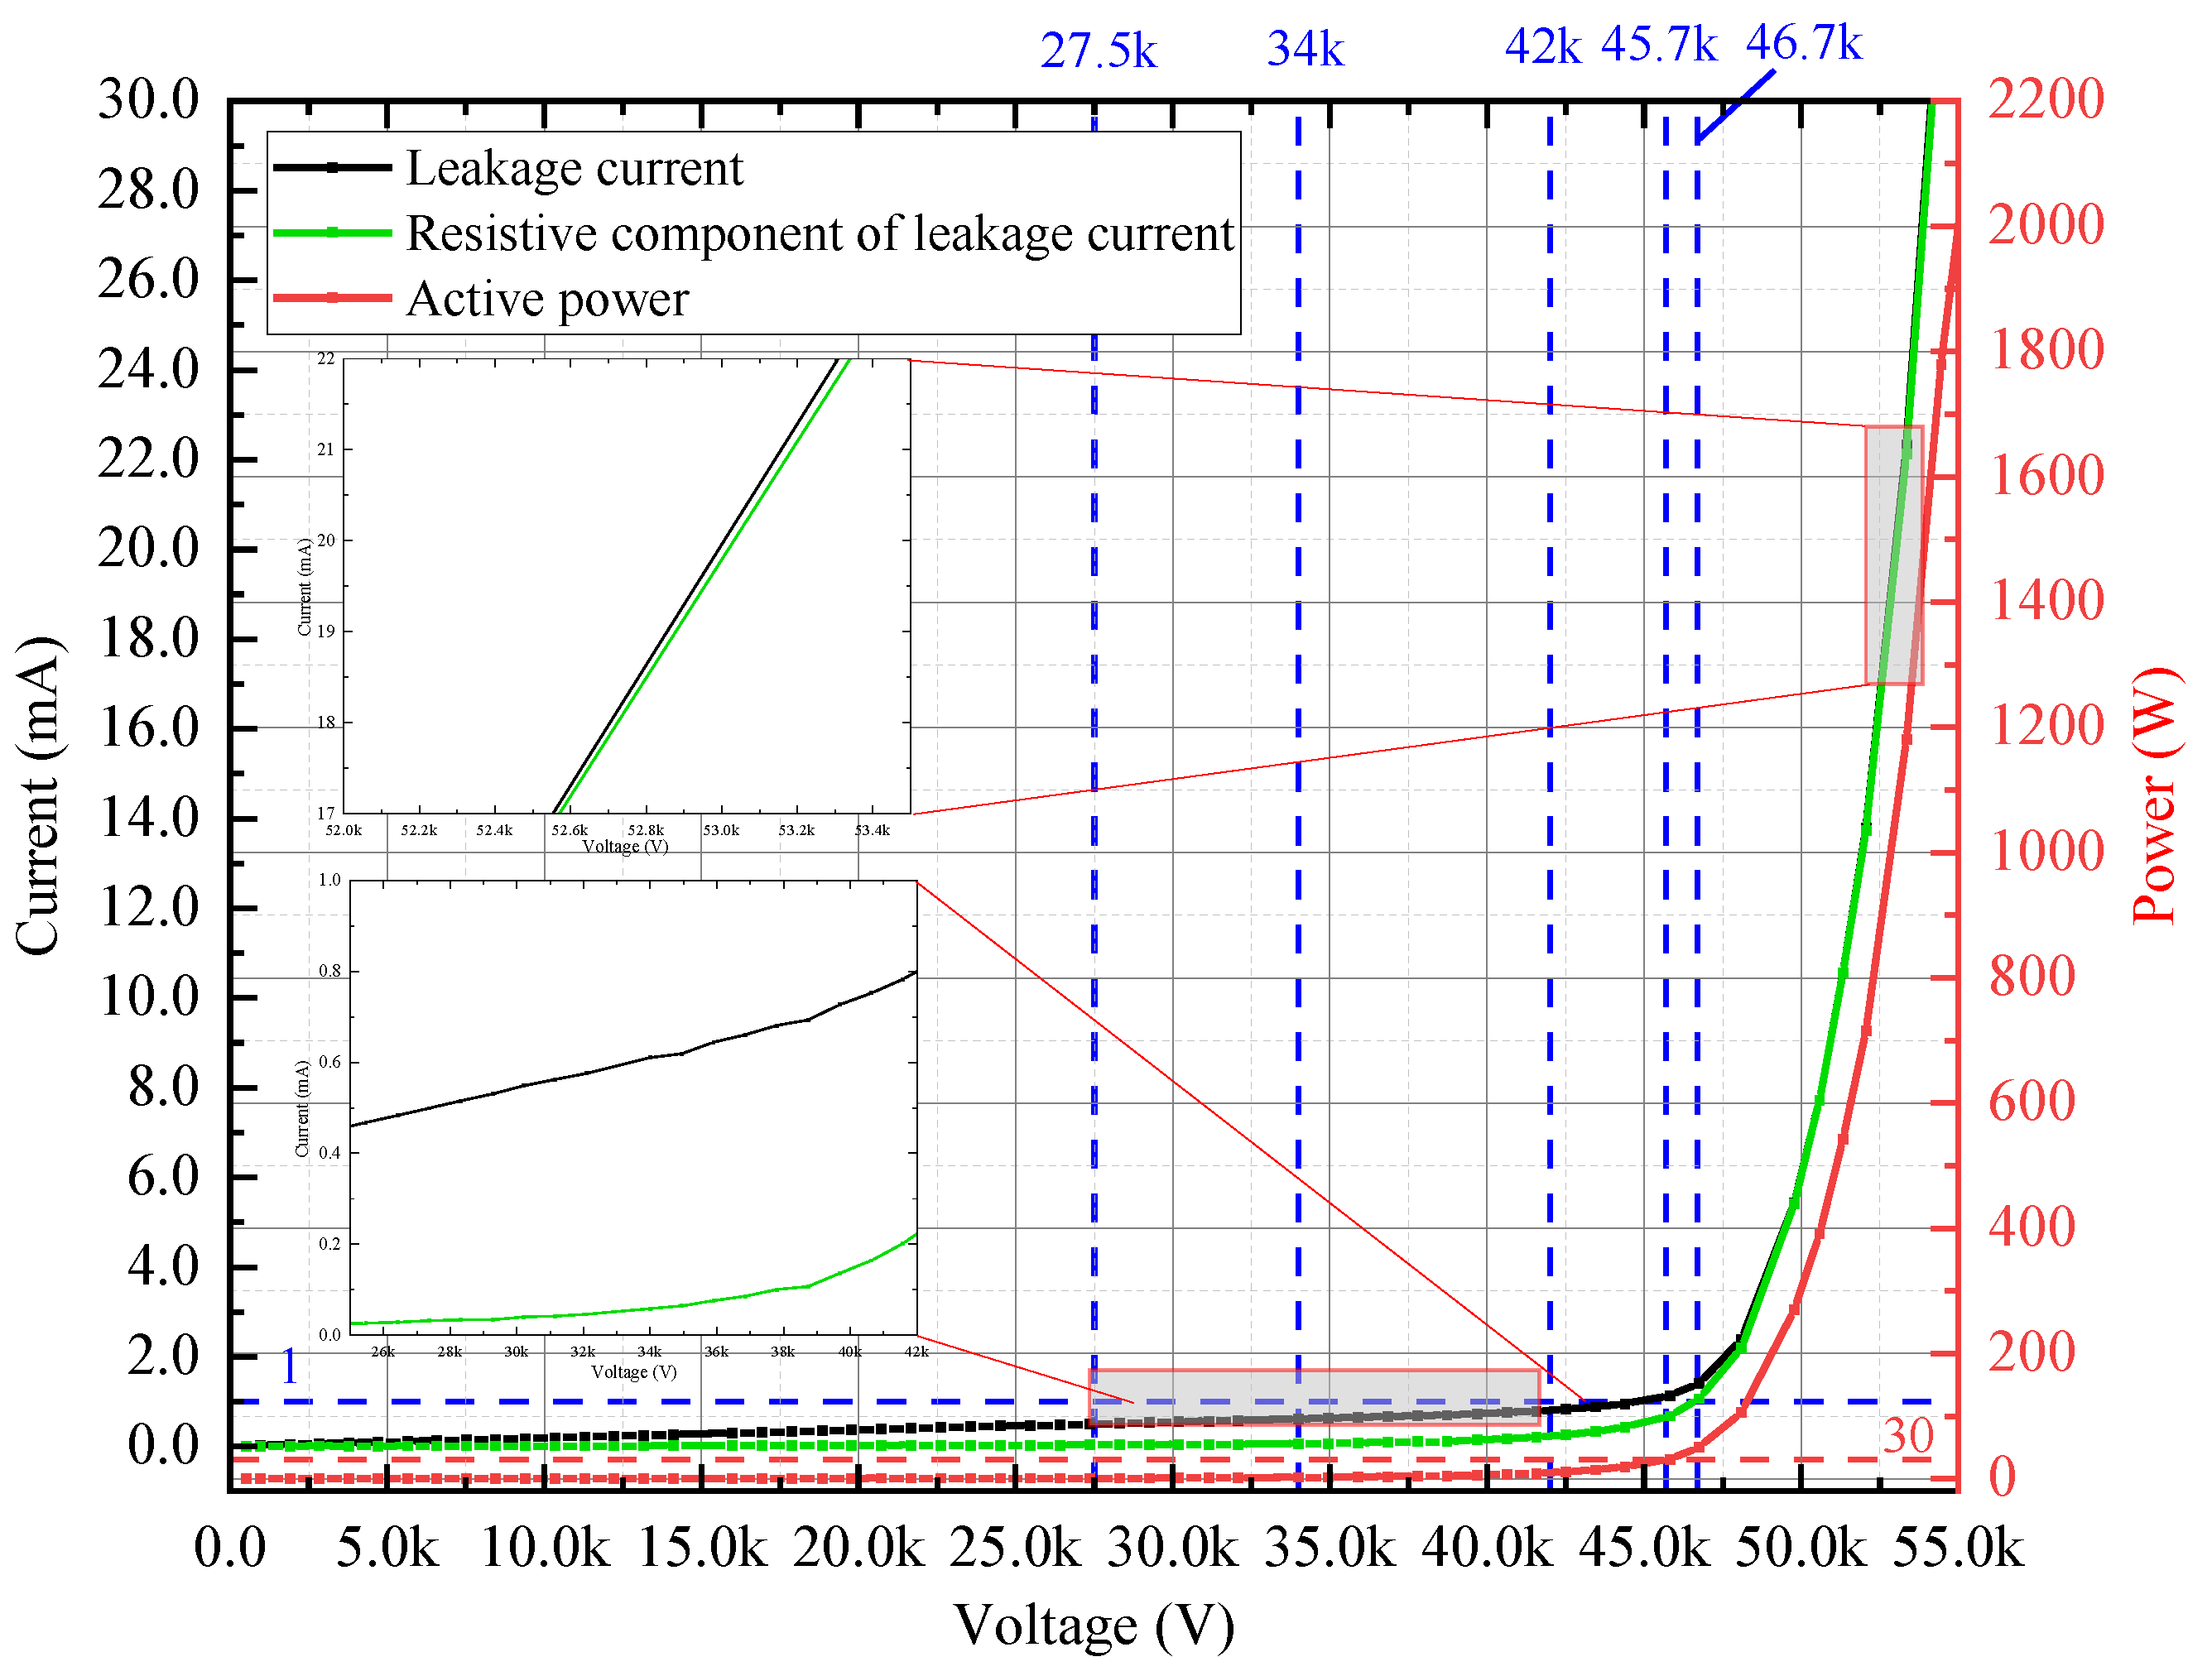
First, 0-55 kV fundamental voltage is applied on the arrester for obtaining its electrical characteristics. The tested results of Figure 4 demonstrates that when the voltage applied less than rated voltage (42 kV), the leakage current is very small (less than 0.8 mA) and keeps a linear correlation with the voltage, indicating that the arrester operates within the linear range (see Region Ⅰof Figure 1a). When exceeding the rated voltage, the arrester operation turns to the nonlinear range (see Region Ⅱ of Figure 1a), causing a rapid increase in leakage current. This effect becomes more evident when the leakage current exceeds 1 mA (requiring 45.7 kV voltage) corresponding to 30 W active power. It is obvious that the resistive component of leakage current and the active power are with similar tendencies to the leakage current. At the voltage value of 46.7 kV, the resistive leakage current reaches 1mA. By observing and comparing the two zooming in parts of Figure 4, it is found that the resistive component of the leakage current is much smaller than the total leakage current in the linear region (lower applied voltage), while it becomes the dominant component when turns to the nonlinear region (higher applied voltage). This means that increasing the voltage applied on the arrester will result in a considerable heat generation which is also reflected by the nonlinear increase of the active power (red line in Figure 4).
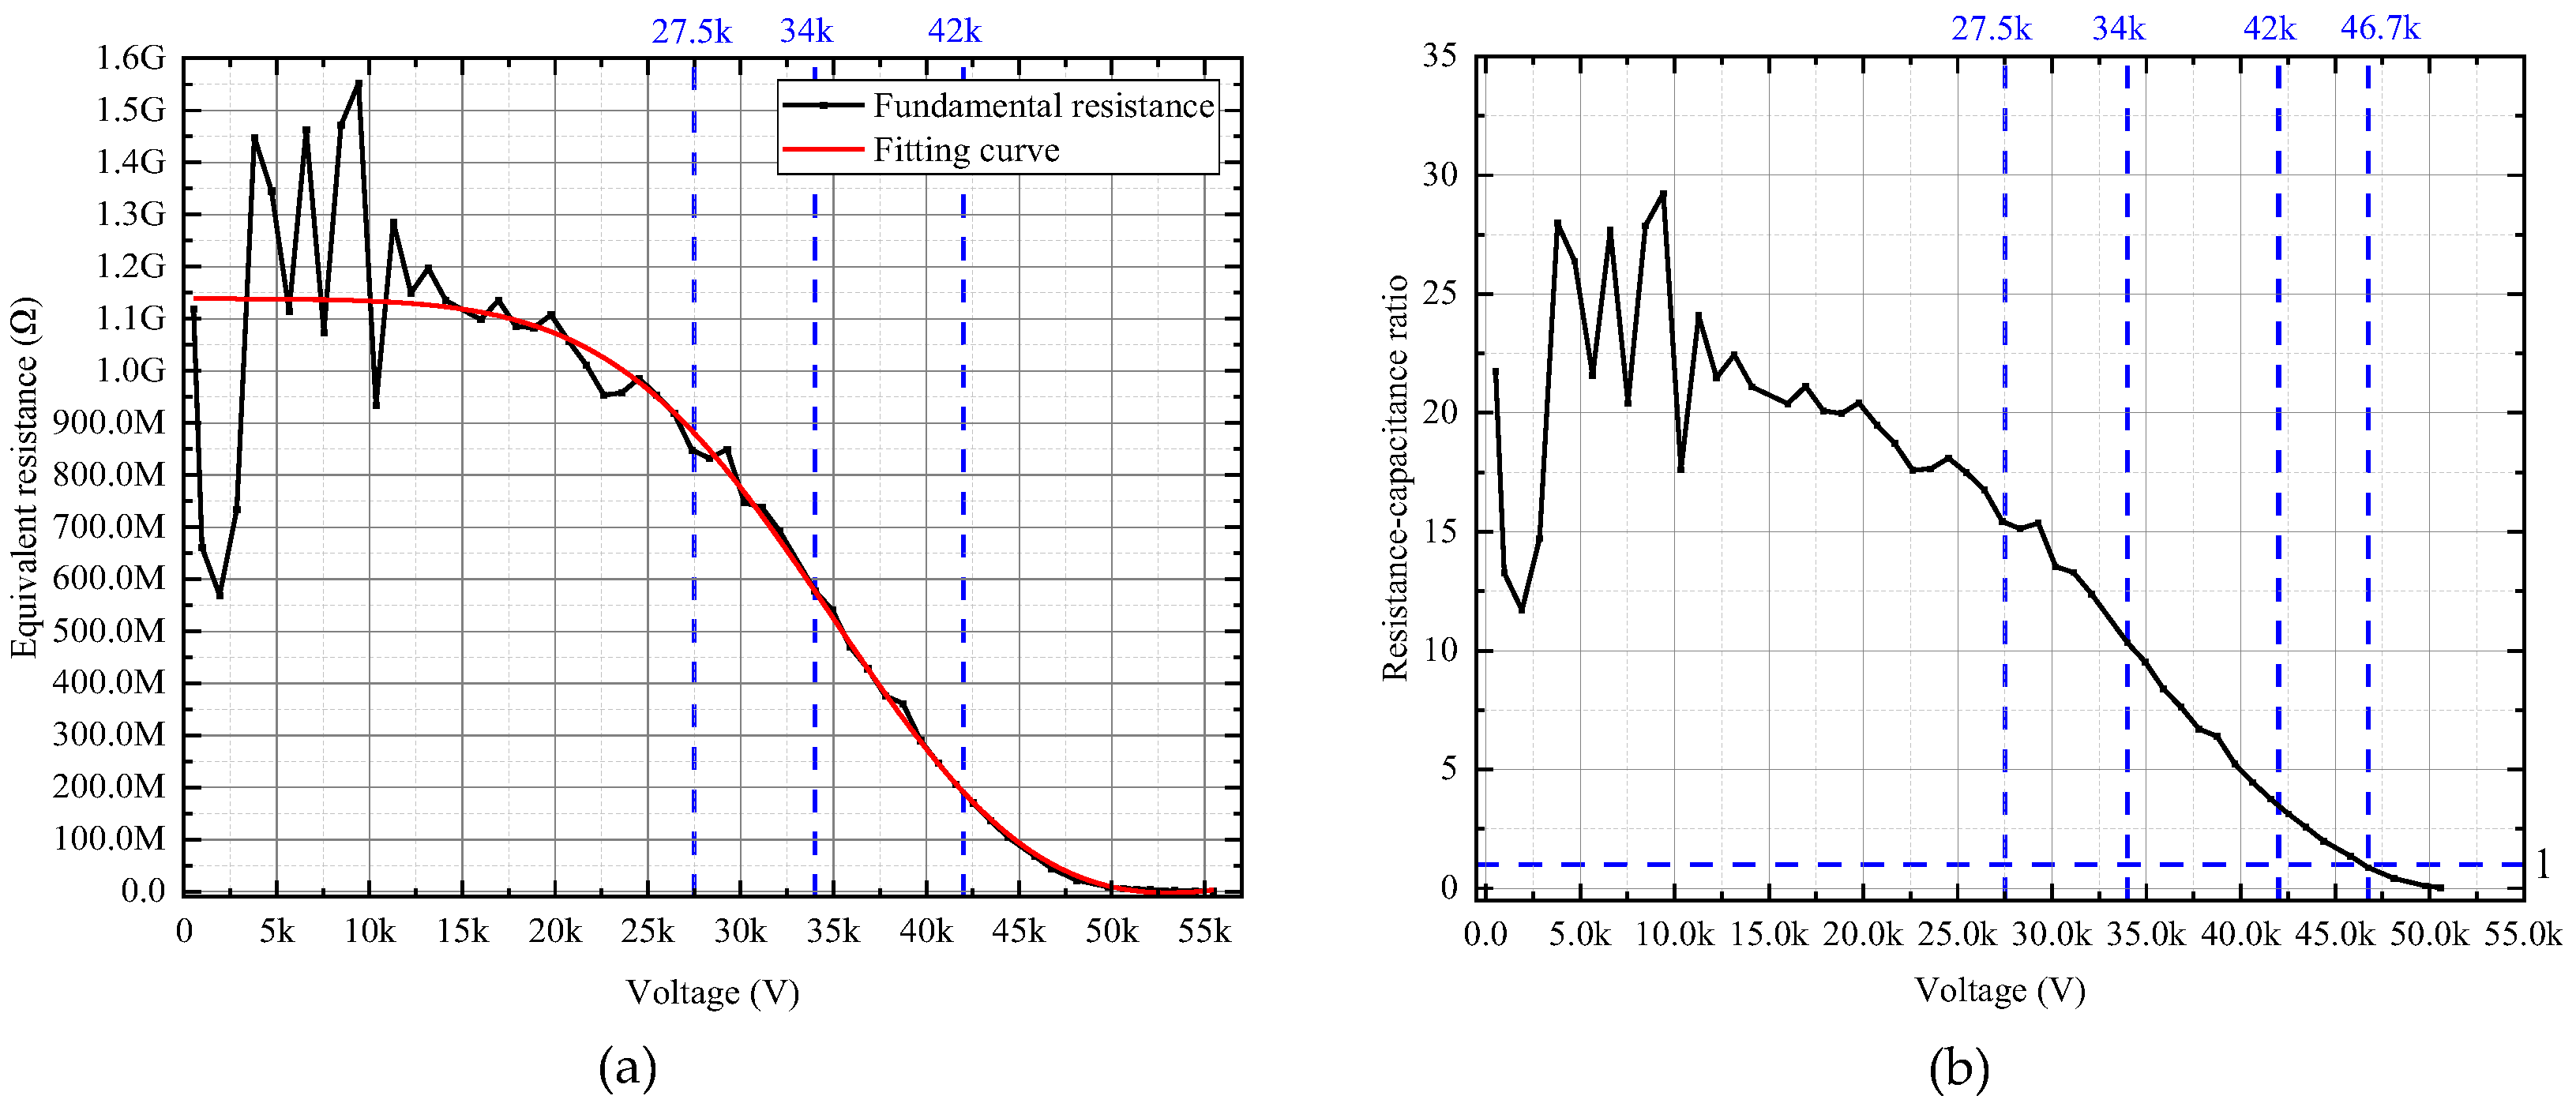
Figure 5a demonstrates a decrease in the equivalent resistance of the arrester as the applied voltage increases. When the voltage is below the rated voltage of the contact supply network (27.5 kV for Chinese cases), the equivalent resistance value is greater than 900 MΩ. At continuous operating voltage (34 kV), the value is 600 MΩ. For the rated voltage (42 kV), this value decreases to 200 MΩ. Keeping increase the voltage, it will further decrease to below 100 MΩ. It should be noted that within the low voltage range, the measured results exhibit a significant fluctuation due to the limited sensor precision for very small leakage current signal. However, it is remedied by the fitting curve. A similar varying tendency of the ratio of equivalent resistance (Rp) to equivalent capacitive reactance (1/jωCp) of the simplified arrester loss model (refer to Figure 1c) is shown in Figure 5b. It can be assumed that although the equivalent resistance apparently decreases along with the voltage increase, the equivalent reactance value keeps stable. Specifically, as the arrester operation turns to the nonlinear region, the ratio goes below 1 meaning that the ratio can be chosen as an index for PHM purposes.
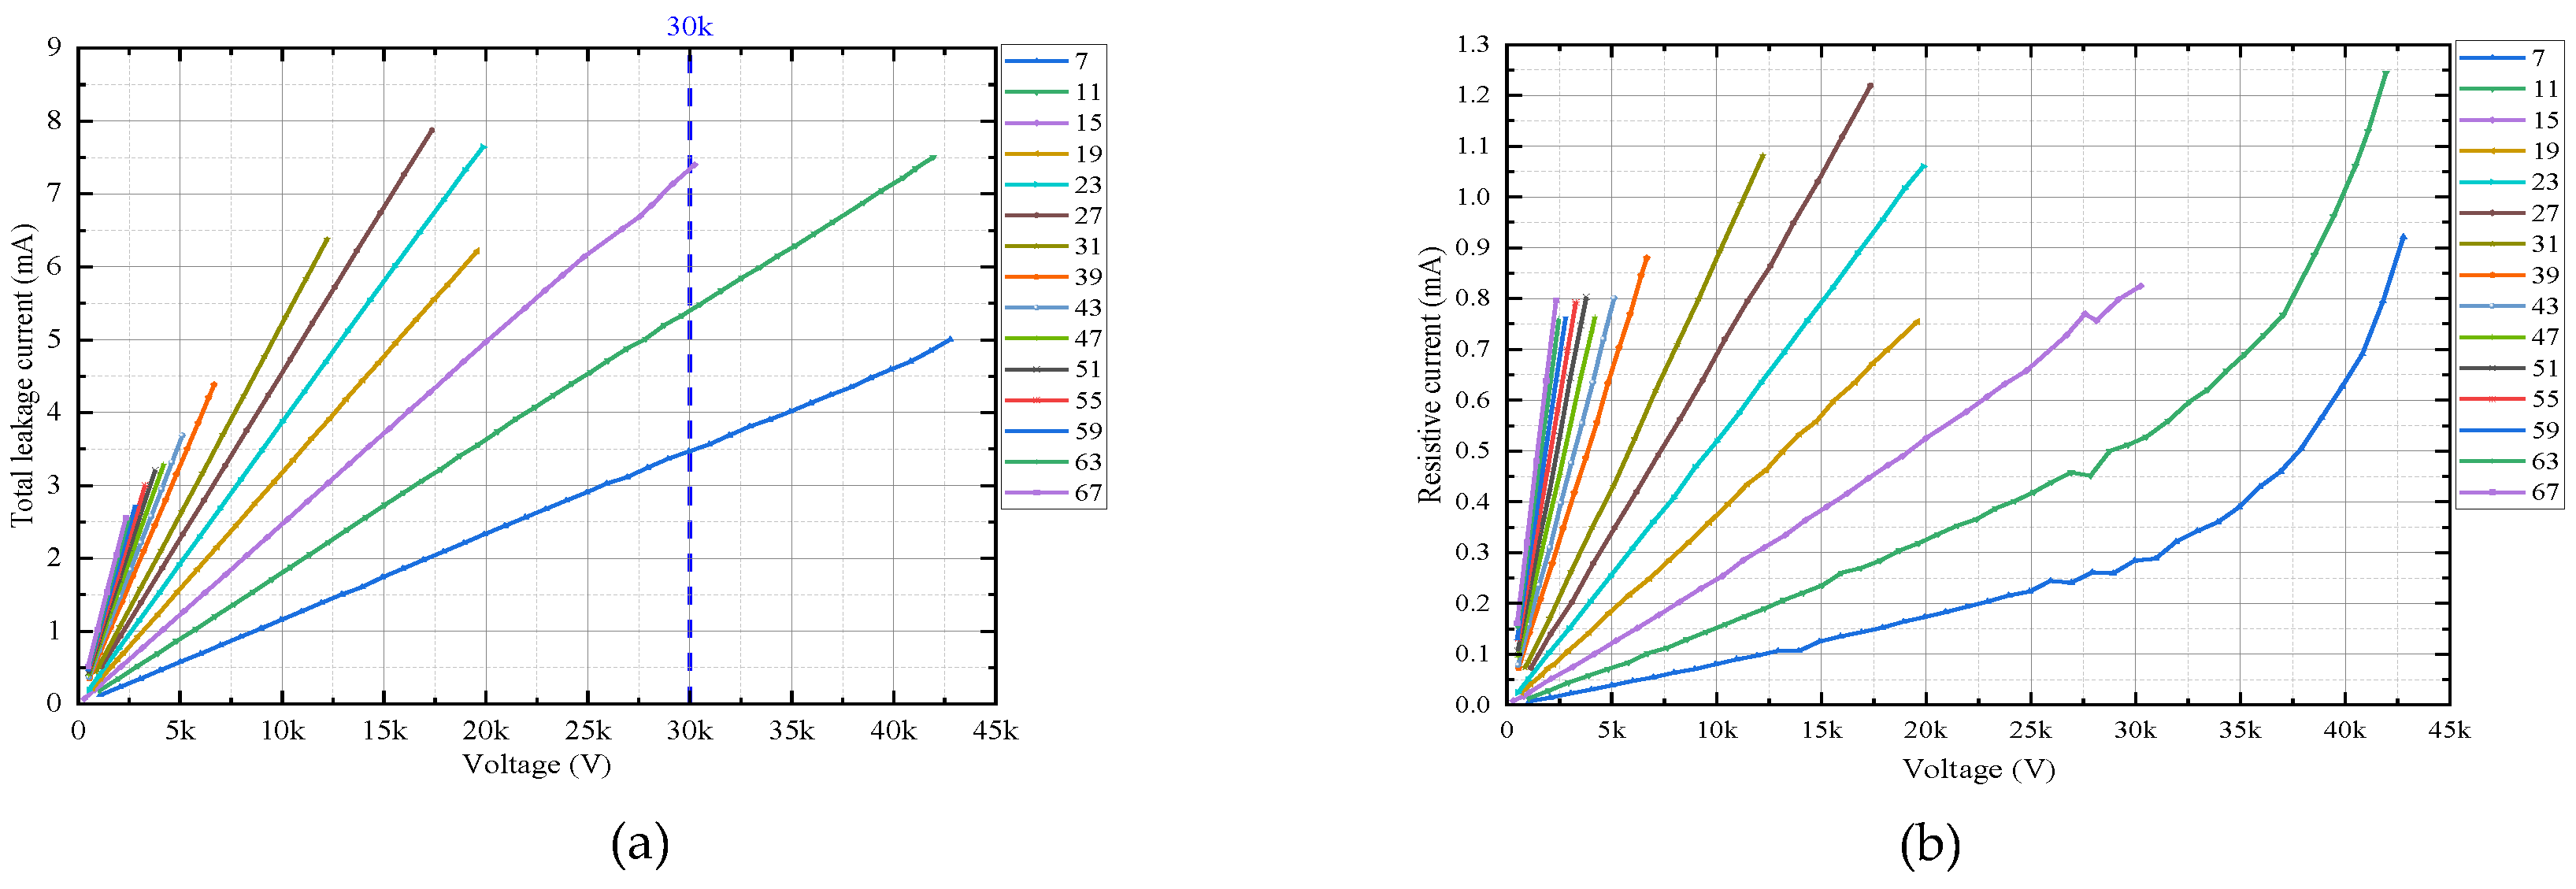
To investigate the volt-ampere properties of arresters when subjected to high-order harmonic voltages of the traction supply network, 7th (350 Hz) to the 67th (3350 Hz) harmonic voltages are applied on the arrester. Figure 6a demonstrates a linear correlation between voltage and leakage current at various frequencies when the voltage applied is below 42kV. It is apparent that for a same voltage amplitude, the leakage current increases along with the voltage frequency increase, e.g., the leakage current is 3.5 mA for 30kV, 7th harmonic voltage, 5.5 mA and 7.3 mA for the 11th and the 15th harmonics respectively with the same amplitude. The main reason is that referring to the circuit model of Figure 1c the equivalent resistance value of the arrester is extreme large within the low voltage range, so that the equivalent capacitive reactance, which is a frequency dependent quantity, dominates the arrester equivalent impedance. The very small values of resistive component of the leakage current of Figure 6b also proves this opinion. However, it looks strange that the resistive current, commonly seen as frequency independent, still increases with the voltage frequency which is similar to the total leakage current. This can be explained by the equivalent circuit mode of Figure 1b, where a polarization branch exists. Particularly, under the low voltage range, the polarization resistance is the dominant component of the equivalent resistance of the arrester. Obviously, the polarization branch, consisting of a resistor and a capacitor connected in series, is frequency dependent.
It should be noted that the tested results obtained in this set of tests just show the arrester linear properties under harmonic voltages. This owes to the limited transformation ratio of the boost transformer in high frequency range. The tested arrester consists of fourteen ZnO valve plates, so that less harmonic voltage can lead a single valve plate operating in its nonlinear region. Thus, the single ZnO valve plate of the arrester is chosen as the tested object for following high frequency tests.

2.4. Test 2: Valve Plate Electrical Characteristics under Harmonic Voltages

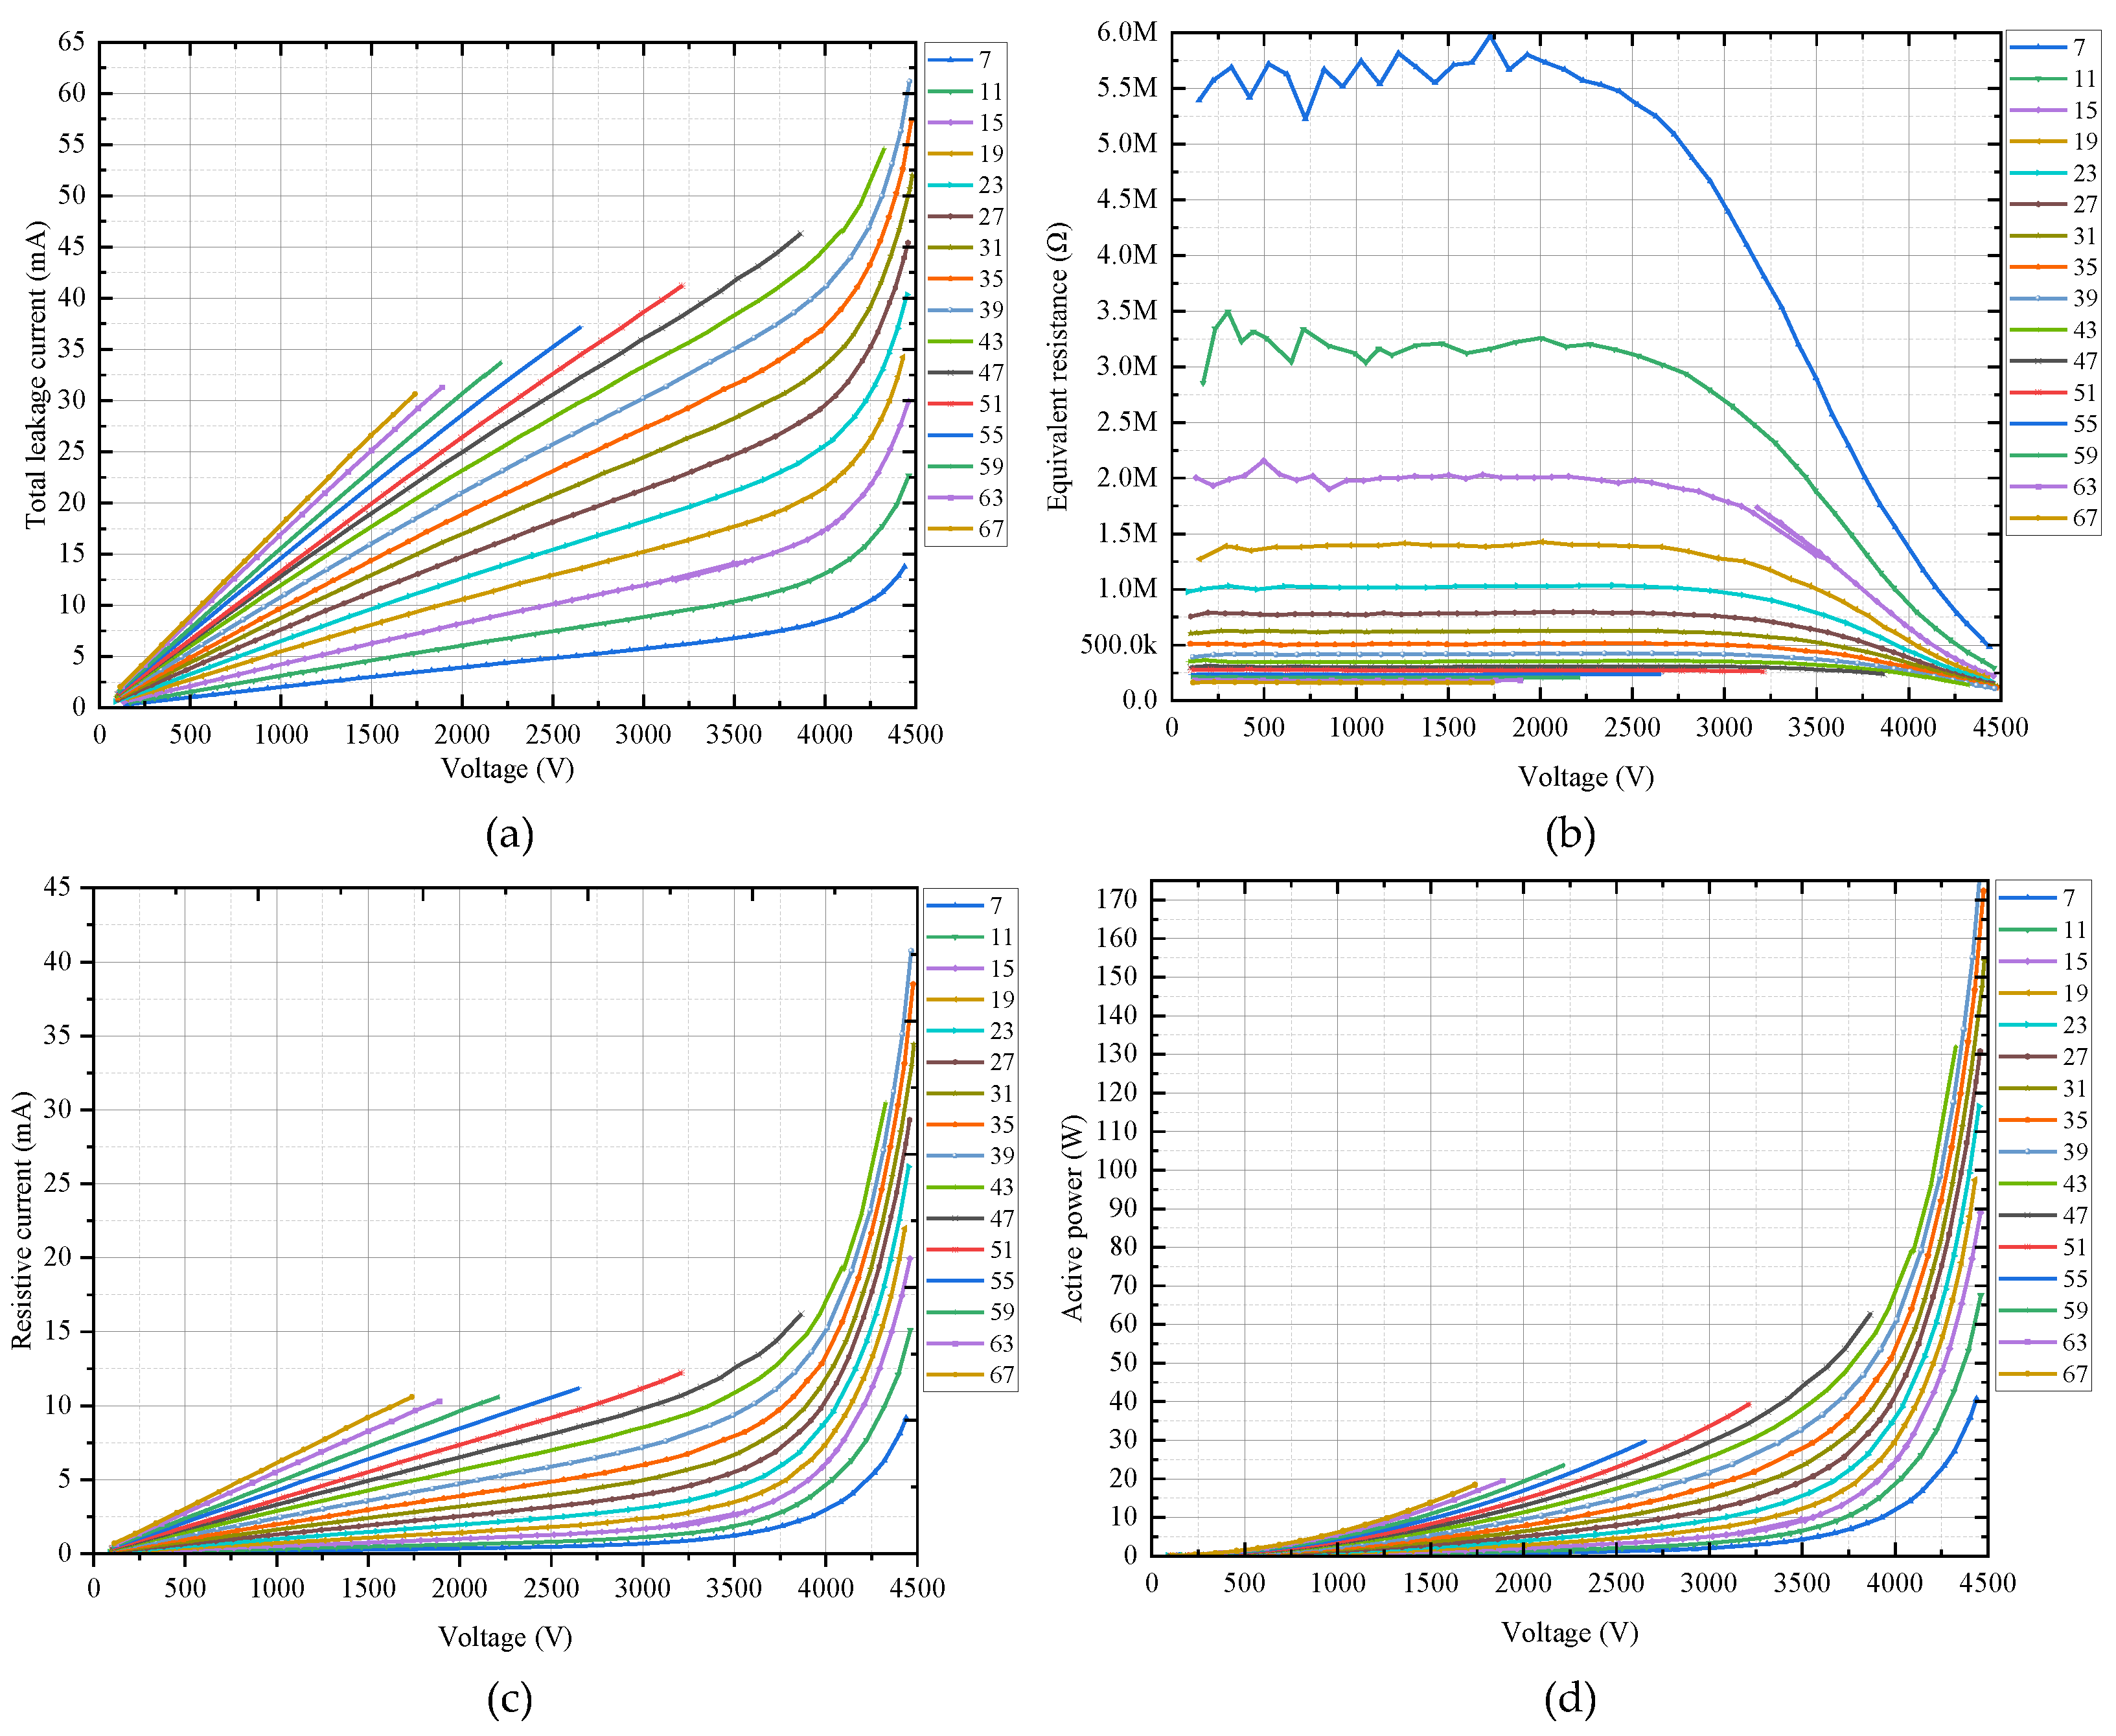
Harmonic voltages from 7th to 67th are applied on the ZnO valve plate. As shown in Figure 7a, the leakage current of the valve plate exhibits a linear correlation with the voltage under 4000 V regardless of the frequency. Exceeding 4000 V, the leakage current shows a nonlinear increase. The equivalent resistance given in Figure 7b remains constant under low voltage range for each frequency, while it shows a negative correlation with the frequency. In fact, this is consistent to the arrester property within linear region shown in Figure 6. It is noteworthy that with the increase of the applied voltage the equivalent resistance reduces nonlinearly, and tends to be frequency independent. This evidence that as voltage increase the valve plate enters nonlinear operation region with a rapid increase in its conductance, i.e., the equivalent resistance R representing the conductance branch of the circuit model of Figure 1b becomes the dominant. In other word, it is proved that a high electric field intensity leads to an increase in conductivity of the valve plate material. Specifically, the equivalent resistance goes below 300 kΩ when the voltage close to 4500 V except the 7th harmonic. As results, the nonlinearities of the resistive current and the active power are given in Figure 7c,d which are similar to what were found by arrester fundamental tests (see Figure 4).
So far, the tests prove that no matter what frequency, an overvoltage with high enough amplitude leads the arrester, or say the ZnO valve plate, entering its nonlinear operation region; while the influence of frequency is only significant in the low voltage range, i.e., linear region. The reason is that the electrical properties of ZnO dielectric mainly depend on its capacitance effect under lower voltage range; yet, it is dominated by the conductive effect in the nonlinear region since the rapidly increased conductivity under the higher voltage. However, according operation experience, the fact is that the fundamental voltage of traction supply network is generally stable (around the rated 27.5 kV) even if a resonance happens, and it is difficult to each high frequency harmonic voltage to exceeds 15 kV during the resonance [16,17]. It is to say that both fundamental voltage and harmonic voltage of the traction supply network have not reached the value that would cause the arrester entering its nonlinear operation region. This is not enough to support the claim that under continuous harmonic overvoltage, the arrester operates in nonlinear region, resulting in its (resistive) leakage current rapid increase, then heat accumulation. However, it should be considered that in actual operation, especially during the resonance, the voltage applied on the arrester simultaneously includes fundamental and large amount of harmonic components. Consequently, the next set of tests is carried out for investigating the electrical characteristics of ZnO valve plate under combination voltage, i.e., fundamental superposed by multiple harmonics.

2.5. Test 3: Valve Plate Electrical Characteristics under Voltage Combination of Fundamental and Harmonics

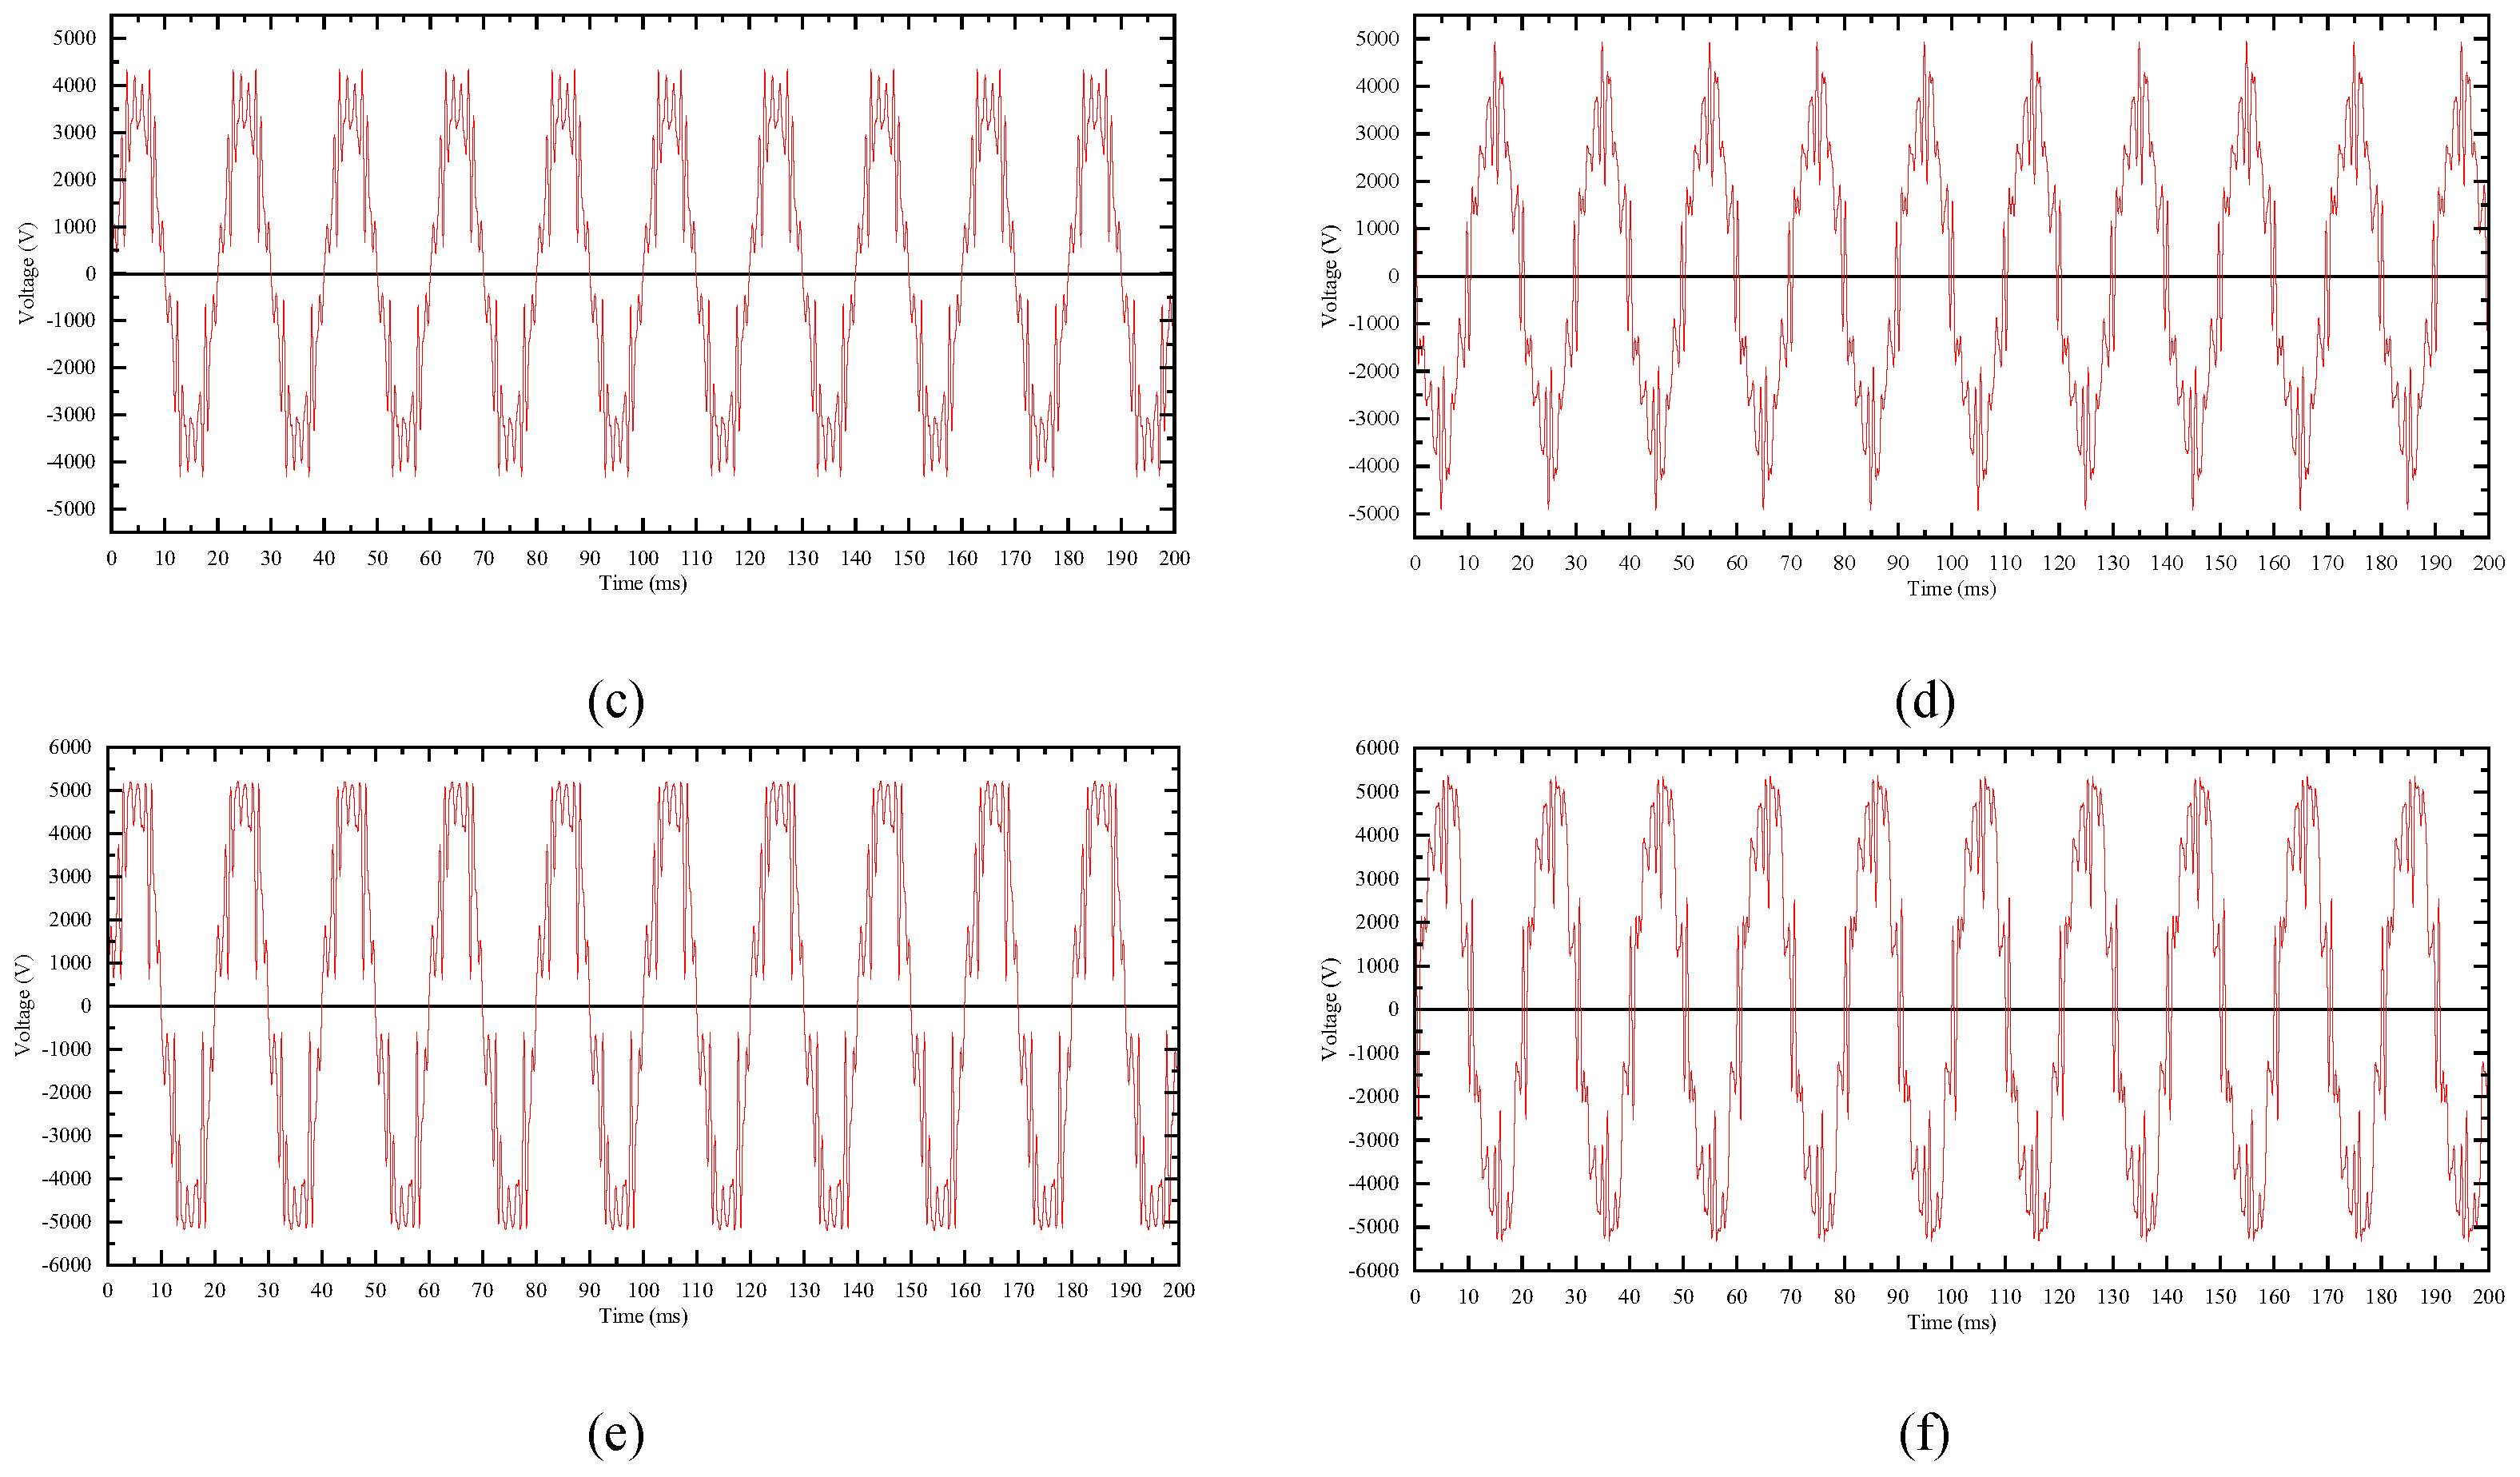
The last set of tests consider six combination voltages which are divided into three groups as shown in Table 2. In each group, the fundamental as well as four harmonics are set to same amplitudes in root-mean-square (RMS). The fundamental voltage values of 2000 V, 2500 V and 3000V are related to one-fourteenth of the traction supply network voltage (27.5 kV), continuous operating voltage (34 kV), and rated voltage (42 kV). By controlling phase angles of the harmonics, different peak values of the combination voltage waveforms are obtained as shown in Figure 8.
By comparing the results of group 1-1 and group 1-2 given in Table 2, it is found that for a same fundamental voltage of 2000 V linking to 28 kV for a whole arrester, the equivalent resistance of the valve plate decreases by 56%, and its active power generated by the fundamental voltage increased to over 2.5 times which are attributed to the 20% increase in the peaks of the combination voltages. Additionally, the total active power, i.e., lose, increases by 77%. This indicates that in traction supply network a severely distorted voltage, with relatively high peak value, consisting of a normal fundamental and relatively high amount of harmonic components, which is generally appears during the resonance, can lead the arrester to enter its nonlinear operation region generating considerable leakage current as well as heat. Similar results of the rest groups of the tests also support the conclusion. In fact, high peak value of the combination voltage means high electric field intensity which is the incentive leading the increase in conductivity of the valve plate material.
To sum up, according to the study provided in this section, it is proved that: i) in nonlinear region a small voltage increase will generates a rapid increase in arrester leakage current especially its active component which is the excitation of heat; ii) a high enough voltage regardless of its frequency can lead to the arrester nonlinearity; iii) resonance voltage of the traction supply network, which can also provide a high amplitude of electric field intensity, may lead to the nonlinearity as well. Another important information is that the resonance can last for a relatively long time making it possible for heat accumulation. Such findings not only explain the locomotive faults, also provide valuable reference for designing arrester monitoring plan.

3. PHM Design for Locomotive Arrest

3.1. PHM Architecture Design and Parameter Indicators

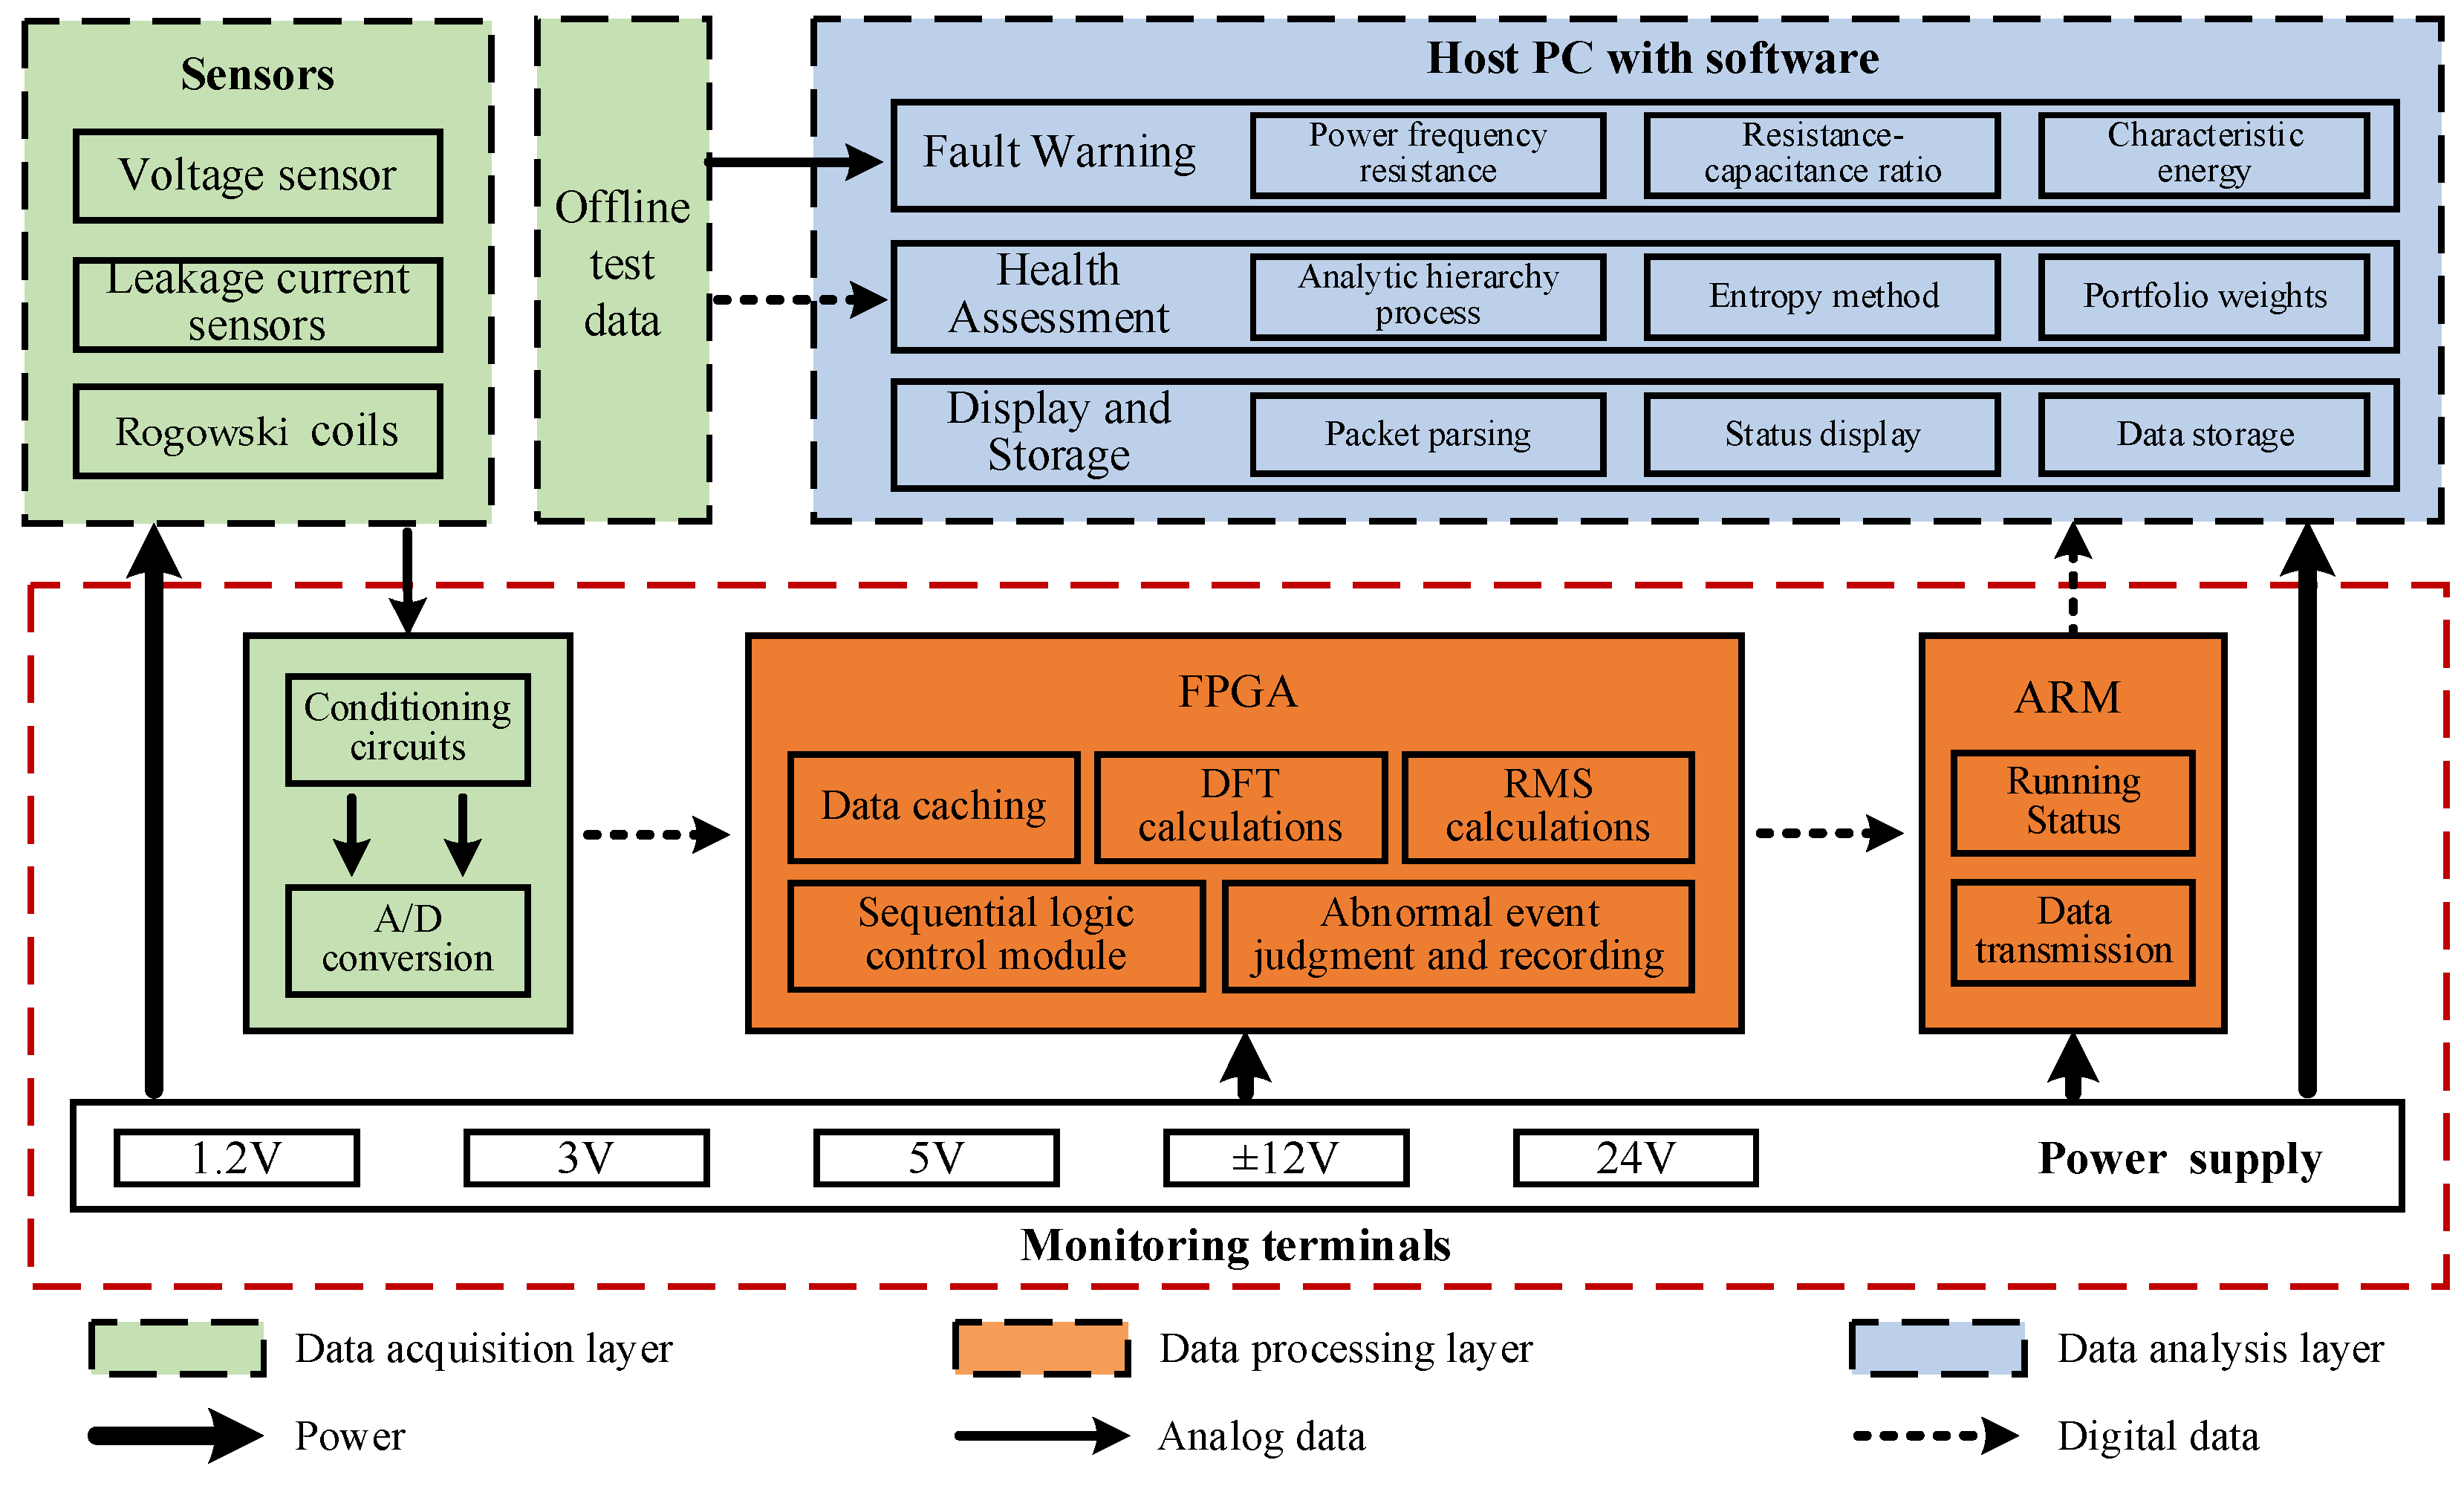
In response to enhance the locomotive arrester application and maintenance, a PHM system based on operation status online monitoring and health assessment algorithms is proposed. The configuration of the locomotive arrester PHM system is given in Figure 9, where the system is physically divided into three parts, i.e., the sensors, the monitoring terminal and the host PC with data analysis software. From the functional perspective, it is a three-layer system:
i) Data acquisition layer (see green blocks in Figure 9). A voltage sensor is utilized to measure the secondary voltage of the locomotive line-side potential transformer, i.e., acquiring the voltage signal applied on the arrester. The arrester leakage current is measured by a small range Hall current sensor. Additionally, a Rogowski coil is adopted to detect the extremely large leakage current when the arrester acting so as to count the arrester actions. Then all the measured analogue signals are conditioned and A/D converted.
ii) Data processing layer (see orange blocks in Figure 9). The basic architecture of this layer is formed by an FPGA chip and an ARM chip. The former is mainly responsible for the calculations of discrete Fourier transform (DFT), RMS and abnormal event judgment. The later accounts for operating status display and data communication with the host PC.
iii) Data analysis layer (see blue blocks in Figure 9). This is the top layer that executes fault warning and health assessment based on data processing results and relevant algorithms.
For the purposes of locomotive arrester PHM, the following technical indicators are designed:
  • Considering the characteristics of harmonic overvoltage on the traction supply network, 100-order harmonic analyzing ability is required. Thus, the voltage sensor and the leakage current sensor need a bandwidth over 5000 Hz.
  • According to the features of various transients, e.g., lightning impulse, the onboard vacuum circuit breaker open/close, the pantograph goes up/down, etc., the Rogowski coil requires a more than 1 MHz bandwidth.
  • To address the spectrum analysis demand, the A/D conversion stage is designed with a sampling rate ≥ 20 kHz, a resolution of 16bits and an accuracy ≤ 1%.
  • To ensure real-time performance, it is demanded to meet the computational ability that completing continuously ten power frequency cycles’ calculation of the RMS, peak value, and 100-order DFT within 1 second.

3.2. Fault Warning Method

Based on the test results above, a set of fault warning criteria for the locomotive arrester is designed as follows.
Arrester fundamental equivalent resistance warning
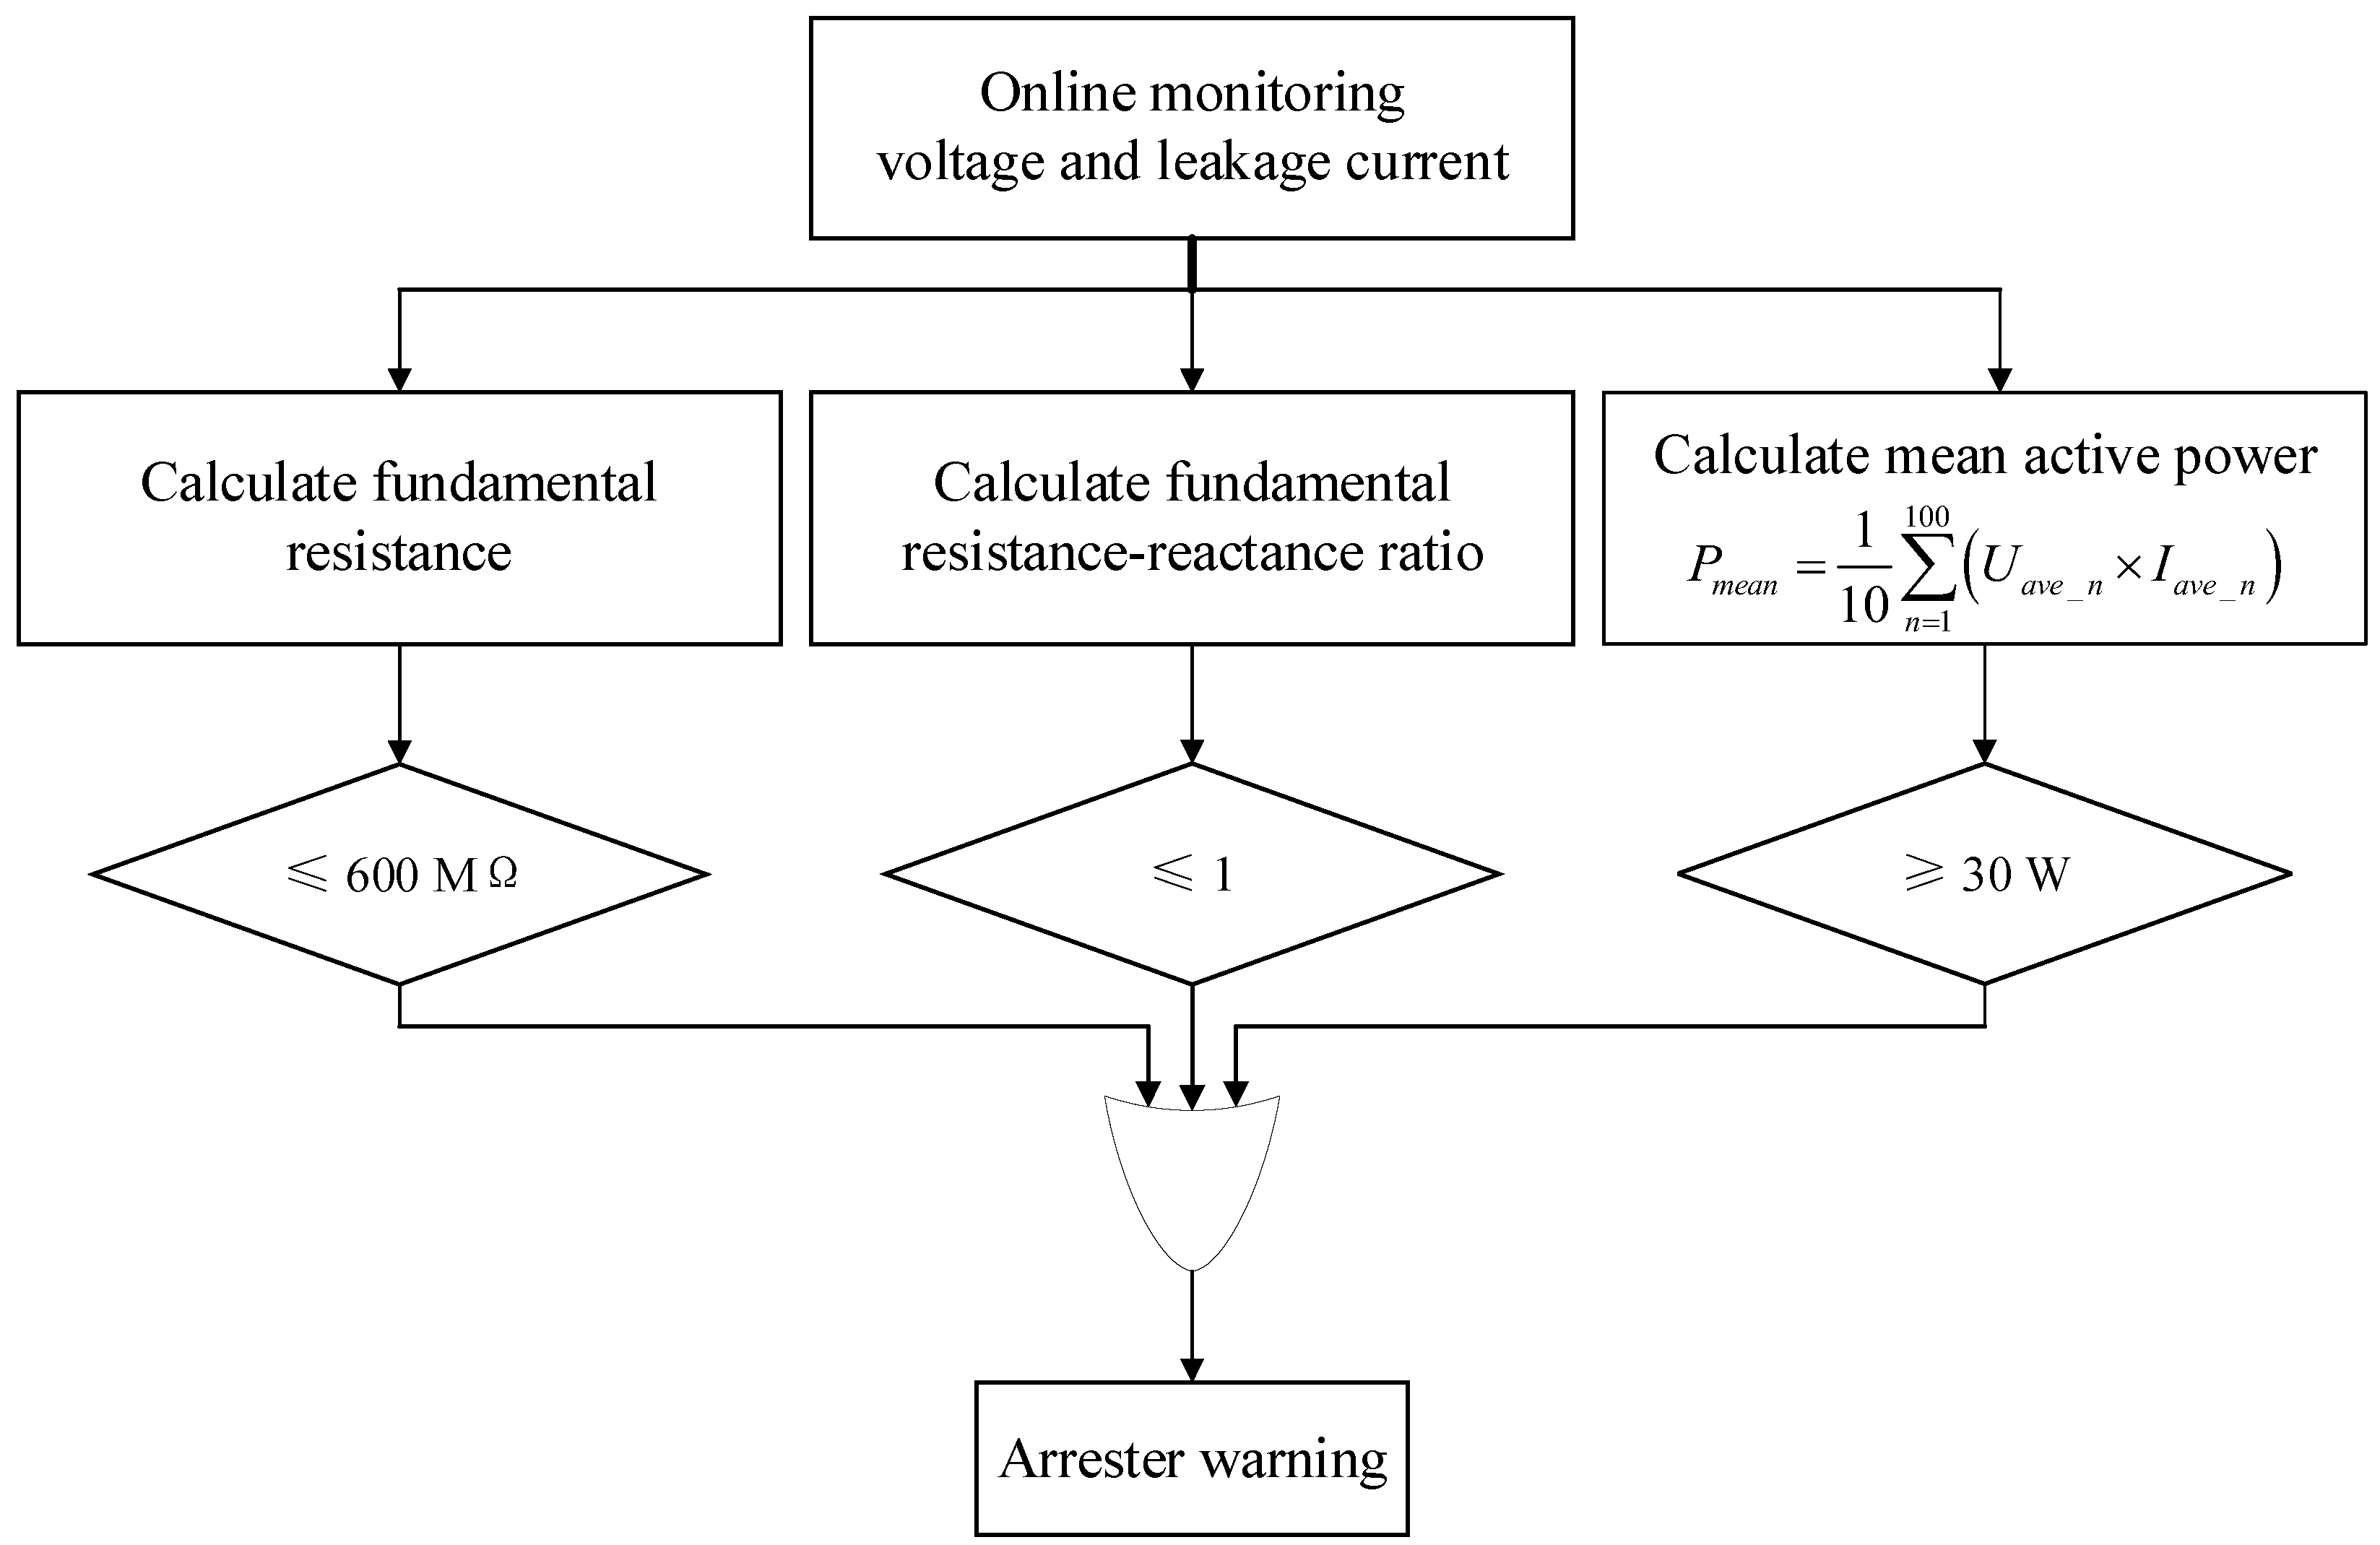
According to the results of Figure 4 and Figure 5a, to ensure the stable operation of the arrester, the threshold is set to 600 MΩ for fundamental equivalent resistance. Under a normal supply voltage, if the value of this index below the threshold value for a relatively long time, it is assumed that the arrester is severely aged and needs to be repaired or replaced in a timely manner.
Ratio of fundamental equivalent resistance to equivalent reactance for warning
According to the results of Figure 4 and Figure 5b, once the arrester operates in its nonlinear region, the ratio of the fundamental equivalent resistance to equivalent capacitive reactance will drop below 1. Therefore, this value is set as a threshold for this ratio. If the ratio falls below 1, a warning will be generated, since the arrester nonlinear operation, implying drastic heat generation, is not desirable.
Arrester active power warning
According to the results of Figure 4, the value of 30 W is set as the active power threshold since over this value the arrester becomes nonlinear. On the basis of the DFT solutions of the measured voltage and current, a total active power can be calculated by summing up every harmonic active power. Then the mean active power is defined as the mean of total active power of ten continuous cycles.
To sum up, a fault warning logic for the locomotive arrester is developed as shown in Figure 10.

3.3. Health Assessment Method

3.3.1. Health Status Indicators

To start with the health assessment task, it is essential to choose a series of indicators identifying the arrester health status. By synthetically considering the test results above, the description of common arrester defects in [27] (see Table A1 in Appendix A), as well as other relevant standard, e.g. reference [28], ten identifiers are selected for indicating the arrester health status as given in Table 3. The ten identifiers, consisting of online monitoring electrical parameter (I1), offline detection electrical parameters (I2~I5), and basic information of the arrester (I6~I10), are classified into five levels: "good", "normal", "attention", "abnormal", and "fault".

3.3.2. Evaluation Weight Analysis

To address the health assessment demand, the analytic hierarchy process (AHP) and entropy weight method are utilized to determine subjective weight and objective weight respectively. At last, they are combined using the geometric mean method.
AHP
Step 1: Taken into account the ten identifiers of Table 3, an evaluation index set is defined as {I1, I2, ..., I10}. All the elements are weighted by the 9-level scaling method [29] yielding a 10 × 10 judgment matrix A(I) = (aij), as given in Equation 1, representing the relative importance of the ten identifiers to the arrester health status.
A ( I ) = 1 3 3 3 3 4 4 4 4 5 1 / 3 1 2 1 3 3 3 3 3 4 1 / 3 1 / 2 1 1 / 2 1 1 1 2 2 3 1 / 3 1 2 1 2 2 3 3 3 3 1 / 3 1 / 3 1 1 / 2 1 2 2 2 2 3 1 / 4 1 / 3 1 1 / 2 1 / 2 1 1 2 2 3 1 / 4 1 / 3 1 1 / 3 1 / 2 1 1 1 1 2 1 / 4 1 / 3 1 / 2 1 / 3 1 / 2 1 / 2 1 1 1 2 1 / 4 1 / 3 1 / 2 1 / 3 1 / 2 1 / 2 1 1 1 2 1 / 5 1 / 4 1 / 3 1 / 3 1 / 3 1 / 3 1 / 2 1 / 2 1 / 2 1
Step 2: The maximum eigenvalue λmax of A(I) is calculated at 10.2993. Then consistency check of the matrix A(I) is carried out by Equation 2 [30]:
C R = λ max n n 1 R I
For this case, n = 10, the mean random consistency index (RI) is set to 1.49. The result of consistency ratio (CR) is obtained at 0.02232 which is less than 0.1, i.e., the consistency check is passed.
Step 3: The subjective weights of the ten identifiers are obtained through Equation 3:
w 1 _ i = 1 n j = 1 n a i j k = 1 n a k j
where, n = 10 in this case and w1_i is the subjective weight of the identifier Ii (i = 1, 2, …10). As a result, the subjective weight set W1 = [w1-1, w1-2, ..., w1-10] of the arrester health status identifiers is acquired:
W 1 ( I ) = 0.264 0.158 0.082 0.14 0.092 0.074 0.058 0.05 0.05 0.032
Entropy weight method
Step 1: Based on offline tests and online monitoring, 5 data sets of the identifiers are adopted as an example for calculating the objective weights. So that, a 5 × 10 original index matrix X(I)=(xij) is established as given in Equation 5.
X ( I ) = 0 . 48 64 . 5 22 47.3 1 . 43 2 0 . 84 0 . 88 0 . 86 0 . 84 0 . 45 66.8 20 49.1 1 . 34 2 0 . 92 0 . 86 0 . 90 0 . 86 0 . 47 65.2 19 48.2 1.32 3 0.86 0 . 92 0 . 94 0 . 92 0 . 46 66.5 17 48 . 5 1.40 1 0.90 0 . 94 0 . 92 0 . 88 0 . 49 64.3 24 46.7 1.37 2 0 . 94 0 . 88 0.88 0 . 84
Step 2: The X(I) needs to be normalized. Since the larger values of I2, I4, I5 and I7~I10, the higher health score of the arrester is, Equation 6 is used to normalize them. On the contrary, I1, I3 and I6 are normalized by Equation 7 because of their negative correlation to the health score [31]. As a result, the normalized matrix B(I) is obtained as presented in Equation 8.
b i j = x i j min ( x j ) max ( x j ) min ( x j )
b i j = max ( x j ) x i j max ( x j ) min ( x j )
B ( I ) = 0 . 250 0 . 080 0 . 286 0 . 250 1 . 000 0 . 500 0 . 001 0 . 250 0 . 001 0 . 001 1.000 1.000 0 . 571 1 . 000 0 . 182 0 . 500 0 . 800 0 . 001 0 . 500 0 . 250 0 . 500 0 . 360 0 . 714 0 . 625 0 . 001 0 . 001 0.200 0 . 750 1.000 1.000 0 . 750 0 . 880 1.000 0 . 750 0 . 727 1.000 0.600 1.000 0 . 750 0 . 500 0 . 001 0 . 001 0 . 001 0 . 001 0 . 455 0 . 500 1.000 0 . 250 0.250 0 . 001
Step 3: According to entropy weight method, the objective weight can be calculated by Equations 9, 10, and 11 [32].
h i j = b i j i = 1 m b i j
E j = i = 1 m h i j ln ( h i j ) ln m
w 2 _ i = 1 E j n j = 1 n E j
where, m=5, n = 10 in this case, Ej is the entropy value and w2_i is the objective weight of the identifier Ii (i = 1, 2, …10). Consequently, the objective weight set W2(I) = [w2-1, w2-2, ..., w2-10] is obtained:
W 2 ( I ) =   0 . 087 0 . 125 0 . 081 0 . 084 0 . 097 0 . 073 0 . 091 0 . 104 0 . 087 0 . 172  
Combination weight
Comprehensively considering the subjective factors (W1) and the objective factors (W2), the combination weight set W = [w1, w2, ..., w10] can be calculated by Equation 13.
w i = w 1 _ j × w 2 _ j j = 1 n w 1 _ j × w 2 _ j
W =   0 . 162 0 . 150 0 . 087 0 . 116 0 . 101 0 . 079 0 . 078 0 . 077 0 . 071 0 . 079  
In the end, each identifier is scored in range of 0-100 based on the limits presented in Table 3. The overall health score of the arrester is defined as the sum of products of score and weight of all the identifiers.
Finally, based on the design of the monitoring system as well as health assessment algorithms, a locomotive arrester PHM system is developed. Its online monitoring hardware equipment and analysis software are demonstrated in Appendixes B and C respectively.

4. Conclusions

In response to the situation that the locomotive arrester experienced burnout or explosion during traction supply network harmonic resonance, this study firstly carries out a series of high-frequency tests investigating the performance of the arrester under wide frequency band overvoltage; then proposes a PHM method for the arrester. The test results indicate that normal fundamental supply voltage superposed by high order harmonics can lead to arrester nonlinearity causing a sharp increase in heating power. Based on the grasp of the arrester electrical characteristics from the tests, the PHM provides online monitoring, fault warning and health assessment solutions. The testing method and PHM scheme presented in this paper can be not only applied to the arrester, also readily expanded to other high-voltage electrical equipment on the electric locomotive.

Author Contributions

Conceptualization, X.P., H.Z., K.S. and G.X.; methodology, X.P. H.Z. and K.S.; software, K.S. and G.X.; validation, P.W., K.S. and G.X.; formal analysis, X.P., H.Z., P.W. and K.S.; investigation, P.W. and G.X.; data curation, P.W. and G.X.; writing—original draft preparation, P.W.; writing— review and editing, X.P., H.Z. and K.S.; supervision, X.P., H.Z. and K.S.; project administration, H.Z.; funding acquisition, X.P.and H.Z.; All authors have read and agreed to the published version of the manuscript.

Funding

This work was supported by State Key Laboratory of Heavy-duty and Express High-power Electric Locomotive Open Fund Project (No.) GZKFKT2022-015. and Research on Overvoltage of High Voltage Electrical Systems in Electric Locomotives (Grant No. 2022CJB074).

Institutional Review Board Statement

Not applicable.

Informed Consent Statement

Not applicable.

Data Availability Statement

Not applicable.

Conflicts of Interest

The authors declare no conflict of interest.

Appendix A

Table A1 shows the description of arrester defect types, defect diagnosis indicators and corresponding changes in the standard [27].
Table A1. Typical defects of locomotive arrester.
Arrester Defects Defect Diagnosis Indicators Diagnostic Key Points
Internal moisture Leakage current under dc U1mA and 0.75 U1mA, and its resistive component under the voltage of traction supply network, temperature, insulation resistance Resistive component of leakage current increases, dc U1mA reference voltage decreases, the leakage current under 0.75 U1mA increases, relative temperature difference larger than 1K
Insulation aging Leakage current under dc U1mA and 0.75 U1mA, and its resistive component under the voltage of traction supply network, temperature, high frequency partial discharge Resistive component of leakage current increases, dc U1mA reference voltage decreases, the leakage current under 0.75 U1mA increases, relative temperature difference larger than 1K
External insulation pollution/aging Leakage current and its resistive component under the voltage of traction supply network, Temperature Leakage current and its resistive component increase apparently
Abnormal discharge UV imaging detection, external insulation anti pollution capability Determine the source of discharge

Appendix B

Figure B1 shows the developed locomotive arrester online monitoring system.
Figure B1. Photo of developed locomotive arrester online monitoring system.
Preprints 117479 g0a1

Appendix C

Figure C1 and Figure C2 show the architecture and functional design of the locomotive arrester PHM software respectively.
Figure C1. Architecture of locomotive arrester PHM software.
Preprints 117479 g0a2
Figure C2. Functional design of locomotive arrester PHM software.
Preprints 117479 g0a3
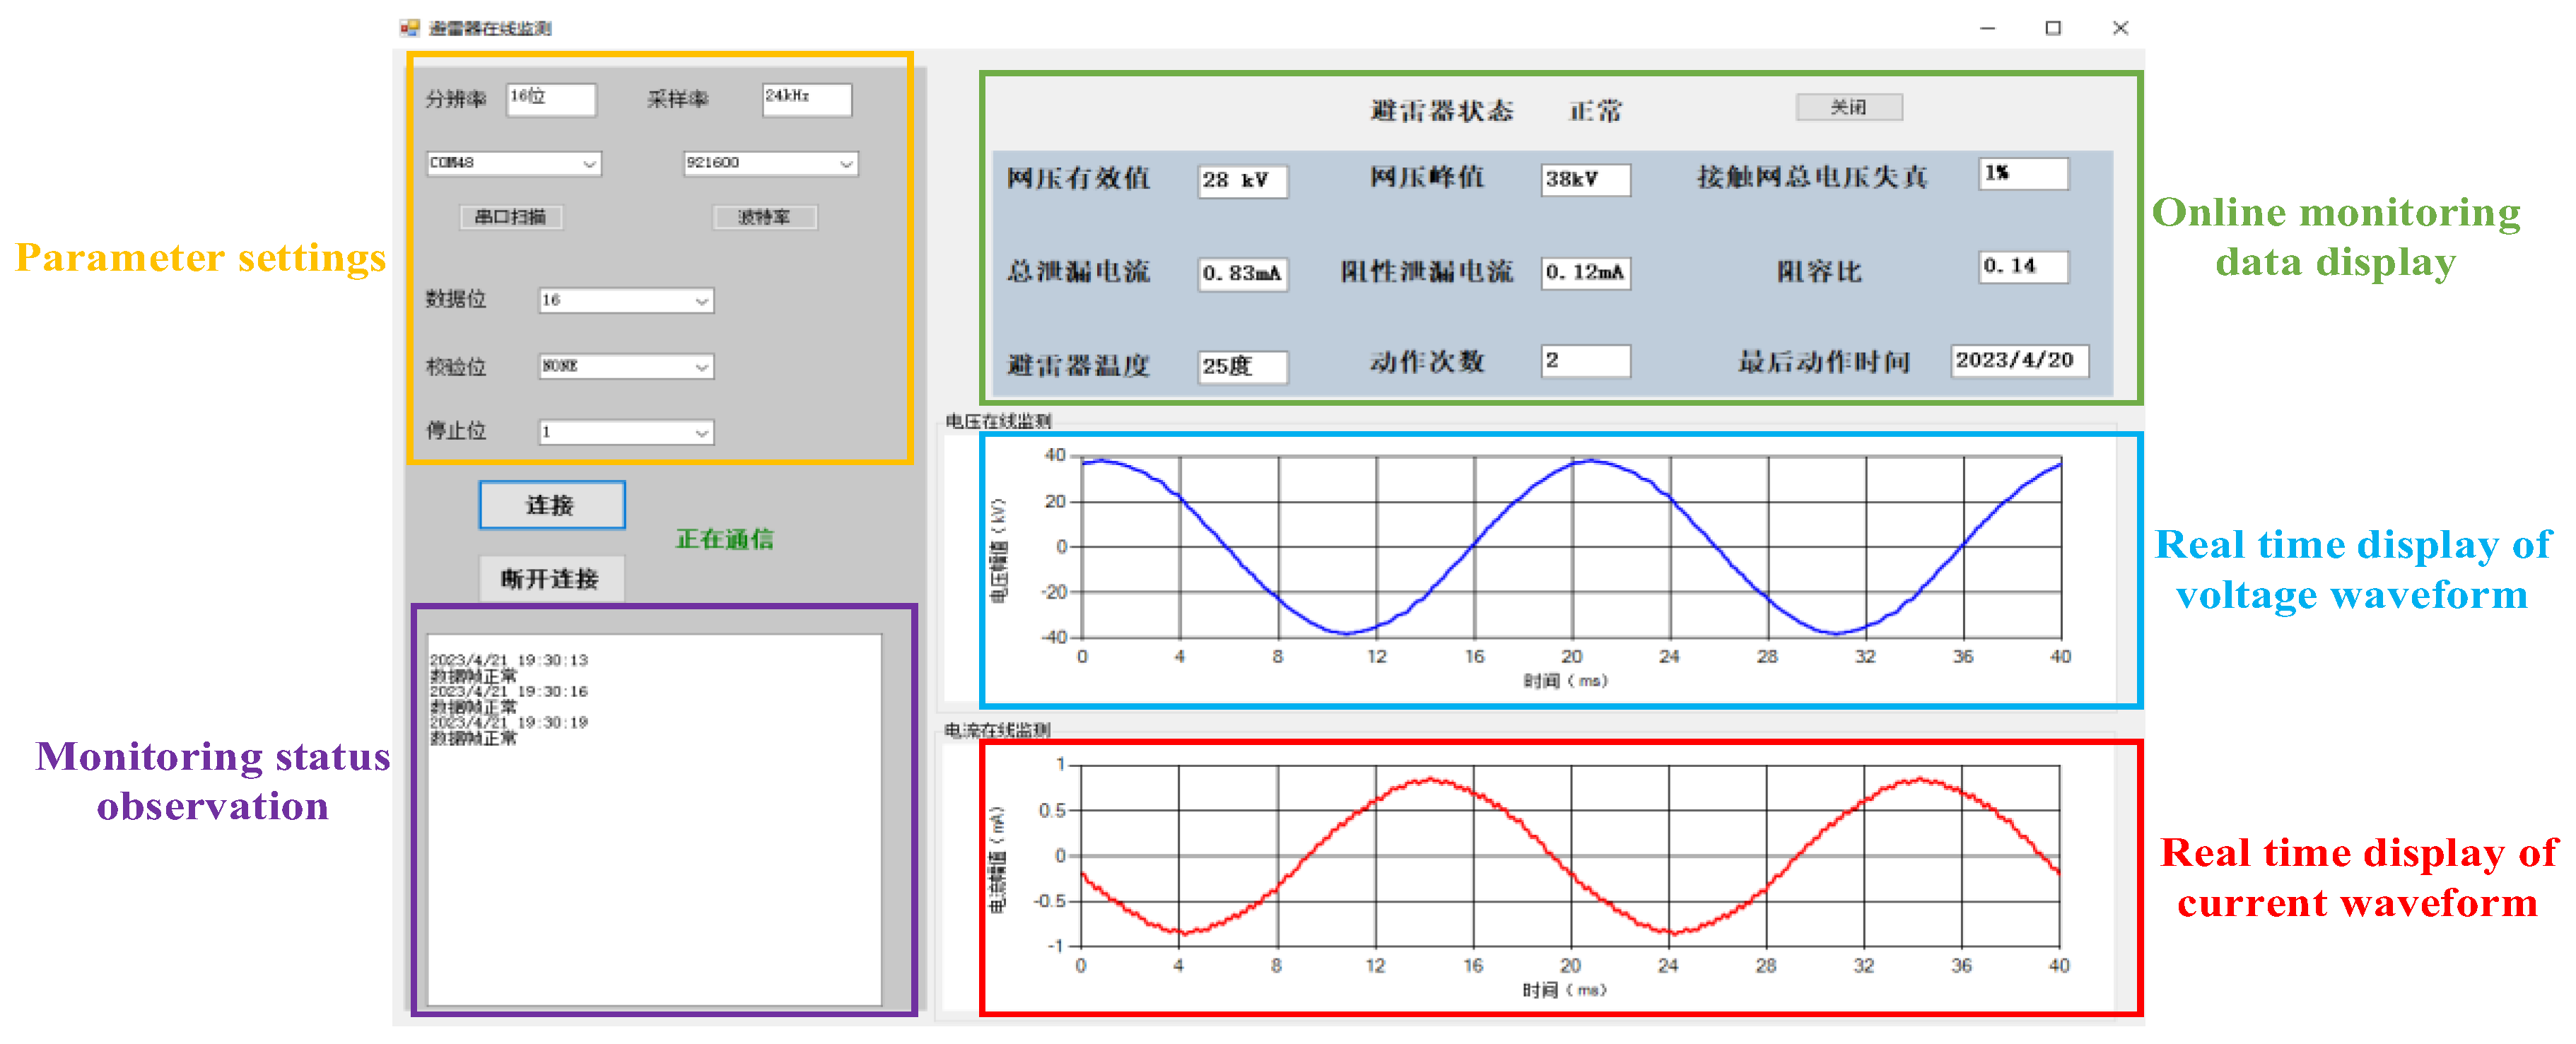
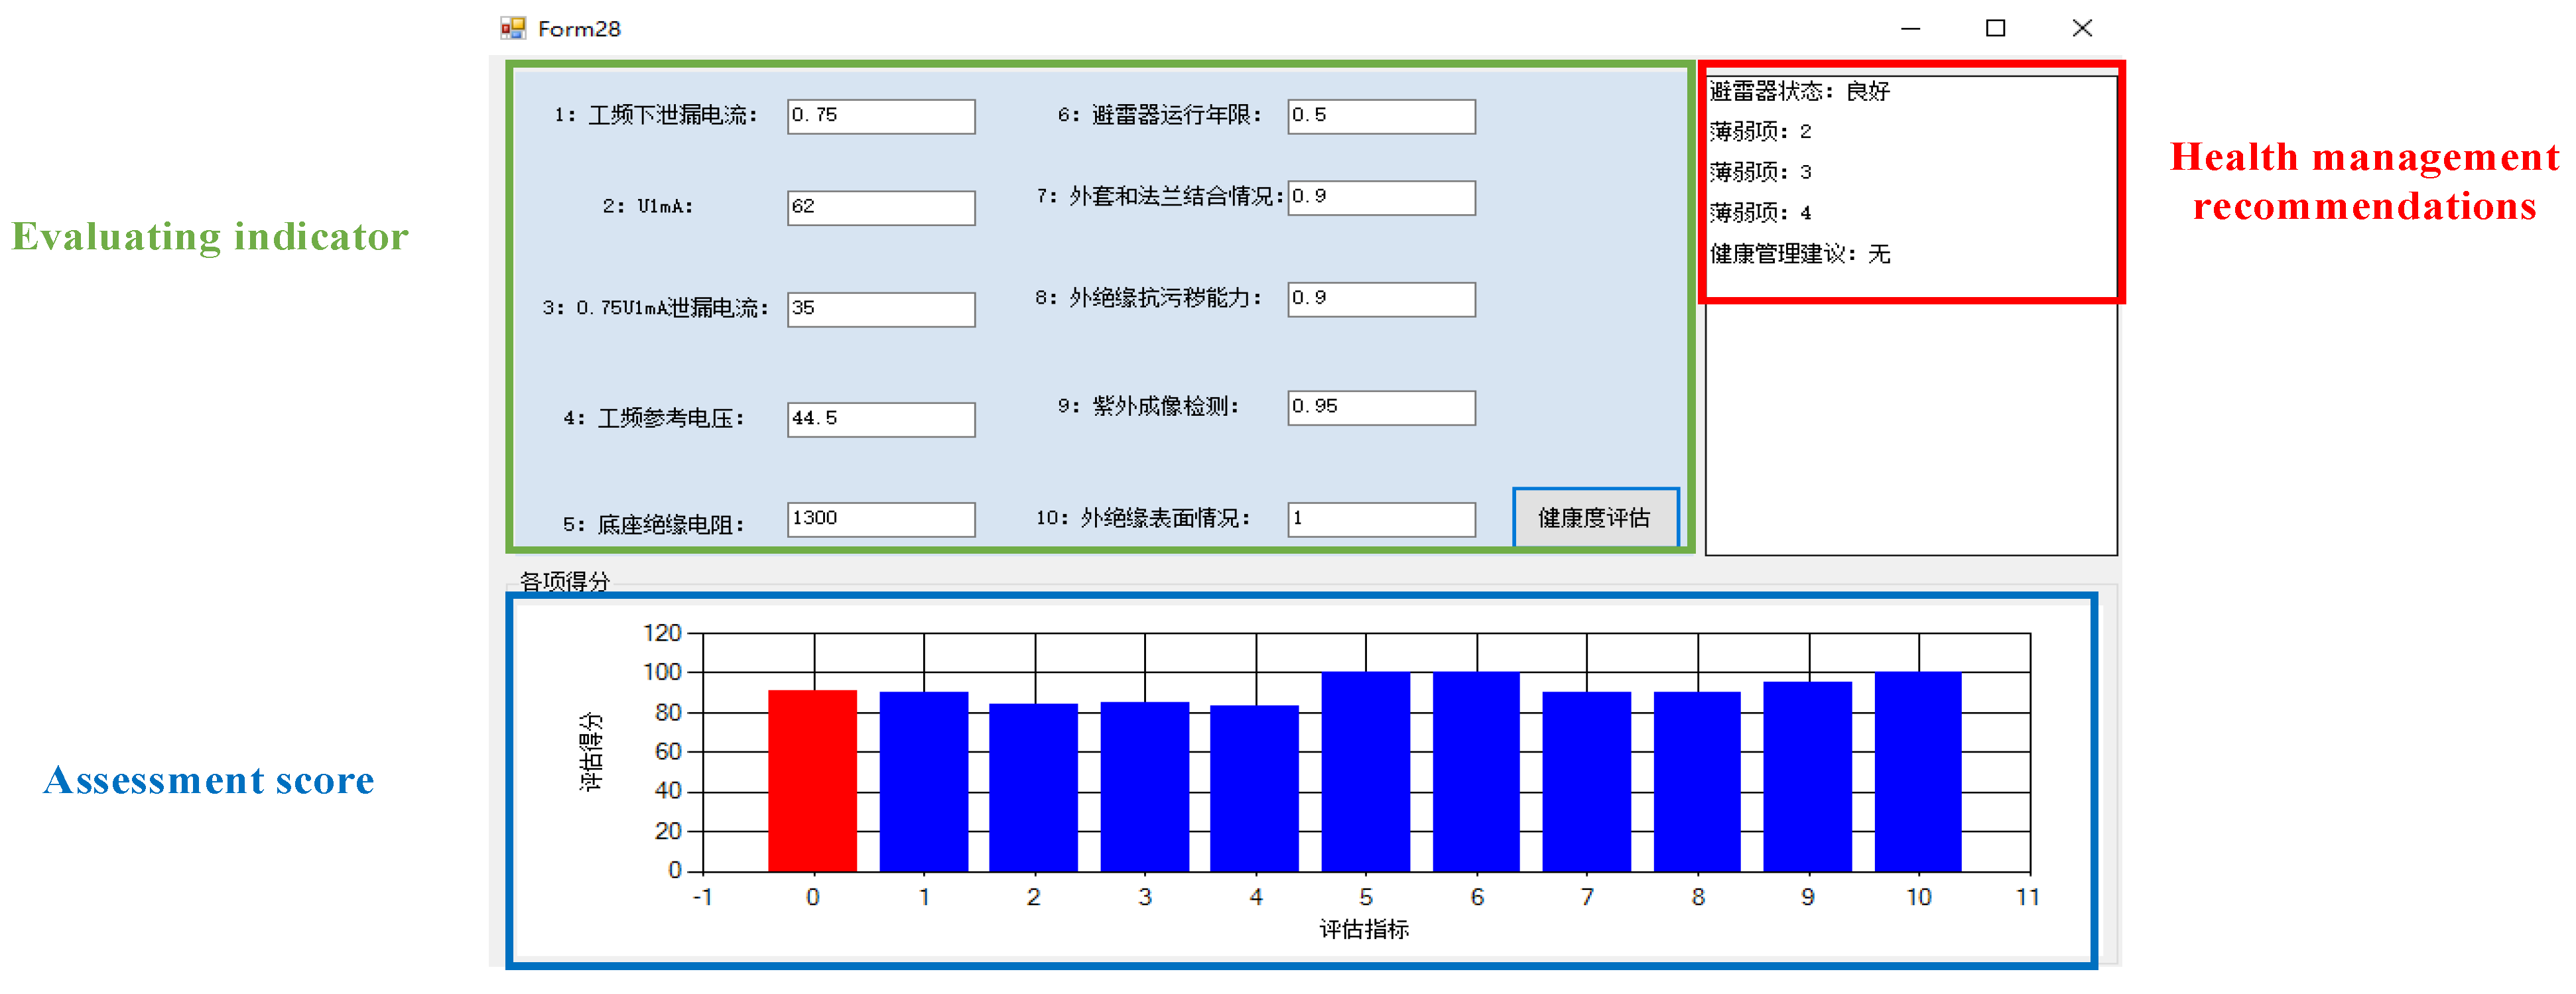
Figure C3 and Figure C4 demonstrate the arrester health status online monitoring interface and health status assessment interface respectively.
Figure C3. Online monitoring interface of arrester health status.
Preprints 117479 g0a4
Figure C4. Arrester health status assessment interface.
Preprints 117479 g0a5

References

  1. Jia, Y.; Wang, L., Analysis and Countermeasures of Arrester Failure in HXD1 Electric Locomotive. Technology and Market 2018, 25, (5), 27-30.
  2. Latiff, N. A.; Illias, H. A.; Bakar, A. H.; Dabbak, S. Z., Measurement and modelling of leakage current behaviour in ZnO surge arresters under various applied voltage amplitudes and pollution conditions. Energies 2018, 11, (4), 875. [CrossRef]
  3. Jia, Y. Research on the Overvoltage Protection Scheme for High Voltage Electrical System of Electric Locomotives. Beijing Jiaotong University 2016.
  4. Qu, Z.; Liu, M.; Guo, L.; Liu, Y. Transient processes time series analysis of high-speed railway power traction and over-voltage protection, 2012 International Conference on Computer Distributed Control and Intelligent Environmental Monitoring, 2012; IEEE: 2012; pp 818-821. [CrossRef]
  5. Ganesh, K. S. A Review of zinc oxide varistors for surge arrester, 2018 4th International Conference on Electrical Energy Systems (ICEES) 2018; IEEE: 2018; pp 470-474. [CrossRef]
  6. Ru, X.; Peng, Y.; Guo, X.; Wu, J., Analysis and Failure of HXD1 Electric Locomotive Arrester Explosion Damage. Electric Drive for Locomotives 2018, (1), 122-125. [CrossRef]
  7. Du, J., Analysis and preventive measures for the explosion fault of arrester on HXD3C locomotive. Electric Locomotives & Mass Transit Vehicles 2016, 39, (5), 87-89. [CrossRef]
  8. Kim, I.; Funabashi, T.; Sasaki, H.; Hagiwara, T.; Kobayashi, M., Study of ZnO arrester model for steep front wave. IEEE Transactions on Power Delivery 1996, 11, (2), 834-841. [CrossRef]
  9. Wu, J.; Hu, J.; Chen, S.; He, J., Harmonic characteristics of leakage currents of ZnO varistors under impulse aging. IEEE Transactions on Power Delivery 2016, 32, (4), 1758-1765. [CrossRef]
  10. Yang, J.; Ma, Y.; Ma, Y.; Pan, H.; Du, H. Analysis of the mechanism of thermal collapse of MOA valve plates caused by multiple lightning strikes, Journal of Physics: Conference Series, 2021; IOP Publishing: 2021; p 012152. [CrossRef]
  11. Ishida, K.; Dokai, K.; Tsozaki, T.; Irie, T.; Nakayama, T.; Fujita, H.; Arakawa, K.; Aihara, Y., Development of a 500 kV transmission line arrester and its characteristics. IEEE transactions on power delivery 1992, 7, (3), 1265-1274. [CrossRef]
  12. Sun, J.; Fan, Y.; Zhang, K.; Liu, J.; Wang, X.; Yan, S., The Leakage Current Characteristics of High-Gradient MOA Plate and Its Heating Analysis with Coatings under High-Frequency Overvoltage. Coatings 2023, 13, (3), 497. [CrossRef]
  13. Sun, J.; Ding, F.; Lv, Y.; Ren, J.; Song, S.; Li, T.; Zhi, Q.; Guo, C., Leakage current characteristics and ageing assessment technology of roof arrester under ultra harmonics overvoltage. High Voltage 2022, 7, (2), 346-356. [CrossRef]
  14. Tian, F.; Tong, Y.; Wang, J.; Zhang S.; Cao J. Study on the frequency and temperature dependence of electrical conductivity of zinc oxide valve plate. IEEE Transactions on Dielectrics and Electrical Insulation 2023, 30, (3), 1302-1311. [CrossRef]
  15. Song, K.; Wu, M.; Yang, S.; Liu, Q.; Agelidis, V. G.; Konstantinou, G., High-order harmonic resonances in traction power supplies: A review based on railway operational data, measurements, and experience. IEEE Transactions on Power Electronics 2019, 35, (3), 2501-2518. [CrossRef]
  16. Li, Z.; Hu, H.; Zhou, Y.; He, Z., A rapid modal analysis method for harmonic resonance using modified power iteration. IEEE Transactions on Power Delivery 2016, 33, (3), 1495-1497. [CrossRef]
  17. Hu, H.; Tao, H.; Blaabjerg, F.; Wang, X.; He, Z.; Gao, S., Train–network interactions and stability evaluation in high-speed railways–Part I: Phenomena and modeling. IEEE Transactions on Power Electronics 2017, 33, (6), 4627-4642. [CrossRef]
  18. Zhou, Z. Research and Application of Prognostics and Health Management Technology Framework in Heavy Haul Locomotiv.Control and Information Technology 2022, (6), 115-122. [CrossRef]
  19. Hu, Y.; Miao, X.; Si, Y.; Pan, E.; Zio, E., Prognostics and health management: A review from the perspectives of design, development and decision. Reliability Engineering & System Safety 2022, 217, 108063. [CrossRef]
  20. Ranjbar, B.; Darvishi, A.; Dashti, R.; Shaker, H. R., A survey of diagnostic and condition monitoring of metal oxide surge arrester in the power distribution network. Energies 2022, 15, (21), 8091. [CrossRef]
  21. Lijun, Q.; Minghui, W., Overview of PHM Technology Framework and Its Key Technologies. Foreign Electric Measurement Technology 2018, 37, (2), 10-15. [CrossRef]
  22. Yu, P.; Liu, D.; Peng, X., Overview of Fault Prediction and Health Management Technologies. Journal of Electronic Measurement and Instrumentation 2010, 24, (1), 1-9.
  23. Yang,T. Railway passenger car bogie fault prediction system based on PHM technology. Intelligent City 2024,10(1):27-29. [CrossRef]
  24. Raju, K.; Prasad, V.; Elavarasan, R. M.; Subramaniam, U.; Almakhles, D. J., Development of high gradient ZnO arrester material for high voltage applications. IEEE Access 2020, 8, 115685-115693. [CrossRef]
  25. Brito, V. S.; Lira, G. R.; Costa, E. G.; Maia, M. J., A wide-range model for metal-oxide surge arrester. IEEE Transactions on Power Delivery 2017, 33, (1), 102-109. [CrossRef]
  26. Lin, R.; Yang, J.; Huang, L.; Liu, Z.; Zhou, X.; Zhou, Z., Review of Launch Vehicle Engine PHM Technology and Analysis Methods Research. Aerospace 2023, 10, (6), 517. [CrossRef]
  27. DL/T 1703-2017 Guide for condition evaluation of mental oxide arrester.
  28. GB/T 11034-2020 Metal-oxide surge arresters without gaps for a.c. systems.
  29. Darko, A.; Chan, A. P. C.; Ameyaw, E. E.; Owusu, E. K.; Pärn, E.; Edwards, D. J., Review of application of analytic hierarchy process (AHP) in construction. International journal of construction management 2019, 19, (5), 436-452. [CrossRef]
  30. Uddin, M. R.; Al Noman, A.; Tasnim, F.; Nafisa, N.; Hossain, S. In A Hybrid MCDM Approach based on AHP, and TOPSIS to select an ERP system in Bangladesh, 2021 International Conference on Information and Communication Technology for Sustainable Development (ICICT4SD), 2021; IEEE: 2021; pp 161-165. [CrossRef]
  31. Zhuo, Y.; Cao, Y.; Chen, L.; Nie, J.; Huang, Y.; Liang, Y. In Research on evaluation model based on analytic hierarchy process and entropy weight method for smart grid, 2022 5th International Conference on Energy, Electrical and Power Engineering (CEEPE), 2022; IEEE: 2022; pp 729-734. [CrossRef]
  32. Yin, J.; Han, L.; Ma, L.; Cai, H.; Li, H.; Li, J.; Sun, G. In Evaluation of terminal signal quality based on entropy weight method, 2022 4th International Conference on Intelligent Control, Measurement and Signal Processing (ICMSP), 2022; IEEE: 2022; pp 855-858. [CrossRef]
Figure 1. Electrical characteristics of zinc oxide valve plates. (a) static volt-ampere characteristics; (b) solid dielectric loss circuit model; (c) simplified circuit model.
Preprints 117479 g001
Figure 2. Experimental circuit for testing the arrester and its valve plates. (a) design of the circuit; (b) photo of the built circuit.
Preprints 117479 g002
Figure 3. Testing objects. (a) YH10WT-42/105 locomotive arrester; (b) ZnO valve plates of the arrester.
Preprints 117479 g003
Figure 4. Figure 4. Tested results of arrester leakage current, resistive component of leakage current, active power varying along with the applied voltage.
Preprints 117479 g004
Figure 5. Tested results of equivalent circuit parameters varying along with the applied voltage. (a) equivalent resistance; (b) ratio of equivalent resistance to equivalent reactance.
Preprints 117479 g005
Figure 6. Tested volt-ampere characteristics of arrester under harmonic voltages. (a) leakage current; (b) resistive component of leakage current.
Preprints 117479 g006
Figure 7. Tested electrical characteristics of ZnO valve plate under harmonic voltages. (a) leakage current; (b) equivalent resistance; (c) resistive component of leakage current; (d) active power.
Preprints 117479 g007
Figure 8. Combination voltages applied on the ZnO valve plate. (a) group 1-1; (b) group 1-2; (c) group 2-1; (d) group 2-2; (e) group 3-1; (f) group 3-2.
Preprints 117479 g008aPreprints 117479 g008b
Figure 9. Configuration of the proposed locomotive arrester PHM.
Preprints 117479 g009
Figure 10. Locomotive arrester fault warning logic.
Preprints 117479 g010
Table 1. Technical parameters of YH10WT-42/105 arrester.
Parameter Value
Rated voltage (kV) 42
Continuous operating voltage (kV) 34
Nominal discharge current (A) 10
Residual voltage of lightning impulse current ≤ (kV) 105
Residual voltage of steep wave impulse voltage ≤ (kV) 118
Residual voltage of operating impulse current ≤ (kV) 89
DC reference voltage (1 mA) ≥ (kV) 58
AC reference voltage ≥ (kV) 42
2 ms square wave current capacity (A) 800
High current withstand capability (kA) 100
Table 2. Set up of the six combination voltages and associate results.
Test
group
Fundamental Voltage Harmonic voltage Peak value of combin-ation voltage (V) Fundamental equivalent resistance
(MΩ)
Fundamental
active power
(W)
Total active power
(W)
750Hz 950Hz 1150Hz 1350Hz
RMS
(V)
Phase(°) RMS
(V)
Phase(°) RMS
(V)
Phase(°) RMS(V) Phase(°) RMS(V) Phase(°)
1-1 2000 0 389 0 235 180 215 0 190 180 3500 61.4 0.0669 0.141
1-2 2000 0 389 0 235 0 215 0 190 0 4200 27.0 0.151 0.249
2-1 2500 0 485 0 300 180 270 0 240 180 4351 22.5 0.282 0.429
2-2 2500 0 485 0 300 0 270 0 240 0 4931 12.4 0.506 0.735
3-1 3000 0 540 0 330 180 310 0 273 180 5000 6.30 1.47 2.00
3-2 3000 0 540 0 330 0 310 0 273 0 5394 3.90 3.32 2.95
Table 3. Health status indicators of the arrester.
Identifier Evaluation Parameters Good Normal Attention Abnormal Fault
I1 Fundamental leakage current / mA < 0.5 0.5 - 1 1 - 1.5 1.5 - 5 > 5
I2 DC U1mA /kV > 63.8 58 - 63.8 52.3 - 58 46.4 - 52.3 < 46.4
I3 Leakage current under 0.75 U1mA / uA 10 - 30 30 - 50 50 - 70 70 - 100 > 100
I4 Reference voltage / kV > 46.2 42 - 46.2 37.8 - 42 33.6 - 37.8 < 33.6
I5 Base insulation resistance / kMΩ > 1.2 1 - 1.2 0.8 - 1 0.6 - 0.8 < 0.6
I6 Arrester service life / year 0 - 1 1 - 3 3 - 6 6 - 12 > 12
I7 Combination of insulation jacket and flange 0.8 - 1 0.6 - 0.8 0.5 - 0.6 0.3 - 0.5 0 - 0.3
I8 External insulation anti-pollution capability 0.8 - 1 0.6 - 0.8 0.5 - 0.6 0.3 - 0.5 0 - 0.3
I9 UV imaging detection 0.8 - 1 0.6 - 0.8 0.5 - 0.6 0.3 - 0.5 0 - 0.3
I10 External insulation surface condition 0.8 - 1 0.6 - 0.8 0.5 - 0.6 0.3 - 0.5 0 - 0.3
Disclaimer/Publisher’s Note: The statements, opinions and data contained in all publications are solely those of the individual author(s) and contributor(s) and not of MDPI and/or the editor(s). MDPI and/or the editor(s) disclaim responsibility for any injury to people or property resulting from any ideas, methods, instructions or products referred to in the content.
Copyright: This open access article is published under a Creative Commons CC BY 4.0 license, which permit the free download, distribution, and reuse, provided that the author and preprint are cited in any reuse.
Prerpints.org logo

Preprints.org is a free preprint server supported by MDPI in Basel, Switzerland.

Subscribe

© 2024 MDPI (Basel, Switzerland) unless otherwise stated