1. Introduction
Recently, the detection of small objects has become an important research topic in the field of computer vision and intelligent perception technology, particularly in Intelligent Transportation System (ITS), where it is required for tasks such as pedestrian detection, vehicle identification and abnormal event monitoring. Among these, vehicle logo detection has emerged as a crucial task for identifying vehicles, calculating brand exposure, and advancing small object detection research. However, previous research has overlooked the importance of extracting detailed features from small objects, which has severely limited the accuracy and generalization of vehicle logo detection. Consequently, effective extraction and constructed the features from small size objects are crucial method to solve the vehicle logo detection task.
In recent years, deep learning-based detection methods have encountered challenges in feature extraction and representation tasks [
1,
2,
3]. Deep residual networks [
4] are not effective in extracting detailed texture features, which can negatively impact the detection accuracy. Moreover, the absence of a feature monitoring mechanism in the network often leads to difficulty in achieving the desired detection results. Therefore, we focus on constructing robust feature extraction models based on self-attention networks, which can enable correlation feature learning in pixel areas and obtain better object texture information. Our work specifically aims to develop a self-attention network-based detection method for achieving the small size objects due to three primary reasons:
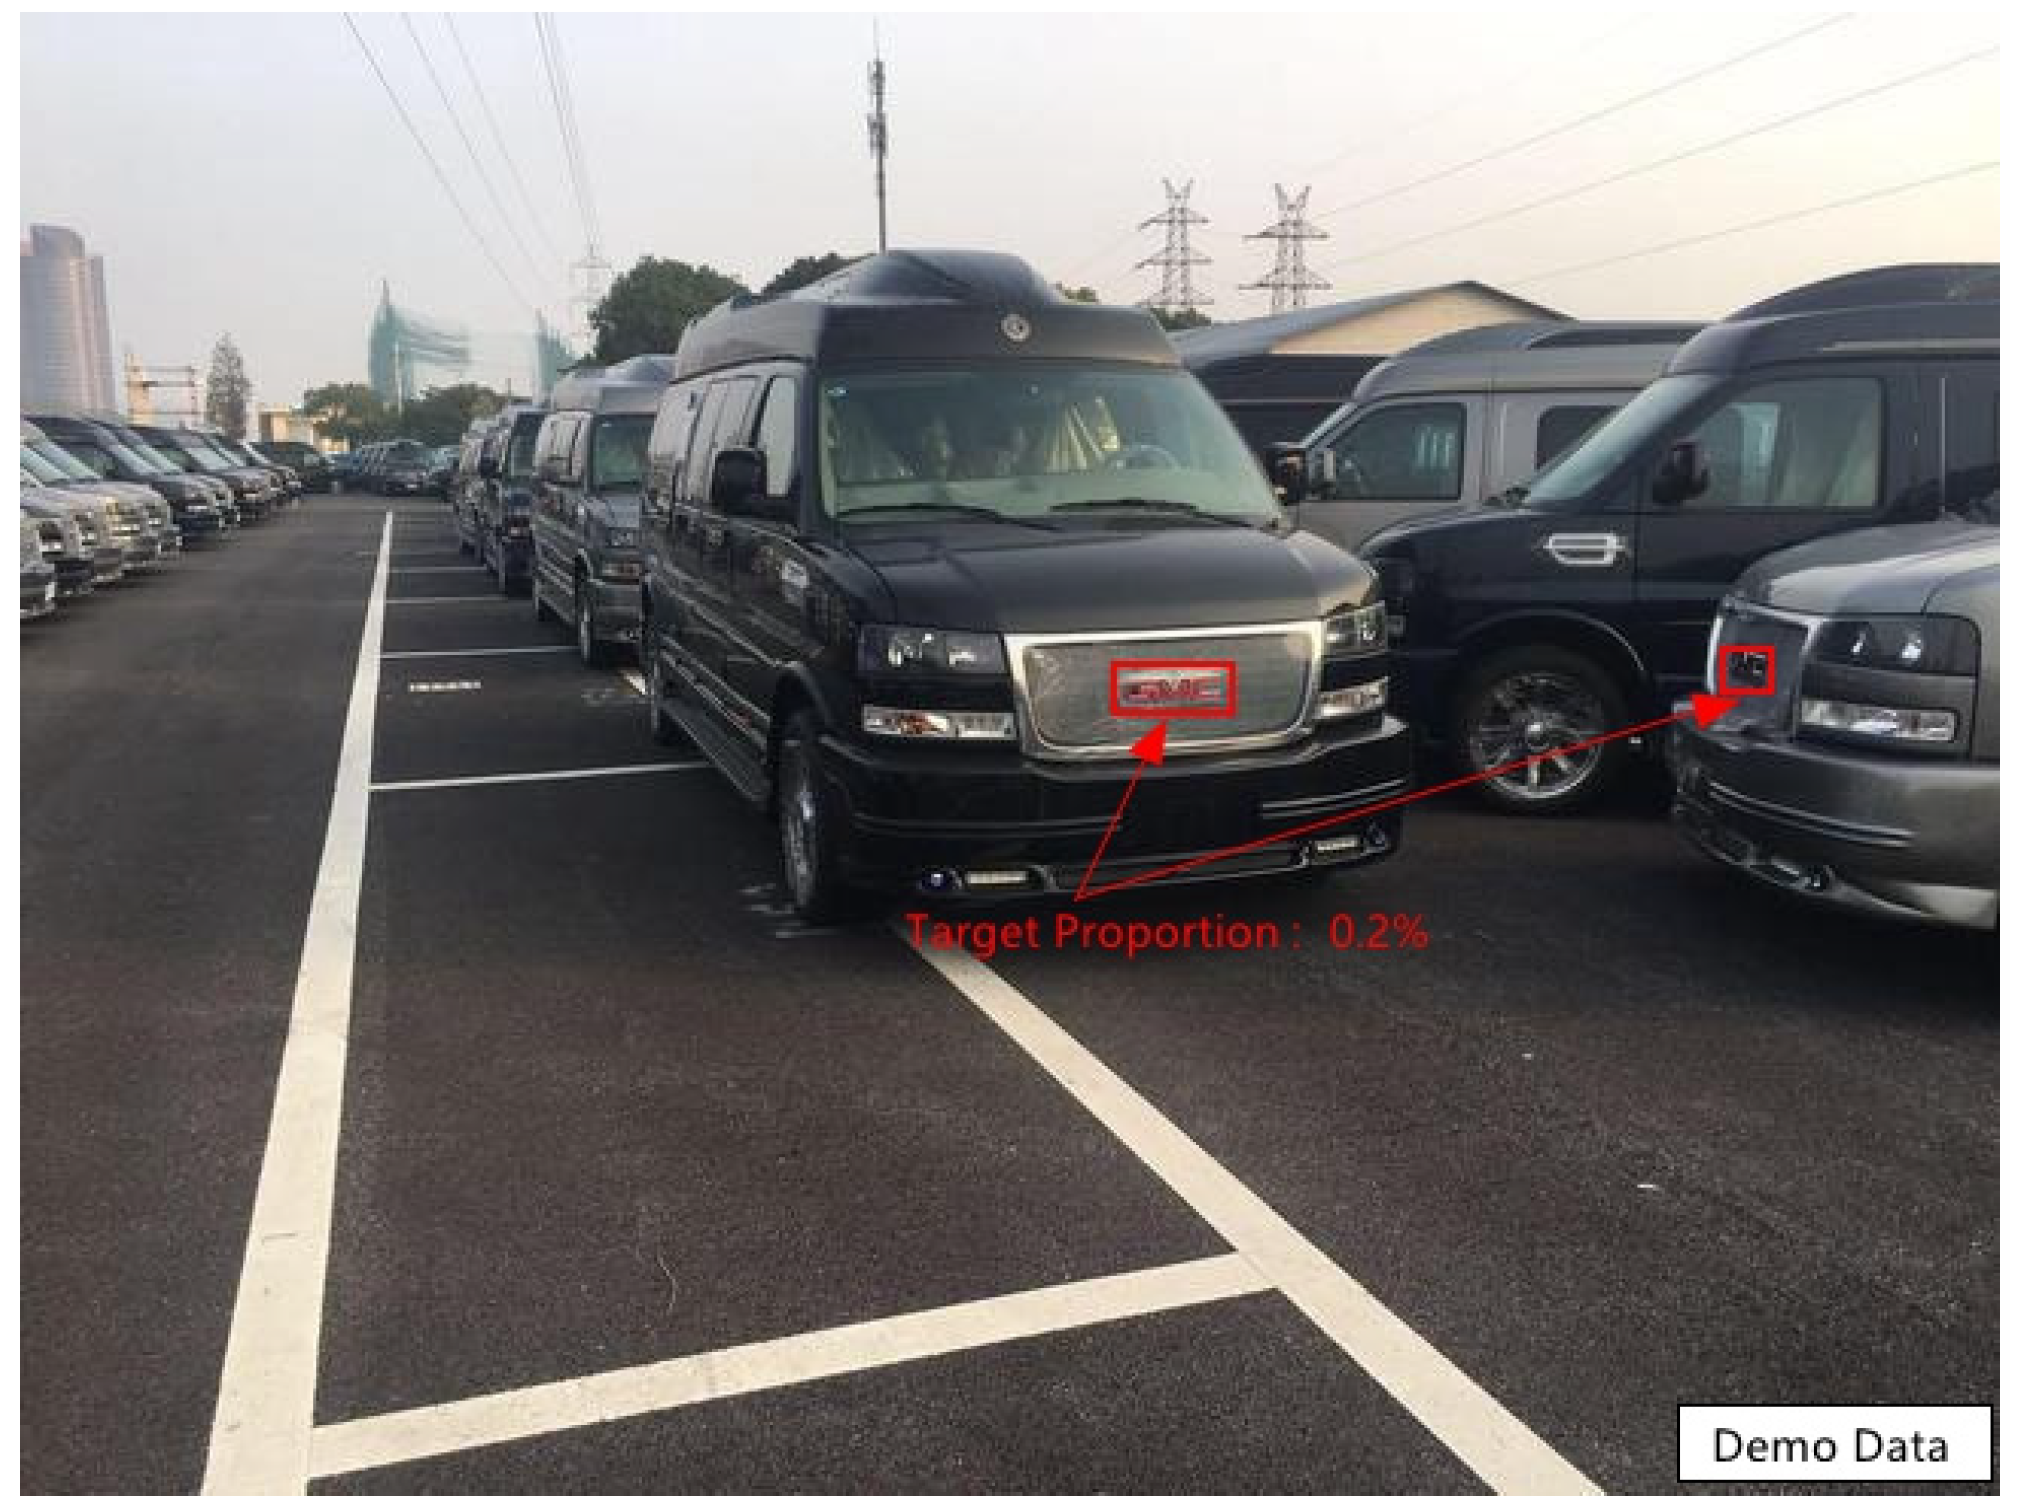
Figure 1.
Example of proportion of vehicle logo. The proportion of small objects in this paper is: 0.2%.
Figure 1.
Example of proportion of vehicle logo. The proportion of small objects in this paper is: 0.2%.
Firstly, our proposed model addresses the challenges in small size object detection, including the impact of complex background noise on text signs and the sensitivity of vehicle logos to lighting and weather conditions. Text signs, such as HAVAL and Jeep, are particularly vulnerable to the influence of the external environment. The feature descriptors from neural networks are unable to effectively learn content with small differences in relevant regional characteristics. Furthermore, vehicle logos are not fixed in a particular position, such as the front of the radiator and car cover.
Secondly, the proposed model tackles the challenges in vehicle logo detection caused by different lighting and weather conditions. These challenges confuse the logo with the characteristics of other objects and cause color deviation due to the sensitivity of the logo’s material to light. To address these challenges, our feature extraction network is designed with generalization in mind during the training process.
Thirdly, the balance between accuracy and speed puzzles the practical application of depth learning-based detectors. The deepening of the network and the application of the visual method based on the transformer mechanism result in a significant reduction in the detection speed. Therefore, our model aims to reduce the memory consumption of network models and improve computing efficiency, improving the overall effectiveness of object detection methods.
In this paper, we focus on developing a feature extraction network based on self-attention and a detection head for small size objects in vehicle logo. For the feature extraction network, we designed a multi feature fusion residual convolution with pixel attention layer, which can effectively learn the related relationship surrounding the vehicle logo, considering the challenges posed by complex background noise and varying lighting and weather conditions. To achieve smooth sampling of the object and reduce feature loss in the down-sampling process, we cascade multiple residual convolutions. For the detection head, we utilize cross-layer fusion for supporting the multi-scale prediction layer, which can improve the locating and classification accuracy of small size objects. The contributions of our model can be summarized as follows:
A) We propose a balanced object detection method based on self-attention networks, which achieves real-time and higher detection precision for vehicle logos.
B) We construct a related feature learning model based on the theory of visual transformer and convolution. It utilizes cross-layer fusion and related pixel learning to improve the representational model for small size objects.
C) We build a multi-scale prediction detector by fusing shallow layers with deep layers, which takes shallow texture features as important information for locating objects. Experimental evaluation on the VLD-45 datasets proves that our detector has robustness and superiority in detecting small size objects.
The remainder of our research is organized as follows:
Section 2 introduces related work on object detection based on deep learning.
Section 3 describes the detailed model for our VLD-Transformer method.
Section 4 presents the experimental results with comparable methods and ablation analysis. Finally,
Section 5 concludes the conclusion and research project.
2. Related Work
With the standardization of dataset, vehicle logo detection task has become a hot topic in computer vision research. Vehicle log detection methods have evolved from traditional manual feature-based to the depth feature, achieving improved detection performance. In this section, we will briefly review these methods from three different aspects: the dataset, traditional detection method and deep learning-based method.
A. VLD Dataset
Although the vehicle logo detection task has been studied for many years, there are few public datasets available for the computer vision community. XMU [
5] and HFUT-VL [
6] datasets contain image data obtained from real-time road cameras. However, these datasets lack a division into training, validation, and test sets, and don’t have a uniform image size. The VLD-30 [
7] and VLR-40 [
8] datasets have contributed to establishing classification standards and reconstructing the dataset division for vehicle logos. Nevertheless, there are still some issues with vehicle logos, such as low image resolution and a lack of real-world scenarios. The VLD-45 [
9] dataset provides a large amount of data for vehicle logo detection tasks, consisting of 45,000 images and 45 classes from real-world and Internet acquisitions. In this paper, we use the VLD-45 to evaluate the precision of our method.
B. Traditional Detection Method
Previous research on vehicle logo detection focused on predicting the bounding box and classification using manually designed feature extraction models. Commonly used methods include Scale-Invariant Feature Transform (SIFT operator) and Histograms of Oriented Gradients (HOG) for feature representation methods [
10,
11]. Support Vector Machine (SVM) was used to combine HOG and predict the candidate region from the images [
12,
13]. Psyllos et al [
14] proposed feature matching method for vehicle logo based on SIFT features, which realizes the 94% recognition accuracy with 10 categories. Peng et al [
15] used the Statistical Random Sparse Distribution (SRSD) for vehicle logo recognition, which improves the low-resolution image feature extraction. Sun et al [
16] combined the HOG features with SIFT features, which uses the SVM classifier to predict the classes of vehicle logo. In addition, most methods use manually designed feature extractors to complete the vehicle logo representation. This method is combined to achieve object location and classification by training strong and weak classifiers [
17]. However, these methods have limited ability to handle large amounts of data, resulting in lower generalization for the detector.
C. Deep Learning-Based Detection Method
Deep learning-based method has become the mainstream algorithm for detecting small-sized objects, such as vehicle logos. The deep features obtained through Convolutional Neural Network (CNN) training have better target representation ability. In addition, the learning method through adaptive learning is also better than the manually set feature matching template. Pan et al [
18] proposed the vehicle logo recognition method with the CNN, which compared the performance of CNN and SIFT. The experiments proved the accuracy of CNN greater than SIFT model. Li et al [
19] combined the Hough transform with deep neural network to detect the vehicle logo. It used the Deep Belief Networks (DBNs) for completing the logo classification. Foo Chong Soon et al [
20] designed a CNN model based on automatically searching method, which hoped to construct the optimal target feature extractor. Liu et al [
21] used the ResNeXt network for improving the performance of matching restricted region extraction. Nguyen et al [
22] proposed a multi-scale feature fusion framework for achieving the efficient feature extraction. Thus, extracting the detailed texture features of vehicle logo is still one of the important problems to improve the accuracy of object detection.
Recently, visual transformer has been applied for feature extraction based on deep learning, which uses self-attention networks to learn the regional feature relationships. The backbone has better feature extraction capability for local context information from the images. However, the memory consumption and computation increase exponentially with the deepening of the network. Thus, the focus of this paper is to explore how to integrate transformer mechanisms into feature extraction networks.
3. Method
In this section, we will introduce the detailed pipeline of our proposed method, VLD-Transformer. Our method consists of three sub-modules based on a deep learning object detector: Attention Feature Extraction Network, Detection Head and Training Policy. By constructing the network block with attention and residual blocks for the backbone, we can create a robust representational model for texture feature extraction for small-sized objects.
A. Overview
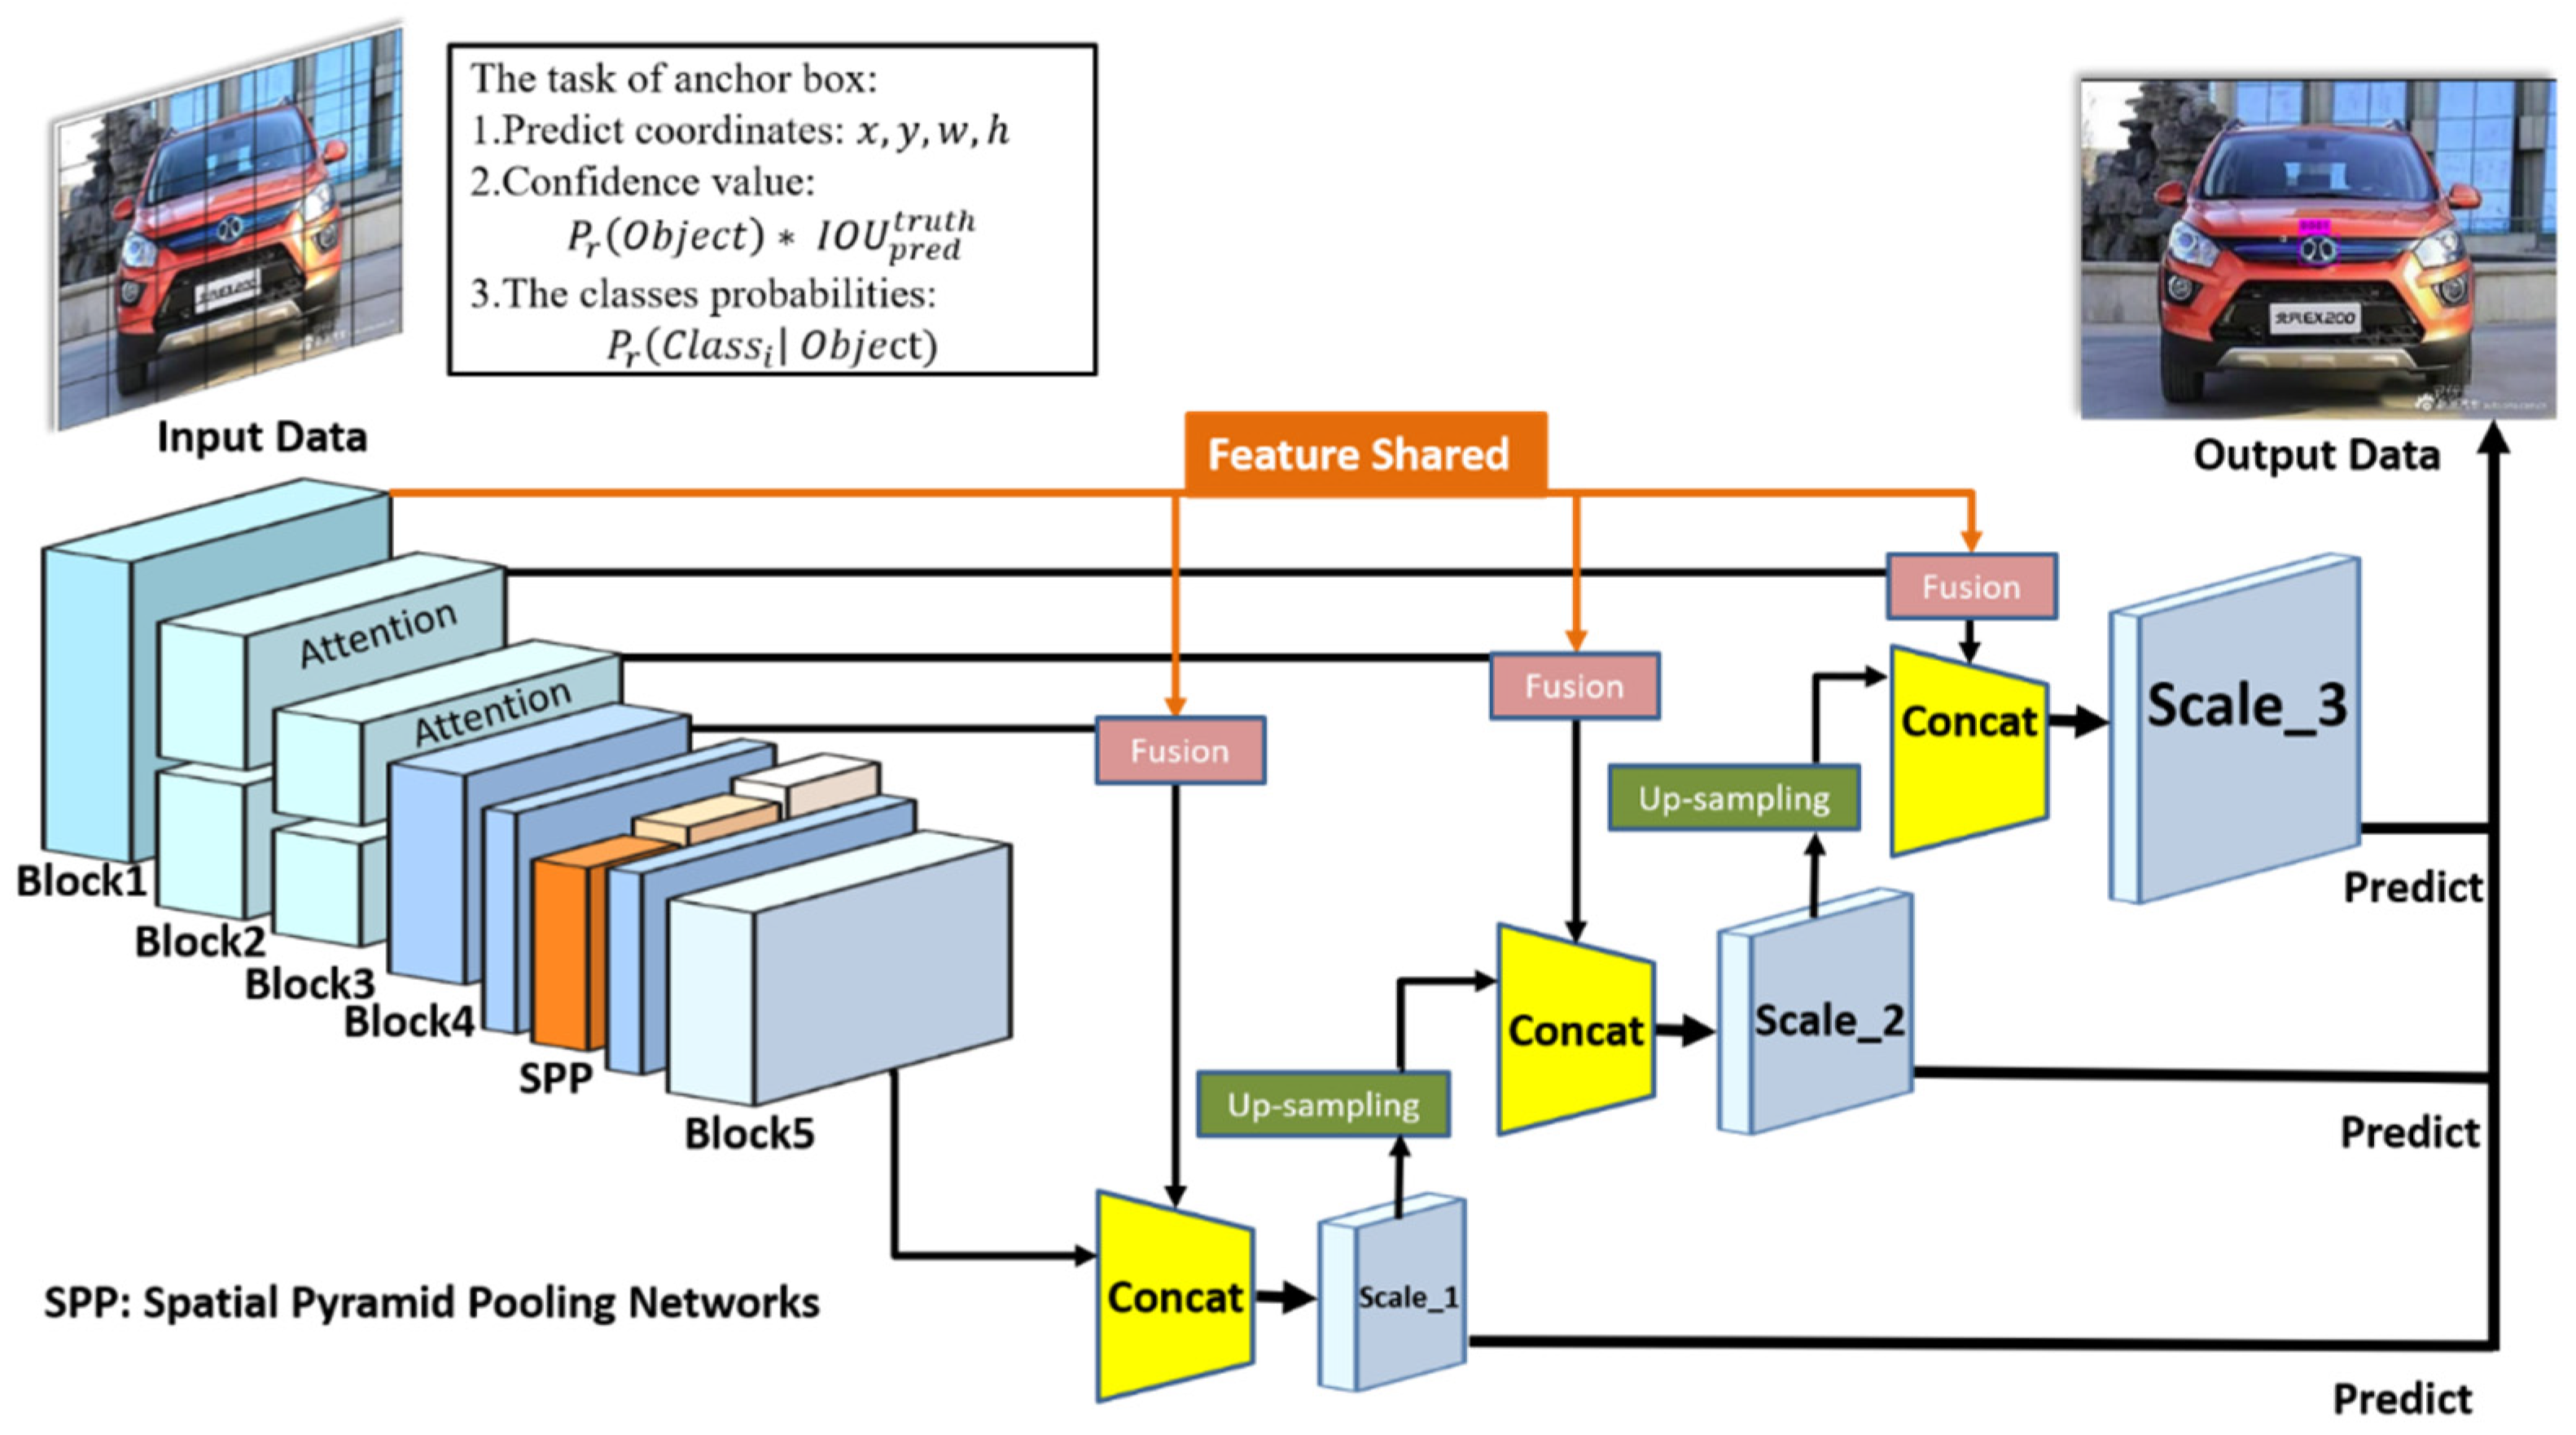
As shown in
Figure 2, our method takes RGB images as input data and reseizes them to 640×640 pixels. The backbone consists of 5 convolutional blocks and 1 Spatial Pyramid Pooling (SPP) network. We incorporate 2 attention blocks in the shallow layers to learn related relationship features and use the SPP network to fuse features of different scales, thus improving the utilization of shallow layers. Through supervision and self-attention mechanisms, our model enhances the extraction of texture information and reduces feature loss during the detection and location process for small size objects.
For the detection head, we employ a feature sharing learning method to perform multi-scale object prediction. We use the concat layer to merge the feature map from the deep layer with the shallow layer. In our opinion, we can complete the target positioning task at different scales, which can provide important reference for small size objects. The predicted layer is refined from blocks 1 to 4, providing many detailed features to assist object location. Furthermore, we balance the classification and location loss during training process to ensure the prediction accuracy of the detector for the location bounding box. The detailed structure of the method will be described in this section for our method of VLD-Transformer.
C. Detection Head
Our detection head is a typical single-stage detection framework based on anchor box generation, which includes three predicted layers of different scales. Additionally, we propose a feature fusion method that combines the shallow and deep layers. This approach enables the model to incorporate more detailed texture feature information, leading to improved accuracy in object classification and location.
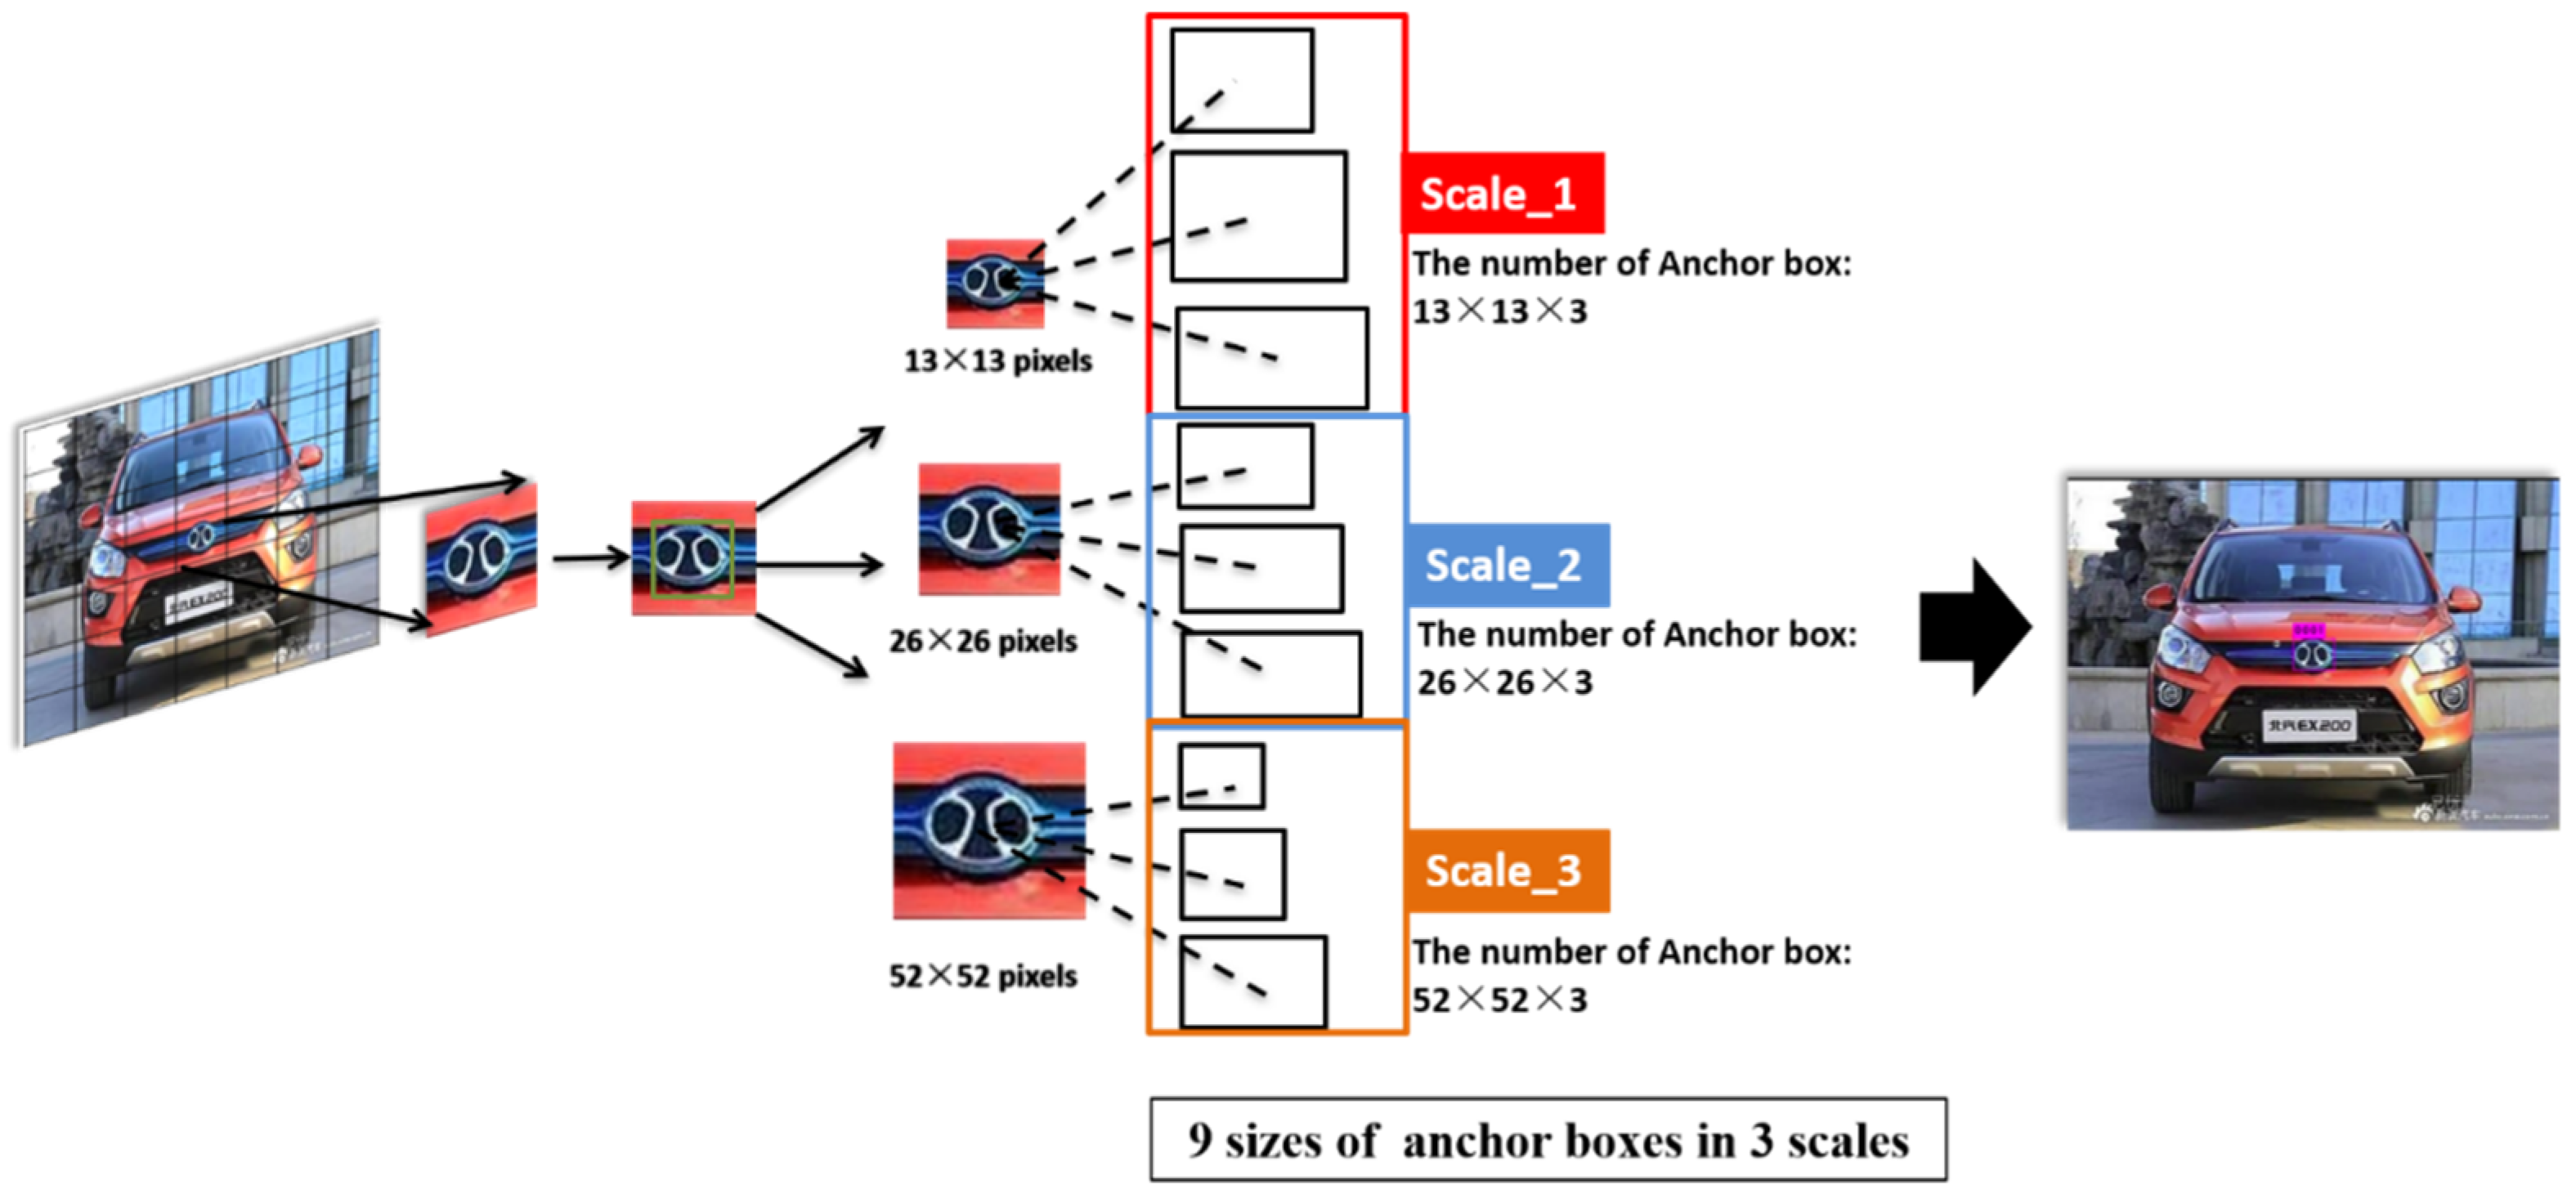
In Figure 5, it shows the predicted pipeline for object detection. The detection head takes the output feature map from backbone as input data. Then, according to the divided of whole input data, we can acquire the grid cell from the image space. For each grid cell, our model generates candidate object regions using the anchor box generation method. From our analysis, through the method of pre-setting anchor box, the detection network can have obvious perceptual learning on the scale of the objects. Especial for the small size objects, anchor box will help reduce the deviation range of bounding box regression calculation when training the model. However, many anchor box settings will affect the subsequent detection running rate. Meanwhile, to avoid the influence of manually setting the anchor box size on the final prediction accuracy, we use K-means clustering to calculate the initial size of the anchor box.
Figure 5.
Example of structure for our detection head. We propose the multi-scale prediction method based on anchor box generation. It includes anchor box from the three scales for solving the scale change problem of small size objects.
Figure 5.
Example of structure for our detection head. We propose the multi-scale prediction method based on anchor box generation. It includes anchor box from the three scales for solving the scale change problem of small size objects.
For the anchor box, we build an optimization merit functions for selecting the size of box based on K-means method. The Intersection over Union (IoU) can represent the overlap ratio between targets. The distance function
is:
where
is the target center point.
represents the width and height of the bounding box. For each bounding box (
), we use the loss function to find the optimal cluster number
and bounding box size (
). The function
is:
The formula calculates different loss results according to different values. Then, according to the best result of loss, is selected as the number of anchor box. Meanwhile, this method gives the corresponding size of () for anchor box.
For the prediction layer, we deal with the problem of object scale change by setting three scale prediction layers. At the same time, to compensate for the feature loss in the down-sampling process, we integrate the shallow features with the prediction layer to improve the positioning and classification accuracy in single prediction.
D. Training Policy-Freezing
Typically, we need to spend a lot of time training models. At the same time, the mini-batch gradient descent optimization method is affected by changes in the data itself. Thus, we propose the freeze training policy for the backbone to improve training efficiency and effectiveness. This method is implemented by adjusting the iteration steps and freezing the weights update. For our training policy, we divide the training iteration steps into three equal parts and freeze the training weight parameters in the second part. By setting the loss function of threshold, we can update the weight parameters for the third part. This method is to ensure the fast convergence of the first part and the optimal solution of the third part. The second part of the calculation is controlled by the loss threshold to improve the training efficiency. In addition, effective control of loss changes is conducive to improving the robustness and accuracy of our model.
4. Experiments
In this section, we give the experimental evaluation for our method on VLD-45 datasets. According to our research, we carried out multi-detector method contrast experiment, ablation experiment and qualitative experiment. In addition, we focus on comparing the running rate and accuracy of the detection model, which can achieve the optimal detection performance through effective parameter regulation.
A. Datasets
For the experimental dataset, we use the VLD-45 object detection datasets [
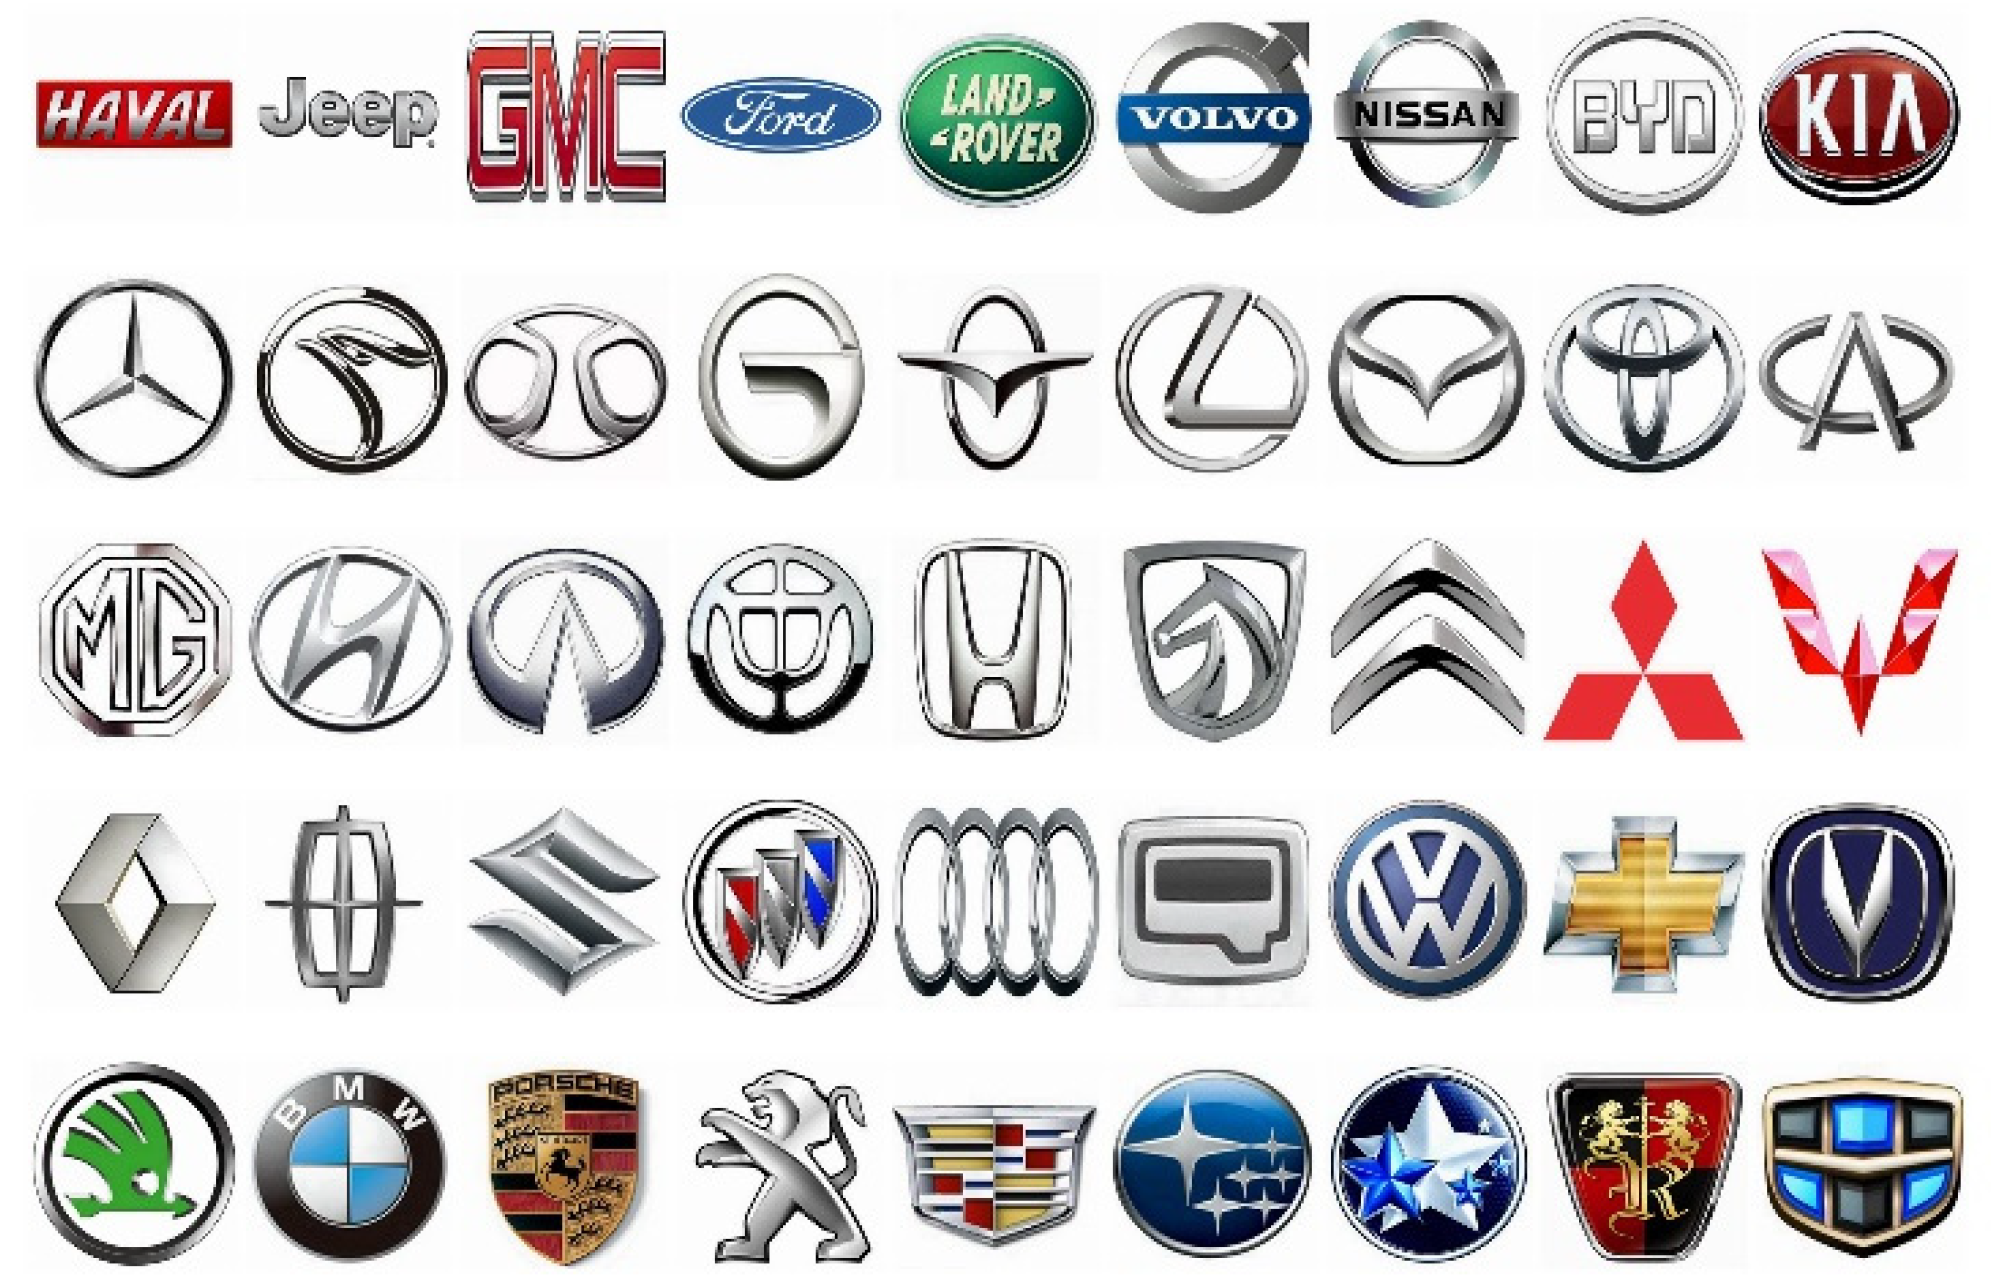
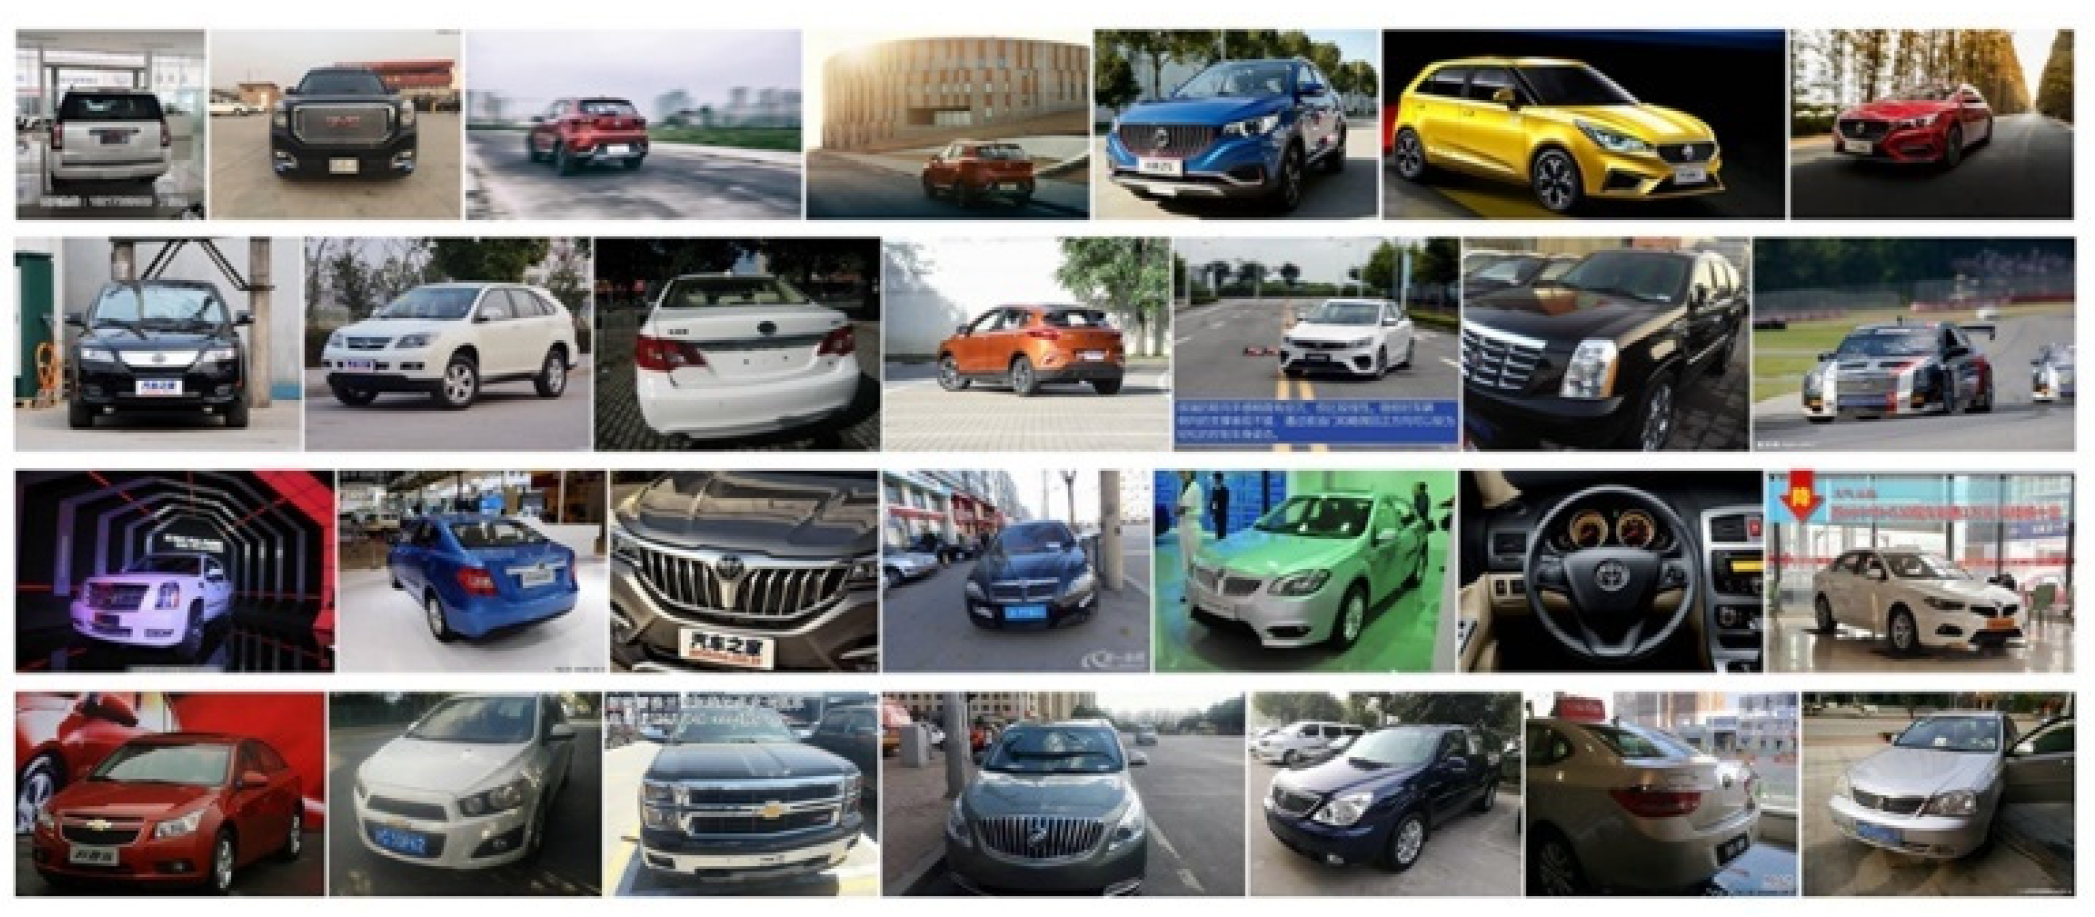
9]. It includes 45000 images and 50359 objects from 45 classes of vehicle logo, as shown in Figure 6 for the brand of the vehicle logo. According to the analysis of dataset, the proportion of the target is 0.2% in the whole image. Meanwhile, the average size of the object is 40×32 pixels. Thus, this dataset can be used to research the small size objects detection. Figure 7 shows the samples of the VLD-45. This dataset includes the training dataset (20025 images), valid dataset (14985 images) and testing dataset (9990 images). We directly complete the method evaluation experiment on the original dataset. For the evaluation index, we use the Average Precision (AP) for giving the single class accuracy. And the mean Average Precision (mAP) is applied to multi-classes evaluation.
Figure 6.
The example of VLD-45 dataset for 45 categories.
Figure 6.
The example of VLD-45 dataset for 45 categories.
Figure 7.
The samples of detailed VLD-45 dataset.
Figure 7.
The samples of detailed VLD-45 dataset.
B. Parameters
From the
Figure 2 and Figure 5, our input data is resized as 416×416 pixels (32 of sampling rate), which keeps the balance of memory usage and feature requirements. Meanwhile, we use the pre-training model from the logo classification for improving the detection training. The number of anchor box has 9 sizes from 3 different scales. For the threshold of Non-maximum Suppression (NMS), we unify set it to the value of 0.5 for the Intersection over Union (IoU).
All of our experiments are trained and tested on the GPU of NVIDIA Tesla A8000. About the training optimizer, we use the AMSGrad method for completing the weight update. Our models need to spend 80000 iterations with the batch size of 32.
C. Comparison Experiments
In evaluating the detection performance, we chose mainstream detection methods for comparison, including Faster R-CNN [
23], RefineDet [
24], YOLOv3 [
25], YOLOv4 [
26], and Our Method (VLD-Transformer). To facilitate analysis, the experiments provide detection accuracy in terms of Average Precision (AP) for 45 categories, along with overlap ratios and running times on the testing data of VLD-45. The results are presented in
Table 1. Analyzing the results presented in
Table 1 further emphasizes the effectiveness of our approach. The obtained Average Precision (AP) and mean Average Precision (mAP) for our method showcase a substantial improvement in detection accuracy when compared to the selected benchmark methods. This enhancement is particularly notable across diverse detection classes.
In contrast to the previous mAP result of 84.7%, our method achieves a remarkable 88.0% mAP. This indicates a noteworthy advancement in the model’s ability to accurately identify and classify objects in the given dataset. Importantly, this improvement in mAP is achieved with an efficient processing time of only 0.07 seconds per image, highlighting the practical viability of our method in real-time applications. Furthermore, the exceptional performance in the overlap ratio of results, reaching 89.3%, underscores the robustness of our method in providing precise regional accuracy.
The high overlap ratio signifies the model’s capability to deliver consistent and reliable results, crucial for applications where precise object delineation is paramount.
Notably, for challenging classes such as letter patterns (e.g., HAVAL, LAND ROVER, and Jeep), our method enhances detection precision by 3% to 5% in terms of AP. The experimental evaluation indicates that our method exhibits effective localization and classification for all categories. However, it’s acknowledged that our method has not uniformly improved detection results across all categories, suggesting potential for enhancement in multi-category prediction capabilities. Hence, addressing the differentiation in features across multiple categories remains a key area for future research.
In summary, the results affirm the robustness and efficiency of our proposed method, positioning it as a promising solution for accurate and real-time object detection tasks. The high mAP, rapid processing time, and strong overlap ratio collectively contribute to the method’s practical utility and underline its potential for various applications in computer vision and object recognition.
D. Ablation Experiment for Our Method
Our exploration into the detection performance of three improved methods for the VLD-Transformer reveals significant insights. As outlined in
Section 3, we introduced three methods—Attention Feature Extraction Network (AFEN), Detection Head (DH), and Freezing Training Policy (FTP)—aimed at enhancing detection results. Rigorous validation experiments were conducted for each method under controlled conditions.
The ablation results in
Table 2 underscore the critical need for a robust backbone as the feature extraction network for VLD-Transformer. The evaluation demonstrates that compared to YOLOv4, our AFEN module achieves a baseline detection mAP of 0.855. This indicates the efficacy of AFEN in extracting discriminative features essential for accurate detection.
Furthermore, the improvement achieved by the detection head, coupled with the training policy, should not be overlooked. The amalgamation of the detection head and the freeze training policy results in an impressive 0.88 detection accuracy on the dataset. This highlights the synergistic effect of refining both the network architecture and the training strategy for enhanced performance.
While the training policy exhibits limited performance in model improvement, it emphasizes the importance of a holistic optimization approach. To achieve further advancements in detection accuracy, emphasis should be placed on meticulous design considerations within the detection framework. The experimental results underscore the complexity of optimizing the feature extraction model and the overall detection framework for superior performance in real-world scenarios.
E. Qualitative Results
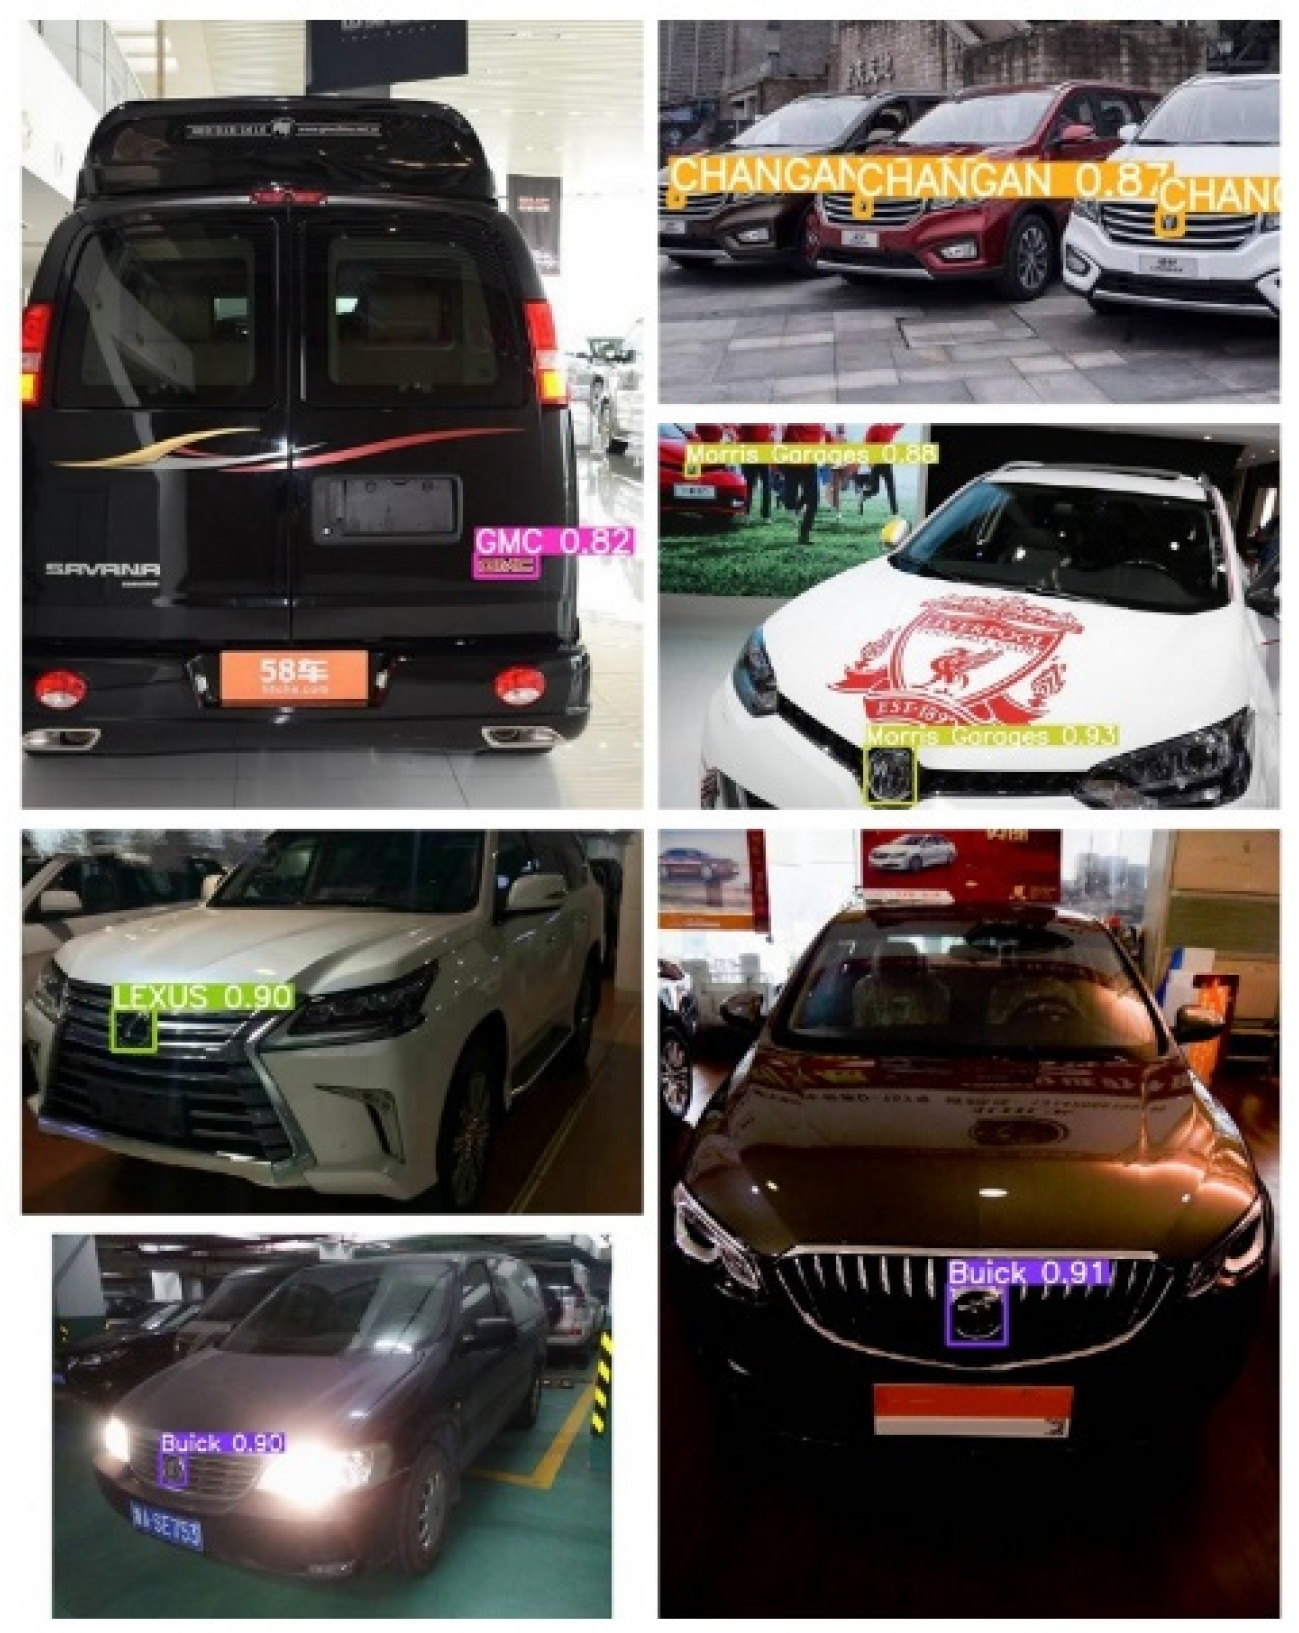
The Figure 8 shows the detection result for our method of VLD-45.
The results presented in Figure 8 illustrate the detection outcomes achieved by our VLD-Transformer method on the VLD-45 dataset. As depicted in the examples, it is evident that our approach yields favorable qualitative results. The qualitative analysis further supports the efficacy of our method in enhancing the accuracy of vehicle logo detection.
Figure 8.
The examples of qualitative results for VLD-Transformer on the VLD-45 dataset.
Figure 8.
The examples of qualitative results for VLD-Transformer on the VLD-45 dataset.
One notable observation is the precision exhibited in the detection of vehicle logos. The VLD-Transformer demonstrates a robust capability to accurately identify and delineate logos, even in complex scenarios or varied lighting conditions. This is indicative of the model’s adaptability and resilience in real-world applications. Moreover, the qualitative results suggest that our method excels in maintaining the integrity and clarity of detected logos. This is crucial for applications where precise logo recognition is essential, such as in autonomous driving systems or traffic monitoring.
The analysis of Figure 8 underscores the potential practical significance of our VLD-Transformer method in real-world scenarios, showcasing its ability to contribute to advancements in vehicle logo detection accuracy and reliability. Further quantitative assessments and comparisons with existing methods would provide a comprehensive evaluation of its performance against diverse benchmarks.
5. Conclusions
In this work, we propose an end-to-end framework for the task of vehicle logo detection, called VLD-Transformer. Our method focusses on solving the detection of small size objects. Thus, we design an attention feature extraction network based on visual transformer, which combines multi-scale feature fusion with attention blocks to achieve robust feature representation. Then, we construct the detection head with multi-scale prediction for improving the locating precision. For the prediction layer, we design the up-sampling network for learning the detection parameters. The multi-scale prediction layer can fuse the feature map from the shallow layer to acquire the bounding box regression result. The whole model method can be used for parameter learning. In addition, we use the freeze training policy of multi-stages for adjusting the training efficiency. According to the evaluation on the VLD-45 dataset, our method obtains the best detection performance on the vehicle logo classes of 45. Besides, the ablation results prove the effectiveness of VLD-Transformer. However, our model still lacks balance in detection accuracy and running rate. In the future, we will reconstruct the detection framework itself to achieve real-time detection performance.
Acknowledgments
This work is supported by “Junma Plan” research topic from Inner Mongolia University. The fund of Supporting the Reform and Development of Local Universities (Disciplinary Construction) and the special research project of First-class Discipline of Inner Mongolia A. R. of China under Grant YLXKZX-ND-036.
References
- Zhu Li, Fei Richard Yu, Yige Wang, et al. Big Data Analytics in Intelligent Transportation Systems: A survey. IEEE Transactions on Intelligent Transportation Systems. 20(1), 383-398(2018).
- Sahel, Salma, Mashael Alsahafi, Manal Alghamdi, et al. Logo Detection Using Deep Learning with Pretrained CNN Models. Engineering, Technology & Applied Science Research. 11(1), 6724-6729(2021).
- Ma, Lixin, Yong Zhang. Research on Vehicle License Plate Recognition Technology Based on Deep Convolutional Neural Networks. Microprocessors and Microsystems. 82, 103932(2021).
- Kai Ming He, Xiangyu Zhang, Shaoqing Ren, et al. Deep Residual Learning for Image Recognition. IEEE Conference on Computer Vision and Pattern Recognition. 770-778(2016).
- Psyllos, Apostolos P., Christos-Nikolaos E. Anagnostopoulos, et al. Vehicle Logo Recognition Using A Sift-based Enhanced Matching Scheme. IEEE transactions on intelligent transportation systems, 11(2), 322-328(2010).
- Yu Ye, Jun Wang, Jingting Lu, et al. Vehicle Logo Recognition Based on Overlapping Enhanced Patterns of Oriented Edge Magnitudes. Computers & Electrical Engineering. 71, 273-283(2018).
- Shuo Yang, Junxing Zhang, Chunjuan Bo, et al. Fast Vehicle Logo Detection in Complex Scenes. Optics & Laser Technology. 110, 196-201(2019).
- Meethongjan Kittikhun, Thongchai Surinwarangkoon, Vinh Truong Hoang. Vehicle Logo Recognition Using Histograms of Oriented Gradient Descriptor and Sparsity Score. 18(6), 3019-3025(2020).
- Yang Shuo, Chunjuan Bo, Junxing Zhang, et al. VLD-45: A Big Dataset for Vehicle Logo Recognition and Detection. IEEE Transactions on Intelligent Transportation Systems. (2021).
- Llorca David Fernández, Roberto Arroyo, Miguel Angel Sotelo. Vehicle Logo Recognition in Traffic Images Using HOG Features and SVM. IEEE International Conference on Intelligent Transportation Systems. 2229–2234(2013).
- Satpathy Amit, Xudong Jiang, How-Lung Eng. LBP-Based Edge-Texture Features for Object Recognition. 23(5), 1953-1964(2014).
- Gu Qin, Jianyu Yang, Guolong Cui, et al. Multi-scale Vehicle Logo Recognition by Directional Dense SIFT Flow Parsing. IEEE International Conference on Image Processing. 3827-3831(2016).
- Sotheeswaran S., A. Ramanan, A Coarse-to-Fine Strategy for Vehicle Logo Recognition from Frontal-View Car Images. Parttern Recognition. 28, pp.142-154(2018).
- Psyllos Apostolos P., Christos-Nikolaos E. Vehicle Logo Recognition Using a SIFT-Based Enhanced Matching Scheme. IEEE Trans on Intelligence Transport System. 11, pp.322-328(2010).
- Peng Haoyu, Xun Wang, Huiyan Wang, et al. Recognition of Low-Resolution Logos in Vehicle Images Based on Statistical Random Sparse Distribution. IEEE Transactions on Intelligent Transportation Systems. 16(2), 681-691(2014).
- Sun Quan, Xiaobo Lu, Lin Chen, et al. An Improved Vehicle Logo Recognition Method for Road Surveillance Images. IEEE International Symposium on Computational Intelligence and Design. 1, 373-376(2014).
- Liao Yuan, Xiaoqing Lu, Chengcui Zhang, et al. IEEE International Conference on Computer Vision and Pattern Recognition. 4856-4865(2017).
- Pan Chun, Zhiguo Yan, Xiaoming Xu, et al. Vehicle Logo Recognition Based on Deep Learning Architecture in Video Surveillance for Intelligent Traffic System. IET International Conference on Smart and Sustainable City. 123-126(2013).
- Huan, Li, Qin Yujian, Wang Li. Vehicle Logo Retrieval Based on Hough Transform and Deep Learning. IEEE International Conference on Computer Vision Workshops. 967-973(2017).
- Soon Foo Chong, Hui Ying Khaw, Joon Huang Chuah, et al. Hyper-parameters Optimisation of Deep CNN Architecture for Vehicle Logo Recognition. IET Intelligent Transport Systems. 12(8), 939-946(2018).
- Liu Ruikang, Qing Han, Weidong Min, et al. Vehicle Logo Recognition Based on Enhanced Matching for Small Objects, Constrained Region and SSFPD Network. Sensors. 20, 4528(2019).
- Hoanh Nguyen. Vehicle Logo Recognition Based on Vehicle Region and Multi-scale Feature Fusion. Journal of Theoretical and Applied Information Technology. 98,16(2020).
- Ren Shaoqing, Kaiming He, Ross Girshick, et al. Faster R-CNN: Towards Real-Time Object Detection with Region Proposal Networks. IEEE Transactions on Pattern Analysis and Machine Intelligence. 39(6), 1137-1149(2017).
- Zhang Shifeng, Longyin Wen, Xiao Bian. Single-Shot Refinement Neural Network for Object Detection. IEEE Conference on Computer Vision and Pattern Recognition (CVPR). 4203-4212(2018).
- Redmon Joseph, Ali Farhadi. Yolov3: An incremental improvement. arXiv. 1804.02767 (2018).
- Bochkovskiy Alexey, Chien-Yao Wang, Hong-Yuan Mark Liao. YOLOv4: Optimal Speed and Accuracy of Object Detection. arXiv. 2004.10934(2020).
|
Disclaimer/Publisher’s Note: The statements, opinions and data contained in all publications are solely those of the individual author(s) and contributor(s) and not of MDPI and/or the editor(s). MDPI and/or the editor(s) disclaim responsibility for any injury to people or property resulting from any ideas, methods, instructions or products referred to in the content. |
© 2024 by the authors. Licensee MDPI, Basel, Switzerland. This article is an open access article distributed under the terms and conditions of the Creative Commons Attribution (CC BY) license (https://creativecommons.org/licenses/by/4.0/).
