1. Introduction
In recent years, the development of GPS and other location information systems has simplified and increased the accuracy of determining the position of various objects, including people and vehicles. The data obtained in this way are used to conduct new types of research in various fields, including traffic engineering, urban planning, disaster prevention, and behavioral pattern analysis. For example, a proposed method uses cell-phone location data to extract individual behavior patterns, which can then be exploited to identify movements within a city ([
1,
2,
3,
4]). The spatial distribution of base users is visualized by analyzing GPS data, and the characteristics of human flows and the location of bases are discussed ([
5]). There is also research on the obstacles faced when people must flee to evacuation sites during natural disasters as well as efficient evacuation guidance using GPS-derived movement trajectory data ([
6]). Furthermore, the actual damage and recovery process can be read from post-earthquake behavior patterns based on GPS information ([
7,
8]).
The analysis of human movement trajectories is fundamental to the study of human behavior, not only from a perspective directly related to these application fields. For example, animal migration tracks are critical from the perspective of environmental protection, even though their actual status is not fully understood; data collection using GPS and other methods is currently underway ([
9]). In a recent study, around 100 domestic cats were tagged with GPS and analysis of their behavior patterns has begun ([
10]). The complications required to attach GPS tags to animals is more cumbersome than one might imagine. Fortunately, sufficient data have already been gathered on humans who actively carry GPS tags as smartphones or cell phones. Both qualitatively and quantitatively using such data to investigate the characteristics of human behavior is fundamental for a deeper understanding of human beings.
Human movement distances are also known to follow a power distribution ([
1]); various studies are based on this notion. For example, some studies describe the emergence of a power distribution as a superposition of such human modes of transportation as walking, running, and bicycling as well as other modes of transportation, including trains/subways, cars, cabs, and buses, all of which follow a log-normal distribution ([
11]). Other studies link the power distribution of human movement distances to the structure of social networks ([
12]). The relationship between the area enclosed by a moving trajectory on a random walk and the distance traveled has also been studied using the concept of fractal dimension ([
13,
14,
15]). In this paper, we show that various human behaviors can be analyzed from movement trajectories by investigating the well-known set of 2-dim area and 1-dim perimeter lengths without broaching such concepts.
From this viewpoint, we previously reported on the statistical properties observed in the correlation between the area and the perimeter of polygons drawn using confidential data on the daily movement trajectories of approximately 20,000 people passing through Urayasu City, Chiba Prefecture in August 2022 ([
16]). We found that the movement trajectories of people traveling distances of 5 km or more are linear, and those traveling distances less than 5 km are enclosed in much more areas, varied such as circles and squares. This result suggests that long-distance travelers have a specific destination in mind to which they tend to move to and from in a straight line. Short-distance travelers have multiple destinations and tend to move in a trajectory that resembles a circle to minimize their travel distance.
In addition, we found that the linearity of long-distance travel was particularly strong in women under the age of 30, and that this tendency was particularly strong on weekends and national holidays. These results are thought to be influenced by the presence in Urayasu City of Tokyo Disneyland, Japan’s largest theme park. In this paper, we analyze the movement trajectory data of Kyoto City, Japan’s largest historical tourist city to confirm this assumption. We then confirm whether the same statistical properties are observed as in Urayasu City. We support this investigation by also analyzing the data on the movement of people in Kanazawa City, Ishikawa Prefecture, which is another historic tourist destination.
This paper is organized as follows. First,
Section 2 describes the data used in this paper.
Section 3 reviews the previous, relevant research. In
Section 4, we examine whether the observation results (reviewed in
Section 3) from Urayasu City in Chiba Prefecture can also be observed in the data from Shimogyo-ku in Kyoto City and Kanazawa City in Ishikawa Prefecture. In
Section 5, we show that the observation result in the actual data described in this paper can be reproduced by a simple model simulation. Finally,
Section 6 summarizes this paper and discusses future issues.
2. Data
Our analysis in this paper is based on the following three datasets purchased from Agoop Corp. One is the movement trajectory of people passing through Urayasu City, Chiba Prefecture in August 2022. Another is the movement trajectory of people passing through Shimogyo-ku, Kyoto in November 2021 and January 2022. One more is the movement trajectory of those passing through Ishikawa Prefecture in August 2023 and September 2023. Shimogyo-ku is in the heart of Kyoto City, including the busiest Kyoto’s main train station. These movement trajectories consist of latitude and longitude data at one-minute intervals, with specifications that do not allow movements to be tracked across days. We analyzed approximately trajectories per day, each of which consisted of five or more points and a distance less than 10 km between the start and end points.
For example,
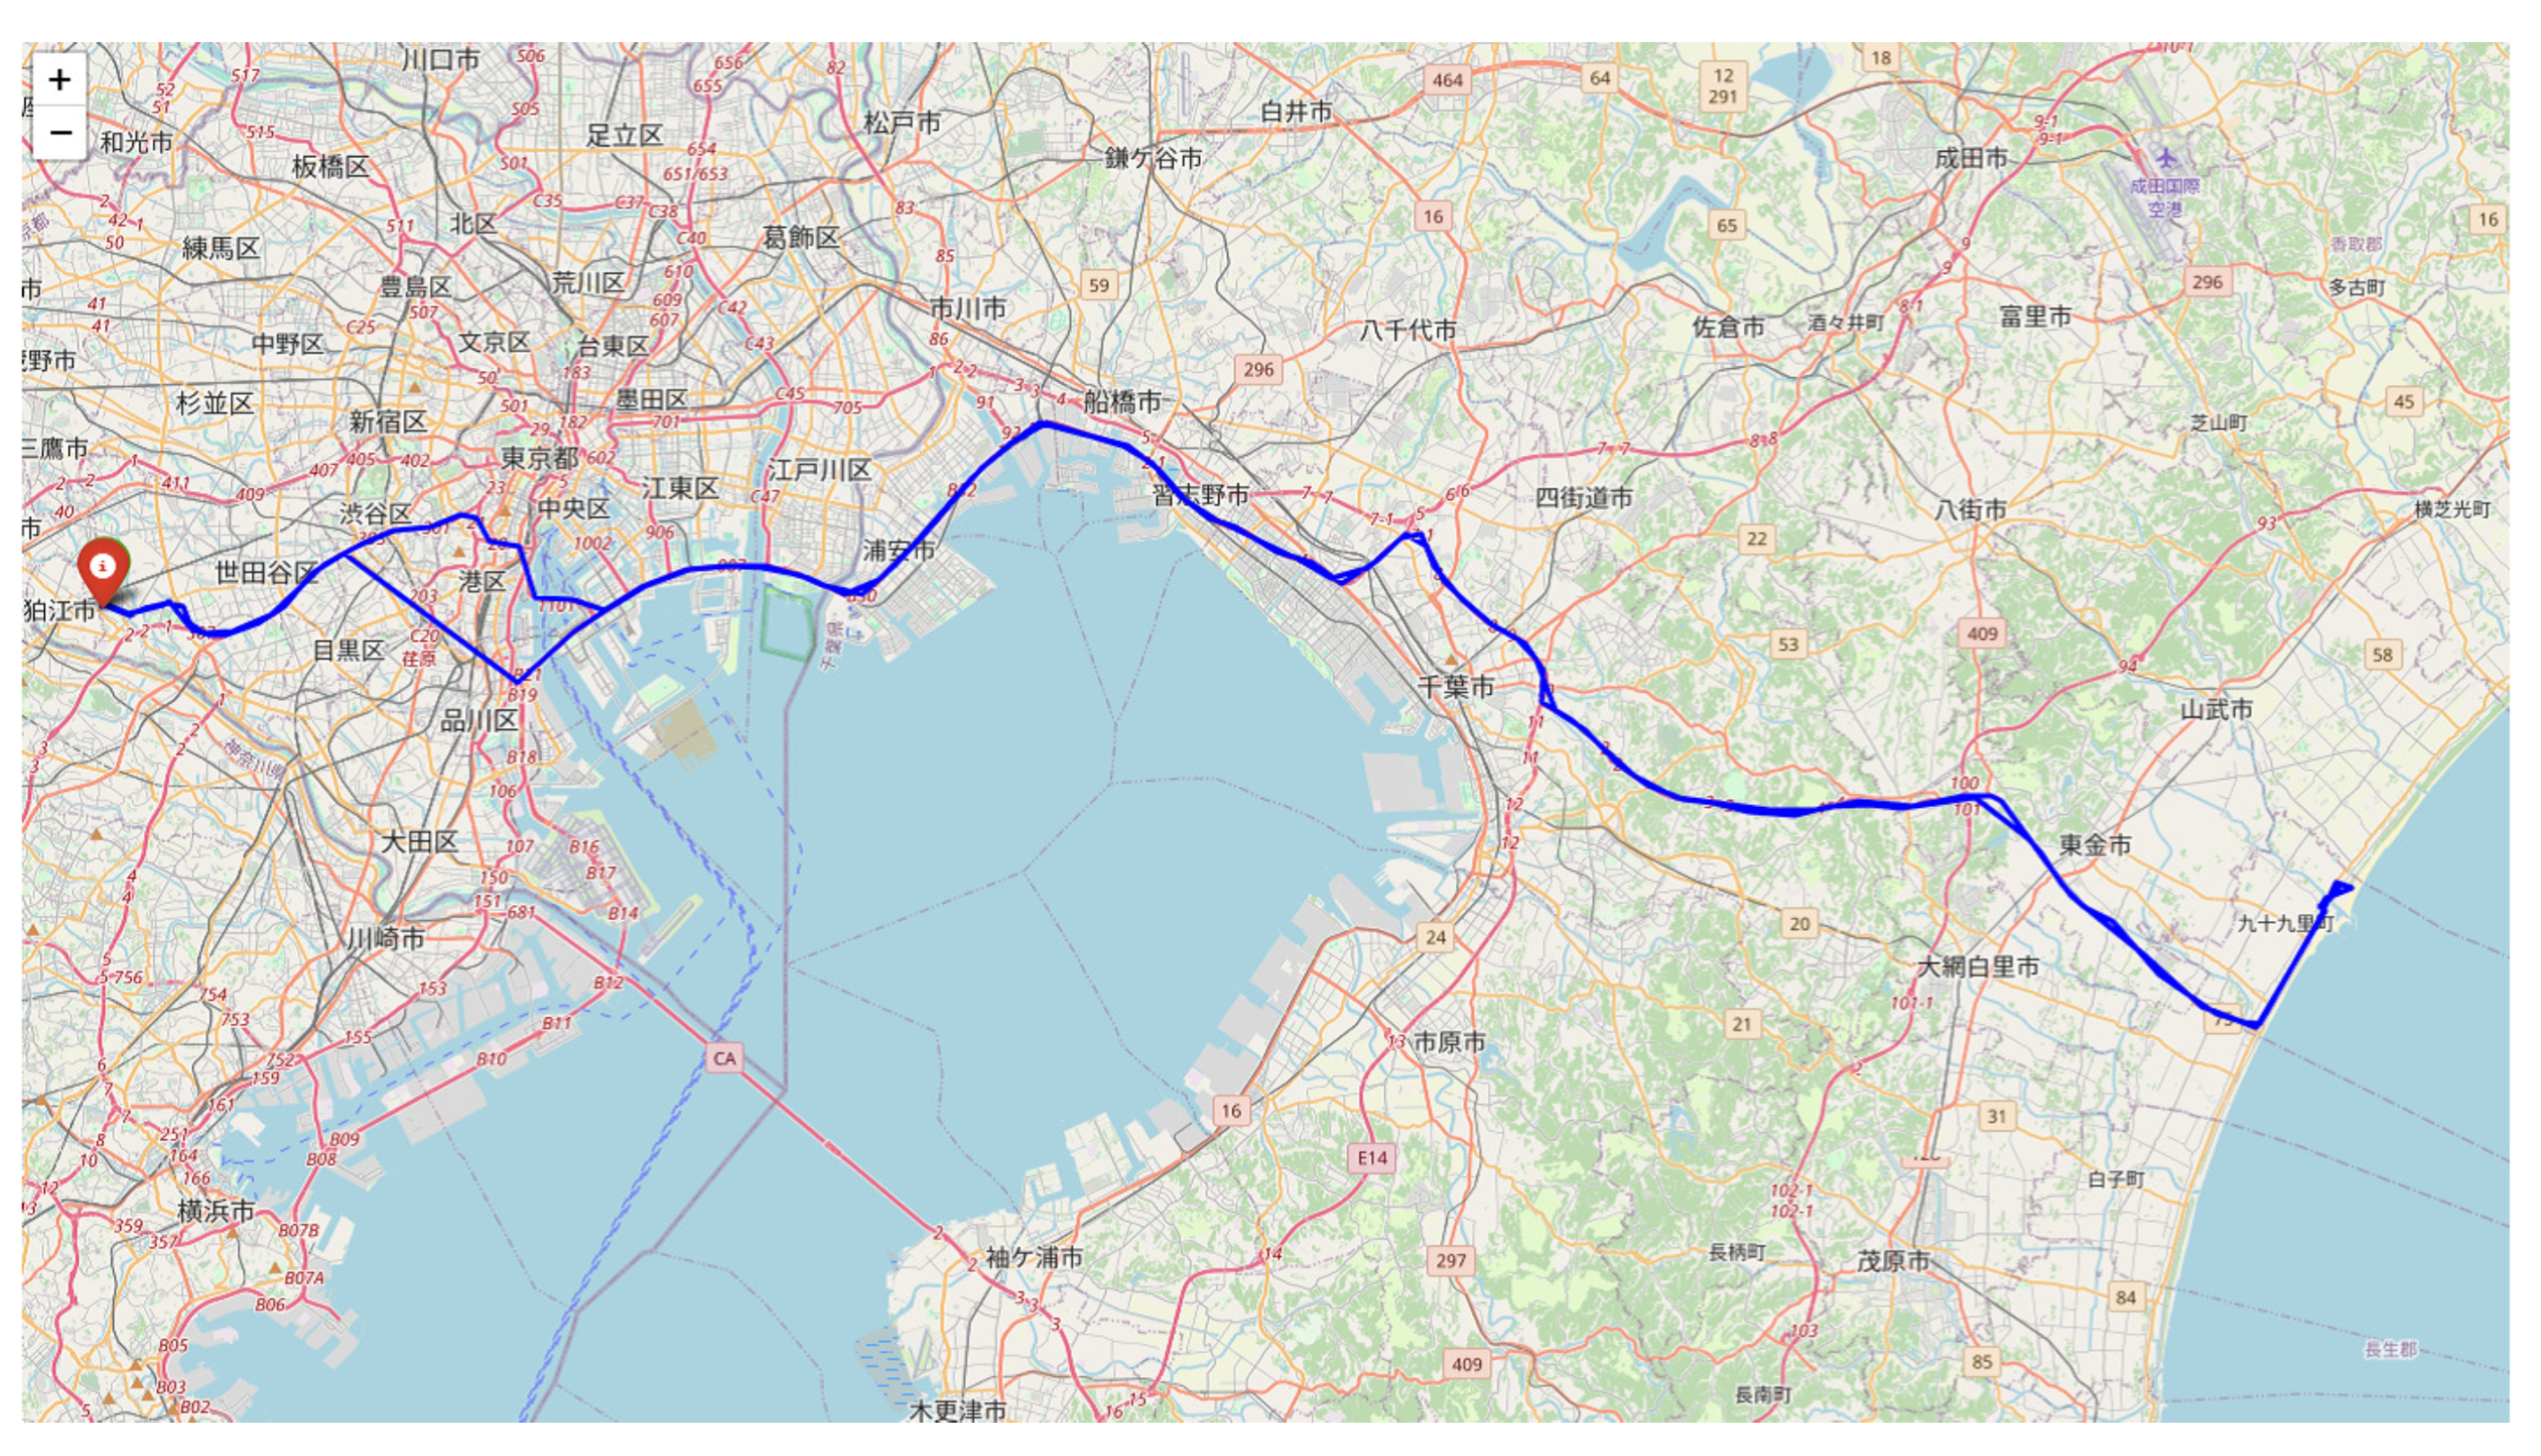
Figure 1 shows one person’s movement trajectory through Urayasu City, Chiba Prefecture on August 27, 2022, where the start and end points are indicated by red and green markers (the latter is hidden behind the former). This is a typical example of what can be observed in a moving trajectory, where its area bounded is 28.2 km
2 and its perimeter is 200.4 km.
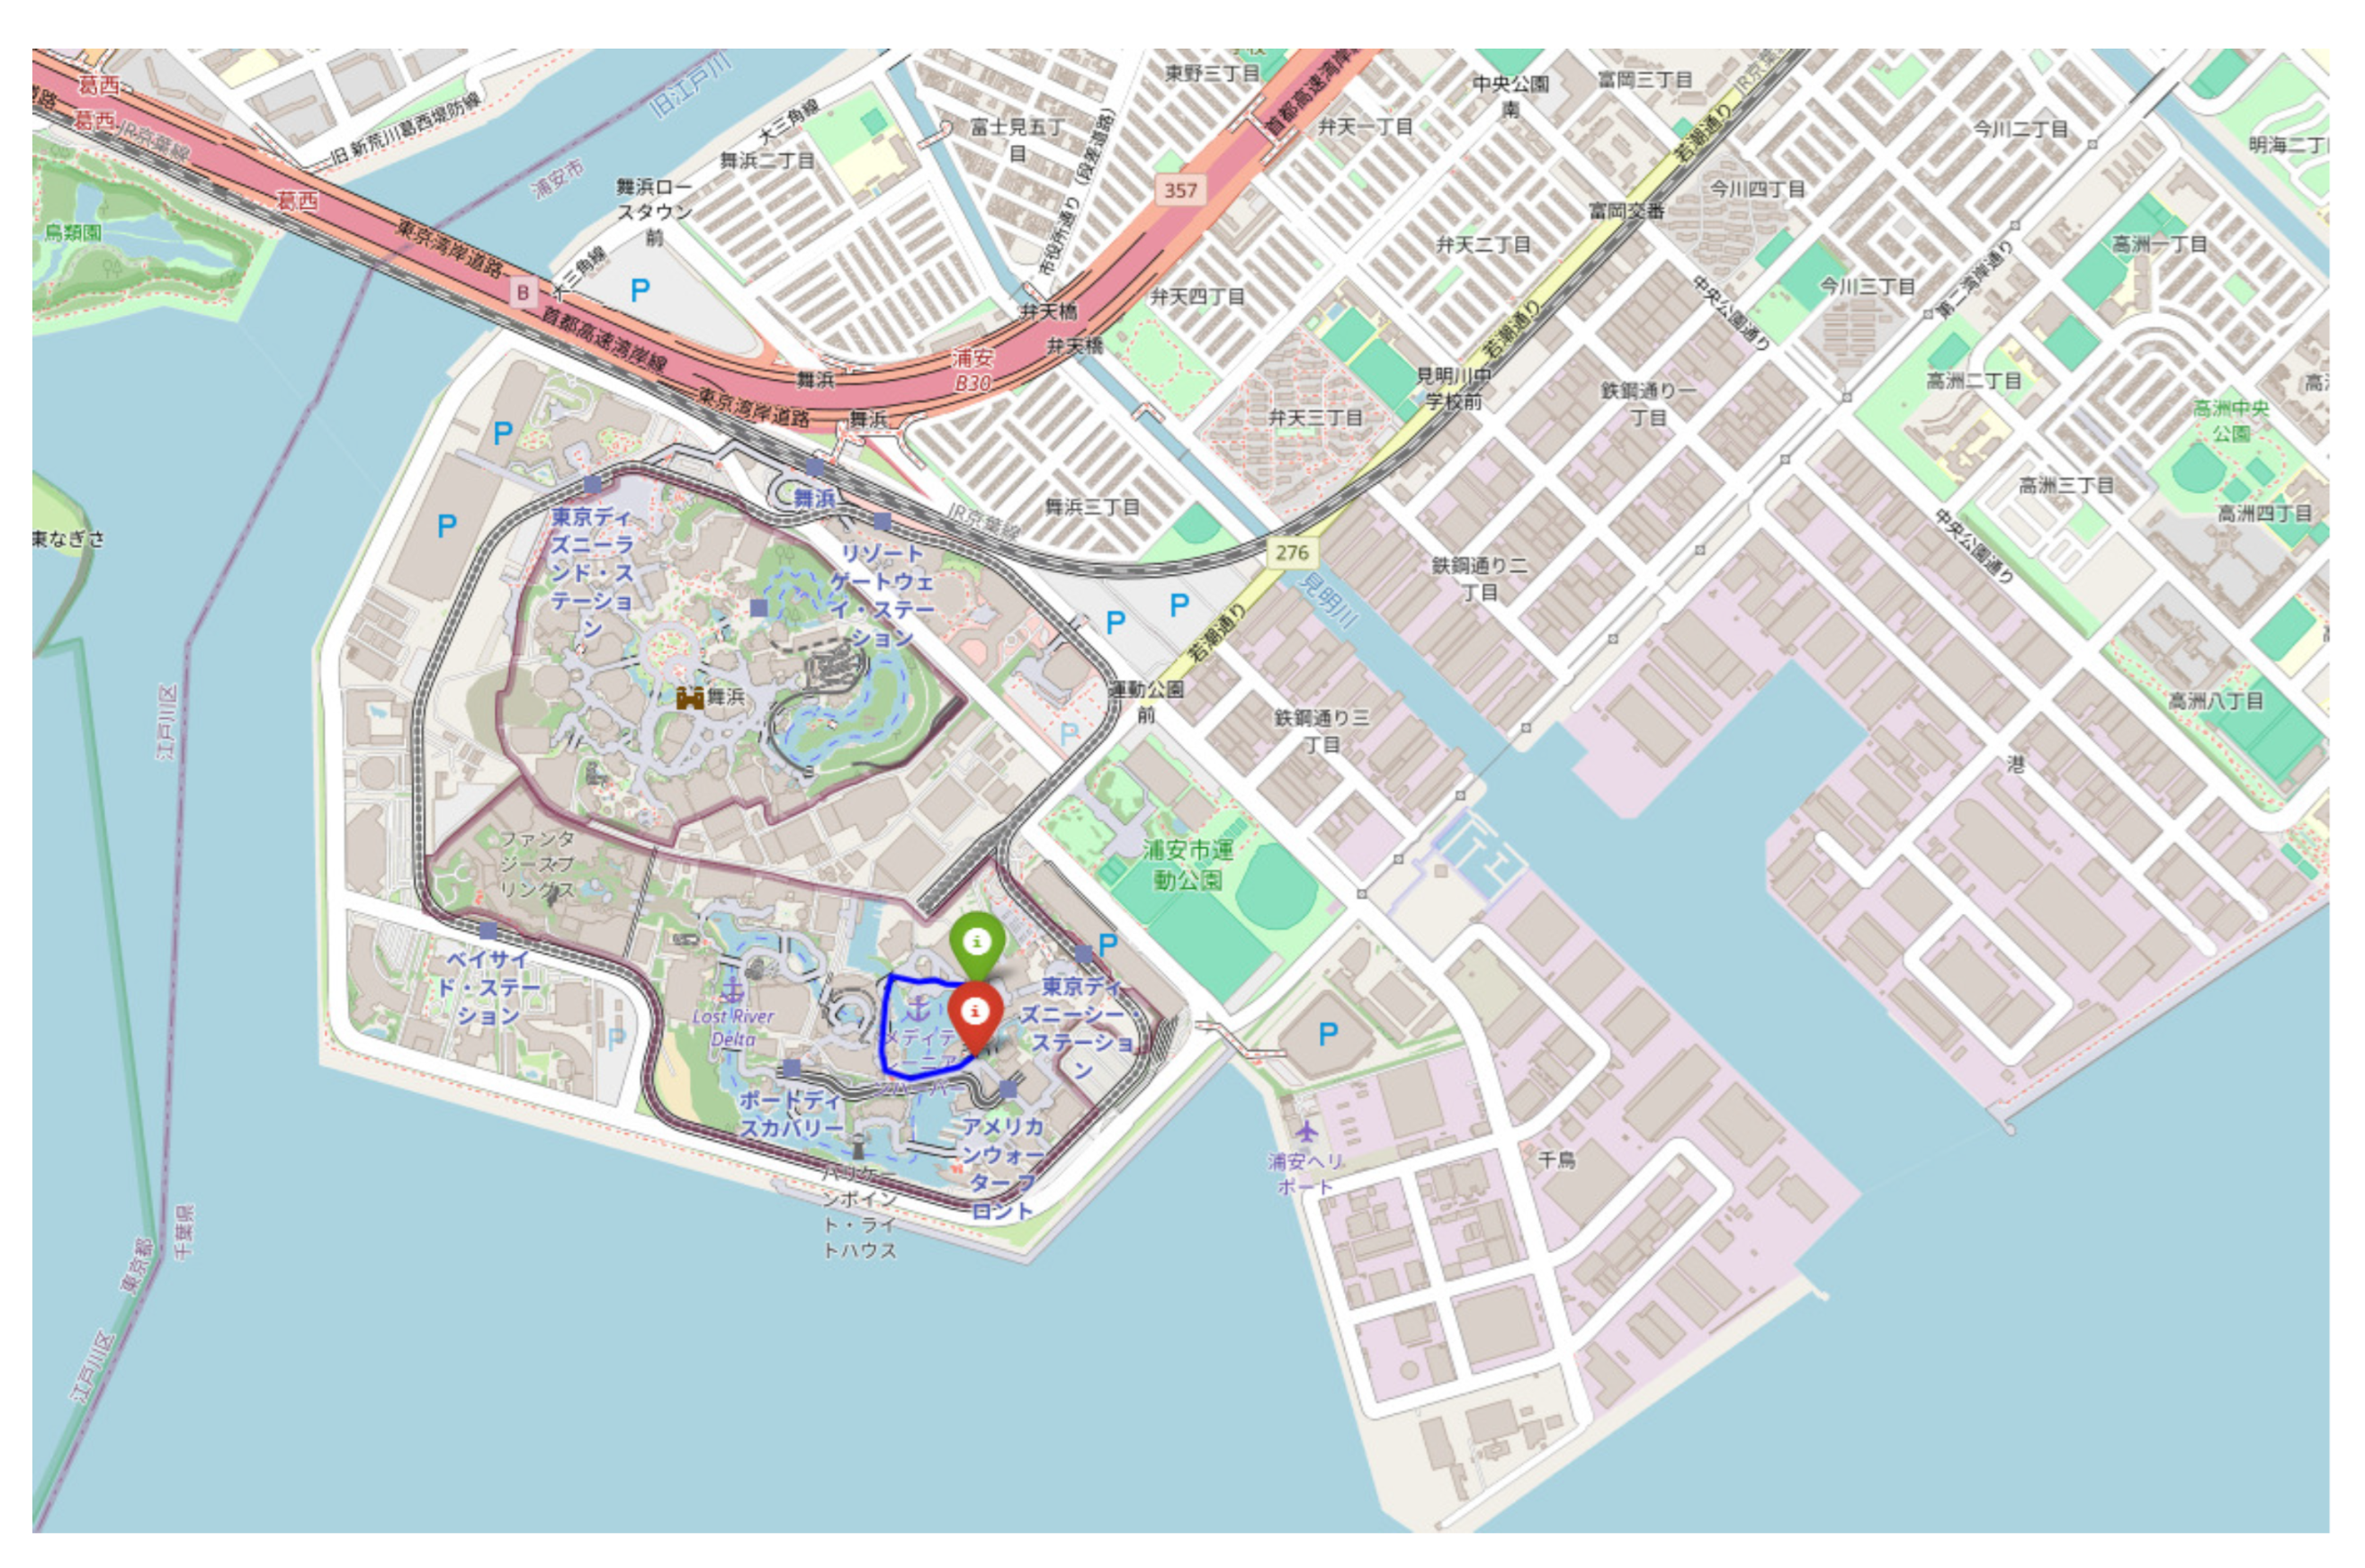
Figure 2 shows another person’s movement path through Urayasu City on August 22, 2022. This is another typical movement trajectory on a small scale, although it is overlooked when superimposed on
Figure 1 due to the scale, which is an enclosed area of 0.033 km
2 whose outer perimeter is 0.70 km.
The database contains not only movement tracks but also such personal attributes as gender, age, and city code where a person is presumed to live. Residency estimates are made by data-providing vendors who can track movement across days. This paper focuses on whether the properties observed in Urayasu City can also be observed in data from Shimogyo-ku and Ishikawa Prefecture. In particular, we discuss what fuels the changing nature of long-distance travel on weekends and national holidays.
3. Analysis of Urayasu City
3.1. Analysis without Consideration of Personal Attributes
First, in this section, our analysis does not consider personal attributes. As in our previous study ([
16]), we denote the area of the polygon enclosed by the human movement trajectory as
S km
2 and its perimeter as
L km.
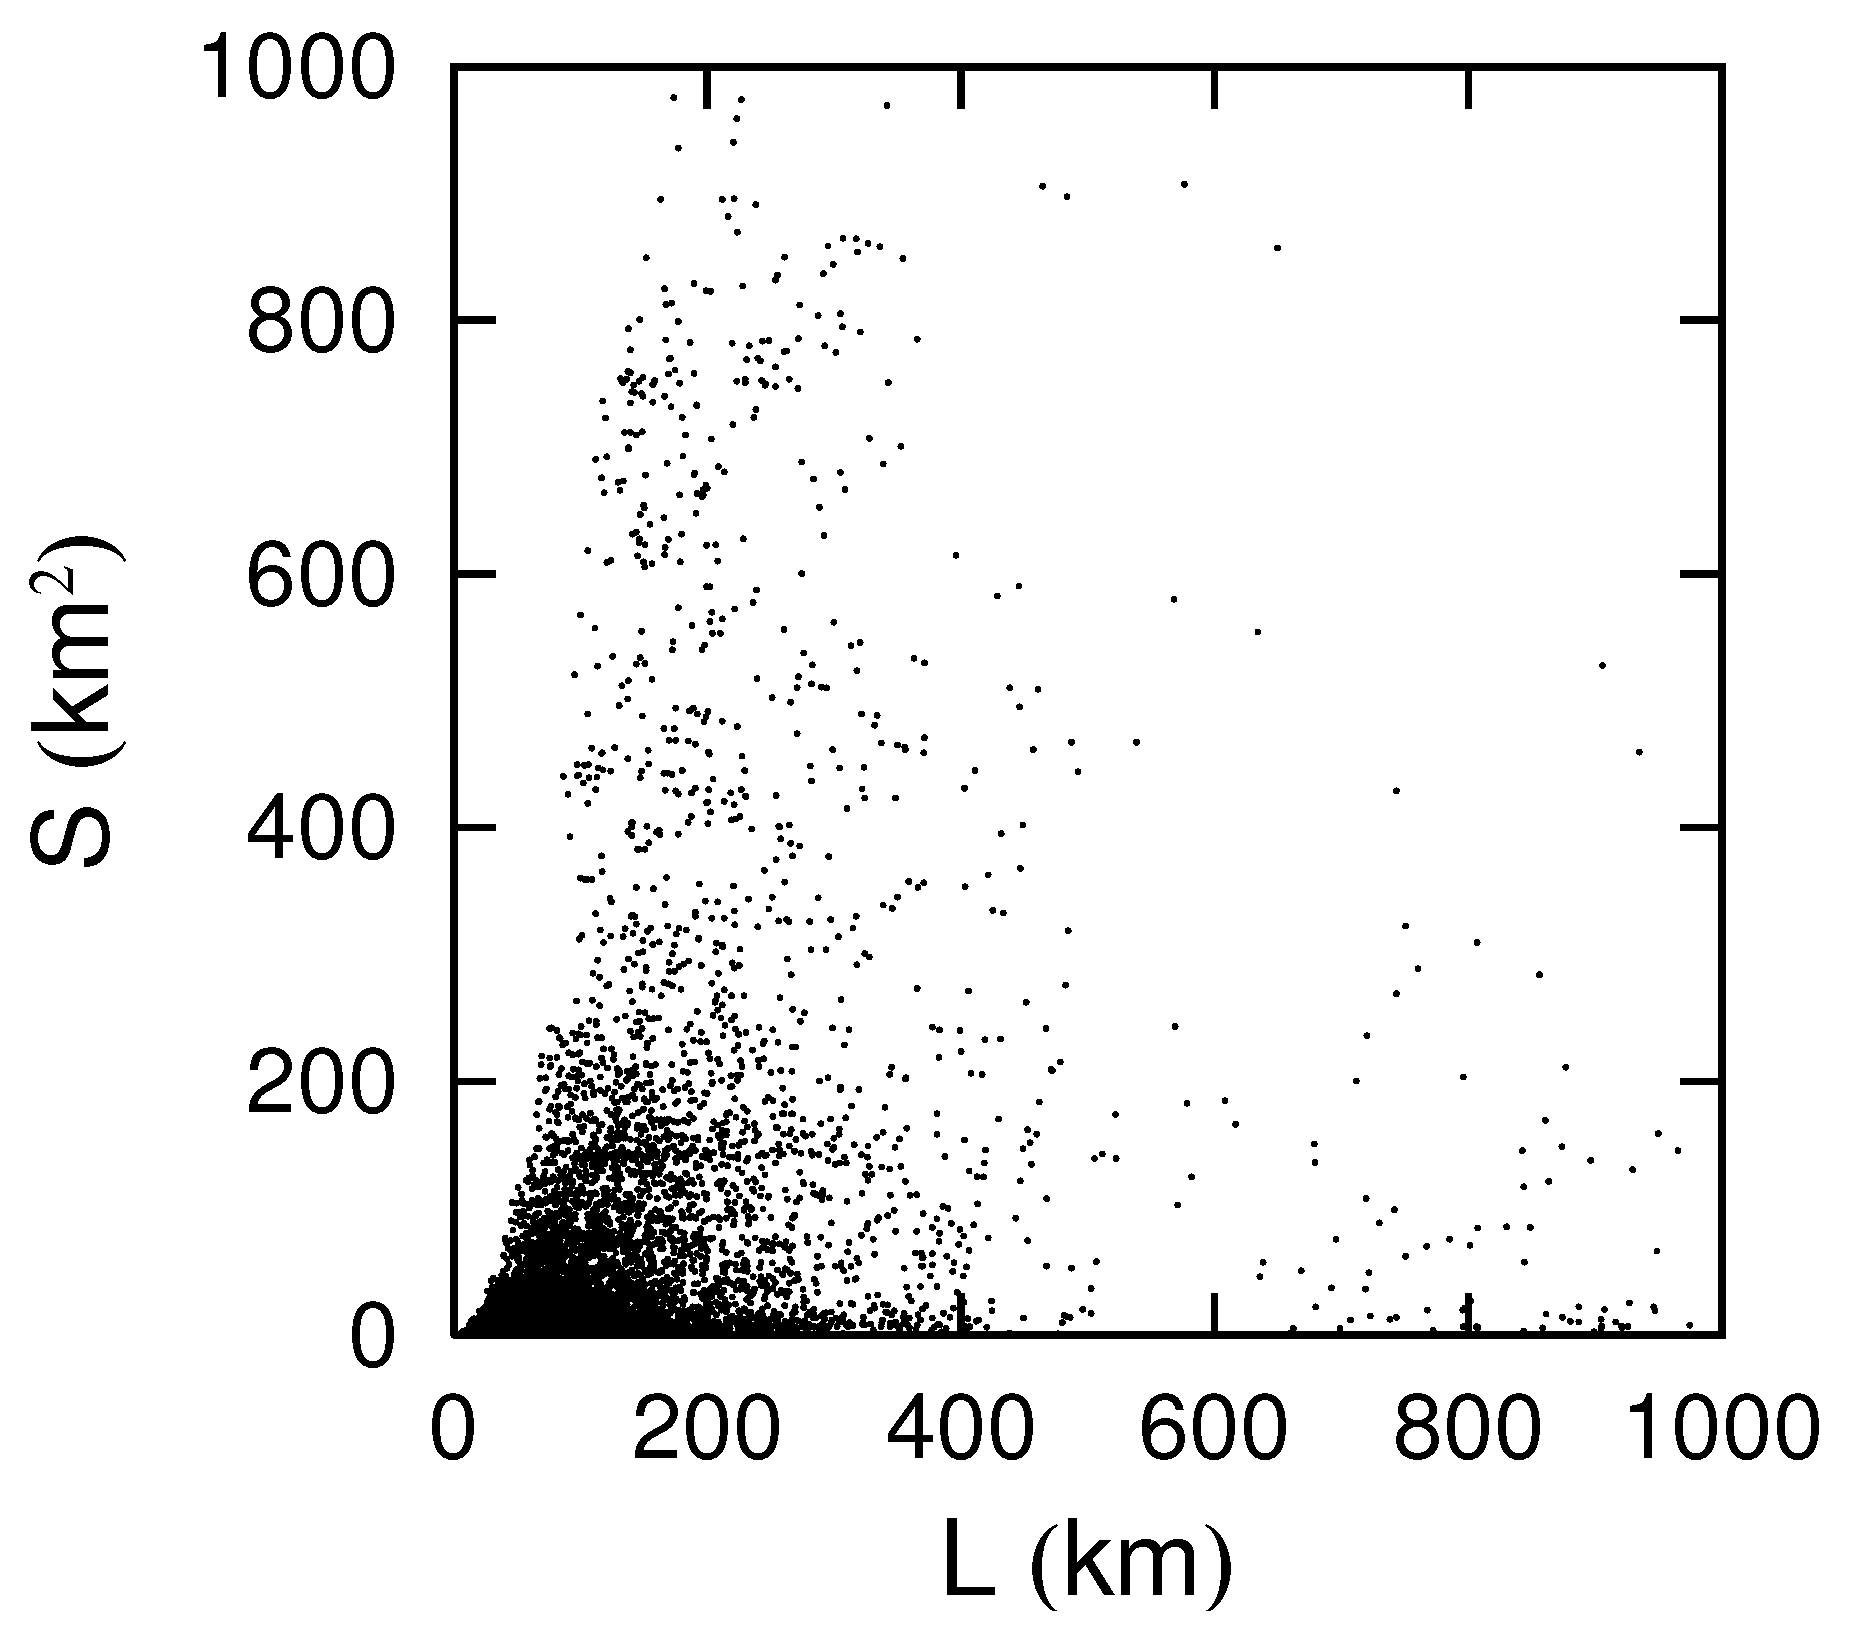
Figure 3 is a scatter plot of
L and
S of people passing through Urayasu City, Chiba Prefecture on August 7, 2022, where 14,492 data points are displayed. The parabolic boundary seen on the left edge of
Figure 3 shows that
S has an upper bound that depends approximately on
. This corresponds to the fact that the polygon that maximizes
S when
L is constant is a circle, and the relation is
. This property is visualized as the outer circumference of a polygon drawn by a movement trajectory that comes close to a circle or a square (
Figure 2).
Figure 3 also shows that the data are widely distributed, although many are gathered in
km and
km
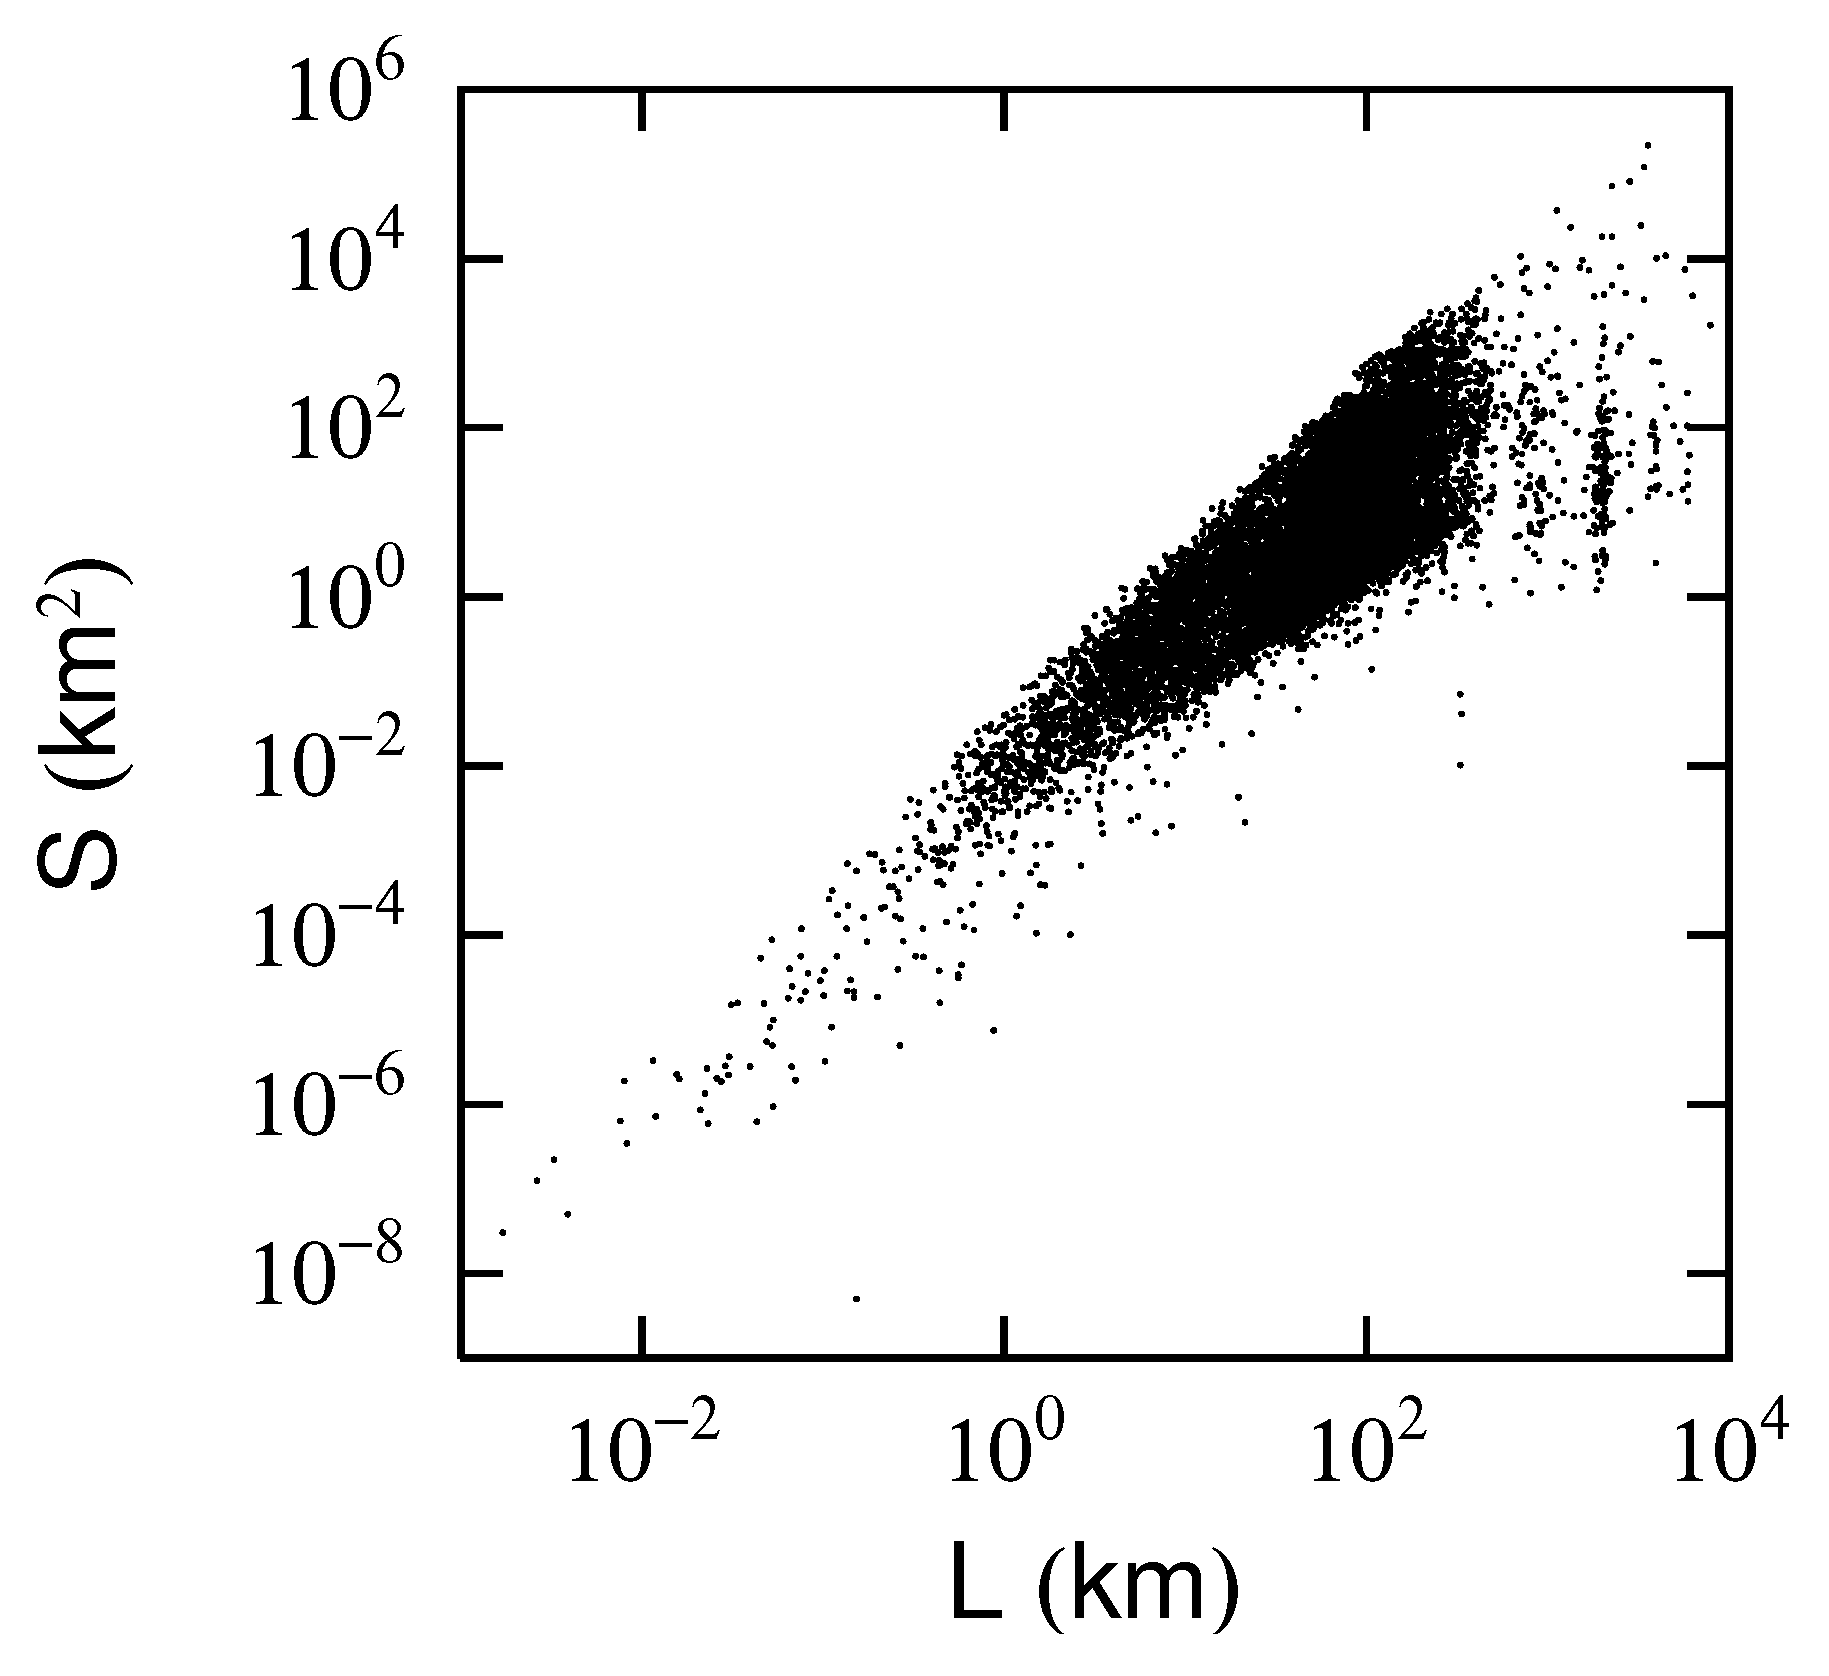
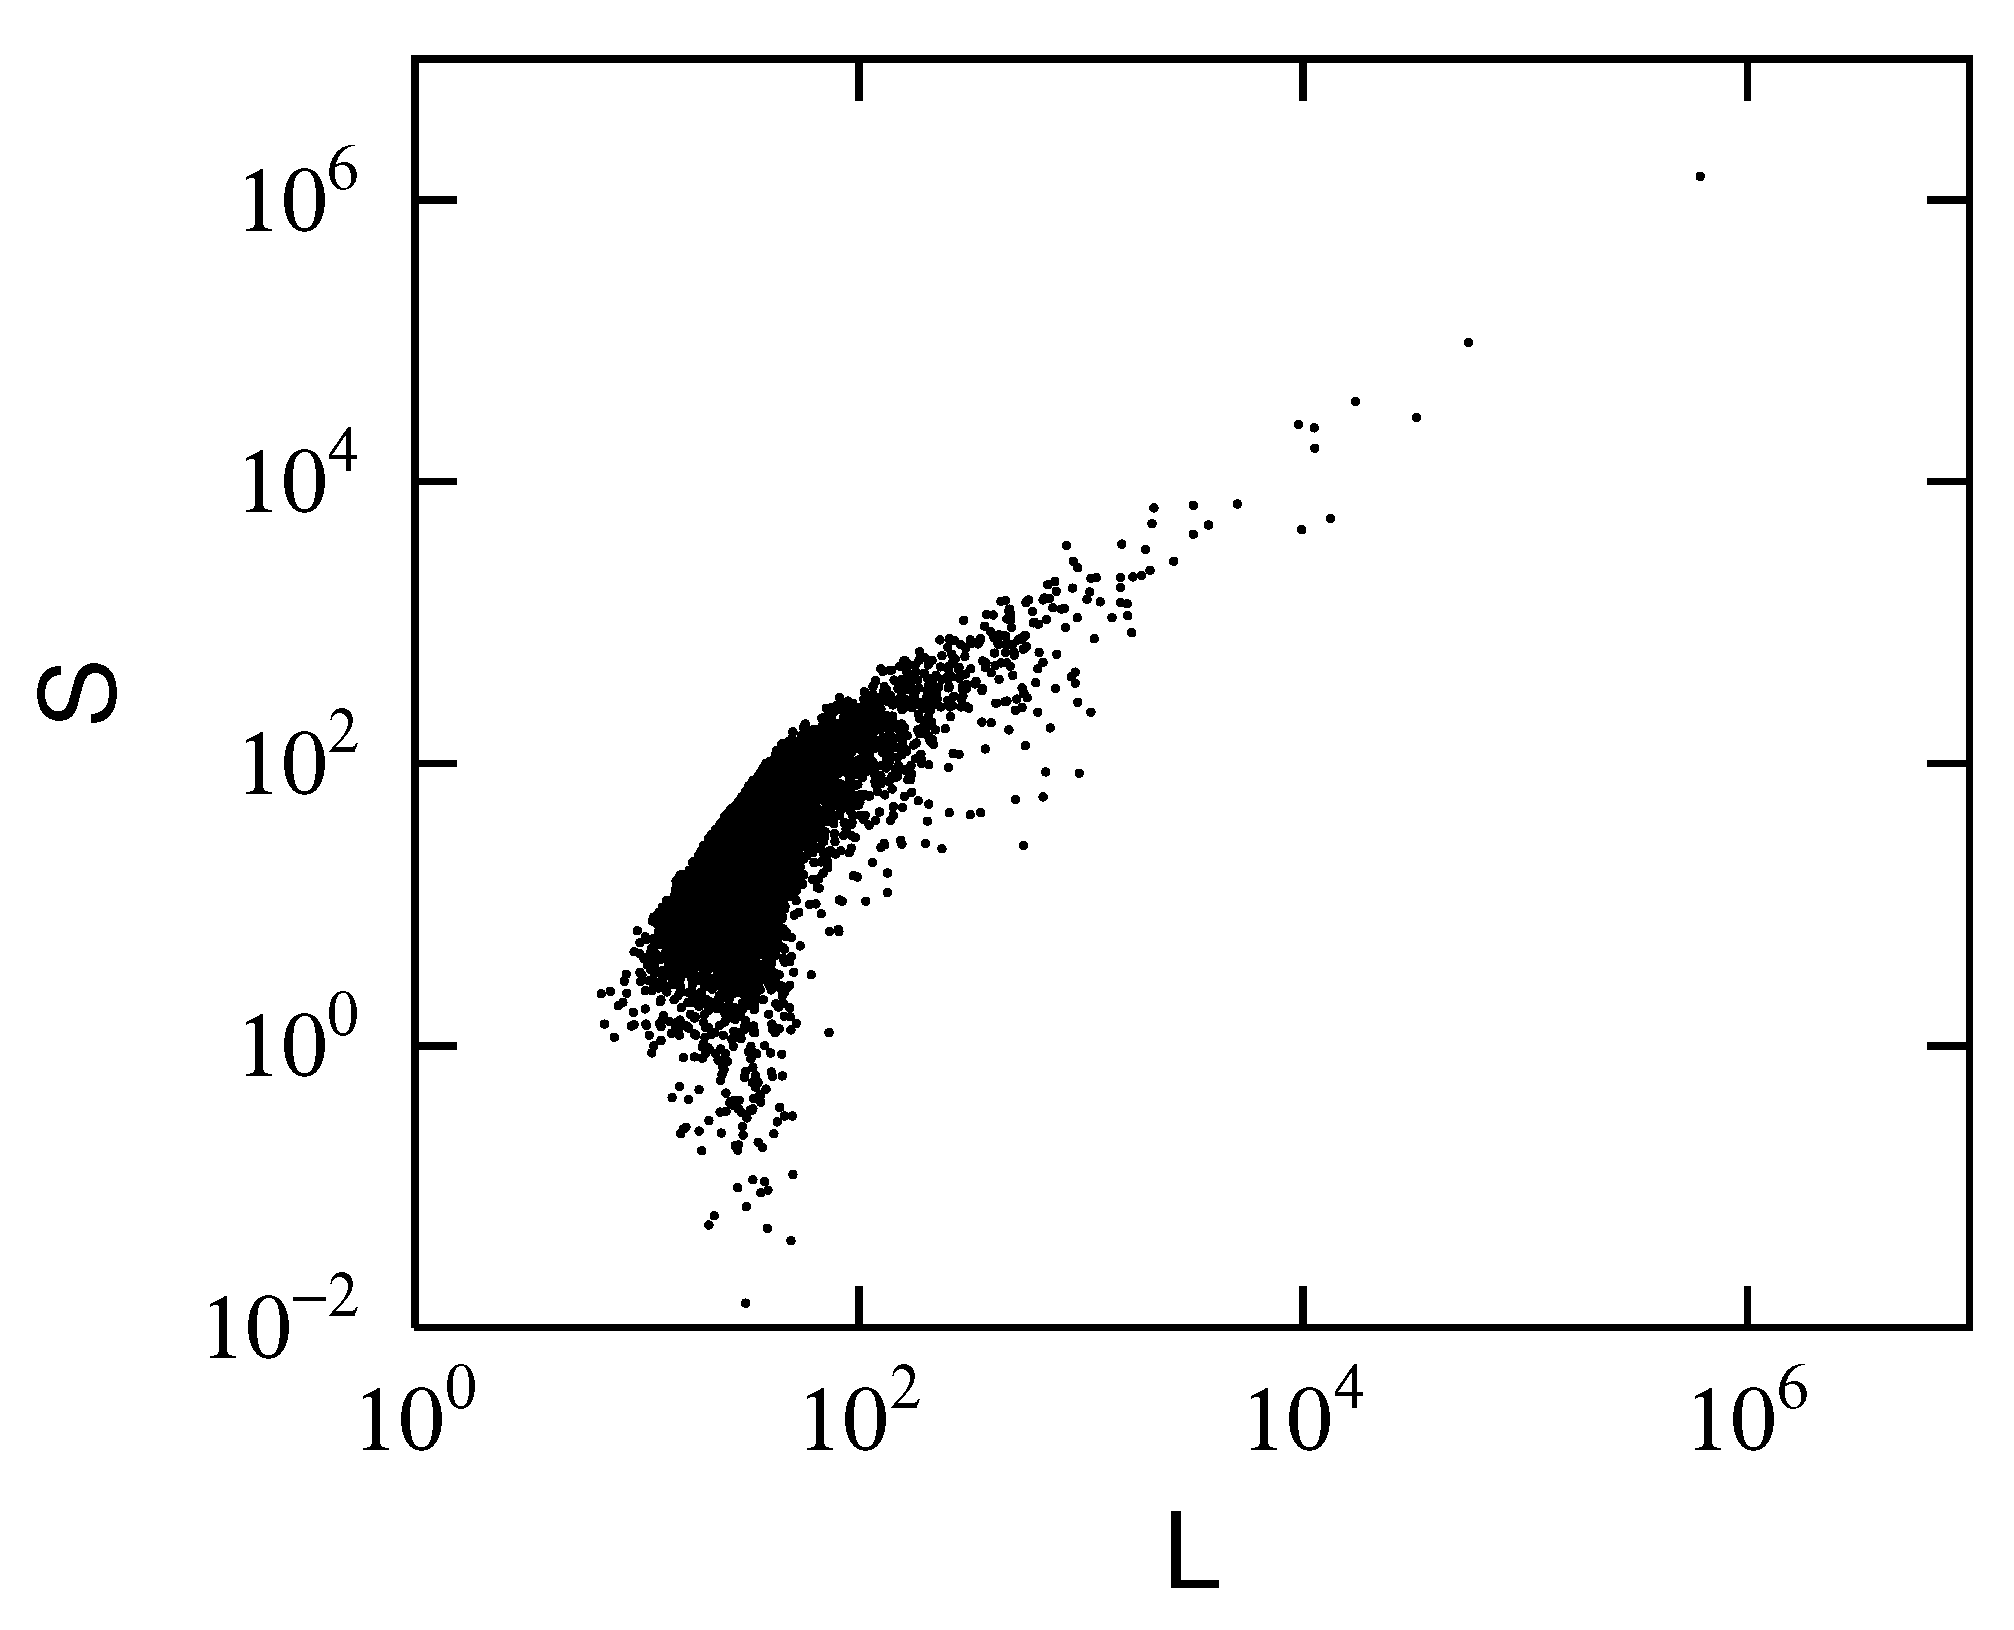
2. To see the structure in more detail, we plot
Figure 3 on both the logarithmic axes and denote it as
Figure 4. It shows a strong correlation between
and
, which can be expressed using parameter
:
Furthermore,
Figure 4 shows that parameter
in Eq. (
1) is different for large (long distance) and small (short distance) scales of
L. In this paper, we denote
km as a short distance and its parameter as
and 5 km
as a long distance and its parameter as
. The boundary between short and long distances, 5 km, was set as the distance an average adult might walk in approximately one hour.
Measuring those parameters by the least squares method for the data in
Figure 4 yields
and
. The fact that
is close to 2 indicates that when the distance of the outer perimeter is less than 5 km, many movement trajectories will be polygons with a large enclosed area (
Figure 2). On the other hand,
falls between 1 and 2, indicating that many movement trajectories are straight and partially polygonal when the outer perimeter’s distance exceeds 5 km (
Figure 1). We use the fact that when the movement trajectories are all straight lines, area
S of a rectangle with
L, which is sufficiently large compared to 1, can be approximated as
.
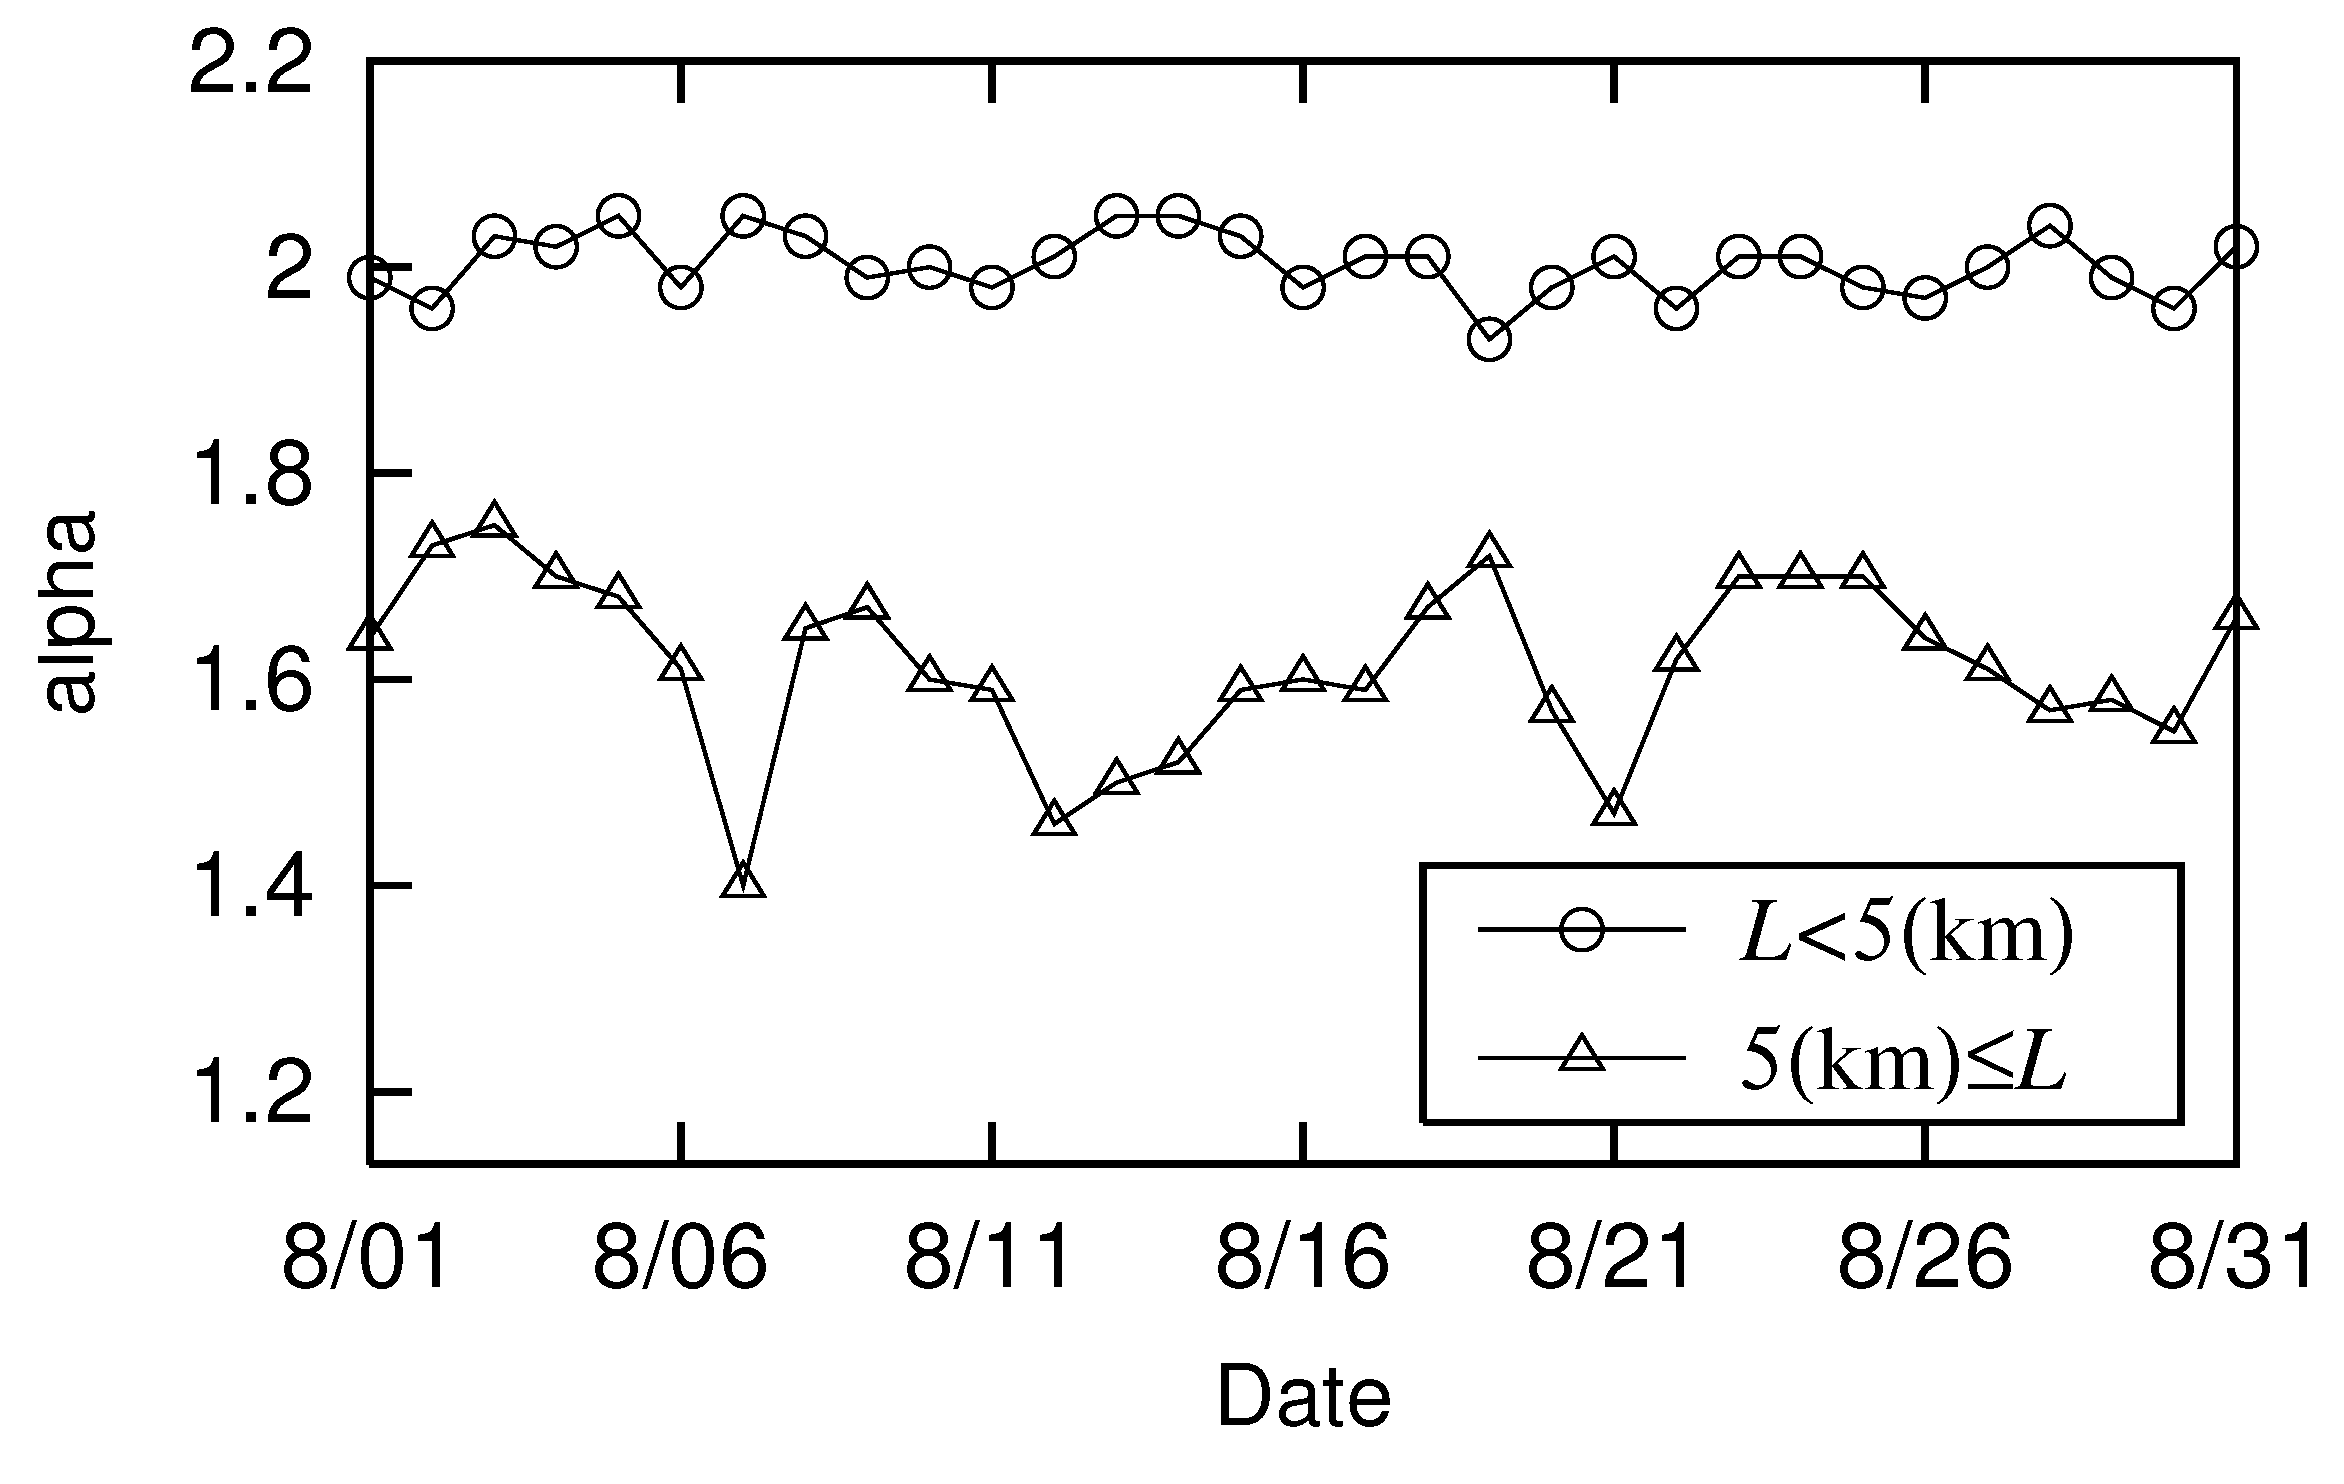
Next we measure parameters
and
for every person who passed through Urayasu City during the 31 days of August and represent these changes in
Figure 5. We removed the errors (to two decimal places) for clarity. There are four minima in
(△) shown in
Figure 5: August 7, 12, 21, and 30. August 7 and 21 are Sundays, the 12th is the second day of a period of summer holidays in Japan, and the 30th is just before the end of the children’s summer vacation. The above observation indicates that people’s long-distance movement trajectories are more linear on weekends and holidays.
3.2. Analysis Classified by Personal Attributes
We next observed the movement trajectories classified by personal attributes. First, we note whether any differences surface by gender in long-distance movement trajectory parameter
.
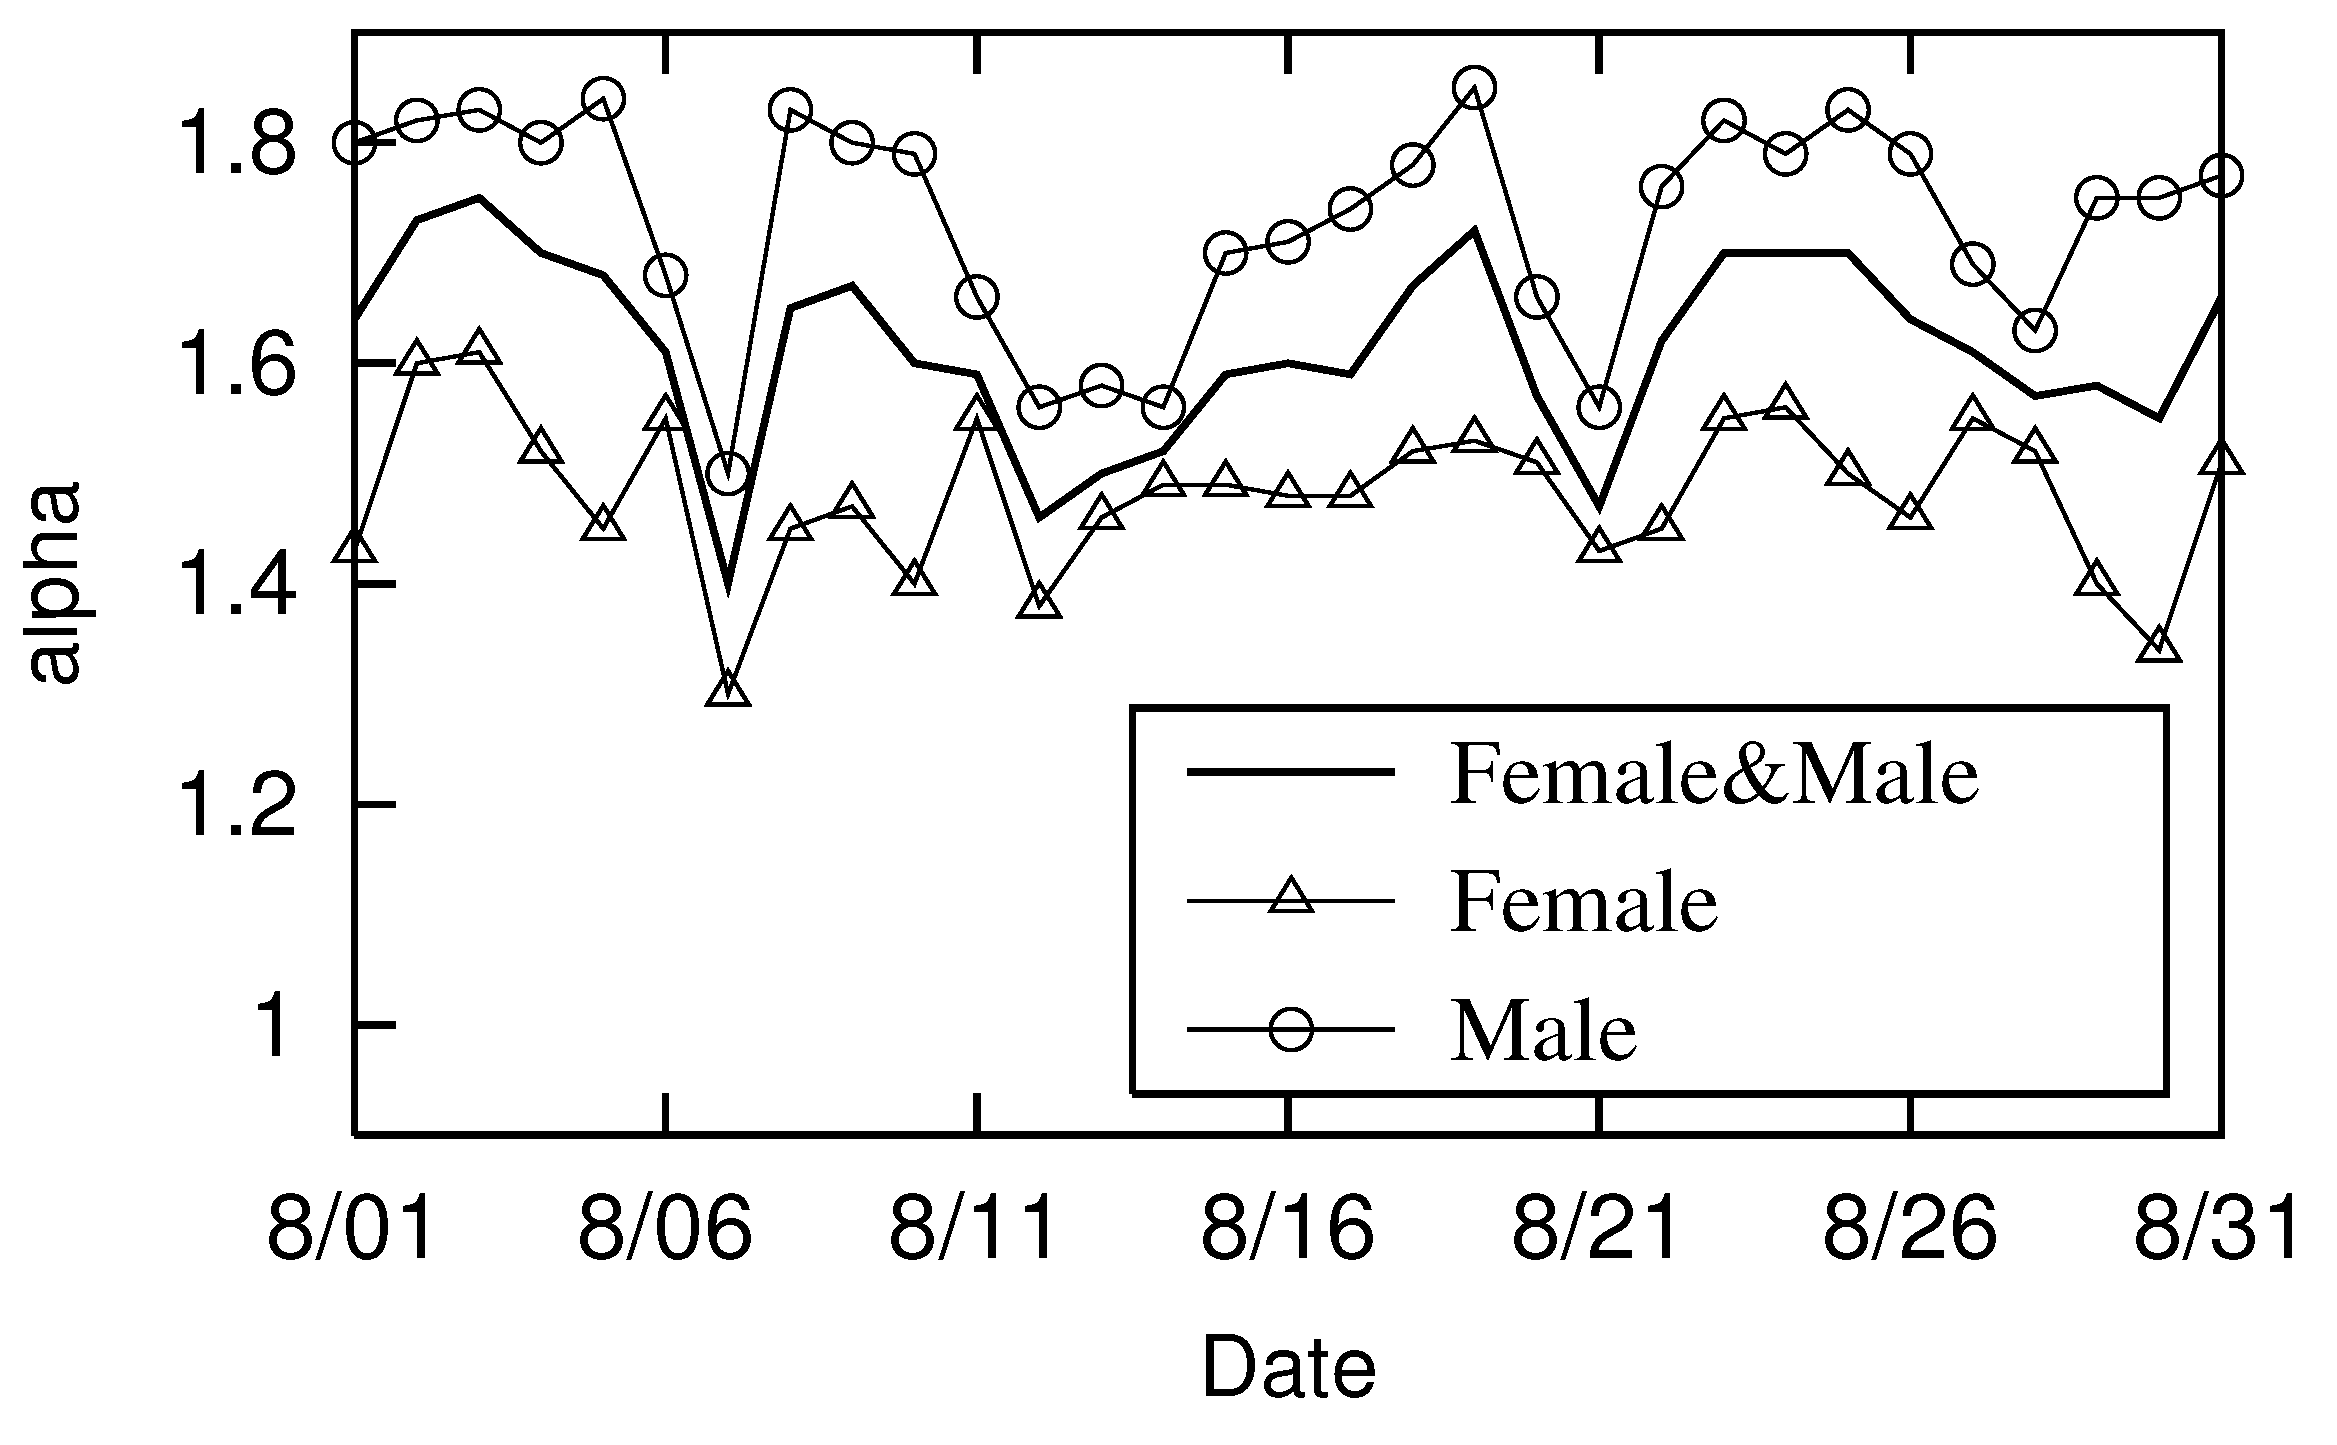
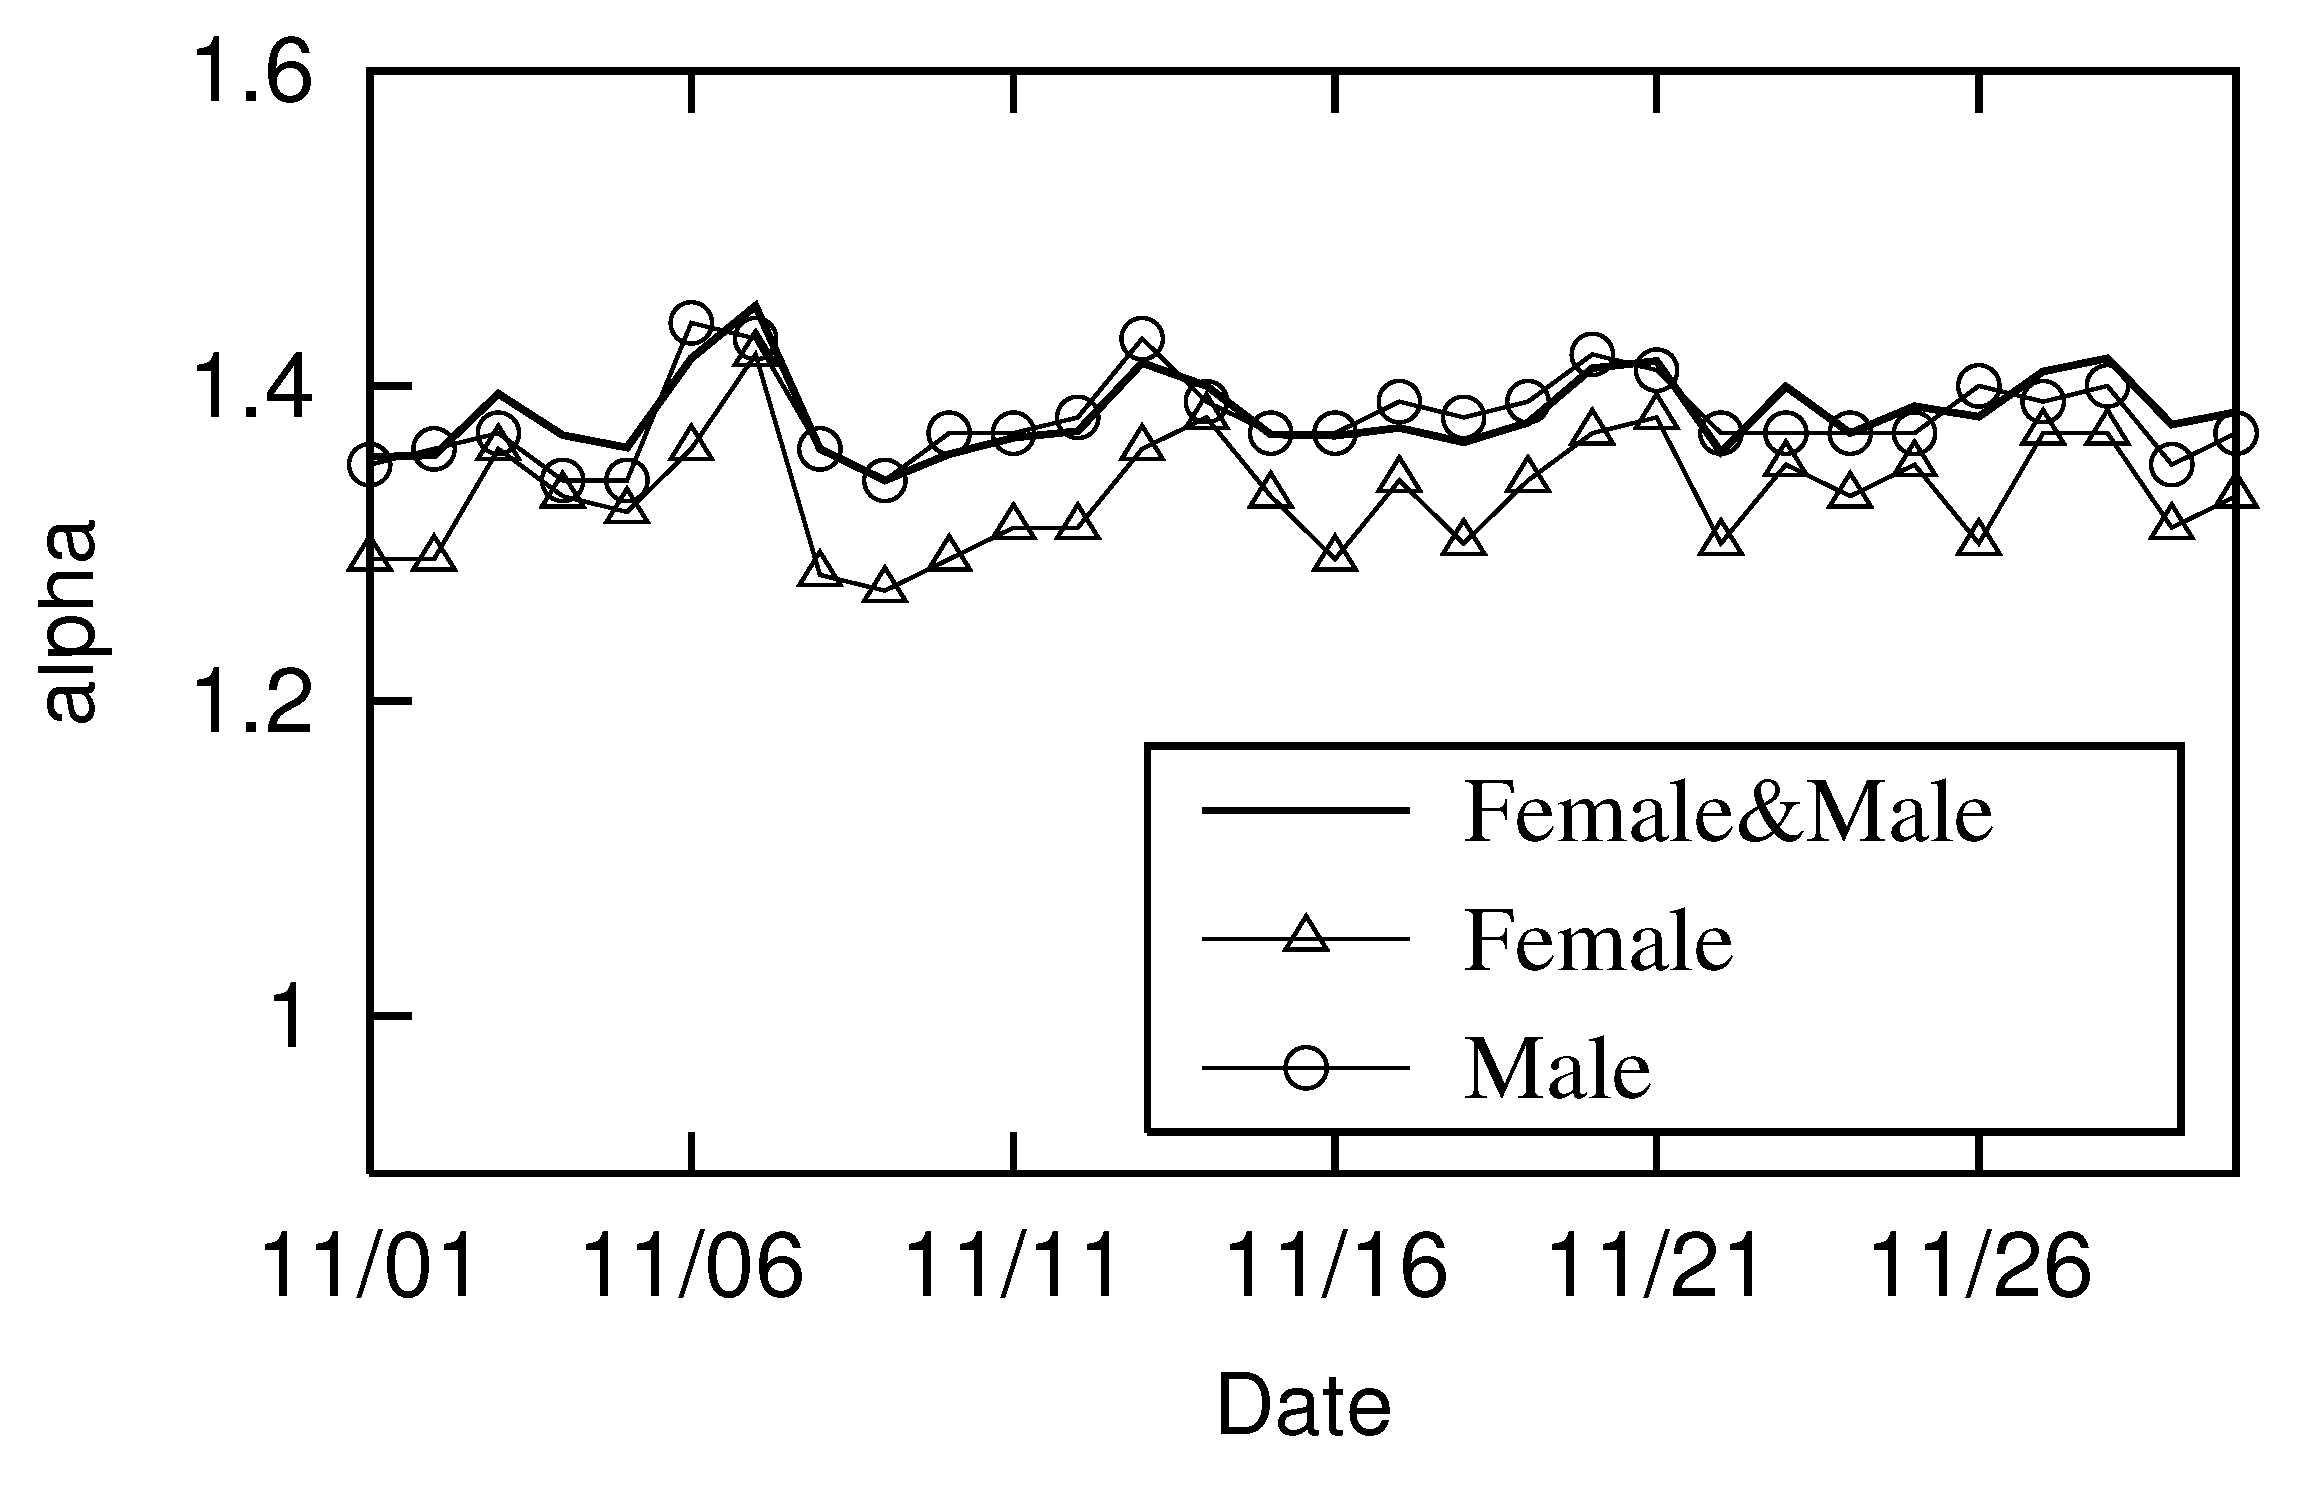
Figure 6 shows the
transition for women (△) and men (◯). At the same time, the transition for the case without a gender distinction is also denoted by a solid line (–), which is identical to the
(△) transition in
Figure 5.
Figure 6 shows that the
of women is always smaller than that of men, an observation that implies that long-distance movement trajectories are more linear for women than men.
We next categorized the ages into three groups: under 30, between 30 and 60, and over 60 (G1, G2, and G3). We examined whether long-distance migration parameter
differed across these three groups.
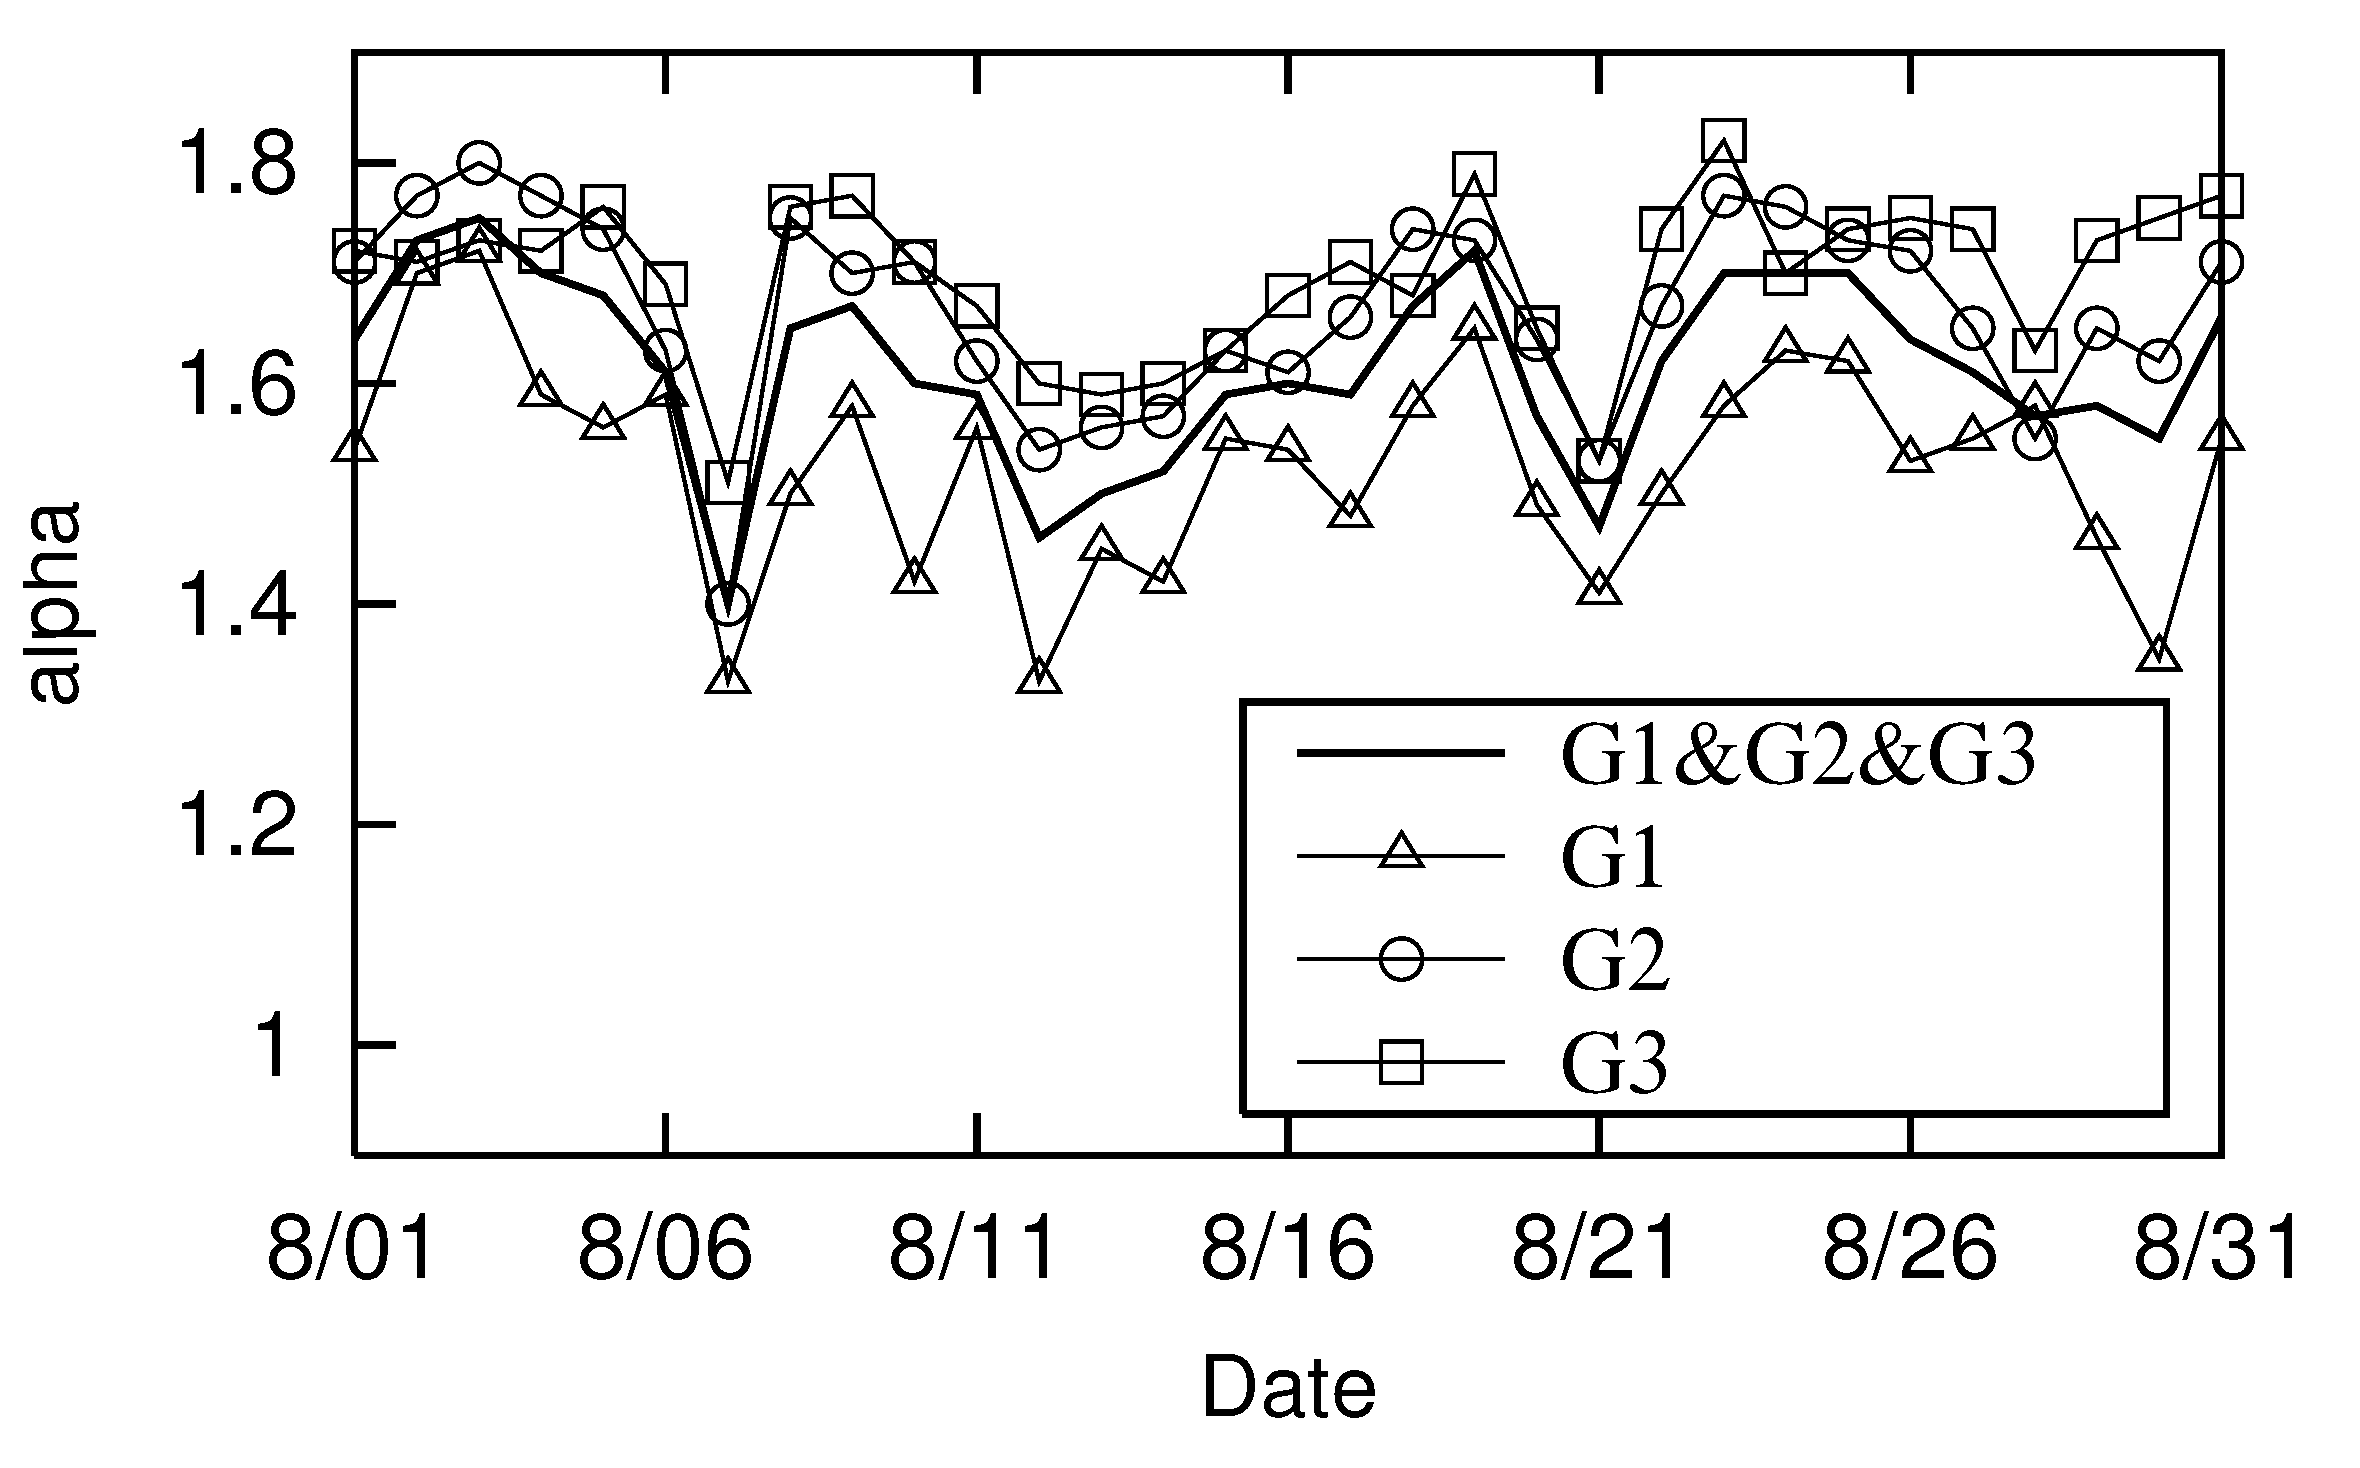
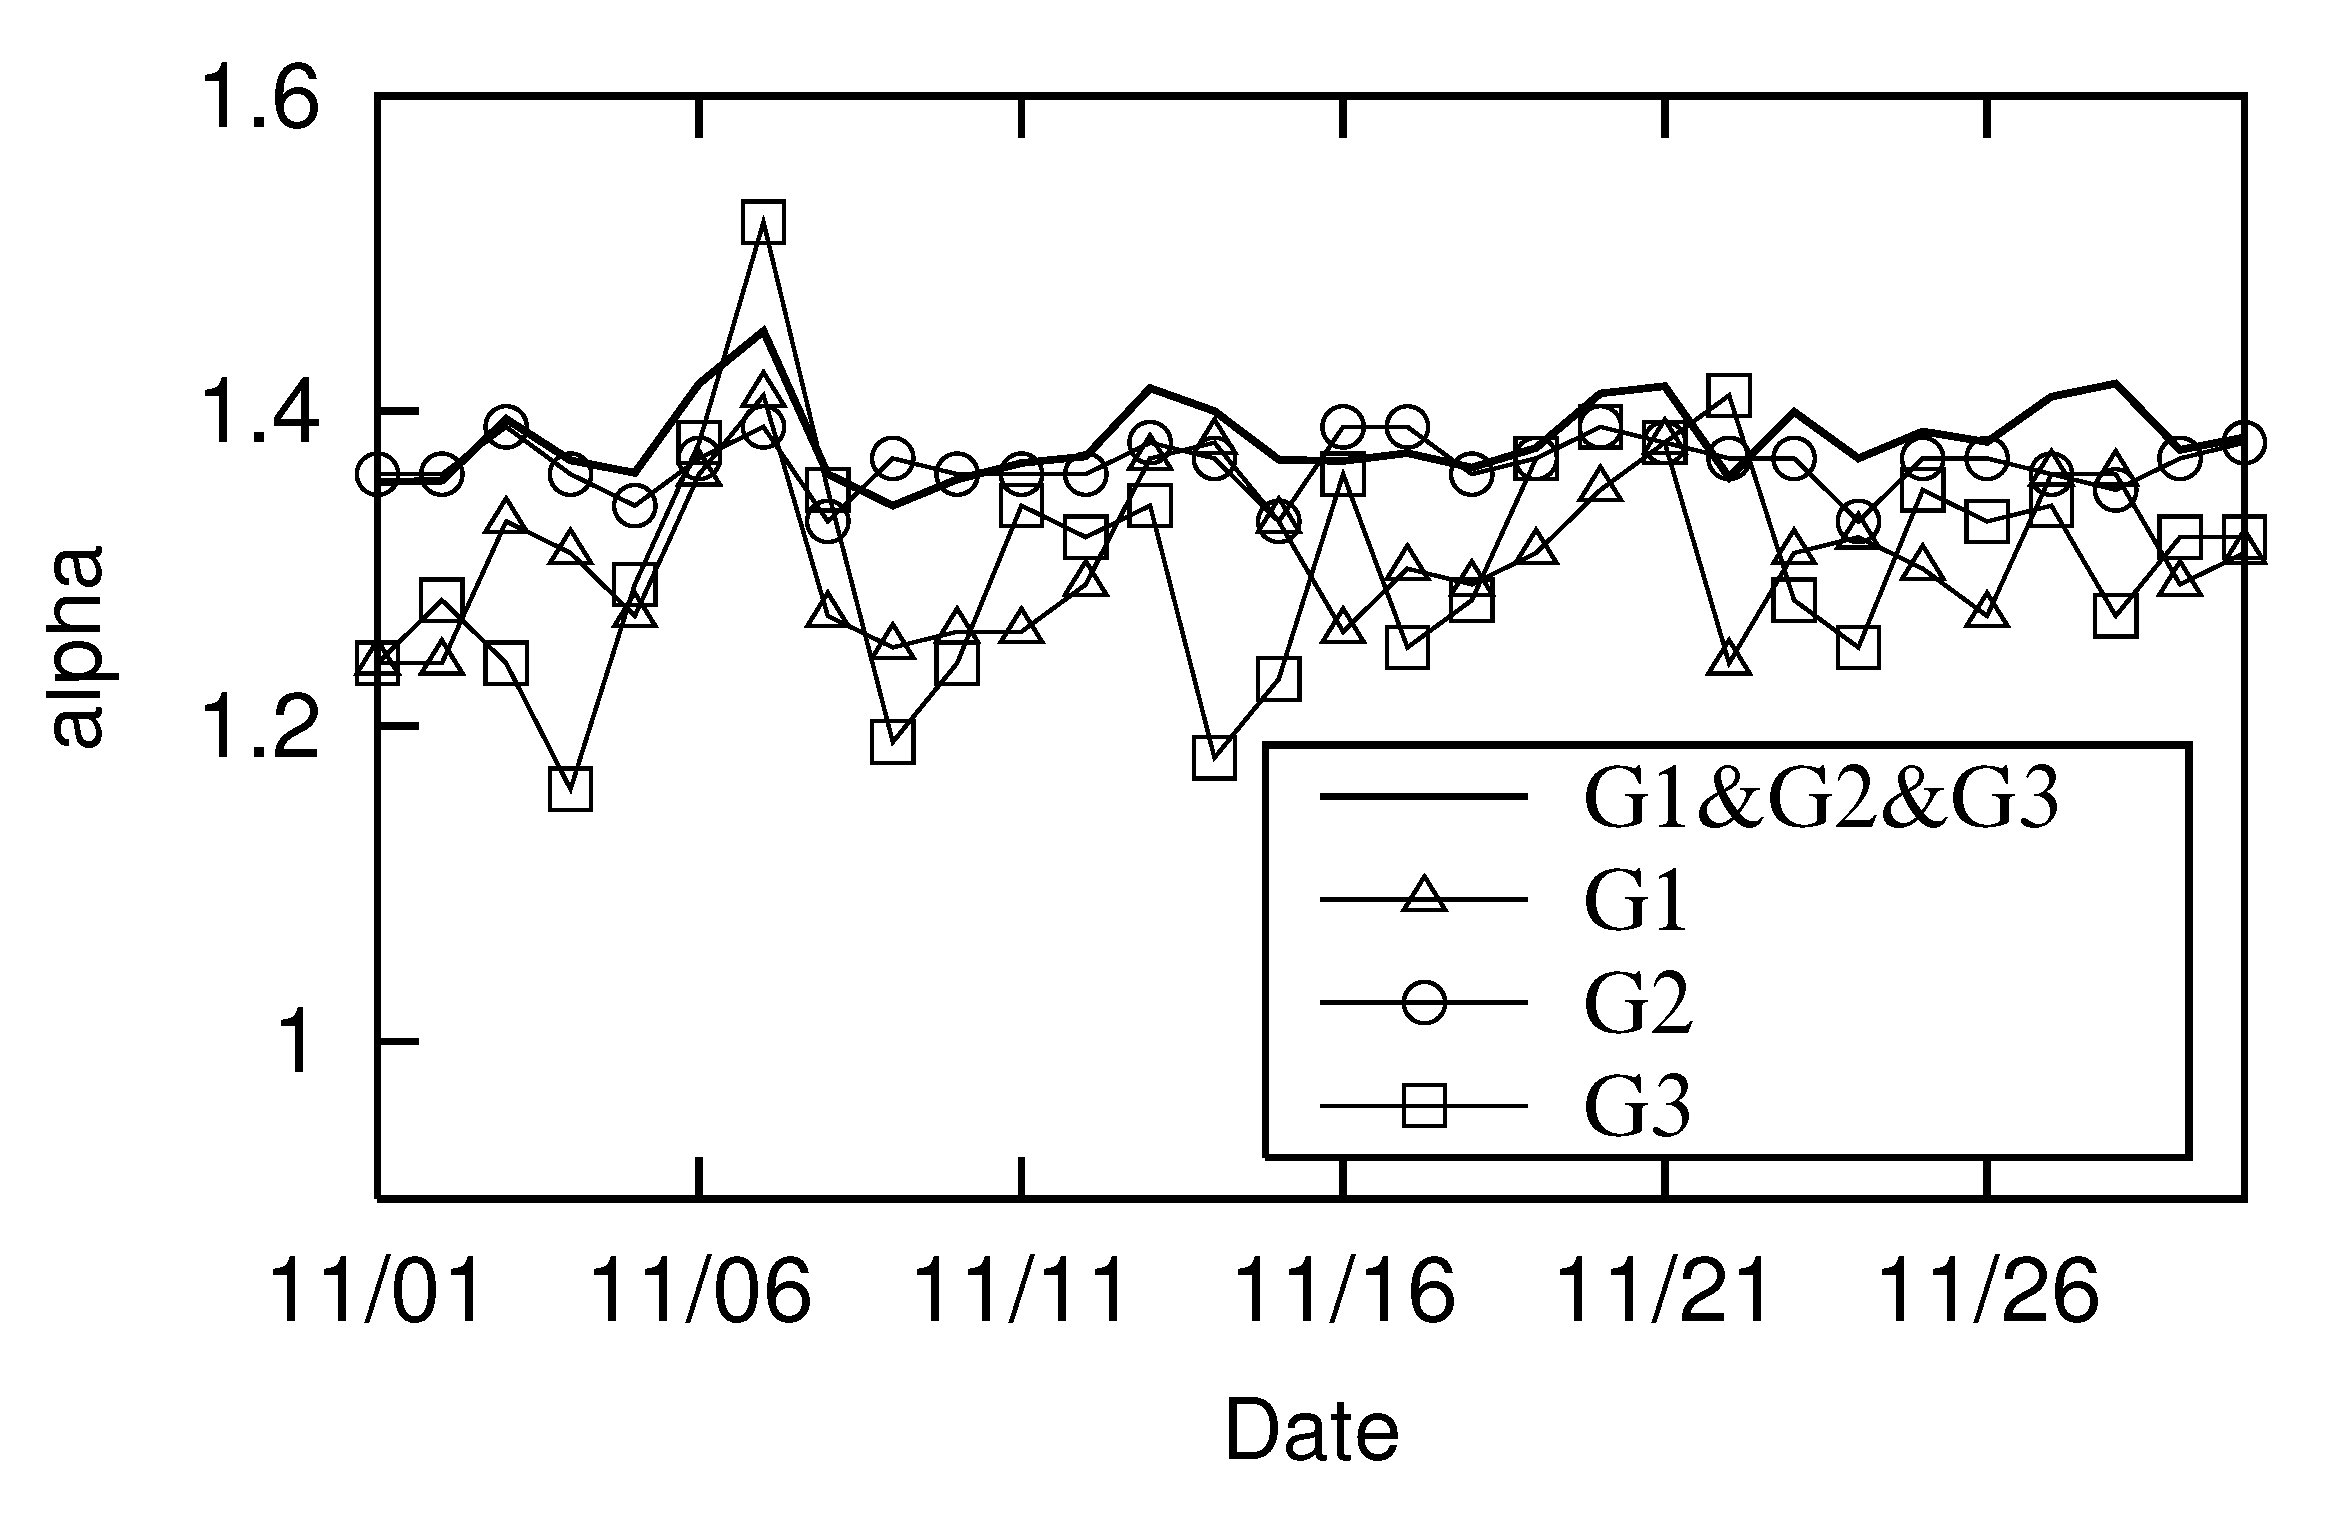
Figure 7 shows the
trends for each group. The transition without age distinction is also marked with a solid line (–),identical to the
(△) in
Figure 5 and the
transition (–) in
Figure 6.
Figure 7 shows that the long-distance movement trajectories for ages less than 30 (G1, △) are the most linear. It also shows no significant difference in the shape of long-distance movement trajectories for ages between 30 and 60 (G2, ◯) and 60 and older (G3, □).
4. Analysis of Kyoto City
4.1. Analysis without Consideration of Personal Attributes
In the previous section, we observed how the statistical relationship between the area and perimeter of polygons enclosed by human movement trajectories depends on the environment (weekdays or holidays) and such individual attributes as gender and age. In this section, we confirm whether the observation results from Urayasu City are similarly observed in other areas in Japan. This observation allows us to determine whether the observations in the previous section are altered by such external factors as region. Our analysis focuses on the movement trajectory of people through Shimogyo-ku, which is in the central area of Kyoto City where thousands of tourists visit many historical tourist attractions.
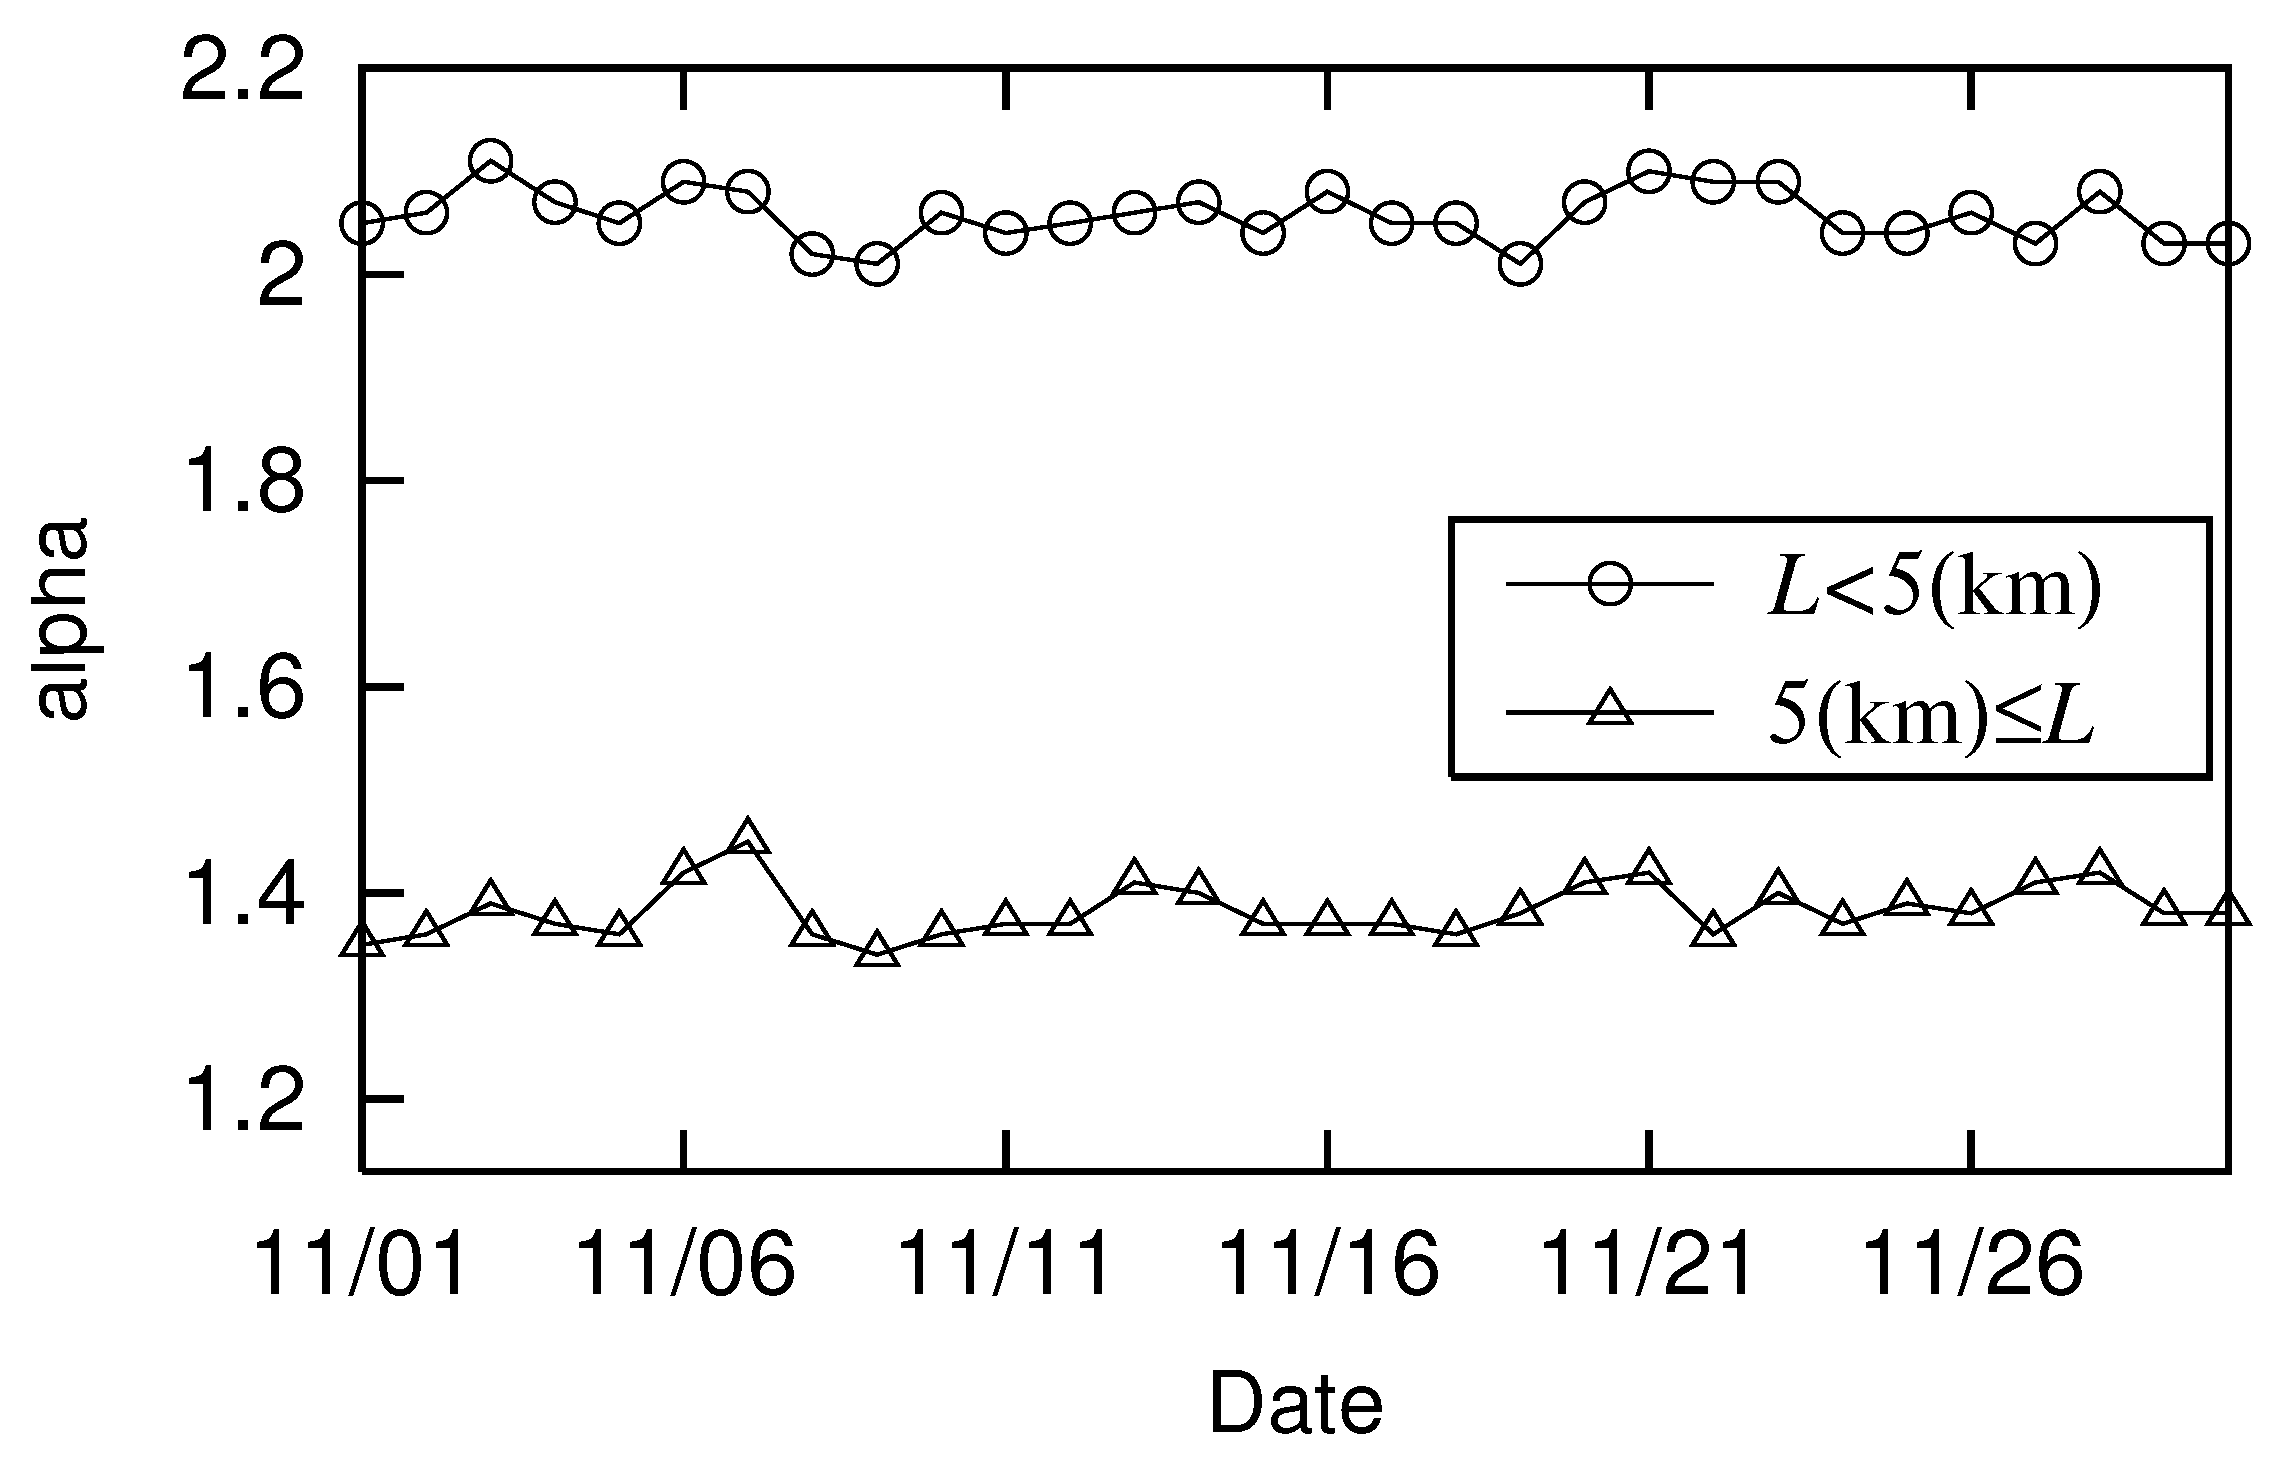
Figure 8 shows the
(◯) and
(△) of people passing through Shimogyo-ku, Kyoto during the 30 days of November 2021. In
Figure 8, as in
Figure 5, the second decimal place errors were omitted for clarity. In
Figure 8,
(◯) remains close to 2, as in
Figure 5, which shows the movement trajectory of Urayasu City. At the same time,
(△) falls between 1 and 2. However, the difference is that
fluctuated around
in the case of Urayasu City, whereas it fluctuated around
for Shimogyo-ku. The major difference is that the linearity of the long-distance movement trajectory in Urayasu City is strengthened on weekends and national holidays (
becomes smaller), and it weakens in Shimogyo-ku (
becomes larger). Specifically,
in
Figure 8 has six maxima: November 3, 7, 13, 21, 23, and 28. These are all weekends or holidays (November 7, 14, 21, and 28 are Sundays; November 3 and 23 are national holidays). Similar results to the above can be found in the movement trajectory of those passing through Shimogyo-ku in January 2022.
4.2. Analysis Classified by Personal Attributes
Figure 9 shows the
transition for each woman (△) and man (◯) who passed through Shimogyo-ku, Kyoto in November 2021. Transitions when gender is not distinguished are also marked with a solid line (–),identical to the
(△) transition in
Figure 8.
Figure 9 shows that the long-distance movement trajectory is more linear for women (△) than for men (◯), as in Urayasu City.
Next we examined whether long-distance movement parameter
differed by age group (as in Urayasu City) by again classifying the people into the same three age groups: under 30, between 30 and 60, and over 60 (denoted as G1, G2, and G3, respectively).
Figure 10 shows the
trends by the three age groups. The transition when age is not distinguished is also marked with a solid line (–),identical to the
(△) in
Figure 8 and the
(–) transition in
Figure 9.
Figure 10 shows that in the case of Kyoto City, unlike Urayasu City, no significant differences are found in the shape of the long-distance movement trajectories by age group. Similar results to the above are observed in the movement trajectory of those who passed through Shimogyo-ku, Kyoto in January 2022.
5. Factors Contributing to Long-Distance Variations
In the previous section, we compared the movement trajectory parameters ( and ) for two areas: Urayasu City, Chiba Prefecture and Shimogyo-ku, Kyoto City. The common property shared by both is that parameter of the short movement trajectory is around 2 in both cases, while long-distance movement trajectory parameter is between 1 and 2. In other words, short-distance movement trajectories tend to enclose a larger area, and long-distance movement trajectories tend to be more linear, as observed in the two regions. However, was around in Urayasu City and around in Kyoto City. This means that the movement trajectory of a person passing through Shimogyo-ku, Kyoto is more linear with respect to the movement trajectory of a person passing through Urayasu City. The property, which differed significantly between the two, was that became smaller on weekends and holidays in Urayasu City, and it increased in Kyoto City. In other words, on weekends and holidays, long-distance movement trajectories are more linear in Urayasu City and less linear in Kyoto City.
In this section, we discuss what personal attributes create this variation in long-distance movement trajectories on weekends and holidays. We focus on places of residence and denote these data as a personal attribute, just like for the gender and age groups.
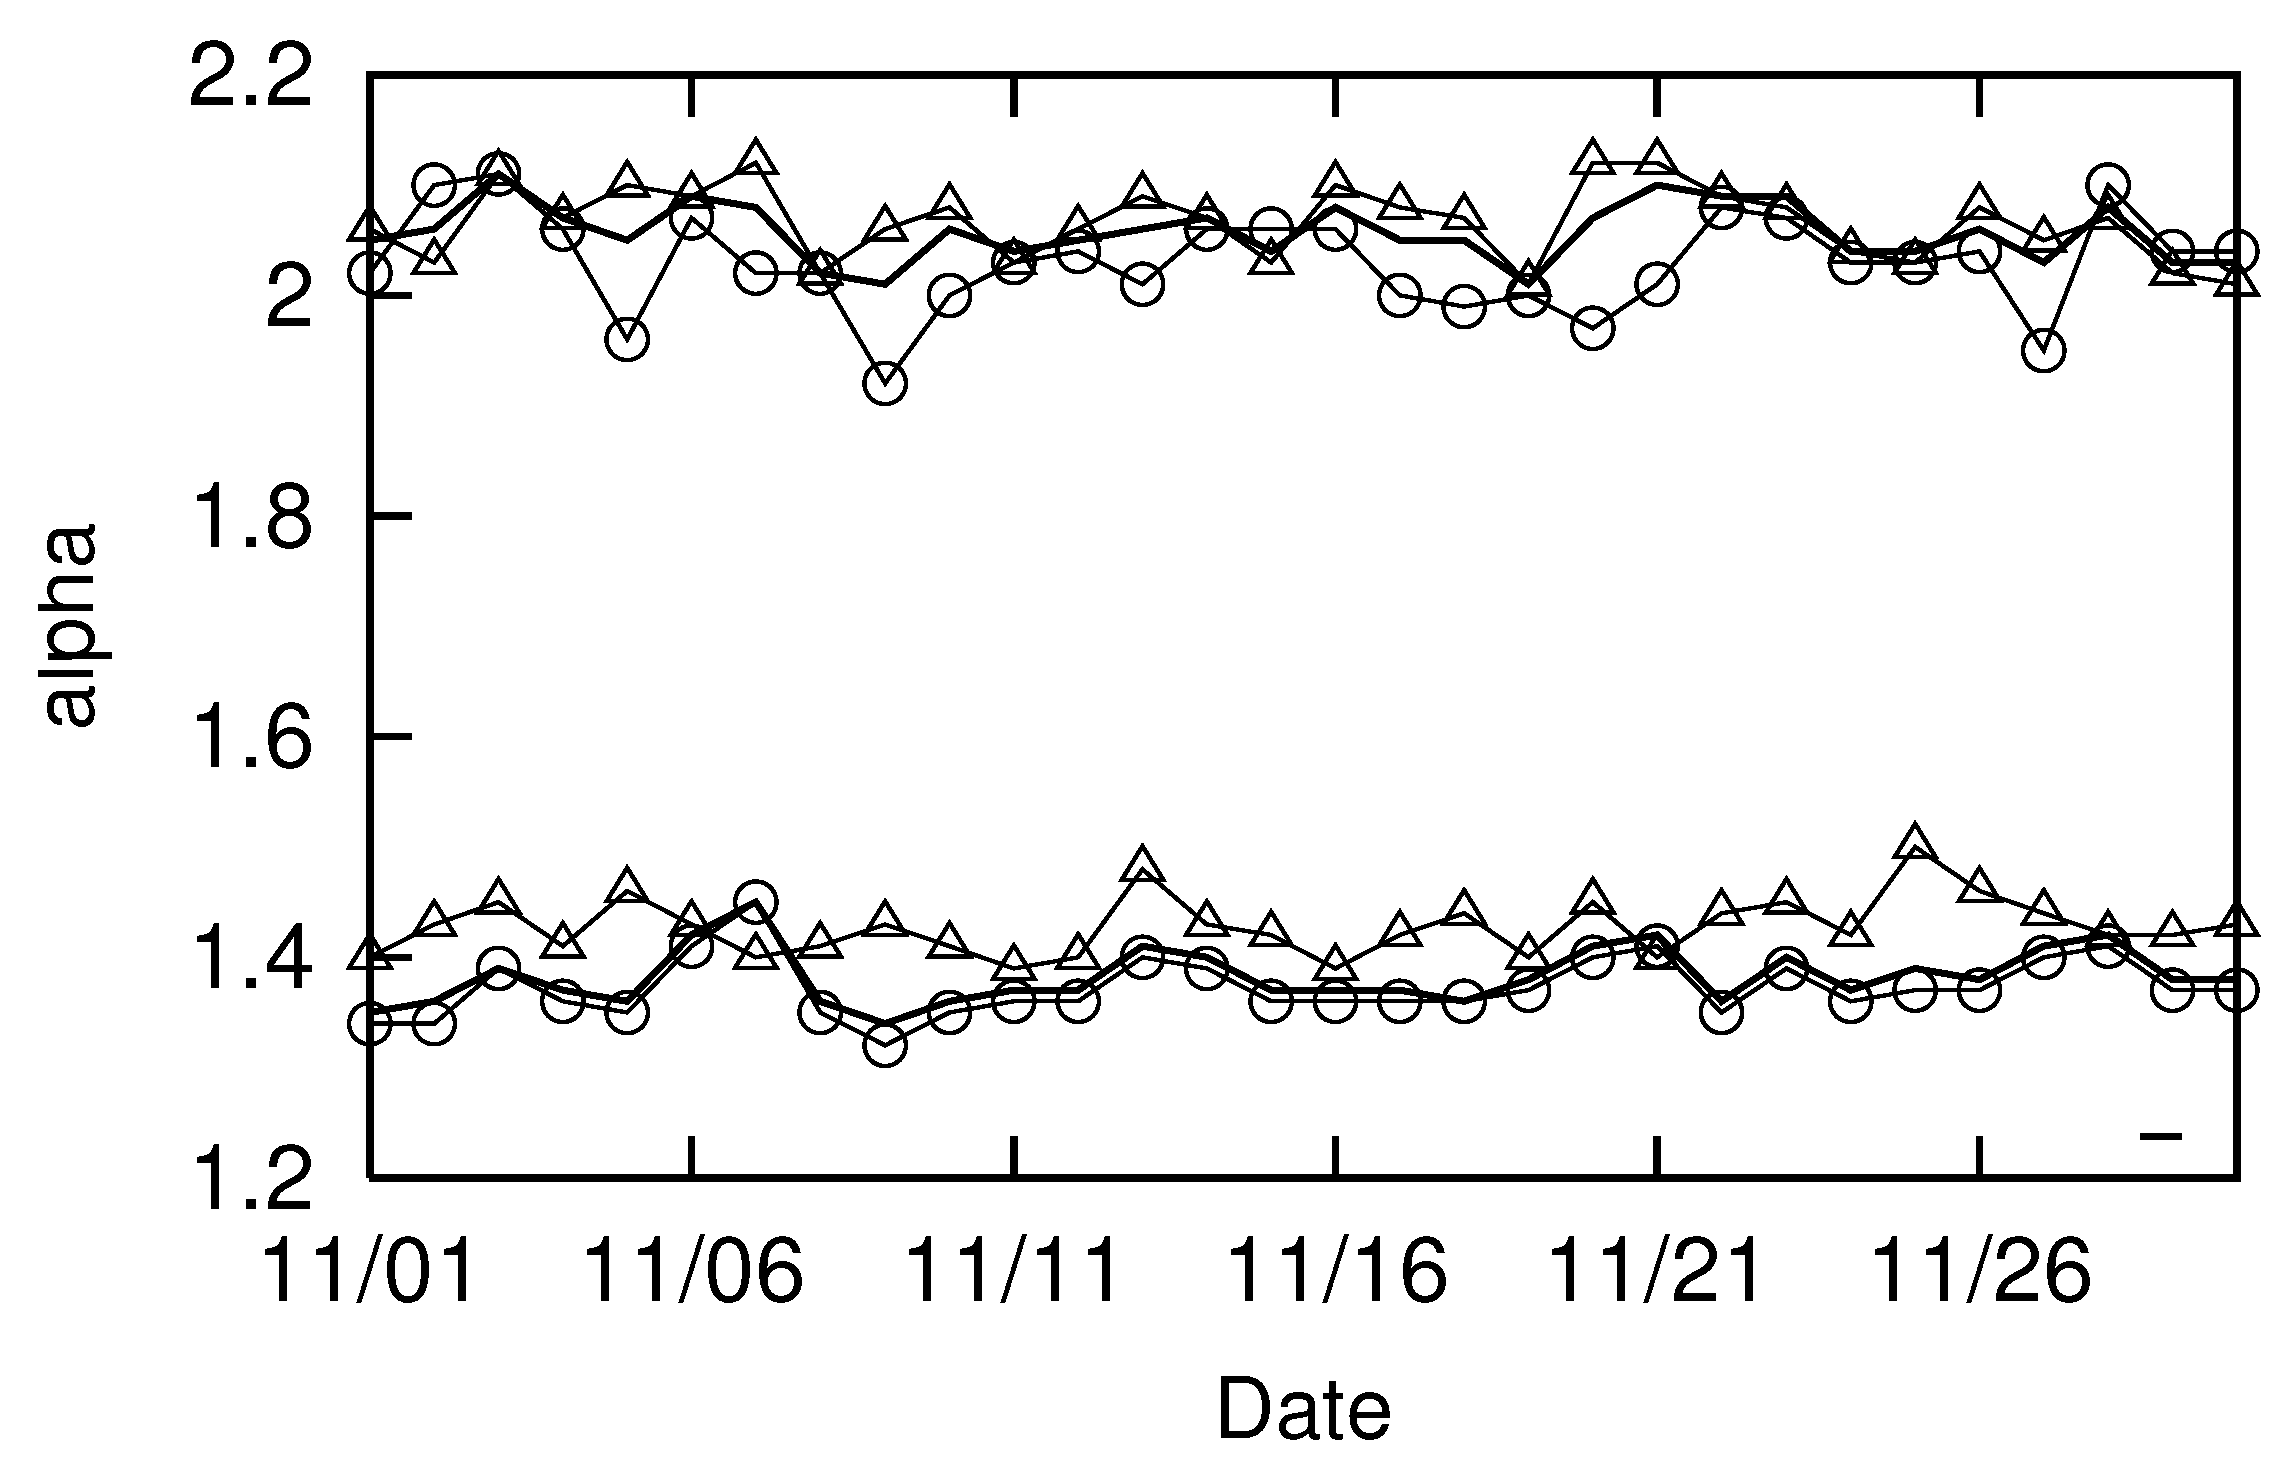
Figure 11 shows three transitions: 1)
and
for those who passed through Shimogyo-ku, Kyoto in November 2021 (
Figure 8, solid lines around 2 and
); 2)
and
for those whose homes (residences) are estimated to be in Shimogyo-ku, Kyoto (△); 3)
and
for those whose homes are estimated to be outside of Shimogyo-ku, Kyoto (◯).
Figure 11 shows that the variation in long-distance movement trajectories (–) is made by those whose homes are estimated to be located outside of Shimogyo-ku, Kyoto (◯). This strong correlation has a correlation coefficient of
. Conversely, the correlations with the movement trajectories (△) of those whose homes are estimated to be in Shimogyo-ku, Kyoto is very weak: a correlation coefficient of
. The long-distance movement trajectories in Shimogyo-ku are comprised of an average of
persons per day. Among them, those whose homes are estimated to be in Shimogyo-ku (△) average
per day. On the other hand, those whose homes are estimated to be outside of Shimogyo-ku (◯) are
on average per day. Therefore, it is reasonable to assume from these numbers that the overall long-distance movement parameter
is heavily influenced by those whose homes are estimated to be outside of Shimogyo-ku (◯).
Next, we consider the same aspect for Urayasu City, as discussed in
Section 3.
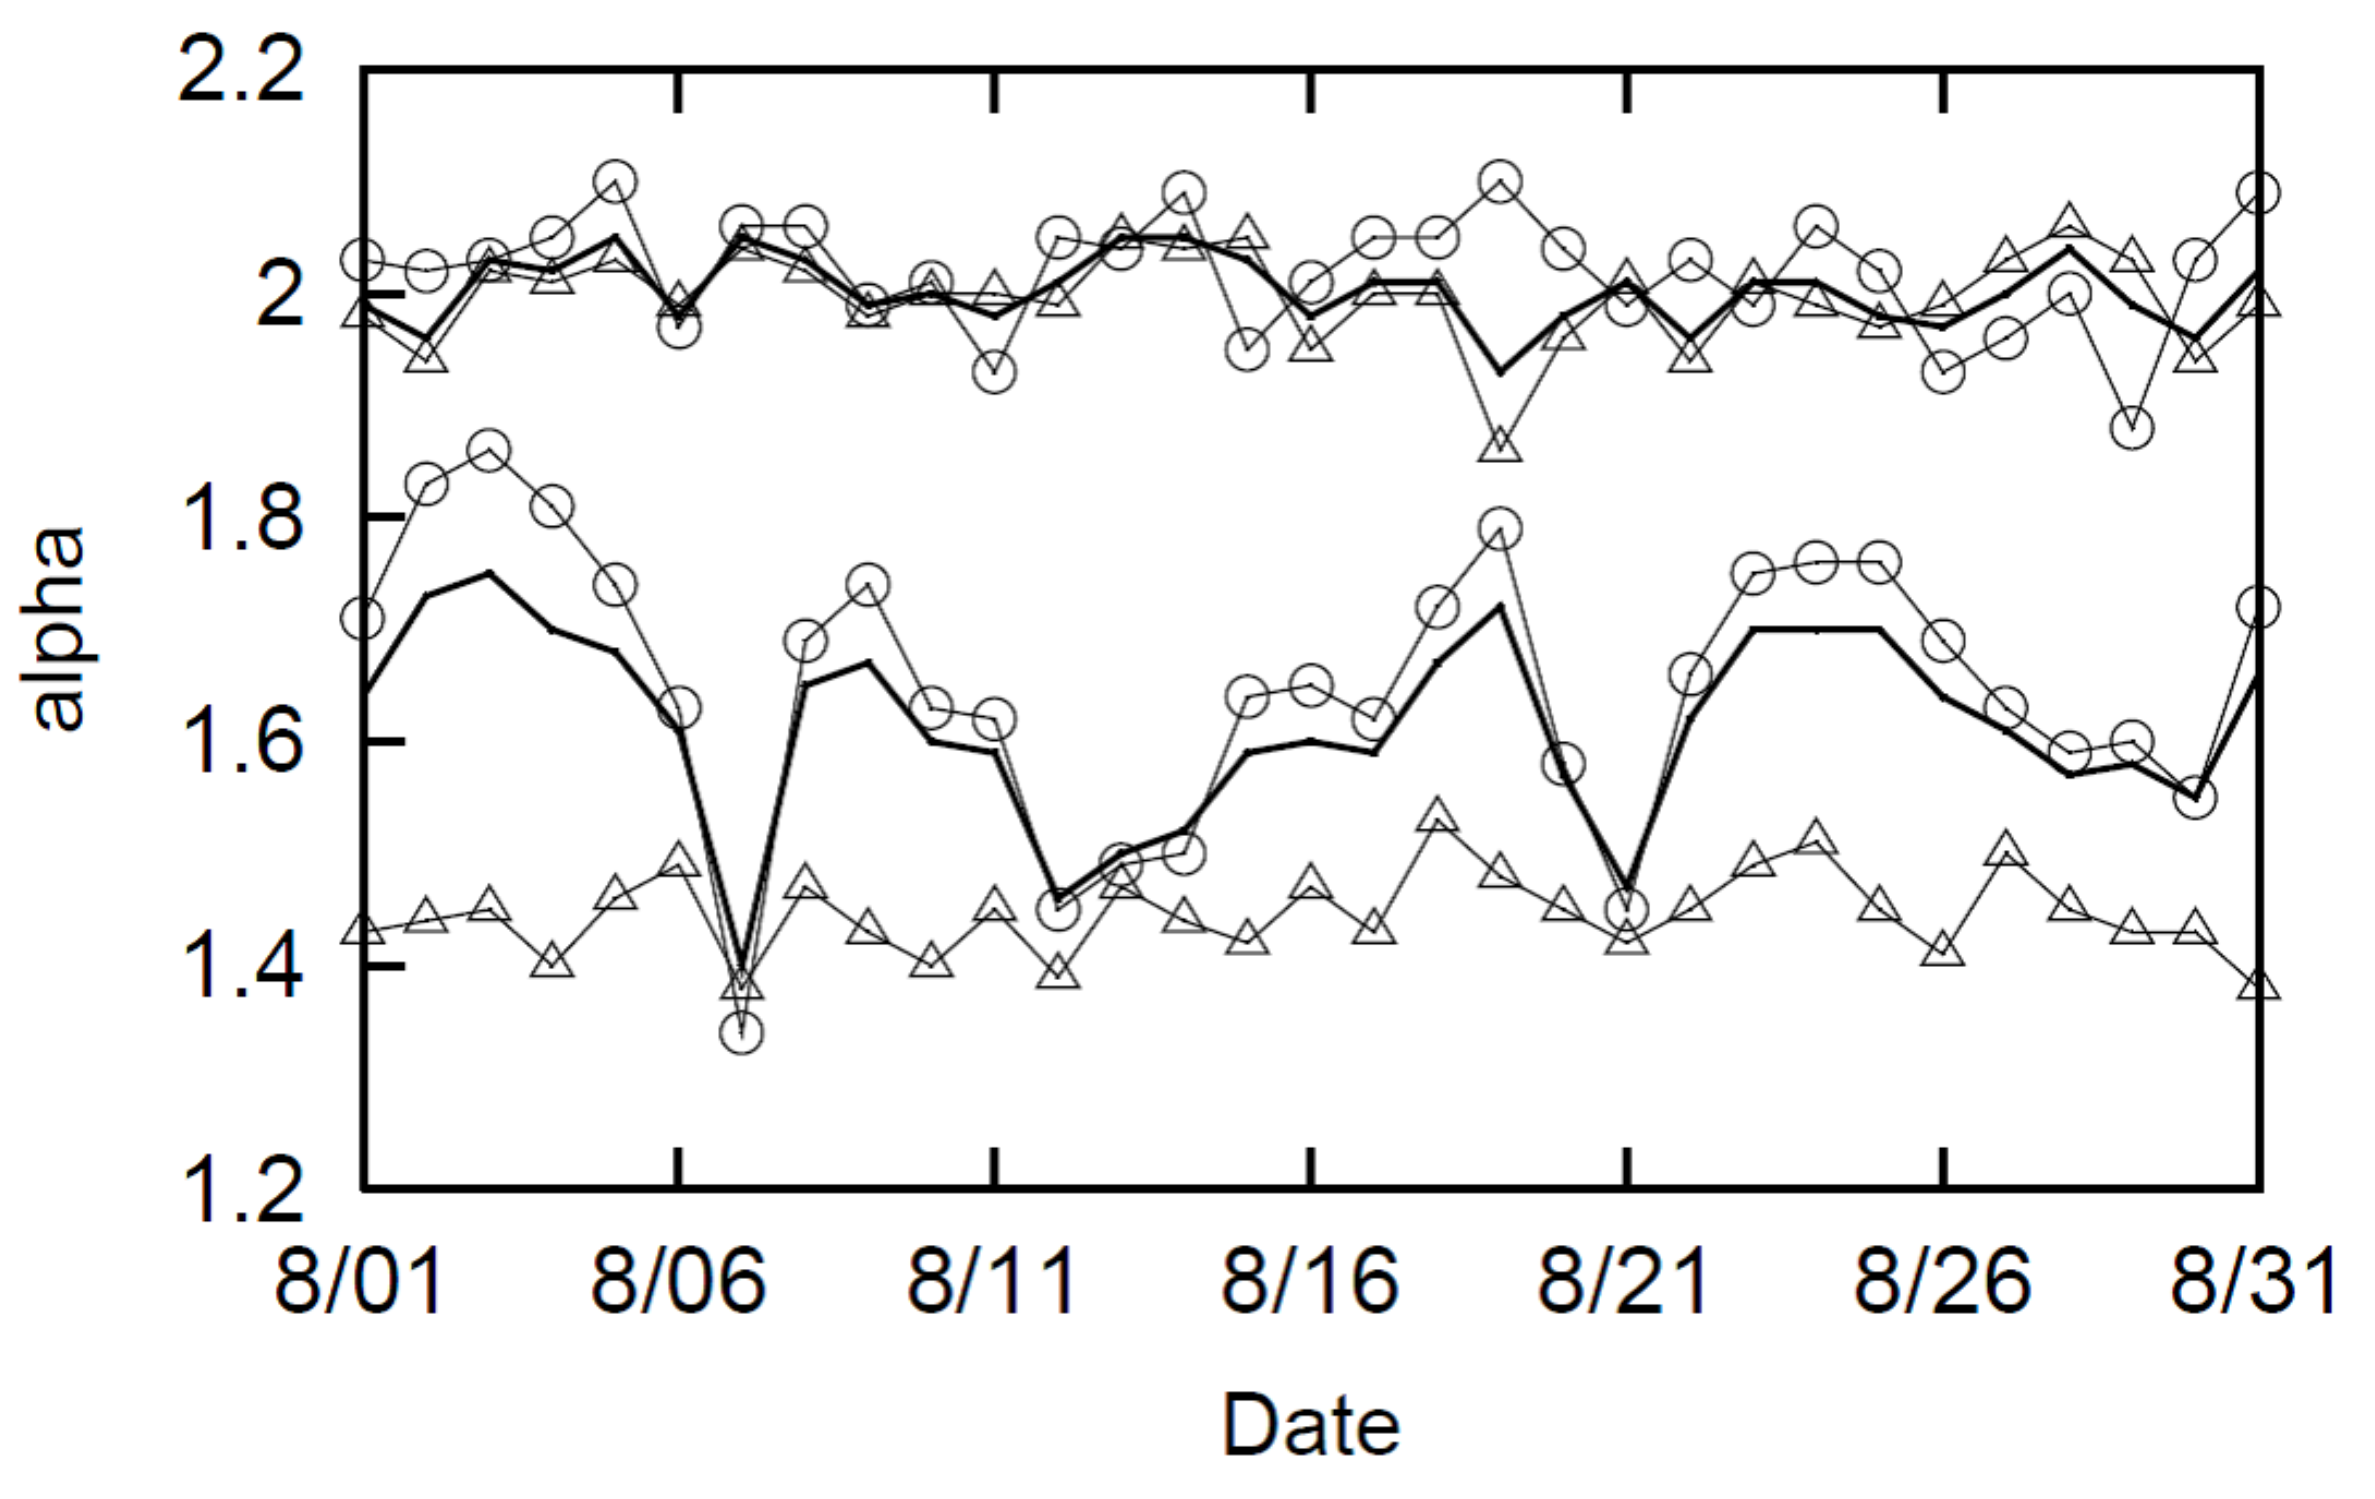
Figure 12 shows the following three changes: 1)
and
of people who passed through Urayasu City in August 2022 (shown in
Figure 5, solid lines around 2 and
); 2)
and
of people whose homes are estimated to be in Urayasu City (△); 3)
and
for those whose homes are estimated to be outside of Urayasu City (◯).
Figure 12 shows that, as in the case of Kyoto, those whose homes are estimated to be located outside of Urayasu City (◯) are making the variation in the long-distance movement trajectories of those who went through Urayasu City. As in the case of Kyoto, the correlation is very strong:
. Conversely, the correlation with the movement trajectory (△) of those whose homes are estimated to be in Urayasu City is weak:
. The long-distance movement trajectory in Urayasu City is comprised of an average of
persons per day. Among them, those whose homes are estimated to be in Urayasu City (△) averages
per day. On the other hand, those whose homes are estimated to be outside of Urayasu City (◯) average
per day. Therefore, it remains reasonable to assume from the numbers that overall, long-distance movement parameter
is greatly affected by those whose homes are estimated to be outside of Urayasu City (◯).
Furthermore, consider the same aspect about Kanazawa City, Ishikawa Prefecture.
Figure 13 shows the following three changes: 1)
and
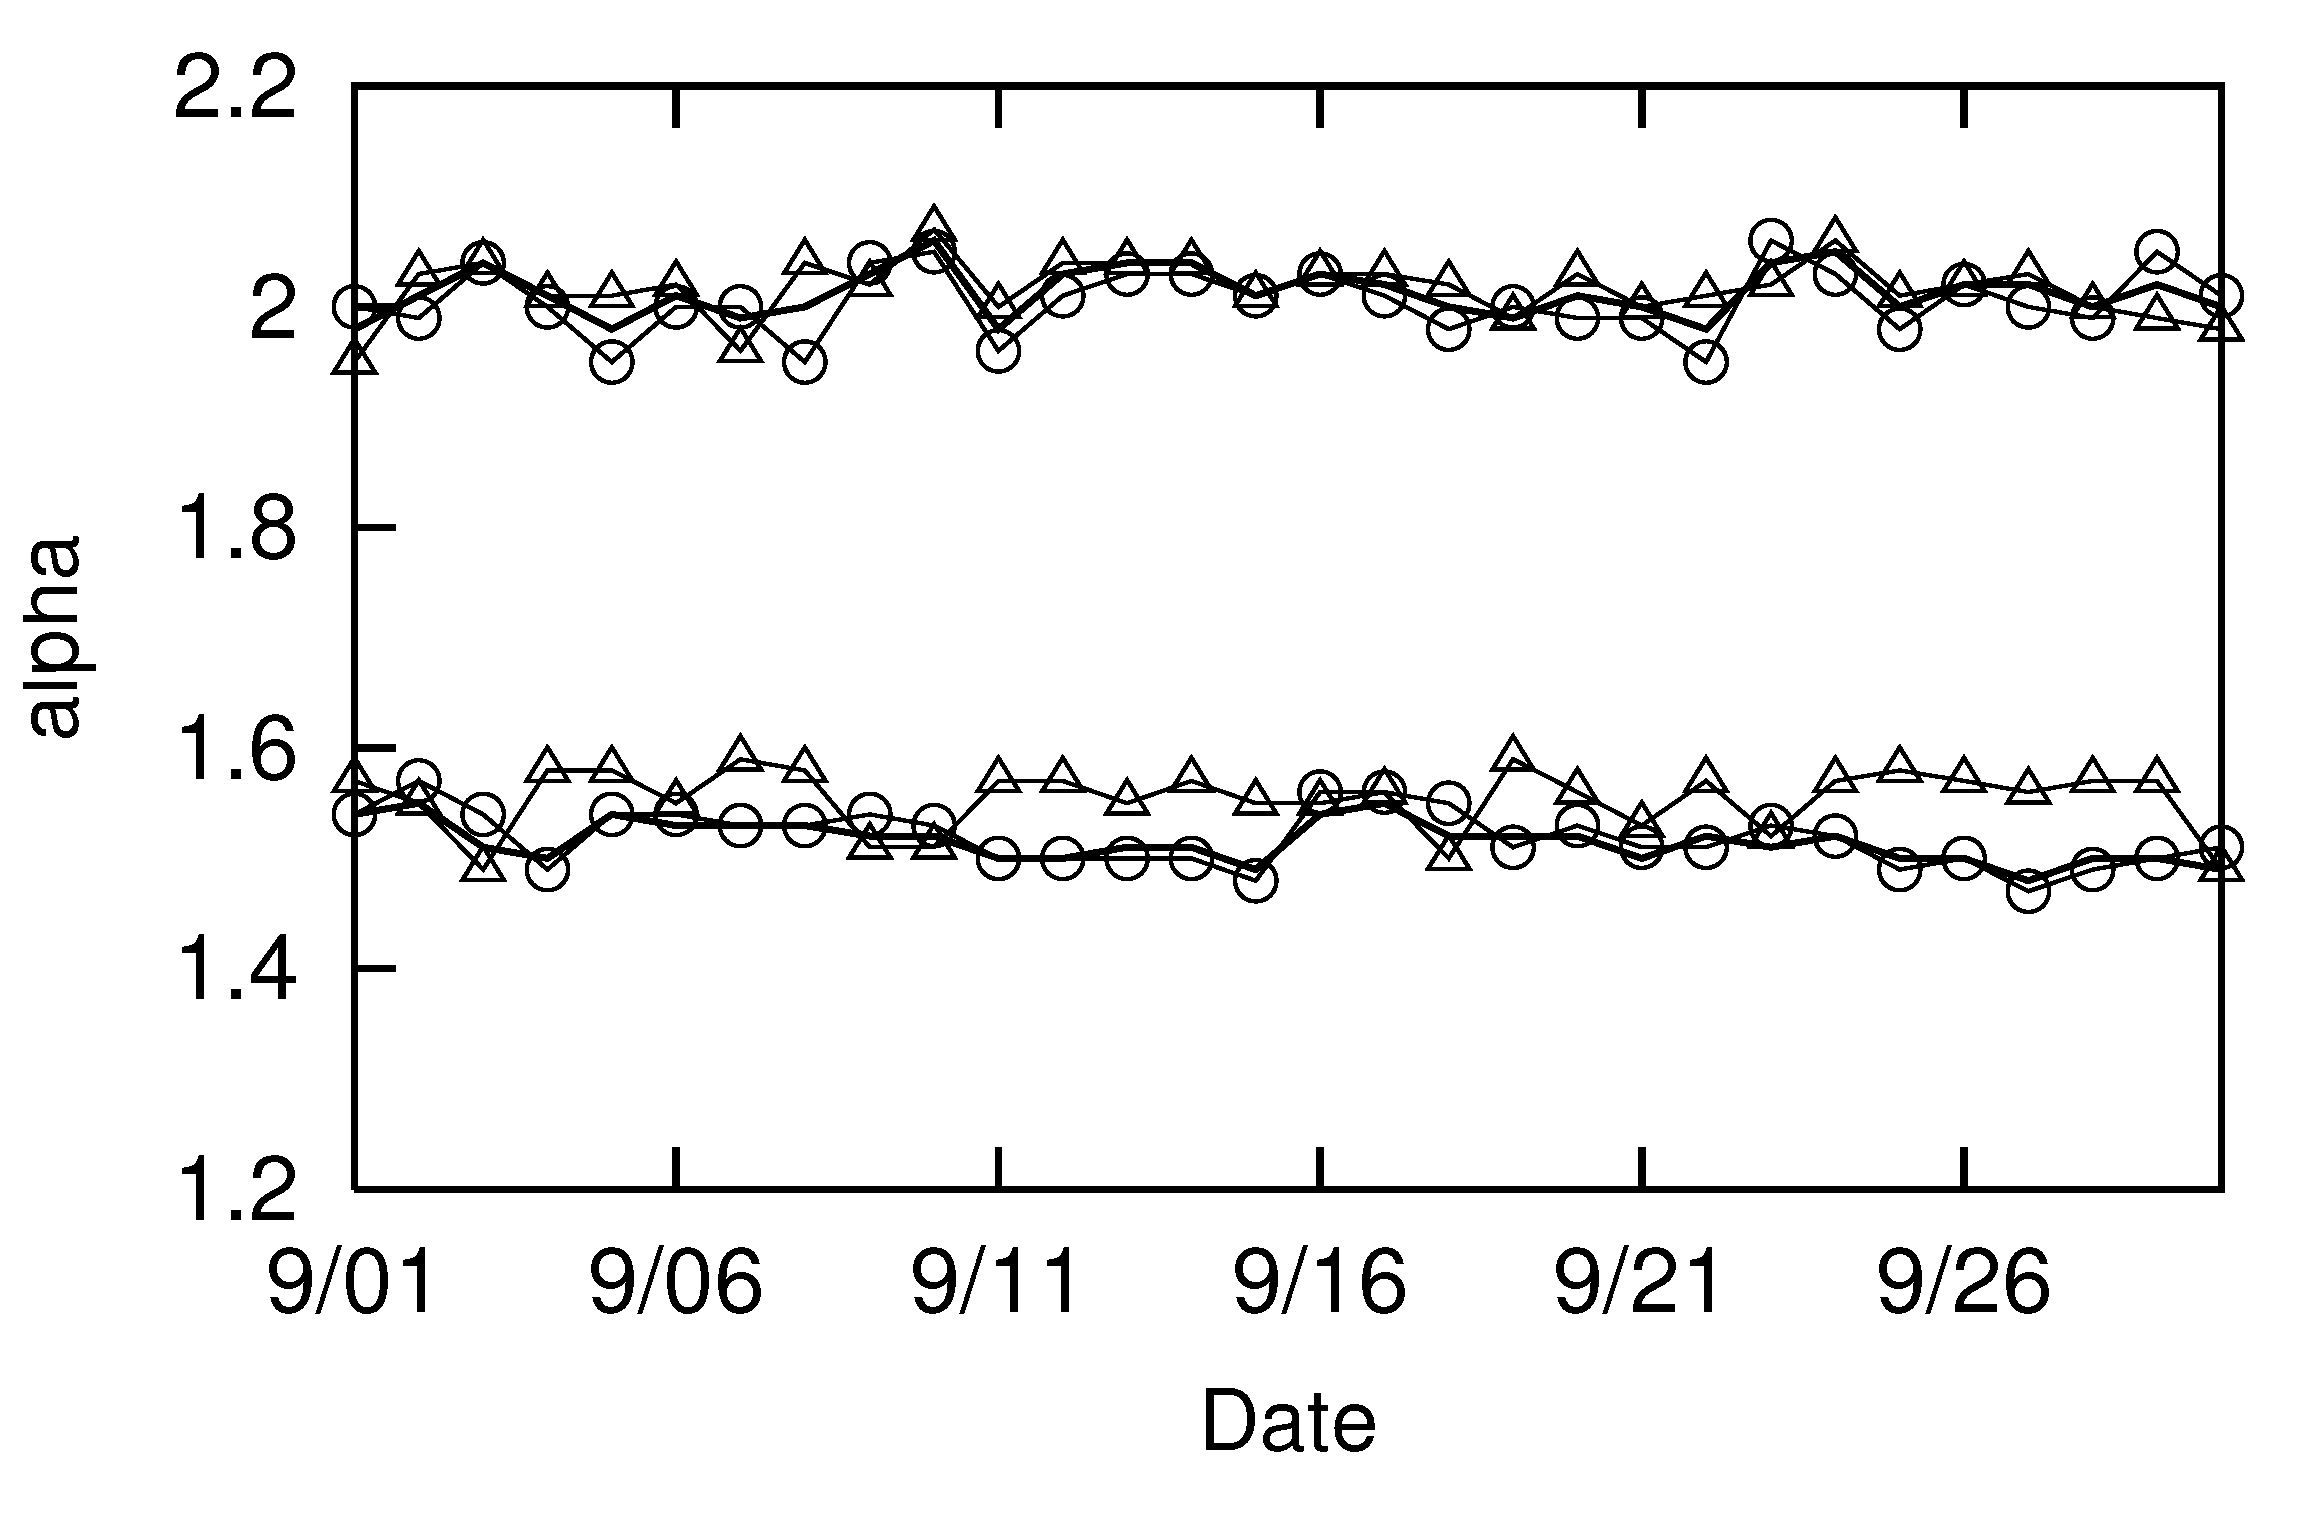
of people who passed through Ishikawa Prefecture in September 2023 (solid lines around 2 and
); 2)
and
of people whose homes are estimated to be in Kanazawa City, Ishikawa Prefecture (△); 3)
and
for those whose homes are estimated to be outside of it (◯). When movement trajectories are divided between those whose homes are presumed to be in Ishikawa Prefecture and those whose homes are not, most people are included in the former group. This differs from Shimogyo-ku, Kyoto, and Urayasu City, where many are from outside these areas. Therefore, unlike Urayasu City or Shimogyo-ku, people’s residences are limited to Kanazawa City, where tourist attractions in Ishikawa Prefecture are concentrated.
Figure 13 shows that those whose homes are estimated to be outside of Kanazawa City (◯) are creating the variations in the long-distance movement trajectories of those who passed through Ishikawa Prefecture. The correlation is strong:
. Conversely, the correlation with the movement trajectory (△) of those whose homes are estimated to be in Kanazawa City, Ishikawa Prefecture is weak:
.
The long-distance movement trajectory in Ishikawa Prefecture is comprised of an average of people per day. Among them, those whose homes are estimated to be in Kanazawa City Prefecture (△) average per day. On the other hand, those whose homes are estimated to be outside of Kanazawa City (◯) are on average per day. The number of people whose homes are estimated to be outside of Kanazawa City (◯) is around times the number of people whose homes are estimated to be in it (△); the correlation coefficient is around times. In other words, it is not simply the number of people coming from outside the region that affects the overall long-distance movement parameter . It is also important that they are coming from outside the region.
At the end of this section, we also discuss the variation of short movement trajectories.
Figure 11 and
Figure 12 show that those whose homes are estimated to be in the region (△) are creating the variation in short-distance movement trajectories. Their correlations are also strong:
or
, respectively. The correlations with the movement trajectory (◯) of those whose homes are presumed to be outside the region are weaker:
or
, respectively. The number of people estimated to have homes in Shimogyo-ku, Kyoto is around
times that of those who do not, and the number of people estimated to have homes outside of Urayasu City, Chiba is around
times that of those who do not. In other words, it is reasonable to assume that the variation in these short-distance movement trajectories is created by people living in the region, given their numbers.
Figure 13 also shows the difficulty of determining whether those whose homes are presumed to be in Kanazawa City, Ishikawa Prefecture (△) (◯) are making short movement trajectories through it. The correlation coefficient between the former (△) and the total is
, and the correlation between the latter (◯) and the total is
. Since the number of people whose homes are estimated to be in Kanazawa, Ishikawa is around
times the number of those whose homes are not, this result is also reasonable, given the numbers. The above conclusion indicates that short movement trajectories are made by local residents.
6. Simulation
In the previous sections, we identified statistical properties that can be found in the movement trajectory data of Urayasu City, Chiba Prefecture, Shimogyo-ku, Kyoto City, and Ishikawa Prefecture. The main feature is that area
S of the polygon surrounded by the movement trajectories seems correlated to the power of its perimeter
L (
, Eq. (
1)). This correlation is separated into short and long distances. The power exponent
at short distances with
is greater than the value
at long distances with
:
In this section, we show that a model in which such a phenomenon occurs can be made with minimum tooling requirements.
First consider a circle whose radius
is centered at point
B at distance
R from point
A (
Figure 14). Take
n points on its circumference. Denote by
angle
, which makes a line connecting them and the circle’s center
B, where
. Consider point
on each line whose distance from point
B is
.
Figure 14 is an example for
. Next,
R is generated
times with a power distribution of exponent 1 and
and
are uniformly distributed. Then, deeming point
A as home and point
as a destination, we investigate the movement trajectory that connects
A→
→
→⋯→
→
A and measure area
S that encloses it and its perimeter
L.
Figure 15 is a scatter plot of
L and
S with
.
As seen from
Figure 15, there is a two-fold linear correlation between
and
, as in the actual data; its slope
is larger in the small range than in the large range of
L. For example, if the boundary between long and short distances is
, then
and
from the least squares method. If the boundary is
, then
,
. In both cases, the values of
are around 2 and those of
are between 2 and 1. Note that if
(e.g.,
), then
is not observed. That is,
is creating the fold in the linear correlation, and its scale is approximately given by
. In this simulation,
R was generated with a power distribution, but the same phenomenon can be observed when generated with a uniform distribution. To simplify distinguishing here between long- and short-range boundaries, we use a power distribution. The above simple model allows the separation of correlations between
and
to be generated by the size of
L.
The major difference between the scatter plot in
Figure 3 in the actual data and
Figure 15 in the simulation is that in the former data, the long-distance data are larger than the short-distance data; the opposite is true in the simulation. As noted in our Introduction, human movement distances are generally power-distributed. The data used in our analysis, however, were collected using the GPS function of smart phones possessed by those passing through regions containing tourist attractions. Because of this restriction, the movement trajectories of those who made long-distance movements are preferentially collected, and perhaps the amount of data due to the size of
L is inverted between
Figure 3 and
Figure 15.
7. Results and Conclusions
This paper uses movement trajectory data for one month in Urayasu City, Chiba Prefecture, two months in Shimogyo-ku, Kyoto City, and two months in Ishikawa Prefecture to reveal the following observations. When a human’s movement trajectory creates a polygon, statistical properties exist for its area and perimeter. When the distance is less than 5 km, which is the distance a typical healthy adult walks in approximately one hour, it is considered a short distance, and a distance exceeding 5 km is considered a long distance. The movement trajectories for short distances tend to resemble a large enclosed area like a circle, and the movement trajectories for long distances tend to be linear. These results can be understood from the slope of an optimal straight line drawn on a log-log scatter plot, which charts the area of a polygon drawn by a movement trajectory and its perimeter. For short distances, the exponent is around 2 and between 1 and 2 for long ones. These observations are common to the above three types of movement trajectory data.
We also identified the following facts by classifying these observations by individual attributes. Women tend to move more linearly than men. For Urayasu City, Chiba Prefecture, those under 30 tend to move more linearly than other age groups. For Shimogyo-ku, Kyoto, and Ishikawa, we found no significant difference in trends by age groups.
By comparing observations from three different regions in Japan, Urayasu City, Chiba Prefecture, Shimogyo-ku, Kyoto City, and Ishikawa Prefecture, we observed the impact of such external factors as region on statistical properties. First, the short-distance movement trajectory index was in Urayasu City, in Shimogyo-ku, and in Ishikawa Prefecture. All of these values are in the 2 range, and we observed no significant differences. However, the long-distance movement trajectory indexes varied by region, ranging from in Urayasu City to in Shimogyo-ku and to in Ishikawa Prefecture. The long-distance movement index showed a characteristic pattern of fluctuation: on weekends and national holidays, the index was smaller in Urayasu City and larger in Shimogyo-ku.
We interpret the above observations as follows. The difference in long-distance movement trajectory parameter for those passing through Urayasu City and Shimogyo-ku is due to the difference in the linearity of the movement trajectories of visitors from outside their respective regions. Disneyland, Japan’s largest theme park, is in Urayasu City and attracts young women, especially on weekends and holidays. This situation strengthens the linearity of weekends and holidays.
On the other hand, the numerous historical tourist attractions in Shimogyo-ku attract people of all ages with an even stronger force. The linearity is moderated by the trajectory of people who want to efficiently visit many tourist destinations on weekends and holidays. The long-distance movement trajectories of those passing through Ishikawa Prefecture are made by people who most likely live outside of Kanazawa City. Since tourist destinations in Kanazawa City are clustered in a smaller region than those in Kyoto City, it is difficult to observe a trend of moderate linearity on weekends and holidays. But compared to Urayasu City, the trend resembles that of Shimogyo-ku. We also found that the variation in the short-distance movement trajectory parameters is created by those living in the area.
Finally, the correlation parameter between the area and the perimeter of the polygon enclosed by movement trajectories differs between long- and short-distance movements. We can reproduce this property by a simple model simulation. This paper shows that discussions of movement trajectories, which have traditionally been described using such concepts as fractal dimension, can be analyzed by merely correlating two familiar variables: an area and its perimeter. The findings obtained by this paper include important properties that should be addressed when creating movement trajectory models.
Future work will spatially and temporally expand our analysis for the three regions in this study. However, obtaining commercially available human flow data faces financial constraints. It would be interesting to shift the perspective a bit from human flow data and use car navigation data to determine whether similar statistical regularities exist in the movement trajectory of cars. Furthermore, if we analyze the movement trajectories of non-human animals, we might identify differences between them and humans and increase our comprehension of human behavior compared with non-human animals. We are currently preparing to embark on a study in this direction and will report in the near future.
Author Contributions
All the authors carried out this work’s conceptualization, methodology, investigation, and validation. AI, SF, and YT did the formal analysis. AI prepared and wrote the original draft. TM managed the project administration and funding acquisition. All the authors contributed to the article and approved its submitted version.
Funding
This work was supported by JSPS KAKENHI Grant Numbers JP21K04557 and 22K04609.
Data Availability Statement
Publicly available datasets were analyzed in this study. These data can be purchased from the Agoop-Corp.:
https://www.agoop.co.jp/.
Conflicts of Interest
The authors declare that the research was conducted without any commercial or financial relationships that might be construed as potential conflicts of interest.
References
- González, M.; Hidalgo, C.; Barabási, A. Understanding individual human mobility patterns. Nature 2008, 453, 779–782. [Google Scholar] [CrossRef] [PubMed]
- Song, C.; Qu, Z.; Blumm, N.; Barabási, A.L. Limits of Predictability in Human Mobility. Science 2010, 327, 1018–1021. [Google Scholar] [CrossRef] [PubMed]
- Calabrese, F.; Lorenzo, G.D.; Liu, L.; Ratti, C. Estimating Origin-Destination Flows Using Mobile Phone Location Data. IEEE Pervasive Computing 2010, 10, 36–44. [Google Scholar] [CrossRef]
- Blondel, V.; Esch, M.; Chan, C.; Clérot, F.; Deville, P.; Huens, E.; Morlot, F.; Smoreda, Z.; Ziemlicki, C. Data for Development: the D4D Challenge on Mobile Phone Data. arXiv arXiv:1210.0137 2013.
- Wang, H.; Wang, H.; Ni, X.; Zeng, W. Revealing Spatial-Temporal Characteristics and Patterns of Urban Travel: A Large-Scale Analysis and Visualization Study with Taxi GPS Data. ISPRS International Journal of Geo-Information 2019, 8, 257. [Google Scholar] [CrossRef]
- Okuno, Y.; Hashimoto, Y. An Analysis of Trajectory Data for Quasi Tsunami Evacuation in a Heavy Snow and Cold Area. Theory and Applications of GIS 2015, 23, 11–20. [Google Scholar] [CrossRef]
- Contreras, D.; Forino, G.; Blaschke, T. Measuring the progress of a recovery process after an earthquake: The case of L’aquila, Italy. International Journal of Disaster Risk Reduction 2018, 28, 450–464. [Google Scholar] [CrossRef]
- Soulakellis, N.; Vasilakos, C.; Chatzistamatis, S.; Kavroudakis, D.; Tataris, G.; Papadopoulou, E.E.; Papakonstantinou, A.; Roussou, O.; Kontos, T. Post-Earthquake Recovery Phase Monitoring and Mapping Based on UAS Data. ISPRS International Journal of Geo-Information 2020, 9, 447. [Google Scholar] [CrossRef]
- Ropert-Coudert, Y.; Van de Putte, A.P.; Reisinger, R.R.e.a. The retrospective analysis of Antarctic tracking data project. Scientific Data 2020, 7, 94. [Google Scholar] [CrossRef] [PubMed]
- Bischof, R.; Hansen, N.R.; Nyheim, O.S.; Kisen, A.; Prestmoen, L.; Haugaasen, T. Mapping the “catscape” formed by a population of pet cats with outdoor access. Scientific Reports 2022, 12, 5964. [Google Scholar] [CrossRef] [PubMed]
- Zhao, K.; Musolesi, M.; Hui, P.; Rao, W.; Tarkoma, S. Explaining the power-law distribution of human mobility through transportationmodality decomposition. Scientific Reports 2015, 5, 9136. [Google Scholar] [CrossRef] [PubMed]
- Deville, P.; Song, C.; Eagle, N.; Blondel, V.D.; Barabási, A.L.; Wang, D. Scaling identity connects human mobility and social interactions. Proceedings of the National Academy of Sciences 2016, 113, 7047–7052. [Google Scholar] [CrossRef] [PubMed]
- Mandelbrot, B.B. The Fractal Geometry of Nature; W.H.Freeman & Co Ltd: San Francisco, 1983. [Google Scholar]
- Weiss, G. Aspects and Applications of the Random Walk; North Holland: New York, 1994. [Google Scholar]
- Benhamou, S. How to reliably estimate the tortuosity of an animal’s path:: straightness, sinuosity, or fractal dimension? Journal of Theoretical Biology 2004, 229, 209–220. [Google Scholar] [CrossRef] [PubMed]
- Ishikawa, A.; Fujimoto, S.; Mizuno, T.; Tanaka, Y. Statistical relationship between the area and perimeter of a polygon drawn by the trajectory of human movement. to appear in J-Stage, 2023. [Google Scholar]
Figure 1.
Person’s movement trajectory through city of Urayasu City on August 27, 2022. Enclosed area is , and its perimeter is .
Figure 1.
Person’s movement trajectory through city of Urayasu City on August 27, 2022. Enclosed area is , and its perimeter is .
Figure 2.
Person’s movement trajectory through Urayasu City on August 22, 2022. Enclosed area is and its perimeter is .
Figure 2.
Person’s movement trajectory through Urayasu City on August 22, 2022. Enclosed area is and its perimeter is .
Figure 3.
Scatter plot of perimeter L km and area S km2 of polygon enclosed by movement trajectory of a person through Urayasu City on August 7, 2022.
Figure 3.
Scatter plot of perimeter L km and area S km2 of polygon enclosed by movement trajectory of a person through Urayasu City on August 7, 2022.
Figure 4.
Figure 3 on both logarithmic axes
Figure 4.
Figure 3 on both logarithmic axes
Figure 5.
Changes in and of those passing through Urayasu City in August 2022: August 7, 14, 21, and 28 are Sundays; August 11 is a national holiday.
Figure 5.
Changes in and of those passing through Urayasu City in August 2022: August 7, 14, 21, and 28 are Sundays; August 11 is a national holiday.
Figure 6.
Women, men, and both genders together passing through Urayasu City in August 2022: August 7, 14, 21, and 28 are Sundays; August 11 is a national holiday.
Figure 6.
Women, men, and both genders together passing through Urayasu City in August 2022: August 7, 14, 21, and 28 are Sundays; August 11 is a national holiday.
Figure 7.
Changes in through Urayasu City in August 2022 for persons under 30 (G1), between 30 and 60 (G2), and over 60 (G3), and for them together: August 7, 14, 21, and 28 are Sundays; August 11 is a national holiday.
Figure 7.
Changes in through Urayasu City in August 2022 for persons under 30 (G1), between 30 and 60 (G2), and over 60 (G3), and for them together: August 7, 14, 21, and 28 are Sundays; August 11 is a national holiday.
Figure 8.
Changes in and of those passing through Shimogyo-ku, Kyoto in November 2021: November 7, 14, 21, and 28 are Sundays; November 3 and 23 are national holidays.
Figure 8.
Changes in and of those passing through Shimogyo-ku, Kyoto in November 2021: November 7, 14, 21, and 28 are Sundays; November 3 and 23 are national holidays.
Figure 9.
Changes in for women, men, and both genders combined through Shimogyo-ku, Kyoto in November 2021: November 7, 14, 21, and 28 are Sundays; November 3 and 23 are national holidays.
Figure 9.
Changes in for women, men, and both genders combined through Shimogyo-ku, Kyoto in November 2021: November 7, 14, 21, and 28 are Sundays; November 3 and 23 are national holidays.
Figure 10.
of people under 30 (G1), between 30 and 60 (G2), and over 60 (G3), and of them together through Shimogyo-ku, Kyoto in November 2021: November 7, 14, 21, and 28 are Sundays; November 3 and 23 are national holidays.
Figure 10.
of people under 30 (G1), between 30 and 60 (G2), and over 60 (G3), and of them together through Shimogyo-ku, Kyoto in November 2021: November 7, 14, 21, and 28 are Sundays; November 3 and 23 are national holidays.
Figure 11.
Changes in and for those who passed through Shimogyo-ku, Kyoto in November 2021 (solid lines around 2 and ): The and trends are for those whose homes are estimated to be in Shimogyo-ku, Kyoto (△), and the and are for those whose homes are estimated to be outside of it (◯). November 7, 14, 21, and 28 are Sundays; November 3 and 23 are national holidays.
Figure 12.
Changes in and for those who passed through Urayasu City in August 2022 (solid lines around 2 and ): Among them, and trends are for those whose homes are estimated to be in Urayasu City (△), and and are for those whose homes are estimated to be outside Urayasu City(◯). August 7, 14, 21, and 28 are Sundays; August 11 is a national holiday.
Figure 13.
Changes in and for those who passed through Ishikawa Prefecture in August 2022 (solid lines around 2 and ): Among them, the and trends are for those whose homes are estimated to be in Kanazawa City, Ishikawa Prefecture (△), and the and are for those whose homes are estimated to be outside Kanazawa City, Ishikawa Prefecture (◯). September 3, 10, 17, and 24 are Sundays; September 8 is a national holiday.
Figure 14.
Consider a circle with radius centered at point B at distance R from home A. Take n points on the circumference, and let be angle between the line connecting them and center B of the circle. Furthermore, consider point on the line whose distance from point B is , where . The figure shows an example for .
Figure 15.
In setting of
Figure 14,
R was generated
times with a power distribution with exponent 1,
and
r with a uniform distribution. Consider the movement trajectory connecting
A→
→
→⋯→
→
A. Scatter plot of polygon’s area
S and its perimeter
L. Here,
.
Figure 15.
In setting of
Figure 14,
R was generated
times with a power distribution with exponent 1,
and
r with a uniform distribution. Consider the movement trajectory connecting
A→
→
→⋯→
→
A. Scatter plot of polygon’s area
S and its perimeter
L. Here,
.
|
Disclaimer/Publisher’s Note: The statements, opinions and data contained in all publications are solely those of the individual author(s) and contributor(s) and not of MDPI and/or the editor(s). MDPI and/or the editor(s) disclaim responsibility for any injury to people or property resulting from any ideas, methods, instructions or products referred to in the content. |
© 2024 by the authors. Licensee MDPI, Basel, Switzerland. This article is an open access article distributed under the terms and conditions of the Creative Commons Attribution (CC BY) license (http://creativecommons.org/licenses/by/4.0/).
