Preprint
Article

Co-optimisation of Mechanical Properties and Radiopacity through Radiopaque Filler Incorporation for Medical Tubing Applications

Altmetrics

Downloads

66

Views

50

Comments

0

A peer-reviewed article of this preprint also exists.

Submitted:

07 September 2024

Posted:

09 September 2024

You are already at the latest version

Alerts
Abstract
The objective of this research project was to evaluate the effects of the addition of inorganic fillers into PEBA at various loading levels on the processing, mechanical, thermal and physical properties of the polymer. The composites investigated in this study were Pebax® 6333 SA01 MED (PEBA100) with 10 wt.%, 20 wt.% and 30 wt.% Barium Sulphate (PEBA/BaSO4) and Bismuth Oxychloride (PEBA/BiOCl) respectively. Composites were prepared using twin screw extrusion and injection moulding. Post-processing, composite samples were analysed for their mechanical properties (via tensile, impact and flexural analysis), thermal properties (via differential scanning calorimetry), rheological performance (via melt flow index) and physical properties (via density analysis and ash content testing). The results of which reveal how filler type and concentration influence PEBA composites. The results of the study suggest that BiOCl filler enhances the aesthetic properties, increases the stiffness, while maintaining some level of flexibility with minimal adverse effects on the tensile and impact strength. When comparing BiOCl to BaSO4 filled composites, it was clear that depending on the application of the polymer composite, BiOCl may provide more desirable properties. The study highlights the importance of optimising filler concentration and processing conditions to achieve desired composite properties for specific medical applications.
Keywords: 
Subject: Engineering  -   Other

1. Introduction

1.1. Background

Medical devices play a crucial role in modern healthcare, providing critical support in diagnosis, treatment and patient care. Medical device is a broad term for a range of products that cater to a vast array of solutions for healthcare issues. Before 1900, medicine had little to offer the typical citizen because its resources were mainly the education and little black bag of the physician [1]. A medical device is any instrument or apparatus intended by the developer or manufacturer to be used for a specific medical purpose. These devices range from the basic devices to complex devices. These devices could be further categorised into the following: non-invasive devices that do not enter the body such as bandages and stethoscopes, invasive devices that enter the body such as catheters and needle tips. Other devices include active devices that require a source of energy to function such as pacemakers and infusion pumps, and diagnostic devices used to diagnose diseases or conditions such as imaging devices (MRI, X-Ray, etc.), dialysis machines.
As the global population continues to grow and age, development and innovation of new medical devices is of utmost importance. Many global leaders in medical device development and manufacturing are pushing the boundaries of materials to achieve the end goal of developing new innovative products for the healthcare market. There are many considerations when designing a medical device, an important consideration being material selection. Choice of materials will impact virtually all aspects of the device’s use: the dimensions, lifespan, and capabilities of the device; the cost and complexity of validation, manufacture, and application; and, most important of all, the physiological response of the patient and thus the viability of the device as a medical therapy [2].
Catheter tubing is a particularly interesting area of medical device development. Invasive catheter types include in-dwelling and intermittent catheters [3]. These catheters are used for a wide range of applications such as urinary catheters, central venous catheters (CVC) and pulmonary artery catheters (PAC). When reflecting on the design and development of specific devices such as catheter tubing, a major consideration is the materials from which the device will be produced. Not only is the polymer selection important, but also the ability to integrate radiopacity into the device, providing the surgeons with the ability to view the device during deployment under contrast x-ray-based techniques such as fluoroscopy, angiography, computed tomography (CT), and dual energy X-ray absorptiometry (DXA) [4].

1.2. Polymers in Medical Tubing

When developing medical tubing such as catheters, it is important to select the correct materials to ensure that the catheter performs as required. An appropriate combination of physical and mechanical properties is essential if a product is to be successful in its application [5]. The various types of catheters require different characteristics such as, stiffness/flexibility, kink resistance, softness, smooth surface, elasticity, coefficient of friction etc. Developments into innovative polymers are ongoing, where manufacturers are developing polymer groups with various different properties.
Synthetic polymers have extensive applications as biomaterials in medical implants. They can either be permanent, where their intended duration spans years, or temporary, where they are naturally biodegraded in vivo or removed upon healing [4]. The most common polymers used in catheter applications are Thermoplastic Polyurethane (TPU), Silicone [6], Polyether Block Amide (PEBA) [7] and Polyvinyl Chloride (PVC) [8]. What makes these materials special is that manufacturers have the capabilities to tweak the formulations during synthesis to obtain materials with different properties. When reviewing materials available on the global polymer market, there are a wide variety of TPUs and PEBAs for example with different shore hardness’s and properties such as tensile modulus.
PEBA is one of the most versatile polymeric materials in use in the medical device industries. Poly (ether amide) are a group of Thermoplastic Elastomers (TPEs) that can be processed by injection moulding and profile or film extrusion [9]. Pebax® or poly(ether-b-amide) is a category of thermoplastic elastomeric copolymers prepared through block arrangement of hard polyamide and flexible polyether sections forming by condensation polymerization [10]. What makes Pebax® so suitable for catheter applications is that while it shows excellent processability, it also displays high thermal and chemical stability [3]. The chemical structure of PEBA can be seen in Error! Reference source not found., where the hard segments are typically composed of PA12 and the soft segments were identified by Bardin, et al., (2022) as a PTMO in Pebax® 2533. It is unclear if the same soft segment flexible polyether is used for all Pebax® grades.
Figure 1. PEBA chemical structure.
Preprints 117602 g001
The various PEBA grades from Arkema in the Pebax® range would have similar constituents, with differing compositions to achieve properties to suit particular applications. Pebax® 6333 SA01 MED for example would, in theory, have a greater number of hard block PA 12 segments than Pebax® 2533 SA01 MED to achieve a stiffer, harder material. Error! Reference source not found. shows some of the various grades of Pebax® SA01 MED for comparison purposes. It can be seen that the manufacturer of Pebax®, Arkema S.A., have developed a variety of PEBA thermoplastics suitable for a wide range of applications where either a hard or soft material is required, but also where a manufacturer may wish to focus on other properties such as tensile modulus (Young’s modulus) or impact strength. This has been possible due to the development of these grades by tuning the constituents prior to the condensation polymerisation process.
Table 1. Various Pebax® grades properties [11,12,13,14].
Properties Units Pebax® 2533 SA01 MED Pebax® 4033 SA01 MED Pebax® 6333 SA01 MED Pebax® 7233 SA01 MED
Shore A Hardness - 74 89 ~100 (estimate) >100 (estimate)
Shore D Hardness - ~25 (estimate) 35 58 61
Tensile Modulus MPa 12 73 307 510
Charpy notched Impact Strength, +23°C kJ/m2 No Break No Break No Break 15

1.3. Requirements for Radiopaque Materials

X-ray-computed tomography (CT) is a well-established tissue imaging technique employed in a variety of research and clinical settings. Specifically, CT is a non-invasive clinical diagnostic tool that allows for 3D visual reconstruction and segmentation of tissues of interest [15]. Lusic & Grinstaff, (2013) summarise that, as a rule, materials possessing higher density (ρ), or high atomic number (Z) tend to better absorb X-rays. The relationship is best expressed in [15] for X-ray absorption coefficient (μ):
μ ρ Z 4 A E 3
where;
A = Atomic mass
E = X-ray energy
Consequently, X-ray attenuating contrast media containing atoms of high atomic number (most commonly iodine or barium) are frequently used in clinical settings to obtain images of soft tissues.

1.4. Inorganic Fillers

When a radiopaque material is used for the single-scan method, it must be homogenous and uniform in appearance and must not create scatter. One such material is barium sulphate, which is commonly used for gastrointestinal (and cardiovascular) imaging [16]. Ingestion of certain forms of barium (e.g. barium carbonate or barium fluoride) in toxic amounts can lead to gastrointestinal (vomiting, diarrhea and abdominal pain), cardiac and skeletomuscular stimulation followed by paralysis [17,18]. The toxicity of barium compounds depends on their solubility. Barium sulphate (BaSO4), which is often used for medical purposes, remains essentially unabsorbed and is unlikely to cause adverse effects (to the body) [17]. Chemically pure BaSO4 is nontoxic to humans, due to insolubility, and is frequently used as a contrast agent in the X-ray diagnosis of colorectal and upper gastrointestinal examinations [19]. BaSO4 is commonly used in medical devices, incorporated homogeneously into a polymer suitable for a particular application. It is typically incorporated at levels of 10-40 wt.% but is known to be incorporated up to 60 wt.% [20].
Bismuth compounds are considered to be poorly to moderately absorbed after inhalation or ingestion, but there are no quantitative data. The highest concentration of absorbed bismuth is typically found in the kidney and liver, and generally excreted through the urine [21]. Similar to BaSO4, bismuth oxychloride is insoluble in water, reducing the toxicity of the compound. BiOCl is commonly used in medical devices, incorporated homogeneously into a polymer suitable for a particular application. Similar to barium sulphate, bismuth oxychloride is typically incorporated at levels of 10-40 wt.%. High-loading filler fractions up to 60 wt.% are often required to achieve good X-ray visibility, although such amounts of radiopaque filler can strongly influence mechanical properties [22].
Other radiopaque additives such as bismuth subcarbonate (Bi2OCO3), bismuth trioxide (Bi2O3) and tungsten (W) each yield their own advantages and disadvantages. While Bi2OCO3 is the most popular radiopaque filler after BaSO4 due to its greater radiopacity, its polymer compatibility is limited and is unstable at temperatures in excess of 200°C. Bi2O3, similar to Bi2OCO3, has excellent radiopacity, however, its yellow appearance may be undesirable, especially when browning occurs at elevated temperatures. Tungsten is different from the other fillers, due to its greater density (19.28g/cm3), it is generally loaded at levels in excess of 80 wt.% [20]. While the occupied volume is similar to those of barium sulphate and bismuth oxychloride, it is an extremely dense compound. It does, however, have excellent radiopaque properties. That being said, the appearance of the compound is dark for those who desire more colourful devices, may not be an option. Some advantages and disadvantages of both BaSO4 and BiOCl can be seen in Table 2.
Table 2. Advantages and disadvantages of Barium Sulphate and Bismuth Oxychloride [23].
Filler Advantages Disadvantages
Barium Sulphate (BaSO4) Widely used in industryyufenRelatively inexpensiveyufenVery process stableyufenEasy to colour High loading levelsyufenPoor tinting strength
Bismuth Oxychloride (BiOCl) Excellent white colouryufenHighly compatible with wide range of polymersyufenSmooth surface finish Difficult to colouryufenSusceptible to UV degradation

2. Materials and Methods

2.1. Materials

Polyether Block Amide (Pebax® 6333 SA01 MED), Barium Sulphate (Blanc Fixe XR HN) and Bismuth Oxychloride (Bismuth Oxychloride BPC) were obtained from National Chemicals Company (NCC). The properties of the Pebax® 6333 SA01 MED can be seen in Table 3. The BaSO4 used had a density of 4.5 g/cm3 and an average particle size of approximately 1µm. The BiOCl used had a density of 7.7 g/cm3 and an average particle size of approximately 1.5µm. Both fillers are white in appearance.
Table 3. Pebax® 6333 SA01 MED material properties (Arkema S.A., 2024). Cond (conditioned) for at least 16 h at 23 ±2°C and 50 ±10 %RH (relative humidity).
Property Dry/Cond Unit Test Standard
Tensile Modulus 307/240 MPa ISO 527-1/-2
Yield Stress 19/18 MPa ISO 527-1/-2
Yield Strain 22/22 % ISO 527-1/-2
Nominal Strain at Break ?50/>50 % ISO 527-1/-2
Shore D Hardness, after 15s 58/* ISO 868
Charpy Notched Impact Strength, +23°C ⁻/No Break kJ/m2 ISO 179/1eA
Density 1.01/⁻ g/cm3 ISO 1183

2.2. Preparation of PEBA/Filler Composites

Pebax® 6333 SA01 MED was dried at 70°C for 4 hours prior to compounding on the twin-screw extruder, while the Blanc Fixe XR HN and Bismuth Oxychloride BPC were conditioned at 20°C for 24 hours prior to compounding. The moisture content of each of the materials were checked prior to compounding using a Brabender Aquatrac+ moisture analyser, where the Pebax® 6333 SA01 MED and the fillers were dried to below 0.08 percent moisture (%H2O). The composites were then dried at 70°C for 4 hours until a moisture content of <0.08 %H2O was achieved. The blend compositions manufactured via hot melt extrusion are detailed in Table 4.

2.3. Twin-Screw Compounding

All melt processing for the production of PEBA/filler composites for the purposes of this study were carried out on a Leistritz ZSE 27MAXX co-rotating twin screw extruder (Leistritz Extrusionstechnik GmbH, Germany), comprised of 27mm diameter mixing screws and a 40 L/D ratio. The extrusion temperatures utilised are shown in Table 5. The rotational speed of the co-rotating screws was kept constant at 310 RPM. The torque required to obtain maximum dispersion of the filler increased from 70 % torque for the 10 wt.% filled composites to 75 % torque for the 30 wt.% filled composites. The extruder utilised Coperion K-Tron gravimetric feeders (Coperion GmbH, Germany), allowing for highly accurate dosing of each element with a feed rate of 25 kg/hr. The twin screw extruder used for the trials is the property of Innovative Polymer Compounds (IPC) situated in Kilbeggan, Ireland. Upon material exiting the dies of the machine, strands were cooled in a water bath set at 10°C before pelletising using a Rieter Primo E strand pelletiser (MAAG Group, Germany) to produce pellets 2.5mm in diameter and 3.0mm in length.

2.4. Injection Moulding

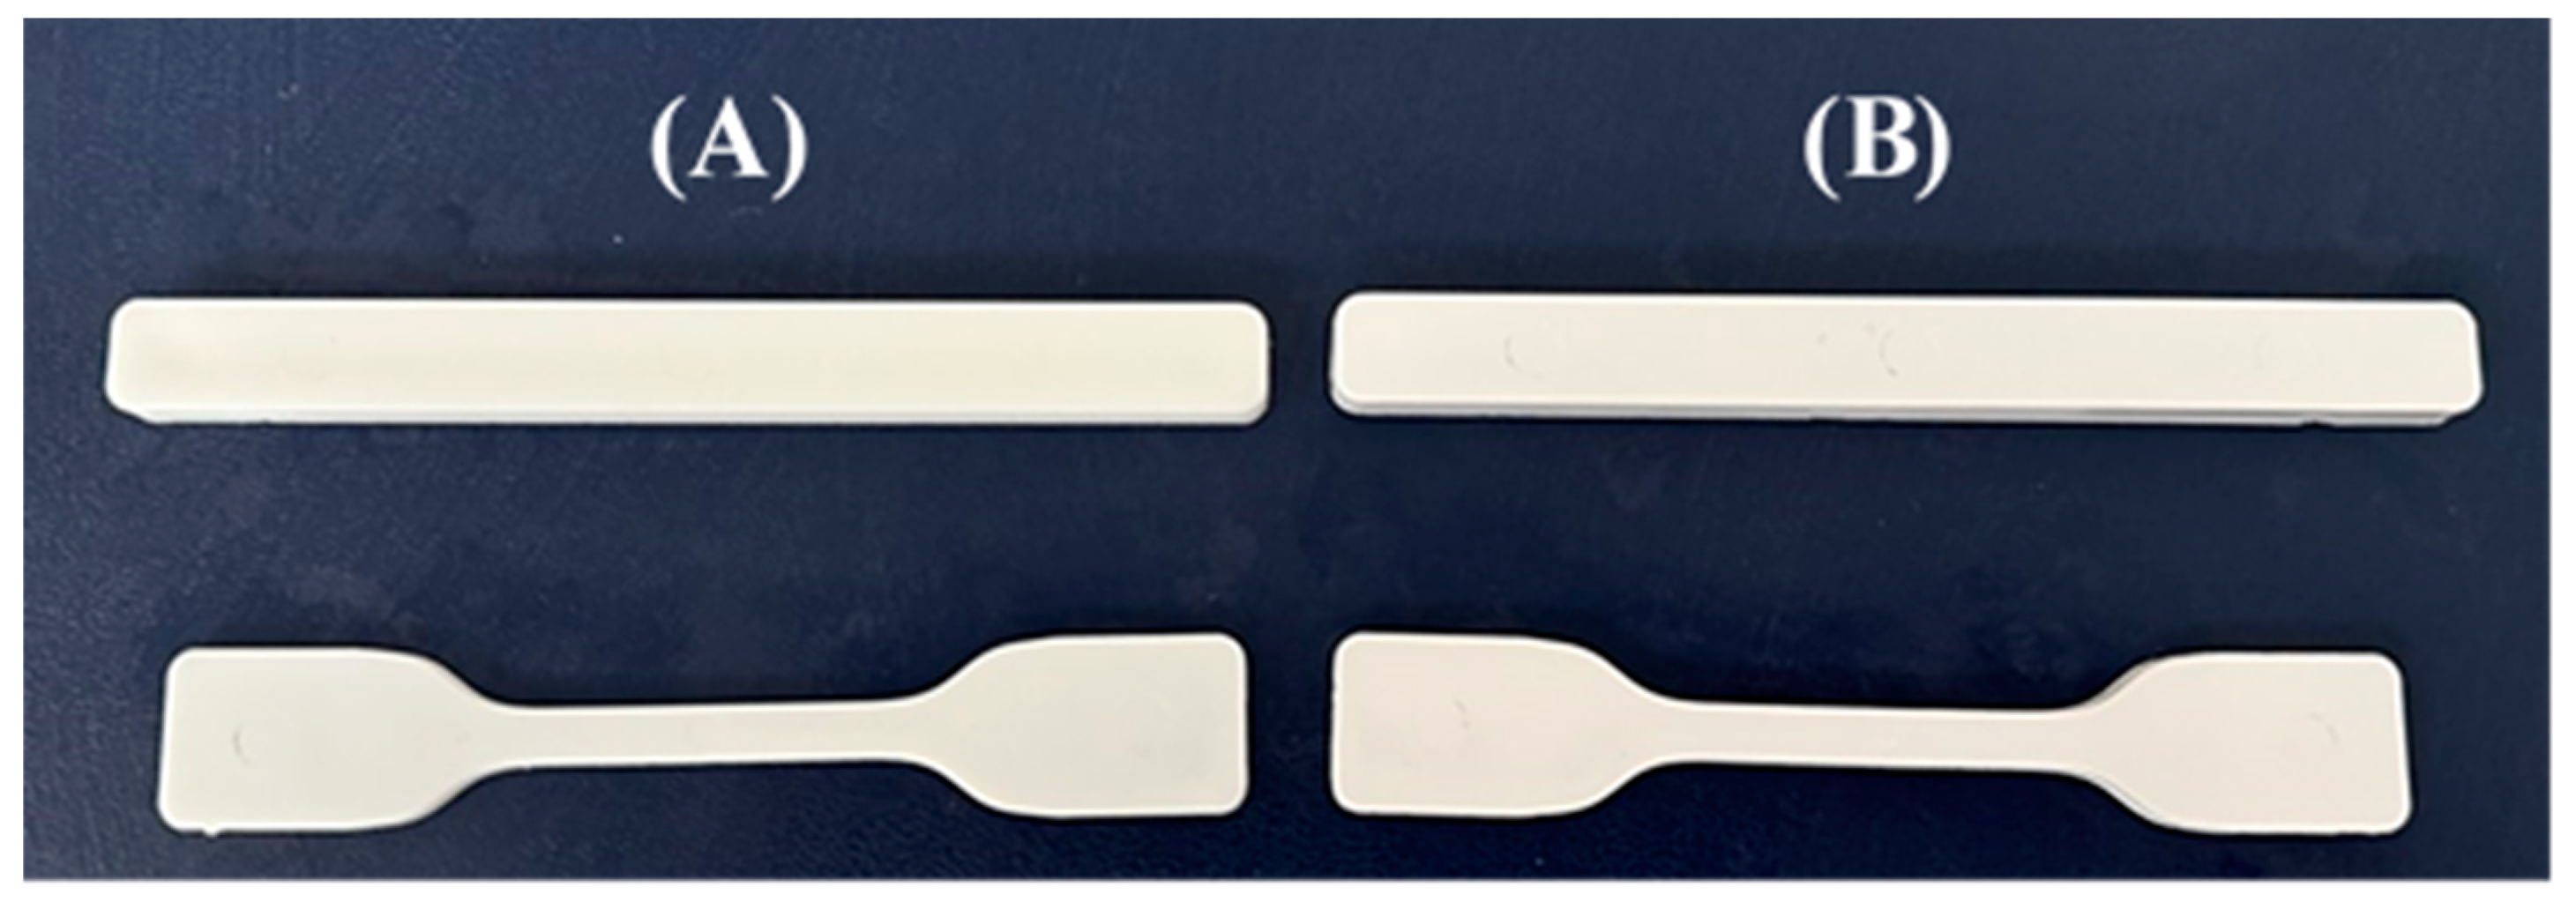
Injection moulding of impact and tensile test specimen was carried out on an Arburg Allrounder 370E Golden Electric injection moulding machine (ARBURG GmbH + Co KG, Germany) located in Ross Polymer Services Ltd, Athlone. The Arburg has a maximum clamping force of 600 kN, a screw diameter of 30mm and a theoretical stroke volume of up to 85 cm3. The machine has four thermocouples along the barrel and one on the nozzle controlling the input temperature in the process. The recommended processing temperatures from Arkema were used in the processing of the composites, 230 °C in zone 1 to 260 °C at the nozzle. A mould temperature of 40 °C was maintained by means of an a Wittmann Tempro basic (Wittmann Technology GmbH, Vienna, Austria) temperature controller. The mould temperature was confirmed using an ATP temperature probe. The mould utilised for in the production of tensile and impact test specimen was a ‘two by two’ mould, with cooling performed for 15 seconds (s). The geometry of the moulded samples can be seen in Figure 10.
Figure 2. Tensile and Impact test specimen, (A) 30 wt.% BaSO4 & (B) 30 wt.% BiOCl.
Preprints 117602 g002

2.5. Mechanical Analysis

2.5.1. Tensile Testing

Tensile testing was performed in accordance with EN ISO 527-1 international standard for test specimens using a Zwick Roell Z005 tensile tester (Zwick GmbH & Co. KG, Ulm, Germany). A total of 6 test specimen for each sample were tested with dimensions of 112 mm in length, 6 ± 0.2 mm in width, and 3 ± 0.2 mm in thickness. The tensile testing was performed at ambient room temperature, approximately 20 °C. The tensile properties from the trials were obtained directly from the machine software. No additional calculations were required.

2.5.2. Flexural Testing

The flexural tests were performed using a three-point bending configuration by mounting a dedicated tool on the universal testing machine (Walter + Bai LFV 300, Walter + Bai AG, Löhningen, Switzerland). The radius of the support rollers and the loading nose was 25 mm and the distance between the centres of the rollers was 60 mm. The test samples were prismatic (bar-shaped samples), and each testing set comprised 6 specimens. The specimen can be seen in Figure 10. The test speed was kept constant at 5 mm/min. The mechanical tests were conducted at ambient room temperature, approximately 20 °C and 50 ± 5% relative humidity (rh).

2.5.3. Impact Testing

A calibrated Zwick Roell CEAST 6245 (Zwick Roell, Elm, Germany) was used to carry out the Charpy notched impact test on prismatic shaped samples, and each test set comprised of 5 specimens with dimensions of 123 mm in length, 12.3 ± 0.2 mm in width, and 6 ± 0.2 mm in thickness. The specimens were notched to a depth of 1.0 mm and placed in the sample holder with the notched placed centrally with the notch facing away from the falling pendulum arm. The 4 Joule (J) pendulum hammer was then locked in the upward position and subsequently released. Upon impact of the downward swinging pendulum, the impact energy imparted into the specimen is recorded in J. The impact strength of the samples was calculated using Equation 2 and Equation 3.
K = m × g × ( H h )
where;
K = Notched impact energy
m = mass of the hammer
g = gravity constant
H = initial height of pendulum hammer
h = distance travelled by pendulum hammer post impact
α = K A
where;
α = Charpy Notched impact (J/m2)
A = cross-sectional area minus notch (m)
g = gravity constant
H = initial height of pendulum hammer
h = distance travelled by pendulum hammer post impact

2.6. Thermal Analysis

2.6.1. Melt Flow Index

MFI analysis was conducted on CEAST 7025,000 (Instron CEAST, Torino, Italy). As the melt flow of the polymer is extremely sensitive to moisture, which can affect the results of the melt flow, each sample formulation was dried to the same moisture content, < 0.08 %H2O. The melt flow apparatus uses Instron melt flow modular software which calculates the MFI value in g 10 minutes-1 automatically, reducing any risk of human error which can occur when incorporating the manual material cutting method. Once the software was prepared with parameters for each sample such as product name and density, the barrel was carefully filled with granules from the specific testing batch, ensuring to press the material the reduce any voids or air pockets within the barrel. The piston was then placed in the barrel, with the displacement measurement sensor in place. Once the test had concluded, the results were graphed with the MFI values for each sample.

2.6.2. Differential Scanning Calorimetry

DSC analysis was carried out using a Pyrus 6 DSC (PerkinElmer, Waltham, MA, USA), which was calibrated using indium as the reference material. Samples between 6-8 mg were accurately measured and placed in lid-sealed aluminium pans. Calorimetry scans were performed using a heating/cooling rate of 10 °C min−1 applying standard heat from 20-250 °C min−1 for all samples. Samples were tested under nitrogen atmosphere with a flow of 30 mL min−1 to avoid oxidation. The resultant thermograms and determination of thermal transitions was performed using TA Universal Analysis software. The degree of crystallinity of the hard-crystalline phase of the PA in Pebax® was calculated Equation 4.
X c = H f H f * × 100
where;
∆Hf = enthalpy of fusion obtained from thermogram
∆Hf* = enthalpy of fusion of 100% crystalline PA12 in the hard regions of the PEBAX [24].

2.7. Physical Analysis

2.7.1. Density

Prior to performing density analysis, the theoretical density of composite samples was calculated using Equation 5 and Equation 6.
M f 1 ρ f 1 = V f 1 + M f 2 ρ f 2 = V f 2 + M f n ρ f n = V f n = V t o t
V t o t M t o t = ρ t h e o r
where;
Mf = Mass fraction
ρf = Density of mass fraction
Vf = Volume fraction
Vtot = Total volume
Mtot = Total mass of the composite
Ρtheor = Theoretical density
Determination of the density of the various samples is a manual process, whereby the polymer granules from each formulation are heat pressed into a square plaque with dimensions of 50 ± 0.2 mm in length, 50 ± 0.2 mm in width, and 2 ± 0.2 mm in thickness. A Kern ADJ 200-4 (KERN & SOHN GmbH, Balingen, Germany) digital balance accurate to 0.1 mg was used for weighing the samples for density. The pre-prepared samples are placed on the measurement plate of the scales, with the value recorded after stabilisation in excel as ‘W1’. The ‘pan straddle’ apparatus was then placed into the measurement section of the scales, with the immersion vessel placed on a self-supporting tripod. The cradle was then attached to the pan straddle, and the immersion vessel filled with boiling water. Once the temperature of the water had reached 20 °C, the scales was zeroed, and the same polymer sample was placed on the cradle submerged in water. This was allowed to stabilise over 5 minutes to provide an accurate measurement. This value was then input into excel as ‘W2’. Density of samples were subsequently calculated using Equation 7.
ρ = W 1 W 1 W 2
where;
W1 = Mass of sample in air
W2 = Mass of sample underwater

2.7.2. Ash Content Analysis

Ash content analysis is a measurement of filler content of a polymer composite, typically used as an alternative to thermogravimetric analysis (TGA). The main difference between ash content analysis and TGA is that ash content analysis does not continuously monitor and graph the results from the test. The test was carried out using a SNOL 3/1100 (Umega Group, Ukmergė, Lithuania) muffle furnace, whereby a porcelain crucible was placed into the muffle furnace for 15 minutes, removed and placed into the desiccator to cool. The crucible was then weighed using the Kern ADJ 200-4 digital balance. The value obtained was recorded in excel as ‘W1’. 2 g of the polymer sample was then weighed in the second crucible, the crucible and polymer were then weighed and recorded as ‘W2’ in excel. The crucible with the 2 g of polymer was placed into the muffle furnace. The muffle furnace was set to 850 °C, with the polymer sample heating for 10 minutes. After the 10 minutes had lapsed, the crucible was removed and placed in the desiccator to cool. After cooling, the weight of the crucible and polymer was recorded in excel as ‘W3’. These steps of heating the polymer and cooling were continued until a constant weight of the crucible and polymer was achieved., or until the variation was < 0.002 g. The ash content was subsequently calculated using Equation 8.
A s h , m a s s % = W 3 W 1 W 2 W 1 × 100
where;
W1 = Mass of crucible (g)
W2 = Mass of polymer sample and crucible together (g)
W3 = Mass of ashed sample and crucible together (g)

3. Results

3.1. Processing Observations

3.1.1. Twin-Screw Extrusion

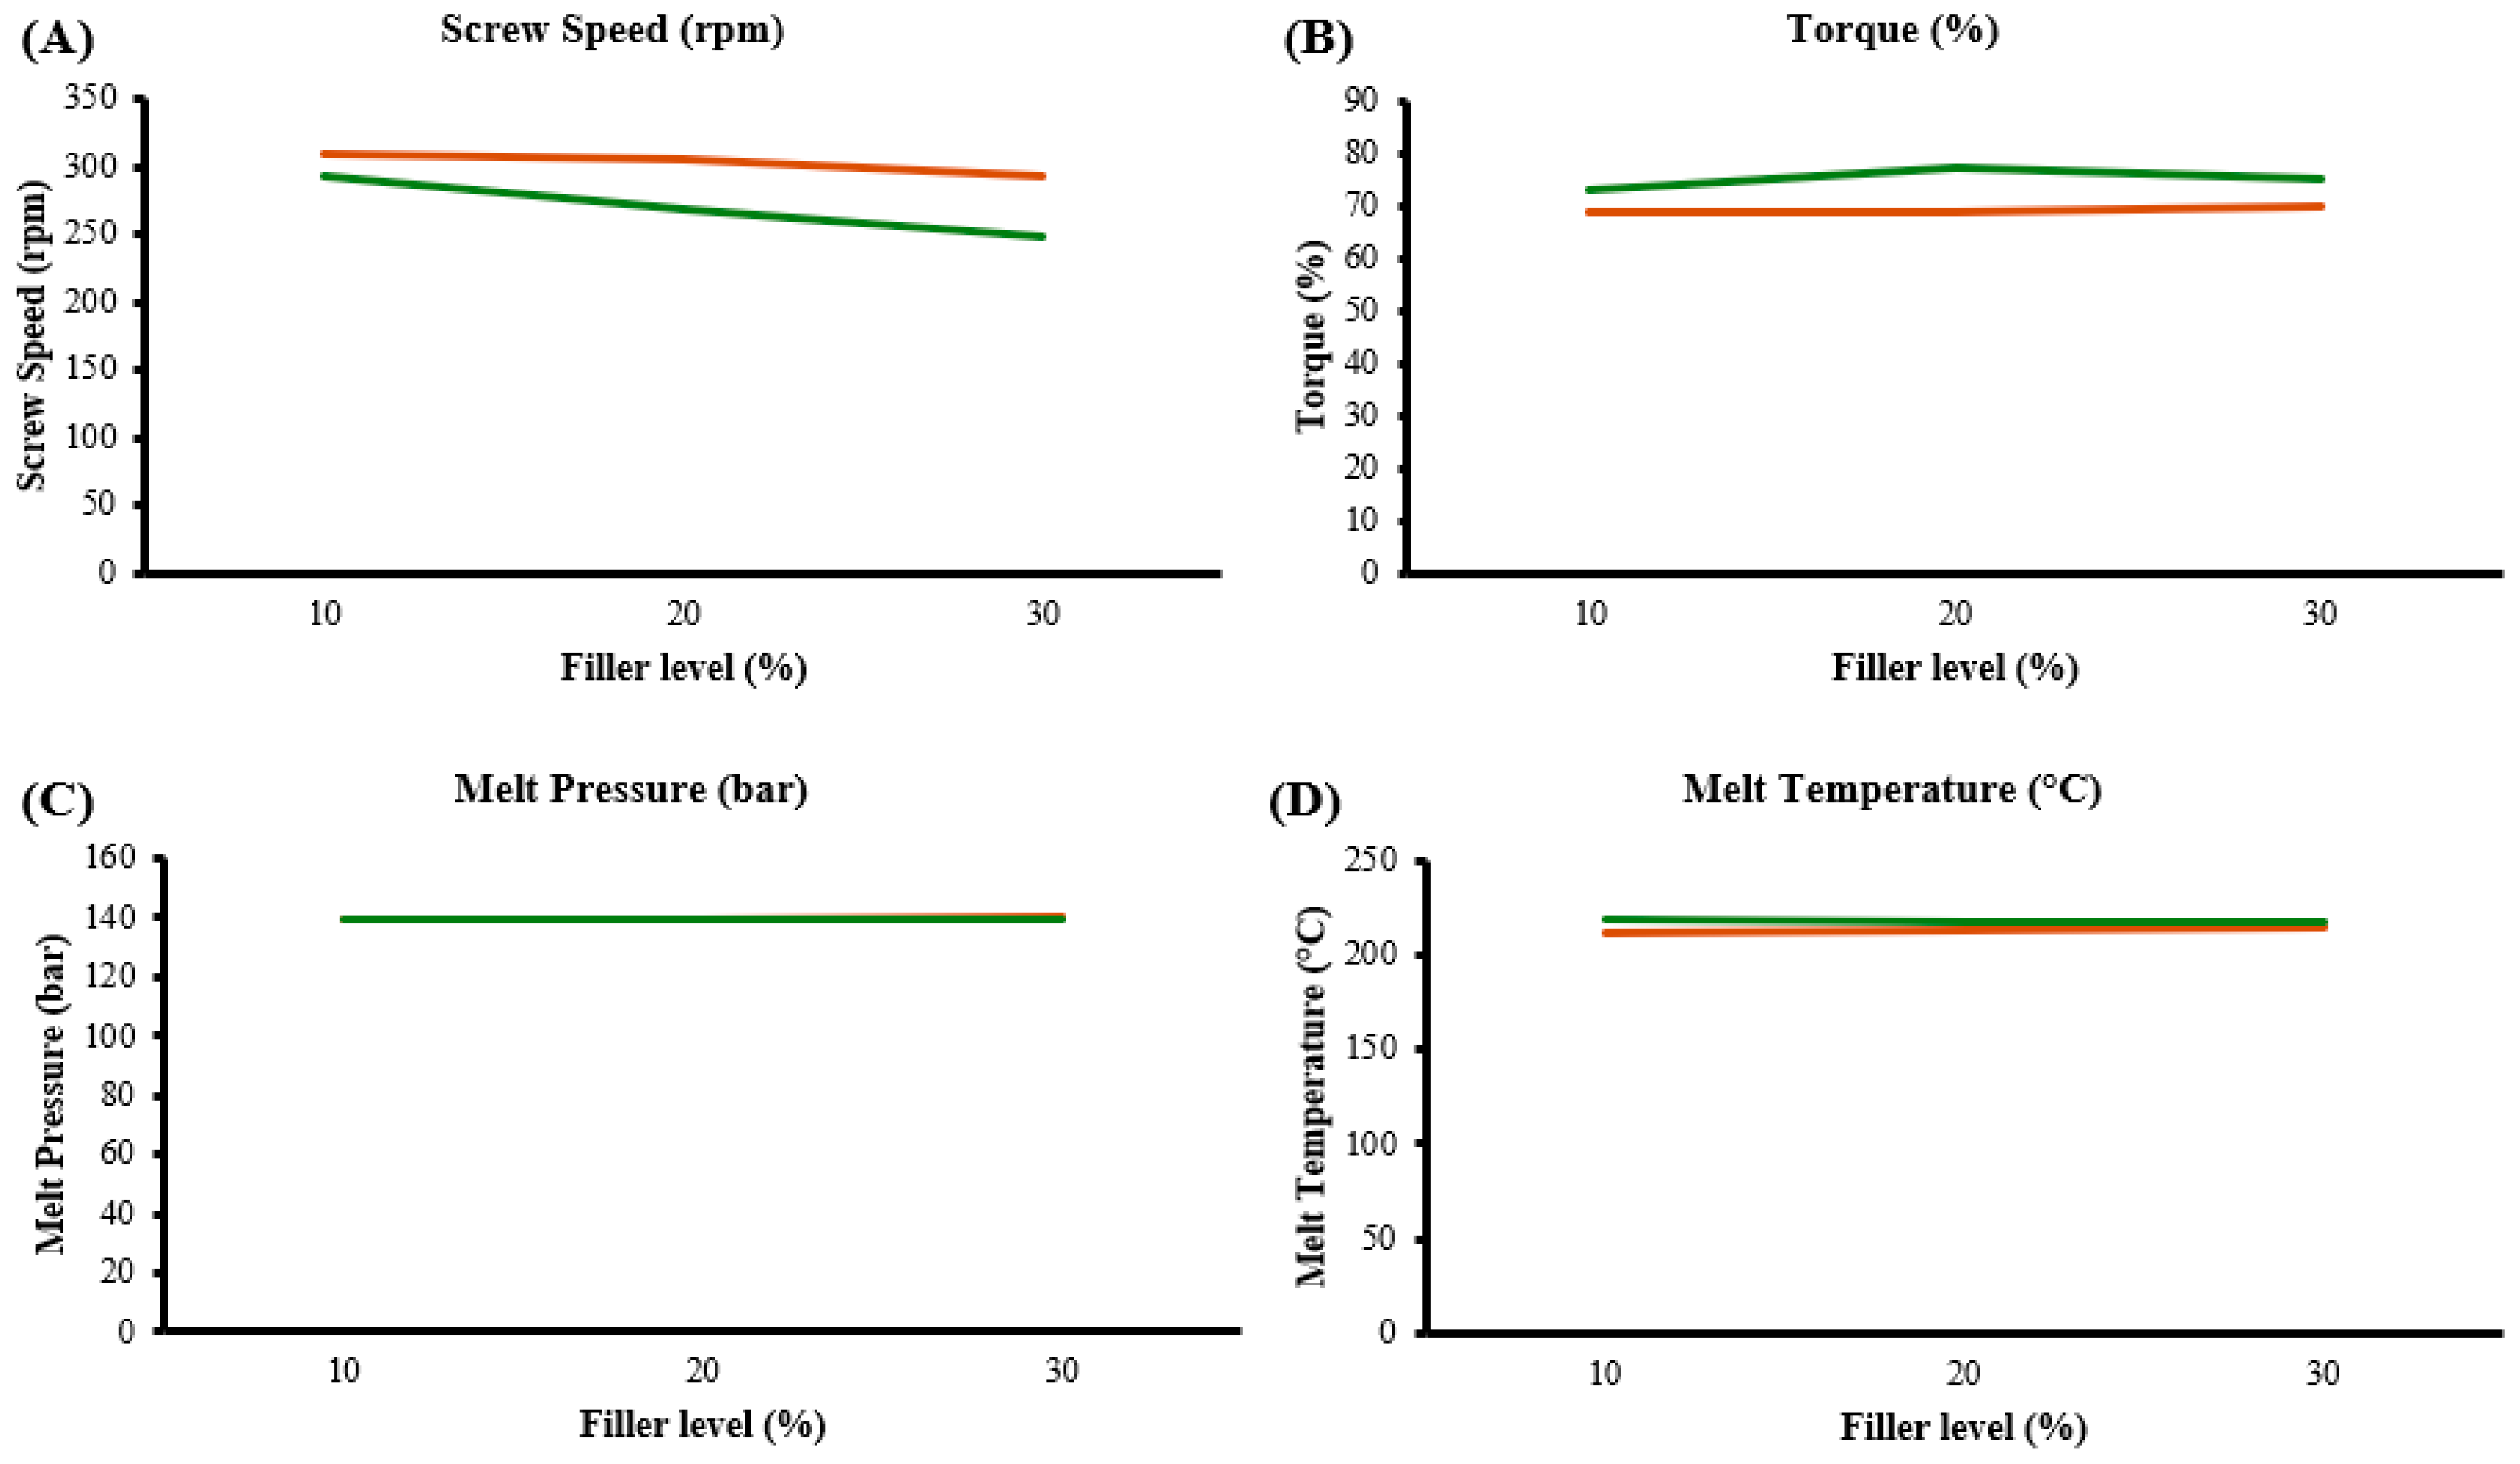
Observations were noted throughout the extrusion trials. These included the screw speed, machine torque, melt pressure at the die and polymer melt temperature. The data recorded from the compounding trials were graphically represented and can be seen in Figure 3. All graphs show the average value obtained throughout each filler level of both BaSO4 (orange) and BiOCl (green). While the BaSO4 remained most consistent throughout compounding, there were no issues in processing. During the compounding of both PEBA/BaSO4 and PEBA/BiOCl, it can be seen in Figure 3B that there was an increase in torque as the filler level increased. PEBA/BaSO4 showed a slight increase in torque 69% to 70% torque, while the PEBA/BiOCl display a greater increase, 73% to 77% to 75% torque. It can be seen in Figure 3A that the screw speed was reduced as the filler level increased for each respective filler. It was necessary to reduce the screw speed in an attempt to maintain a consistent torque level. This increase in torque may be due to the addition of polymer and dry filler in the first zone of the extruder. This may put additional pressure on the screws leading to an increase in torque required by the motor to rotate screws. The melted blend may experience; however, it is expected that the viscosity of the composite may reduce due to the shear occurring further in the process. It can be seen in Figure 3C and D that the melt pressure and temperatures were both consistent. Figure 3D show that the melt temperatures in the various PEBA/BaSO4 composites were lower melt temperature than those of PEBA/BiOCl. This may suggest that the BiOCl has a higher thermal conductivity value than BaSO4, where the PEBA/BiOCl composites absorb more heat from the extrusion process. At the highest filler loading level (30 wt.%), the melt temperatures of the two formulations were essentially superimposable. It was posited that this was due to the increased volume of BaSO4 in the composition compared to BiOCl. Though both materials were loaded at 30 wt.%, the density of the BaSO4 is 4.5 g/cm3, whereas the BiOCl has a density of 7.8 g/cm3, therefore BaSO4 occupies 42 % more volume in the melt.
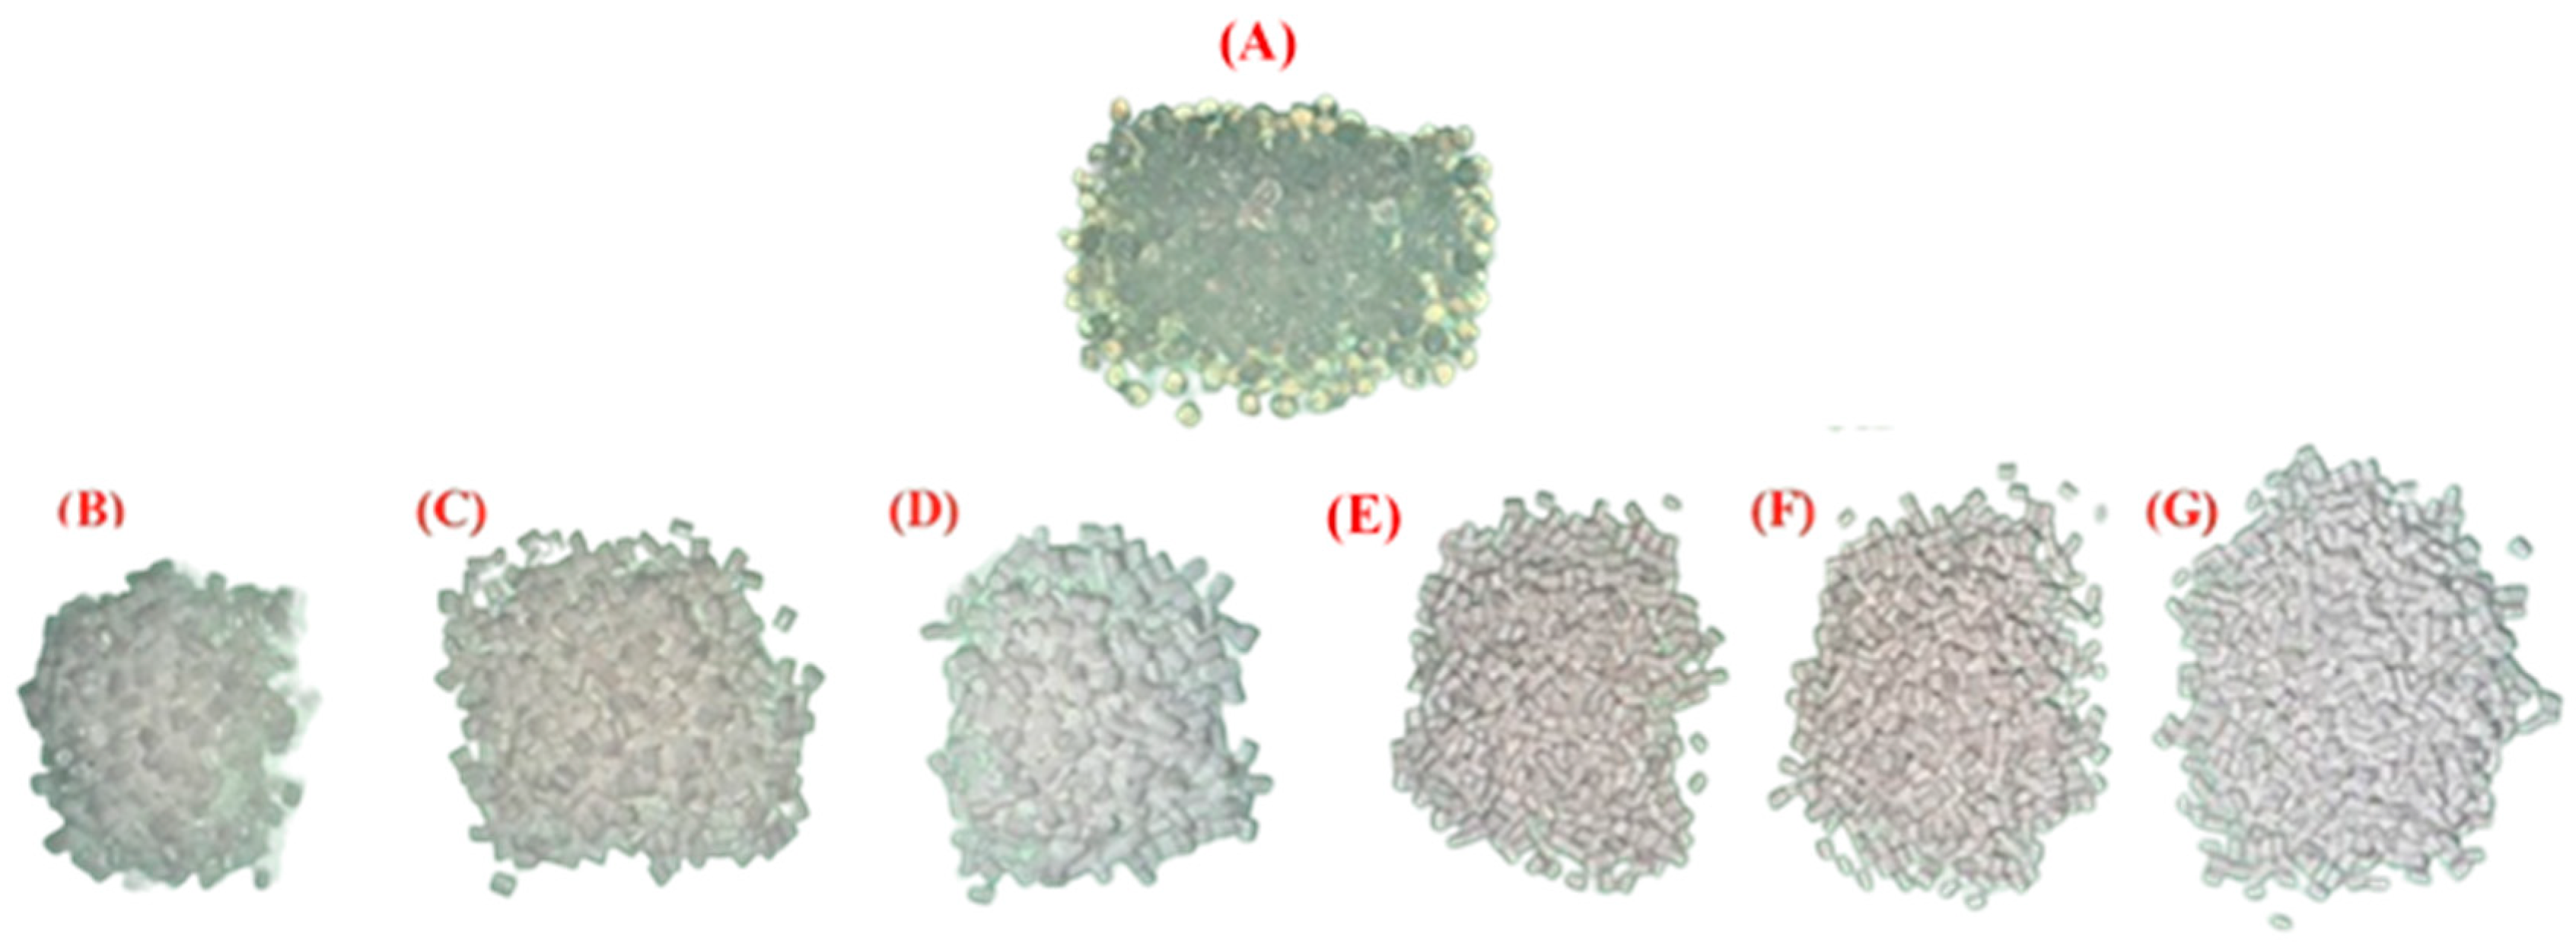
Figure 4 shows the appearance of pellets pre- and post-extrusion, where (A) is the Pebax® SA01 MED, (B), (C) and (D) are PEBA/BaSO4-10, -20 and -30 respectively, while (E), (F) and (G) are PEBA/BiOCl-10, -20 and -30 respectively. The ‘whiteness’ of the composites is obvious from the image. While it is clear that both PEBA/BaSO4 and PEBA/BiOCl obtain a deeper white colour as the filler level increases, the PEBA/BiOCl has a more pronounced white colour. It is evident that at the lower loading levels, the PEBA/BaSO4 composites are much more translucent than the lower loadings of PEBA/BiOCl. Both the PEBA/BaSO4-30 and PEBA/BiOCl-30 displayed a brilliant white colour, however, the PEBA/BiOCl-30 displays a somewhat yellow hue.

3.1.2. Injection Moulding

Similar to the extrusion trials, there were a number of observations made during the injection moulding trials. Two parameters of interest during injection moulding were melt cushion and plasticising time. Figure 16 depicts the average values obtained from the injection moulding trials, with Figure 16A displaying the average melt cushion and Figure 16B the average plasticising time. It can be seen that the trends are similar between the PEBA/BaSO4 and PEBA/BiOCl, where there is a clear increase in the melt cushion as the filler addition level increases for both PEBA/BaSO4 and PEBA/BiOCl. In relation to the plasticising time for the various filler levels of PEBA/BaSO4 and PEBA/BiOCl composites, it was clear that as the loading increased, there was a reduction in plasticising time. This may be as a result of the reduction in viscosity, which is a major variable in the plasticising time in injection moulding [25]. An observation was made, whereby, as the filler content increase, so too did the melt flow index. This may have been due to the shear in the extrusion process, but the viscosity was reduced. In relation to the melt cushion, as materials with higher densities have less compressibility, a smaller volume of melt cushion would be required to maintain consistent pressure in the mould to obtain dimensionally stable components. In contrast to this, with shear in the extrusion processes prior to injection moulding, the molecular weight of the various composites is expected to have reduced, which leads to a lower viscosity, therefore requiring a larger melt cushion to provide more control during the packing phase. It was observed that initially, at the lower loading levels of inorganic filler for both PEBA/BaSO4 and PEBA/BiOCl composites, the melt cushion had dropped, but increased again as the filler loading within the composites increased. It could be said that due to the increase in the melt density as the filler content increases, the melt cushion increases to compensate for the loss in volume of the composite at higher filler loading. The standard deviation of each of the process parameters explains a lot about the behaviour of the material. Consistency, or low standard deviation, shows that the material is consistent, with little variation throughout. The consistency of the melt cushion and plasticising times for each of the composites was crucial in evaluating the dispersion of the filler throughout the respective polymer matrix. Without consistency in the process, this would signify a lack of consistency in the composites themselves.
Figure 5. Injection moulding observations, (A) average melt cushion, (B) average plasticising time; Pebax® 6333 SA01 MED (blue), BaSO4 filled Pebax® 6333 SA01 MED (orange), BiOCl filled Pebax® 6333 SA01 MED (green).
Preprints 117602 g005

3.2. Mechanical Properties

3.2.1. Tensile Properties

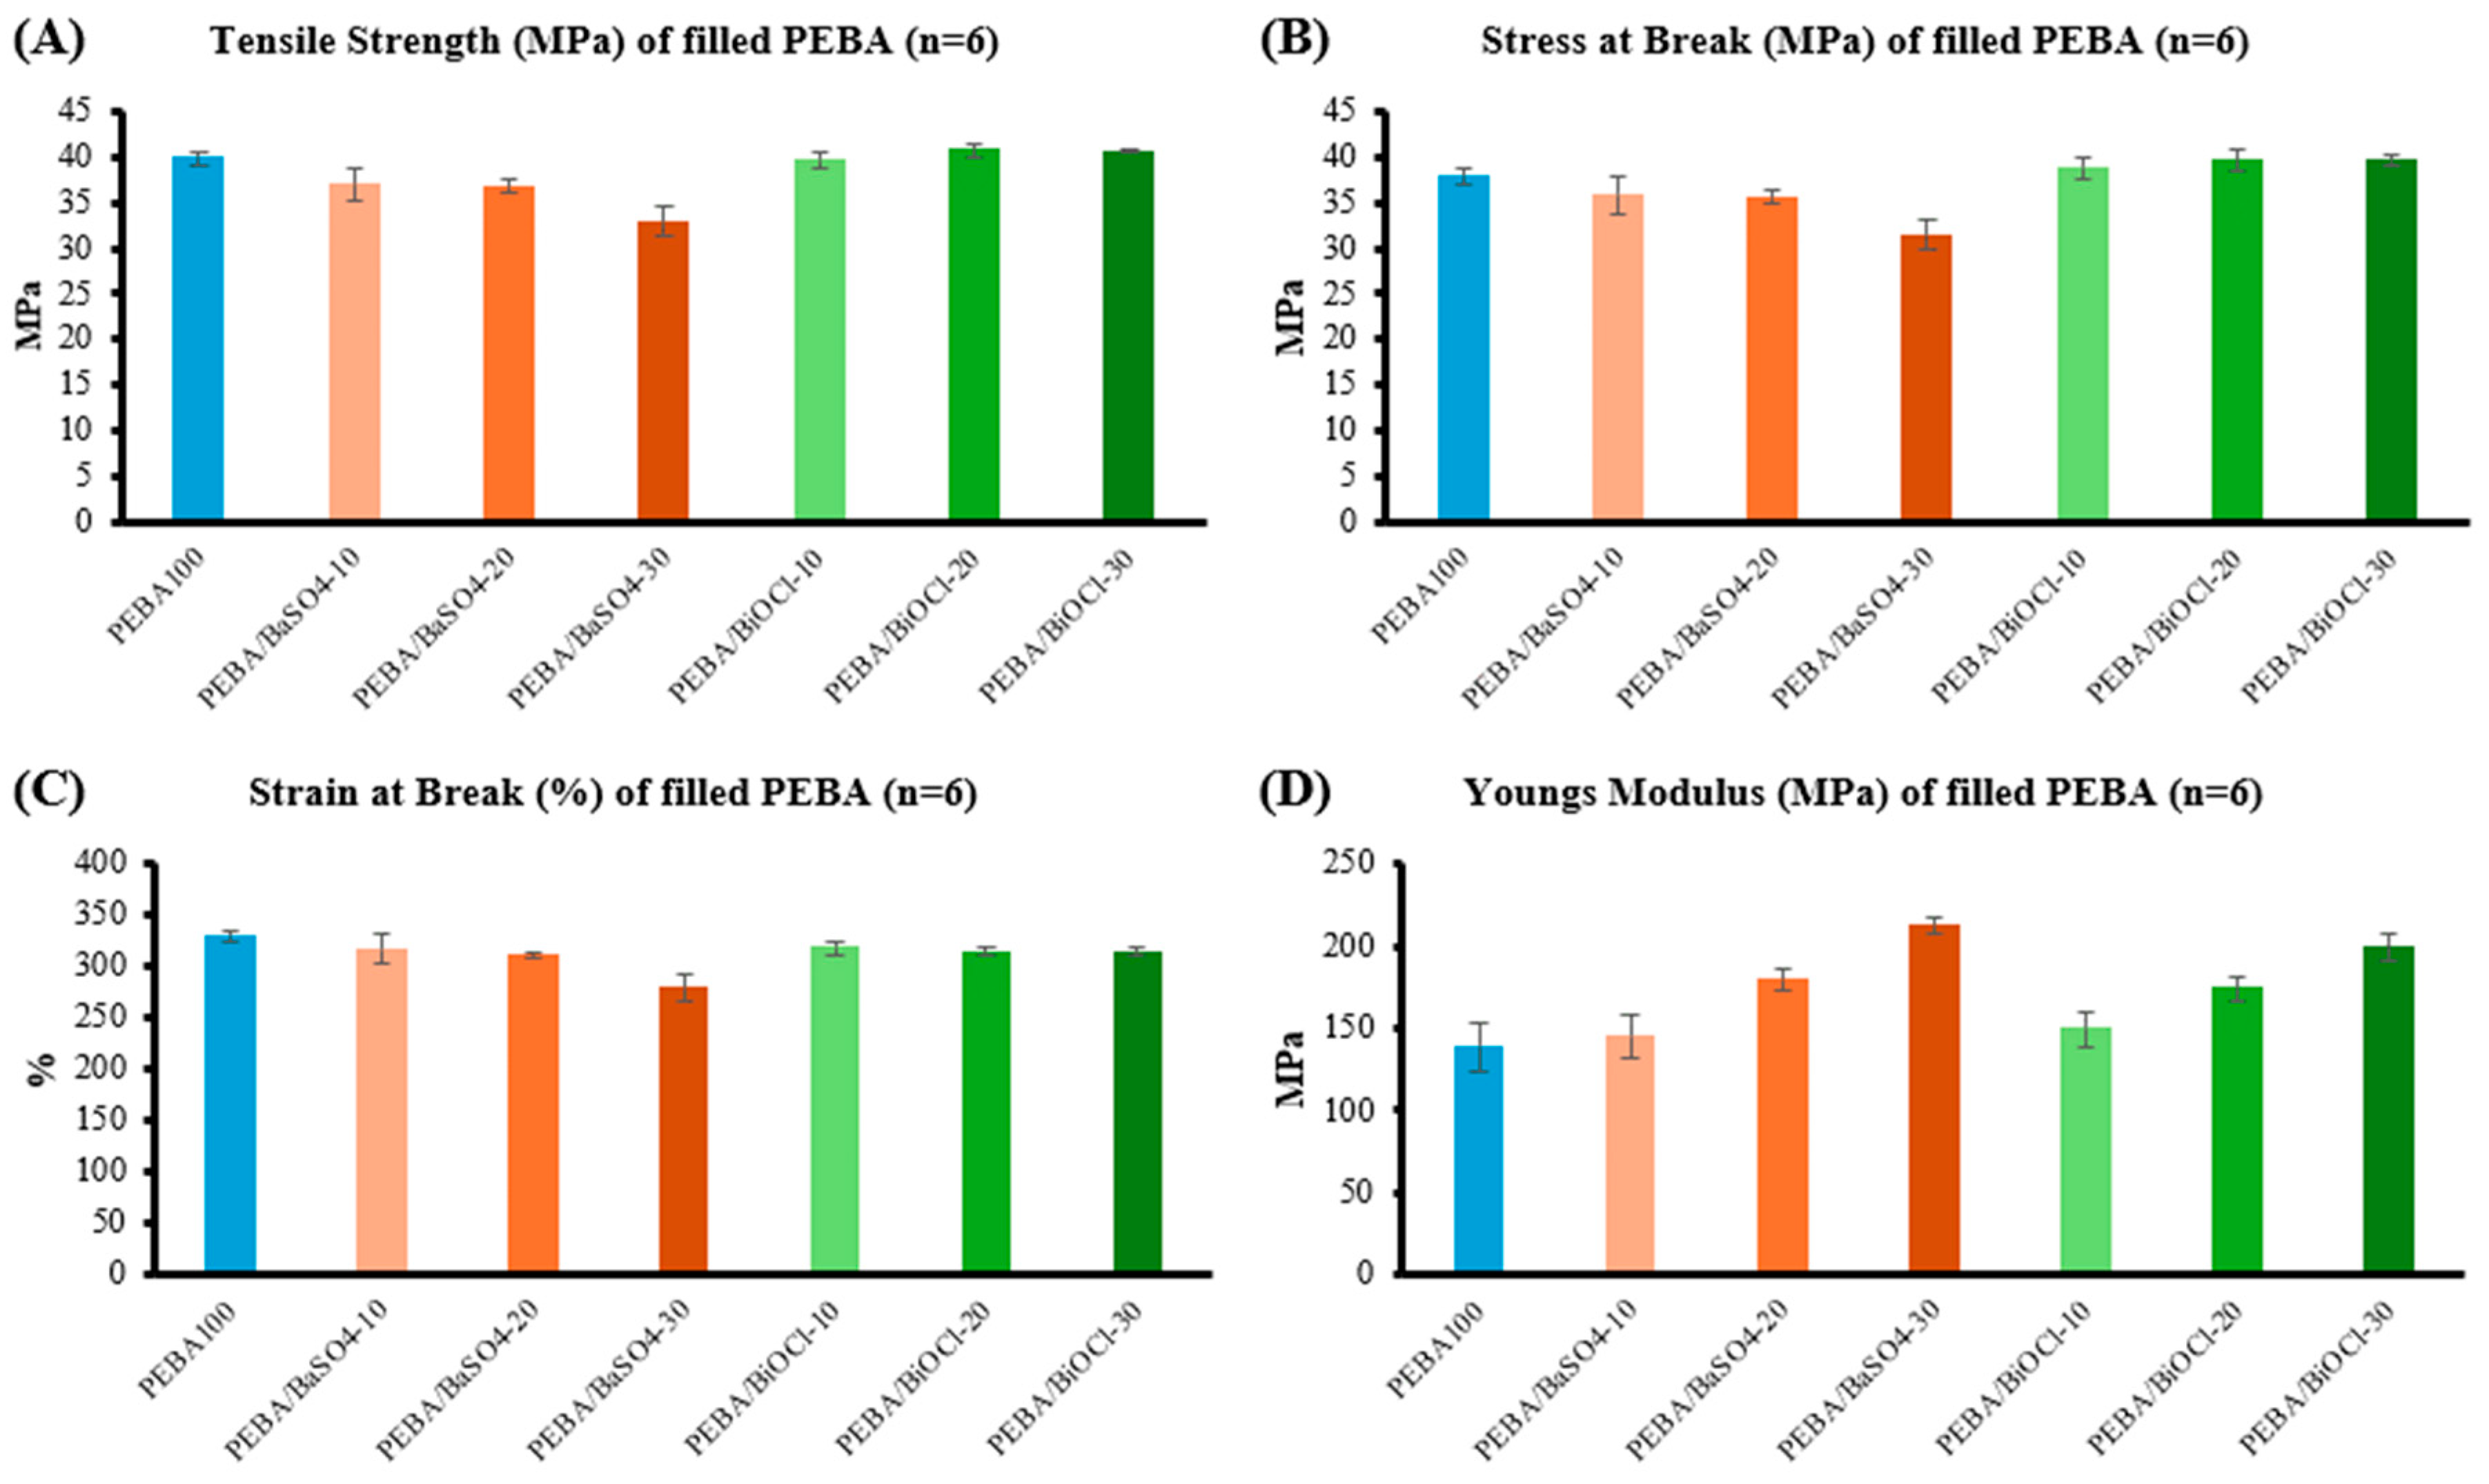
There are multiple factors that may influence the tensile properties of a polymer or polymer composite. Bayazian & Schoeppner found that when processing a polymer using extrusion technology, the shear and other stresses that occur in the process causes chain scission to occur, reducing the molecular weight of the polymer [26]. This reduction in molecular weight can cause the mechanical properties of the polymer to be reduced. Another factor that plays a major role in the mechanical properties of polymer composites is a phenomenon known as nucleation. With the incorporation of micro (>1 µm) or nano (1-100 nm) particles into a polymer matrix, it is not uncommon to see an increase in the degree of crystallinity of the polymer due to a nucleating affect brought on by the filler. This can lead to an enhancement of the tensile properties of the polymer due to improved organisation of lamellar crystals. Composite strength and toughness are very much dependent on the adhesion quality, the particle size and the loading levels in the polymer [27]. Figure 6 displays the tensile properties of the various PEBA/BaSO4 and PEBA/BiOCl composites in comparison to the Pebax® 6333 SA01 MED (PEBA100).
It is clear that the PEBA/BiOCl composites outperform the PEBA/BaSO4 composites in all tensile properties at the respective filler loading. It is, however, noted that the PEBA100 performs exceptionally well, almost outperforming the composites in all tensile properties. Figure 6A displays the tensile strengths of the PEBA100 and the various PEBA/BaSO4 and PEBA/BiOCl composites. A 7% reduction was observed in the tensile strength of PEBA/BaSO4-10 (36.95 MPa) when compared to PEBA100 (39.78 MPa), however, there was only a 0.3 % reduction in tensile strength of the PEBA/BiOCl-10 (39.67 MPa) when compared to the PEBA100. These reductions in tensile strength were also observed by Mahdi & Dean when analysing the tensile behaviours of PP/cotton fibre (CF) composites [28]. It was found that as the filler loading increased from 0 wt.% to 50 wt.% in increments of 10 wt.%, the tensile strength of the composite displayed a reduction in each step. This reduction in tensile strength from PEBA100 to filled PEBA composites may be as a result of the reduction in molecular weight post-processing, but also due to the decreased crystallinity in the composites and poor interfacial adhesion between filler and polymer. As for the lesser reduction of strength in the PEBA/BiOCl composite in contrast to the PEBA/BaSO4 filled, this may be as a result of the volume % of filler in the polymer matrix. As the BiOCl is almost twice as dense as the BaSO4, the volume of filler in the polymer is less in the PEBA/BiOCl composites, potentially leading to lesser reduction of strength. When comparing the lowest filler loading for each of the inorganic fillers, it is apparent that the PEBA/BaSO4 suffers more so with greater loading than PEBA/BiOCl. An 11% reduction of tensile strength was observed in PEBA/BaSO4-30 (32.88 MPa) when compared to PEBA/BaSO4-10. In stark contrast, PEBA/BiOCl-30 only experienced a 2% reduction in tensile strength when compared to PEBA/BiOCl-10. This could again be associated with the volume of filler in the composite, the potentially excessive loading of BaSO4 yields a greater reduction in strength of the composite. Upon reviewing the stress at break of the PEBA100 and various fillers in Figure 6B, it can be seen that the trend is similar to that of the tensile strength. While there was an observed reduction in stress at break of 5.5% for PEBA/BaSO4-10 (35.74 MPa) when compared to PEBA100 (37.85 MPa), there was a greater reduction in the stress at break value PEBA/BaSO410 to PEBA/BaSO4-30 (31.41 MPa). The PEBA/BaSO4-30 seen a reduction of 12% when compared to PEBA/BaSO4-10, and even an 11.7% reduction when compared PEBA/BaSO4- 20 (35.61 MPa). Similar to the results obtained in the tensile strength of the PEBA/BiOCl composites, an overall improvement in stress at break values was exhibited by the PEBA/BiOCl composites in comparison to the PEBA100, with a 2% improvement of PEBA/BiOCl-10 (38.69 MPa) vs. PEBA100 (37.85 MPa). From there, the PEBA/BiOCl-30 (39.62 MPa) showed an increase over the PEBA/BiOCl-10 of 2.4%. It could be said that with the PEBA/BiOCl, due to the lower volumetric loading of inorganic filler, the polymer elongation or deformation is not impeded as it may be with the higher volume loading of BaSO4.
Figure 6C depicts the results obtained for the strain at break in each of the samples. As the % strain at break is a representation of the maximum change in length from the original length prior to a sharp drop in stress, it is essentially a metric for the ability of the material to deform until it breaks. The PEBA100 (330.35 MPa) outperformed both the PEBA/BaSO4 and PEBA/BiOCl at all addition rates, with a 4 % reduction in strain at break from PEBA100 to PEBA/BaSO4-10 (316.82 MPa), and a 3.7 % reduction when compared to PEBA/BiOCl-10 (318.03 MPa). With the PEBA/BaSO4 composites, there was a 10 % reduction from PEBA/BaSO4-10 to PEBA/BaSO4-30 (279.68 MPa), while in the case of PEBA/BiOCl, there was only a 1 % reduction from PEBA/BiOCl-10 to PEBA/BiOCl-30 (314.79 MPa). When comparing PEBA/BaSO4-30 with the PEBA/BiOCl-30, the PEBA/BiOCl outperforms the PEBA/BaSO4 by 10 %. When reviewing the reduction in strain at break for PEBA100 to the higher filler loaded composites, it is apparent that the PEBA100 behaves much better in relation to deformation that the PEBA/BaSO4 than that of the PEBA/BiOCl. The PEBA/BaSO4-30 sample experienced a significant reduction in strain at break, with a decrease of 15 % when compared to PEBA100. In contrast, the PEBA/BiOCl-30 composite only exhibited a 4.7 % reduction when compared to PEBA100. This may be as a result of the excessive volume of BaSO4 in the polymer leading to an increase in the brittleness of the composite. The Young’s modulus of the samples is a representation of the ease of deformation or ability of a material to bend. It is a measurement of a materials stiffness, where a high Young’s modulus indicates a stiff material.
Figure 6D displays the results from the Young’s modulus of the samples. It can be seen that PEBA100 and the composites with the lowest loading level of inorganic filler offer the lowest Young’s modulus. This shows that with no filler, or low levels of filler, the polymer has the ability to deform, showing low stiffness when compared to the higher loading of fillers. While the difference between the 10 wt.% filled composites is miniscule in comparison to PEBA100, the PEBA/BaSO4-30 composite exhibits a 25 % increase in Young’s modulus, while the PEBA/BiOCl-30 exhibits a 30 % increase. A similar trend was observed by Mahdi & Dean upon analysis of the Young’s modulus of PP/CF composites. It was observed that as the filler content (wt.%) increased, so too did the Young’s modulus [28]. The difference between PEBA/BaSO4-30 and PEBA/BiOCl-30 respective composites is 6 %, where the PEBA/BaSO4 exhibits a greater Young’s modulus. This depicts the PEBA/BaSO4 as a stiffer composite due to its reduced ability to deform as exerted stress increases on the sample. The cause of this increase in stiffness of the PEBA/BaSO4 composites with respect to the PEBA/BiOCl may be due to the excessive volume of filler. Salmah, et al., had similar findings when analysing the Young’s modulus of palm kernel shell filled LDPE. It was found that as the filler level increased, so too did the Young’s modulus [29]. It could be seen that the addition of both inorganic fillers at the various loading levels leads to changes in the polymer’s tensile behaviour. While there was no significant change in the tensile properties between PEBA100 and the PEBA/BaSO4-10 and PEBA/BiOCl-10 composites, there were changes in the composites as the filler level increased. It was clear that as the loading levels of PEBA/BaSO4 increased, there were greater reductions in tensile strength, stress at break and strain at break than those observed within the PEBA/BiOCl composites. The PEBA/BiOCl composites appear to have performed better than the PEBA/BaSO4 at the various loading levels, with less variation in properties between filler contents. While the PEBA/BiOCl experience minimal increase in tensile strength from 10 wt.% to 30 wt.% filler content, 2.4 %, the PEBA/BaSO4 composites experienced a large shift of 11 %. The PEBA/BaSO4 composites seen a large shift in Young’s modulus with the increase from 10 wt.% to 30 wt.%, an increase of 32 %, while the PEBA/BiOCl seen a 25 % increase in Young’s modulus with a filler content increased from 10 wt.% to 30 wt.%. This shows that with the increase in filler content of both PEBA/BaSO4 and PEBA/BiOCl, the respective composites experience a significant increase in stiffness. As mentioned by Shah, as the barium content moves beyond about 20 % by volume, composites begin to show losses of the base polymer's tensile strength and other mechanical properties [30]. This is the equivalent to > 40 wt.% BaSO4 in the composite, which experiences a significant reduction in properties compared to the other composites.

3.2.2. Flexural Properties

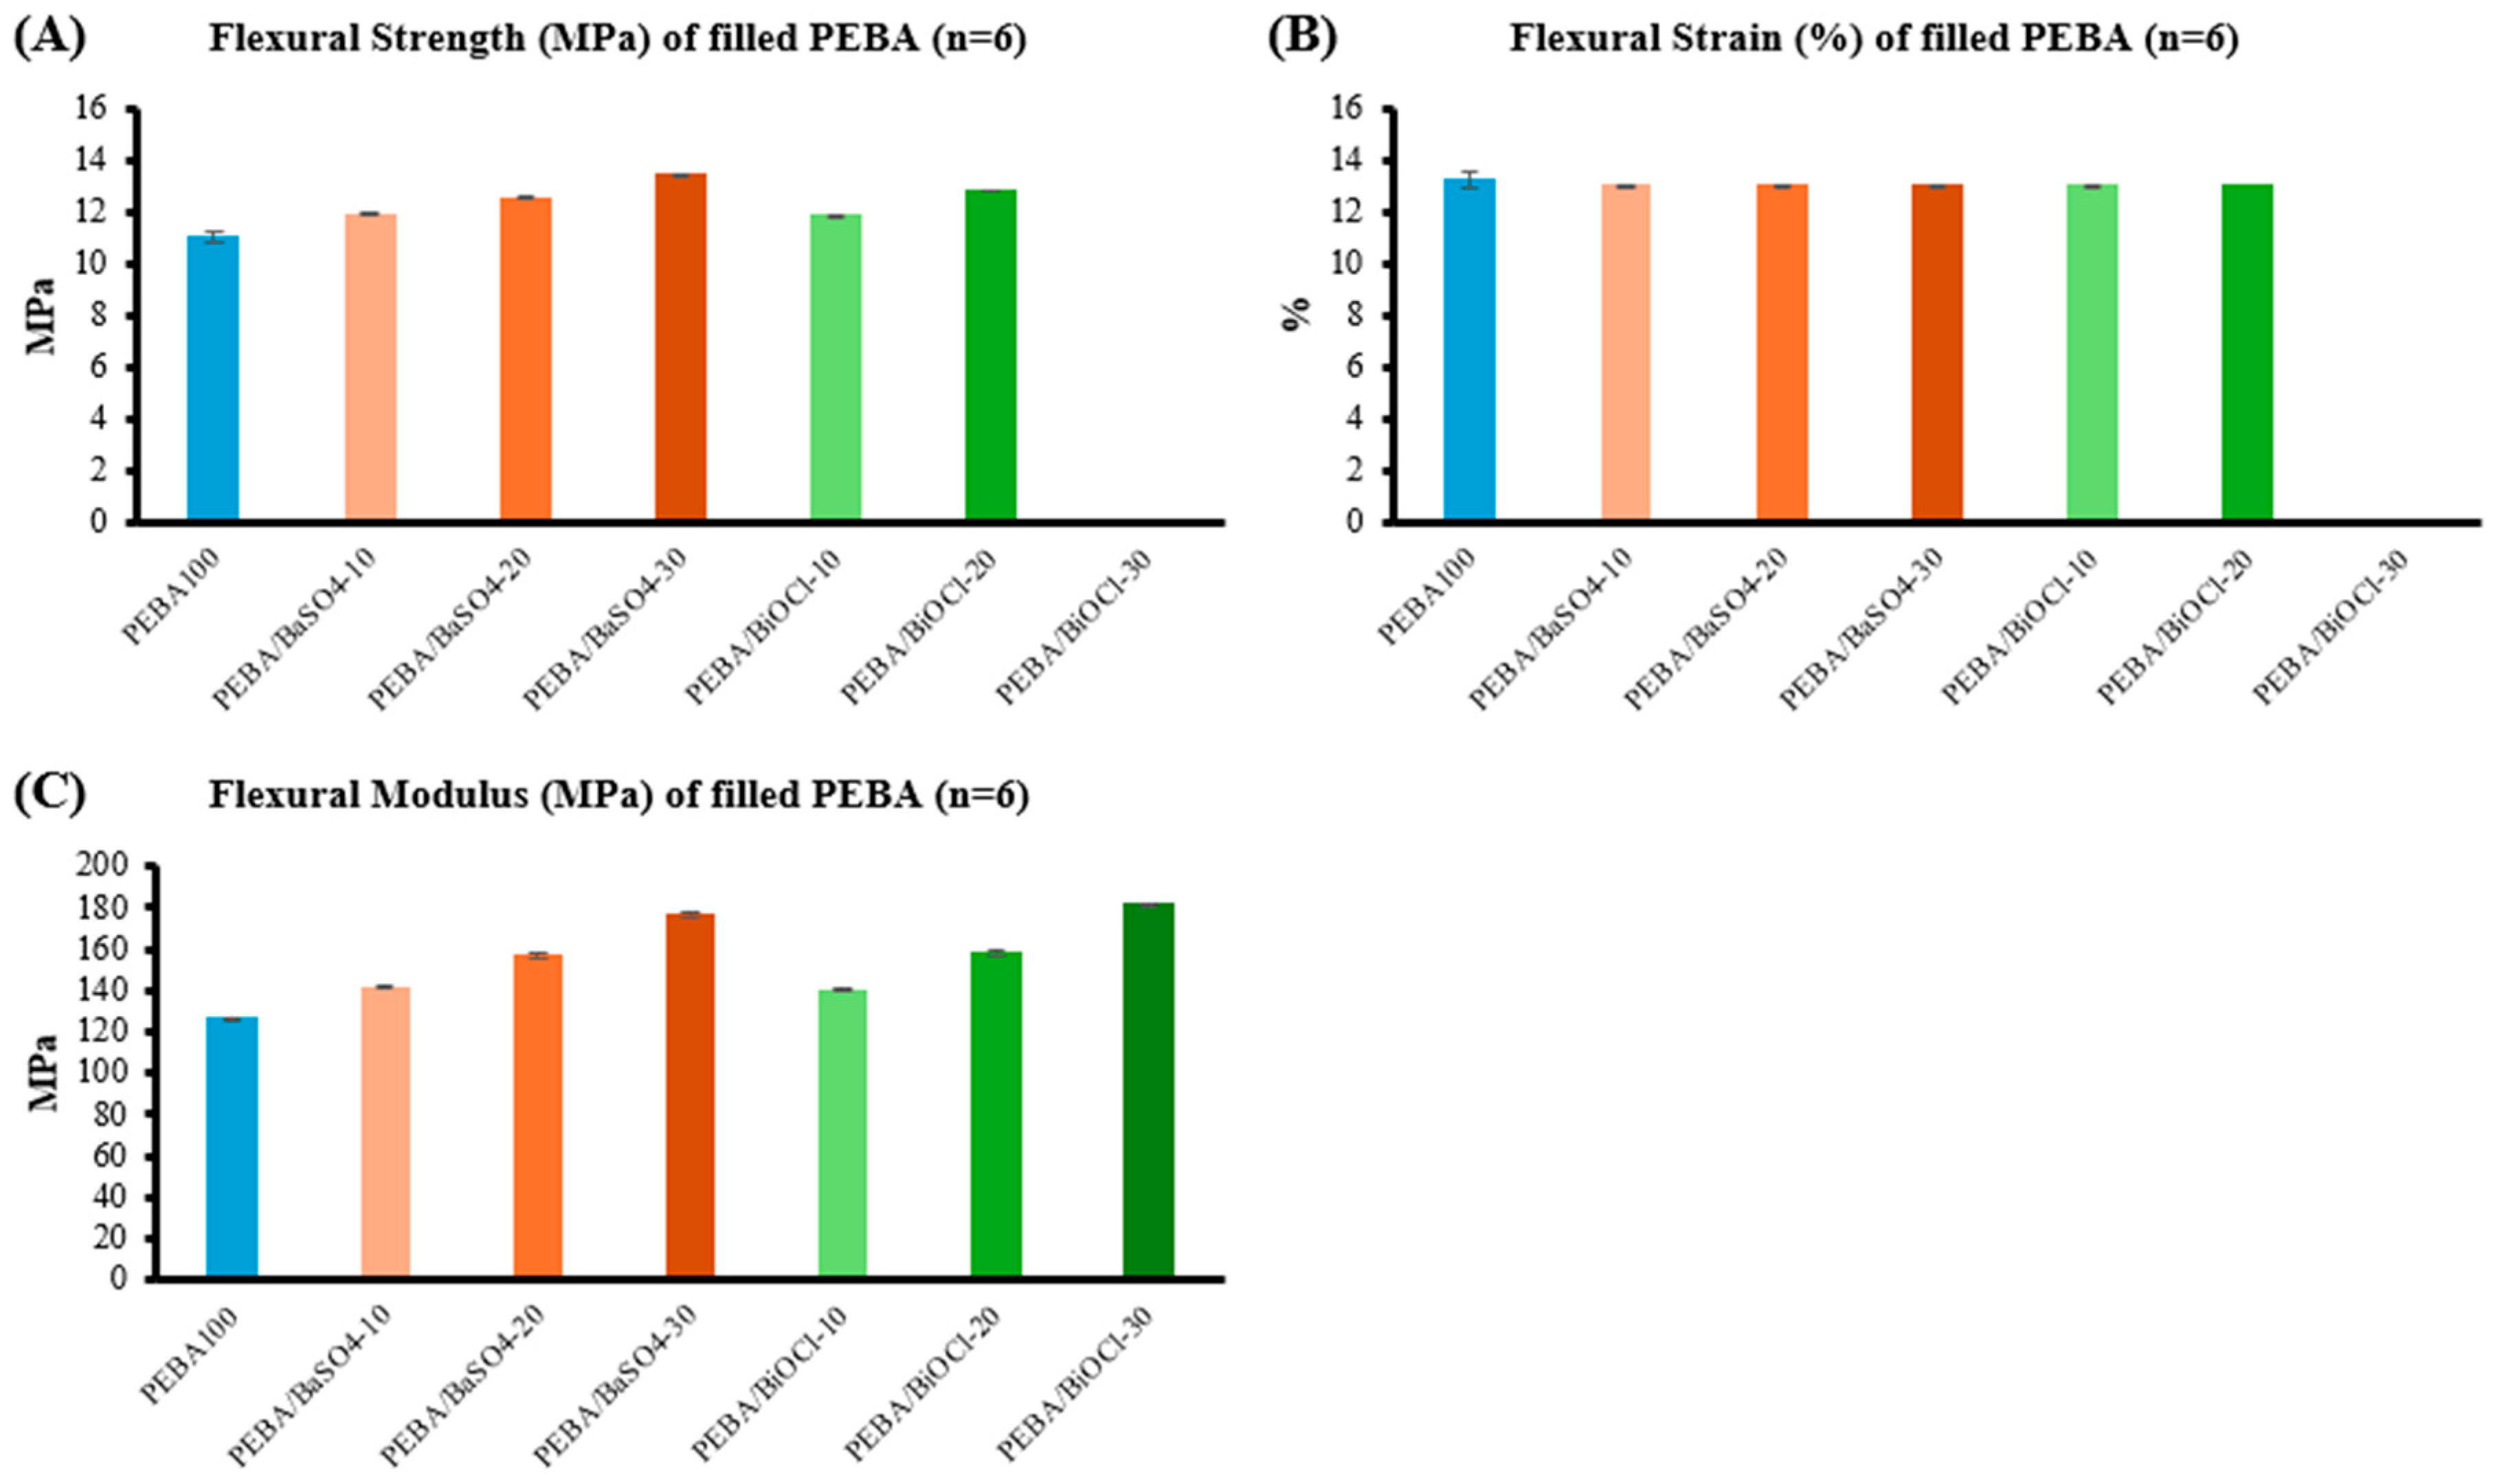
The flexural behaviour is similar to the tensile behaviour of a material, but rather than the resistance to stretching as is the case with tensile, the flexural behaviour of a material is a measure of its resistance to bending deformation. This measurement of stiffness provides in depth knowledge about a material and how it behaves when a simple beam load is exerted upon the material and can be comparable to the stiffness observed in the Young’s modulus. Figure 7 displays the various flexural properties of PEBA100 and the PEBA/BaSO4 and PEBA/BiOCl composites.
It can be seen from the graphs that the composites perform very well in comparison to the polymer, and in the case of flexural strength and modulus, there is a noticeable trend whereby the higher the loading of inorganic filler, the greater the measured values. There were, however, virtually no changes in the flexural strain when the composites are compared to PEBA100. One noteworthy result from the flexural testing was that there was no measurable data obtained for the PEBA/BiOCl-30 in relation to flexural strength and flexural strain. In Figure 7A, the values for flexural strength of PEBA100 and composites can be seen. It is clear in the graph that the composites outperform PEBA100 at all loadings of filler. This is a contrast to the tensile strength of the composites, which explains that the addition of filler provides stiffness to the composites, reducing the flexing that occurs in the samples. There was an observed 7.3 % increase in the flexural strength PEBA/BaSO4 -10 (11.93 MPa) when compared to PEBA100 (11.06 MPa), and a 7 % increase in flexural strength of the PEBA/BiOCl (11.89 MPa) when compared to the PEBA100 (11.06 MPa). This clearly demonstrates the enhancement of the stiffness of the polymer composites with the incorporation of inorganic filler, even at the lowest addition level. There was an 11.4 % increase in the flexural strength from PEBA/BaSO4-10 (11.93 MPa) to PEBA/BaSO4-30 (13.47 MPa), demonstrating greater stiffness with the added volume of filler. A similar trend was observed from PEBA/BiOCl-10 (11.89 MPa) to PEBA/BiOCl-30 (12.85 MPa), where no measured data was obtained for the PEBA/BiOCl-30 for comparison. There was minimal difference between the PEBA/BaSO4 and PEBA/BiOCl at the respective filler loading, with a difference of 0.3 % in favour of the PEBA/BaSO4.
Figure 7B shows the flexural strain values obtained from the flexural test for PEBA100 and composites. This metric evaluates how much a material can bend, changing its length from the original before failure. The graph clearly shows that there has been virtually no change in the flexural strain across all tested samples. Across all samples tested with measured data, a minimum of 0.05 % to a maximum of 1.9 % difference was observed between all samples, PEBA100 and composites (13.028 – 13.281 % strain). It is clear from this that the polymer, irrespective of filler content, behaves the same in relation to its change in the length due to the applied load. This shows that, although as previously indicated, the material becomes stiffer with the incorporation of filler into the polymer matrix, the samples still deform in a similar manner as without filler, showing that the polymer retains its inherent flexibility. The results for the highest loading of PEBA/BiOCL-30 were inconclusive as there was no measured data for this composite.
The flexural moduli of the samples can be seen in Figure 7C. The flexural modulus of a material explains how much stress is required to bend or deform the material. More stress required, means that the material is stiffer. The results obtained from the flexural testing on the flexural strength confirm the Young’s moduli of the various samples obtained during tensile testing. It can be seen that as the filler content increases in the composites, the materials become much stiffer. When comparing PEBA100 (126.05 MPa) with the PEBA/BaSO4-10 (141.5 MPa), there was a 10.9 % increase in the flexural modulus with the incorporation of BaSO4. There was less of a difference when compared to the PEBA/BiOCl-10 (140.01 MPa), where the observed difference in flexural modulus was 9.97 %. However, in contrast, at the higher loadings of filler in the composites, the PEBA/BiOCl-20 (158.36 MPa) displayed a 0.98 % increase in flexural modulus vs. PEBA/BaSO4-20 (156.82 MPa). Similarly, the PEBA/BiOCl30 (181.35 MPa) displayed a 2.87 % increase in flexural modulus vs. PEBA/BaSO4-30 (176.13 MPa). While the differences in flexural moduli are miniscule when comparing the composites to the polymer, it is seen that the PEBA/BiOCl composite stiffer at the higher loading than the PEBA/BaSO4. It is clear that with the addition of inorganic filler to the polymer matrix, the composites become much stiffer. This is exemplified by the tensile strength and Young’s modulus, but also by the values of the flexural strength and modulus. As seen with the flexural strength, as the filler level increased, so too did the flexural strength. Bociong, et al. made similar observations, whereby at 40 wt.% silanized silica filled dental resin, the flexural strength increased. However, as the filler loading increased further, there was a noticeable reduction in flexural strength [31]. This can be associated with the higher volume of filler in the matrix creating a lack of interfacial adhesion between filler and polymer, causing weak areas around the filler. Zabihzadeh et al. evaluated the flexural behaviour of LLDPE/rapeseed composites at loadings levels of 30 wt.%, 45 wt.% and 60 wt.%. At these higher loadings, it was clear that there was a reduction of flexural strength as the filler content increased, showing that as the volume of filler increases in the composite, the weak interfacial adhesion between filler and polymer matrix leads to stress concentration around the filler particles [32]. With the flexural modulus, it was clear that as the filler level increased, so too did the modulus, showing enhanced stiffness in the composite. A similar trend was seen by Omidvar, et al. whilst evaluating the flexural behaviour of LLDPE/rapeseed composites at various filler loadings. It was found that as the filler loading increased by weight, so too did the flexural modulus [32].

3.2.3. Impact Strength

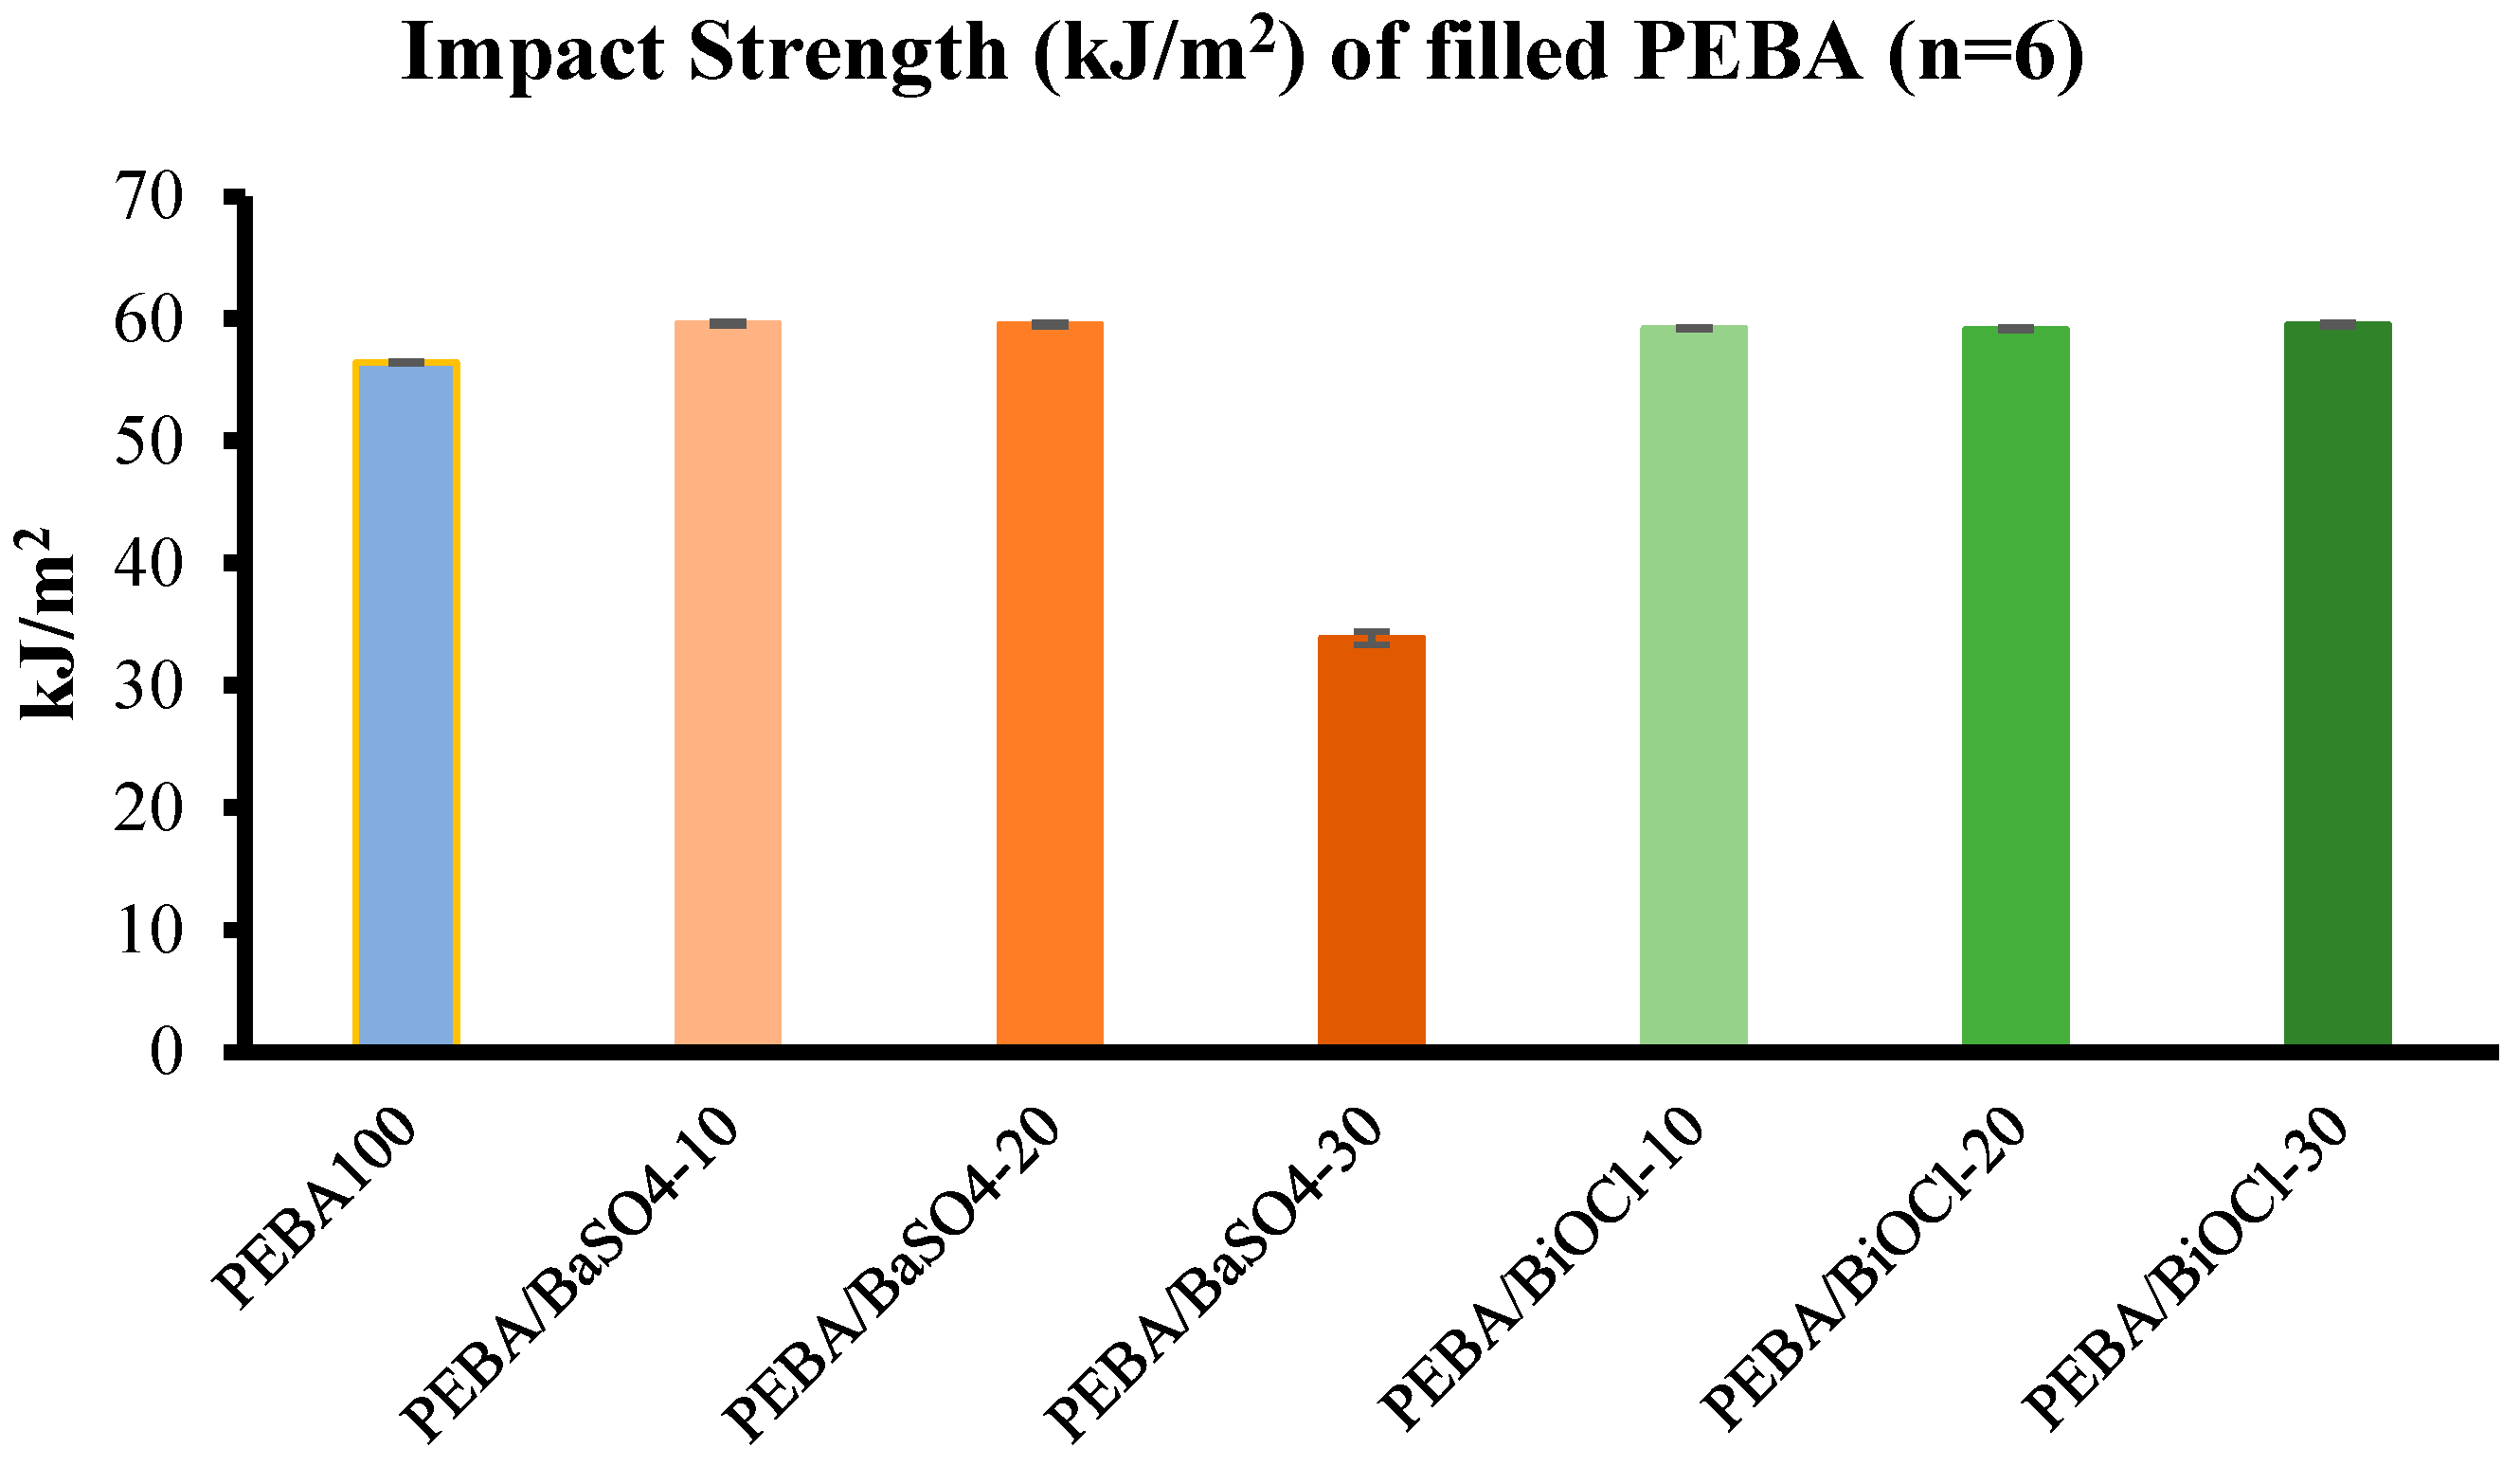
It was important to analyse the effects of incorporating inorganic filler at the various loadings on the impact strength or rigidity of the composites. In order to evaluate this, each sample was subjected to Charpy notched impact testing. The impact values obtained for the PEBA100, and the various composites can be seen in Figure 19. It is clear from the graph that while there is a small increase in the impact strength of the filled PEBA grades (4.7 – 5.33 % increase) in comparison to the PEBA100, there is an observed reduction in impact strength between PEBA100 and PEBA/BaSO4-30. While the incorporation of inorganic filler into the PEBA increases the impact strength, it must be noted that there is a point whereby the addition of filler causes the polymer to become too brittle, leading to catastrophic failure. This was the case for PEBA/BaSO4-30 (33.88 kJ/m2), where the samples broke, requiring much less energy to achieve the break than the energy absorbed by the PEBA/BaSO4-10, PEBA/BaSO4-20 and all PEBA/BiOCl composites. The breakage of PEBA/BaSO4-30 demonstrates the volumetric overloading of inorganic filler, leading to a brittle composite. There was minimal difference between the PEBA/BiOCl composites of various filler loadings, showing that there was no clear reduction in impact strength as the loading increase, contrary to the results obtained for the PEBA/BaSO4-30. A case could be made for the PEBA/BiOCl composites, where due to the higher density of the BiOCl compared. BaSO4, the volume of BiOCl in the PEBA/BiOCl-30 composite does not cross into the brittle point as the PEBA/BaSO4-30 does.
Figure 8. Impact properties of all tested samples (n=6); Pebax® 6333 SA01 MED (blue), BaSO4 filled Pebax® 6333 SA01 MED (orange), BiOCl filled Pebax® 6333 SA01 MED (green).
Preprints 117602 g008
An important factor in the toughness of a polymer composite is the not only the addition level of filler, but also the particle size and particle-matrix interaction. Sreekanth, et al. conducted research on the effects of particle size and filler level on the mechanical properties of TPE composites. It was established that larger particle sizes led to a reduction in the toughness of the composites. Similarly, as the filler content increase, there was a clear reduction in toughness of the composites. It was summarised that the greater the addition of filler, the greater the reduction in elasticity and ability of the composite to absorb energy, reducing the deformability of the polymer matrix [33]. In a similar study, Lakkundi, et al. confirmed the findings of Sreekanth, et al., whereby an increased loading of filler in the polymer caused a weaker interfacial interaction between polymer and filler due to the high loading of filler, leading to a less ductile composite [34].

3.3. Thermal Analysis

3.3.1. Melt Flow Analysis

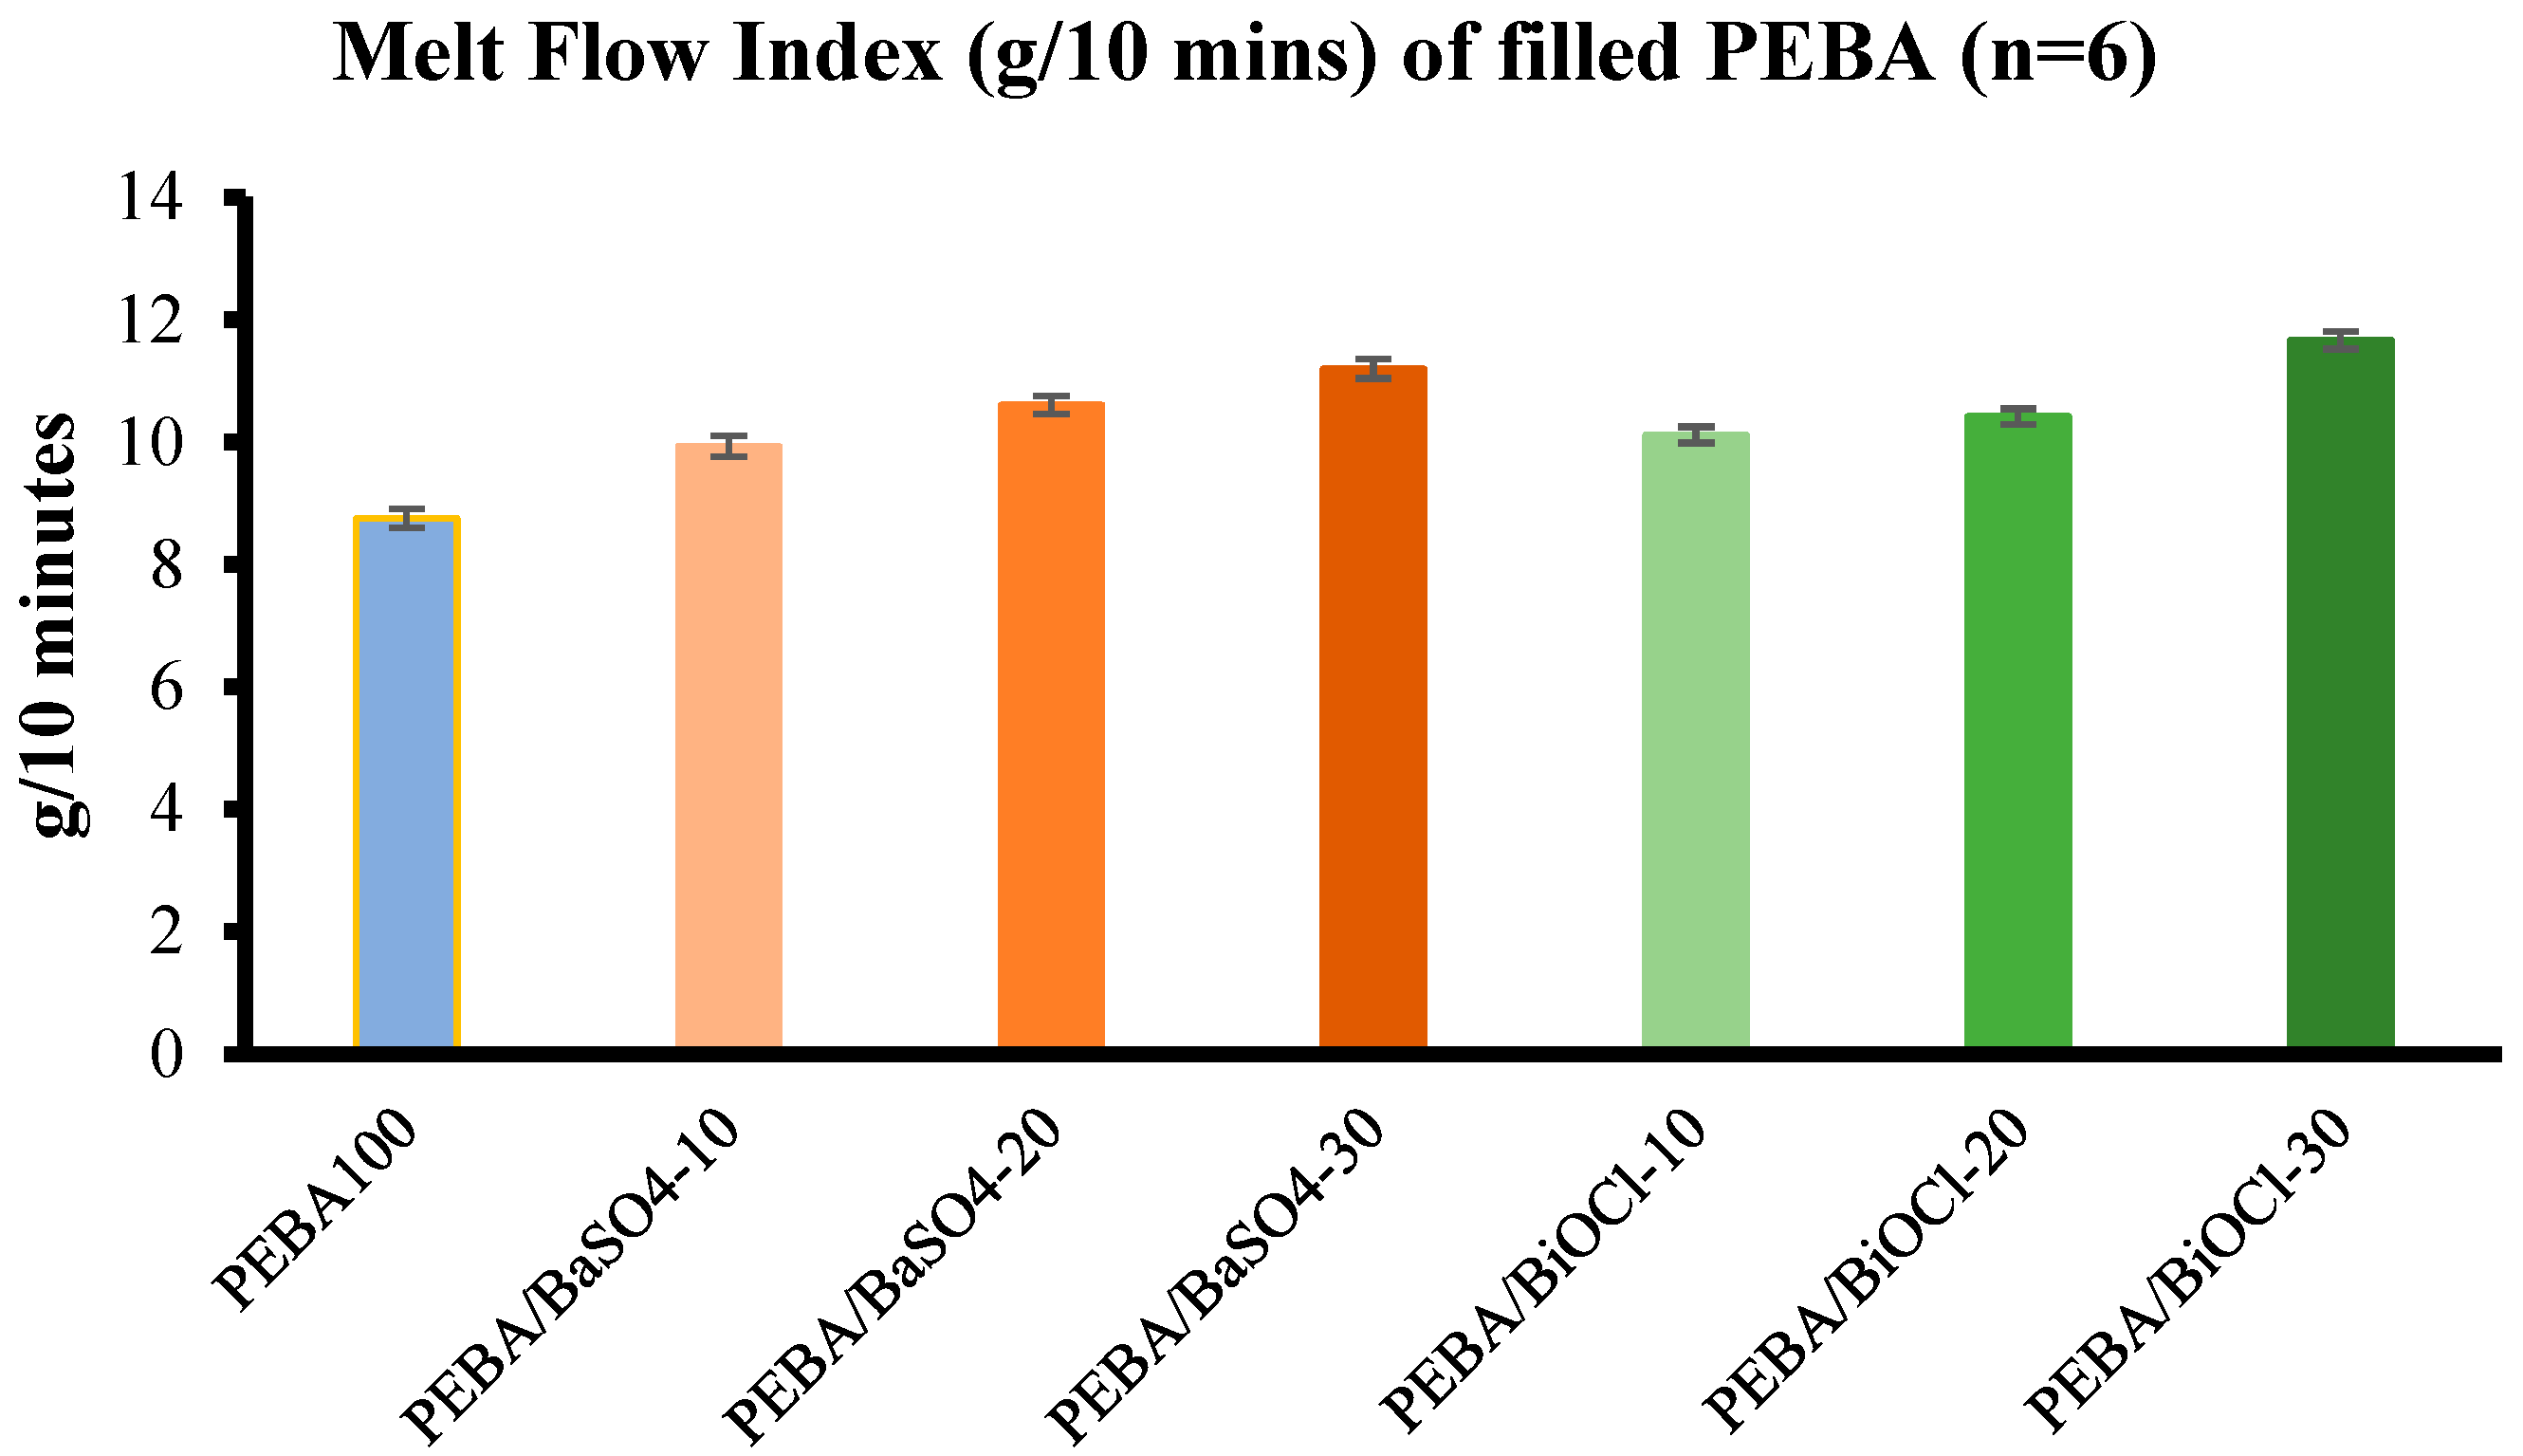
The rheological properties of the polymer and polymer composites are crucial information for processing methods such as injection moulding, and tube extrusion. Figure 9 displays the melt flow index of PEBA100 and the various PEBA/BaSO4 and PEBA/BiOCl composites. It is clear from the graph that irrespective of filler content, the MFI has increased for all composites. This shows that the shear as a result of the twin screw compounding has a more pronounced effect on the flowability of the composites in comparison to the filler content. The increase in melt flow of the PEBA/BaSO4 composites with respect to PEBA100 were 11.9 %, 17.5 % and 21.8 % with the respective increases in filler loading. Similarly, the PEBA/BiOCl composites experienced increases of 13.5 %, 16 % and 25 % with the respective increases in filler loading. There was minimal difference in melt flow between the PEBA/BaSO4 and PEBA/BiOCl composites, showing that the % volume of filler in the composites had minimal impact on the melt flow.
While it may be expected that the composites viscosity would increase with the incorporation of large volumes of filler, this is clearly not always the case. There are other factors that influence the rheological characteristics of the composite. While the addition of fillers into the polymer matrix may enhance certain properties of the polymer, the rheological properties are not as straight forward. The additional processing step, and therefore thermal history, adds additional shear into the polymer, reducing the molecular weight which leads to a reduction in viscosity, or increase in melt flow. This shear, along with adequate mixing, can lead to a very well dispersed filler within the composite, which leads to a reduction in viscosity. If the mixing was inadequate, agglomerates within the polymer matrix would lead to an increase in viscosity. A case could be made for excessive shear in the polymer composites, which may have caused an excessive breakdown of molecular weight of the composites. Hnatkova, et al. analysed the influence of molecular weight on the viscosity of polyethylene glycol (PEG). It was established that as the molecular weight of PEG decreased, there was a reduction in viscosity, which mirrors the results obtained in this study [35].

3.3.2. Differential Scanning Calorimetry

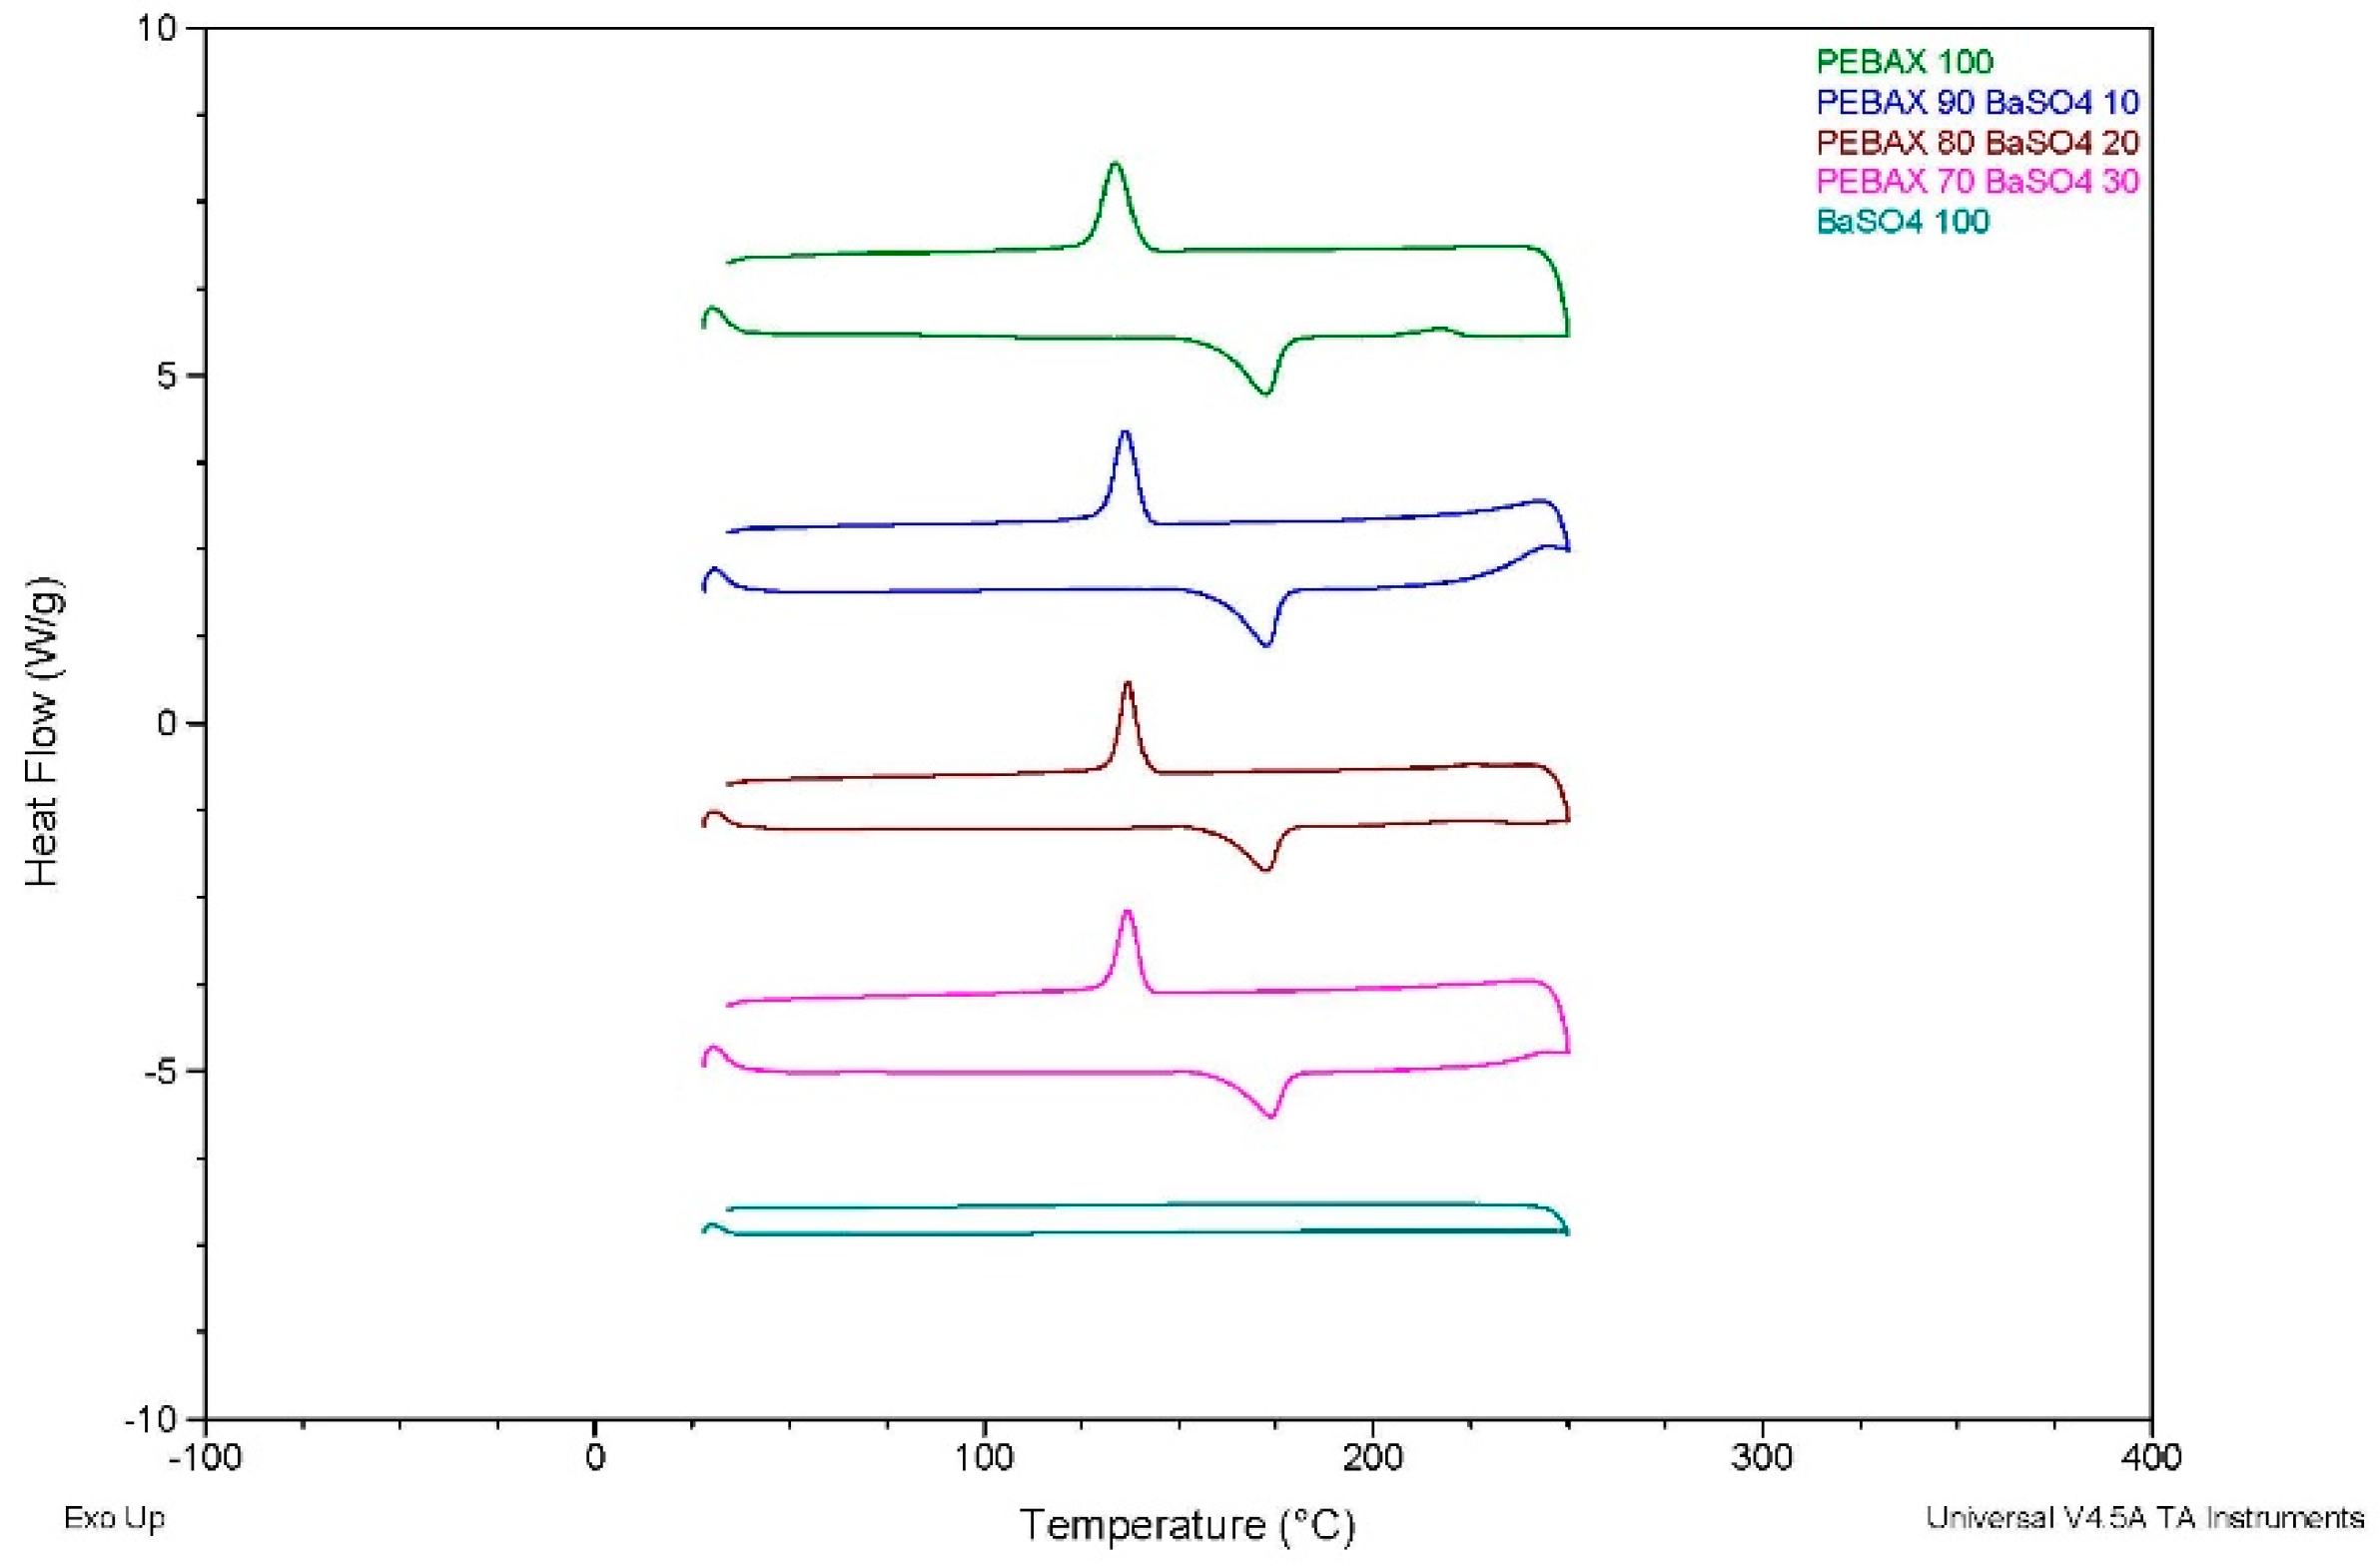
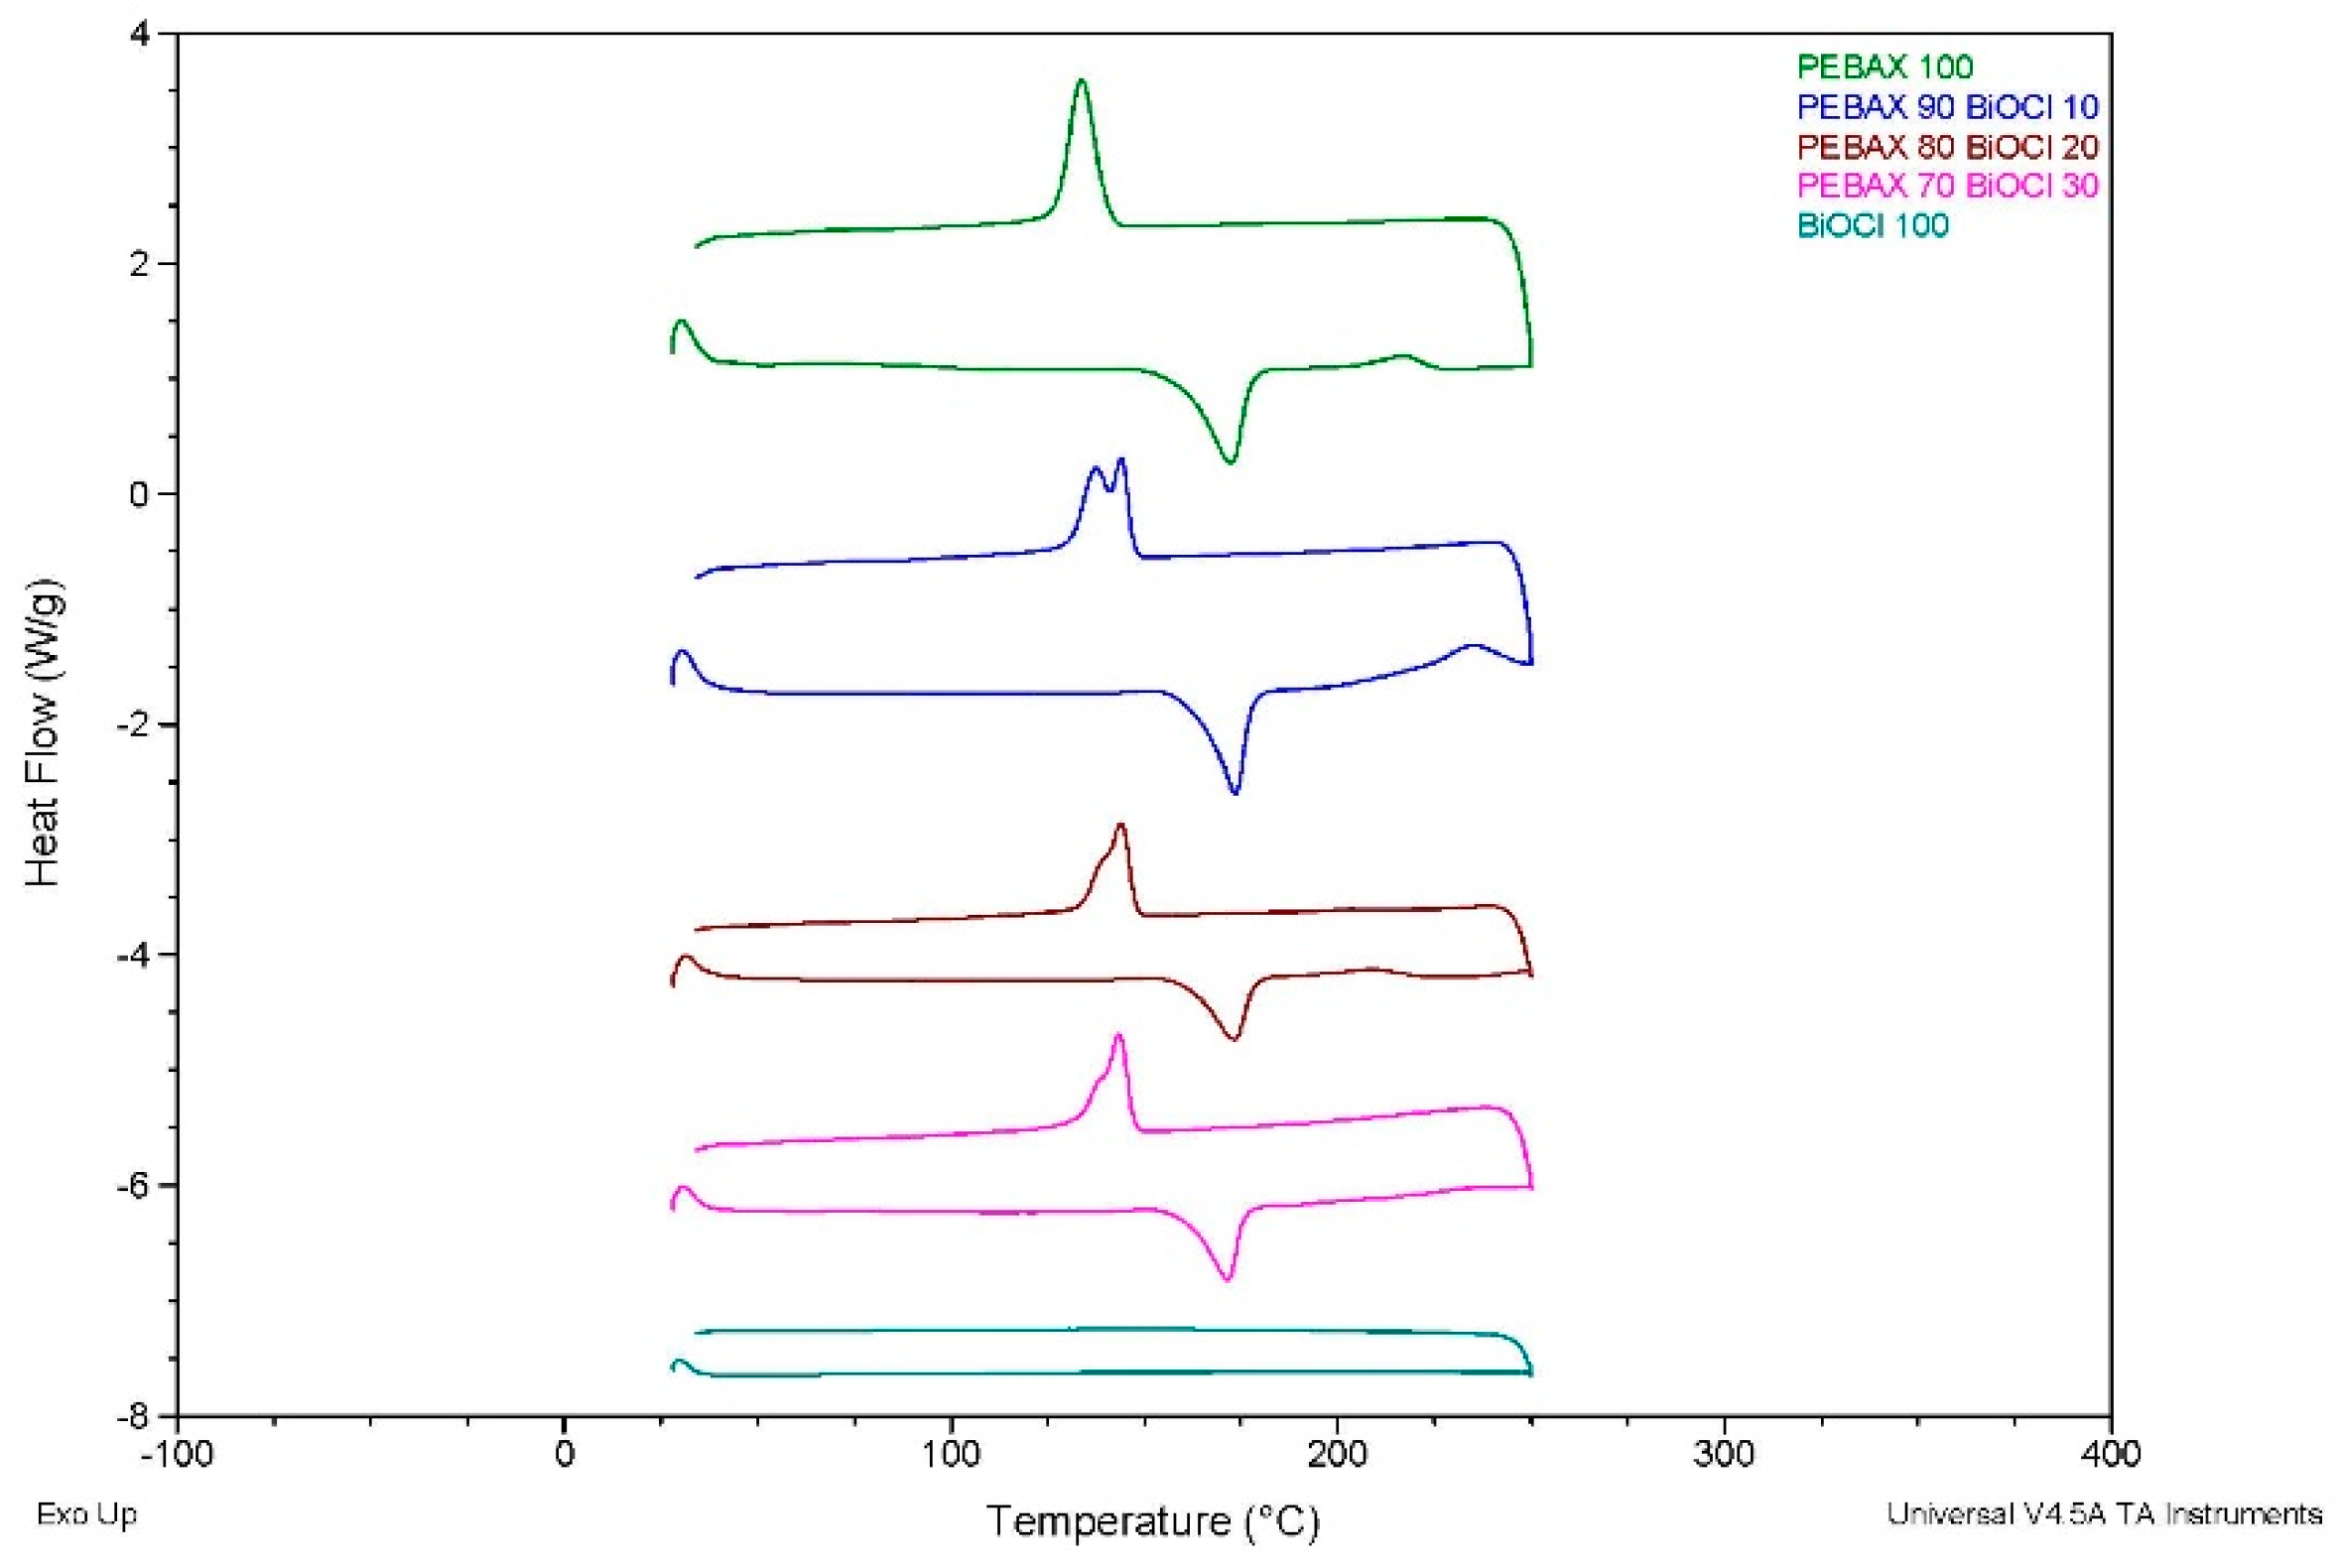
To evaluate the thermal properties, DSC analysis was carried out on the polymer, two inorganic fillers and various composites. Due to the semi-crystalline nature of PEBA, it is of interest to understand how the addition of inorganic fillers affects the crystallinity and other thermal properties. Figure 10 and Figure 11 display the overlaid thermograms for the BaSO4 and BiOCl composites respectively. To provide a comprehensive overview of the thermal characteristics, PEBA100, the various composites of BaSO4 and BiOCl, and the inorganic fillers were all analysed via DSC. Upon initial review of the graphs, it could be seen that while there is minimal movement in the temperature at which endo and exothermic peaks occur in PEBA/BaSO4 composites, there were greater shifts in the temperature at which the exothermic peaks occurred for the PEBA/BiOCl composites. These shifts in temperature for exothermic peaks are caused by crystallisation of the polymer, and as these occur during cooling with crystallisation occurring at a greater temperature. This signifies a reduction in the degree of crystallinity of the polymer., suggesting that the PEBA/BiOCl composites have a lower degree of crystallinity than both the polymer and PEBA/BaSO4 composites. Twin crystallisation peaks were observed during cooling of the PEBA/BiOCl composites, however, not in the thermograms of PEBA/BaSO4. One aspect to consider when understanding the effects of filler on the degree of crystallinity is the nucleating that occurs in the polymer due to the incorporation of fillers. Pingping & Dezhu conducted similar trials on the effects of various addition rates of calcium carbonate (CaCO3) on the cold crystallisation peaks of poly (ethylene terephthalate) (PET). It was found that with an increase in the addition of CaCO3, there was a clear reduction in the degree of crystallinity of the composite. It was summarised that the amorphous regions between spherulites decrease considerably with the addition of CaCO3. These results conform well with the mechanism of the effect of nucleation of CaCO3 on the PET crystallisation process [36]. It could be said that the BaSO4 filler induces a greater degree of crystallisation in comparison to the BiOCl due to an enhanced level of nucleation.
Figure 10. Overlay thermogram of Pebax® 6333 SA01 MED, BaSO4 and PEBA/BaSO4 composites; PEBA-100 (green), PEBA/BaSO4-10 (blue), PEBA/BaSO4-20 (mauve), PEBA/BaSO4-30 (magenta) & BaSO4-100 (teal).
Preprints 117602 g010
Figure 11. Overlay thermogram of Pebax® 6333 SA01 MED, BiOCl and PEBA/BiOCl composites; PEBA-100 (green), PEBA/BiOCl-10 (blue), PEBA/BiOCl-20 (mauve), PEBA/BiOCl-30 (magenta) & BiOCl-100 (teal).
Preprints 117602 g011
Table 6 provides the values obtained from the DSC analysis. It can be seen in the table that while there was minimal change in melt temperature of the composites in comparison to the polymer (PEBA100), there was in fact a change in the melting enthalpies and the crystallisation temperature, where subsequently, the degree of crystallinity has shifted in the composites. The reduction in degree of crystallinity for the PEBA/BaSO4-10, -20 and -30 composites were 10.1 %, 30 % and 28.9 % respectively. On the other hand, the PEBA/BiOCl-10, -20 and -30 composites experienced a 10.6 %, 38.8 % and 37.6 % reduction in crystallinity respectively when compared to the PEBA100, showing that the PEBA/BiOCl composites experienced a greater reduction in crystallinity in comparison to the comparatively loaded PEBA/BaSO4 composites. These results may signify a greater degree of crystallinity of the BaSO4 inorganic filler itself when compared to the BiOCl. This was also investigated by performing DSC on the fillers, however, there were no observed endothermic or exothermic peaks, possibly due to the relatively low temperatures at which the testing was conducted. It may be a case whereby the BaSO4 has overlapping crystallinity when incorporated into the polymer, therefore obtaining a more crystalline composite.
Liu, et al. assessed the effects of melt compounding and the addition of various loading of inorganic fillers on the thermal properties of PLA. It was established that first and foremost, the shear introduced into the polymer during melt compounding had caused the degree of crystallinity to decrease when compared to the PLA. The observed reduction in the degree of crystallinity was significant, at 64.3 % [37]. This reduction in crystallinity showed the effects of shear imparted into the polymer, which, when compared to the results obtained in this study, were mirrored by the reduction in the degree of crystallinity of the melt compounding composites, however, not to such an extent. Similarly, in this study, it was found that as the density of the inorganic fillers increased, the degree of crystallinity decreased significantly. While the trend was similar, it was not to such an extent as observed by Liu, et al. In this study, the observed difference between the two inorganic fillers at the respective loadings was 0.61 %, 12.63 % and 12.33 % respectively. It was also noted that, while the degree of crystallinity decreased with the increase in filler content, they increased slightly at the highest level of loading when compared to the respective middle loading (20 wt.%).
Khalaf conducted DSC analysis on composites with various loading levels of filler. It was established that as the percentage of filler loading increased, the degree of crystallinity decreased. This was attributed to the lower free volume within the polymer due to the greater volume of filler, thereby reducing the crystallisation ability of the polymer [38]. Changes in a polymer’s morphology such as degree of crystallinity can lead to phenomena such as shrinkage in parts. When designing a medical device product, it is important to understand the crystallinity of the polymer or polymer composite, so that accommodations may be made for shrinkage that may occur during process, either post extrusion, or while moulding.
Table 6. Thermal transitions identified from resultant thermograms. Χc = (ΔH/ΔH*); ΔH is the melting enthalpy calculated through integration of the melting peak determined via DSC; ΔH* = 65 J g−1 is the melting enthalpy of a 100% crystalline Pebax®.
Sample Tm (°C) ΔHm (J g−1) Tc (°C) ΔHcc (J g−1) Χc (%)
PEBA100 172.30 58.12 133.67 62.29 89.41
PEBA/BaSO410 172.59 52.25 136.17 54.95 80.38
PEBA/BaSO420 172.65 40.70 136.90 44.69 62.62
PEBA/BaSO430 173.71 41.35 136.89 45.89 63.61
PEBA/BIOCl10 173.53 51.93 144.201, 137.022 0.871, 5.292 79.891
PEBA/BIOCl20 173.36 35.56 147.68 37.72 54.71
PEBA/BIOCl30 171.44 36.25 143.50 36.39 55.77

3.4. Physical Properties

3.4.1. Density

Density is a crucial characteristic to consider when evaluating composites of various filler content for medical devices. When comparing various filler types of dissimilar densities, it is important to look at the densities of the final composites, showing clearly the effects of loading rates a particular filler into a polymer system. In this case, where BaSO4 and BiOCl were incorporated into the polymer at various rates, with such as difference in density of the inorganic fillers, the densities of each formulation of composites were analysed. Knowing the density of a material or composite is important as it provides critical understanding about how the material would behave during processing, but also for design of a medical device. It has also been shown that incorporation of fillers of varying densities at similar weight percentages may have differing effects on the reinforcement of the base polymer. As such modification of the weight percentage of filler added may require alteration [39]. The reinforcement effect herein was, however, not affected by the differing densities of the filler.
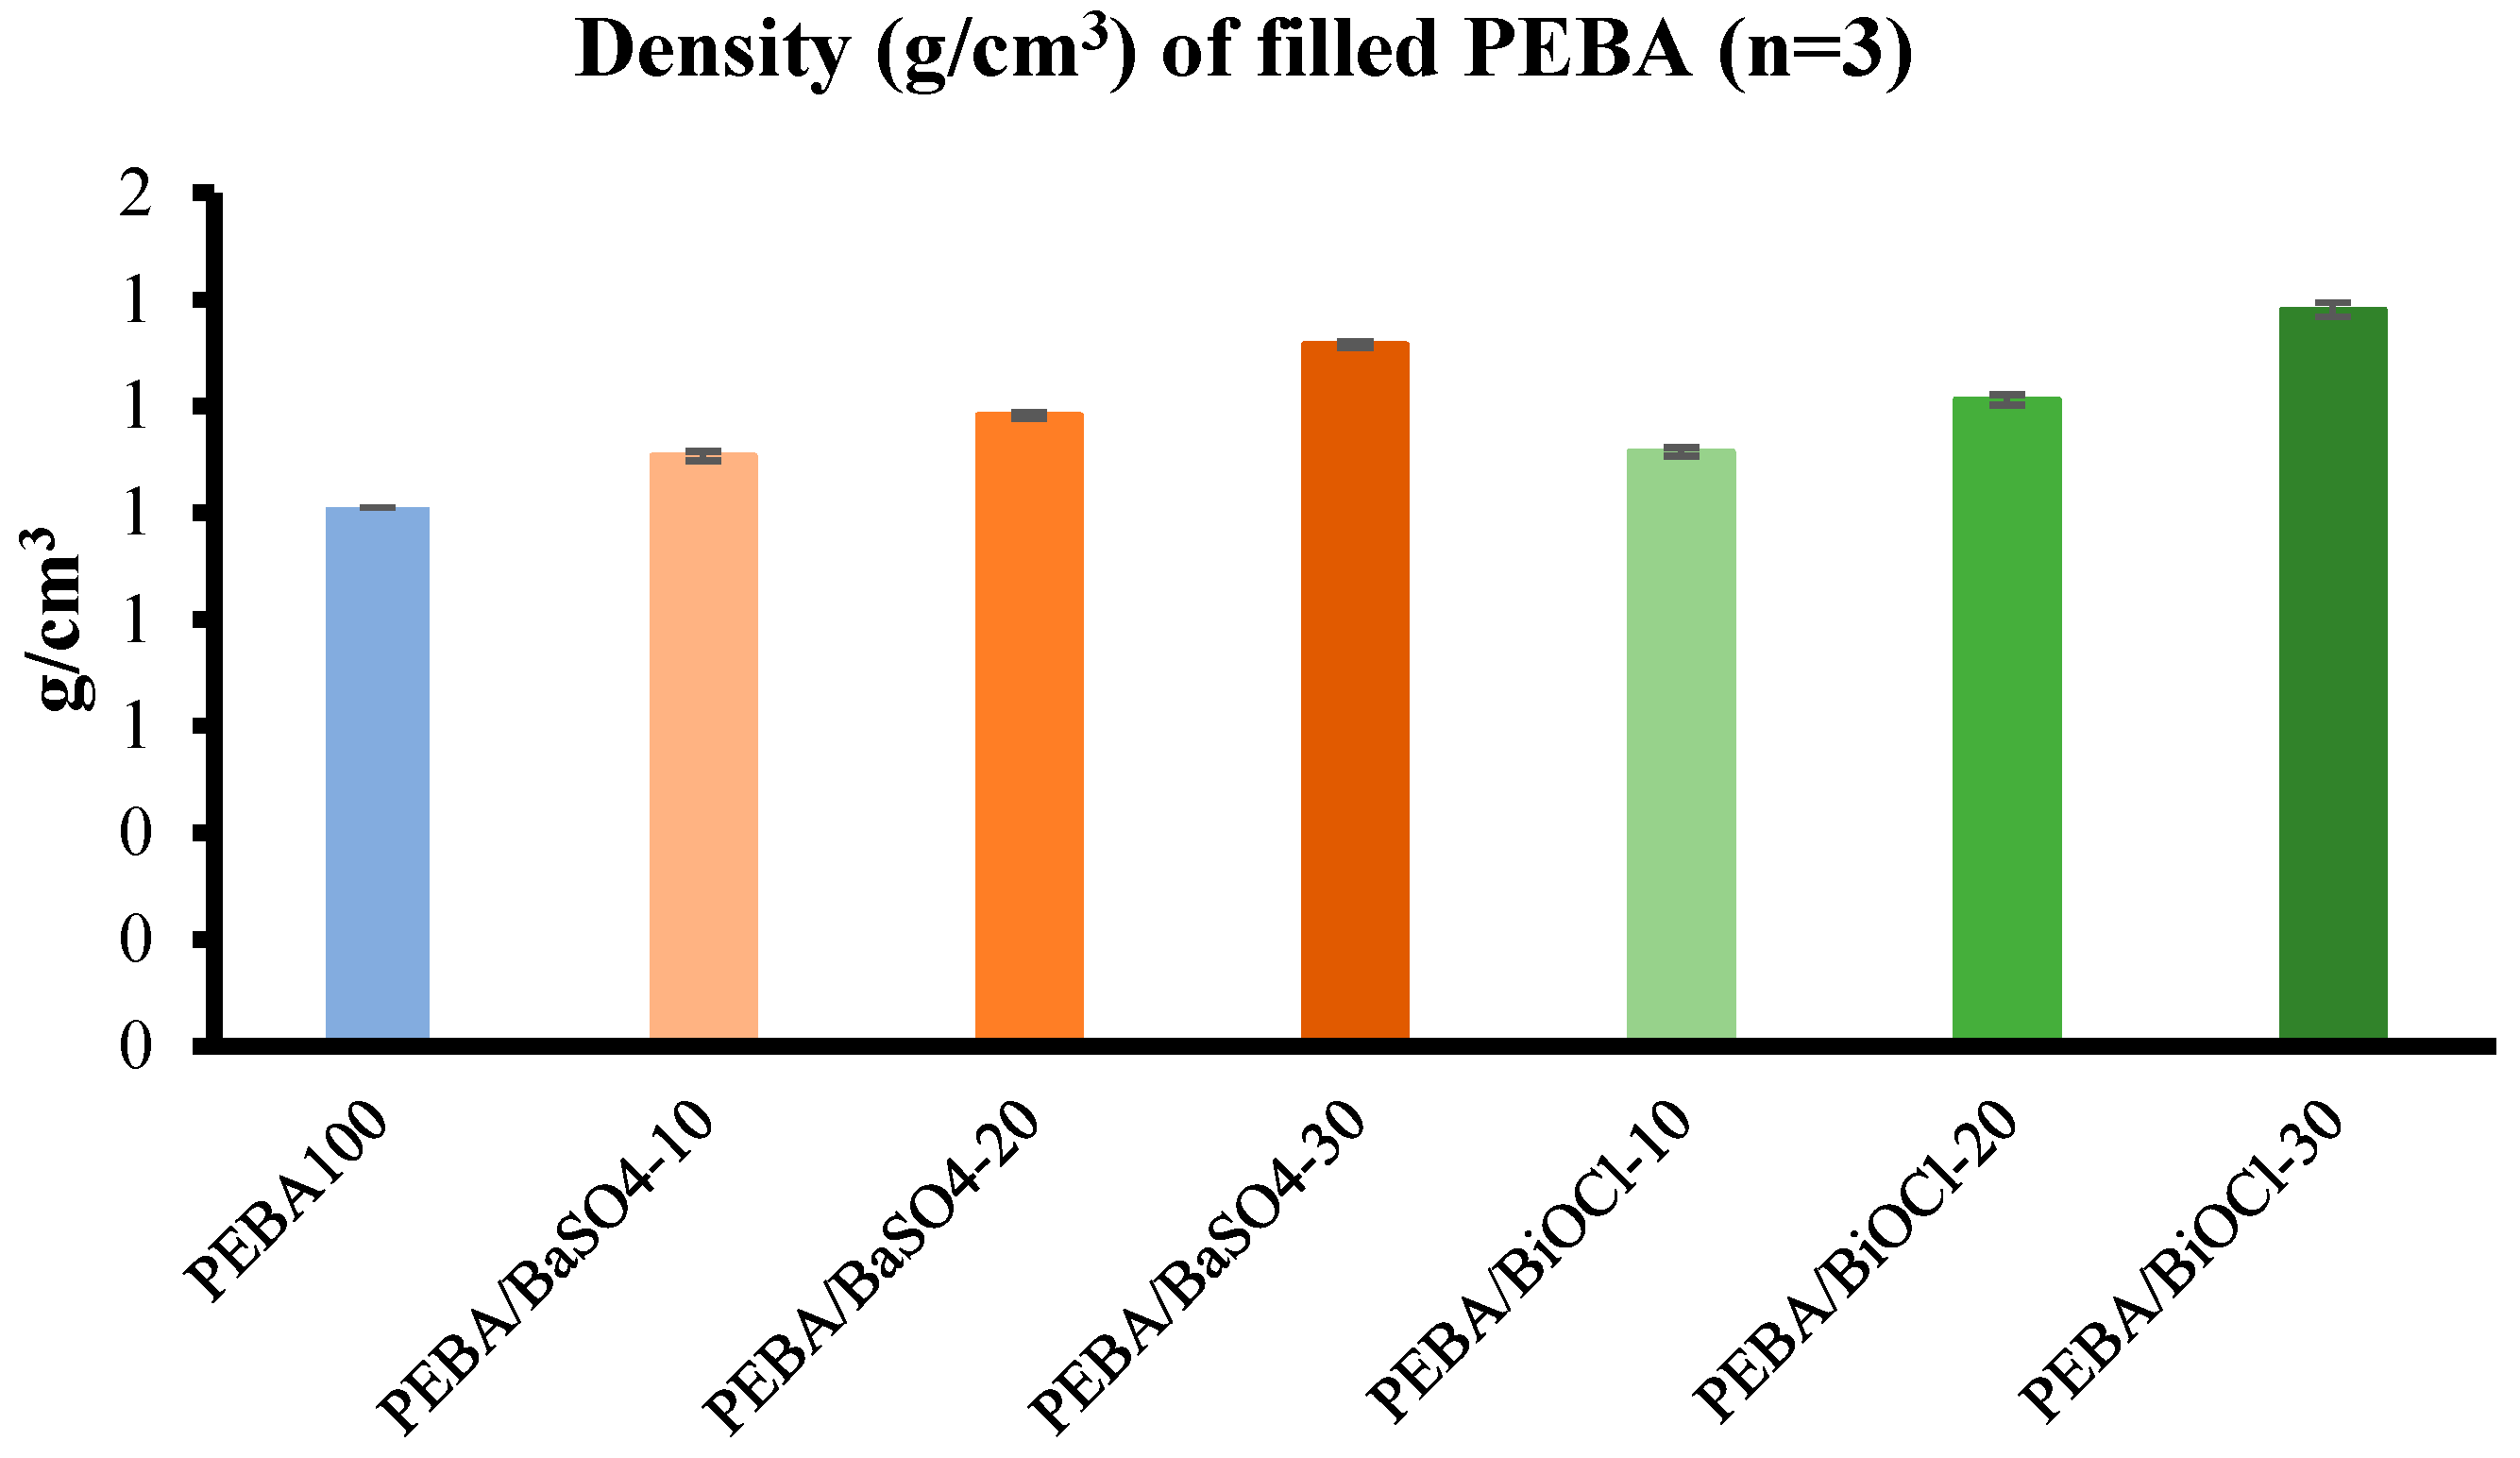
Figure 12 displays the densities of the various composites produced during compounding while Table 7 shows a comparison of theoretic and actual densities. All experimentally obtained values were within 0.01% of the theoretical values, showing the effectiveness of the extrusion and moulding processes in creating uniform blends. It is clear from the graph that with the incorporation of both inorganic fillers into the respective composites, the densities increased from that of the polymer. When comparing the composites against PEBA100 (1.01 g/cm3), there was an increase of 8.73 %, 14.65 % and 23.23 % for the PEBA/BaSO4-10 (1.107 g/cm3), -20 (1.183 g/cm3) and -30 (1.316 g/cm3) composites respectively. Similarly, a 9.39 %, 16.67 % and 26.85 % increase was observed for PEBA/BiOCl-10 (1.115 g/cm3), -20 (1.212 g/cm3) and -30 (1.381 g/cm3) respectively. It was established that the PEBA/BiOCl composites were denser than the PEBA/BaSO4, with an increase of 0.72 %, 2.37 % and 4.71 % at the respective increases in filler loading. It was expected that the BiOCl composites would have a greater density at the respective loadings than the PEBA/BaSO4 composites.
Table 7. Comparison of theoretical densities of the composites prepared and the values obtained experimentally. ρtheor: theoretical density & ρact: actual density.
ρtheor (g/cm³) ρact (g/cm³) Deviation (%)
PEBAX100 1.010 1.010 0.0100
PEBAX90BaSO₄10 1.095 1.107 0.0101
PEBAX80BaSO₄20 1.195 1.183 0.0099
PEBAX70BaSO₄30 1.316 1.316 0.0100
PEBAX90BiOCl10 1.106 1.115 0.0101
PEBAX80BiOCl20 1.222 1.212 0.0099
PEBAX70BiOCl30 1.366 1.381 0.0101
Figure 12. Density analysis; Pebax® 6333 SA01 MED (blue), BaSO4 filled Pebax® 6333 SA01 MED (orange), BiOCl filled Pebax® 6333 SA01 MED (green).
Preprints 117602 g012

3.4.2. Ash Content

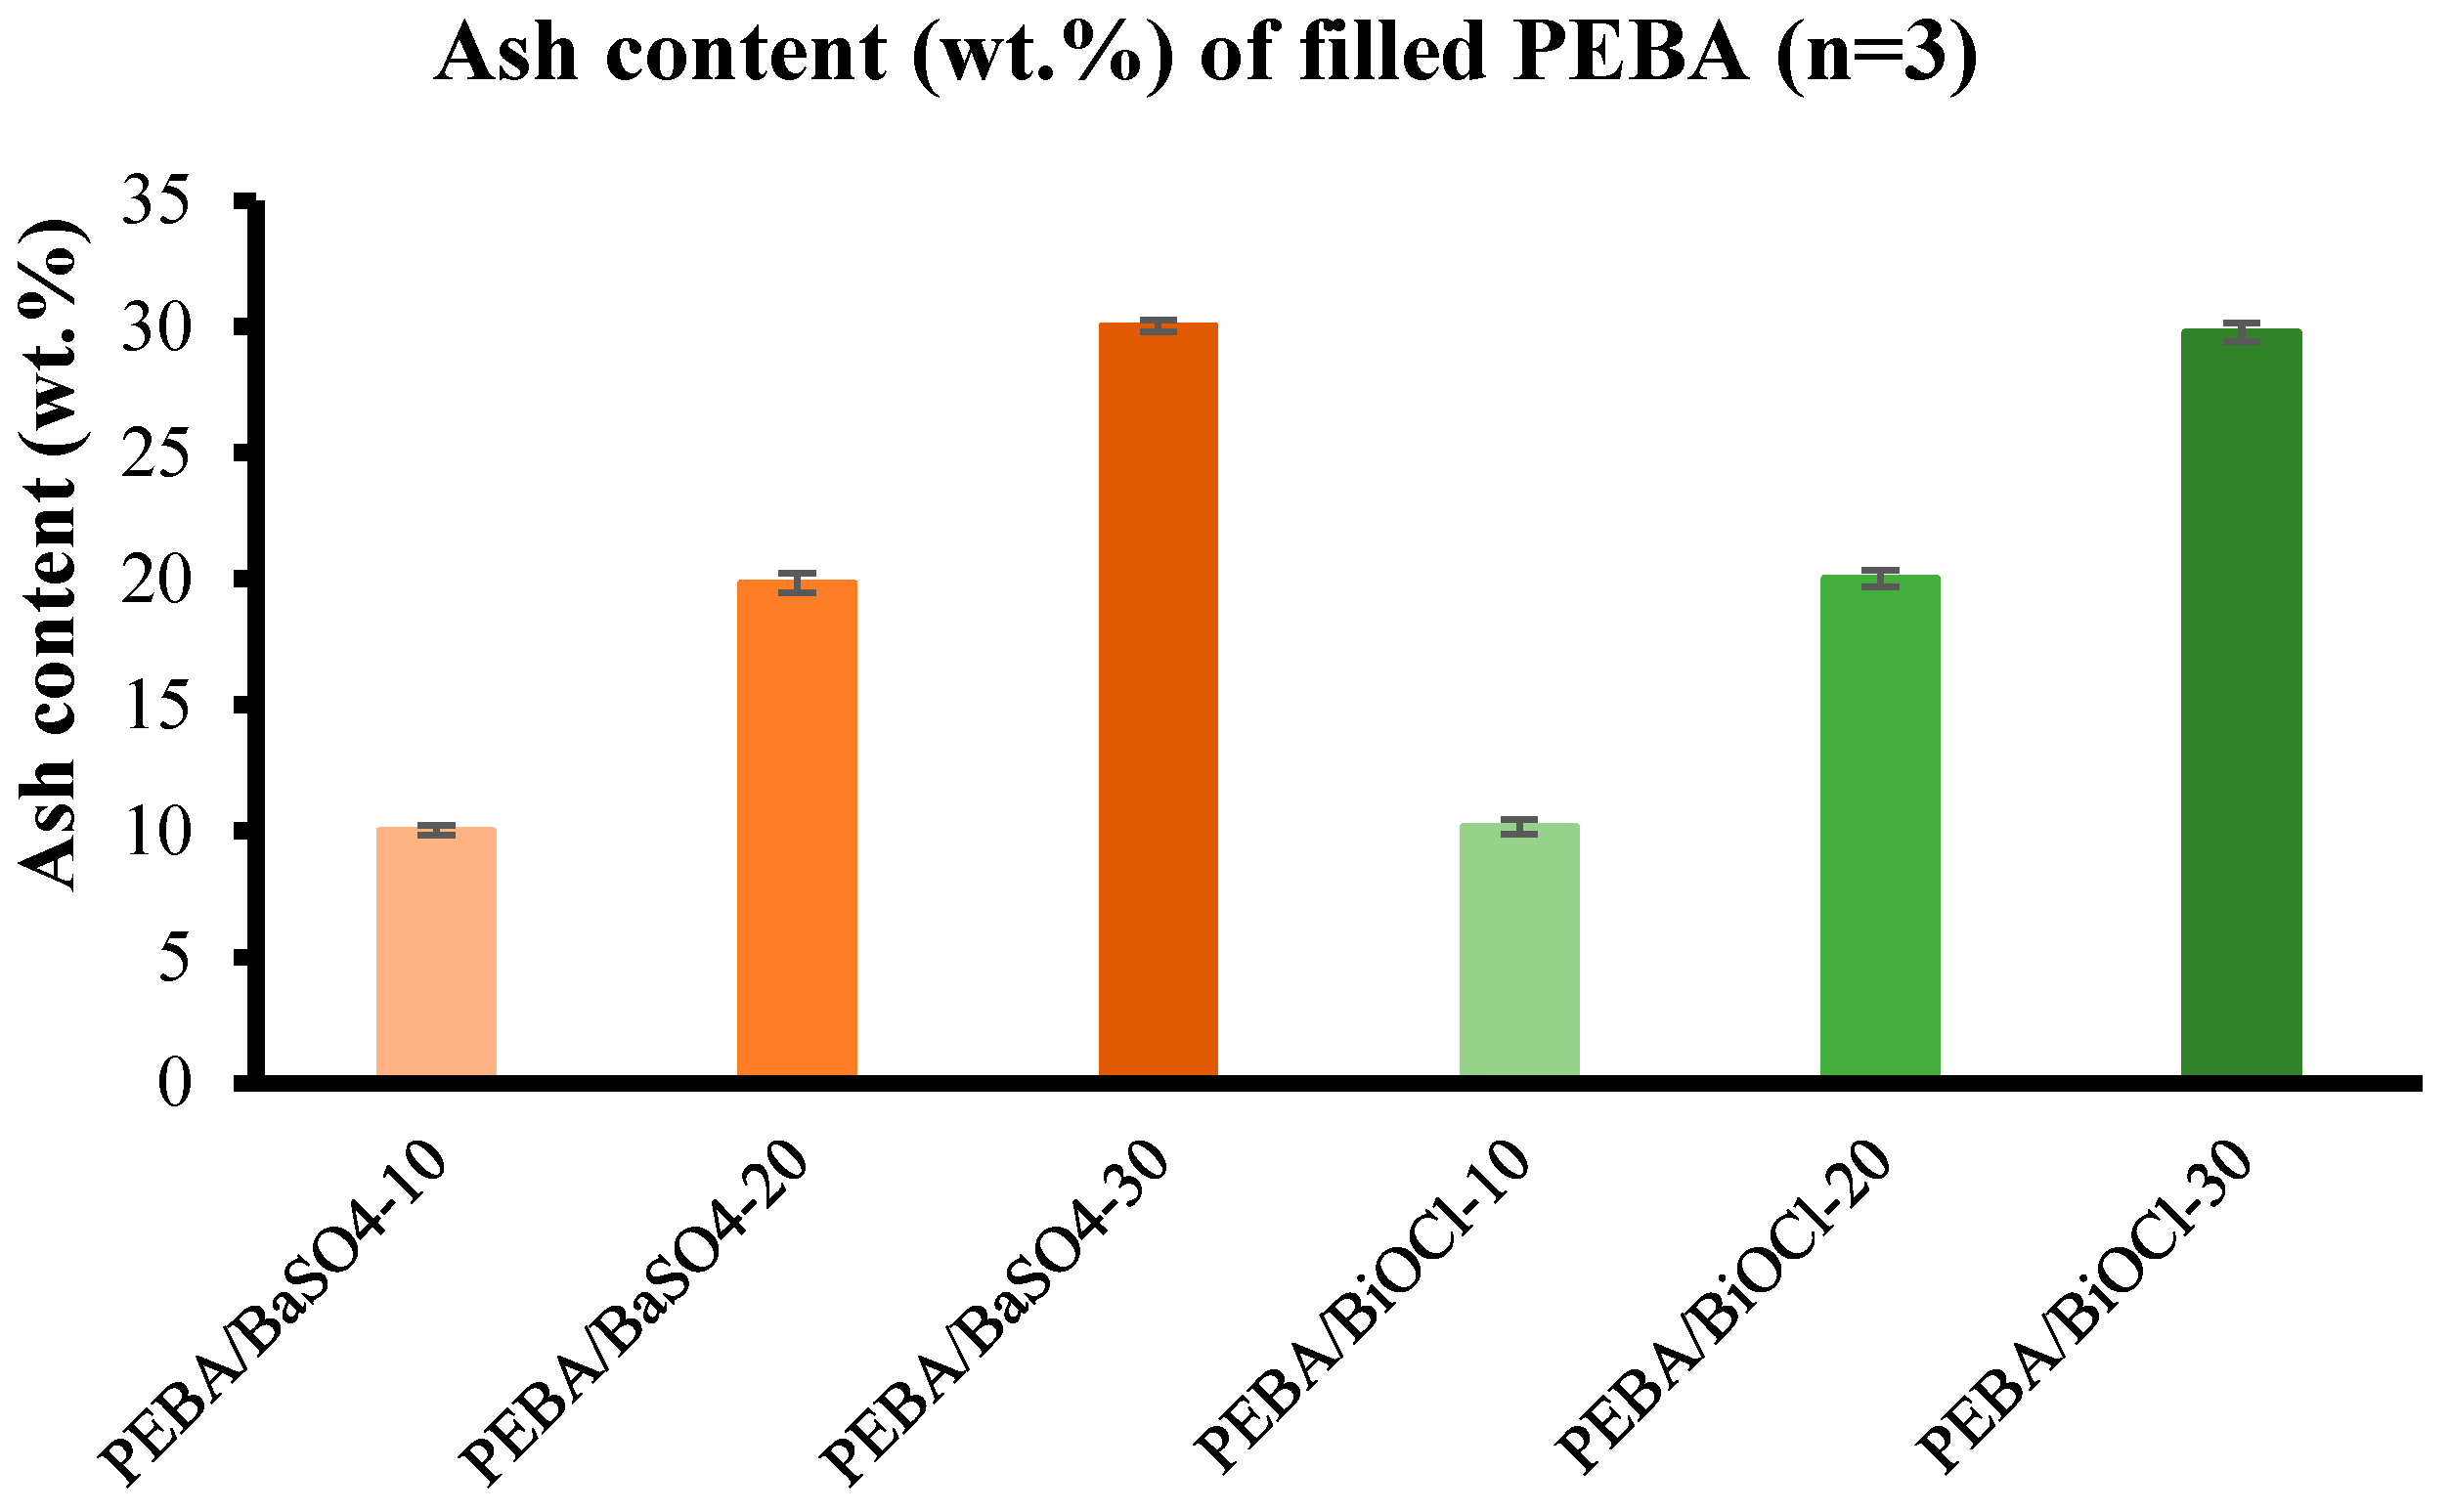
Ash content is an excellent method for evaluation of the content of inorganic filler in a polymer composite after compounding. While this method does not offer as much in-depth data, it does provide an indication of the level of filler within the composite. Figure 24 displays the results obtained from the ash content test. It is clear from the graph that the desired filler loadings for the composites were achieved by compounding. There was some variation in the addition of filler for PEBA/BaSO4-10, -20 and -30 of 0.5 %, 0.84 % and 0.07 % respectively. Similarly, the discrepancy in filler loading of PEBA/BiOCl-10, -20 and -30 was 1.66 %, 0.15 % and 0.76 % respectively, displaying the accuracy of feeding during the compounding process.
Figure 13. Ash content analysis; BaSO4 filled Pebax® 6333 SA01 MED (orange), BiOCl filled Pebax® 6333 SA01 MED (green).
Preprints 117602 g013

4. Conclusion

A series of studies were conducted to offer comprehensive insights into the effects of addition of inorganic fillers on the processing and material properties of Polyether block amide (PEBA). BaSO4 and BiOCl were selected as the fillers of choice as they have garnered wide use in the manufacture of medical tubing, praised for their excellent x-ray contrast properties. The investigation looked closely at the effects of addition level of these inorganic fillers on PEBA, as PEBA is a widely used polymer in the development of cardiovascular tubing. Pebax® 6333 SA01 MED is of particular interest, as this material is commonly used for various types of medical devices, possessing many desirable characteristics required for medical tubing. The investigations carried out encompassed twin screw extrusion and injection moulding processing, as well as mechanical, rheological, thermal, density and ash content analysis of the various composites.
During the extrusion trials, the impact of the filler type and concentration on processing parameters such as screw speed, torque, melt pressure and temperature were studied. It was observed that higher filler levels, particularly in the case of BiOCl, led to an increase in torque, necessitating a reduction in screw speed to maintain stable processing conditions. The higher torque requirement for PEBA/BiOCl composites indicated a greater mechanical demand during processing to achieve adequate mixing and dispersion of filler throughout the polymer when compared to BaSO4. Interestingly, the melt temperatures for PEBA/BiOCl composites were consistently higher than those for PEBA/BaSO4 composites, likely due to the higher thermal conductivity of BiOCl, which, leads to more heat absorption by the composite. The appearance of the extruded material, namely colour and opacity, varied depending on the filler and the addition level. The BiOCl composites displayed a greater degree of opaqueness, with greater whiteness, while the BaSO4 appeared to have less opacity, with a creamy tint to the colour. These findings on the extrusion of composites highlight that, while BaSO4 ensure consistent processing with minor adjustments, BiOCl, although requiring parameter adjustments for consistency, delivers superior aesthetic properties.
The injection moulding trials gave an insight into the behaviour of the composites when moulded. It was established that with an increase in filler level for both composites, there was a clear increase in melt cushion and a decrease in plasticising time during production. These phenomena may be as a result of the changing viscosity and density of the composites due to the additional heat history of the composites in extrusion and the incorporation of inorganic filler at various loadings. With the various polymer composites exposed to shear in the compounding process, this led to a reduction in the viscosity of the various resins as seen from the melt flow analysis. It was found that as the filler level increased, the viscosity reduced, which provides merit to the reduction in molecular weight theory that would affect the melt cushion and plasticising time as discussed previously. The consistency throughout the processes depicts excellent dispersion and addition of filler in the respective composites, suggesting that both BaSO4 and BiOCl fillers, despite their impact on the processing parameters, can be effectively integrated into the injection moulding processes with predictable results.
The tensile properties of the PEBA composites were significantly influenced by the type and loading of fillers. Both fillers led to a reduction in tensile strength, with BaSO4 showing a more pronounced decrease, especially at higher loading levels. This reduction in strength is attributed to a combination of higher volumetric content of BaSO4, which likely increases the brittleness of the composite, and chain scission as a result of shear which occurs in both the extrusion and injection moulding process. In contrast, the PEBA/BiOCl composites retained tensile properties close to those of the unfilled PEBA, indicating less of a detrimental impact from the addition of filler, in part, due to the lower volumetric addition rate. It was, however, observed that the incorporation of both respective fillers led to an increase in the stiffness of the composites (Young’s modulus). The BaSO4 displayed a more substantial increase in stiffness, which is likely due to the large volume of filler in the composite in comparison to BiOCl. The flexural behaviour of the composites mirrored the trends observed during tensile testing, with both fillers enhancing the stiffness of the material as evidenced by increased flexural strength and modulus. Notably, the PEBA/BiOCl composites exhibited slightly higher flexural moduli at higher loadings when compared to the PEBA/BaSO4 composite of same loading, suggesting greater stiffness. Despite the increased stiffness of the composites, they largely retain their flexibility, indicating that the addition of filler did not extensively compromise the materials ability to deform under bending loads. This retention of flexibility, despite filler addition, is particularly valuable in medical tubing applications, where both stiffness and flexibility are required.
The impact strengths of the composites were not significantly enhanced with the addition of inorganic fillers at various loading levels, with an overall improvement of impact strength for all composites (apart from PEBA/BaSO4-30) ranging from 4.7 % to 5.33 %, with no breakage, in comparison to PEBA100. However, at the highest addition level of BaSO4, there was a significant reduction in impact strength, resulting in breakage of the samples. This reduction in impact strength, and breakage of samples, was likely due to the brittleness imparted into the composite due to the excessive loading of BaSO4 filler by volume. The excessive loading would likely lead to poor particle-matrix interaction, causing stress concentration in these areas of poor interfacial adhesion. The PEBA/BiOCl composites maintained consistent impact strength across all filler loadings, suggesting that the BiOCl composites do not reach the same critical brittleness threshold as the PEBA/BaSO4-30. The ability of the PEBA/BiOCl composites to retain toughness at the higher filler loadings make BiOCl filled composites a more suitable choice for applications that require greater radiopacity, while not compromising the rigidity and impact resistance of the composite. A key observation made was the effects of the compounding process on the mechanicals and thermal properties of the composites. The dynamic mechanical properties of amorphous polymers can be changed by the thermal history of the sample, but the effects are generally much less prominent that with the crystalline polymers (Nielsen, 1974). The evaluation of the rheological properties of the various composites, while not as straight forward as expected, was important to analyse the effects of filler loading and the shear from twin screw extrusion. It was initially expected that the incorporation of filler at high loading levels would lead to an increase in viscosity, reduction in melt flow. This, however, was not the case.
The MFI analysis revealed that as the filler level increased in the composites, the melt flow also increased across all composites. While this enhanced flowability is advantageous for processing methods such as injection moulding and extrusion, the findings challenged the conventional expectations that fillers increase viscosity. Instead of the conventional theories, it highlighted the complex interplay between filler content, shear forces during processing, and the resultant molecular weight reduction, which collectively influence the melt flow characteristics. This increased melt flow indicated that these composites of various filler loadings could be processed more efficiently, however, it would be important to avoid excessive shear during processing, as this does in fact lead to a reduction in the mechanical properties of the composite.
The DSC offered valuable insights into the thermal behaviour of the various composites. It was established that the addition of inorganic filler significantly affected the crystallinity of the PEBA composites, with the incorporation of BiOCl into the polymer resulting in a greater reduction in crystallinity when compared to the PEBA/BaSO4 of the same filler content. Despite this reduction, the melting temperatures remained largely unchanged, indicating that the fillers do not significantly alter the thermal stability of the PEBA matrix. The reduction in crystallinity suggests that these composites may experience less shrinkage during processing, which could have its advantages in applications requiring dimensional stability.
Density analysis was conducted to evaluate the actual practical density of the various composites, while also evaluating the actual filler content by means of ash content testing. It was established through ash content testing, that the compounding process was very accurate, with an average tolerance of 0.66 %. The incorporation of fillers led to a significant increase in the density of the respective composites, with the PEBA/BiOCl composites resulting in greater densities in comparison to the PEBA/BaSO4 at equivalent loadings. Evaluation of these composite densities is crucial for understanding the behaviour of the composite during processing and for design of medical tubing, where the weight of a component is critical in specific applications. These are considerations that must be made when evaluating a particular inorganic filler for composites, where the balance between density, mechanical strength, processability and radiopacity are critical. In conclusion, this study provides a detailed understanding of how inorganic fillers such as BaSO4 and BiOCl, and additional thermal history from compounding affect the processing, mechanical, thermal, and rheological properties of a PEBA composite.
While both fillers offer their respective benefits, it was observed throughout the study that with the incorporation of BiOCl at the various filler loadings, there were generally more balanced enhancement of properties with less adverse effects on the mechanical properties such as tensile strength, flexibility and impact resistance. The findings of this study emphasise the important of optimising the filler concentration, irrespective of the chosen filler, along with the processing conditions to achieve a desired polymer composite for specific applications. Particularly in the medical field, where precision and performance are paramount.

Author Contributions

For research articles with several authors, a short paragraph specifying their individual contributions must be provided. The following statements should be used “Conceptualization, A.N; methodology, A.N and D.M.C; formal analysis, A.N.; investigation, A.N; resources, A.N and D.M.C; data curation, A.N; writing—original draft preparation, A.N; writing—review and editing, D.M.C; supervision, J.M and D.M.C; project administration, D.M.C.

Funding

This research was funded by Innovative Polymer Compounds (IPC), Kilbeggan, Ireland.

Data Availability Statement

All data is available within the manuscript.

Conflicts of Interest

The authors declare no conflicts of interest.

References

  1. Enderle, J. Bioinstrumentation. Introd. Biomed. Eng. 3rd ed., n.d., p. 509–608.
  2. Biesiekierski A, Munir K, Li Y, Wen C. 2 - Material selection for medical devices. In: Wen C, editor. Met. Biomater. Process. Med. Device Manuf., Woodhead Publishing; 2020, p. 31–94. [CrossRef]
  3. Saint S, Chenoweth CE. Biofilms and catheter-associated urinary tract infections. Infect Dis Clin North Am 2003;17:411–32. [CrossRef]
  4. Emonde C, Eggers M-E, Wichmann M, Hurschler C, Ettinger M, Denkena B. Radiopacity Enhancements in Polymeric Implant Biomaterials: A Comprehensive Literature Review. ACS Biomater Sci Eng 2024;10:1323–34.
  5. Lawrence EL, Turner IG. Materials for urinary catheters: a review of their history and development in the UK. Med Eng Phys 2005;27:443–53. [CrossRef]
  6. Wildgruber M, Lueg C, Borgmeyer S, Karimov I, Braun U, Kiechle M, et al. Polyurethane versus silicone catheters for central venous port devices implanted at the forearm. Eur J Cancer Oxf Engl 1990 2016;59:113–24. [CrossRef]
  7. Lewis PR, Reynolds K, Gagg C, Gagg C. Forensic Materials Engineering: Case Studies. Boca Raton: CRC Press; 2003. [CrossRef]
  8. Alicdan J, Feldheim A, Fong C, Myers F, Torriani F. Peripheral Venous Catheter Associated Bloodstream Infections (PVC-BSI) Risk Compared to Central Line Associated Bloodstream Infections (CLABSI). Am J Infect Control 2023;51:S34–5. [CrossRef]
  9. Niaounakis, M. 1 - Introduction to Biopolymers. In: Niaounakis M, editor. Biopolym. Reuse Recycl. Dispos., Oxford: William Andrew Publishing; 2013, p. 1–75. [CrossRef]
  10. Singh S, Varghese AM, Reinalda D, Karanikolos GN. Graphene - based membranes for carbon dioxide separation. J CO2 Util 2021;49:101544. [CrossRef]
  11. Arkema, SA. Pebax 2533 SA01 MED 2024.
  12. Arkema, SA. Pebax 4033 SA01 MED 2024.
  13. Arkema, SA. Pebax 6333 SA01 MEd 2024.
  14. Arkema, SA. Pebax 7233 SA01 MED 2024.
  15. Lusic H, Grinstaff MW. X-Ray Computed Tomography Contrast Agents. Chem Rev 2013;113:10.1021/cr200358s. [CrossRef]
  16. Block, M. Implants for the Maxillary Edentulous Patient. Color Atlas Dent. Implant Surg. 4th ed., London: Elsevier; 2014, p. 116–61.
  17. Oskarsson, A. Chapter 4 - Barium. In: Nordberg GF, Costa M, editors. Handb. Toxicol. Met. Fifth Ed., Academic Press; 2022, p. 91–100. [CrossRef]
  18. Su J-F, Le D-P, Liu C-H, Lin J-D, Xiao X-J. Critical care management of patients with barium poisoning: a case series. Chin Med J (Engl) 2020:724. [CrossRef]
  19. Danthanavat N, Mongkolsuk M, Tochaikul G, Sriwongta S, Piyajaroenporn A, Lithreungnam C, et al. Study of epoxy shielding material with barium sulphate for development of radiation protection materials in low-dose diagnostic X-ray. Radiat Eff Defects Solids 2021;176:887–95. [CrossRef]
  20. Acquarulo, L. Specialty Compounds for Medical Applications: An Introduction. Spec Compd Med Appl Introd 1996. https://www.mddionline.com/business/specialty-compounds-for-medical-applications-an-introduction (accessed September 3, 2024).
  21. Oskarsson A, Reeves AL. CHAPTER 20 - Barium. In: Nordberg GF, Fowler BA, Nordberg M, Friberg LT, editors. Handb. Toxicol. Met. Third Ed., Burlington: Academic Press; 2007, p. 407–14. [CrossRef]
  22. Polaskova M, Sedlacek T, Polasek Z, Filip P. Modification of Polyvinyl Chloride Composites for Radiographic Detection of Polyvinyl Chloride Retained Surgical Items. Polymers 2023;15:587. [CrossRef]
  23. Radiopaque Compounds. Foster Corp 2024. https://www.fostercomp.com/custom-compounds/radiopaque-compounds/ (accessed September 3, 2024).
  24. Halim K, Farrell J, Kennedy J. Preparation and characterisation of polyamide 11/montmorillonite (MMT) nanocomposites for use in angioplasty balloon applications. Mater Chem Phys 2013;143:336–48. [CrossRef]
  25. Rosato DonaldV, Rosato DominickV. 7 - Process Control Technology. Inject. Mould. Handb. 3rd ed., Springer, Boston, MA.: Springer; 2000, p. 623–715.
  26. Bayazian H, Schoeppner V. Investigation of molecular weight distributions during extrusion process of polypropylene by rheometry experiment. AIP Conf Proc, AIP Publishing; 2019. [CrossRef]
  27. Fu S-Y, Feng X-Q, Lauke B, Mai Y-W. Effects of particle size, particle/matrix interface adhesion and particle loading on mechanical properties of particulate–polymer composites. Compos Part B Eng 2008;39:933–61. [CrossRef]
  28. Mahdi E, Aamir D. The Effect of Filler Content on the Tensile Behavior of Polypropylene/Cotton Fiber and poly(vinyl chloride)/Cotton Fiber Composites. Mater Adv Nat Fibers Polym 2020;13:1–17. [CrossRef]
  29. Salmah H, Romisuhani A, Akmal H. Properties of low-density polyethylene/palm kernel shell composites: Effect of polyethylene co-acrylic acid 2013;26. [CrossRef]
  30. Shah. Radiopaque Polymer Formulations for Medical Devices. Radiopaque Polym Formul Med Devices 2000. https://www.mddionline.com/materials/radiopaque-polymer-formulations-for-medical-devices (accessed September 3, 2024).
  31. Bociong K, Szczesio A, Krasowski M, Sokolowski J. The influence of filler amount on selected properties of new experimental resin dental composite. Open Chem 2018;16:905–11. [CrossRef]
  32. Zabihzadeh SM, Omidvar A, Marandi MAB, Mirmehdi SM, Dastoorian F. Physical and Mechanical Properties of Rapeseed Waste-filled LLDPE Composites. J Thermoplast Compos Mater 2011;24:447–58. [CrossRef]
  33. Sreekanth M, Bambole V, Mhaske S, Mahanwar P. Effect of Particle Size and Concentration of Flyash on Properties of Polyester Thermoplastic Elastomer Composites. J Miner Mater Charact Eng 2009;8:237–48.
  34. Lakkundi A, Raju G, Madhusudhana H, Satish G. Optimizing Filler Loading and Particle Size for Enhanced PhysicoMechanical Properties in Peanut Shell. J Mater Sci Manuf Res 2024;5:1–8.
  35. Hnatkova E, Hales A, Jiranek L, Vera J, Hausnerová B. Rheological Investigation of Highly Filled Polymers: Effect of Molecular Weight. AIP Conf Proc 2015;1662. [CrossRef]
  36. Pingping Z, Dezhu M. Study on the double cold crystallization peaks of poly(ethylene terephthalate) 3. The influence of the addition of calcium carbonate (CaCO3). Eur Polym J 2000;36:2471–5. [CrossRef]
  37. Liu X, Wang T, Chow LC, Yang M, Mitchell JW. Effects of Inorganic Fillers on the Thermal and Mechanical Properties of Poly(lactic acid). Int J Polym Sci 2014;2014:827028. [CrossRef]
  38. Khalaf, M. Effect of alkali lignin on heat of fusion, crystallinity and melting points of low density polyethylene (LDPE), medium density polyethylene (MDPE) and high density polyethylene (HDPE). J Thi-Qar Sci 2010;2:89–95.
  39. Hanna V, Yan P, Petcher S, Hasell T. Incorporation of fillers to modify the mechanical performance of inverse vulcanised polymers. Polym Chem 2022;13:3930–7. [CrossRef]
Figure 3. Twin screw compounding observations, (A) screw speed, (B) torque, (C) melt pressure & (D) melt temperature; BaSO4 filled Pebax® 6333 SA01 MED (orange), BiOCl filled Pebax® 6333 SA01 MED (green).
Preprints 117602 g003
Figure 4. Pellets pre and post compounding, (A) PEBA-100, (B) PEBA/BaSO4-10, (C) PEBA/BaSO4-20, (D) PEBA/BaSO4-30, (E) PEBA/BiOCl-10, (F) PEBA/BiOCl-20, (G) PEBA/BiOCl-30.
Preprints 117602 g004
Figure 6. Tensile properties of all tested samples (n=6), (A) tensile strength of samples, (B) stress at break of samples, (C) strain at break of samples, (D) young’s modulus of samples; Pebax® 6333 SA01 MED (blue), BaSO4 filled Pebax® 6333 SA01 MED (orange), BiOCl filled Pebax® 6333 SA01 MED (green). Error bars represent standard deviation of the mean.
Preprints 117602 g006
Figure 7. Flexural properties of all tested samples (n=6), (A) flexural strength of samples, (B) flexural strain of samples, (C) flexural modulus of samples; Pebax® 6333 SA01 MED (blue), BaSO4 filled Pebax® 6333 SA01 MED (orange), BiOCl Pebax® 6333 SA01 MED (green).
Preprints 117602 g007
Figure 9. Melt flow analysis; Pebax® 6333 SA01 MED (blue), BaSO4 filled Pebax® 6333 SA01 MED (orange), BiOCl filled Pebax® 6333 SA01 MED (green).
Preprints 117602 g009
Table 4. Composition of materials produced for this study. Wt.% - weight percentage.
Sample Name PEBA (wt. %) BaSO4 (wt. %) BiOCl (wt. %)
PEBA100 100 0 0
PEBA/BaSO410 90 10 0
PEBA/BaSO420 80 20 0
PEBA/BaSO430 70 30 0
PEBA/BiOCl10 90 0 10
PEBA/BiOCl20 80 0 20
PEBA/BiOCl30 70 0 30
Table 5. Extrusion temperatures utilised for the preparation of PEBAX/filler composites.
Heating Zone Parameter (°C)
Zone 1 80
Zone 2 160
Zone 3 180
Zone 4 180
Zone 5 180
Zone 6 180
Zone 7 180
Zone 8 190
Zone 9 190
Zone 10 190
Disclaimer/Publisher’s Note: The statements, opinions and data contained in all publications are solely those of the individual author(s) and contributor(s) and not of MDPI and/or the editor(s). MDPI and/or the editor(s) disclaim responsibility for any injury to people or property resulting from any ideas, methods, instructions or products referred to in the content.
Copyright: This open access article is published under a Creative Commons CC BY 4.0 license, which permit the free download, distribution, and reuse, provided that the author and preprint are cited in any reuse.
Prerpints.org logo

Preprints.org is a free preprint server supported by MDPI in Basel, Switzerland.

Subscribe

© 2024 MDPI (Basel, Switzerland) unless otherwise stated