1. Introduction
The RDA (Range Doppler Algorithm) algorithm was first used between 1976-1978 to process SEASAT SAR data [
1] and in 1984 JPL (Jet Propulsion Laboratories) added a new block to the system called Secondary Range Compression (SRC) and accordingly, it makes it possible for this method to obtain a good result. The image, even at low angle corresponding to zero [
2]. In fact, what makes this method superior and fast is the processing of the blocks present in this method. This method is called RDA because it implements RCMC at the Doppler frequency. A schematic diagram of this method is shown in the figure below in three cases, but for the sake of brevity we only deal with the simple case in which the squint angle is zero.
Figure 1.
A) RDA with squint angle = 0 B) RDA with accurate SRC. C) RDA with approximate SRC.
Figure 1.
A) RDA with squint angle = 0 B) RDA with accurate SRC. C) RDA with approximate SRC.
2. Methodology
RDA in zero squint angle mode according to the above detailed diagram, we will explain this method. As we did, the input raw data signal is as follows:
Where
here is rect and the steps of this method are as follows:
Range compression: In this step, the transferring of the received signal to the frequency domain of the panel and accompanied by the reference signal. The two signals are sent after multiplying them, and then we return the signal to the time domain.
After that, multiplying these signals in the frequency domain, and transferred to the time domain, finally the equation be:
It can be concluded that the minimum distance that can be separated in time for a compressed signal is 41-2.
- 2.
Fourier transform stage: In this step, the Fourier transform of the signal is performed.
In the above equation is the rate of the oscillation signal in the lateral direction, and the redundant should be deleted.
- 3.
CORRECTING THE PLATE MIGRATION: as the target is a point in the coordinates (
), so after compressing the plate the signal must be compressed at point
but as is clear. In addition, another delay duration was obtained whose cause varies with the:
- 4.
COMPRESSION STAGE: Lateral pressure after adjusting the RCM can be done in the same way as the pressure in the direction the plate is completed, and repeat the same for the side direction, so we have:
- 5.
INVERSE FAST FOURIER TRANSFORM (IFFT): the aspect of the above relationship, it is enough to take the form of the Fourier transform to obtain the final expression. We assume that the envelope of the signal in the side direction instead of the (5) relationship is rectangular as follows:
By take the IFFT with constants:
Where
is the side compression signal, and can considered as multiplying index.
We note that there is no impact on the quality and accuracy of radar imaging, A phase multiplication process can be used.
3. Proposed Algorithm
Our goal in this paper is to identify minerals using hyperspectral SAR images instead of optical and infrared images, so we will continue to use the RDA method to retrieve the image at eight different frequencies and a data cube is formed which can somehow recreate a model from the hyperspectral images. Spectrophotometry by simulation.
Hyperspectral measuring devices measure electromagnetic energy reflected from different areas in the form of hundreds or thousands of spectral channels with high spectral resolution, and the most famous of these devices is the AVIRIS device. The variety and number of applications of hyperspectral remote sensing imagery in commercial and military fields is very broad, including environmental monitoring and geological mineral identification.
Identify the type of vegetation, forests, oil discoveries, and identify and point out the depths of the oceans.
Spectroscopic Separation
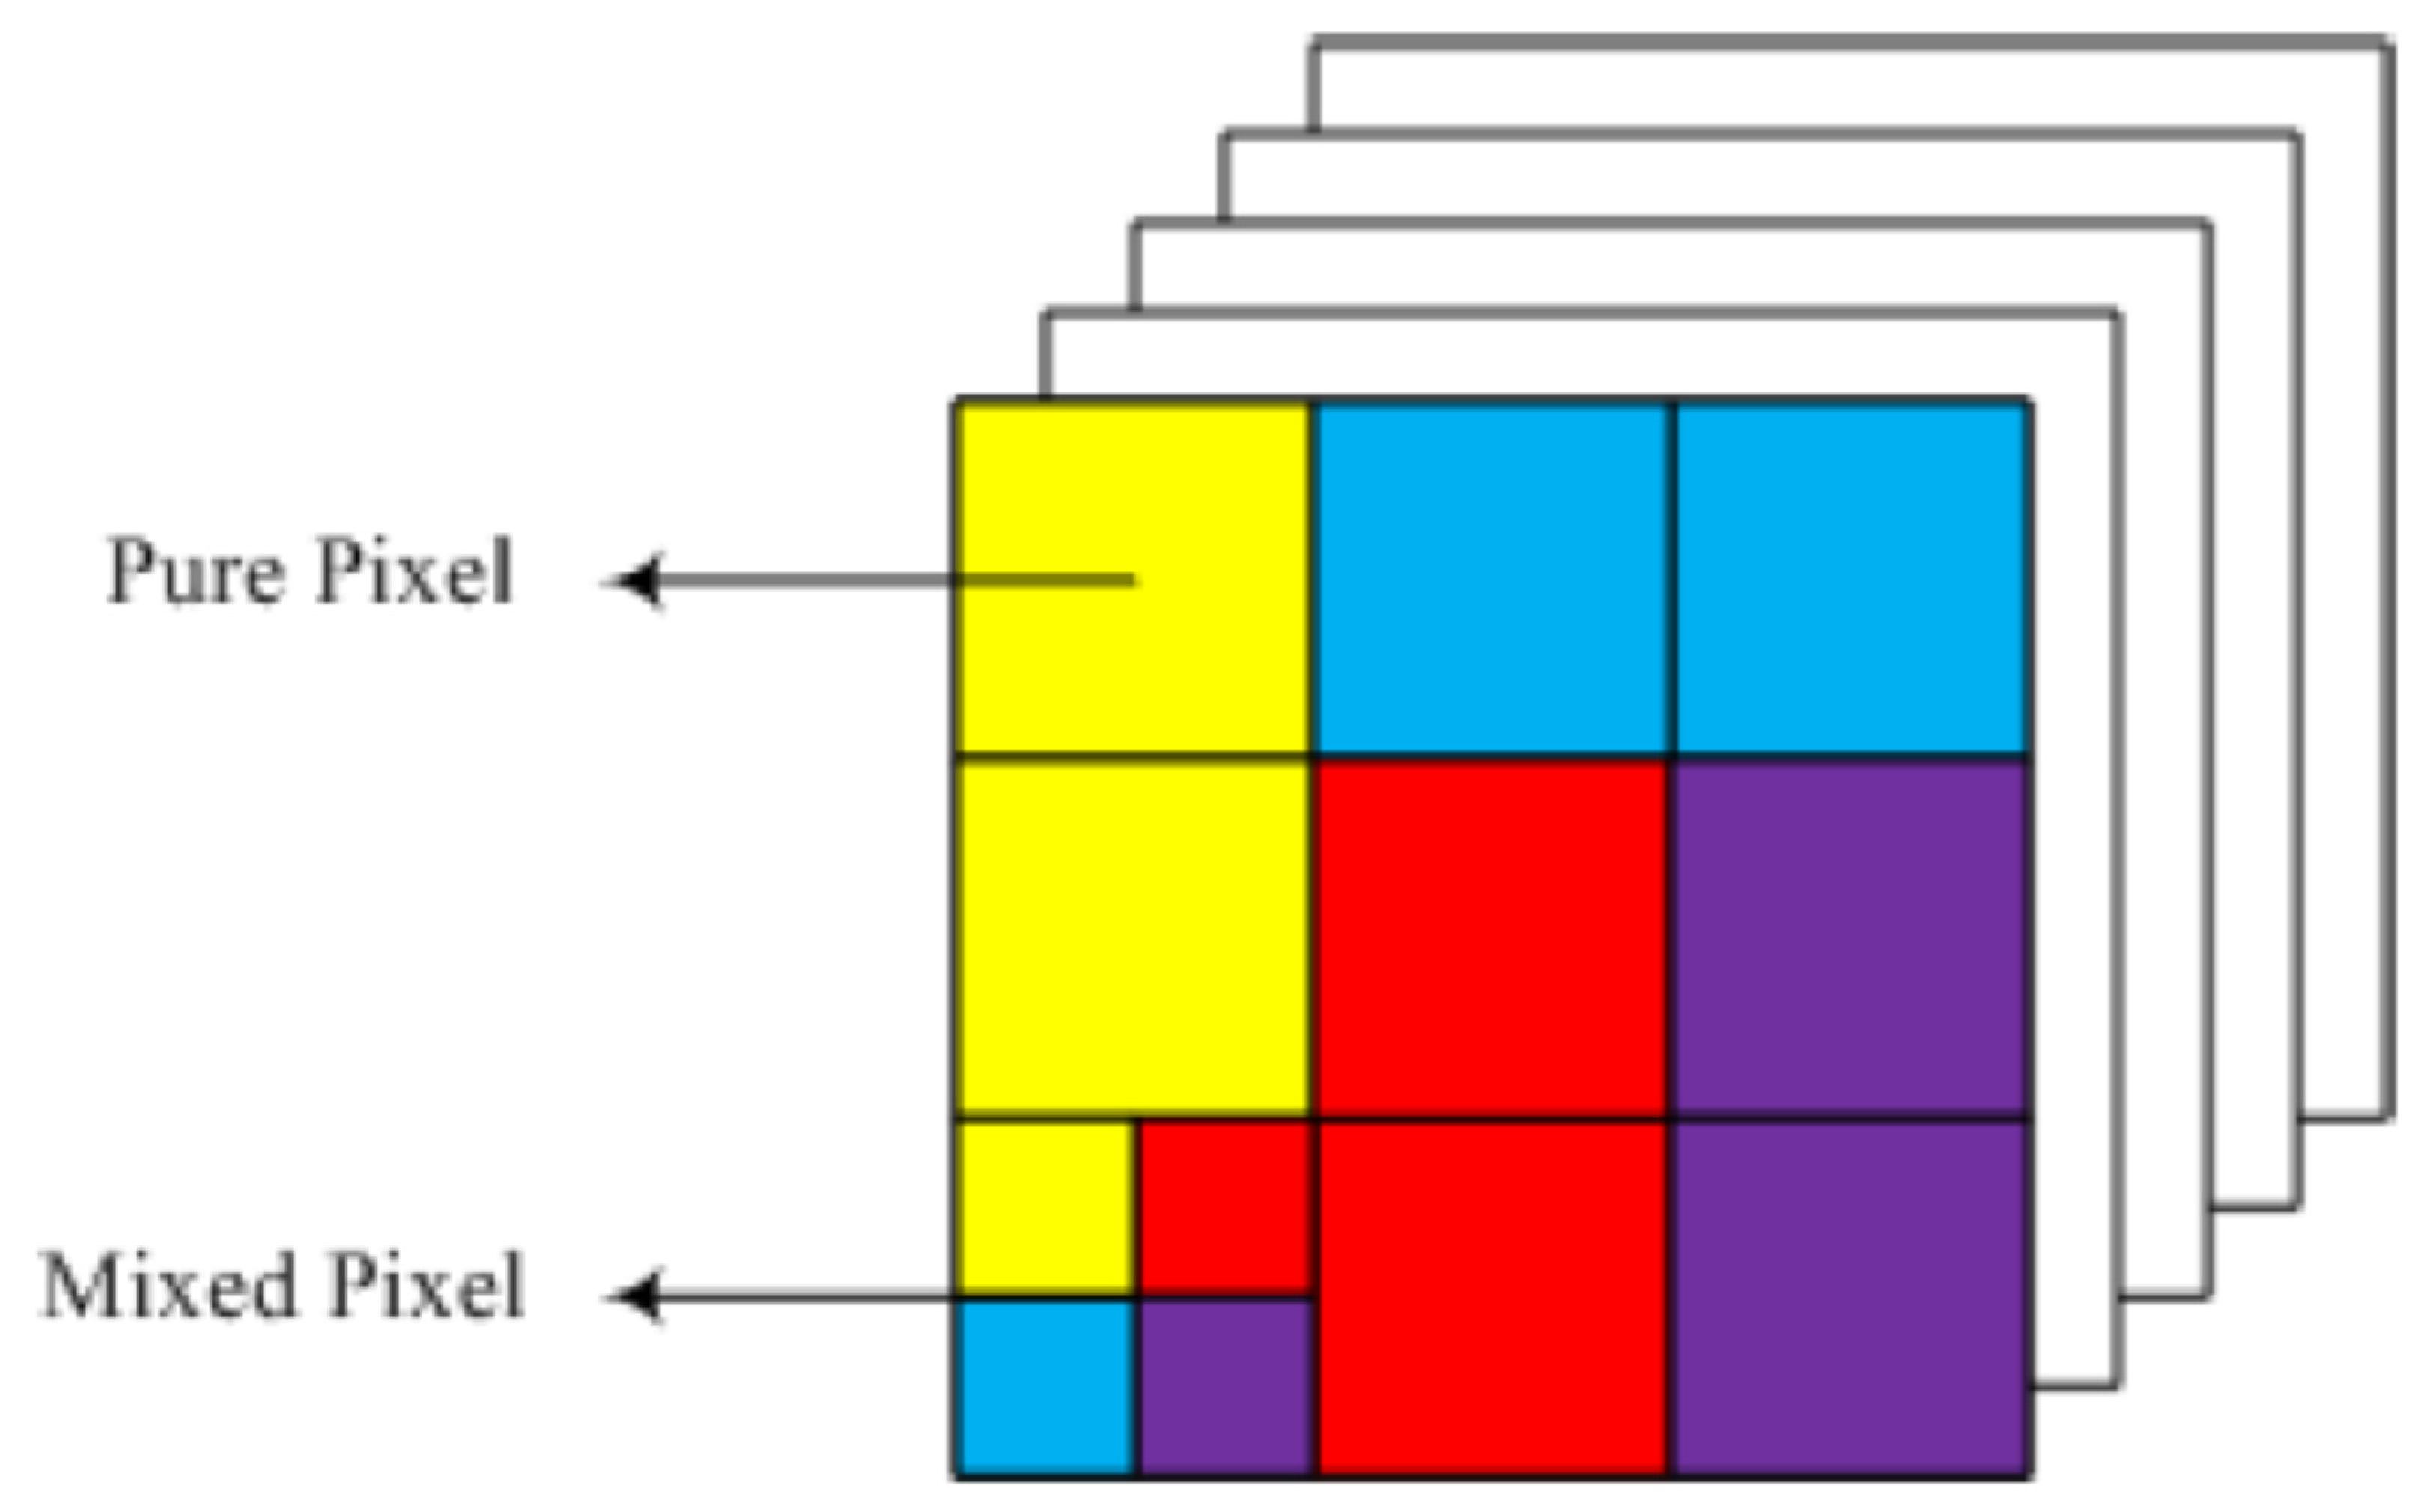
Raw pixels mean pixels made up of only one material. However, the mixed pixels as shown in the figure contain more than one single material.
Figure 2.
Pure Pixel and Mixed Pixel.
Figure 2.
Pure Pixel and Mixed Pixel.
Spectral algorithms transform mixed pixel cells into end members and relative frequency. The end-members are actually spectral signatures present in the present and the relative frequency is the ratio of the end-members in each pixel cell. The relative frequency must be positive for each end member.
There are different assumptions about the type of mixture of electromagnetic spectra. Based on these assumptions, different mixture models have been presented that fall into two main categories, linear and nonlinear.
4. Look at Previous Methods
Methods used for the broad spectrum of minerals fall into two categories: experimental and remote.
4.1. Laboratory Method (Open Space)
In the laboratory method, samples of metals with a high percentage of purity are prepared from the target material, several samples are prepared from each of them to measure the spectrum after jumping and corrosion, and finally data is obtained from their high-resolution images in order to identify, characterize, analyze or classify what was evaluated.
Developed. This method provides us with more accurate information than telemetry.
4.2. Telemetry Method
In this method, multispectral imaging systems on satellites or aircraft are more targeted.
Identifying areas exposed to the presence of important deposits and preparing hyperspectral images from a distance from the target areas is proven, but due to factors such as ground reflection effects, atmospheric effects and mixing effects, these data are less accurate and must be corrected.
At present, HU algorithms are mainly examined from three points of view:
1- Statistics-based deconfliction strategy.
2- Non-dispersive mixing based on spectral library.
3- End member extraction based on fully constrained least squares.
Statistics-based algorithms have recently attracted a lot of attention, partly because these algorithms can estimate endmembers and abundance simultaneously, but mainly because of their Bayesian model, which can solve HU problems using fast mathematical and physical formulation methods.
Classical statistical frameworks focus on non-negative matrix factorization (NMF), which blindly decomposes the HSI into the product of finite member matrices and abundance matrices by optimizing two matrices. By imposing various constraints on the underlying NMF, several NMF-based variants can realize optimal non-mixing functions, such as the 1/2 dispersion regularizer [
8], the graph constraint [
3], and the cooperative dispersion regularizer [
4].
Thus, compared to statistical frameworks for algorithms.
Sparse deconvolution relies on an existing spectral library rather than exploiting end members, which means they focus largely on estimating the abundance matrix. In general, there are many inherent advantages of abundance, including overall diversity.
The joint dispersion of non-local information, spatial discontinuity information, etc. is investigated to extract the end member based on the fully constrained least square, and is related to two independent parts that extract the end members first and then use the fully constrained least square algorithm [
5] to estimate the lot of application.
In addition, end-member extraction algorithms (EEAS) usually select desired end-members from the entire hyperspectral data space based on four lines of research. The first EEA algorithms are based on the extreme subspace projection of pixels with extreme projections when end-members are taken into account.
These include pixel purity index (I) [
6], orthogonal subspace projection (OSP) [
7] and vertex components (VC) analysis [
8]. Second, EEAs with a single maximum size define end-members by setting the maximum size among all unidirectional units. These include the N-FINDR Unidirectional Growth Algorithm (SGA).
Third, EEAs based on spectral-spatial information examine the process of using spectral-spatial features to explore end-members.
These include automated morphological end-member extraction (AMEE) and spectral-spatial end-member extraction (SSEF) [
9].
Spatially Weighted Unidirectional Strategy (SWSS) and Spatial Energy Constrained One-way Maximum (SEM) [
10] Although the EEA identifies endmembers from the entire data in an unsupervised manner, recent efforts are equal. This area highlights the preprocessing algorithm (PPA), which typically searches for a set of spatial-spectral information to select a subset of the data for the next end-member extraction task.
4.3. Principal Components Analysis PCA
Principal component analysis is a mathematical technique that uses statistical properties of data to transform potentially correlated data sets into uncorrelated data sets in such a way that the maximum amount of information is preserved.
This uncorrelated data set is called the principal components. The number of principal components is less than or equal to the number of primary data. This transformation cold also be used to reduce the features. If X is the hyperspectral data matrix, its PCA transformation is defined as the covariance matrix
The datasets obtained are uncorrelated: [
11]
In the above relationship, is the PCA transformation matrix, 1 and d is the number of principal components.
Under this L transformation, the spectrally correlated image is transformed into an uncorrelated image d.
The transformation matrix is obtained using the eigenvectors of the covariance matrix of the original data set, X and is defined in such a way that its principal component has the highest possible variance and the next principal variance is minimized in descending order.
4.4. Pixel Purity Index Algorithm PPI
In this method, each time a spectral imaging of pixels on a particular line is obtained and its two end points are determined. This work is repeated for different directions, and finally the pixels that are placed more times are known as pixels with a pure spectrum [
12], and in the desired direction U, the image of the Pixel 7 is as follows:
The end members are the minimum and maximum value (y) in each direction. Therefore, the number of tests must be large enough so that the chances of finding pure pixel textures are higher than the limitations of this non-statistical method:
4.5. Spatial Energy Algorithm
This spatial energy approach is proposed to extract the spatial spectral endmember of hyperspectral images.
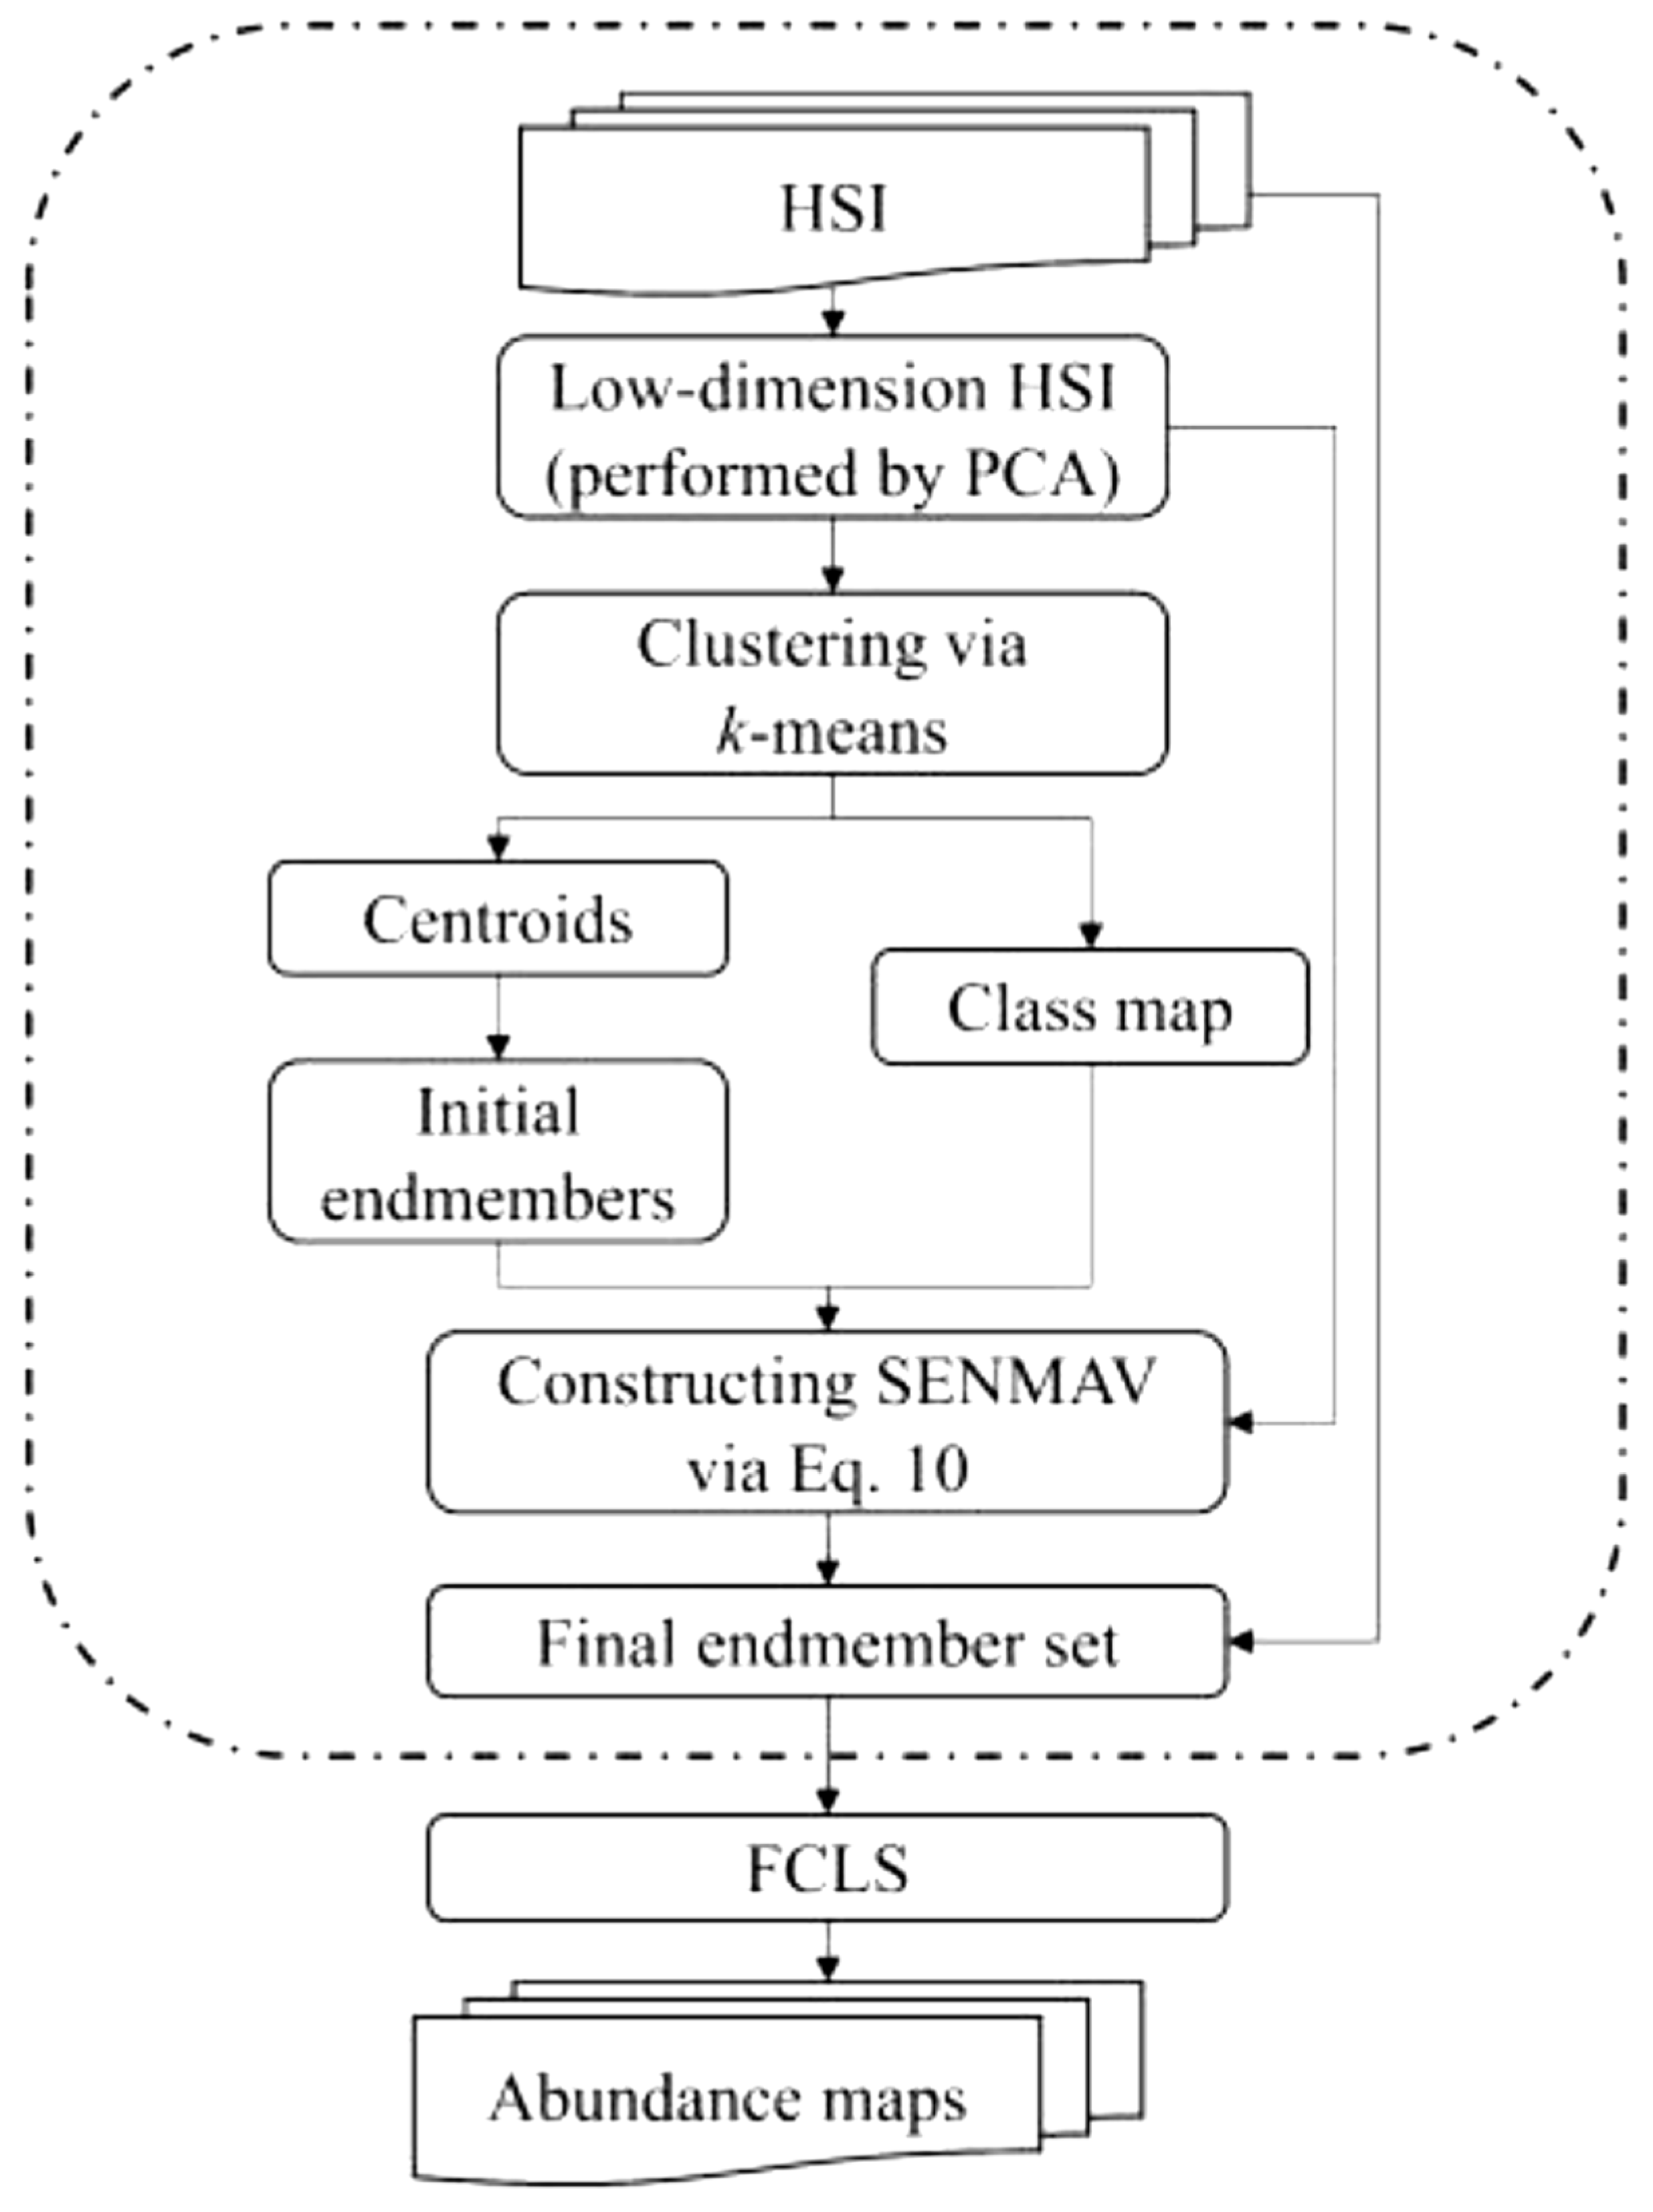
SENMAV (Spatial ENergy prior constrained MAximum simplex Volume) examines spatial information from the perspective of the spatial energy of a former Markov Random Field (MRF), which is used as a regularization expression for the traditional maximum-volume single model to constrain the selection of endmembers in both spatial and spectral domains. New light on endmember extraction on a spectral-spatial basis because SENMAV parallelizes the accuracy of end-member extraction and the spatial feature requirements of the end-members are well-matched. First, we reduced the original HSI to low dimensionality using the PCA method.
We then cluster the dimensionally reduced HSI (Hyper Spectral Image) into a class map via k-means clustering, which captures the spatial energy before the end-member candidates, and the end-member candidates can be randomly selected from the centroids derived from the clustering step. Act Based on the previously limited singular volume framework of space energy, the end members can finally be searched
Until the maximum values of the objective function form. [
13]
Figure 3.
SENMAV diagram.
Figure 3.
SENMAV diagram.
5. Algorithms Based on Thin Architecture
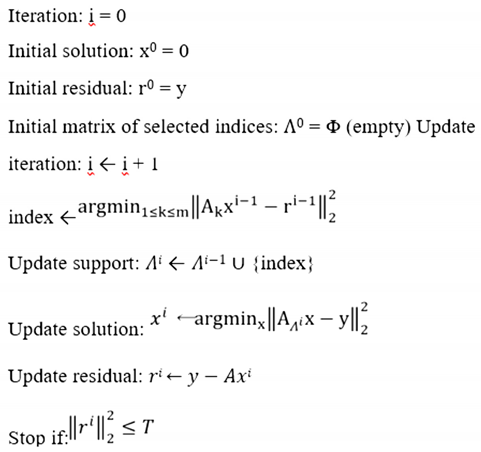
5.1. Orthogonal Matching Pursuit OMP
The basis of this algorithm is to use the optimization problem in such a way that it remains the same.
The y - Axi is obtained as the concatenated set of and the estimate of x in the iteration of the algorithm.
In the first iteration, the initial residual is equal to the observed spectrum of the pixel, the zero relative frequency vector is selected, and the given matrix is empty of end members.
Then, in each iteration, the algorithm searches for the member A that has the best relationship with the true residual, adds this member to the finite member matrix, updates its value, and calculates an estimate of x using the components of the given finite members.
The algorithm stops at some point. The stopping criterion is met when the actual residual value is less than a predetermined threshold and member A cannot be selected more than once because the residual ratio is zero for members who have already been selected. [
14]
5.2. Iterative Spectral Mixture Analysis ISMA
An iterative spectral mixture analysis (ISMA) algorithm is used to solve the optimization problem. The ISMA algorithm is an iterative technique resulting from standard spectral mixture analysis.
The goal of this algorithm is to find the optimal set of end members to estimate the relative frequency.
The algorithm consists of two parts. The result is an examination of the change in mean square error. The mse base is determined after reconstructing the original scene using relative abundance estimates.
First, ISMA computes an uncertain solution to the separation problem using all spectral signatures present in spectral library A, then compares them with the lowest estimated relative frequency in x and removes the spectral signature, the process of iterating the target spectral signature so that the spectral signature remains.
In the second part of the algorithm, the so-called critical iteration is associated with the first sudden change in rmse. [
15]
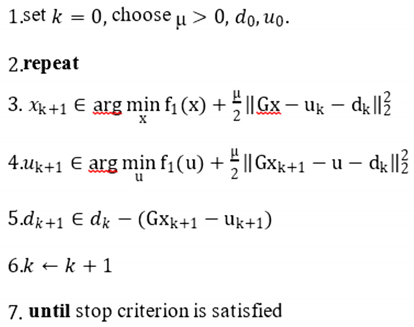
5.3. Alternating Direction Method of Multipliers ADMM
Convex optimization problems are common in hyperspectral separation, examples of which are constrained least squares (CLS) and fully constrained least squares (FCLS), problems of this class used to calculate relative frequency in linear mixtures with known spectra.
The CBP finite basis tracing problem, which is used to find tight smoothness, for example with a few non-zero elements, uses linear mixtures of spectra available in large libraries.
The constrained baseline tracking denoising (CBPDN) problem, a generalization of BP, admits modeling errors. In this method, two new algorithms are introduced to effectively solve optimization problems based on multiple alternative methods, one of which is the complete Lagrangian family presented. [
16]
6. Results and Conclusion
The method proposed in this thesis is to obtain the final elements of hyperspectral images using a multilayer negative matrix decomposition method.
The reason for using this method is that, unlike hyperspectral images, which form the image in a number of high-frequency bands, we form the image at 8 different frequencies, so what is most important is obtaining all the information hidden at those frequencies.
Hierarchical access to layers is not allowed in previous methods, and is only examined as a single layer, but in the proposed method hidden information in layers can be accessed. [
17]
6.1. Data Entry for the Algorithm
Two types of data are used to perform hyperspectral experiments and detailed algorithms:
Several spectrometers in different years have recorded images used to test different algorithms. Hyperspectral data mentioned below is recorded using an airborne visible infrared imaging spectrometer and copyrighted by Navad Ahsgar Aviris. It is an imaging spectrometer with 224 channels and a resolution of about 11 nm covering the wavelength range.
The spatial resolution is also 21 meters. Using this data has many advantages, including that this site has been used for remote sensing experiments since 1981, and many high-resolution studies are available in this field.
The cuprite zone is also a zone containing unpreserved and exposed minerals. To improve separation performance, bands with low signal-to-noise ratio due to atmospheric effects are removed from the 224 bands of the data cube. Therefore, 188 bands of these images will be used.
6.2. Image Simulation
Since hyperspectral images for SAR are not accessible, we tried to generate these data by simulation. The first step was to choose the SAR image formation method, for which we used RDA and then the reflectance of minerals at various frequencies had to be included in the image formation and the level of surface roughness and smoothness. .
Suppose these issues are listed below in order:
6.3. RDA Method
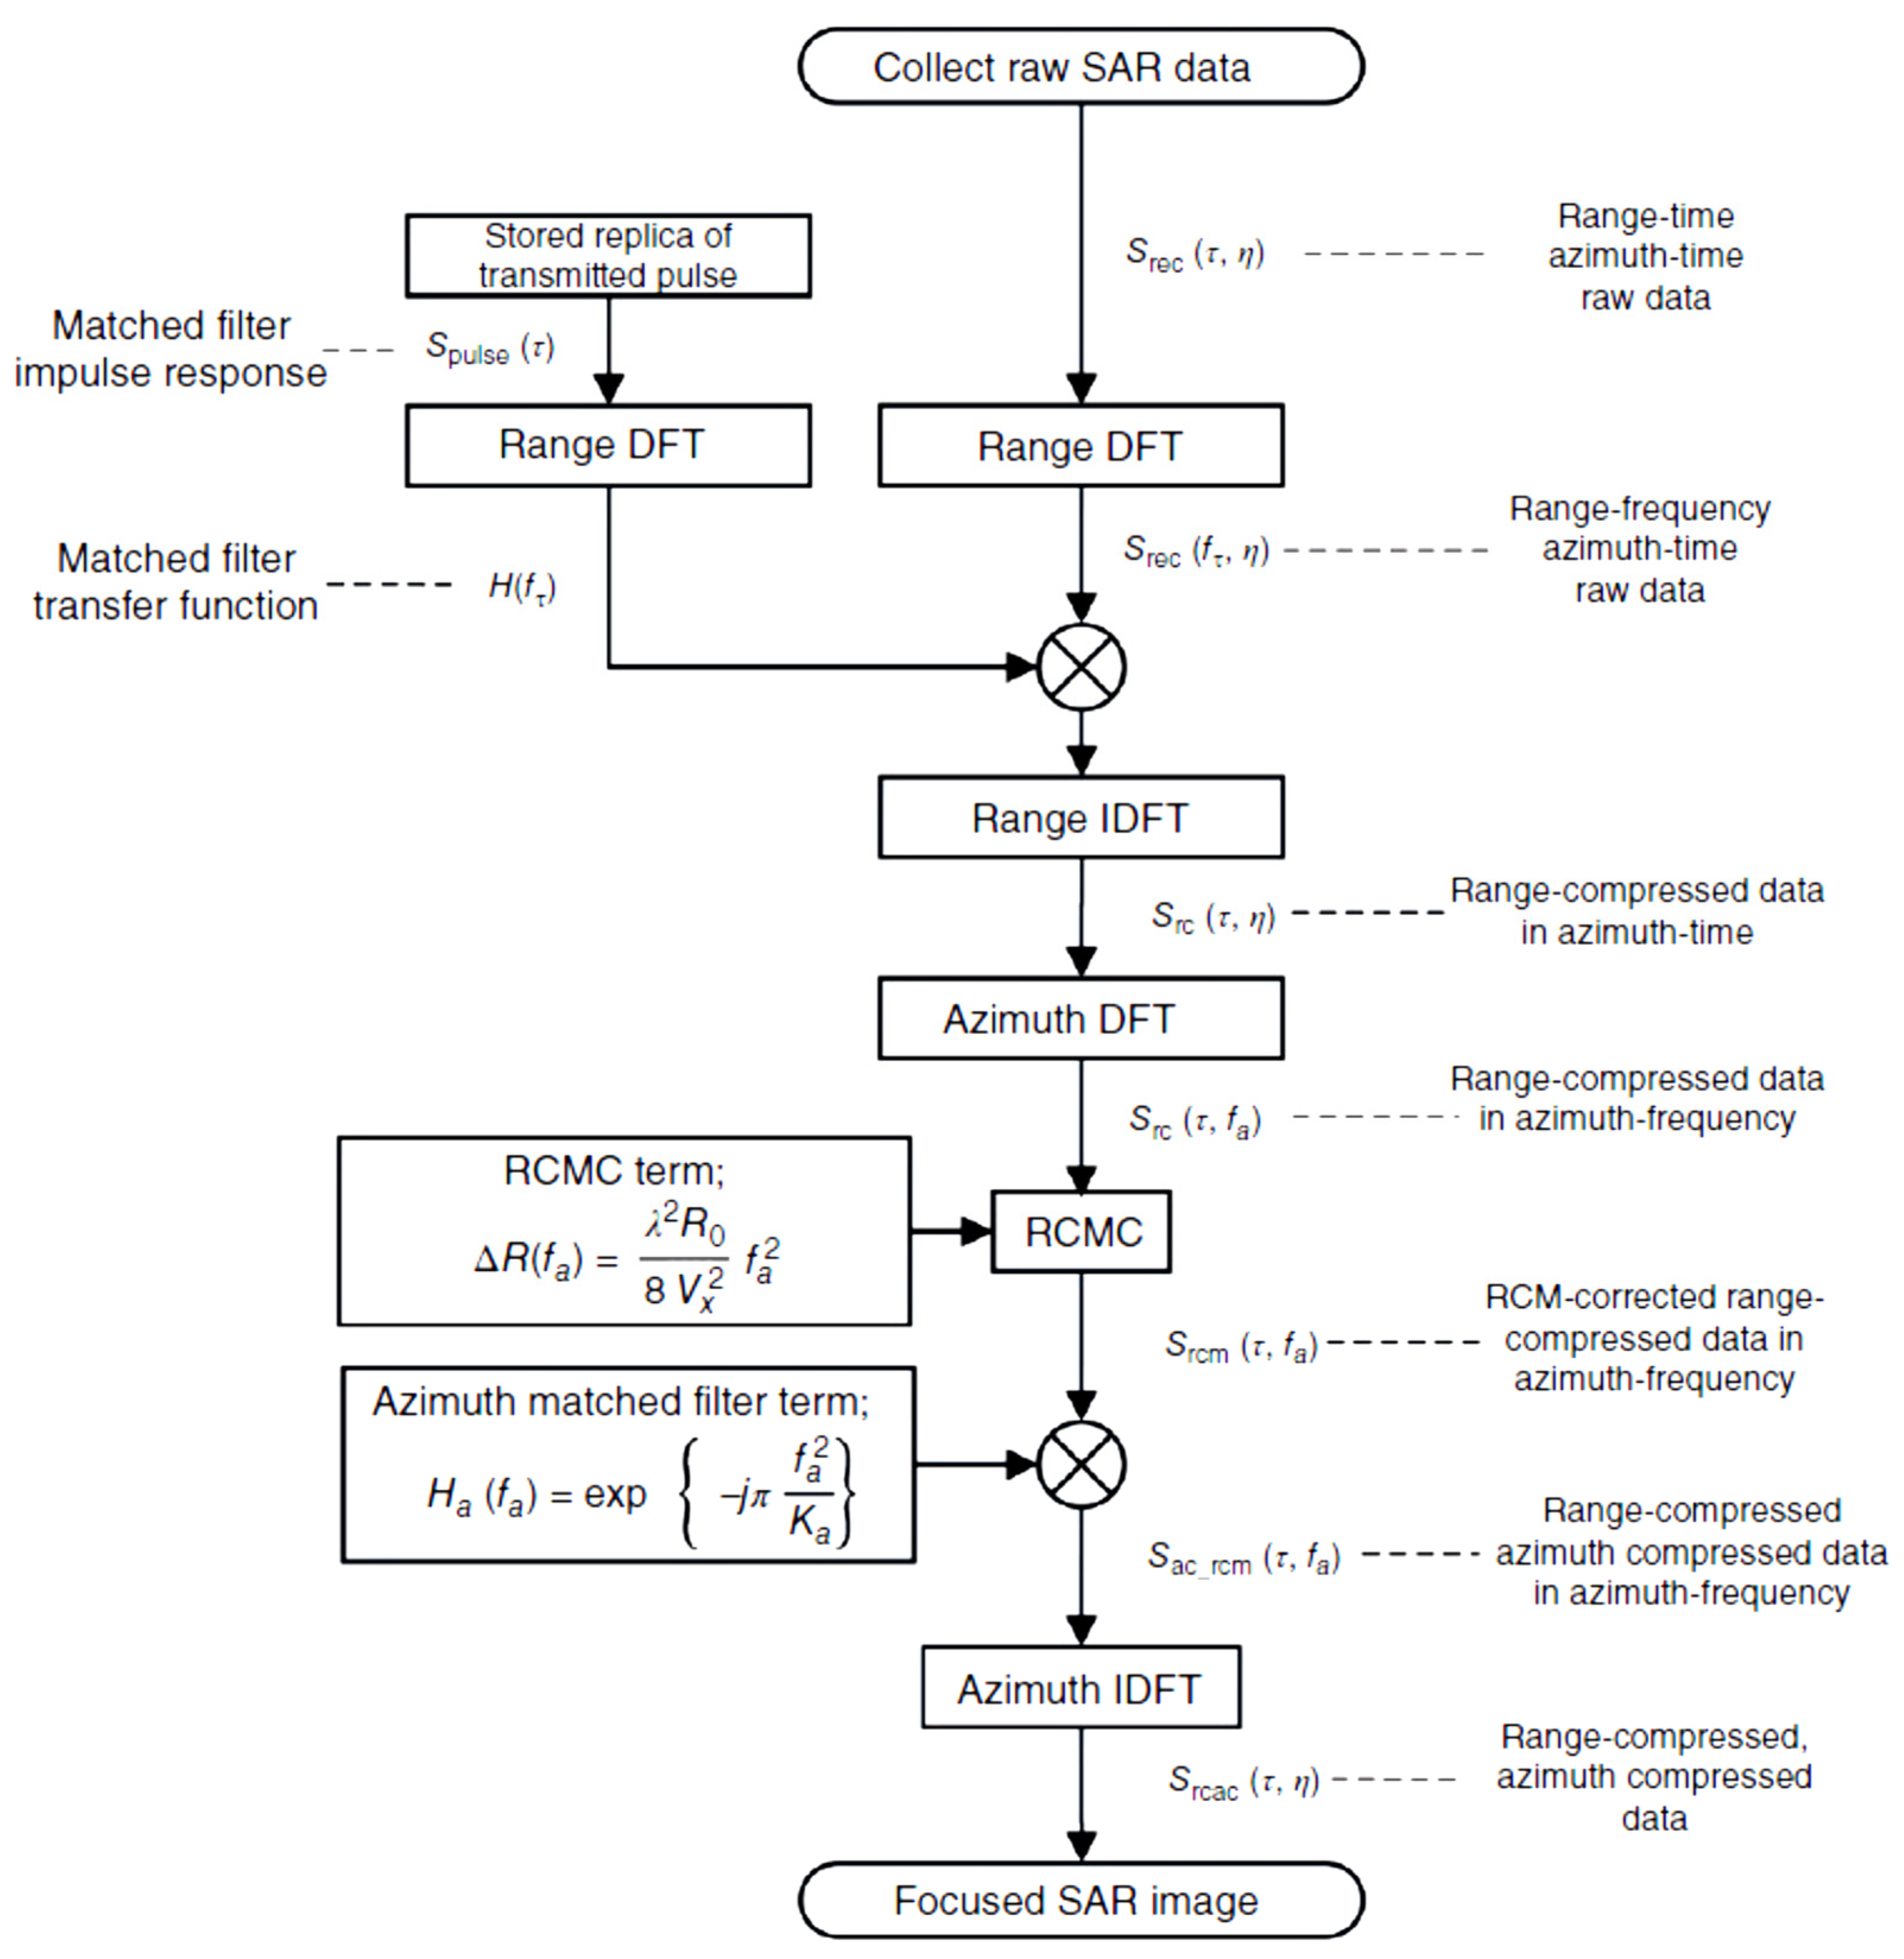
First, we begin by creating an image of the RDA method, the steps of which are summarized in the diagram below. According to the book, the return signal, which is called raw SAR data, is as follows, where the parameter
is the value of the back-scattering reflectivity .
Figure 4.
RDA follow-chart.
Figure 4.
RDA follow-chart.
The amounts in the table below can be used to make one pixel in this way:
Table 1.
Parameters for simulation to one Pixel.
Table 1.
Parameters for simulation to one Pixel.
| The name of the parameter |
Parameter Symbol |
parameter value |
| Pulse repetition frequency |
PRF |
600 Hz |
| Radar platform speed |
v |
200 m/sec |
| Carrier frequency |
|
300M |
| The length of the antenna along the side |
|
0.6 m |
| Range Swath |
|
400 m |
| The distance from the platform to the center Range Swath |
|
20 Km |
| flight height |
h |
14142 m |
| The width of the transmitted chirp pulse |
|
2.5 µsec |
| Chirp rate sent |
|
4xHz/sec |
| Sampling frequency |
|
200 MHz |
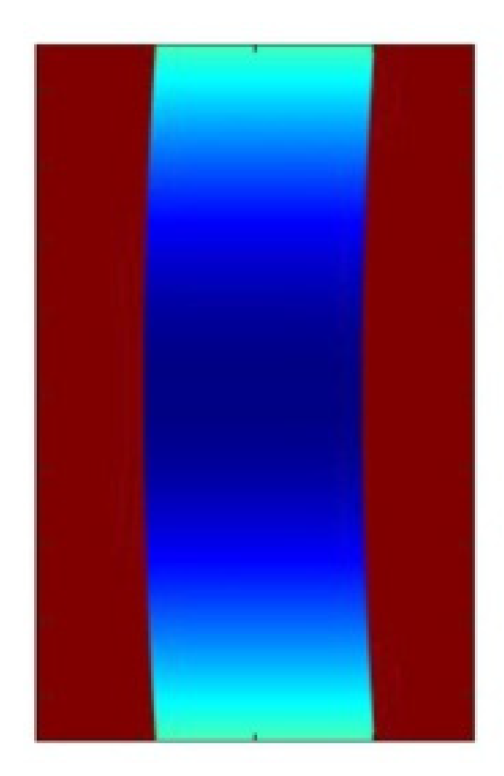
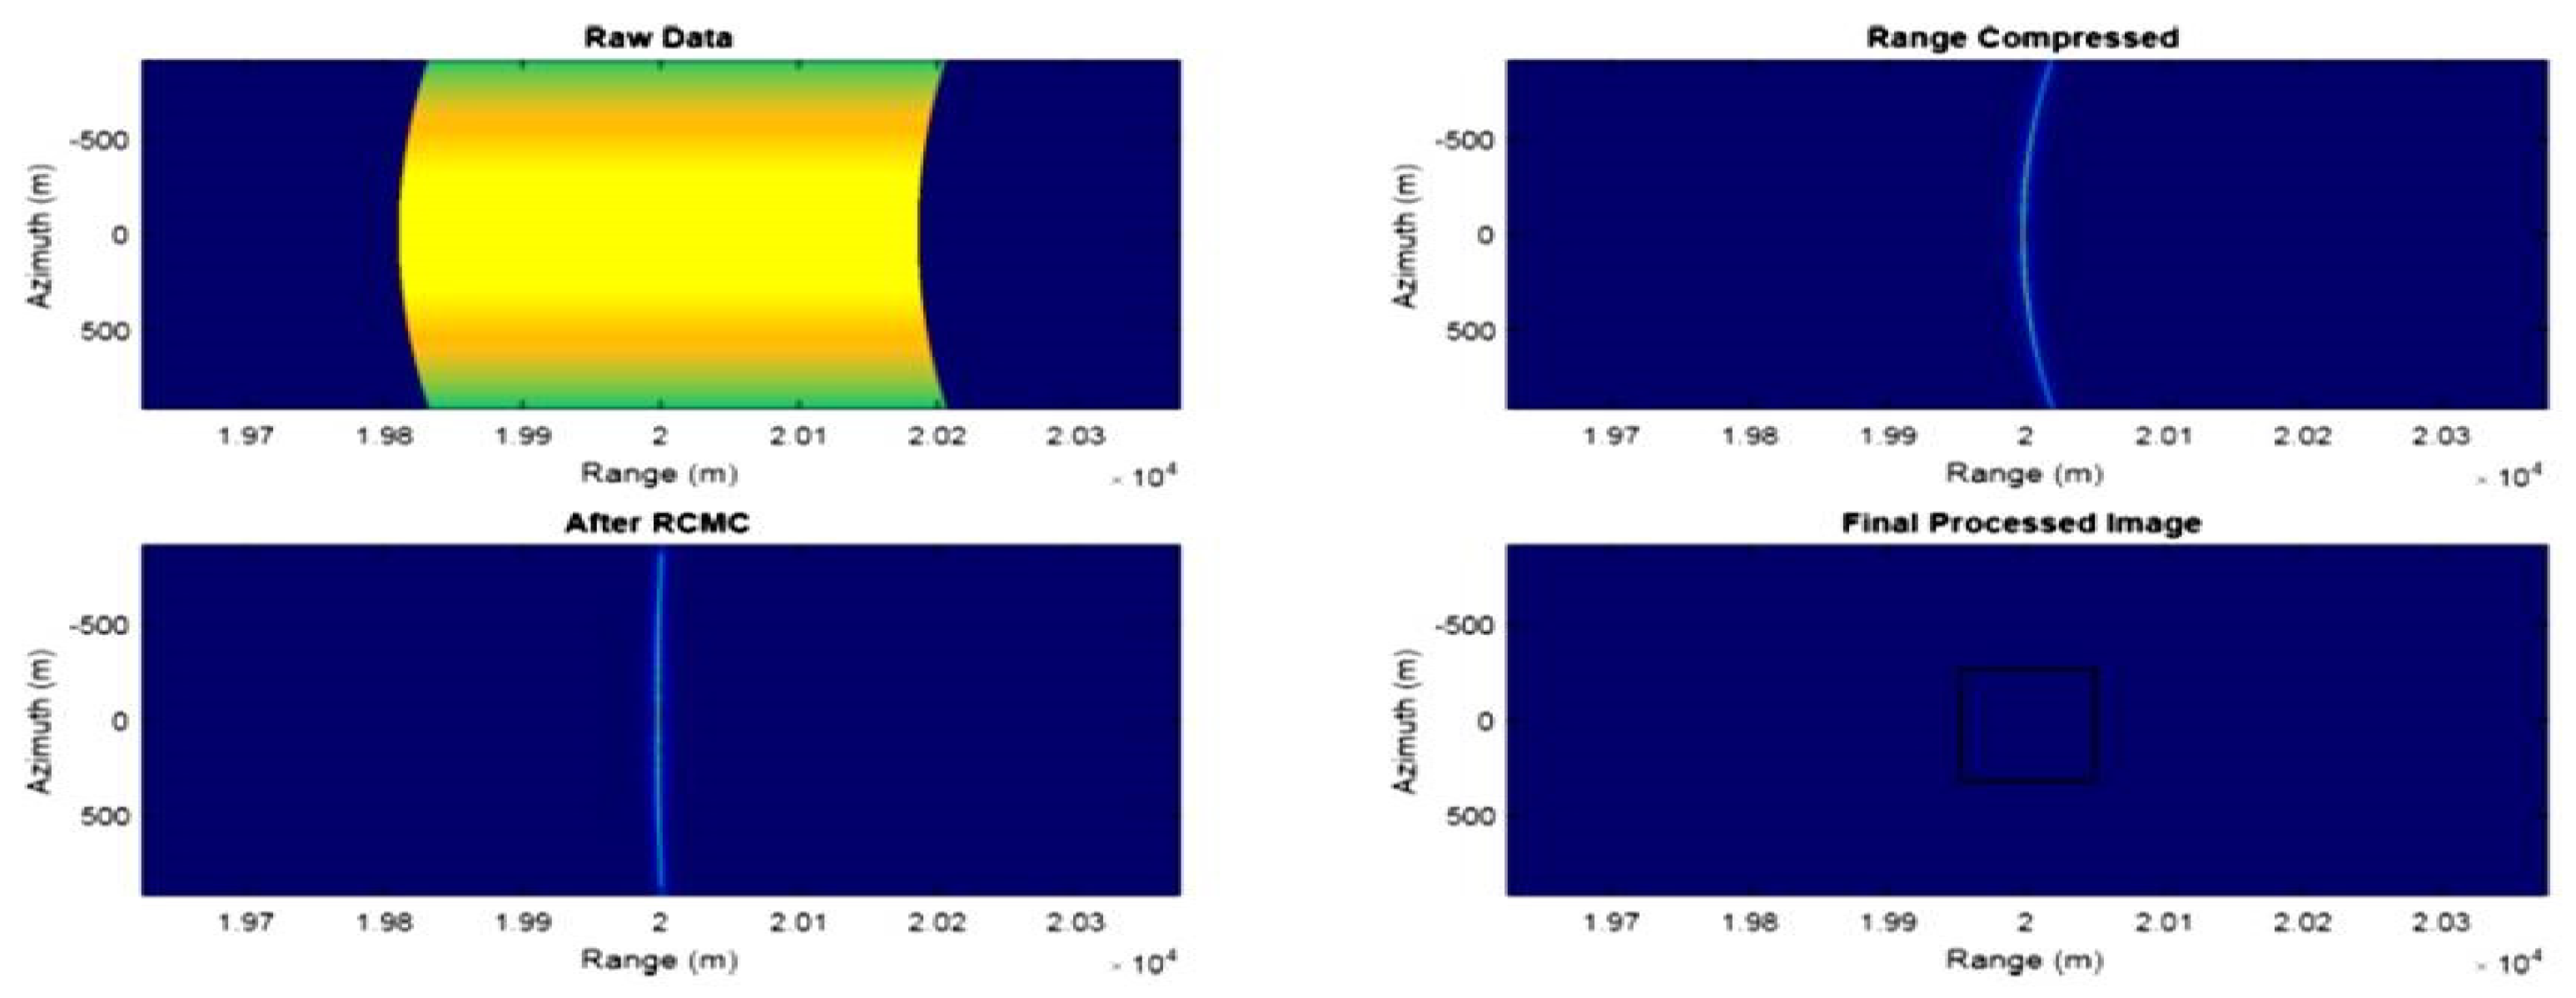
First, the unprocessed raw data is produced as follows, then the processing steps are performed on it and the result is obtained as follows:
Figure 6.
creating a Pixel using RDA.
Figure 6.
creating a Pixel using RDA.
In a fuzzy cloud image, each pixel describes a certain radian of the corresponding position. Due to the lack of specific solutions for hyperspectral images, one pixel often covers several different materials. Therefore, this special spectrum is the combination of the results of several substances according to their distribution and formation. The goals of these combinations are to identify the presence of substances distributed in this area and estimate their parts. To do this, advanced hybrid and non-hybrid models have become vital.
Acknowledgments
The authors would like to thank the anonymous reviewers for their valuable and helpful comments and suggestions.
References
- [1] C. Wu, “A digital system to produce imagery from sar data,” in Systems Design Driven by Sensors, vol.1, 1976.
- [2] M. Y. Jin and C. Wu, “A sar correlation algorithm which accommodates large-range migration,” IEEE Transactions on Geoscience and Remote Sensing, no.6, pp.592-597, 1984. [CrossRef]
- [3] X. Lu, H. Wu, Y. Yuan, P. Yan, and X. Li, “Manifold regularized sparse NMF for hyperspectral unmixing,” IEEE Trans. Geosci. Remote. Sens., vol. 51, no. 5-1, pp. 2815-2826, May 2013. [CrossRef]
- [4] J. Li, J. M. Bioucas-Dias, A. J. Plaza, and L. Liu, “Robust collaborative nonnegative matrix factorization for hyperspectral unmixing,” IEEE Trans. Geosci. Remote. Sens., vol. 54, no. 10, pp. 6076-6090, Oct. 2016. [CrossRef]
- [5] S. Zhang, J. Li, Z. Wu, and A. Plaza, “Spatial discontinuity-weighted sparse unmixing of hyperspectral images,” IEEE Trans. Geosci. Remote. Sens., vol. 56, no. 10, pp. 5767-5779, Oct. 2018. [CrossRef]
- [6] A. Tropp, A. C. Gilbert, and M. J. Strauss, “Algorithms for simultaneous sparse approximation. Part I: Greedy pursuit,” Signal processing, vol. 86, no. 3, pp. 572-588, 2006.
- [7] X. Shen and W. Bao, “Hyperspectral endmember extraction using spatially weighted simplex strategy,” Remote. Sens., vol. 11, no. 18, 2019, Art. no. 2147. [CrossRef]
- [8] F. Kowkabi and A. Keshavarz, “Using spectral geodesic and spatial Euclidean weights of neighborhood pixels for hyperspectral endmember extraction preprocessing.” ISPRS J. of Photogrammetry Remote Sens., vol. 158, pp. 201-218, 2019.
- [9] X. Shen and W. Bao, “A spatial energy and spectral purity based preprocessing algorithm for fast hyperspectral endmember extraction,” in Proc. 10th Workshop Hyperspectral Imag. Signal Process., Evol. Remote Sens., Amsterdam, Netherlands, 2019, pp. 1-5.
- [10] X. Shen, W. Bao, and K. Qu, “Spatial-spectral hyperspectral endmember extraction using a spatial energy prior constrained maximum simplex volume approach,” IEEE J. Sel. Top. Appl. Earth Obs. Remote. Sens., vol. 13, pp. 1347-1361, 2020. [CrossRef]
- [11] I. Jolliffe, Principal component analysis. Springer, 2011.
- [12] J. W. Boardman, F. A. Kruse, and R. O. Green, “Mapping target signatures via partial unmixing of AVIRIS data,” 1995.
- [13] X. Shen, W. Bao, and K. Qu, “Spatial-spectral hyperspectral endmember extraction using a spatial energy prior constrained maximum simplex volume approach,” IEEE J. Sel. Top. Appl. Earth Obs. Remote. Sens., vol. 13, pp. 1347-1361, 2020. [CrossRef]
- [14] Y. C. Pati, R. Rezaiifar, and P. S. Krishnaprasad, “Orthogonal matching pursuit: Recursive function approximation with applications to wavelet decomposition,” in Proceedings of 27th Asilomar conference on signals, systems and computers, 1993, pp. 40-44: IEEE.
- [15] D. M. Rogge, B. Rivard, J. Zhang, and J. Feng, “Iterative spectral unmixing for optimizing per-pixel endmember sets,” IEEE Transactions on Geoscience and Remote Sensing, vol. 44, no. 12, pp. 3725-3736, 2006. [CrossRef]
- [16] J. M. Bioucas-Dias and M. A. Figueiredo, “Alternating direction algorithms for constrained sparse regression : Application to hyperspectral unmixing,” in 2010 2nd Workshop on Hyperspectral Image and Signal Processing: Evolution in Remote Sensing, 2010, pp. 1-4: IEEE.
- [17] X.Feng, H.Li, Rui Wang,” Hyperspectral Unmixing Based on Nonnegative Matrix Factorization: A Comprehensive Review”, 20 May 2022. arXiv:2205.09933v1.
|
Disclaimer/Publisher’s Note: The statements, opinions and data contained in all publications are solely those of the individual author(s) and contributor(s) and not of MDPI and/or the editor(s). MDPI and/or the editor(s) disclaim responsibility for any injury to people or property resulting from any ideas, methods, instructions or products referred to in the content. |
© 2024 by the authors. Licensee MDPI, Basel, Switzerland. This article is an open access article distributed under the terms and conditions of the Creative Commons Attribution (CC BY) license (http://creativecommons.org/licenses/by/4.0/).

