Preprint
Article

Comparing the Ground Reaction Forces, Toe Clearances, and Stride Lengths of Young and Older Adults Using a Novel Shoe Sensor System

Altmetrics

Downloads

63

Views

113

Comments

0

A peer-reviewed article of this preprint also exists.

Submitted:

07 September 2024

Posted:

09 September 2024

You are already at the latest version

Alerts
Abstract
In this study, we developed a lightweight shoe sensor system equipped with four high-capacity, compact triaxial force sensors and an inertial measurement unit. Remarkably, this system enabled measurements of localized three-directional ground reaction forces (GRFs) at each sensor position (heel, first and fifth metatarsal heads, and toe) and estimations of stride length and toe clearance during walking. Compared to conventional optical motion analysis systems, the developed sensor system provided relatively accurate results for stride length and minimum toe clearance. To test the performance of the system, 15 older and eight young adults were instructed to walk along a straight-line while wearing the system. The results revealed that compared to the young adults, older adults exhibited lower localized GRF contributions from the heel and greater localized GRF contribution from the toe and fifth metatarsal locations. Furthermore, the older adults exhibited greater variability in their stride length and smaller toe clearance with greater variability compared to the young adults. These results underscore the effectiveness of the proposed gait analysis system in distinguishing the gait characteristics of young and older adults, potentially replacing traditional motion capture systems and force plates in gait analysis.
Keywords: 
Subject: Engineering  -   Bioengineering

1. Introduction

With the intensification of the demographic shift toward an aging population, falling incidents among older adults are becoming more frequent [1,2]. The aging adversely impacts gait performance, leading to reduced gait speed and stride length, along with increased variability in these parameters and foot clearance [3,4,5,6]. Studies have consistently demonstrated that such increased variability in the above parameters is associated with a heightened risk of falls among the elderly [3,7,8,9]. Furthermore, these variations in gait parameters are associated with alterations in kinetic parameters, such as ground reaction force (GRF), which impact movement dynamics [7,10,11]. Hence, measuring and monitoring these kinetic and kinematic parameters during walking can help identify older adults who are at a high risk of falling.
In the context of gait analysis, monitoring key kinetic and kinematic parameters, such as GRF [12,13,14,15], walking velocity [16,17,18,19], step length [15,19], step width [19], and foot clearance [3,20], is essential. Typically, this monitoring relies on three-dimensional motion analysis systems, comprising force plates and motion capture systems. However, these systems present certain limitations. For instance, they are expensive; require long periods for setup; and demand extensive, dedicated spaces, rendering them impractical in numerous clinical and everyday settings [21,22]. Furthermore, they are incapable of localized GRF measurements, which are vital for assessing the contact and interaction dynamics of a foot and floor during walking.
Conversely, shoe-based gait analysis systems offer enhanced flexibility by eliminating location constraints. These systems typically utilize force and pressure sensors to measure GRFs and their distribution [23,24,25,26,27,28,29]. Additionally, they incorporate inertial measurement units (IMUs) to assess kinematic parameters [30,31,32,33,34,35,36]. However, shoe-based gait analysis systems capable of simultaneously measuring or estimating both GRFs and kinematic parameters using both force sensors and IMUs are yet to be developed.
To address this, the current study set the following goals: 1) Developing and validating a lightweight shoe sensor system equipped with four compact, high-capacity triaxial force sensors and one IMU. 2) Determining whether this system can identify differences in the gait characteristics of young and older adults. To achieve these objectives, two studies were conducted: Study 1 (S1) focused on developing the shoe sensor system, estimating stride length and toe clearance using data obtained from this system, and comparing these data with values extracted from an optical motion capture system. Meanwhile, Study 2 (S2) focused on measuring and estimating the localized GRFs, stride lengths, and minimum toe clearances of young and older adults during straight walking using the shoe sensor shoe system.

2. Methods

2.1. Study 1 (S1)

In S1, the shoe sensor system was developed, and its accuracy in estimating stride length and minimum toe clearance was compared with that of an optical motion capture system.

2.1.1. Developing the Shoe Sensor System

Figure 1 illustrates the shoe sensor system developed in this study. To assemble this system, an 8-mm-thick polyethylene foam outsole was attached to the sole of each walking shoe from a pair (LifeWalker Women’s FLC307, sizes: 23.5 cm and 25.0 cm; ASICS, Kobe, Japan). Subsequently, a triaxial force sensor with a Cr‒N thin-film (Research Institute for Electromagnetic Materials, Tomiya, Japan; dimensions: 20 mm × 20 mm × 7.5 mm; mass: 18 g) [28] was affixed to a partially cut-out portion of the sole. This sensor comprised a 20 mm square stainless-steel housing and a force-sensing contactor (lever). In total, eight sensors—four in each shoe—were used to simultaneously measure forces in three directions at various locations. The sensors were enclosed within 2-mm-thick nitrile rubber to minimize abrasion between the sensor contactor and ground. An IMU (9-DOF Absolute Orientation IMU Fusion Breakout-BNO055; Adafruit, NY, USA; dimensions: 18 mm × 11 mm × 4 mm; mass: 0.6 g) was then mounted at the toe of the shoe at a distance of 3 mm above the ground using adhesive, as illustrated in Figure 1b. The force sensors and IMU were connected to a microcontroller (Teensy 3.6, SparkFun, Electronics®, Niwot, CO, USA). Additionally, the microcontroller board and battery were enclosed in a case, which was attached to the side of the shoe. The microcontroller was wired to a trigger and activated by pressing a switch, which initiated data recording on an SD memory card. The force sensors and IMU had sampling frequencies of approximately 400 Hz and 80 Hz, respectively. The total weight of each shoe, including the sensors, battery, and board, was 309 g. As depicted in Figure 1, in the local coordinate system of each force sensor and the IMU, the x’, y’, and z’ directions represented the foot width, foot length, and vertical direction of the shoe, respectively. Furthermore, the three-directional forces measured by the triaxial sensors were denoted as F x i , F y i , and F z i , respectively, with i denoting the position of the sensor, where i = 1, 2, 3, and 4 denote the heel, first metatarsal, fifth metatarsal, and toe, respectively.

2.1.2. Data Processing Framework of the Gait Analysis System Using Shoe Sensor System

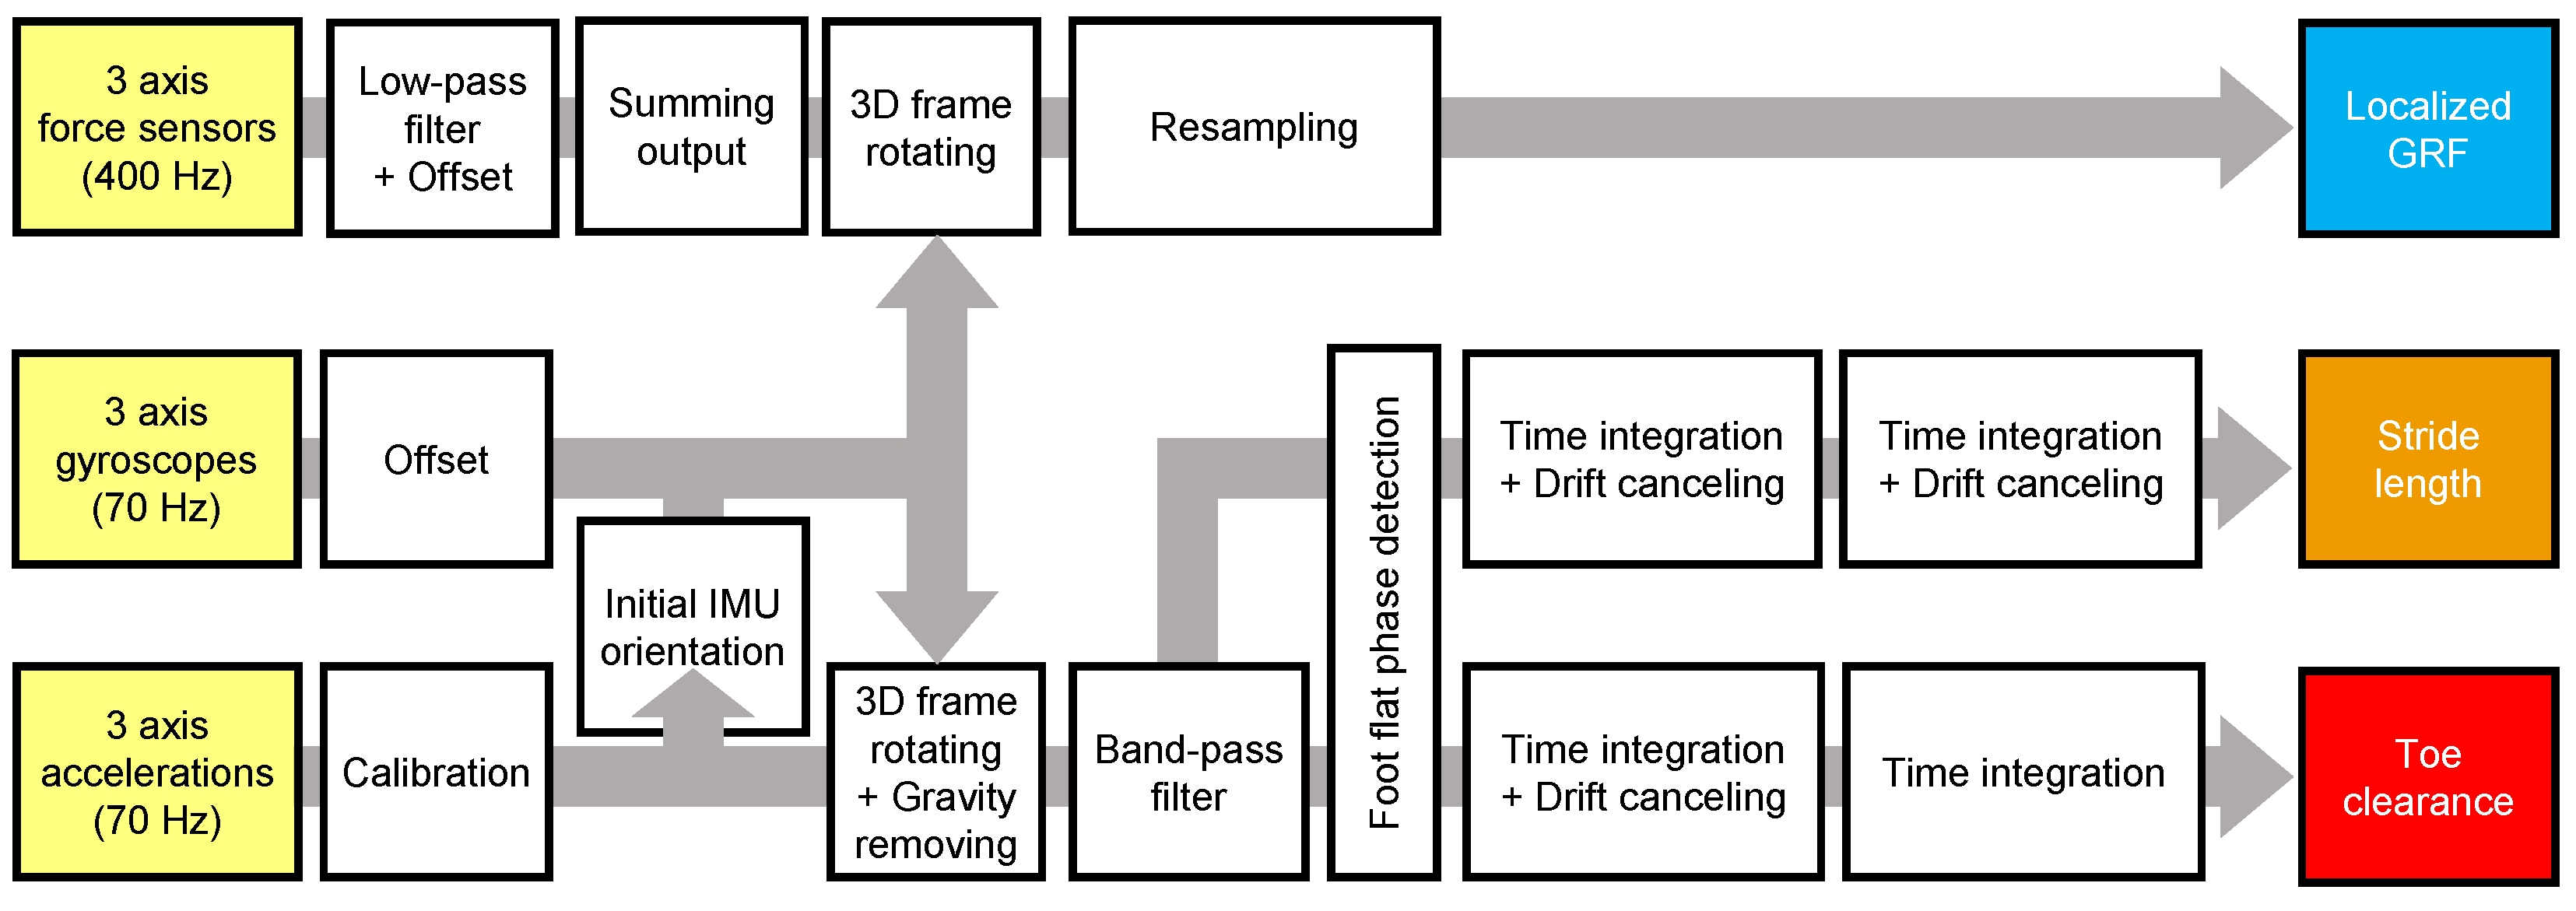
The methods used for analyzing localized GRFs, stride length, and toe clearance using force sensor and IMU data are outlined below, while the flow chart of the algorithm for data analysis is illustrated in Figure 2. Notably, all subsequent analyses were conducted using MATLAB ver. 9.14.0.2239454 (Mathworks, Natick, MA, USA).
First, the acceleration data were calibrated. For this, the IMU was positioned in 20 random stationary postures, and the calibration coefficients of acceleration and bias values were determined using a Newton iterative optimization algorithm. This process ensured that the composite acceleration in all three directions was equal to the norm of gravitational acceleration (= 9.81 m/s2) [37,38]. Next, the angles ( θ ) around the x’-axis and ( φ ) around y’-axis in the initial stationary position of the IMU were estimated using the calibrated acceleration data [38,39].
To calculate localized GRFs, time-series data of F x i , F y i , and F z i ( i = 1–4) recorded during the stance phase were analyzed. A fourth-order Butterworth low-pass filter with a cutoff frequency of 50 Hz was applied to these data to eliminate noise and then offsets were removed. Next, using angles θ and φ , the localized GRF data ( F x i , F y i , F z i ) were transformed into a horizontal and vertical coordinate system ( F x i , F y i , F z i ) on the ground, as follows.
F x i F y i F z i = cos φ 0 sin φ 0 1 0 sin φ 0 cos φ 1 0 0 0 cos θ sin θ 0 sin θ cos θ F x i F y i F z i
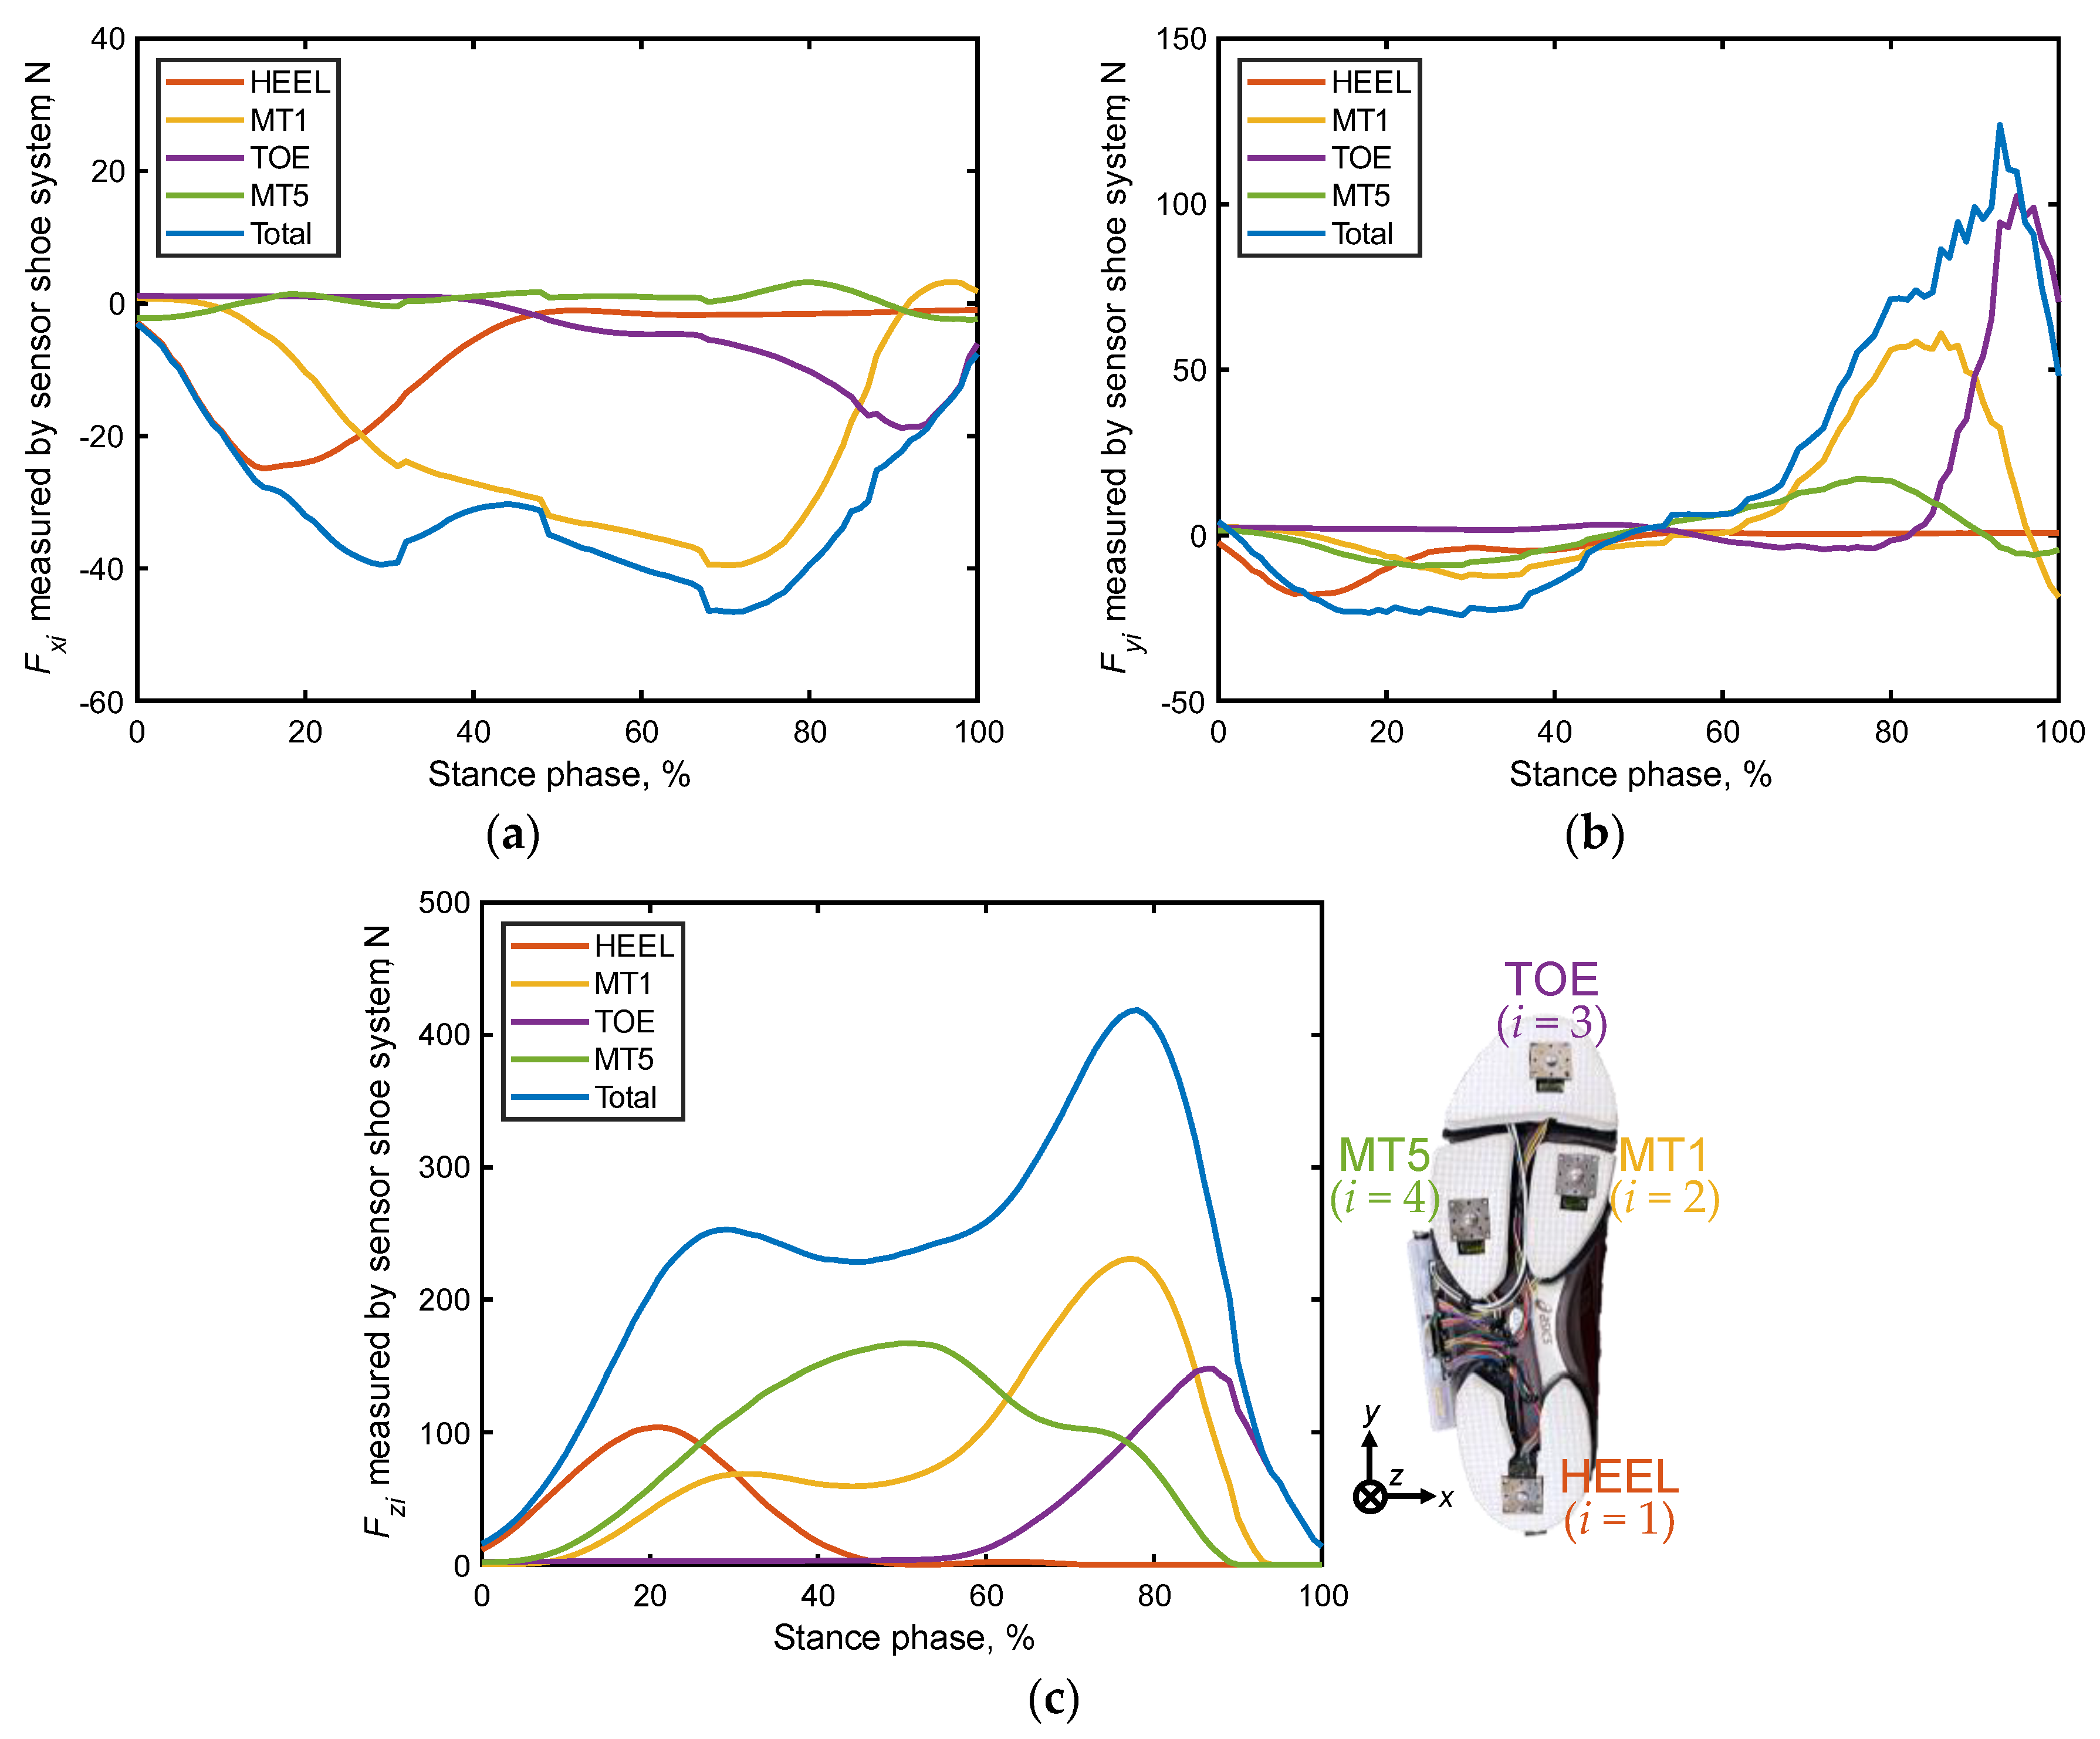
In the shoe sensor system, the stance was determined by monitoring the total value of F z i   ( i = 1–4). In particular, the beginning of the stance phase was marked by the instant at which i = 1 i = 4 F z i exceeded 15 N, while its end was signified by the instant at which i = 1 i = 4 F z i fell below 15 N, based on previous research [29]. Notably, the data in each stance phase were regrouped into 101 datasets, with 0% representing heel contact and 100% denoting toe off, to facilitate comparison of time-series changes during each trial. Figure 3 presents an example of the time-series changes observed in the localized GRFs during a stance phase, as recorded by the shoe sensor system.
To estimate stride length, initial posture correction was performed on the IMU data, followed by angular correction of the output acceleration data. Subsequently, the acceleration outputs (ax’, ay’, az’) were converted into the global coordinate system (ax, ay, az), as follows. In the following equation, ψ denotes the angle around the z’-axis of the IMU.
a x a y a z = cos ψ sin ψ 0 sin ψ cos ψ 0 0 0 1 cos φ 0 sin φ 0 1 0 sin φ 0 cos φ 1 0 0 0 cos θ sin θ 0 sin θ cos θ a x a y a z
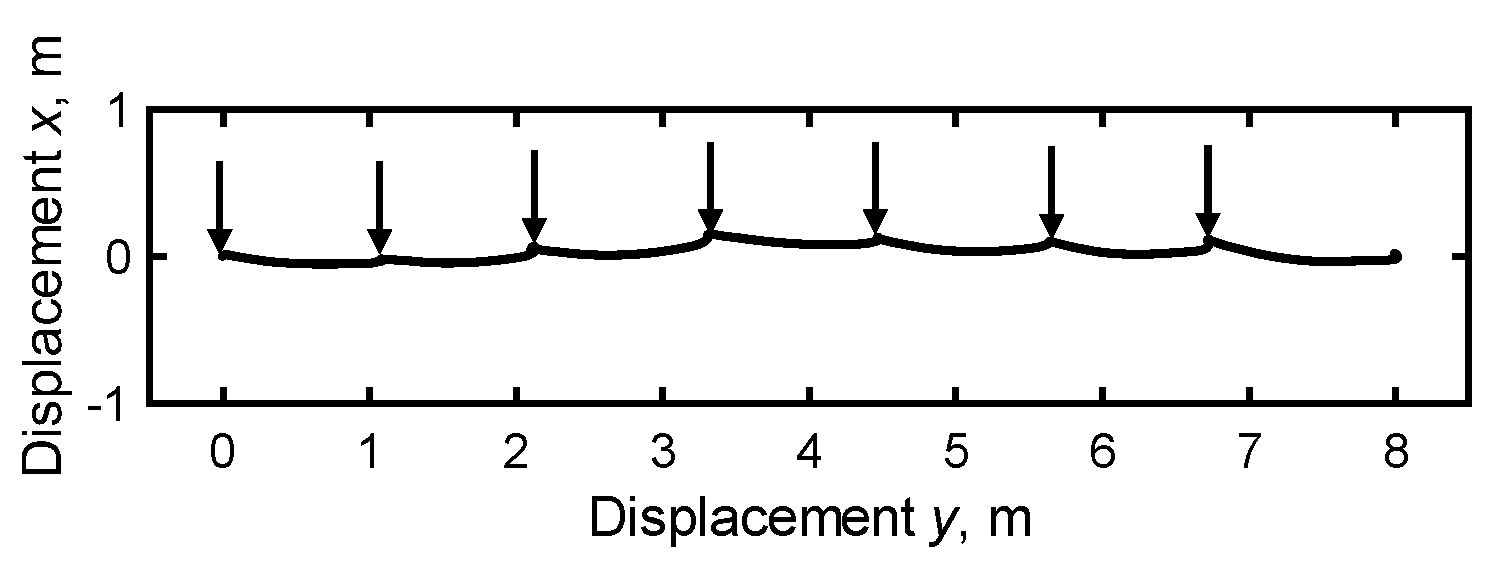
The acceleration data were first processed to eliminate the contribution of gravitational acceleration. Following this, time integration was performed on the horizontal accelerations ax and ay to compute the velocity of the IMU along the horizontal directions. For the resulting time-series velocity data, integration errors were assumed to increase linearly with time. Hence, following the approach adopted by a previous study, a zero horizontal velocity assumption was applied during each stride to compensate for the integration error [40,41]. This assumption exploited the fact that the horizontal velocities were zero during the flat-foot phase. The horizontal position was subsequently calculated by integrating the velocity data over time. Thereafter, stride length was computed as the difference between the horizontal IMU positions recorded at the start of one swing phase and at the start of the next swing phase, as illustrated in Figure 4.
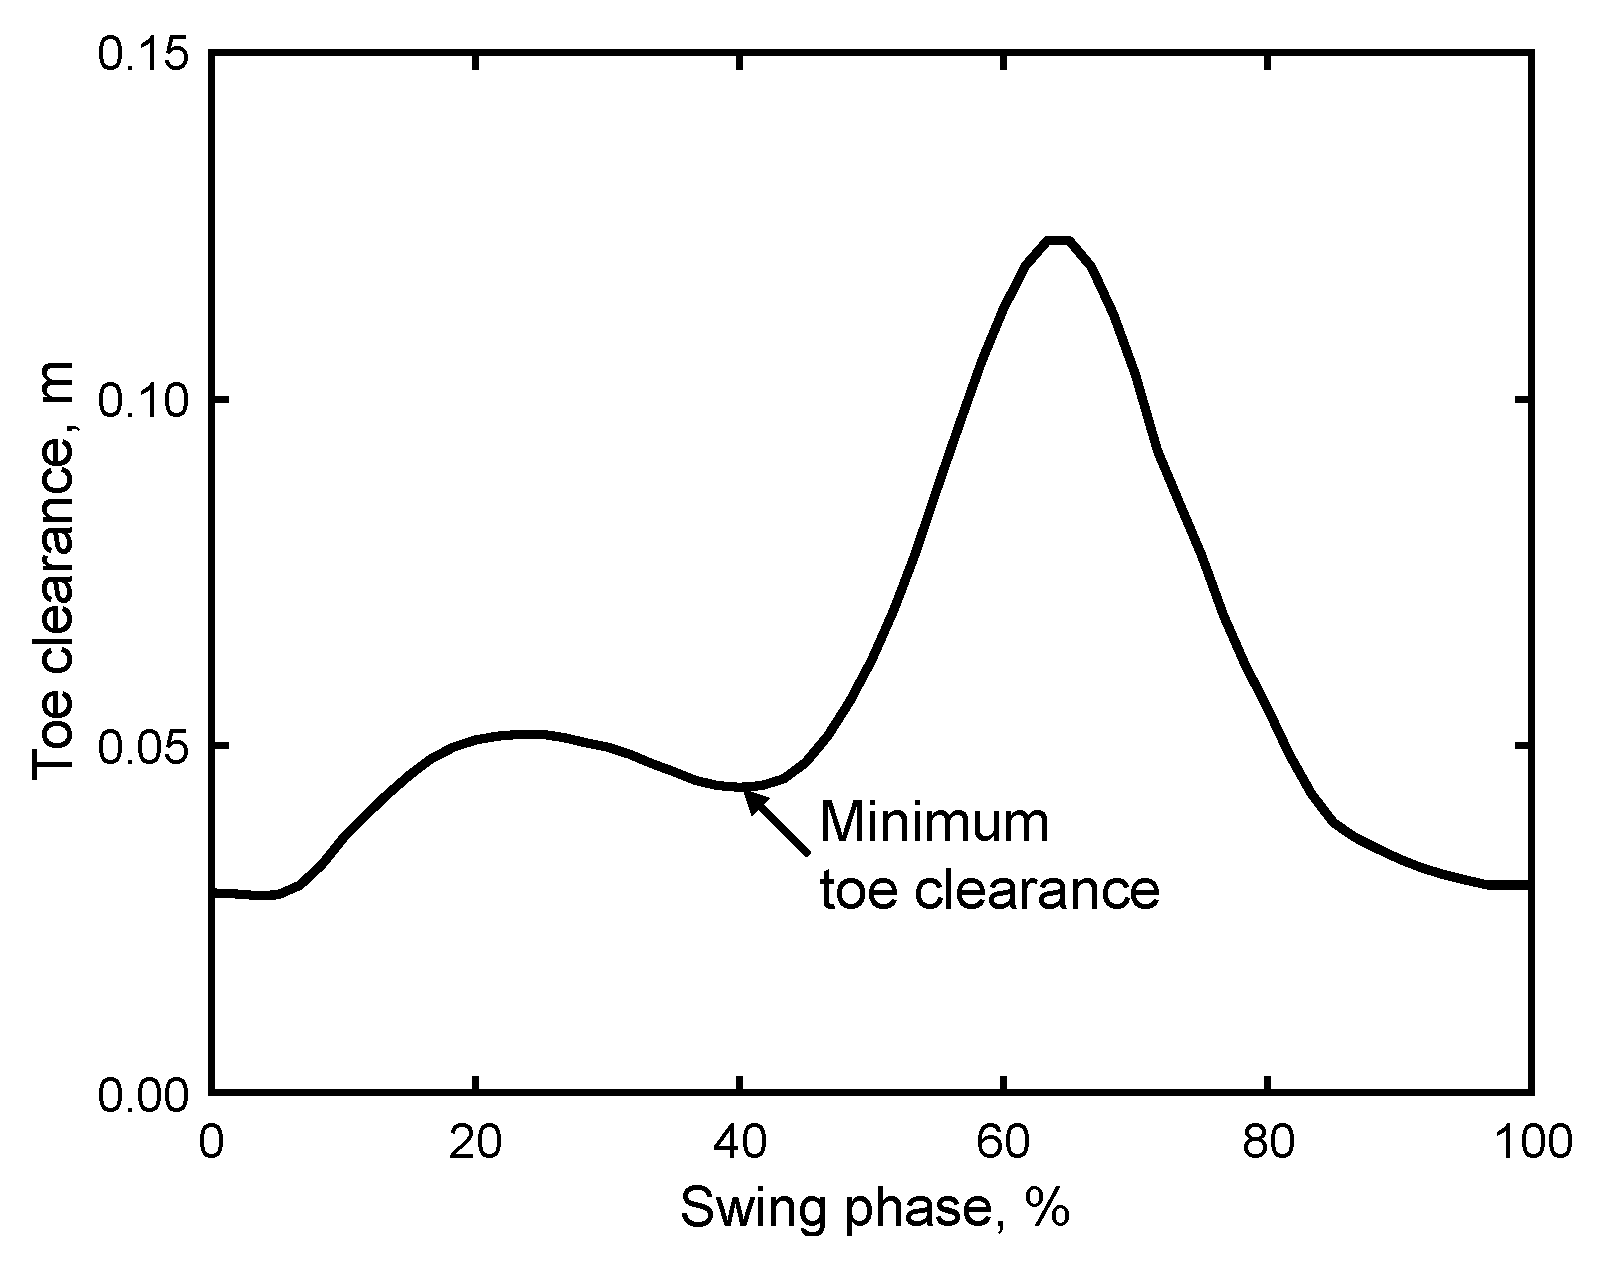
The estimation of toe clearance also followed a similar approach. In particular, time integration was performed on the vertical acceleration a z after eliminating gravitational effects. In this case, a zero vertical velocity assumption was applied to correct for integration errors. This assumption was based on the zero vertical velocity recorded during the flat-foot phase. The vertical IMU position was then computed by integrating the velocity [38]. Furthermore, given that the IMU was mounted at a height of 0.03 m above the ground, a rotation matrix was used to account for this height and estimate the distance from the ground to the toe by adding this transformation to the integral measurements. The minimum toe clearance was then determined by identifying the lowest value in the middle of the swing phase [3,6,20], as illustrated in Figure 5.

2.1.3. Verification Test for the Estimation Accuracy of Stride Length and Minimum Toe Clearance

Fourteen young adults (seven females; age: 22.6 ± 1.6 years; height: 1.66 ± 0.054 m; and body mass: 54.5 ± 5.7 kg) participated in this walking experiment. The experimental protocol was approved in advance by the Ethics Committee for Human Subjects Research, Graduate School of Engineering, Tohoku University (20A-5). Written informed consent was obtained from each participant before the experiments.
During the experiments, participants were instructed to walk at their normal pace along a 5 m straight path equipped with two force plates at the center. Each participant was instructed to complete 20 walking cycles in the same direction, resulting in 20 strides (10 strides per side) for analysis. Two infrared reflective markers were attached to both sides of the IMU installed on the sole at the toe of the shoe, ensuring that the midpoint between the markers aligned with the center of the IMU. Notably, the sampling frequency of the motion capture system (OptiTrack, Acuity Inc., Reston, VA, USA) was 200 Hz. Subsequently, gait parameters recorded by the shoe sensor system were compared with those estimated by the motion capture system. The beginning of the stance phase on the force plate was marked by the instant when the vertical GRF exceeded 50 N, while its end was marked by the instant when the vertical GRF fell below 50 N, based on previous research [29,42,43]. The stride length of the motion capture system was calculated as the horizontal difference between the midpoints of the two markers recorded at the start and end of the stance phase. Furthermore, toe clearance was calculated as the height of the midpoint of the two markers.
The accuracy of the above calculations was assessed using the Pearson product-moment correlation coefficient (r) and root mean squared error (RMSE) between the estimated and measured values for each participant [29]. The results were also visualized using Bland–Altman plots, which display the mean values of the estimated and measured data on the x-axis and the differences between the estimated and measured data on the y-axis. The plots also include a dashed line at ±1.96σ, where σ denotes the standard deviation of the difference.

2.2. Study 2 (S2)

In S2, we used the shoe sensor system to measure and estimate the localized GRFs, stride lengths, and minimum toe clearances of both young and older adults during straight walking. The objective of this analysis was to determine whether the shoe sensor system could highlight differences in gait characteristics between these age groups.
In total, eight young adults (three females) and 15 older adults (all females) participated in this walking experiment. The mean ± standard deviation values of the age, height, and body mass of the participants were 31.1 ± 9.8 years, 1.67 ± 0.066 m, and 60.2 ± 16.6 kg for the young adults and 75.3 ± 4.5 years, 1.54 ± 0.054 m, and 54.6 ± 7.9 kg for the older adults, respectively. The experimental protocol was approved by the Ethics Committee for Human Subjects Research, Tokyo Metropolitan Geriatric Hospital and Institute of Gerontology(R21-20). Written informed consent was obtained from each participant before the experiment.
During the experiment, participants were instructed to walk at their normal pace along a 10 m straight walking path lined with vinyl composition tiles, starting from a stationary standing position. In total, 10 strides per participant—five strides on each side—were included in the analysis, excluding the initial and final strides of the walk.
Next, we calculated the mean values of the total GRF ( i = 1 i = 4 f x i ,   i = 1 i = 4 f y i , a n d   i = 1 i = 4 f z i ) normalized by the participant’s body mass for each 10% segment of the stance phase. We also determined the angle of the total horizontal GRF vector ( α ) based on the following relation.
α = tan 1 i = 1 i = 4 f y i i = 1 i = 4 f x i
Notably, the +y angle (traveling direction) was set to 0 rad, with positive angles indicating rotation toward the medial side of the foot, ranging from values of 0–2π rad. We also obtained the percentage contributions of localized GRFs along the x, y, and z directions ( 100 · f x i i = 1 i = 4 f x i ,   100 · f y i i = 1 i = 4 f y i , 100 · f z i i = 1 i = 4 f z i ) at individual sensor positions, as well as the angle of the horizontal localized GRF vector α i using the following equation.
α i = tan 1 f y i f x i
Additionally, we calculated the mean values and coefficients of variation (CVs) for the stride length and minimum toe clearance data of each participant. A statistically significant difference in height was observed between the young and older participants (unpaired t-test, p < 0.001), while a positive correlation was observed between height and kinetic parameters (r > 0.4). Consequently, we normalized the kinetic parameters by the participants’ heights.
Next, we performed unpaired t-tests to compare the group mean values of the total GRF, percentage contributions of the localized GRFs, α , and α i at each stance phase between the two age groups. We also performed unpaired t-tests to compare the group mean and CV values of the stride length and minimum toe clearance to identify differences between the age groups. The significance level for this analysis was set to p  =  0.05. Furthermore, Cohen’s d, an effect size, was used to evaluate differences in the above variables across the considered age groups [44].

3. Results

3.1. Accuracy Verification of Stride Length and Minimum Toe Clearance (S1)

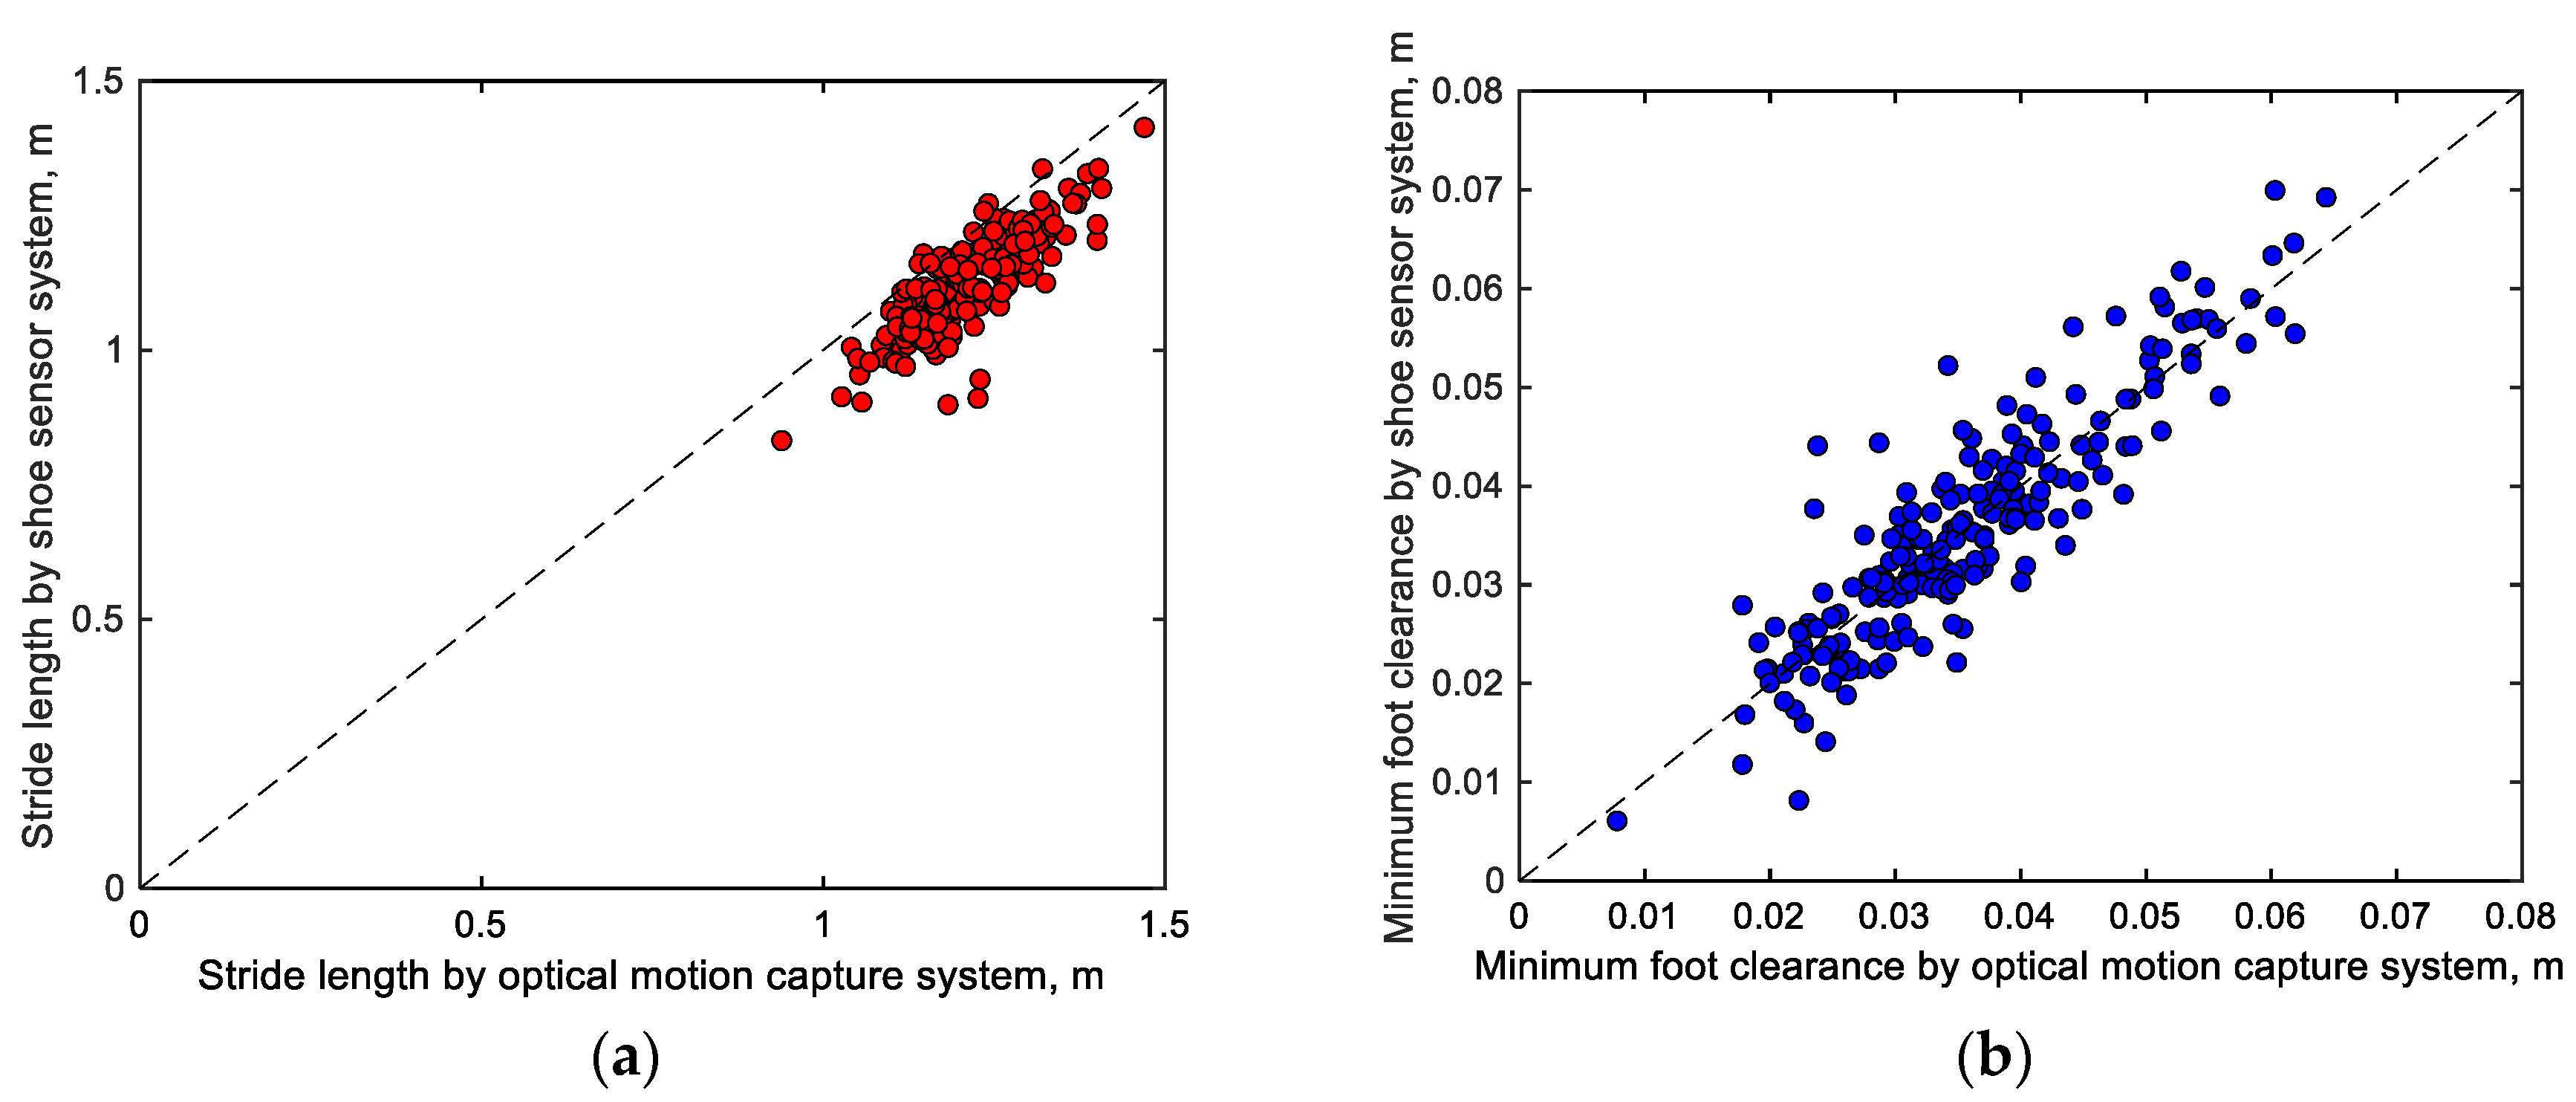
Figure 6 compares the mean stride lengths and minimum toe clearances of each participant obtained from the motion capture system and shoe sensor system. Notably, the stride lengths (Figure 6a, r = 0.840 with p < 0.001 and RMSE = 0.10 m) and minimum toe clearances (Figure 6b, r = 0.898 with p < 0.001 and RMSE = 0.0051 m) estimated by both systems demonstrate relatively good agreement.
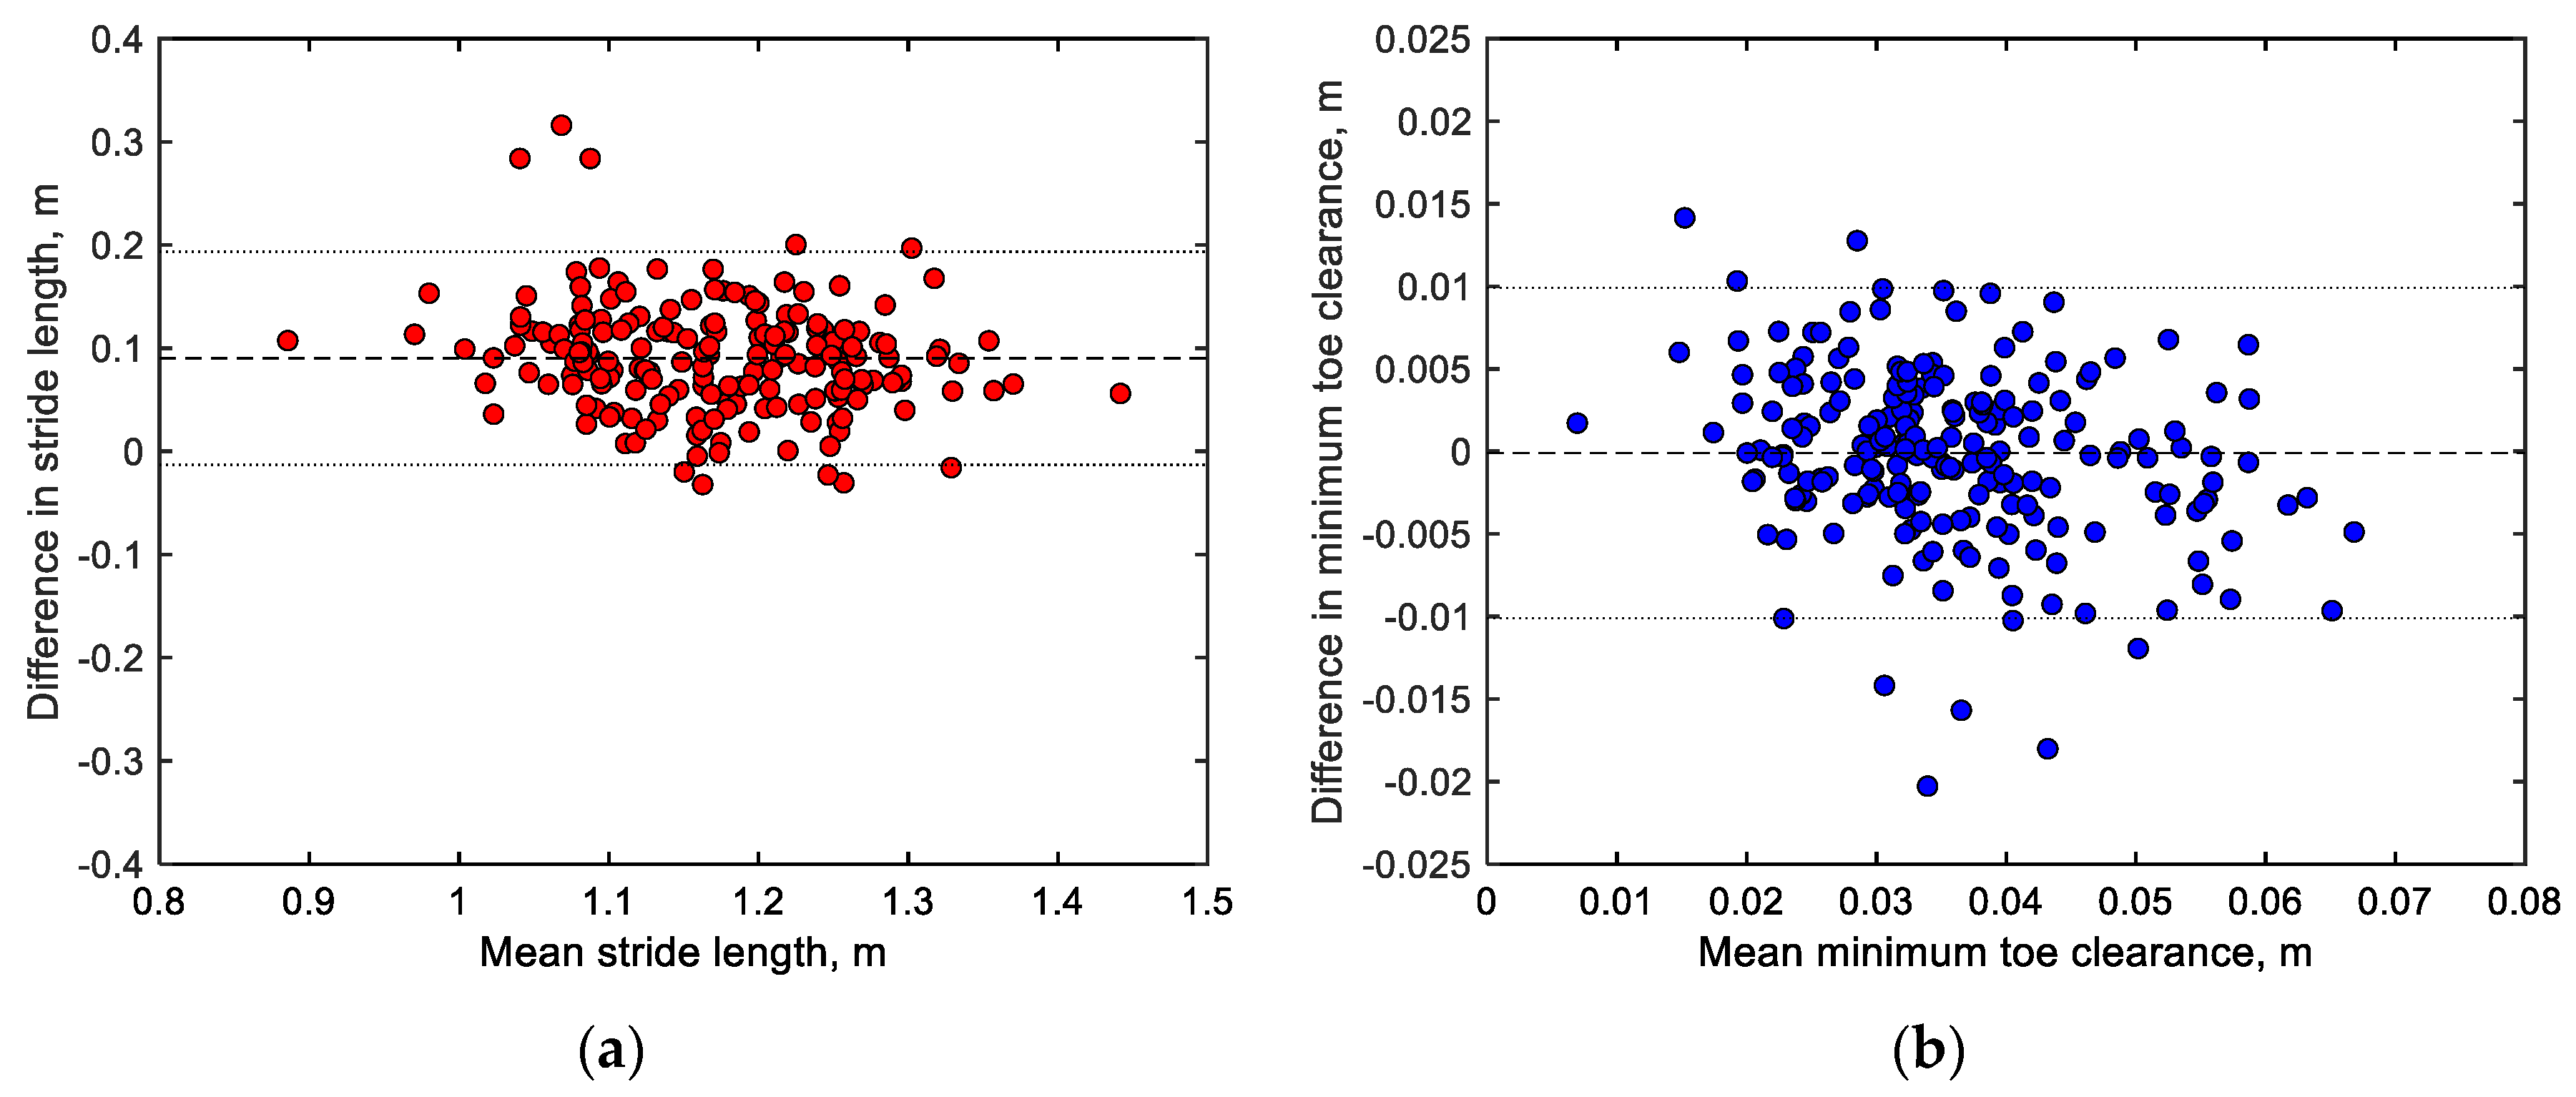
Figure 7 presents Bland‒Altman plots comparing the stride lengths and minimum toe clearances obtained from the motion capture system and shoe sensor system. Notably, the stride lengths (Figure 7a) recorded by both systems exhibit a fixed error of 0.09 m, with most differences in their readings lying within the range of 1.96σ. Meanwhile, the minimum toe clearances (Figure 7b) recorded by both systems exhibit a small fixed error of less than 0.001 m, with most differences in their readings lying within the range of 1.96σ.

3.2. Comparison of Gait Parameters between Young and Older Adults (S2)

3.2.1. Total Ground Reaction Forces (GRF)

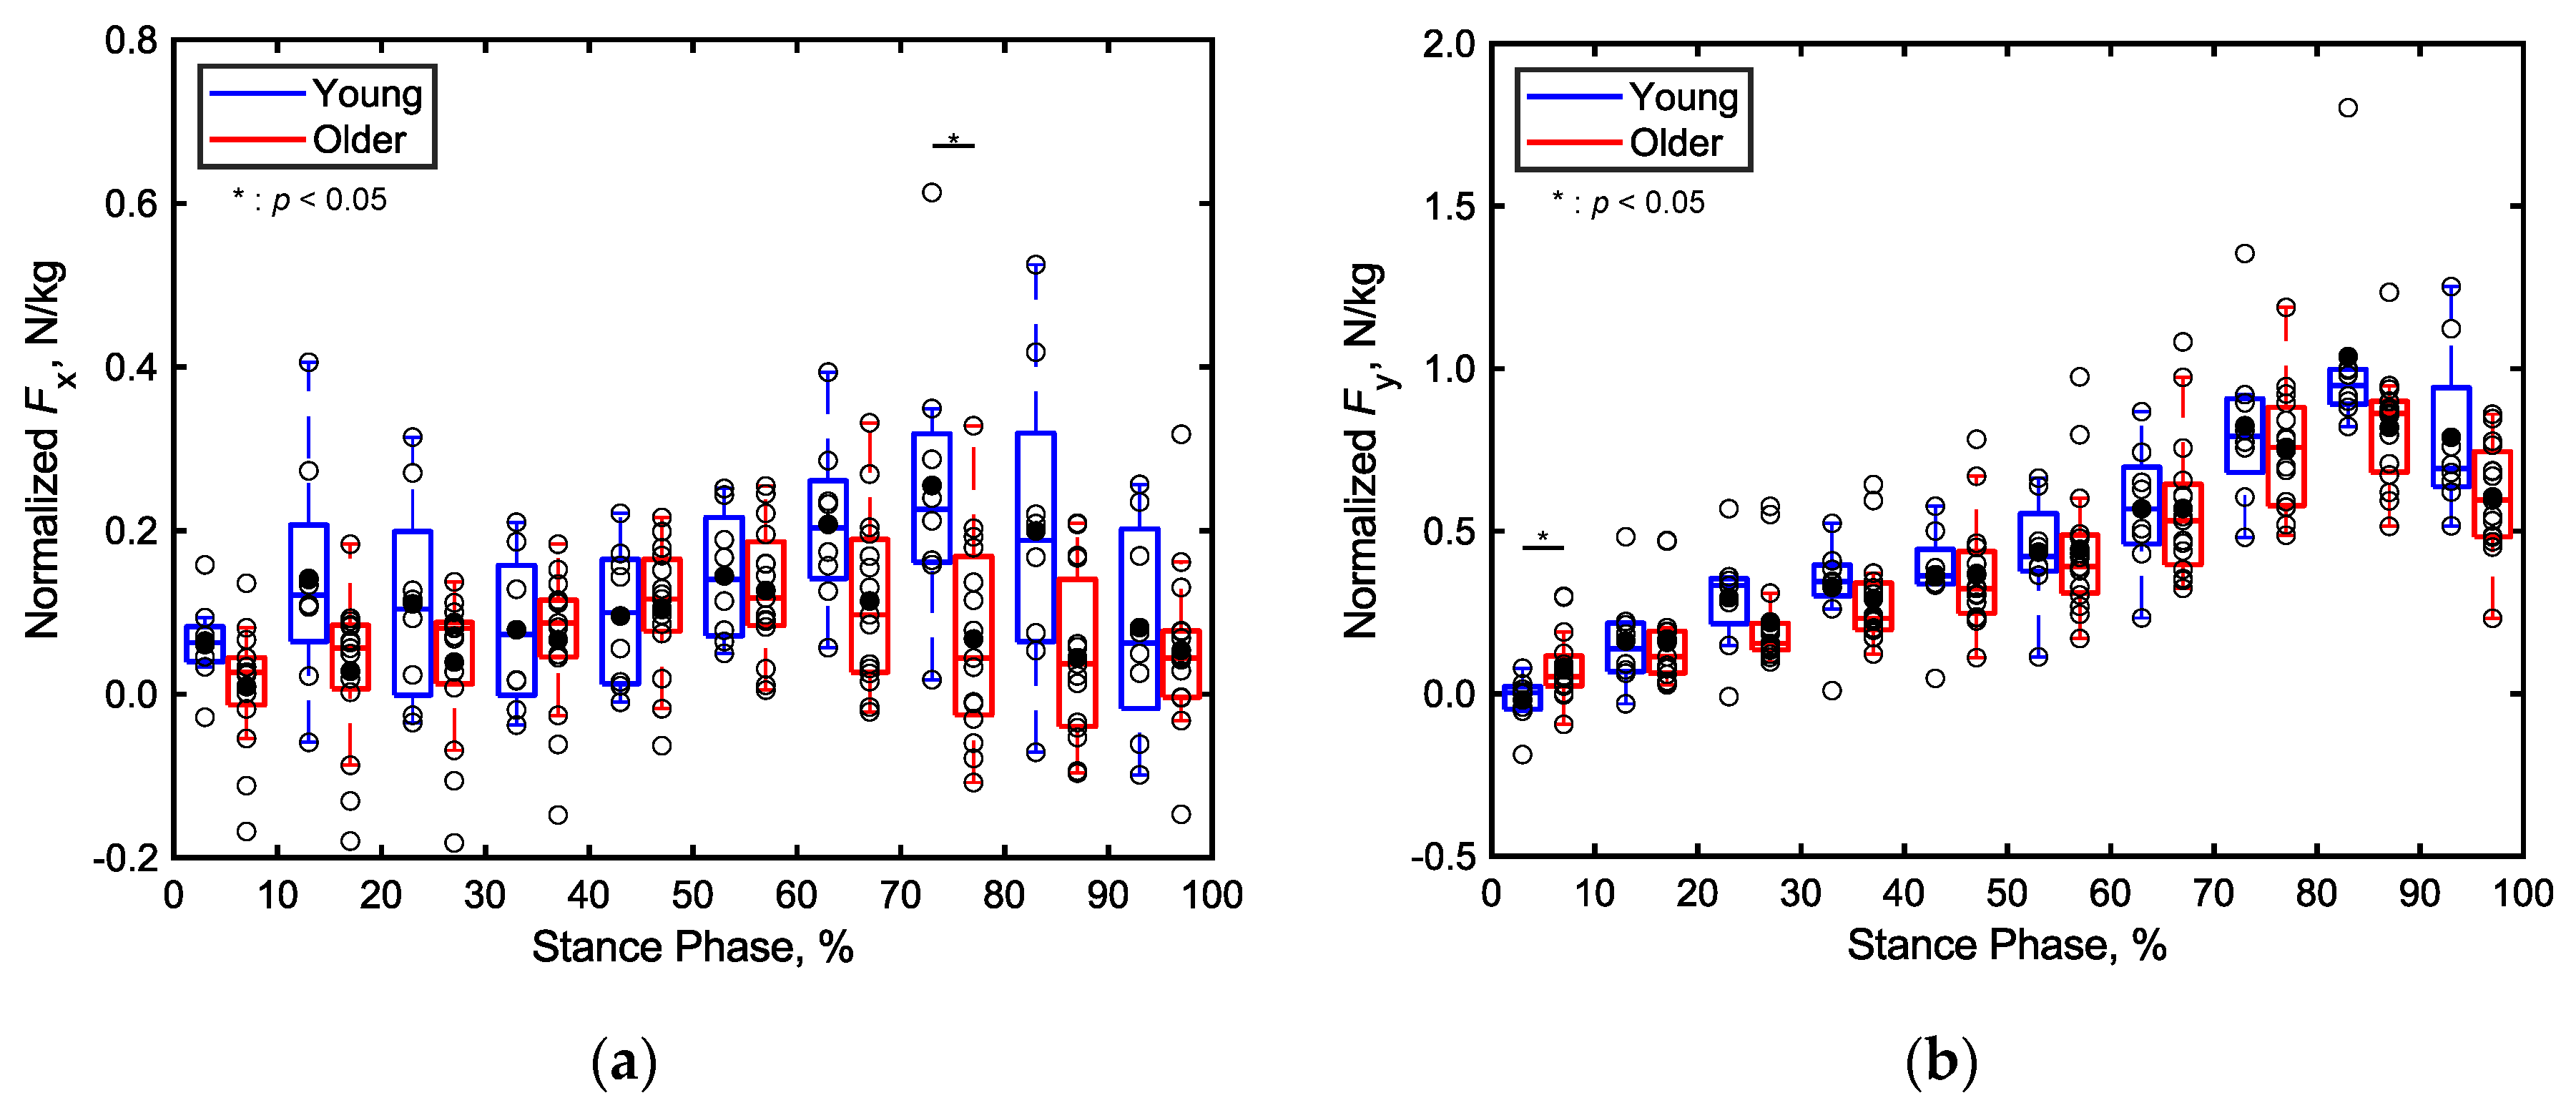
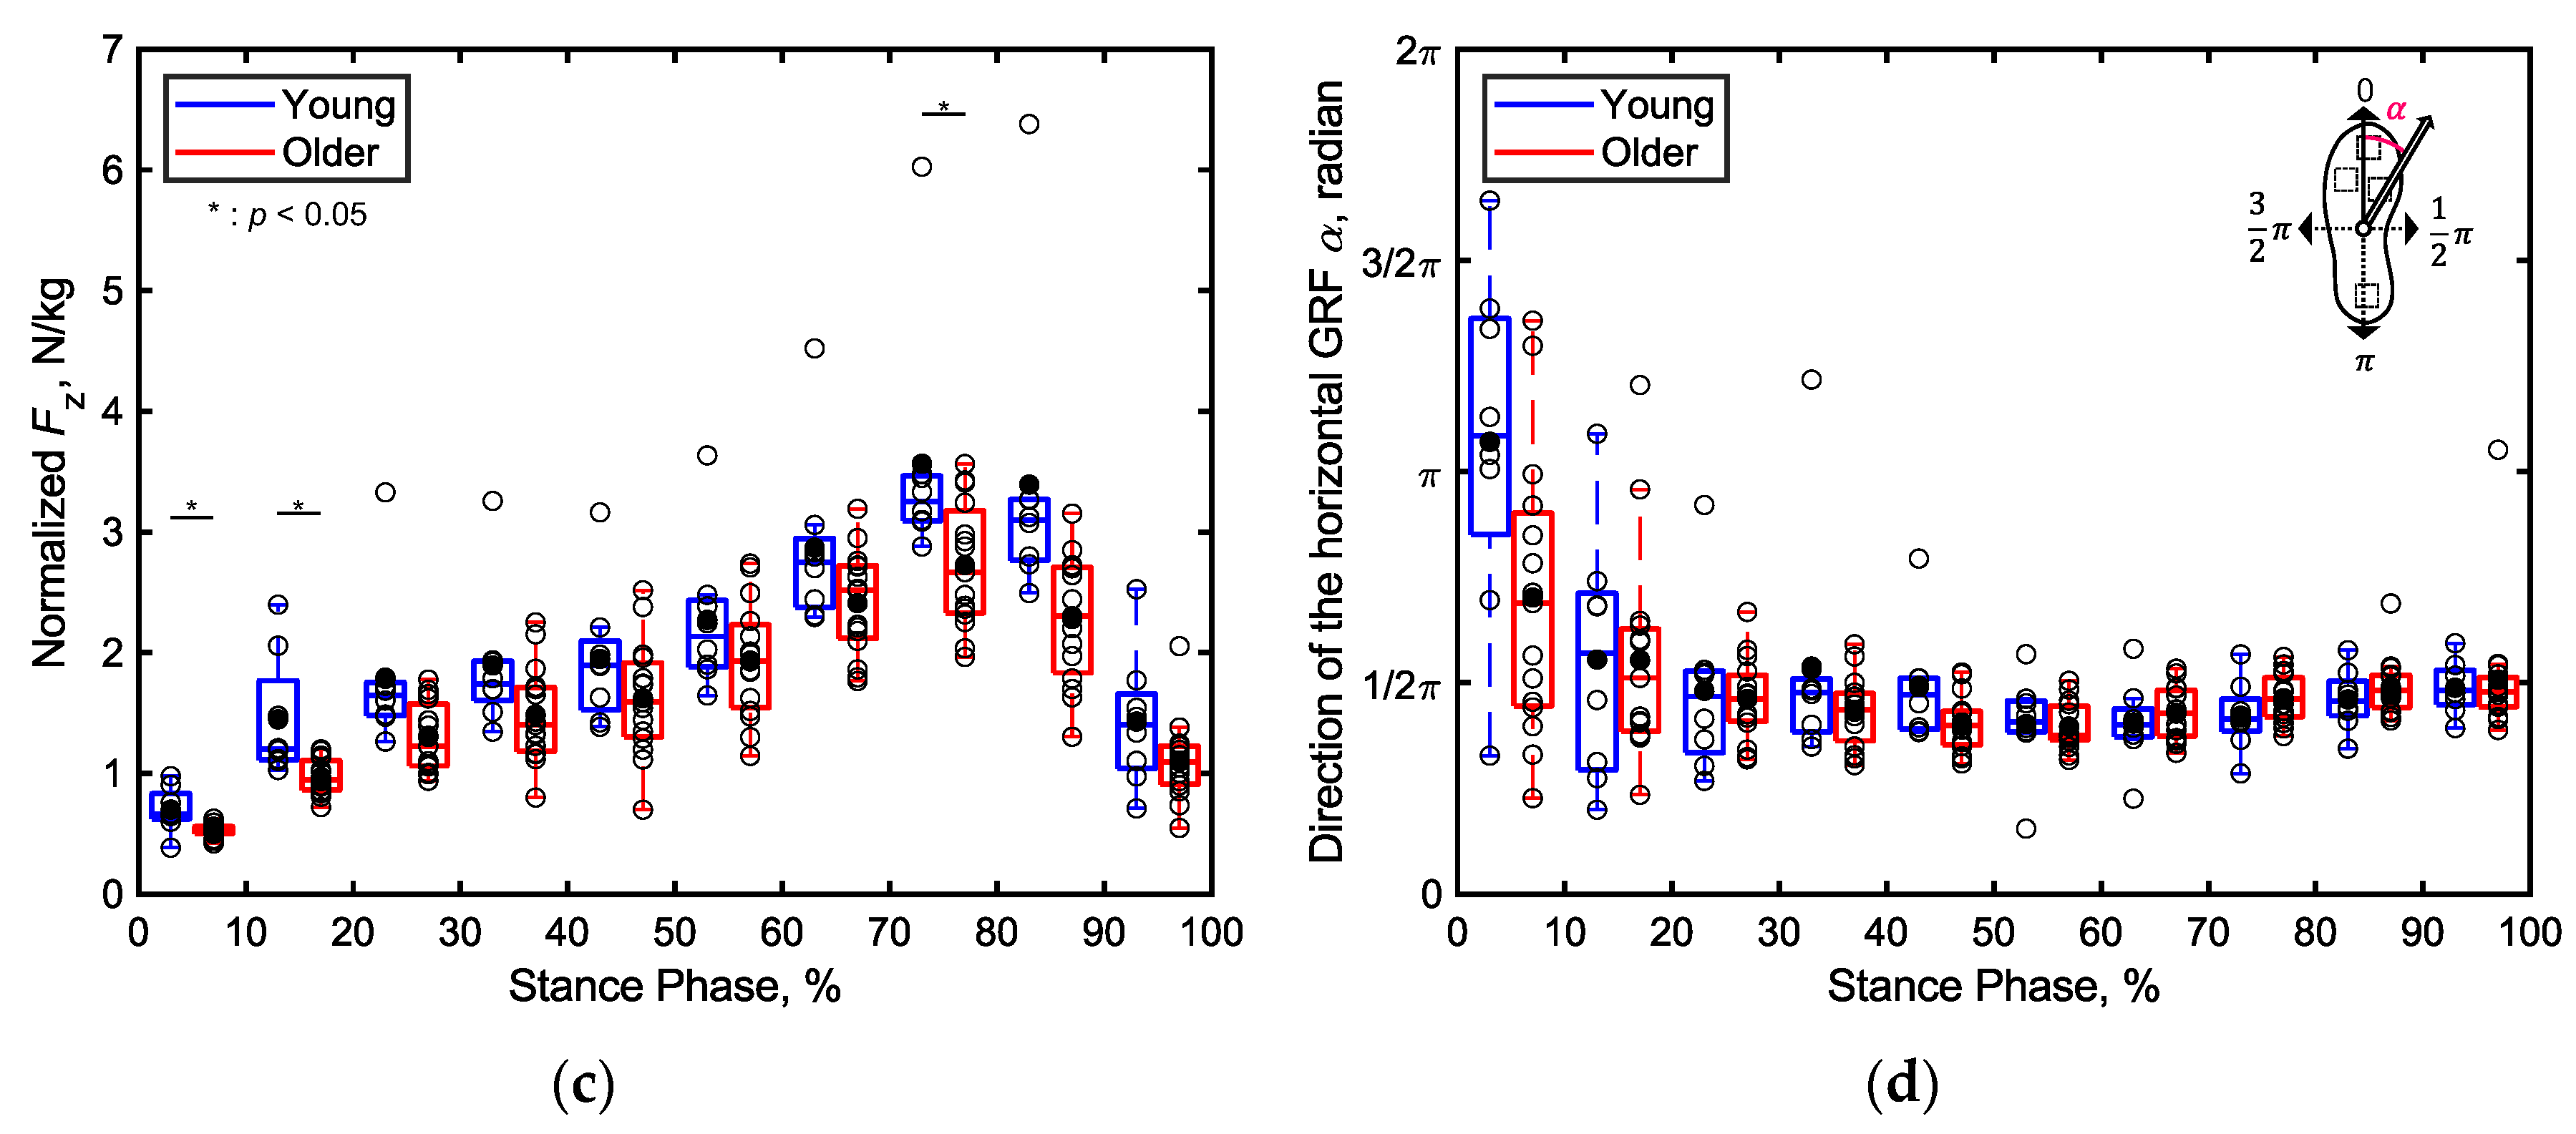
Figure 8 presents boxplots depicting the total GRF normalized by the body mass of each participant from the young and older adult groups across every 10% segment of the stance phase along (a) the x, (b) y, and (c) z directions. In particular, Figure 8d presents boxplots depicting the angle of the horizontal GRF vector for both the young and older adult participants. Notably, significant differences are apparent in the total GRFs of the age groups along the x direction during 71%‒80% of the stance phase, in the y direction during 1%‒10% of the stance phase, and in the z direction during 1%‒20% and 81%‒90% of the stance phase (p < 0.05, Cohen’s d > 0.8). However, no significant differences are observed in other parts of the stance phase along the x, y, and z directions. The angle of the horizontal GRF vector also does not exhibit significant differences across both age groups.

3.2.2. Percentage Contributions of Localized GRFs

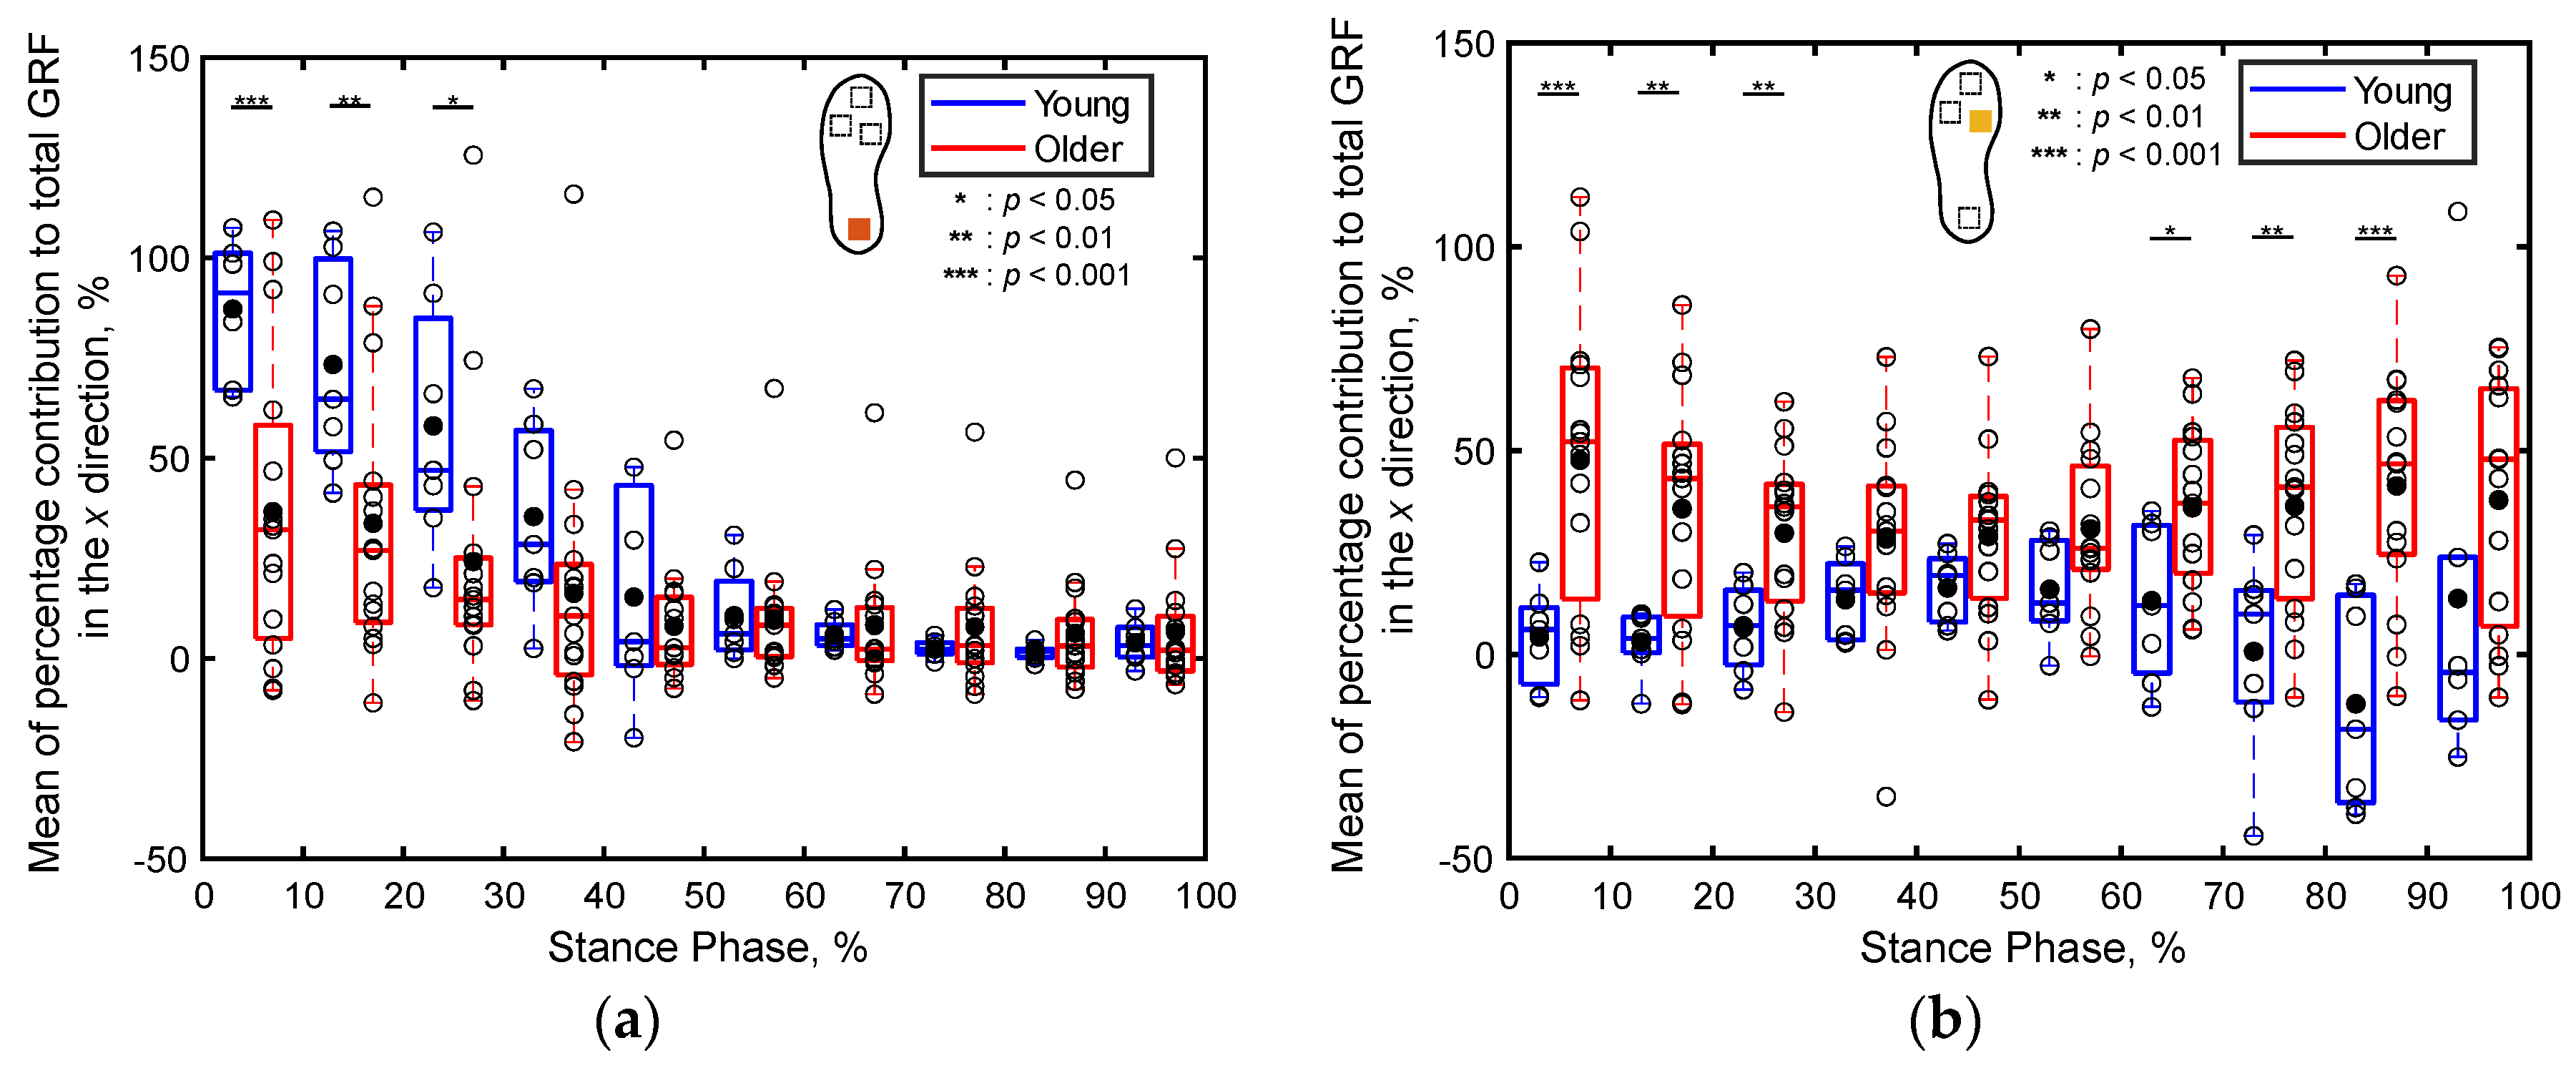
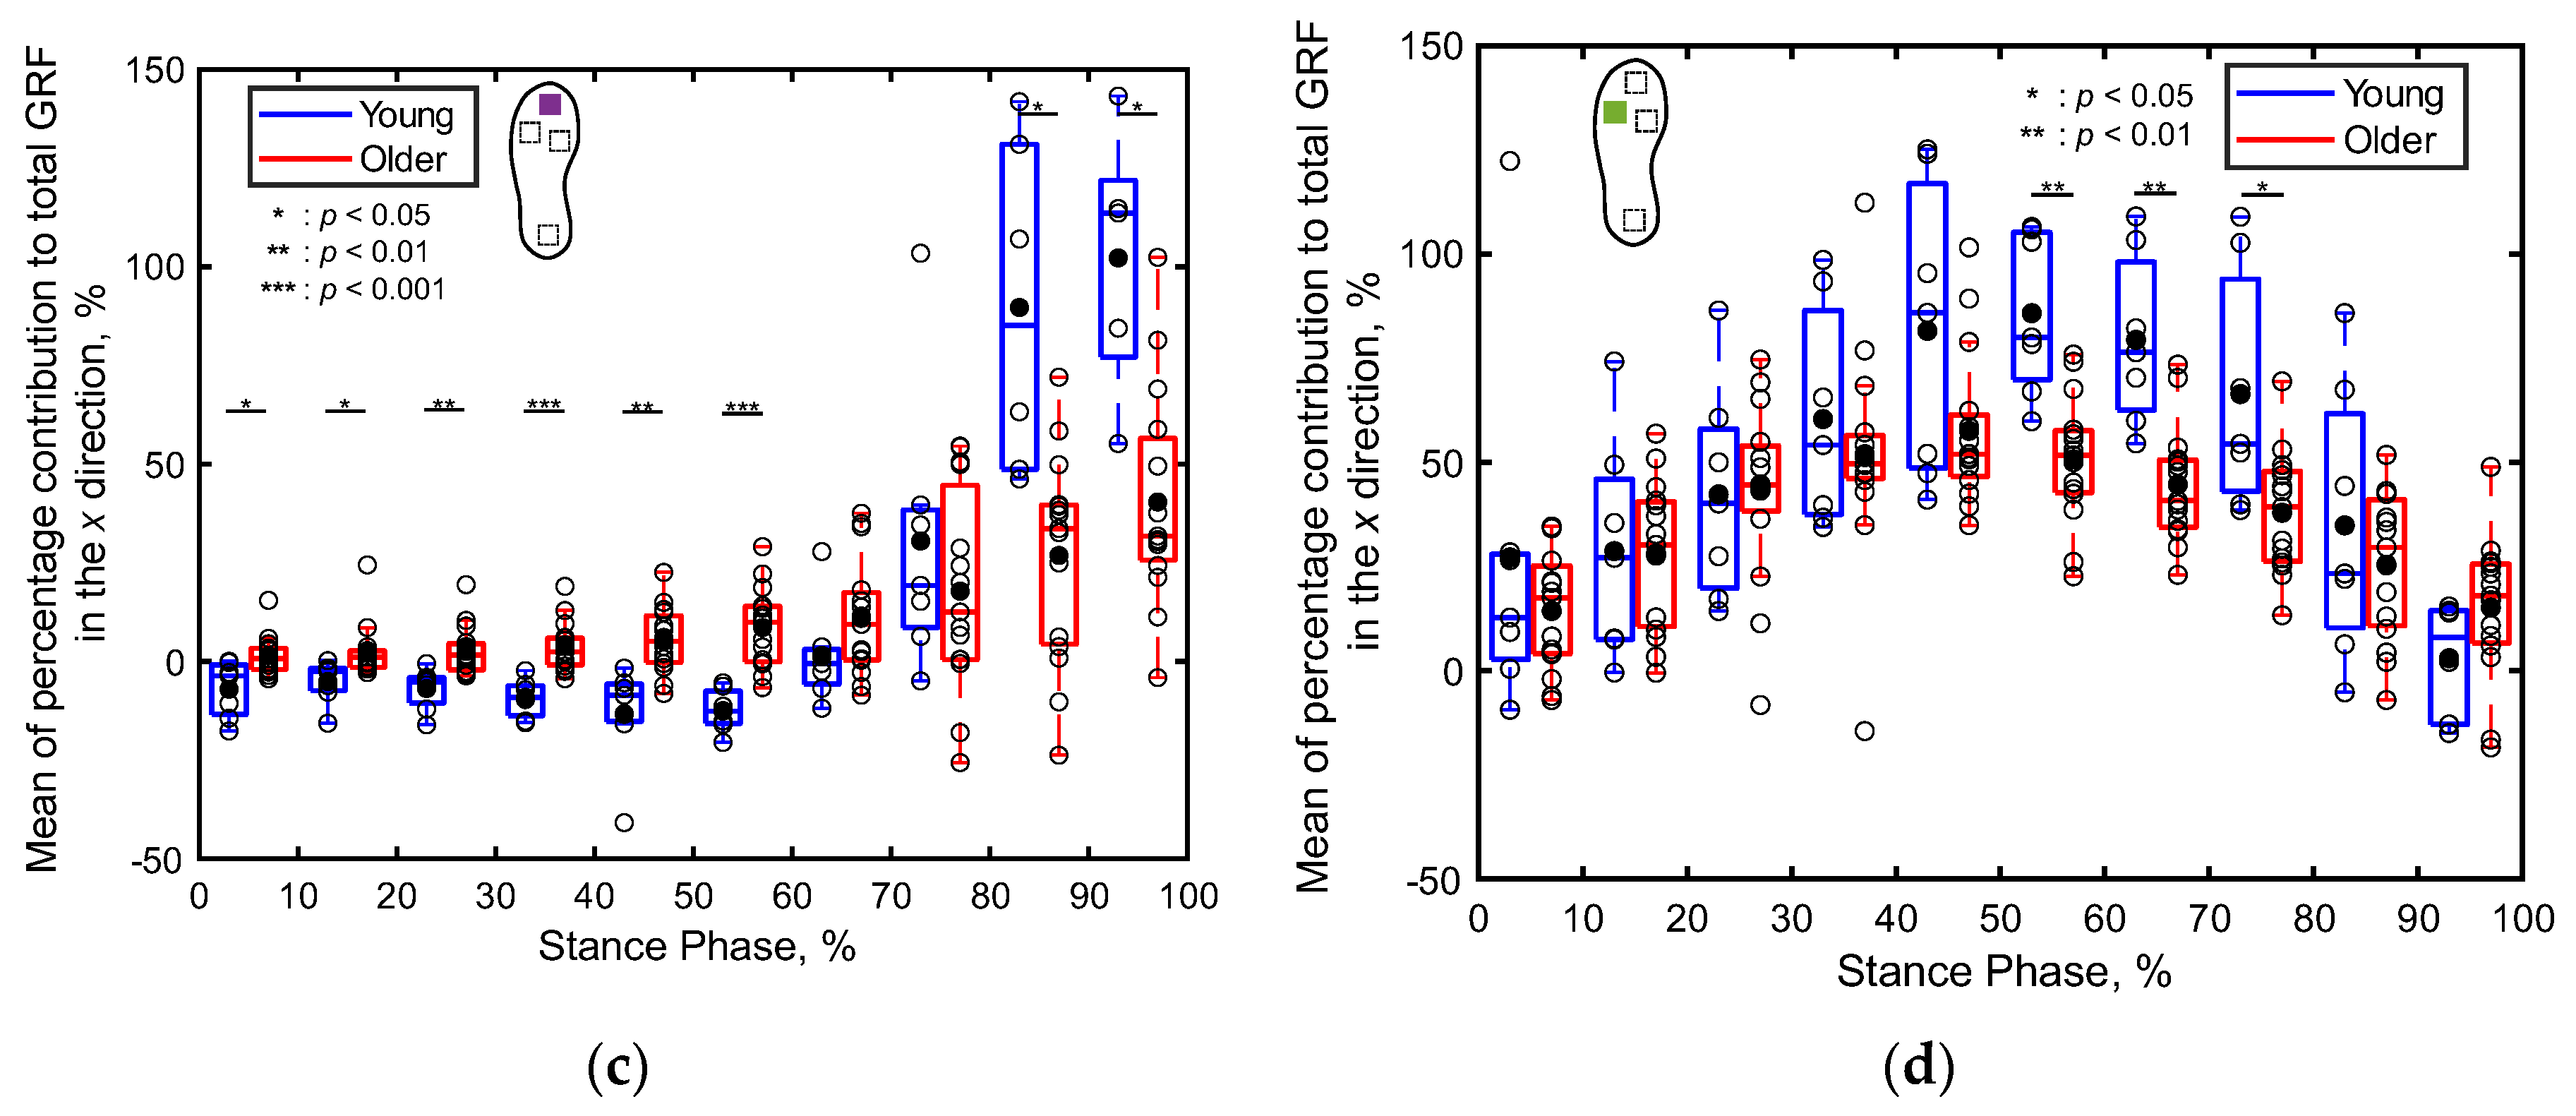
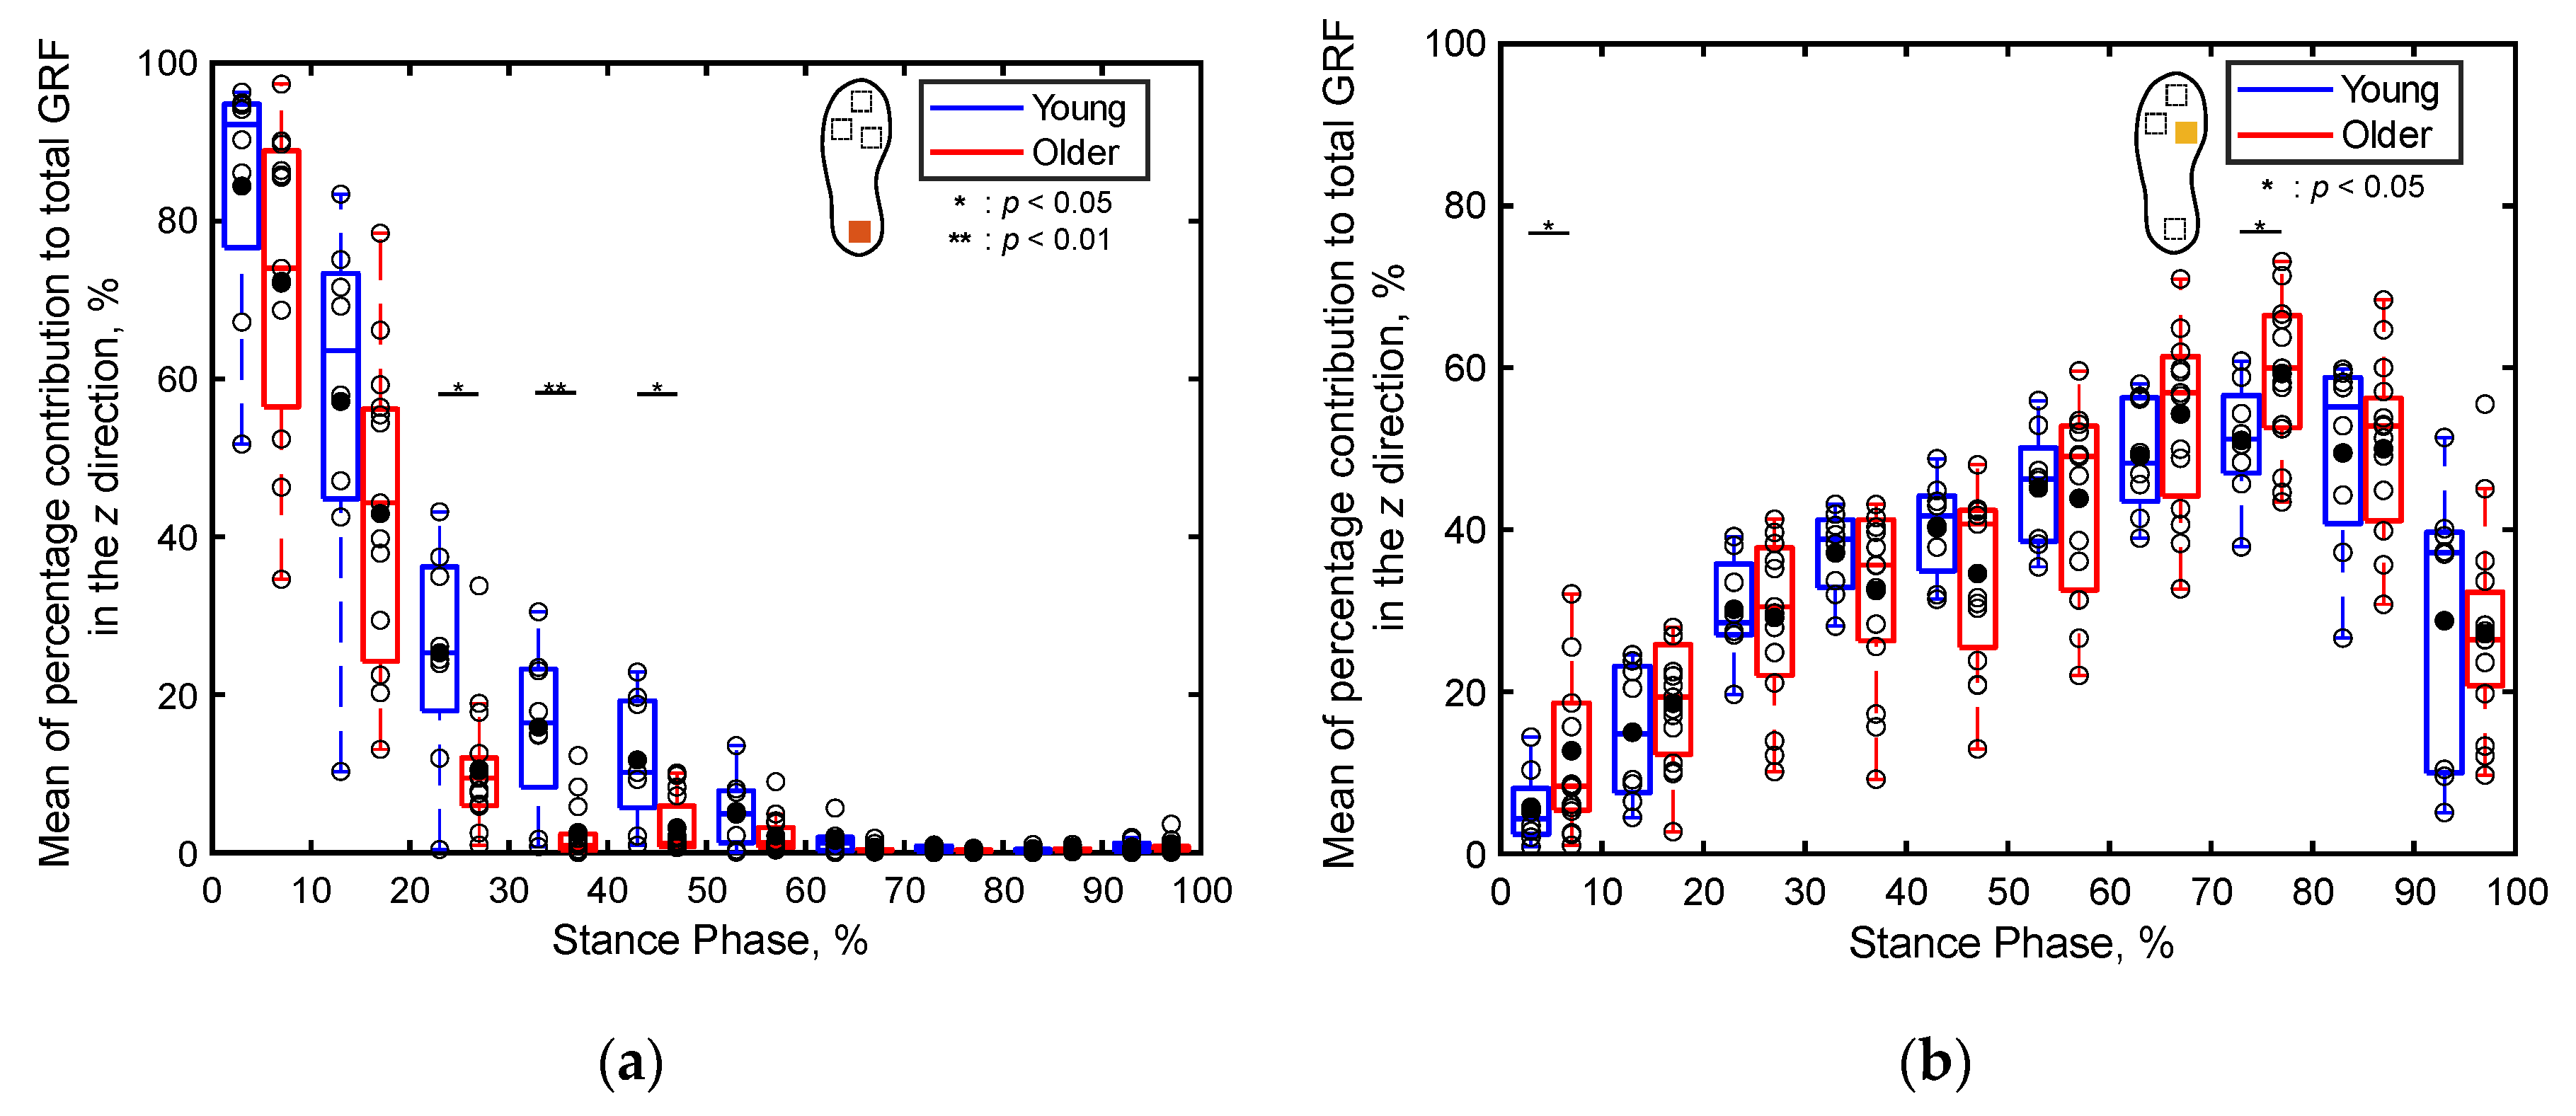
Figure 9 displays the mean percentage contributions of the localized GRFs of both the older and young adult participants along the x direction for every 10% of the stance phase at each sensor position, as recorded by the shoe sensor system. Notably, the contribution of the heel’s GRF to the total GRF during 1%‒30% of the stance phase is significantly lower (p < 0.05, Cohen’s d > 0.8) for the older adults compared to that for the young adults, as depicted in Figure 9a. Conversely, the contribution of the first metatarsal’s GRF to the total GRF during 1%‒30% of the stance phase is significantly higher (p < 0.01, Cohen’s d > 0.8) for the older adults compared to that for the young adults, as illustrated in Figure 9b. Additionally, the contribution of the toe’s GRF to the total GRF along the x direction during the first 60% of the stance phase is significantly greater for the older adults (p < 0.05, Cohen’s d > 0.8) compared to that for the young adults, as depicted in Figure 9c. In the latter half of the stance phase, the contribution of the first metatarsal’s GRF to the total GRF between 61%‒90% of the stance phase is significantly greater (p < 0.01, Cohen’s d > 0.8) for the older adults compared to that for the young adults, as illustrated in Figure 8b. Meanwhile, the contribution of the toe’s GRF to the total GRF between 81%‒100% of the stance phase and that of the fifth metatarsal’s GRF to the total GRF between 61%‒90% of the stance phase are significantly lower (p < 0.05, Cohen’s d > 0.8) for the older adults compared to those for the young adults, as illustrated in Figure 9c,d. No significant differences in the localized GRF contributions along the x direction are observed among the two age groups in the other intervals of the stance phase.
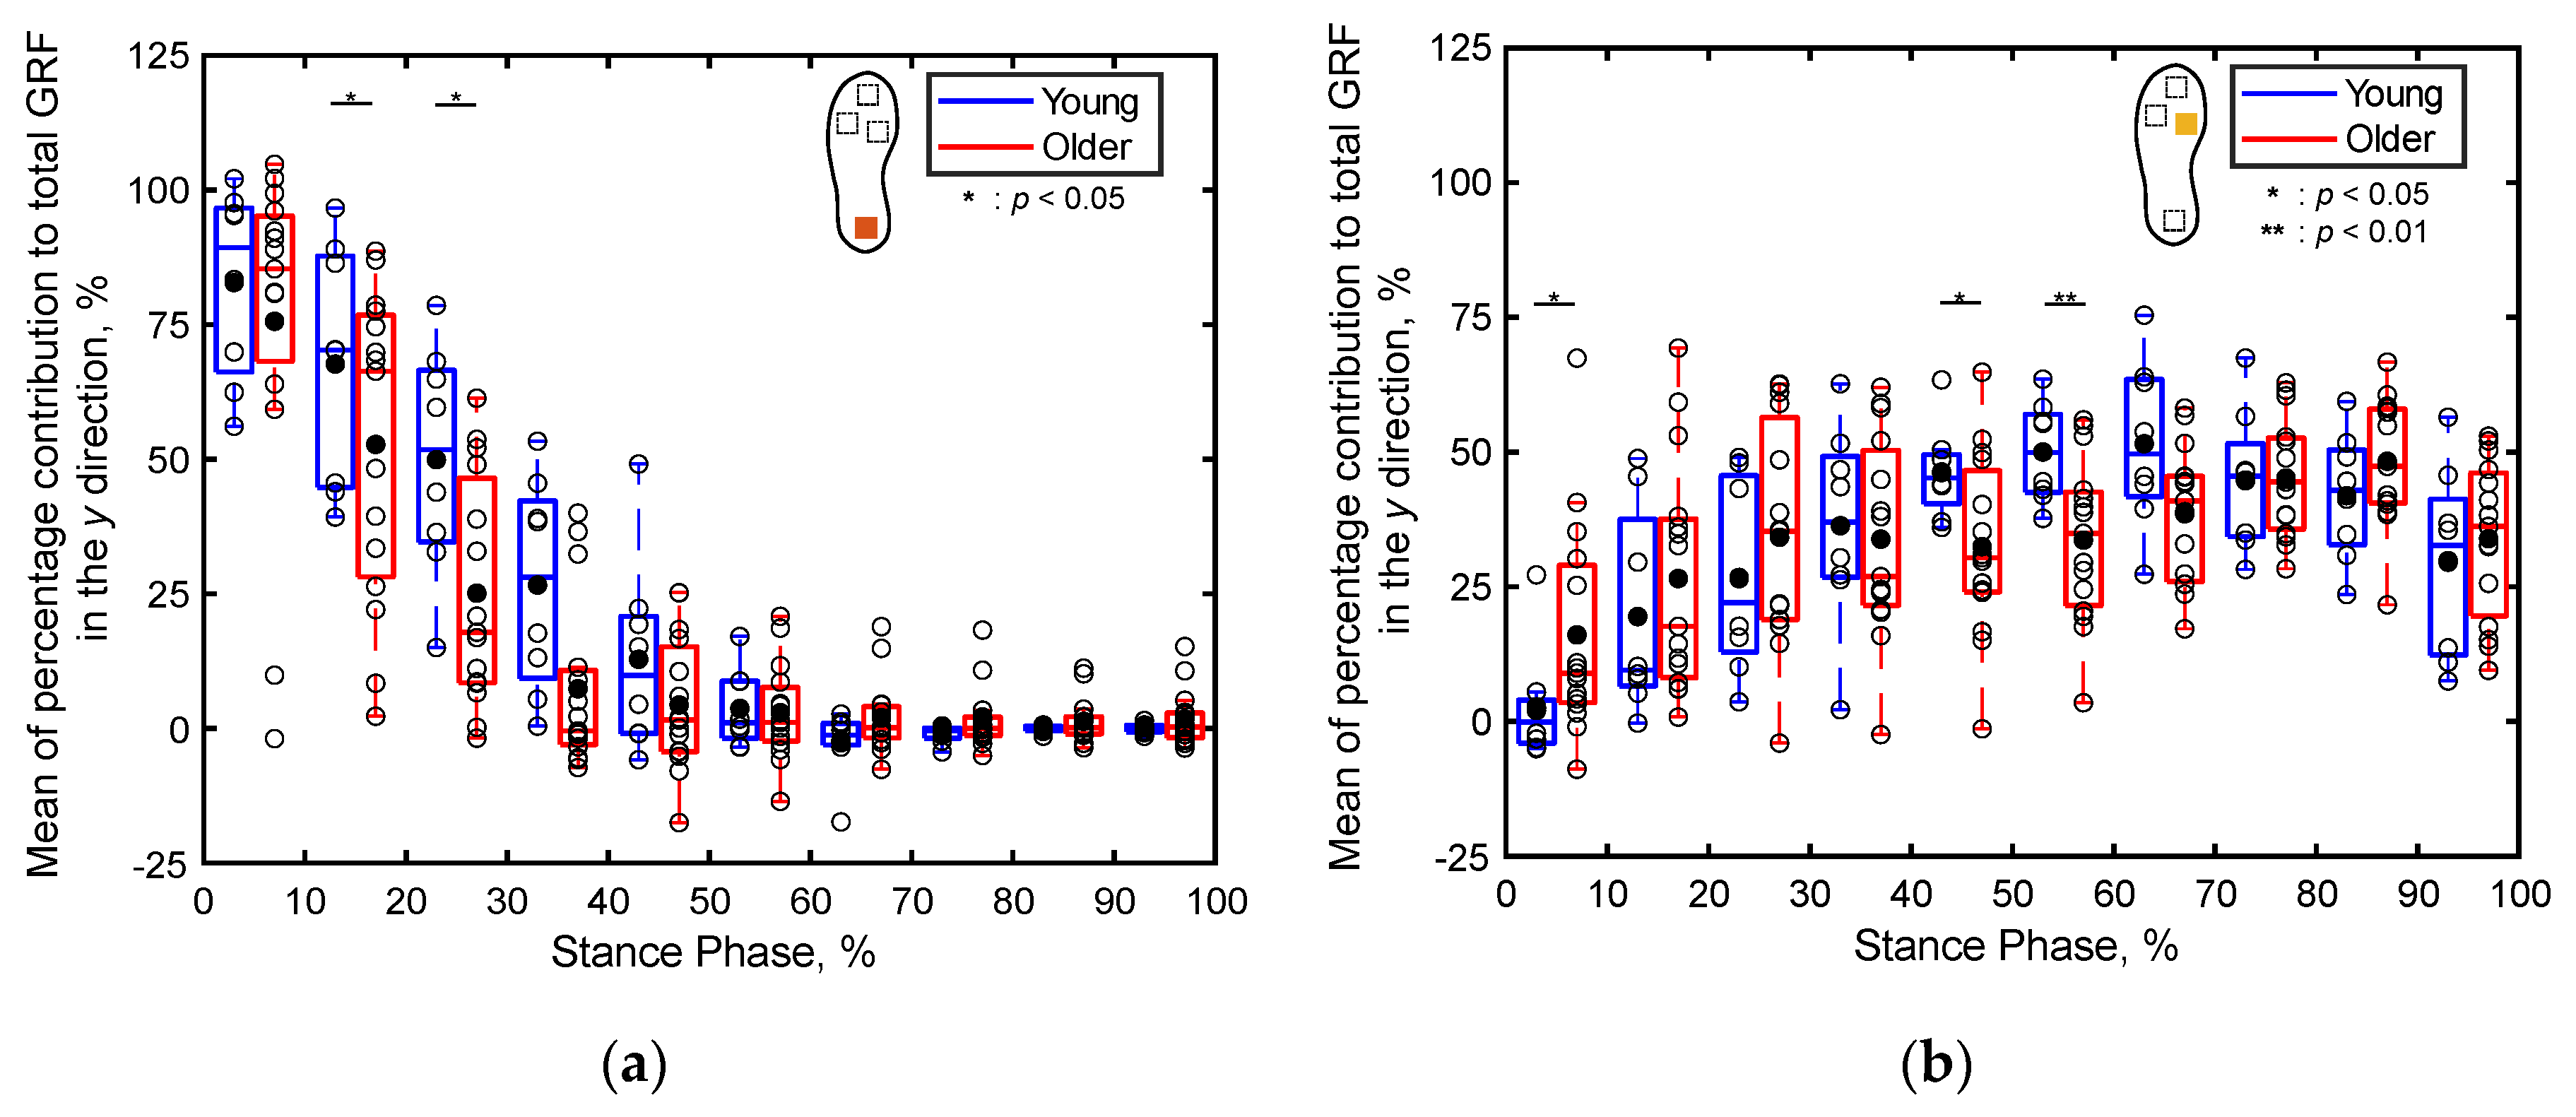
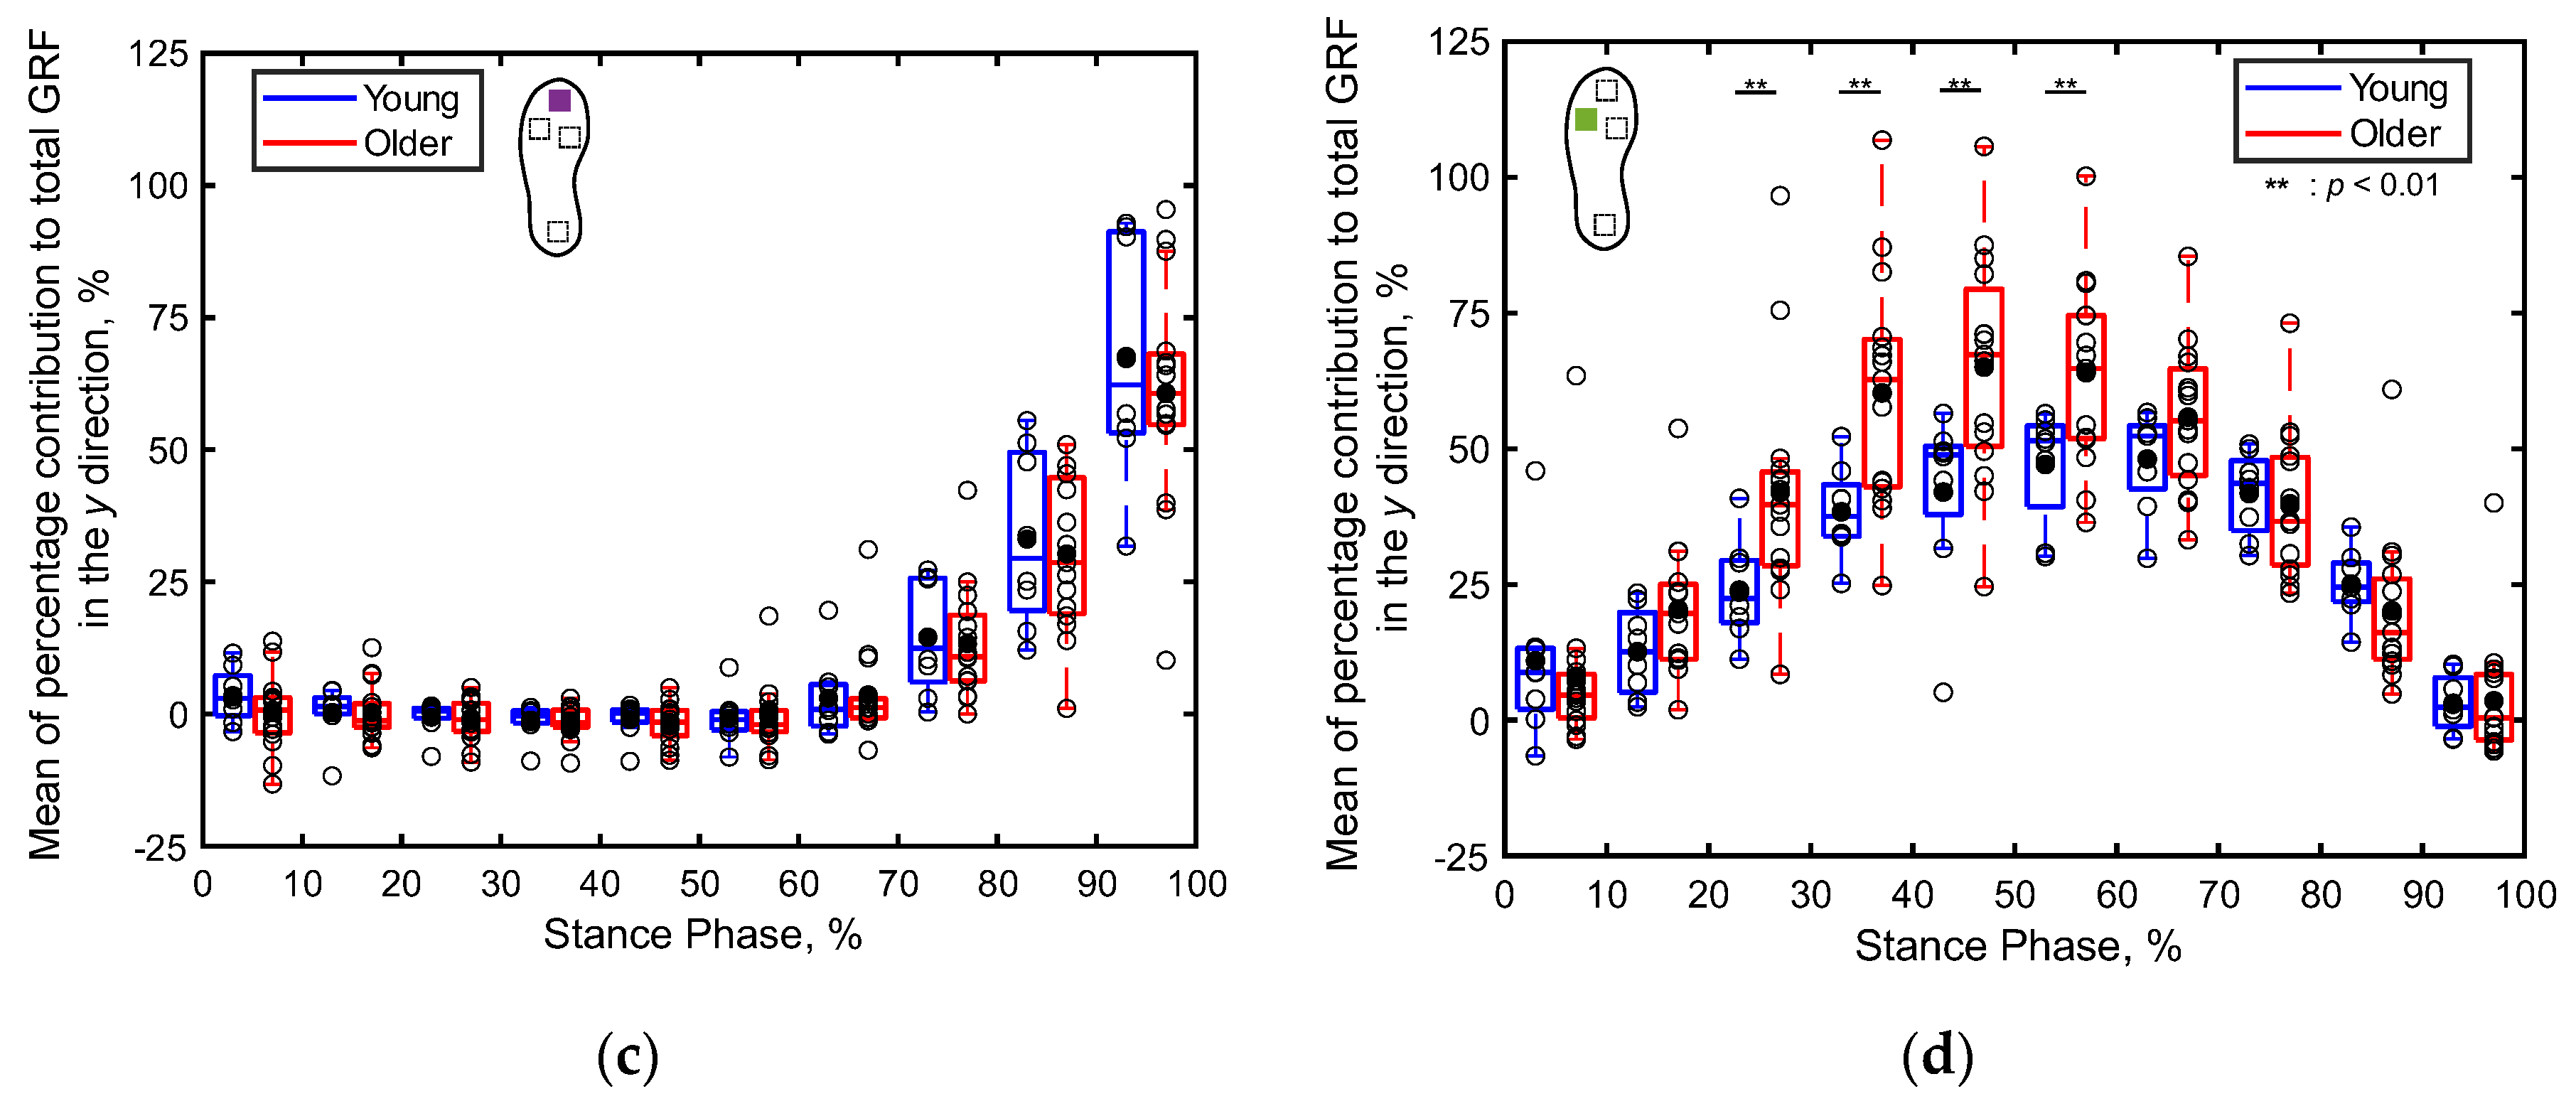
Figure 10 presents boxplots depicting the percentage contributions of the localized GRFs along the y direction recorded at individual sensor positions for both the older and young adult participants. Notably, the contribution of the heel’s GRF to the total GRF between 11%‒30% of the stance phase and that of the first metatarsal’s GRF to the total GRF between 41%‒60% of the stance phase are significantly lower (p < 0.05, Cohen’s d > 0.8) for the older adults compared to those for the young adults, as illustrated in Figure 10a,b. Furthermore, the contribution of the fifth metatarsal’s GRF to the total GRF between 21%‒60% of the stance phase is significantly higher (p < 0.01,Cohen’s d > 0.8) for the older adults compared to that for the young adults, as depicted in Figure 10d. No significant differences are apparent in the contributions of the localized GRFs along the y direction between both age groups in the other intervals of the stance phase.
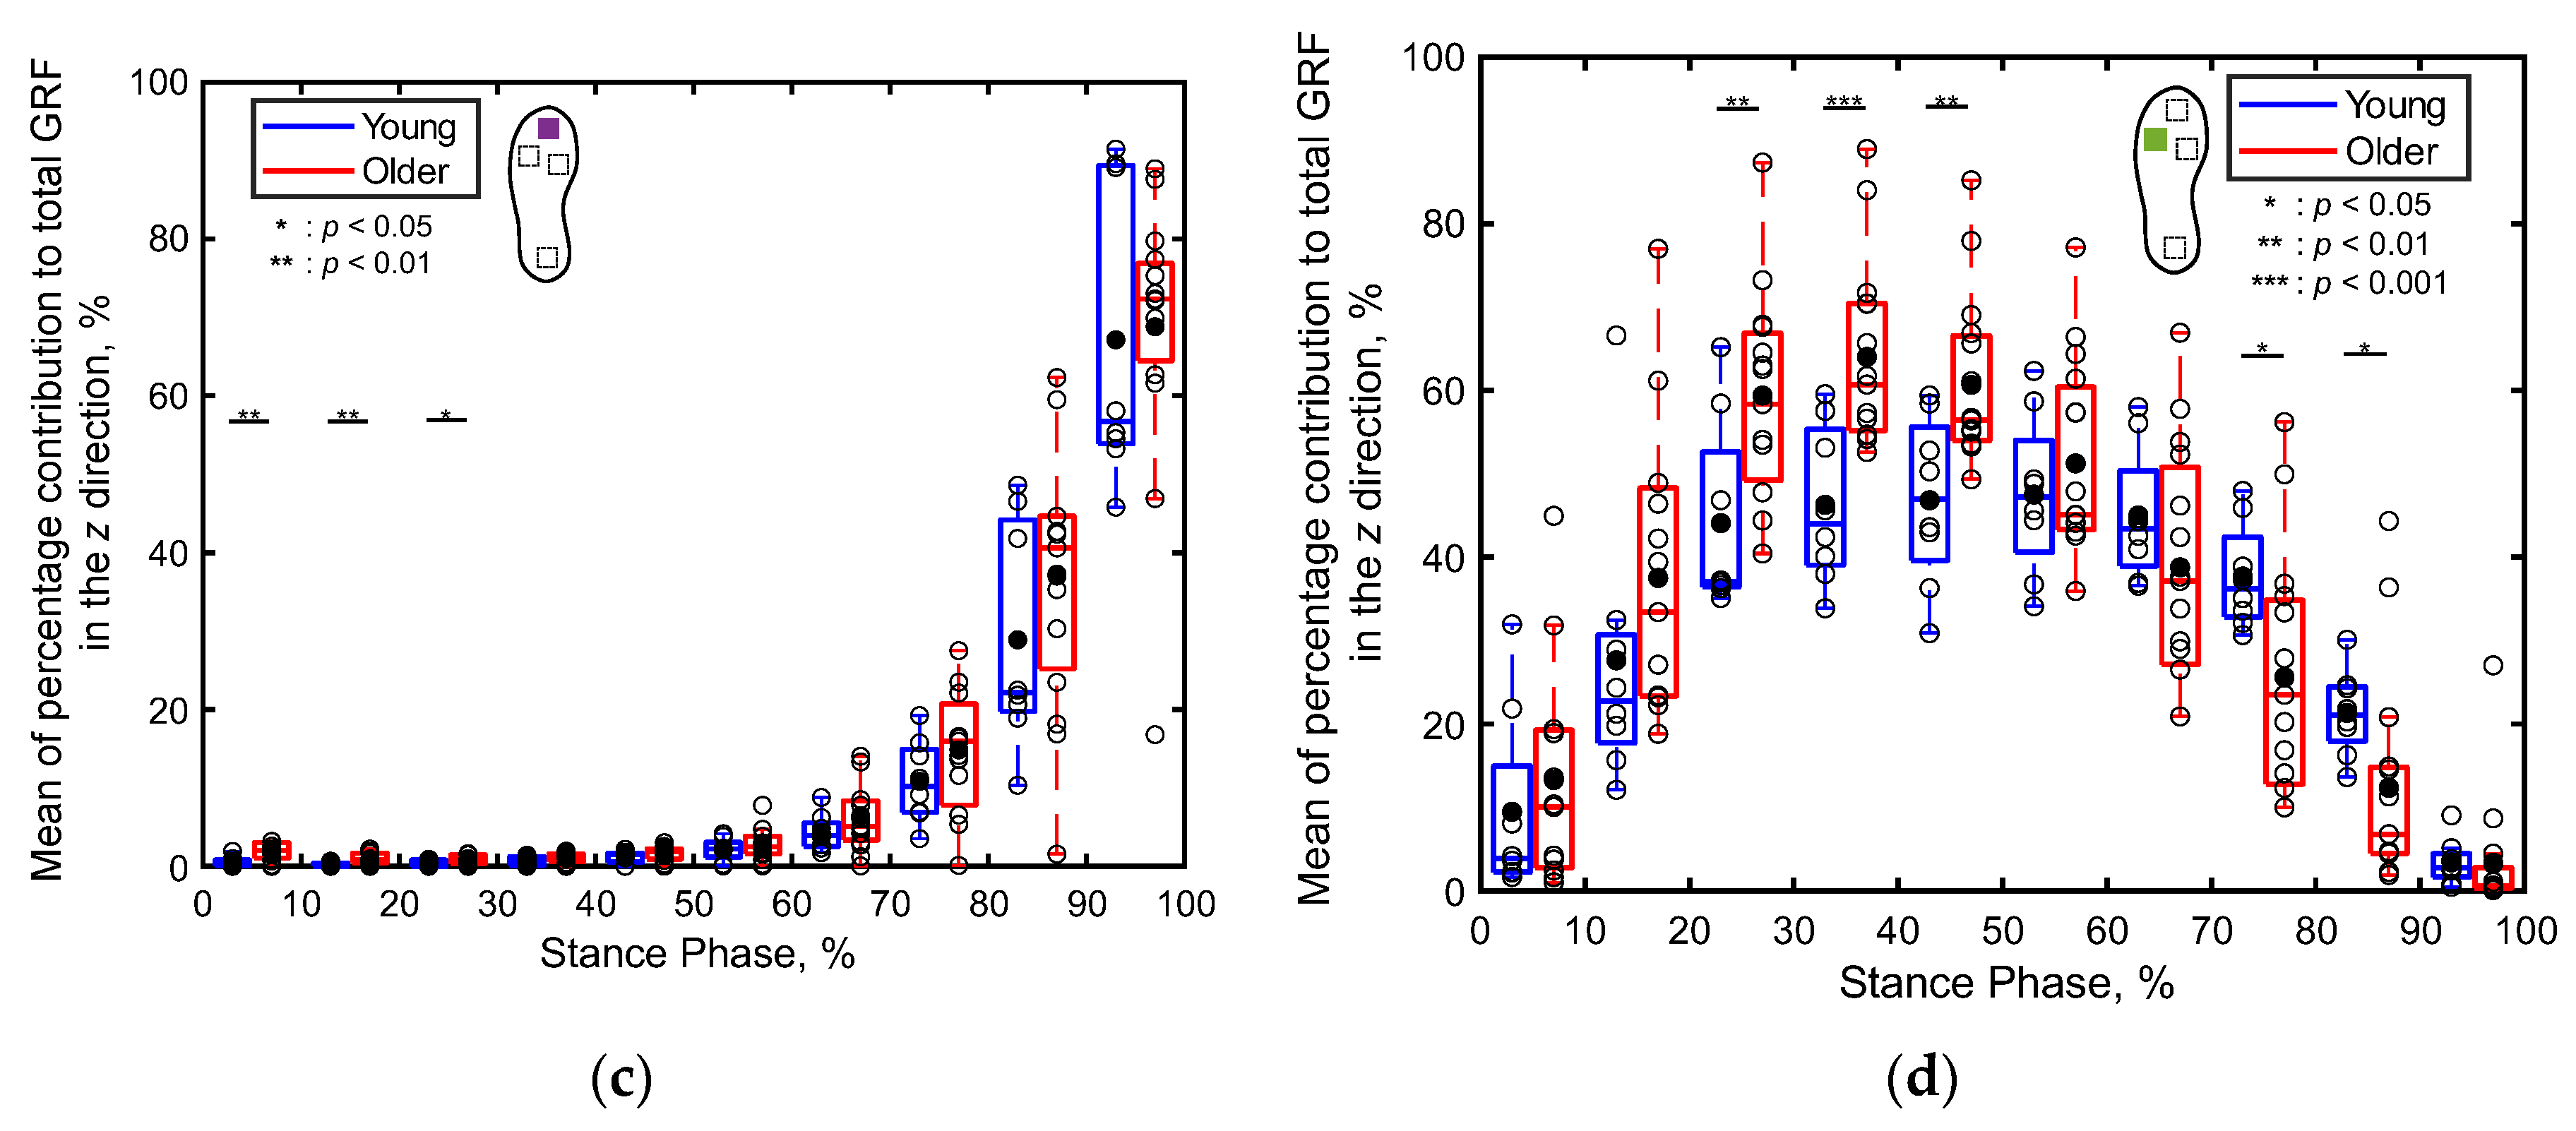
Figure 11 presents boxplots depicting the percentage contributions of the localized GRFs along the z direction at individual sensor positions for both the older and young adult participants, recorded for every 10% of the stance phase. Notably, the contribution of the heel’s GRF to the total GRF during 21%‒50% of the stance phase is significantly higher for the young adults compared to that for the older adults (p < 0.05, Cohen’s d > 0.8), as illustrated in Figure 11a. Conversely, the contribution of the toe’s GRF to the total GRF during 1%‒30% of the stance phase is significantly higher for the older adults compared to that for the young adults (p < 0.05, Cohen’s d > 0.8), as depicted in Figure 11c. Furthermore, the contribution of the fifth metatarsal’s GRF to the total GRF during 21%‒50% is significantly higher for the older adults compared to that for the young adults (p < 0.01, Cohen’s d > 0.8), as depicted in Figure 11d. In other intervals of the stance phase, no significant differences are apparent in the contributions of the localized GRFs along the z direction between the two age groups.
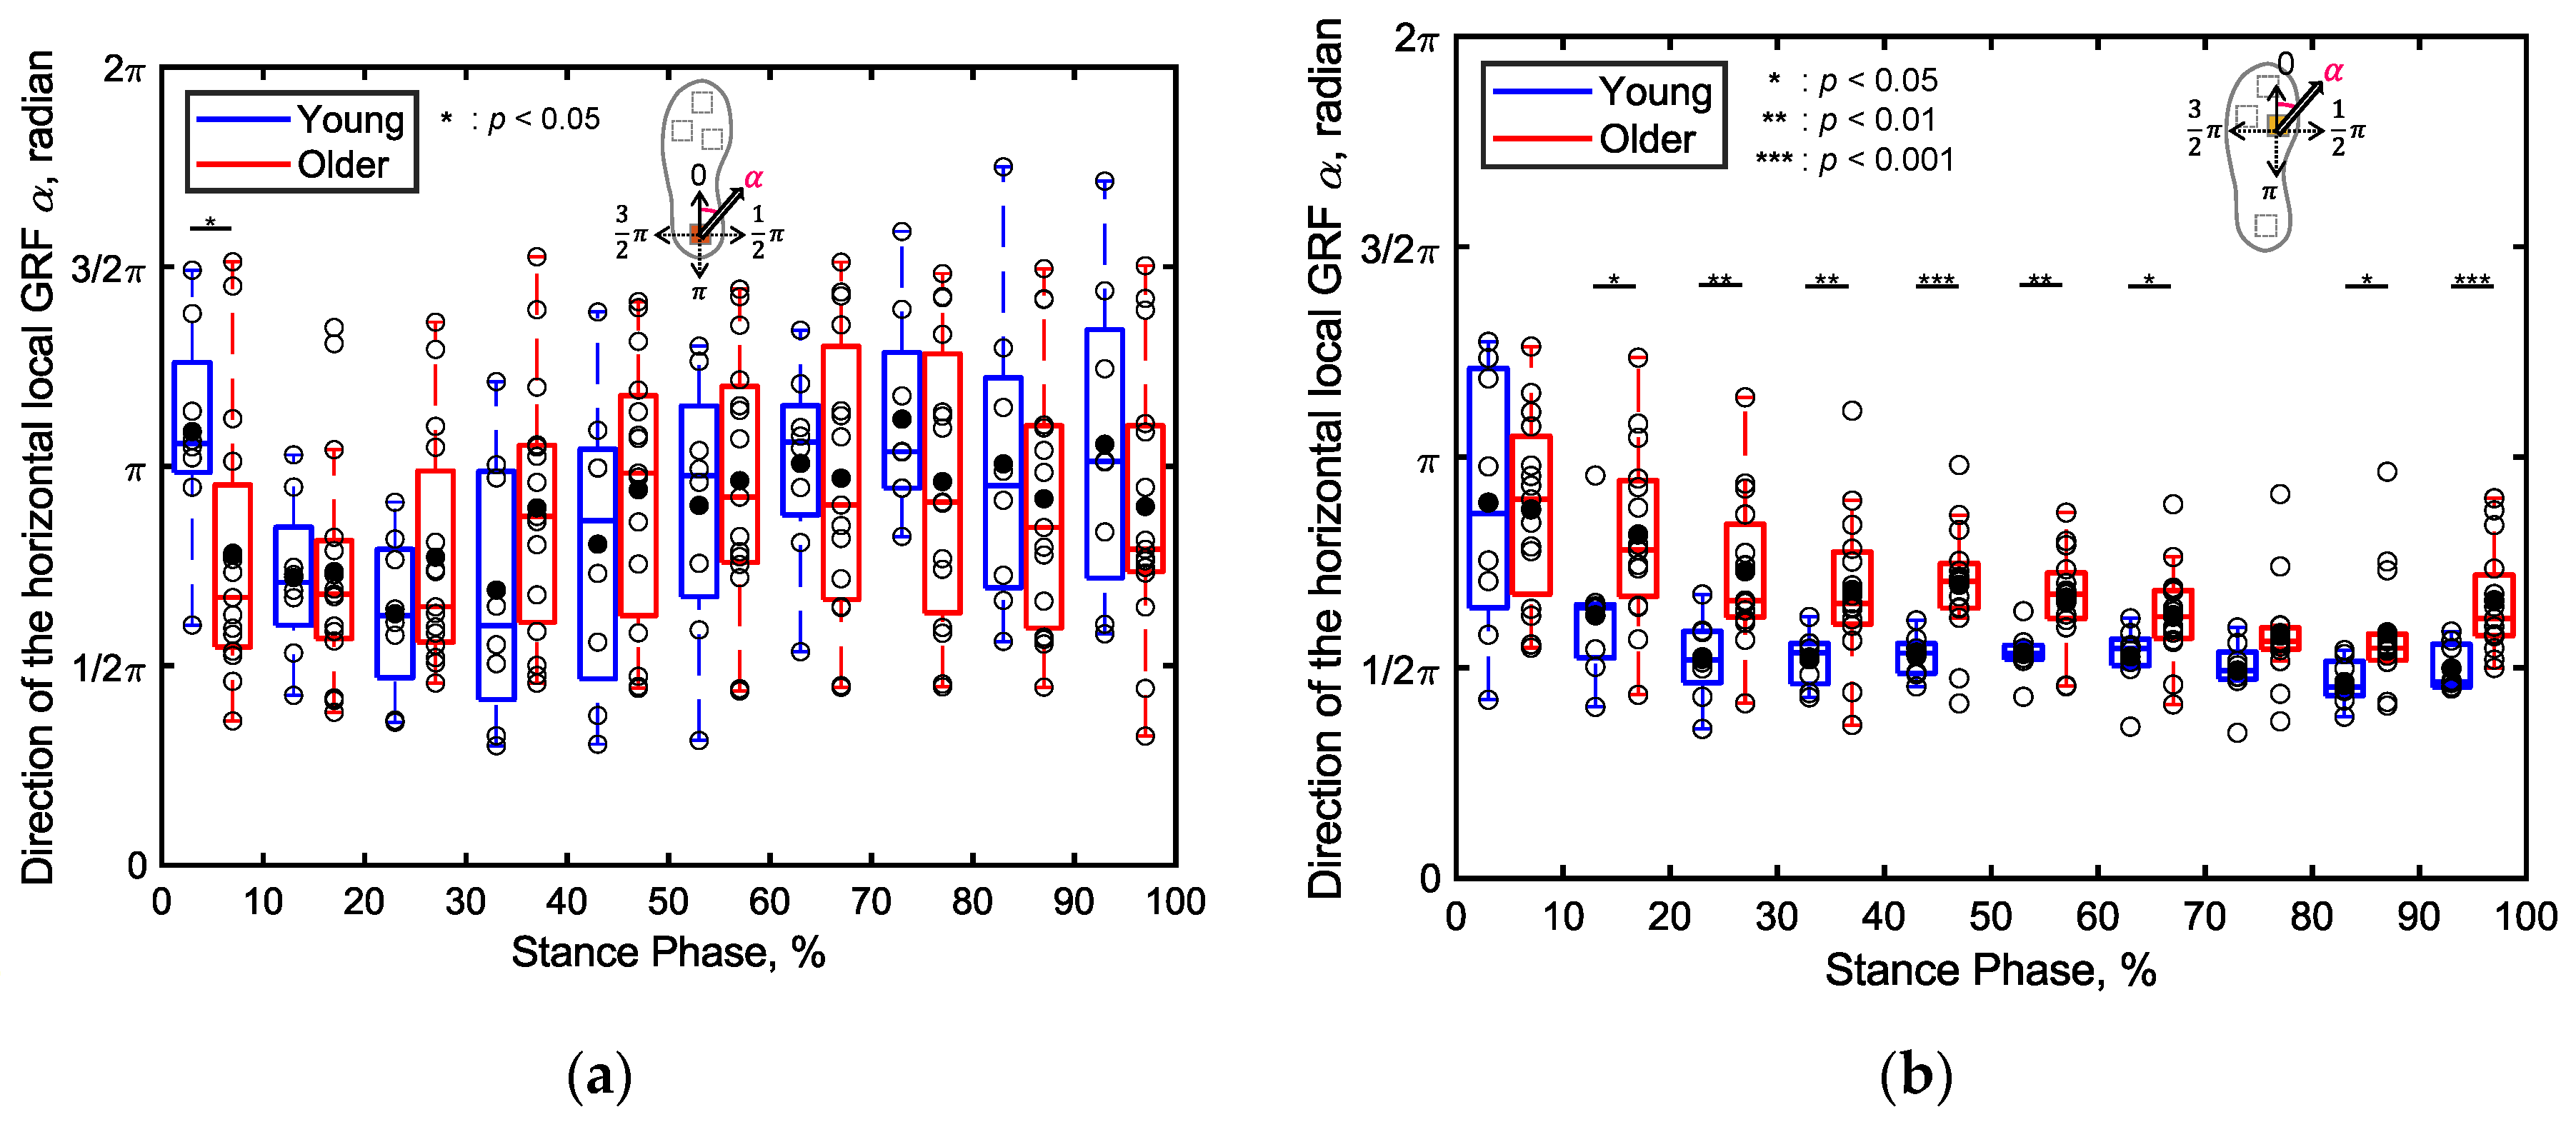
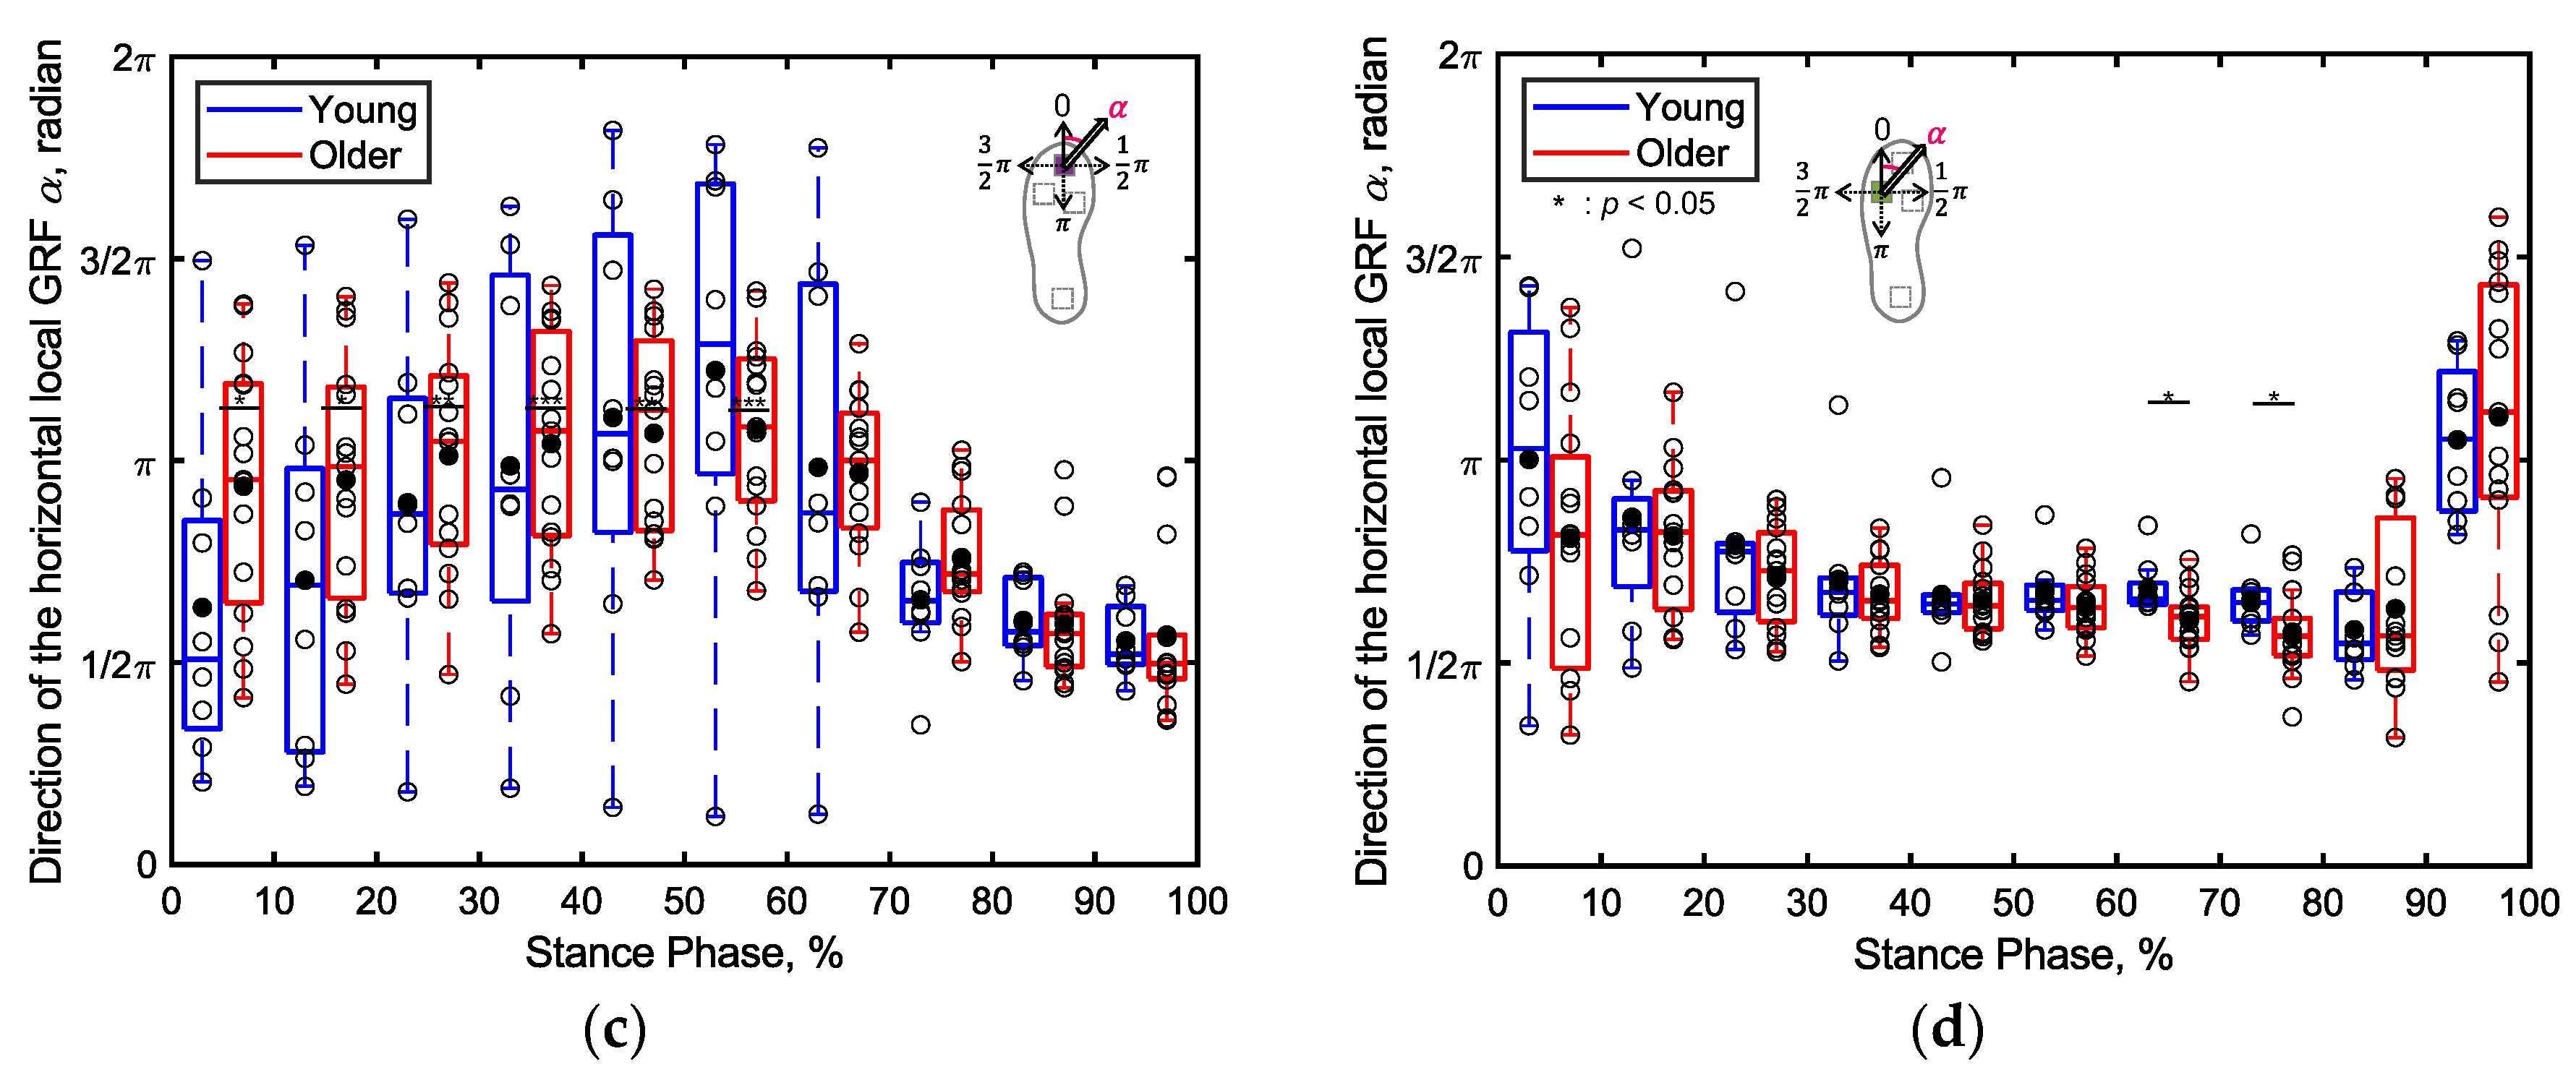
Figure 12 presents boxplots depicting the angle ( α i ) of the horizontal localized GRF vector at each sensor position for the older and young adult participants, recorded during every 10% of the stance phase. Notably, the angle of the GRF at the first metatarsal during 1%‒10% of the stance phase was significantly smaller for the older adults compared to that for the young adults (p < 0.05, Cohen’s d > 0.8), as illustrated in Figure 12a. Conversely, the angle of the GRF at the first metatarsal during 11%‒70% of the stance phase was significantly larger for the older adults compared to that for the young adults (p < 0.05, Cohen’s d > 0.8), as depicted shown in Figure 12b. Furthermore, the angle of the GRF at the first metatarsal during 61%‒80% of the stance phase was significantly smaller for the older adults compared to that for the young adults (p < 0.05, Cohen’s d > 0.8), as illustrated in Figure 12d. In other intervals of the stance phase, no significant differences were apparent in the angle of the horizontal localized GRF between the two age groups.

3.2.3. Stride Length

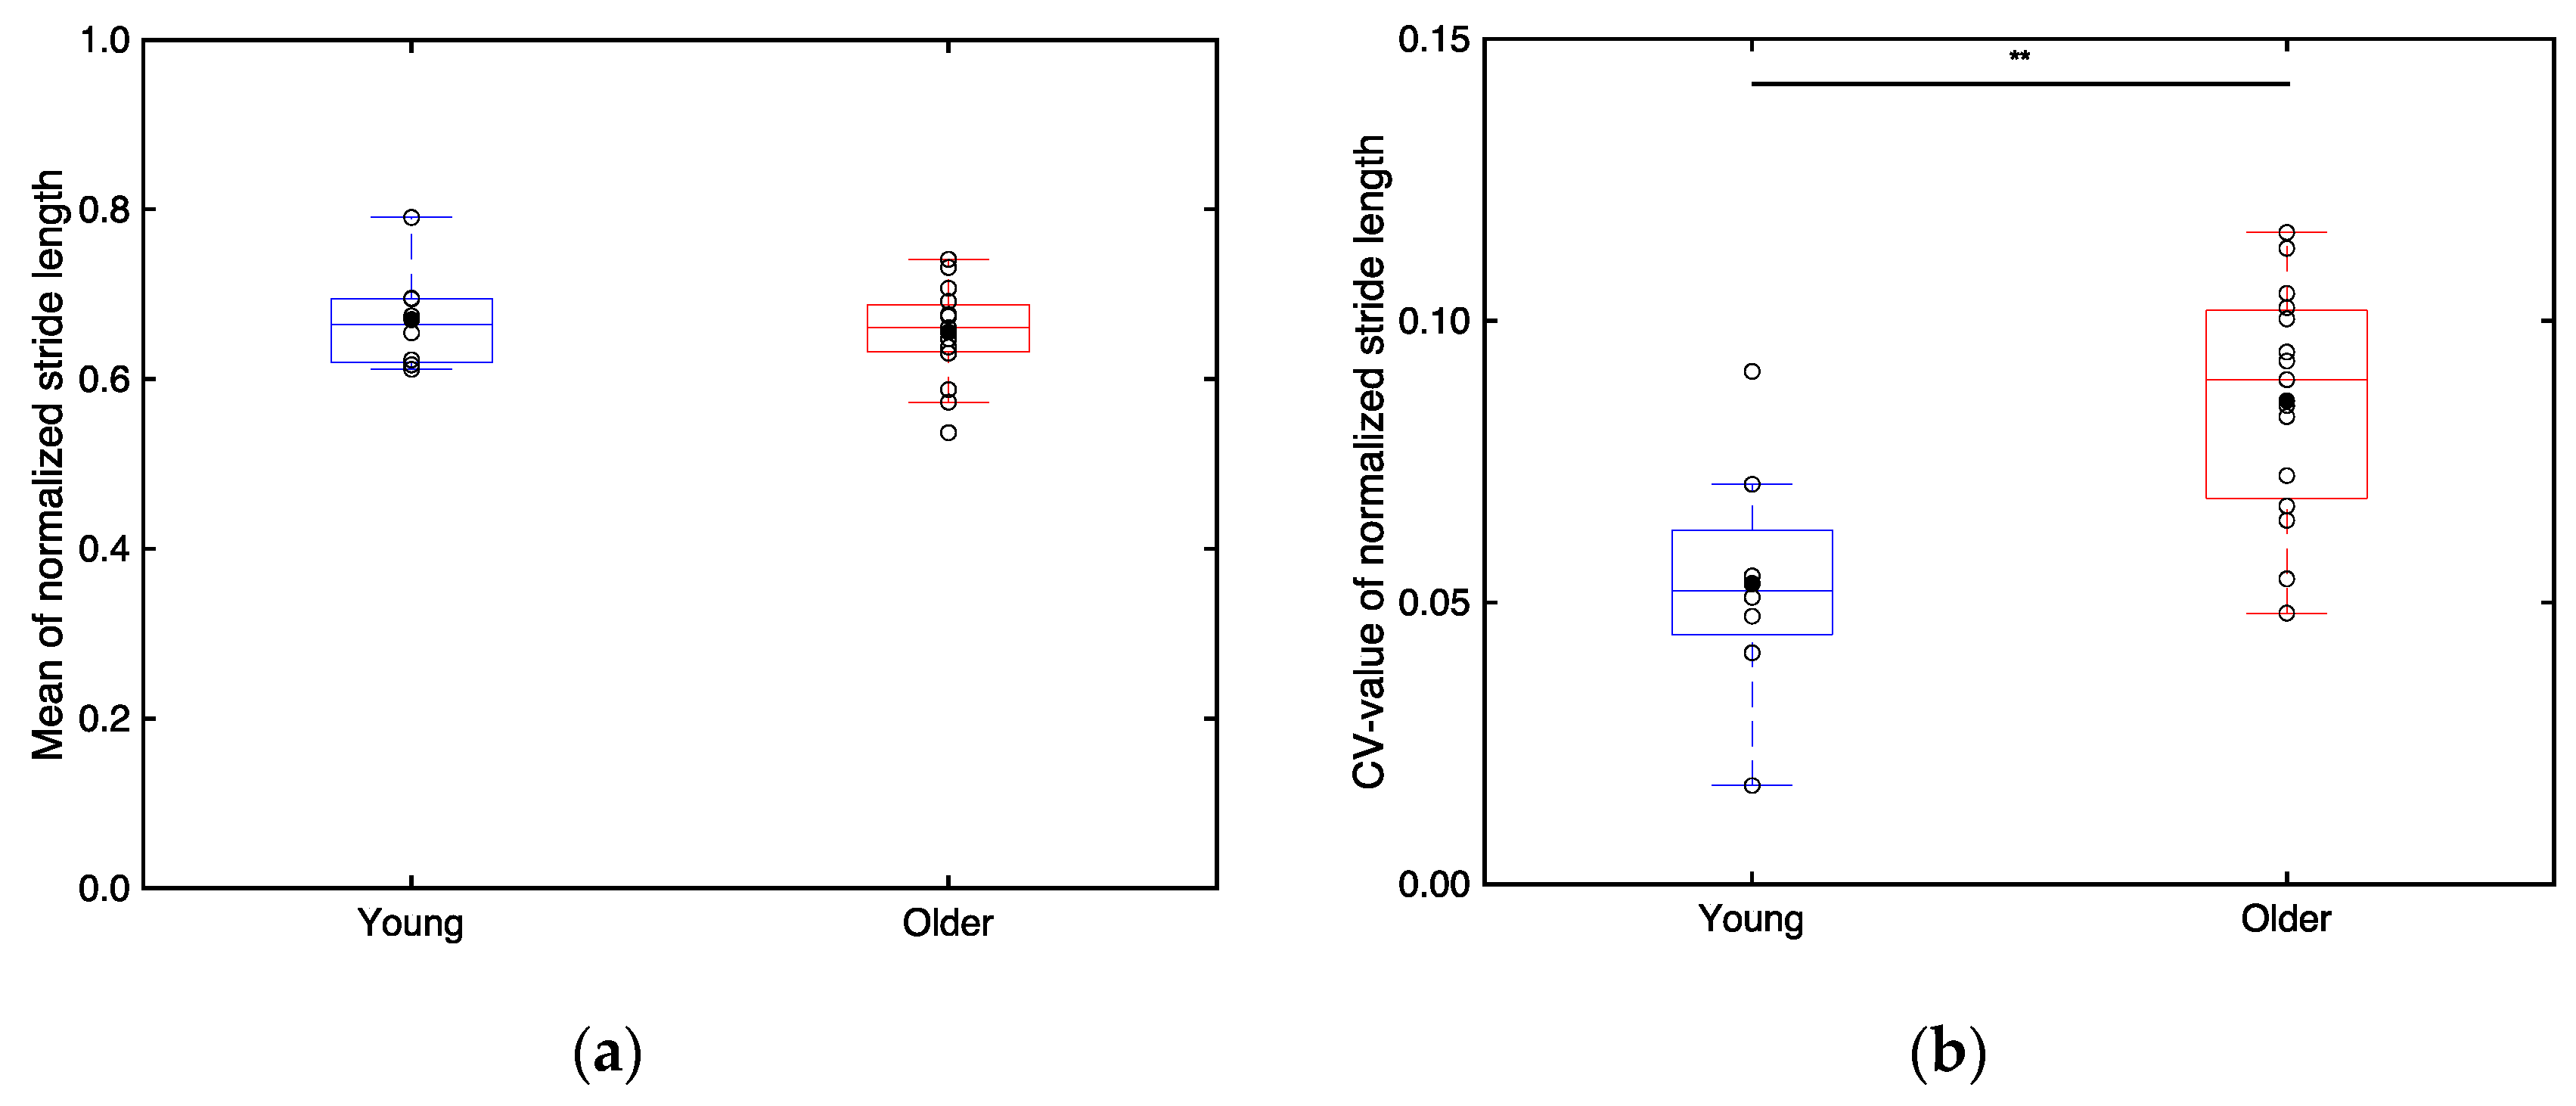
Figure 13 presents boxplots of the mean (Figure 13a) and CV values (Figure 13b) of the stride length of each participant normalized by their height. As illustrated in Figure 13a, no significant differences are apparent in the mean normalized stride length between the older (0.655 ± 0.057) and young adults (0.670 ± 0.059) (p > 0.05). However, as illustrated in Figure 13b, the CV values of the normalized stride length are significantly higher for the older adults (0.0858 ± 0.021) compared to those for the young adults (0.0534 ± 0.021) (p < 0.01; Cohen’s d > 0.8).

3.2.4. Minimum Toe Clearance

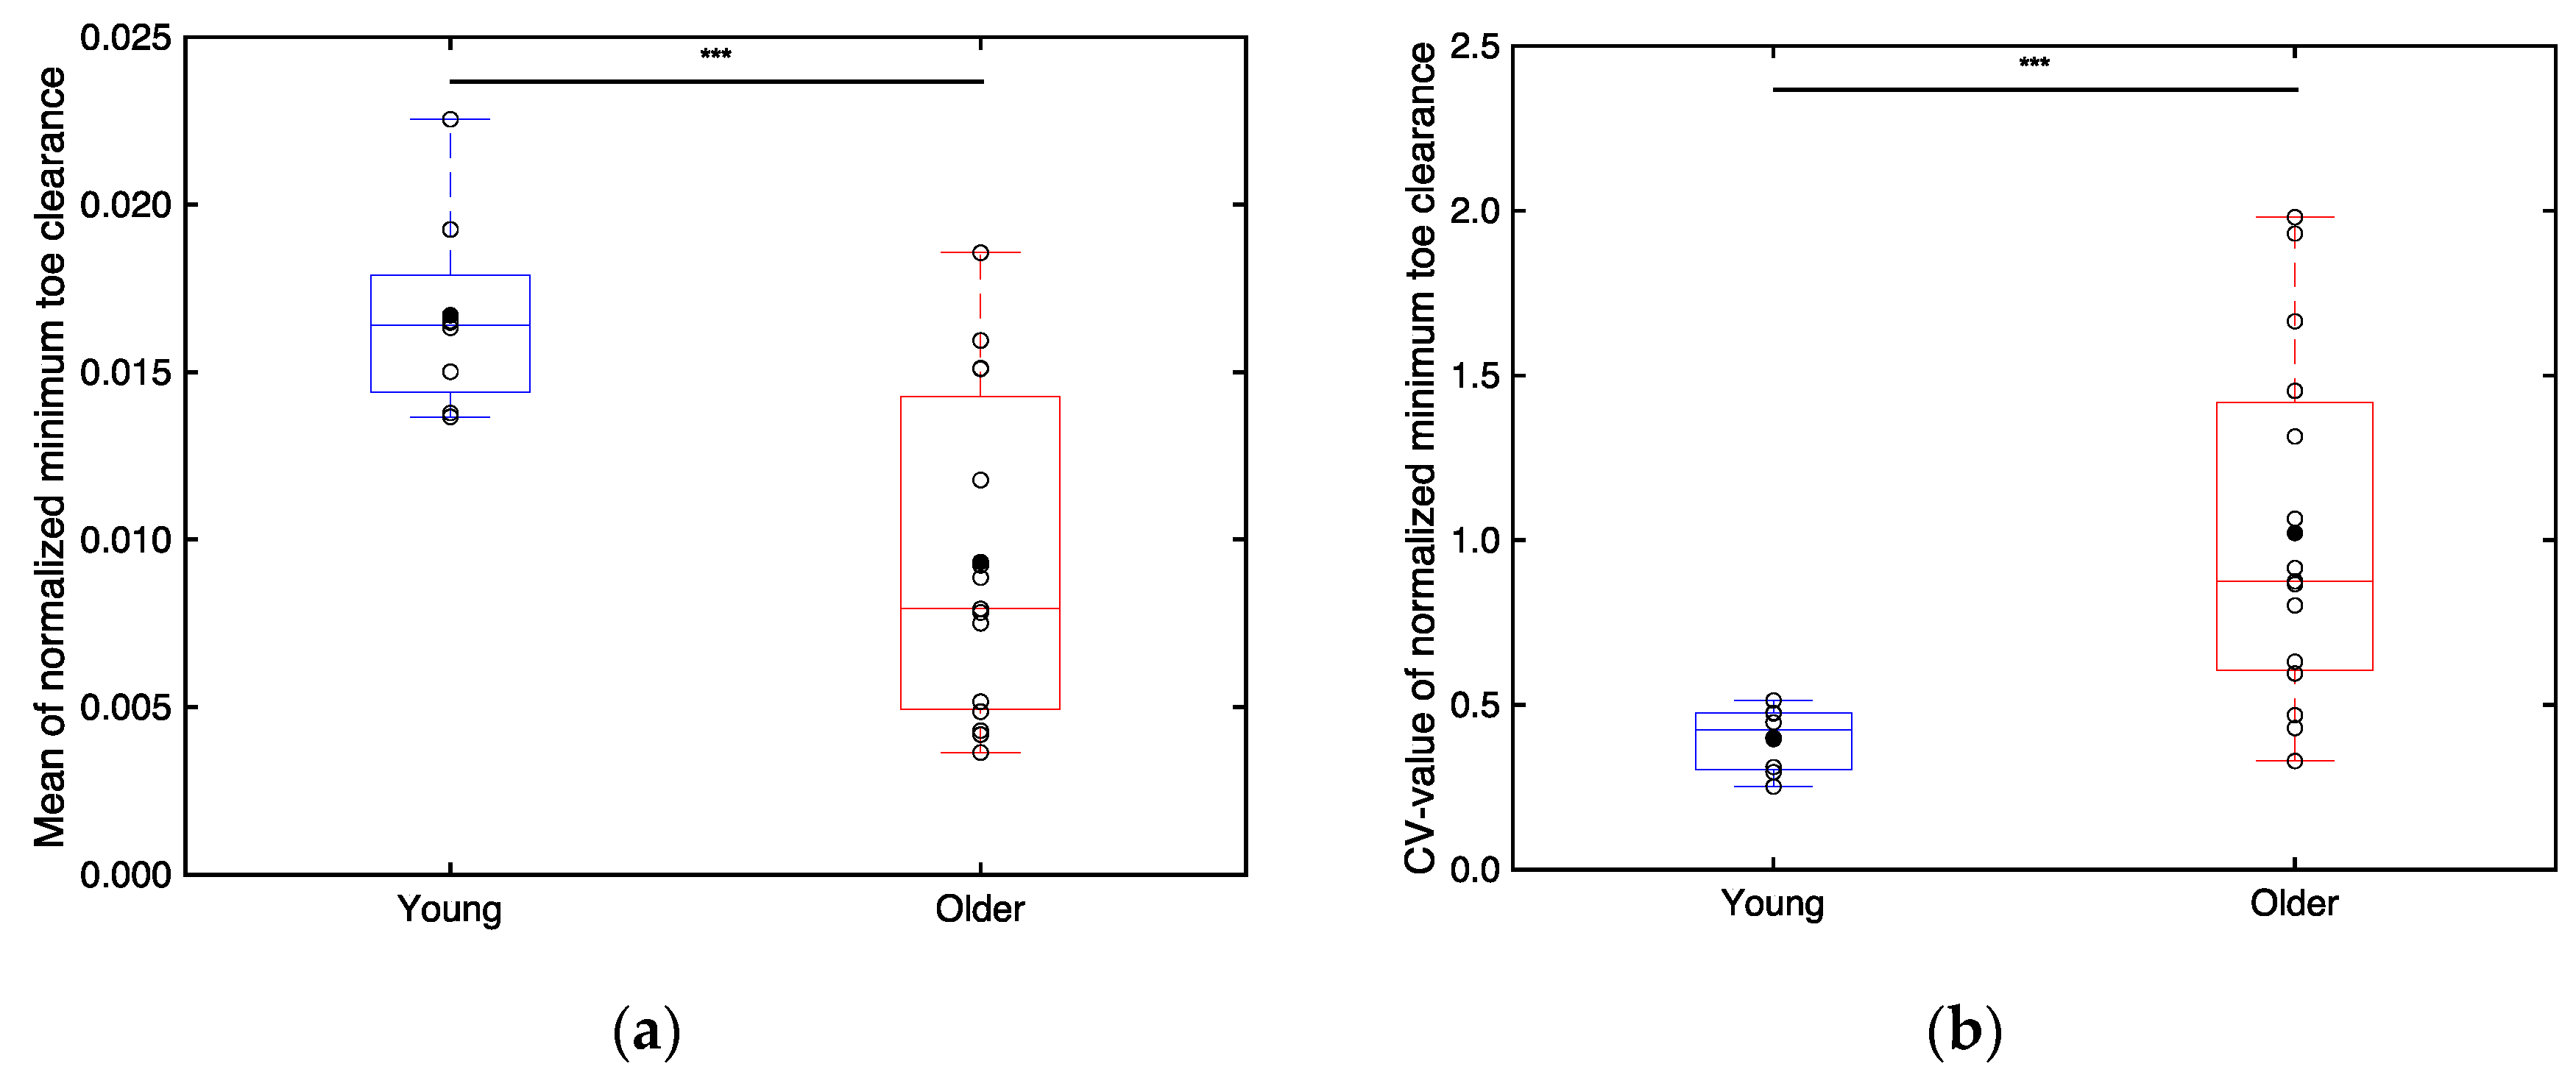
Figure 14 illustrates boxplots of the mean (Figure 14a) and CV values (Figure 14b) of the minimum toe clearance of each participant normalized by their height. As depicted in Figure 14a, the mean normalized minimum toe clearances are significantly smaller (p < 0.001; Cohen’s d > 0.8) for the older adults (0.00934 ± 0.00486) compared to those for the young adults (0.0167 ± 0.00297). Furthermore, as illustrated in Figure 14b, the CV values of the minimum toe clearance are significantly higher (p < 0.001; Cohen’s d > 0.8) for the older adults (1.02 ± 0.53) compared to those for the young adults (0.40 ± 0.10).

4. Discussion

4.1. Estimation Accuracy of the Stride Length and Minimum Toe Clearance (S1)

Benoussaad et al. [38] introduced a foot clearance estimation approach using an IMU attached to the ankle, aiming to achieve a foot clearance estimation error of less than 0.02 m (minimum foot clearance [3]), in accordance with clinical practice requirements [45]. Remarkably, their method achieved an error of 0.0074 m at normal walking pace [38]. Notably, using the same estimation algorithm [38], in this study, we obtained an even better estimation accuracy of 0.0051 mm, likely owing to the placement of the IMU on the toe. This suggests that our estimation accuracy of foot clearance is adequately high for practical applications. However, the RMSE of stride length in this study is 0.10 m, slightly larger than the estimation errors of 0.04 m‒0.06 m reported in studies estimating stride length by performing second-order integration of acceleration [46,47]. The position of the IMU is known to influence the accuracy of stride length estimation performed through the double integral of acceleration [48]. Hence, it is plausible that the placement of the IMU on the toe may have influenced the accuracy of stride length estimation in this study.

4.2. Differences in Localized GRFs between the Young and Older Adults (S2)

Compared to the three-dimensional total GRF and the angle of the horizontal GRF vector (Figure 8), more significant differences were observed in the localized GRFs among the young and older adults. Notably, significant age-related differences were evident in the localized GRFs along the x direction (Figure 9). For instance, during the 1%‒60% of the stance phase, the contribution of the heel’s GRF was significantly lower for the older adults compared to that for the young adults (Figure 9a); conversely, the contribution of the first metatarsal’s GRF was significantly higher for the older adults compared to that for the young adults (Figure 9b). In the later stance phase (61%‒100%), the contribution of the toe’s GRF to the total GRF along the x direction was significantly lower among older adults (Figure 9c). A similar trend was observed along the y direction (Figure 10). Along the vertical direction, in the early stance phase, older adults demonstrated a significantly lower contribution from the heel but considerably greater contributions from the first metatarsal, toe, and fifth metatarsal (Figure 11). These results indicate that the older adults tended to establish foot contact in a flatter orientation owing to their low foot strike angle, demonstrating reduced contribution from the heel and increased contributions from the toe and first metatarsal in the early stance phase. This finding aligns with the results of previous studies, indicating that aging is associated with decreased hip joint angles, a narrow range of motion, increased knee joint angles at foot strike, and decreased extension angles of the hip and knee joints, all contributing toward a lower foot strike angle [49,50,51,52,53]. The results of this study support these findings and underscore the unique capabilities of the proposed system to measure localized GRFs, which cannot be measured using force plate systems.
Furthermore, among the older adults, the orientation of the horizontal GRF at the first metatarsal is directed more posteriorly relative to the direction of progression compared to the young adults (Figure 12b). This supports the notion that during walking, older adults perform stronger braking actions at the first metatarsal upon initial contact, consistent with the observed flat-foot placement. Furthermore, no significant differences are apparent in the angles of the horizontal GRFs at the heel and toe, as illustrated in Figure 10a and Figure 10c, between the two age groups and within individual groups, possibly indicating considerable variability in the angle of horizontal localized GRFs at these positions.
These findings further emphasize that the results obtained in this study are unique to the adopted system and cannot be obtained using force plate systems.

4.3. Difference in Stride Length and Minimum Toe Clearance between the Young and Older Adults (S2)

Our results revealed that the older adult participants exhibited significantly lower mean and considerably larger CV values of the minimum toe clearance compared to the young adult participants (Figure 14). Notably, while the minimum foot clearance does not typically decrease solely owing to aging—often remaining the same or even increasing slightly [3] elderly individuals are more prone to tripping owing to lower median values of the minimum foot clearance (although not significantly lower) and significantly higher variability in these values [6]. Furthermore, the older adult participants exhibited significantly higher CV values of the stride length compared to the young adults (Figure 13b). This increased variability in both the stride length and foot clearance of older adults has been linked to a higher risk of falls [5,6]. These findings suggest that our shoe sensor system can effectively capture gait differences between young and older individuals, thus presenting an alternative to conventional motion capture systems.

4.4. Study Limitation

Despite its contributions, certain limitations of this study must be acknowledged. First, the sample size was small, and the older adult participants were exclusively female, which may limit the generalizability of our results to a broader population. Second, the experimental studies were performed only on one type of flooring. Hence, future research must consider performing such experimental studies on different indoor floorings and outdoor road surfaces to assess the general applicability of the findings. Third, this study solely focused on straight-line walking. Hence, future studies must examine more complex movements, such as turning, which are relevant to daily activities.

5. Conclusions

This study successfully developed a novel shoe sensor system capable of simultaneously measuring localized GRFs, stride length, and toe clearance during walking. Compared to conventional optical motion analysis systems, our shoe sensor system provided relatively accurate results for both the stride length and minimum toe clearance. Gait experiments conducted using the shoe sensor system revealed that older adults presented lower contribution of the local GRF from the heel and greater localized GRF contributions from the toe and fifth metatarsal, compared to young adults. Furthermore, the older adults exhibited lower toe clearances with greater variability compared to the young adults. The older adults also exhibited greater variability in stride lengths. These findings align with the reports of previous studies and underscore the effectiveness of the developed shoe sensor system in analyzing kinematic and kinetic parameters outside the laboratory environment.
In addition to enabling continuous monitoring of these parameters in real environments, the developed system also enhances our understanding of the complex interactions between biomechanical factors that are otherwise quantifiable only under controlled laboratory settings. By integrating sensors into a pair of shoes, the developed system provides comprehensive data on the mechanical forces and movements involved in daily activities. This advancement offers valuable insights into the biomechanical challenges encountered by different populations, such as the elderly. Furthermore, by correlating changes in gait patterns with GRF data, this approach allows for a more nuanced analysis of walking dynamics, potentially leading to improved designs of assistive devices and targeted interventions to correct gait abnormalities.

Author Contributions

Conceptualization, T.Y. and Y.S.; methodology, H.M., T.M., T.N., Y.S., R.S. and T.Y.; software, H.M., M.T. and Y.S.; validation, H.M. and M.T.; formal analysis, H.M., T.M., T.N. and T.Y.; investigation, H.M., T.M., T.N., Y.S., R.S. and T.Y.; resources, H.M., T.M., T.N., Y.S., R.S. and T.Y.; data curation, H.M. and T.M.; writing—original draft preparation, H.M., T.N. and T.Y.; writing—review and editing, H.M., T.M., T.N., Y.S., R.S. and T.Y.; supervision, T.Y.; project administration, T.Y. All authors have read and agreed to the published version of the manuscript.

Funding

This research received no external funding.

Institutional Review Board Statement

The experimental protocol for this study was approved in advance by the Ethics Committee for Human Subjects Research, Graduate School of Engineering, Tohoku University(20A-5) and the Ethics Committee for Human Subjects Research, Tokyo Metropolitan Geriatric Hospital and Institute of Gerontology(R21-20).

Informed Consent Statement

Informed consent was obtained from all subjects involved in the study.

Data Availability Statement

The data including graphs within this paper are available from the corresponding author upon reasonable request.

Conflicts of Interest

The authors declare no conflicts of interest.

References

  1. Kakara, R.S.; Lee, R.; Eckstrom, E.N. Cause-Specific Mortality Among Adults Aged ≥65 Years in the United States, 1999 Through 2020. Public Health Reports® 2023, 139, 54–58. [Google Scholar] [CrossRef] [PubMed]
  2. Peel, N.M. Epidemiology of Falls in Older Age. Canadian Journal on Aging 2011, 30, 7–19. [Google Scholar] [CrossRef] [PubMed]
  3. Mills, P.M.; Barrett, R.S.; Morrison, S. Toe Clearance Variability during Walking in Young and Elderly Men. Gait Posture 2008, 28, 101–107. [Google Scholar] [CrossRef] [PubMed]
  4. Barrett, R.S.; Mills, P.M.; Begg, R.K. A Systematic Review of the Effect of Ageing and Falls History on Minimum Foot Clearance Characteristics during Level Walking. Gait Posture 2010, 32, 429–435. [Google Scholar] [CrossRef]
  5. Menz, H.B.; Lord, S.R.; Fitzpatrick, R.C. Age-Related Differences in Walking Stability.
  6. Begg, R.; Best, R.; Dell’Oro, L.; Taylor, S. Minimum Foot Clearance during Walking: Strategies for the Minimisation of Trip-Related Falls. Gait Posture 2007, 25, 191–198. [Google Scholar] [CrossRef] [PubMed]
  7. Dapp, U.; Vinyard, D.; Golgert, S.; Krumpoch, S.; Freiberger, E. Reference Values of Gait Characteristics in Community-Dwelling Older Persons with Different Physical Functional Levels. BMC Geriatr 2022, 22, 713. [Google Scholar] [CrossRef]
  8. Wingood, M.; Peterson, E.; Neville, C.; Vincenzo, J.L. Feet/Footwear-Related Fall Risk Screening Tool for Older Adults: Development and Content Validation. Front Public Health 2022, 9, 807019. [Google Scholar] [CrossRef]
  9. Sakurai, R.; Suzuki, H.; Ogawa, S.; Takahashi, M.; Fujiwara, Y. Hearing Loss and Increased Gait Variability among Older Adults. Gait Posture 2021, 87, 54–58. [Google Scholar] [CrossRef]
  10. Persch, L.N.; Ugrinowitsch, C.; Pereira, G.; Rodacki, A.L.F. Strength Training Improves Fall-Related Gait Kinematics in the Elderly: A Randomized Controlled Trial. Clinical Biomechanics 2009, 24, 819–825. [Google Scholar] [CrossRef]
  11. Ko, S.U.; Hausdorff, J.M.; Ferrucci, L. Age-Associated Differences in the Gait Pattern Changes of Older Adults during Fast-Speed and Fatigue Conditions: Results from the Baltimore Longitudinal Study of Ageing. Age Ageing 2010, 39, 688–694. [Google Scholar] [CrossRef]
  12. Laroche, D.P.; Cook, S.B.; MacKala, K. Strength Asymmetry Increases Gait Asymmetry and Variability in Older Women. Med Sci Sports Exerc 2012, 44, 2172–2181. [Google Scholar] [CrossRef] [PubMed]
  13. Hsiao, H.Y.; Gray, V.L.; Creath, R.A.; Binder-Macleod, S.A.; Rogers, M.W. Control of Lateral Weight Transfer Is Associated with Walking Speed in Individuals Post-Stroke. J Biomech 2017, 60, 72–78. [Google Scholar] [CrossRef] [PubMed]
  14. Franz, J.R.; Maletis, M.; Kram, R. Real-Time Feedback Enhances Forward Propulsion during Walking in Old Adults. Clinical Biomechanics 2014, 29, 68–74. [Google Scholar] [CrossRef] [PubMed]
  15. Martin, P.E.; Marsh, A.P. STEP LENGTH AND FREQUENCY EFFECTS ON GROUND REACTION FORCES DURING WALKING. 1992; Volume 25. [Google Scholar]
  16. Cesari, M.; Kritchevsky, S.B.; Penninx, B.W.H.J.; Nicklas, B.J.; Simonsick, E.M.; Newman, A.B.; Tylavsky, F.A.; Brach, J.S.; Satterfield, S.; Bauer, D.C.; et al. Prognostic Value of Usual Gait Speed in Well-Functioning Older People - Results from the Health, Aging and Body Composition Study. J Am Geriatr Soc 2005, 53, 1675–1680. [Google Scholar] [CrossRef]
  17. Verghese, J.; Holtzer, R.; Lipton, R.B.; Wang, C. Quantitative Gait Markers and Incident Fall Risk in Older Adults. Journals of Gerontology - Series A Biological Sciences and Medical Sciences 2009, 64, 896–901. [Google Scholar] [CrossRef]
  18. Fukuchi, C.A.; Fukuchi, R.K.; Duarte, M. Effects of Walking Speed on Gait Biomechanics in Healthy Participants: A Systematic Review and Meta-Analysis. Syst Rev 2019, 8, 153. [Google Scholar] [CrossRef] [PubMed]
  19. van Loo, M.A.; Moseley, A.M.; Bosman, J.M.; de Bie, R.A.; Hassett, L. Test–Re-Test Reliability of Walking Speed, Step Length and Step Width Measurement after Traumatic Brain Injury: A Pilot Study. Brain Inj 2004, 18, 1041–1048. [Google Scholar] [CrossRef]
  20. Nagano, H.; Sparrow, W.A.; Mizukami, K.; Sarashina, E.; Begg, R. A Cross-Sectional Study of Foot-Ground Clearance in Healthy Community Dwelling Japanese Cohorts Aged 50, 60 and 70 Years. BMC Geriatr 2021, 21, 166. [Google Scholar] [CrossRef]
  21. van der Kruk, E.; Reijne, M.M. Accuracy of Human Motion Capture Systems for Sport Applications; State-of-the-Art Review. Eur J Sport Sci 2018, 18, 806–819. [Google Scholar] [CrossRef]
  22. Simon, S.R. Quantification of Human Motion: Gait Analysis - Benefits and Limitations to Its Application to Clinical Problems. J Biomech 2004, 37, 1869–1880. [Google Scholar] [CrossRef]
  23. Schepers, H.M.; Van Asseldonk, E.H.F.; Buurke, J.H.; Veltink, P.H. Ambulatory Estimation of Center of Mass Displacement during Walking. IEEE Trans Biomed Eng 2009, 56, 1189–1195. [Google Scholar] [CrossRef] [PubMed]
  24. Adachi, W.; Tsujiuchi, N.; Koizumi, T.; Shiojima, K.; Tsuchiya, Y.; Inoue, Y. Development of Walking Analysis System Using by Motion Sensor with Mobile Force Plate. Journal of System Design and Dynamics 2012, 6, 655–664. [Google Scholar] [CrossRef]
  25. Moriyasu, K.; Nishiwaki, T.; Yamaguchi, T.; Hokkirigawa, K. New Technique of Three Directional Ground Reaction Force Distributions. Footwear Sci 2010, 2, 57–64. [Google Scholar] [CrossRef]
  26. Yamaguchi, T. Distribution of the Local Required Coefficient of Friction in the Shoe–Floor Contact Area during Straight Walking: A Pilot Study. Biotribology 2019, 19, 100101. [Google Scholar] [CrossRef]
  27. Niwa, E.; Sasaki, Y. Cr-N Strain Sensitive Thin Films and Their Pressure Sensor Applications. IEEJ Transactions on Sensors and Micromachines 2014, 134, 385–391. [Google Scholar] [CrossRef]
  28. Niwa, E.; Shirakawa, K.; Shingyochi, S.; Xiong, S.; Nakahara, K.; Ito, T.; Sasaki, Y. Load Vector Sensors Using Strain-Sensitive Cr-N Thin Films and Their Applications. Electronics and Communications in Japan 2016, 99, 58–67. [Google Scholar] [CrossRef]
  29. Yamaguchi, T.; Takahashi, Y.; Sasaki, Y. Prediction of Three-Directional Ground Reaction Forces during Walking Using a Shoe Sole Sensor System and Machine Learning. Sensors (Basel) 2023, 23, 8985. [Google Scholar] [CrossRef]
  30. Dadashi, F.; Mariani, B.; Rochat, S.; Büla, C.J.; Santos-Eggimann, B.; Aminian, K. Gait and Foot Clearance Parameters Obtained Using Shoe-Worn Inertial Sensors in a Large-Population Sample of Older Adults. Sensors (Switzerland) 2014, 14, 443–457. [Google Scholar] [CrossRef]
  31. Dobkin, B.H.; Xu, X.; Batalin, M.; Thomas, S.; Kaiser, W. Reliability and Validity of Bilateral Ankle Accelerometer Algorithms for Activity Recognition and Walking Speed after Stroke. Stroke 2011, 42, 2246–2250. [Google Scholar] [CrossRef] [PubMed]
  32. Salarian, A.; Horak, F.B.; Zampieri, C.; Carlson-Kuhta, P.; Nutt, J.G.; Aminian, K. ITUG, a Sensitive and Reliable Measure of Mobility. IEEE Transactions on Neural Systems and Rehabilitation Engineering 2010, 18, 303–310. [Google Scholar] [CrossRef]
  33. Trojaniello, D.; Cereatti, A.; Della Croce, U. Accuracy, Sensitivity and Robustness of Five Different Methods for the Estimation of Gait Temporal Parameters Using a Single Inertial Sensor Mounted on the Lower Trunk. Gait Posture 2014, 40, 487–492. [Google Scholar] [CrossRef] [PubMed]
  34. Godfrey, A.; Bourke, A.K.; Ólaighin, G.M.; van de Ven, P.; Nelson, J. Activity Classification Using a Single Chest Mounted Tri-Axial Accelerometer. Med Eng Phys 2011, 33, 1127–1135. [Google Scholar] [CrossRef] [PubMed]
  35. Fukushi, K.; Huang, C.; Wang, Z.; Kajitani, H.; Nihey, F.; Nakahara, K. On-Line Algorithms of Stride-Parameter Estimation for in-Shoe Motion-Sensor System. IEEE Sens J 2022, 22, 9636–9648. [Google Scholar] [CrossRef]
  36. Fischer, C.; Sukumar, P.T.; Hazas, M. Tutorial: Implementing a Pedestrian Tracker Using Inertial Sensors. IEEE Pervasive Comput 2013, 12, 17–27. [Google Scholar] [CrossRef]
  37. Frosio, I.; Pedersini, F.; Borghese, N.A. Autocalibration of MEMS Accelerometers. IEEE Trans Instrum Meas 2009, 58, 2034–2041. [Google Scholar] [CrossRef]
  38. Benoussaad, M.; Sijobert, B.; Mombaur, K.; Coste, C.A. Robust Foot Clearance Estimation Based on the Integration of Foot-Mounted IMU Acceleration Data. Sensors 2016, 16, 12. [Google Scholar] [CrossRef]
  39. Luinge, H.J.; Veltink, P.H. Measuring Orientation of Human Body Segments Using Miniature Gyroscopes and Accelerometers. Med Biol Eng Comput 2005, 43, 273–282. [Google Scholar] [CrossRef] [PubMed]
  40. Ryoga, N.; Motomichi, S.; Kiyoshi, H. Stride Estimation Based on Horizontal Acceleration Integration Using an Inertial Sensor. Transactions of the JSME (in Japanese) 2023, 89, 23–00194. [Google Scholar] [CrossRef]
  41. International Society of Information Fusion; Xi’an jiao tong da xue.; IEEE Aerospace and Electronic Systems Society; Institute of Electrical and Electronics Engineers; Chinese Society for Information Fusion 20th International Conference on Information Fusion: 2017 Proceedings. ISBN 9780996452700.
  42. Yamaguchi, T.; Yano, M.; Onodera, H.; Hokkirigawa, K. Kinematics of Center of Mass and Center of Pressure Predict Friction Requirement at Shoe-Floor Interface during Walking. Gait Posture 2013, 38, 209–214. [Google Scholar] [CrossRef] [PubMed]
  43. Burnfield, J.M.; Powers, C.M. The Role of Center of Mass Kinematics in Predicting Peak Utilized Coefficient of Friction during Walking. In Proceedings of the Journal of Forensic Sciences, November 2007; Volume 52, pp. 1328–1333. [Google Scholar]
  44. Lakens, D. Calculating and Reporting Effect Sizes to Facilitate Cumulative Science: A Practical Primer for t-Tests and ANOVAs. Front Psychol 2013, 4, 863. [Google Scholar] [CrossRef]
  45. Benoussaad, M.; Mombaur, K.; Azevedo-Coste, C. Nonlinear Model Predictive Control of Joint Ankle by Electrical Stimulation for Drop Foot Correction. In Proceedings of the 2013 IEEE/RSJ International Conference on Intelligent Robots and Systems; 2013; pp. 983–989. [Google Scholar]
  46. Rampp, A.; Barth, J.; Schülein, S.; Gaßmann, K.G.; Klucken, J.; Eskofier, B.M. Inertial Sensor-Based Stride Parameter Calculation From Gait Sequences in Geriatric Patients. IEEE Trans Biomed Eng 2015, 62, 1089–1097. [Google Scholar] [CrossRef] [PubMed]
  47. Ferrari, A.; Ginis, P.; Hardegger, M.; Casamassima, F.; Rocchi, L.; Chiari, L. A Mobile Kalman-Filter Based Solution for the Real-Time Estimation of Spatio-Temporal Gait Parameters. IEEE Transactions on Neural Systems and Rehabilitation Engineering 2016, 24, 764–773. [Google Scholar] [CrossRef] [PubMed]
  48. Küderle, A.; Roth, N.; Zlatanovic, J.; Zrenner, M.; Eskofier, B.; Kluge, F. The Placement of Foot-Mounted IMU Sensors Does Affect the Accuracy of Spatial Parameters during Regular Walking. PLoS One 2022, 17, e0269567. [Google Scholar] [CrossRef] [PubMed]
  49. Riley, P.O.; Dellacroce, U.; Kerrigan, D.C. Effect of Age on Lower Extremity Joint Moment Contributions to Gait Speed; 2001; Volume 14. [Google Scholar]
  50. Kerrigan, D.C.; Lee, L.W.; Collins, J.J.; Riley, P.O.; Lipsitz, L.A. Reduced Hip Extension during Walking: Healthy Elderly and Fallers versus Young Adults. Arch Phys Med Rehabil 2001, 82, 26–30. [Google Scholar] [CrossRef] [PubMed]
  51. Kang, H.G.; Dingwell, J.B. Effects of Walking Speed, Strength and Range of Motion on Gait Stability in Healthy Older Adults. J Biomech 2008, 41, 2899–2905. [Google Scholar] [CrossRef]
  52. Ostrosky, K.M.; VanSwearingen, J.M.; Burdett, R.G.; Gee, Z. A Comparison of Gait Characteristics in Young and Old Subjects. Phys Ther 1994, 74, 637–644. [Google Scholar] [CrossRef]
  53. Favre, J.; Erhart-Hledik, J.C.; Andriacchi, T.P. Age-Related Differences in Sagittal-Plane Knee Function at Heel-Strike of Walking Are Increased in Osteoarthritic Patients. Osteoarthritis Cartilage 2014, 22, 464–471. [Google Scholar] [CrossRef]
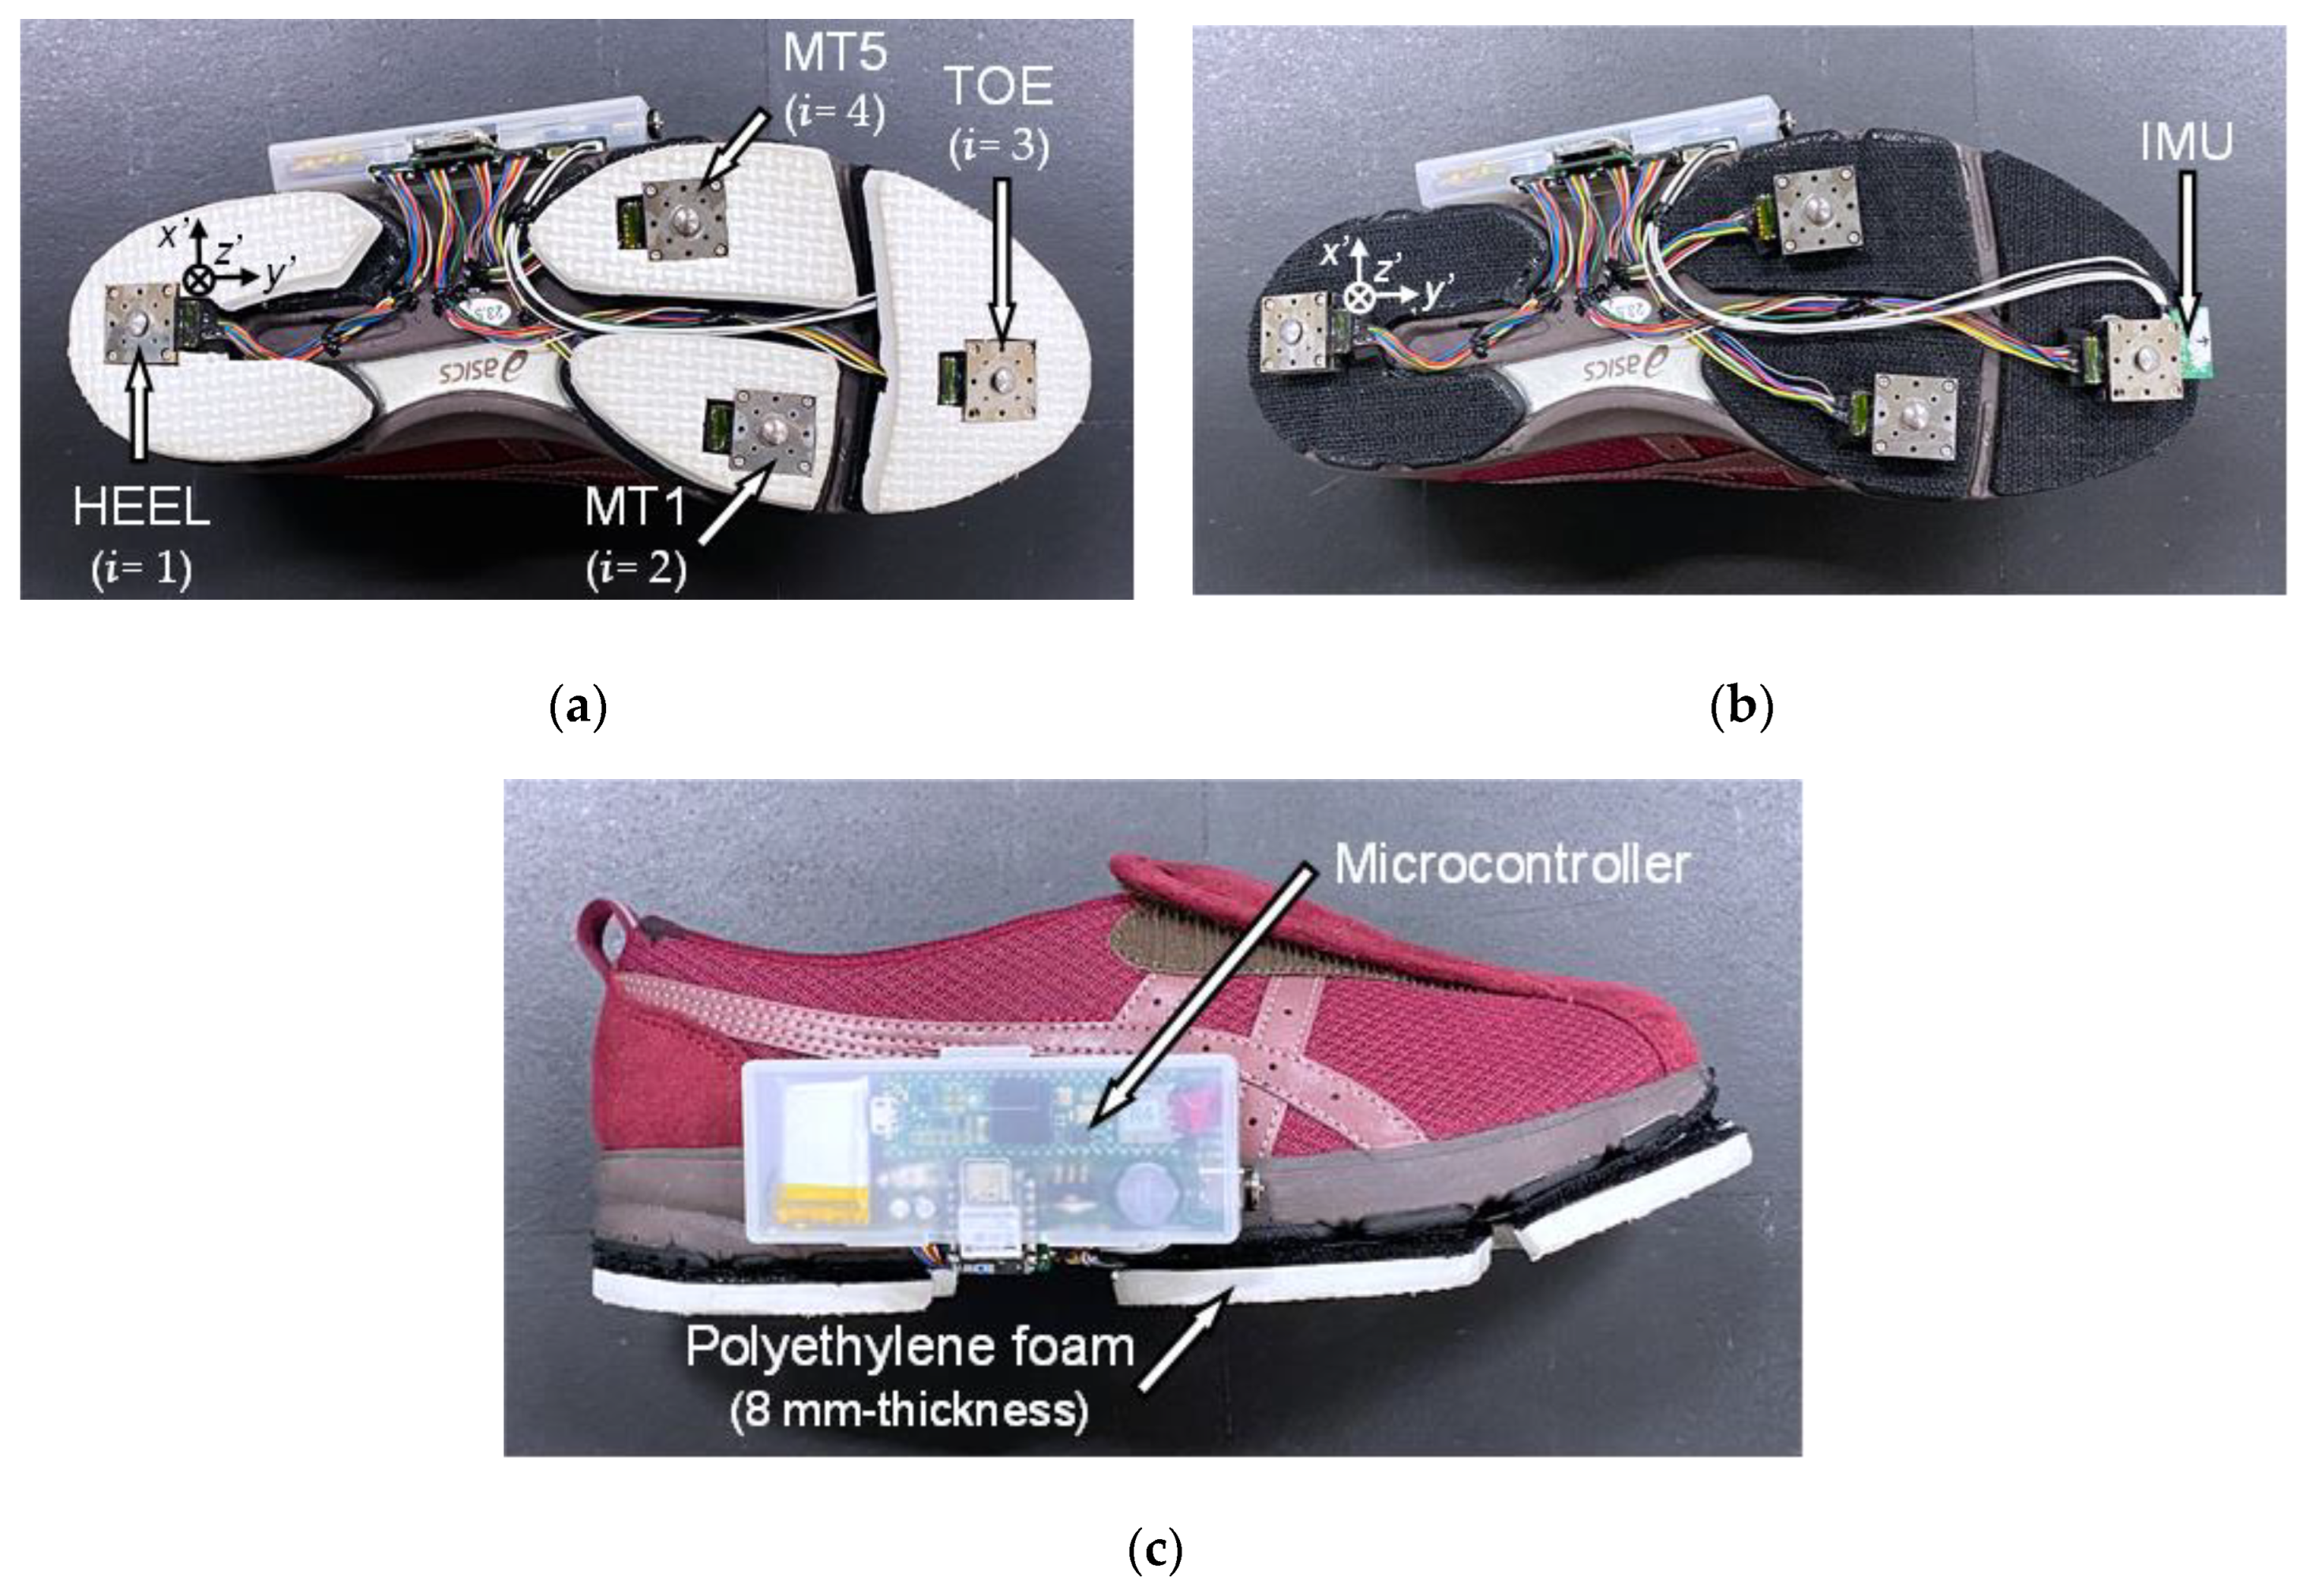
Figure 1. Shoe sensor system. Here, x’, y’, and z’ denote the local coordinates of each sensor system. (a) Installation location of the four triaxial force sensors, (b) installation location of the inertial measurement unit (IMU, depicted without the polyethylene foam outsole), and (c) side view of the shoe sensor system. MT1 and MT5 represent the first and fifth metatarsal heads, respectively.
Preprints 117579 g001
Figure 2. Flowchart of the algorithm used for analyzing localized ground reaction forces (GRFs), stride length, and toe clearance based on data extracted from the shoe sensor system.
Preprints 117579 g002
Figure 3. Example of time-series localized GRF ( F x i , F y i , F z i [ i = 1‒4]) and total GRF i = 1 i = 4 f z i data recorded by the shoe sensor system during a stance phase. (a) Forces in the x direction, (b) y direction, and (c) z direction. Blue lines represent the total of the four localized GRFs.
Preprints 117579 g003
Figure 4. Example of the horizontal trajectory of the IMU position (x, y) at the toe part, as recorded by the shoe sensor system. The arrow indicates the start of the leg swing.
Preprints 117579 g004
Figure 5. Example of time-series toe clearance data recorded by the shoe sensor system during a swing phase.
Preprints 117579 g005
Figure 6. Comparisons between the mean (a) stride lengths and (b) minimum toe clearances recorded by the motion capture system and shoe sensor system.
Preprints 117579 g006
Figure 7. Bland‒Altman plots comparing the (a) stride lengths and (b) minimum toe clearances recorded by the motion capture system and shoe sensor system. Here, the x-axes represent the arithmetic means of the readings of both systems, while the y-axes depict the differences between the readings of both systems. The dashed line in the middle indicates the arithmetic mean of the differences, while the lines above and below this line mark the range of ±1.96σ (σ = standard deviation), encompassing 95% of the differences.
Preprints 117579 g007
Figure 8. Boxplots of the total triaxial GRF of each participant normalized by their body mass during the stance phase, divided into 10% increments along (a) the x, (b) y, and (c) z directions. (d) Boxplot depicting the angle of the horizontal GRF vector of each participant during the stance phase, divided into 10% increments. Unfilled markers represent the average values for each participant, while black markers denote the mean values for each age group. *, **, and *** indicate p < 0.05, p < 0.01, and p < 0.001, respectively.
Preprints 117579 g008aPreprints 117579 g008b
Figure 9. Boxplots depicting the percentage contributions of localized GRFs along the x direction at individual sensor locations for the older and young adult participants during the stance phase, divided into 10% increments: (a) heel, (b) first metatarsal, (c) toe, and (d) fifth metatarsal. Unfilled markers represent the average values for each participant, while black markers denote the mean values for each age group. *, **, and *** indicate p < 0.05, p < 0.01, and p < 0.001, respectively.
Preprints 117579 g009aPreprints 117579 g009b
Figure 10. Boxplots depicting the percentage contributions of the localized GRFs along the y direction recorded at individual sensor locations for the young and older participants during the stance phase, divided into 10% increments: (a) heel, (b) first metatarsal, (c) toe, and (d) fifth metatarsal. Unfilled markers represent the mean values for each participant, while black markers denote the average values for each age group. *, **, and *** imply p < 0.05, p < 0.01, and p < 0.001, respectively.
Preprints 117579 g010aPreprints 117579 g010b
Figure 11. Boxplots depicting the percentage contributions of the localized GRFs along the z direction at individual sensor positions for the young and older adult participants during the stance phase, divided into 10% increments: (a) heel, (b) first metatarsal, (c) toe, and (d) fifth metatarsal. Unfilled markers denote mean values for each participant, while black markers represent the average values for each age group. *, **, and *** imply p < 0.05, p < 0.01, and p < 0.001, respectively.
Preprints 117579 g011aPreprints 117579 g011b
Figure 12. Boxplots depicting the angle of the horizontal localized GRF vector at each sensor position for the young and older participants during the stance phase, divided into 10% increments: (a) heel, (b) first metatarsal, (c) toe, and (d) fifth metatarsal. Unfilled markers represent the mean values for each participant, while black markers denote the average values for each age group. *, **, and *** imply p < 0.05, p < 0.01, and p < 0.001, respectively.
Preprints 117579 g012aPreprints 117579 g012b
Figure 13. Boxplots depicting (a) the normalized stride lengths of the older and young adults and (b) the CV values of these normalized stride lengths. Unfilled markers represent the mean value for each participant, while black markers represent the mean value for each age group. ** implies p < 0.01.
Preprints 117579 g013
Figure 14. (a) Boxplots depicting the normalized minimum toe clearances of the older and young adults and (b) the CV values of these normalized minimum toe clearances. Unfilled markers represent the mean value for each participant, while black markers represent the mean value for each age group. ** implies p < 0.001.
Preprints 117579 g014
Disclaimer/Publisher’s Note: The statements, opinions and data contained in all publications are solely those of the individual author(s) and contributor(s) and not of MDPI and/or the editor(s). MDPI and/or the editor(s) disclaim responsibility for any injury to people or property resulting from any ideas, methods, instructions or products referred to in the content.
Copyright: This open access article is published under a Creative Commons CC BY 4.0 license, which permit the free download, distribution, and reuse, provided that the author and preprint are cited in any reuse.
Prerpints.org logo

Preprints.org is a free preprint server supported by MDPI in Basel, Switzerland.

Subscribe

© 2024 MDPI (Basel, Switzerland) unless otherwise stated