Submitted:
08 September 2024
Posted:
09 September 2024
You are already at the latest version
Abstract
Keywords:
1. Introduction
2. Results
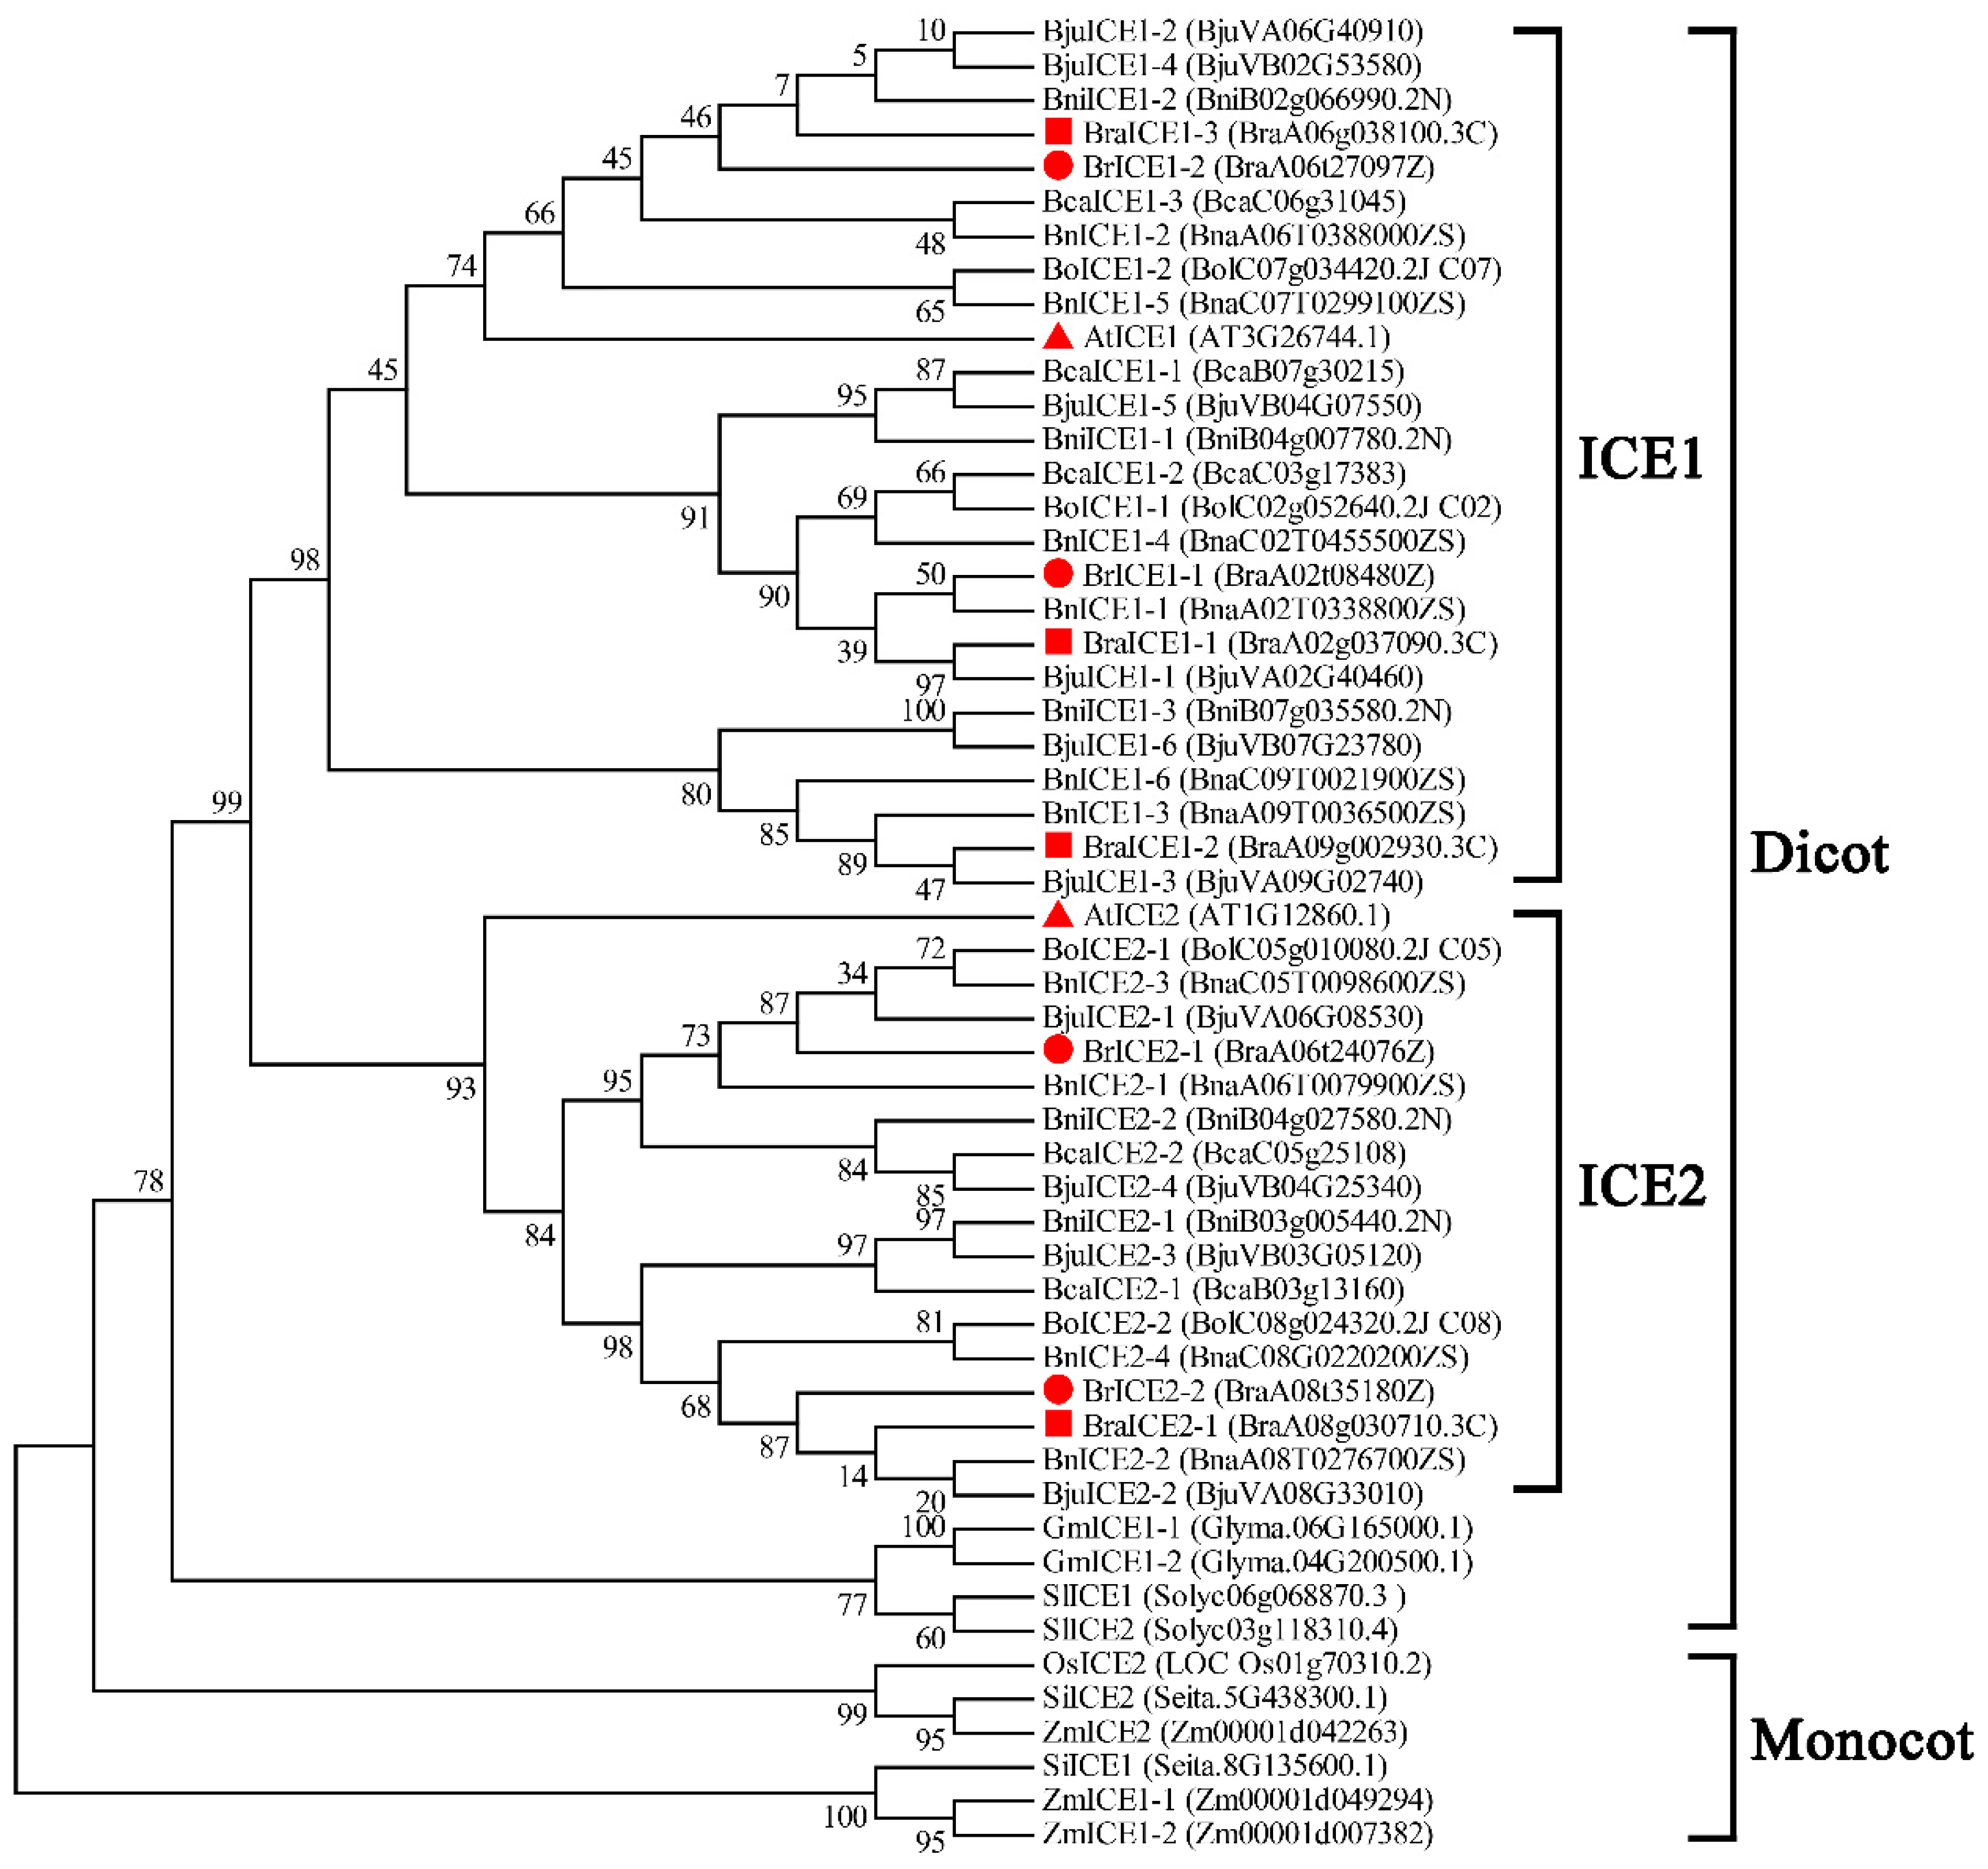
2.1. Identification and Phylogenetic Analysis of ICE1 Homologous Genes in Brassica Species
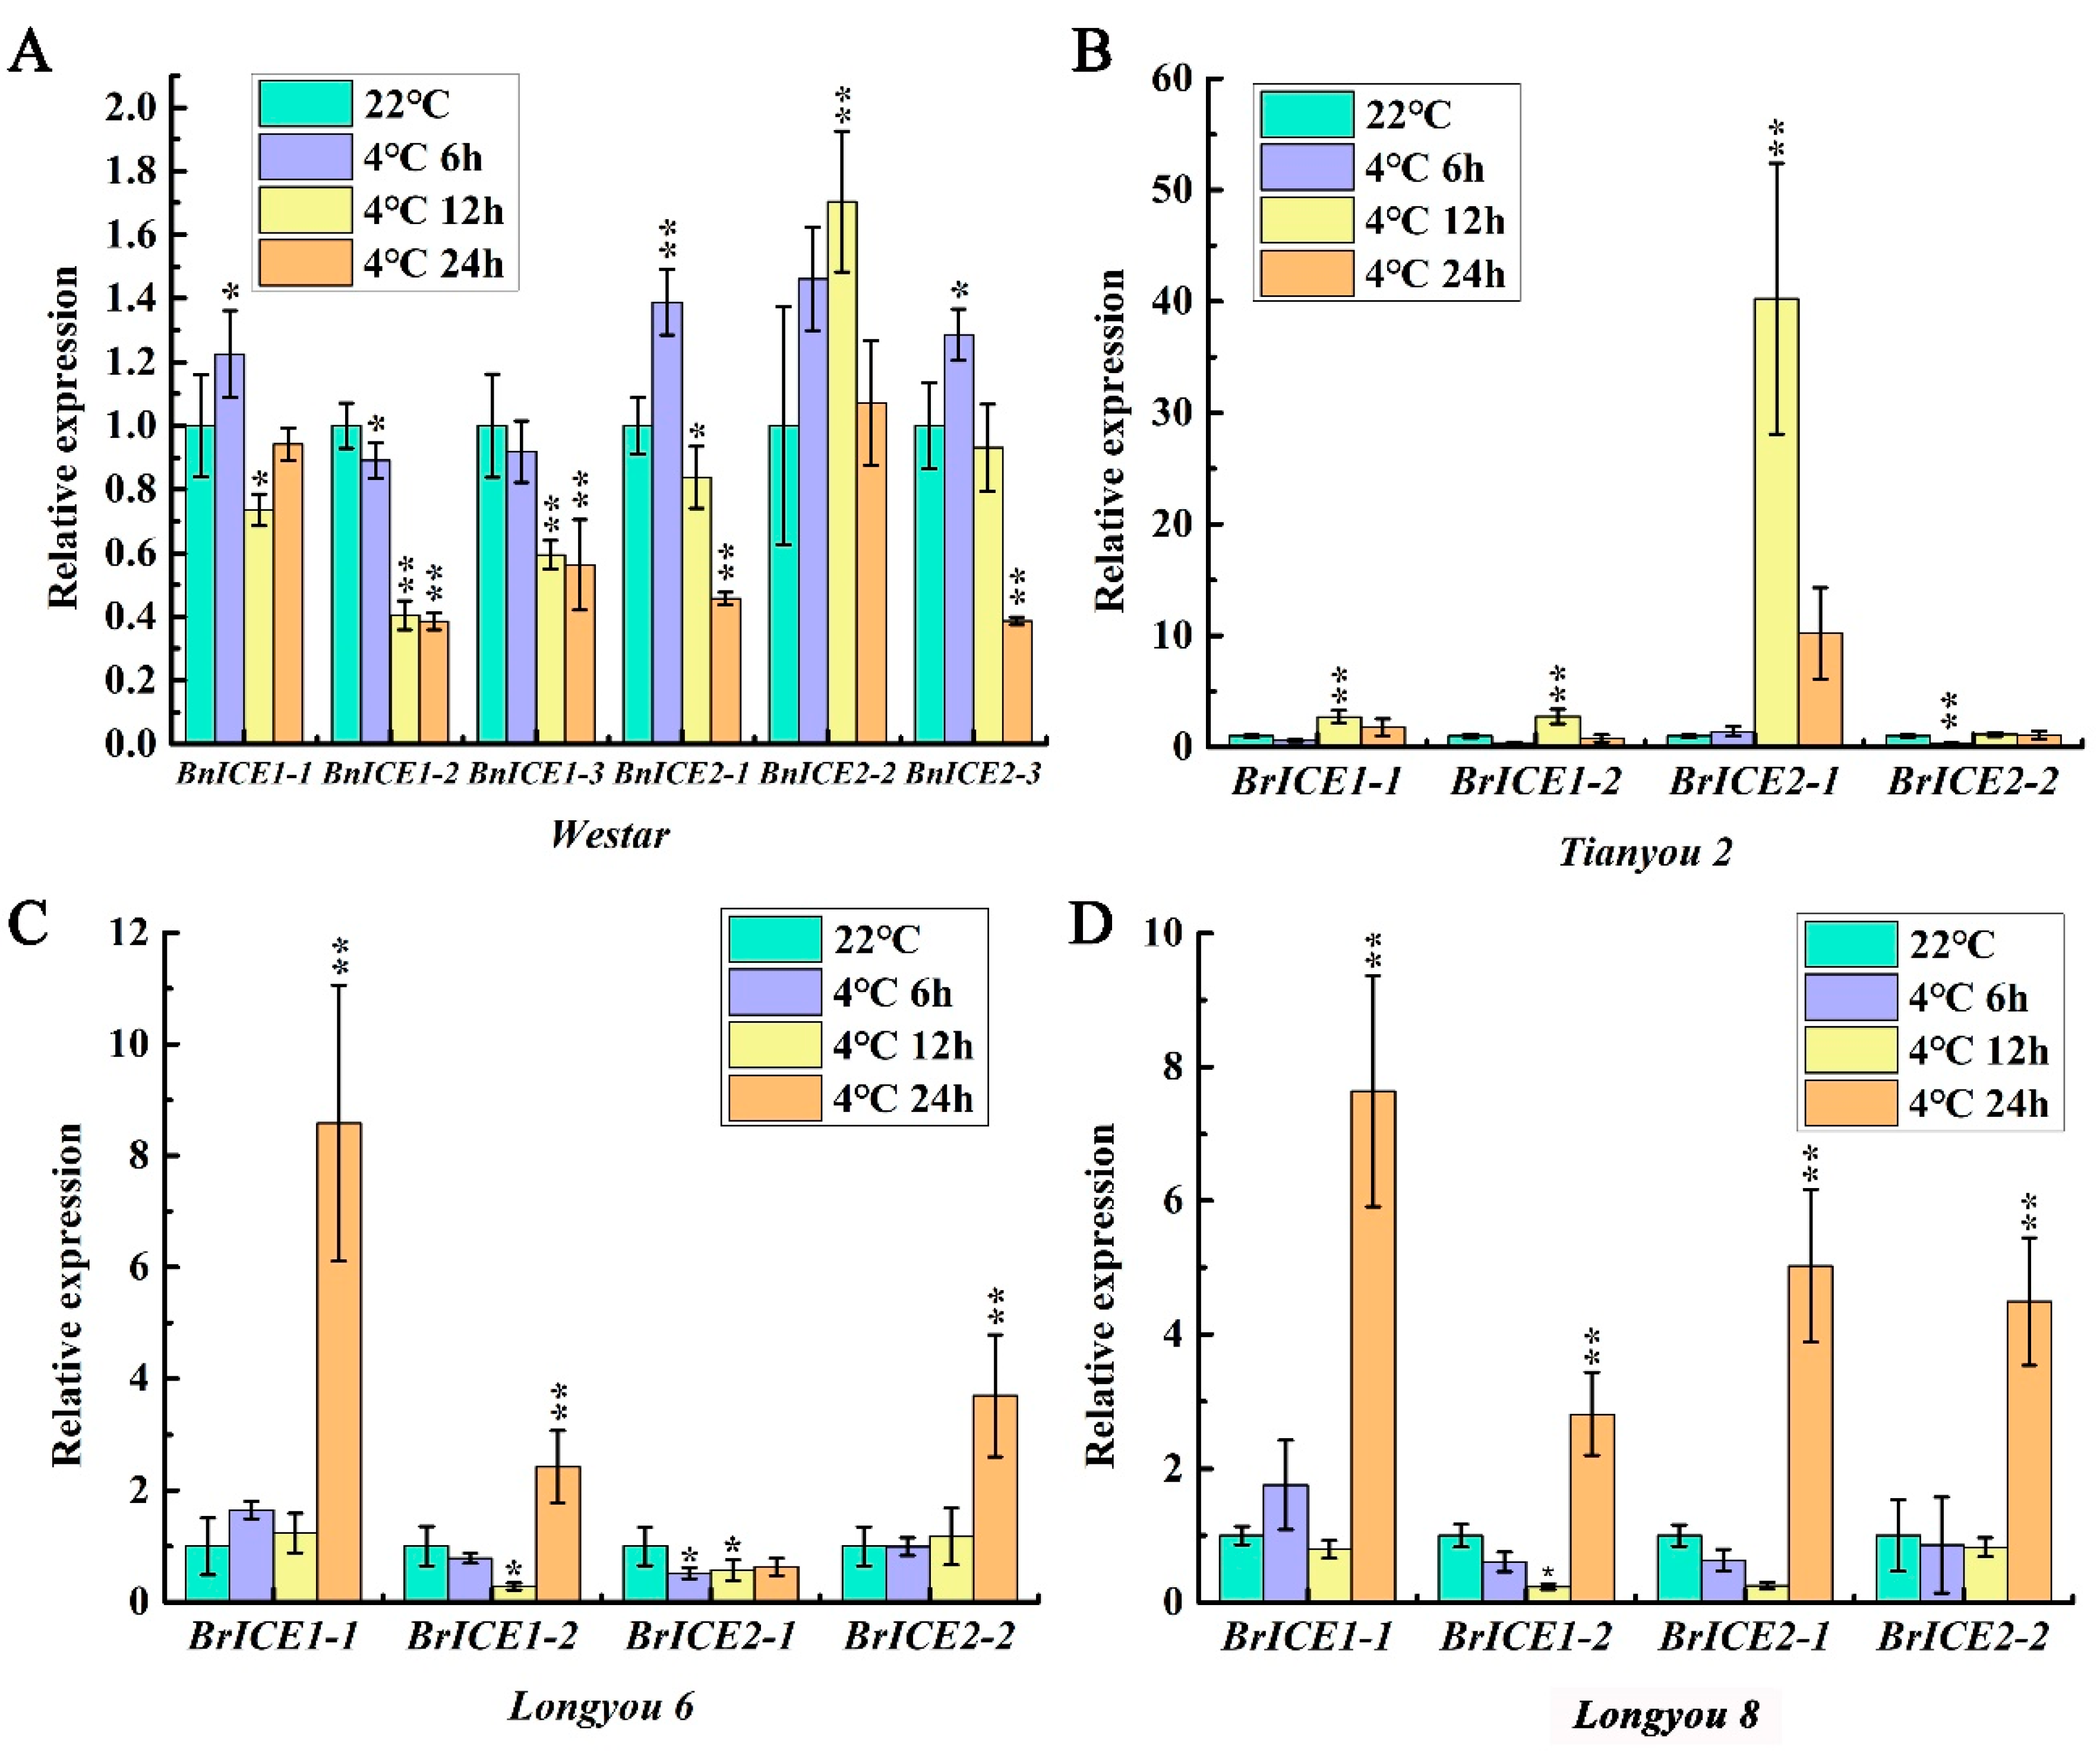
2.2. Low Temperature Induce Diverse Expression Patterns of ICE1 Homologous Genes in Brassica Species
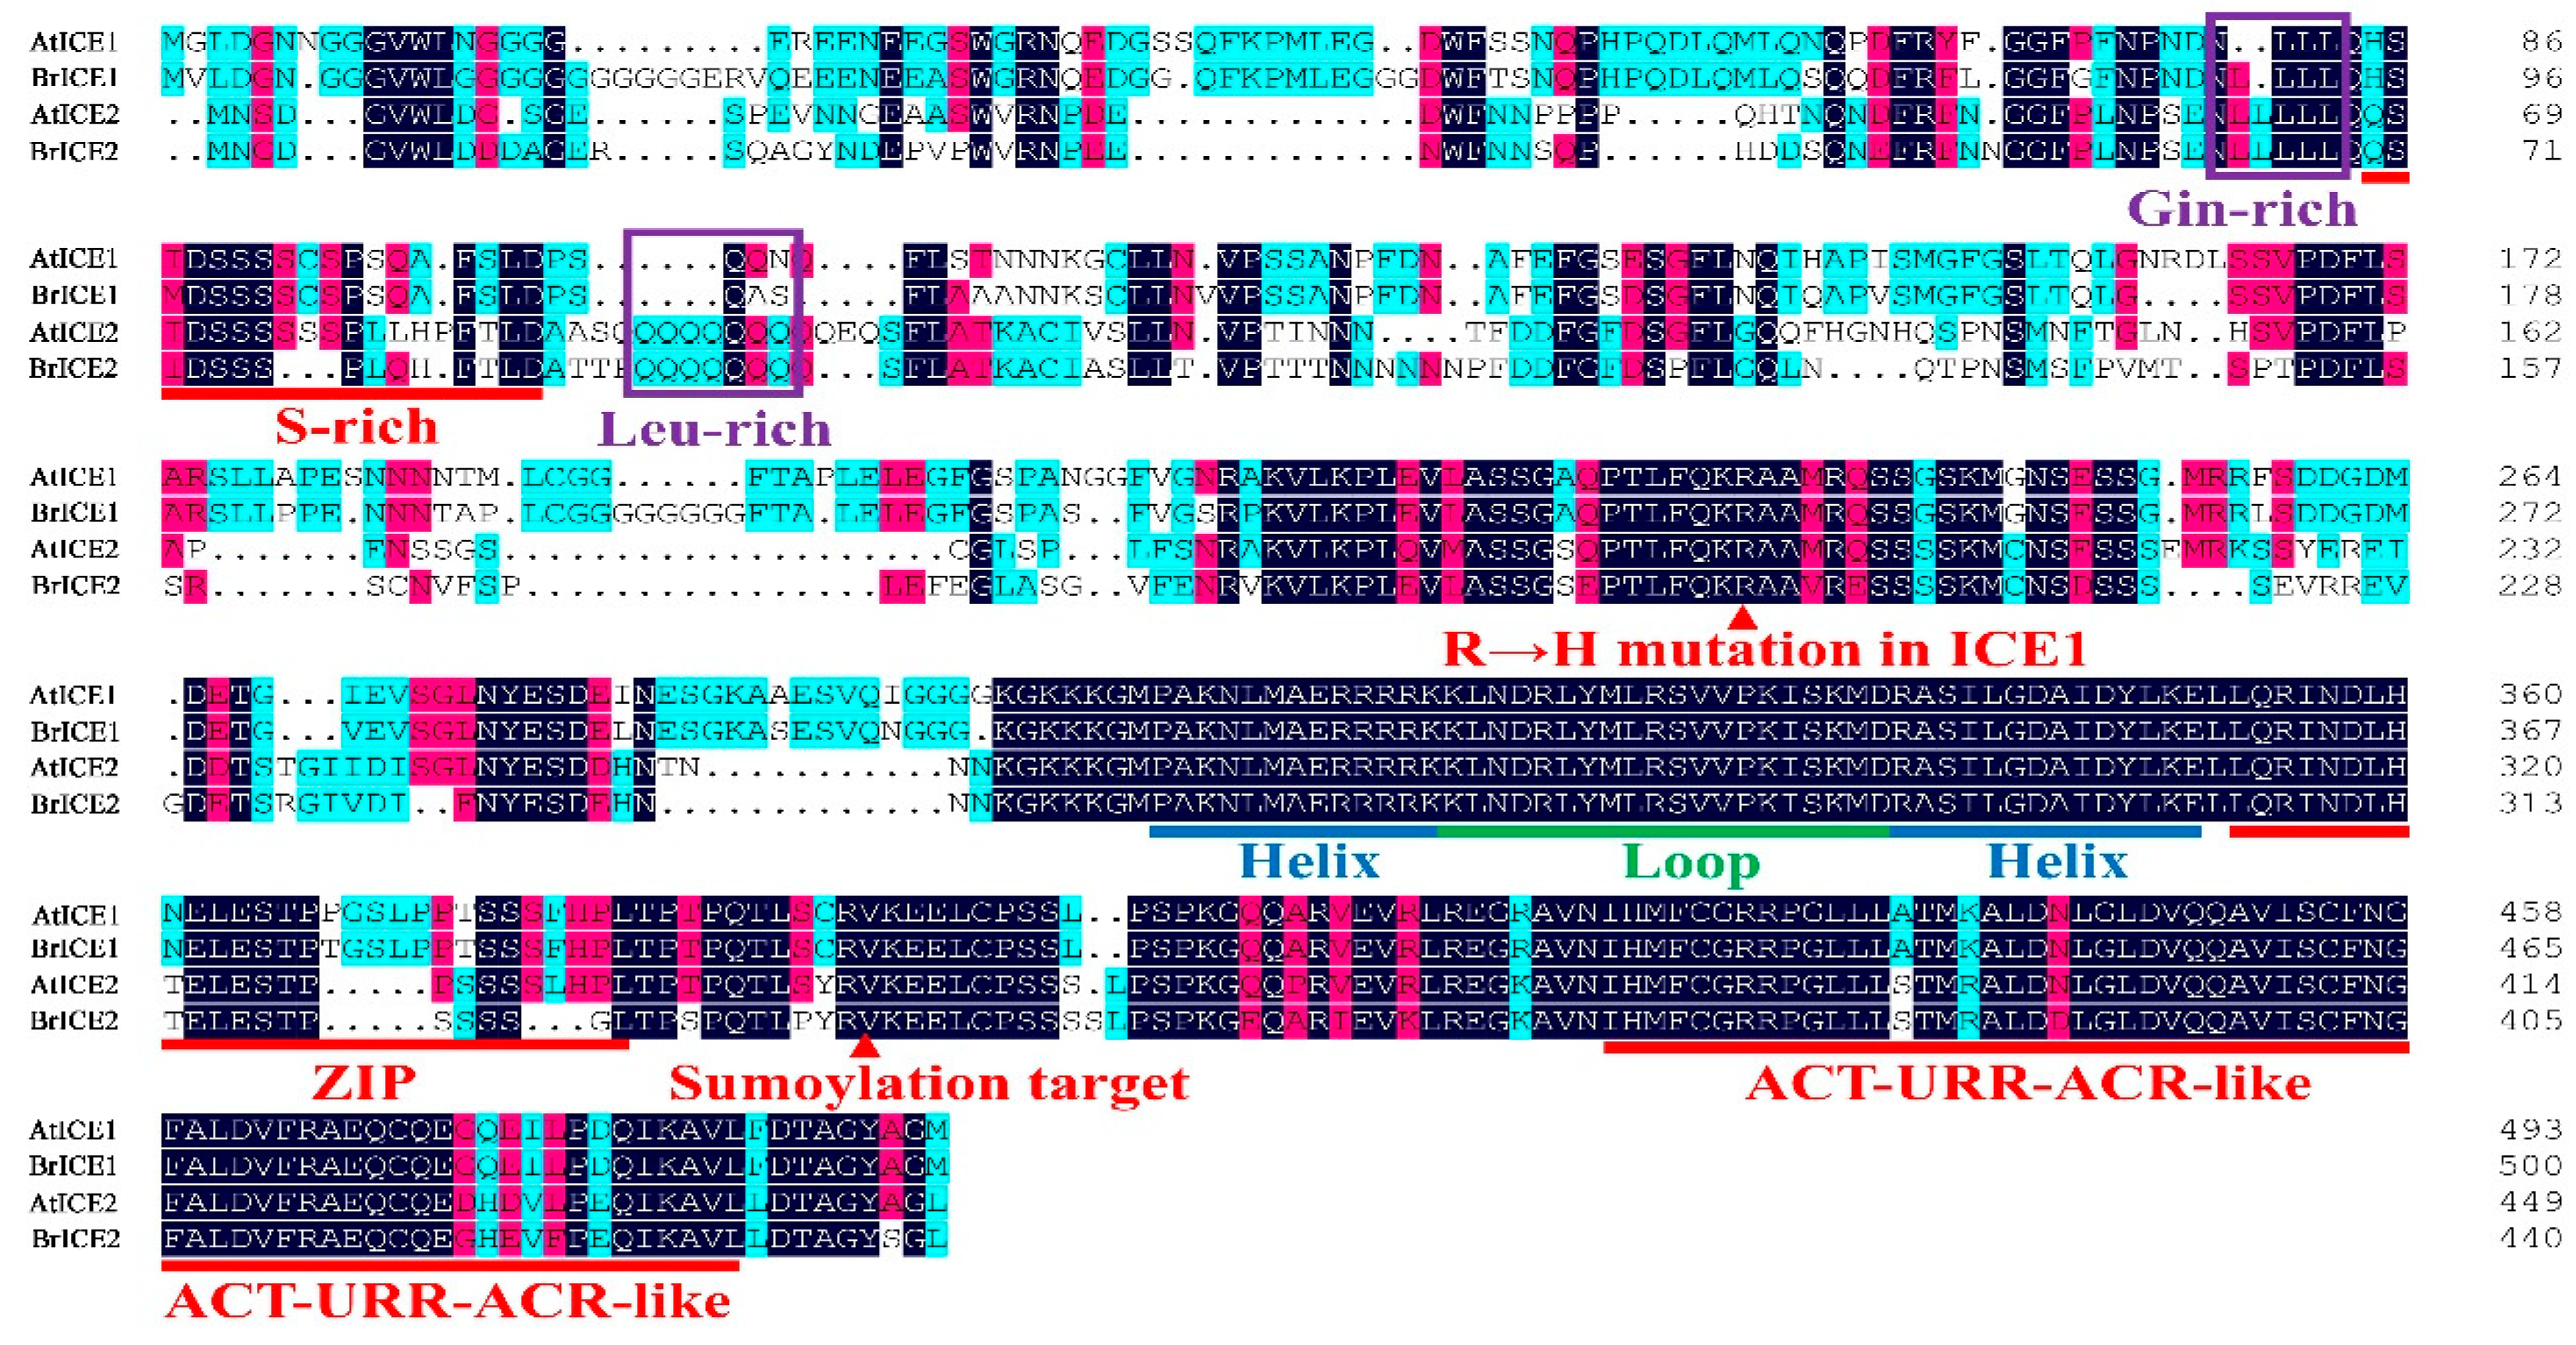
2.3. Cloning and Protein Structural Domain Analysis of BrICE1 Homologous Genes
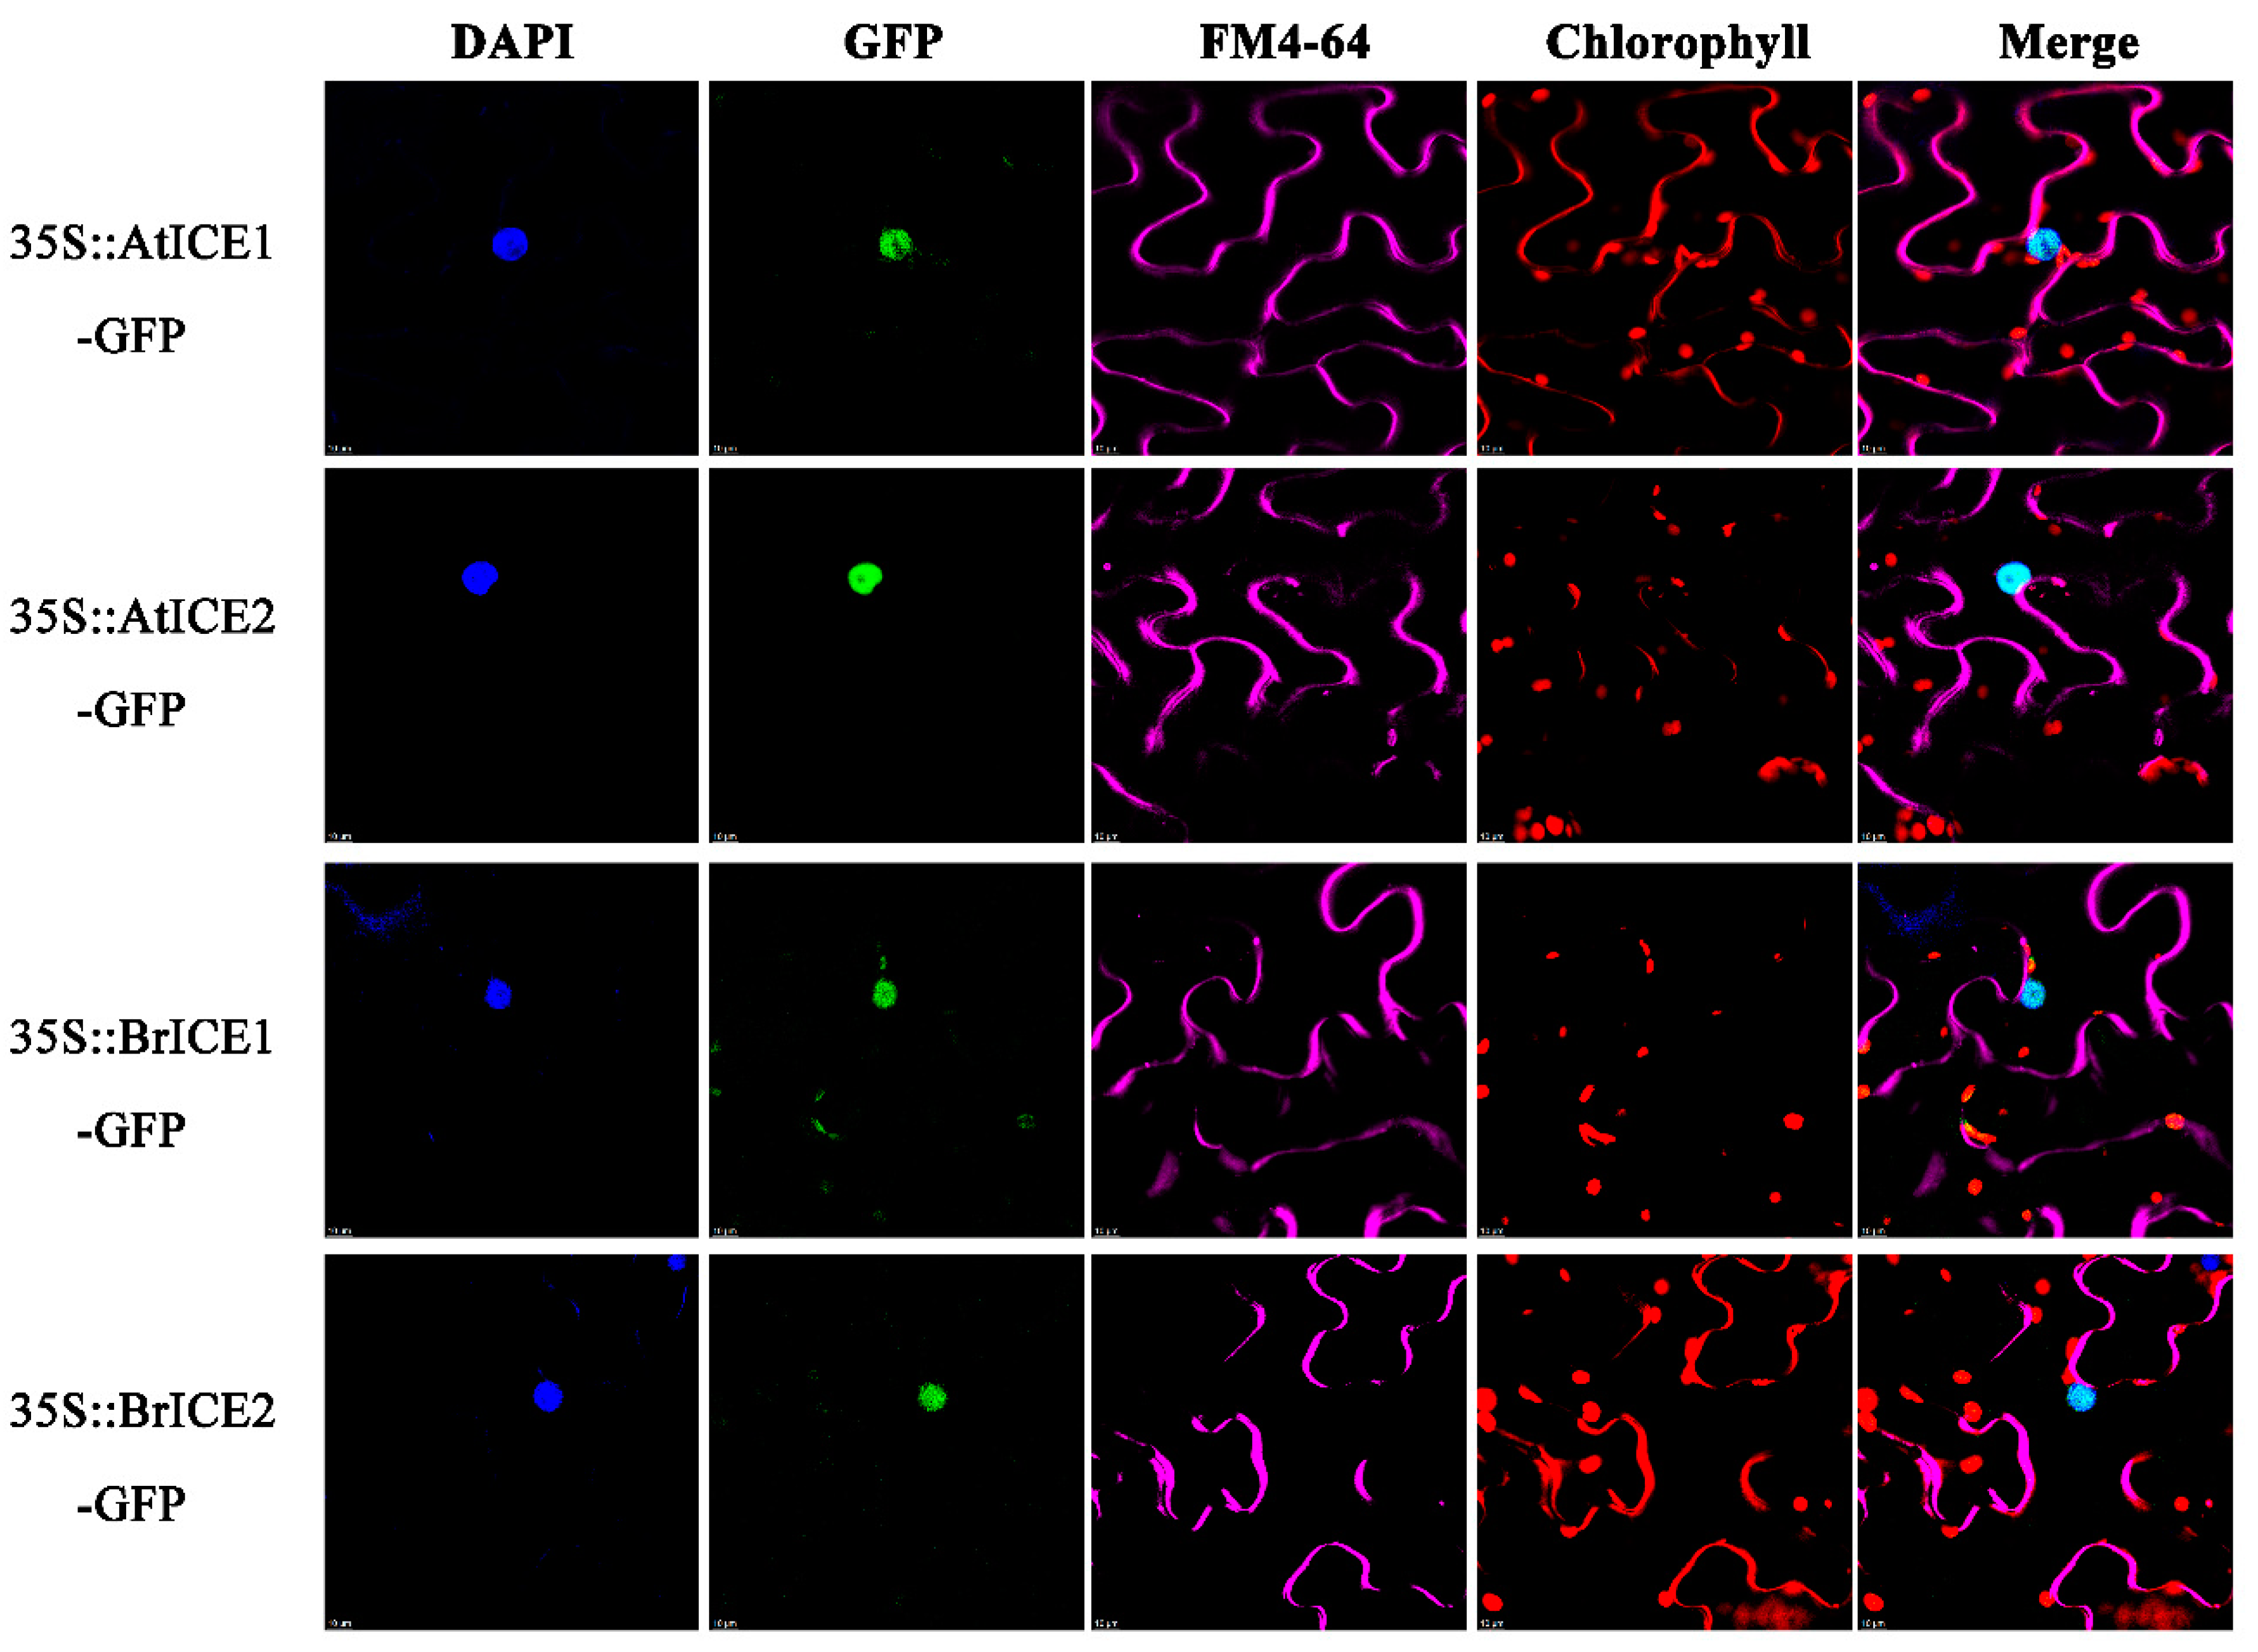
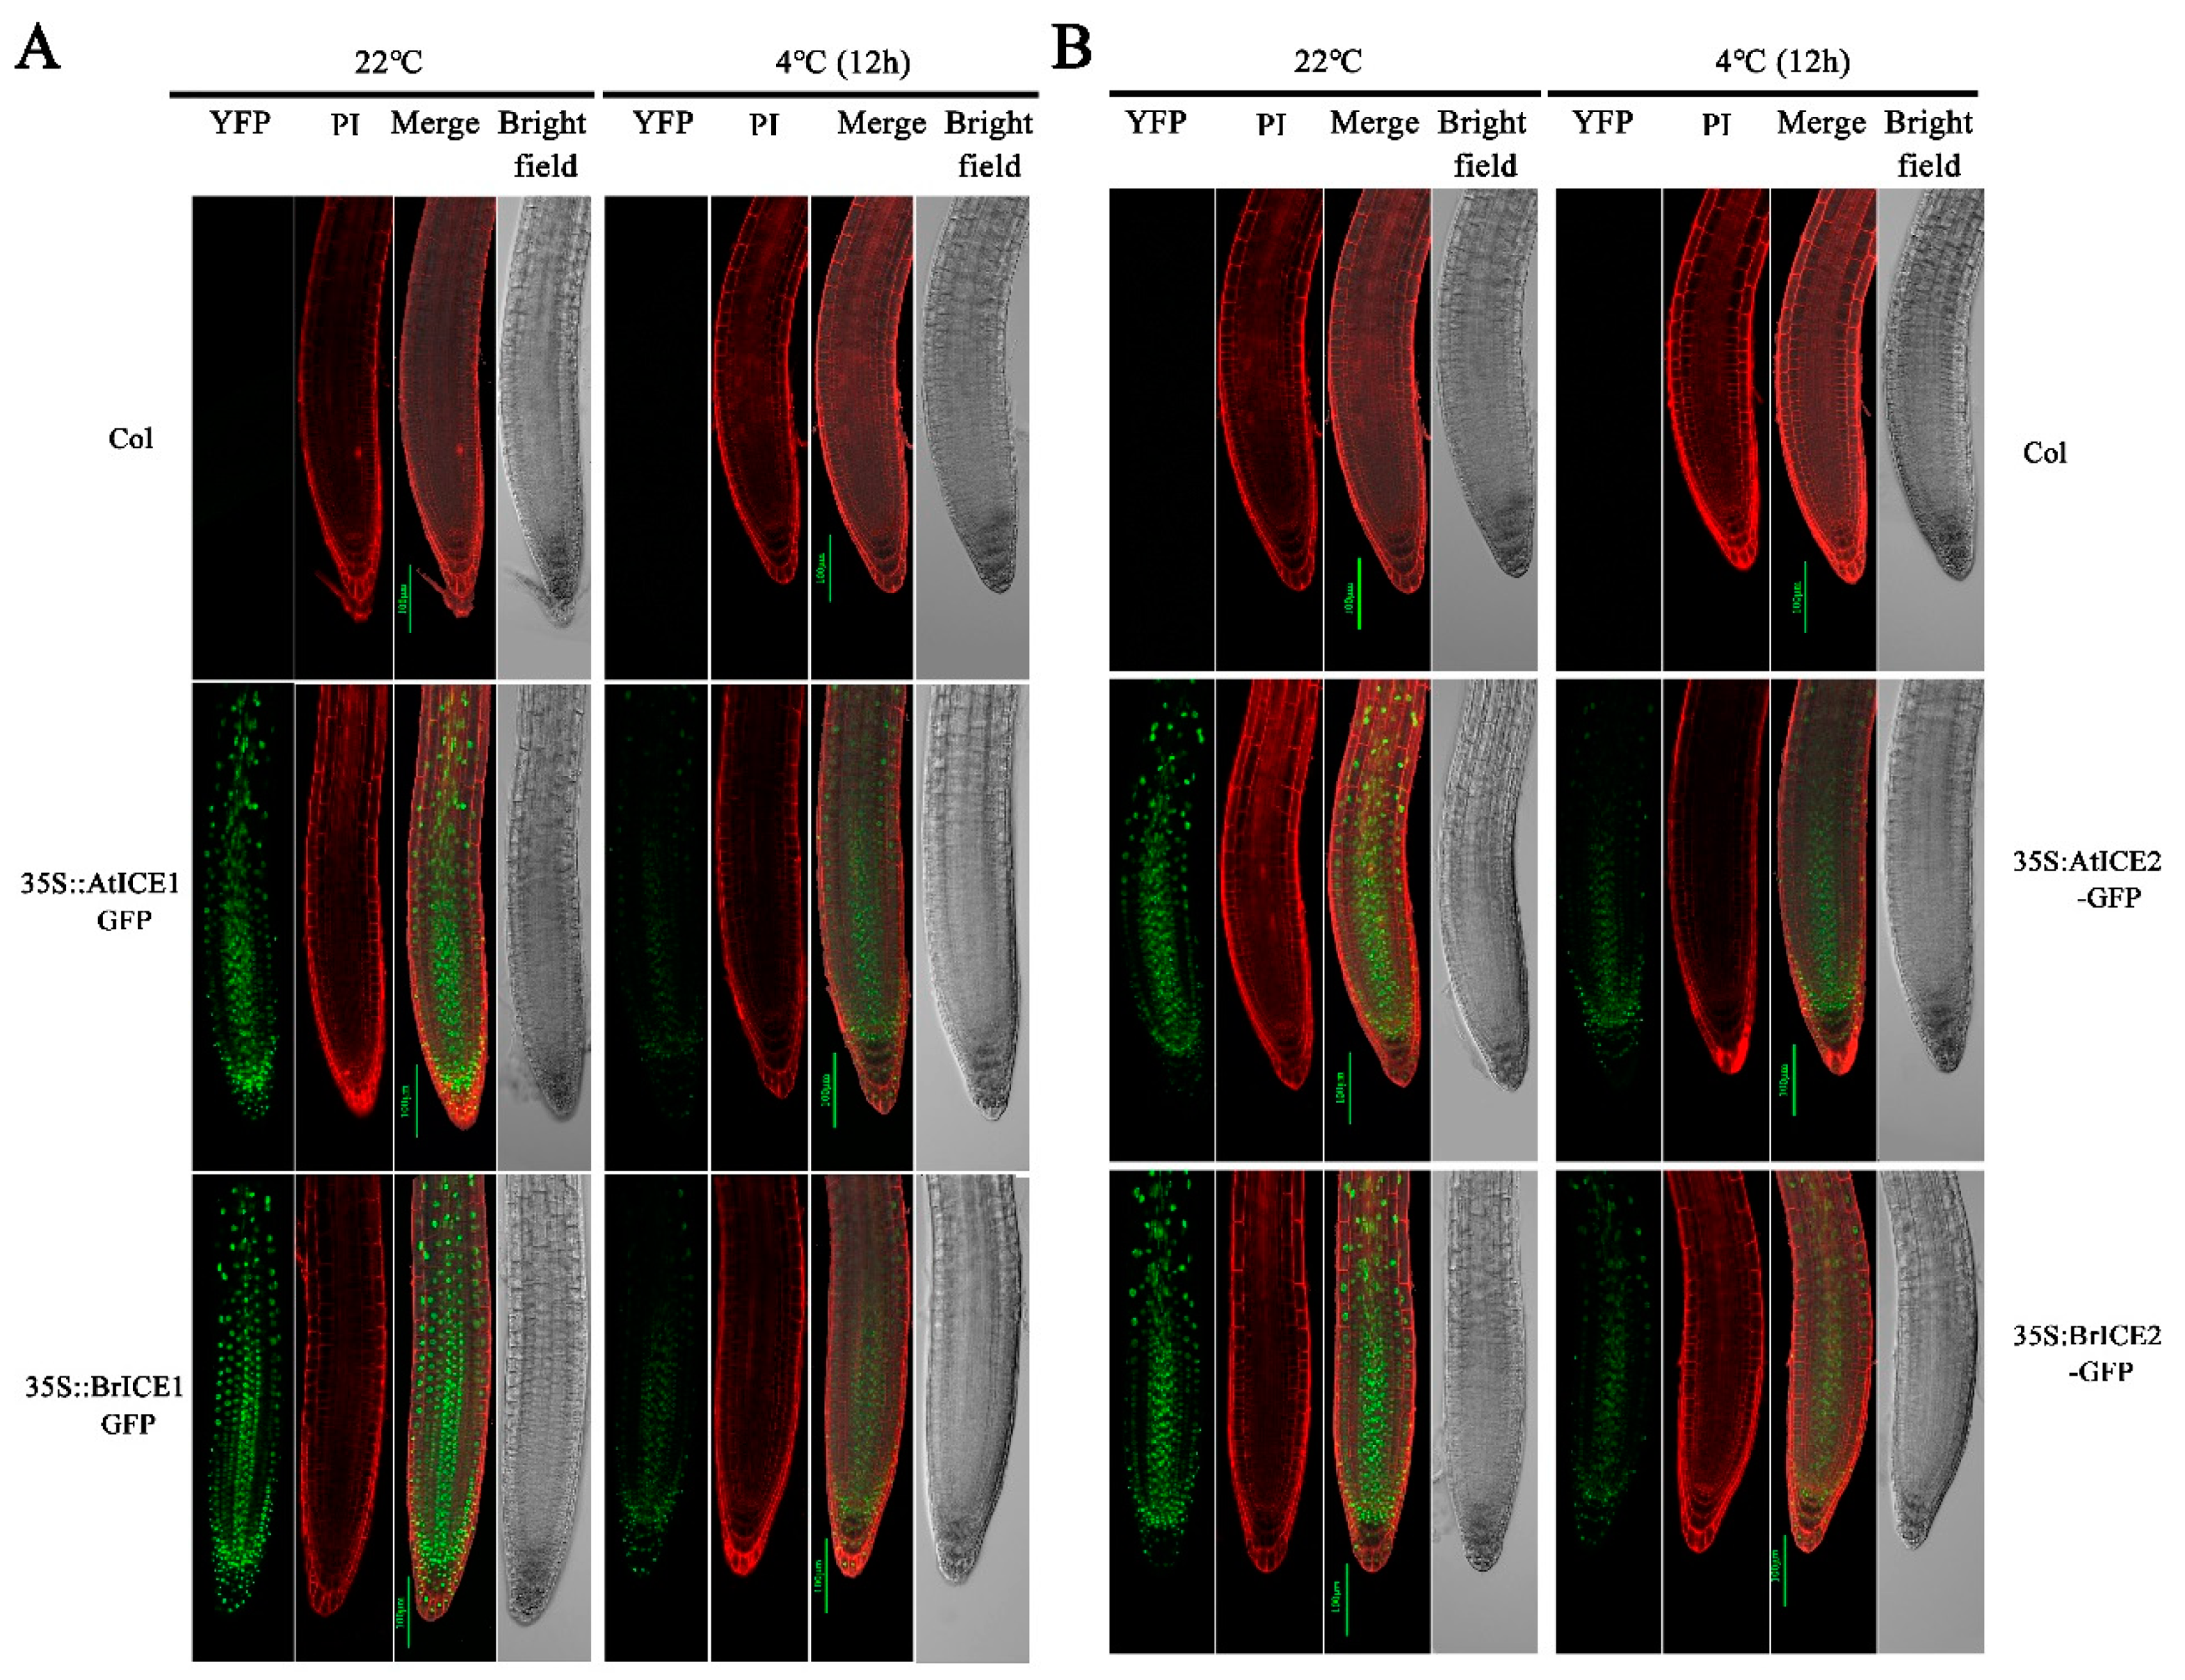
2.4. BrICE1 and BrICE2 Localize to the Nucleus, and Low Temperature Does not Affect Localization
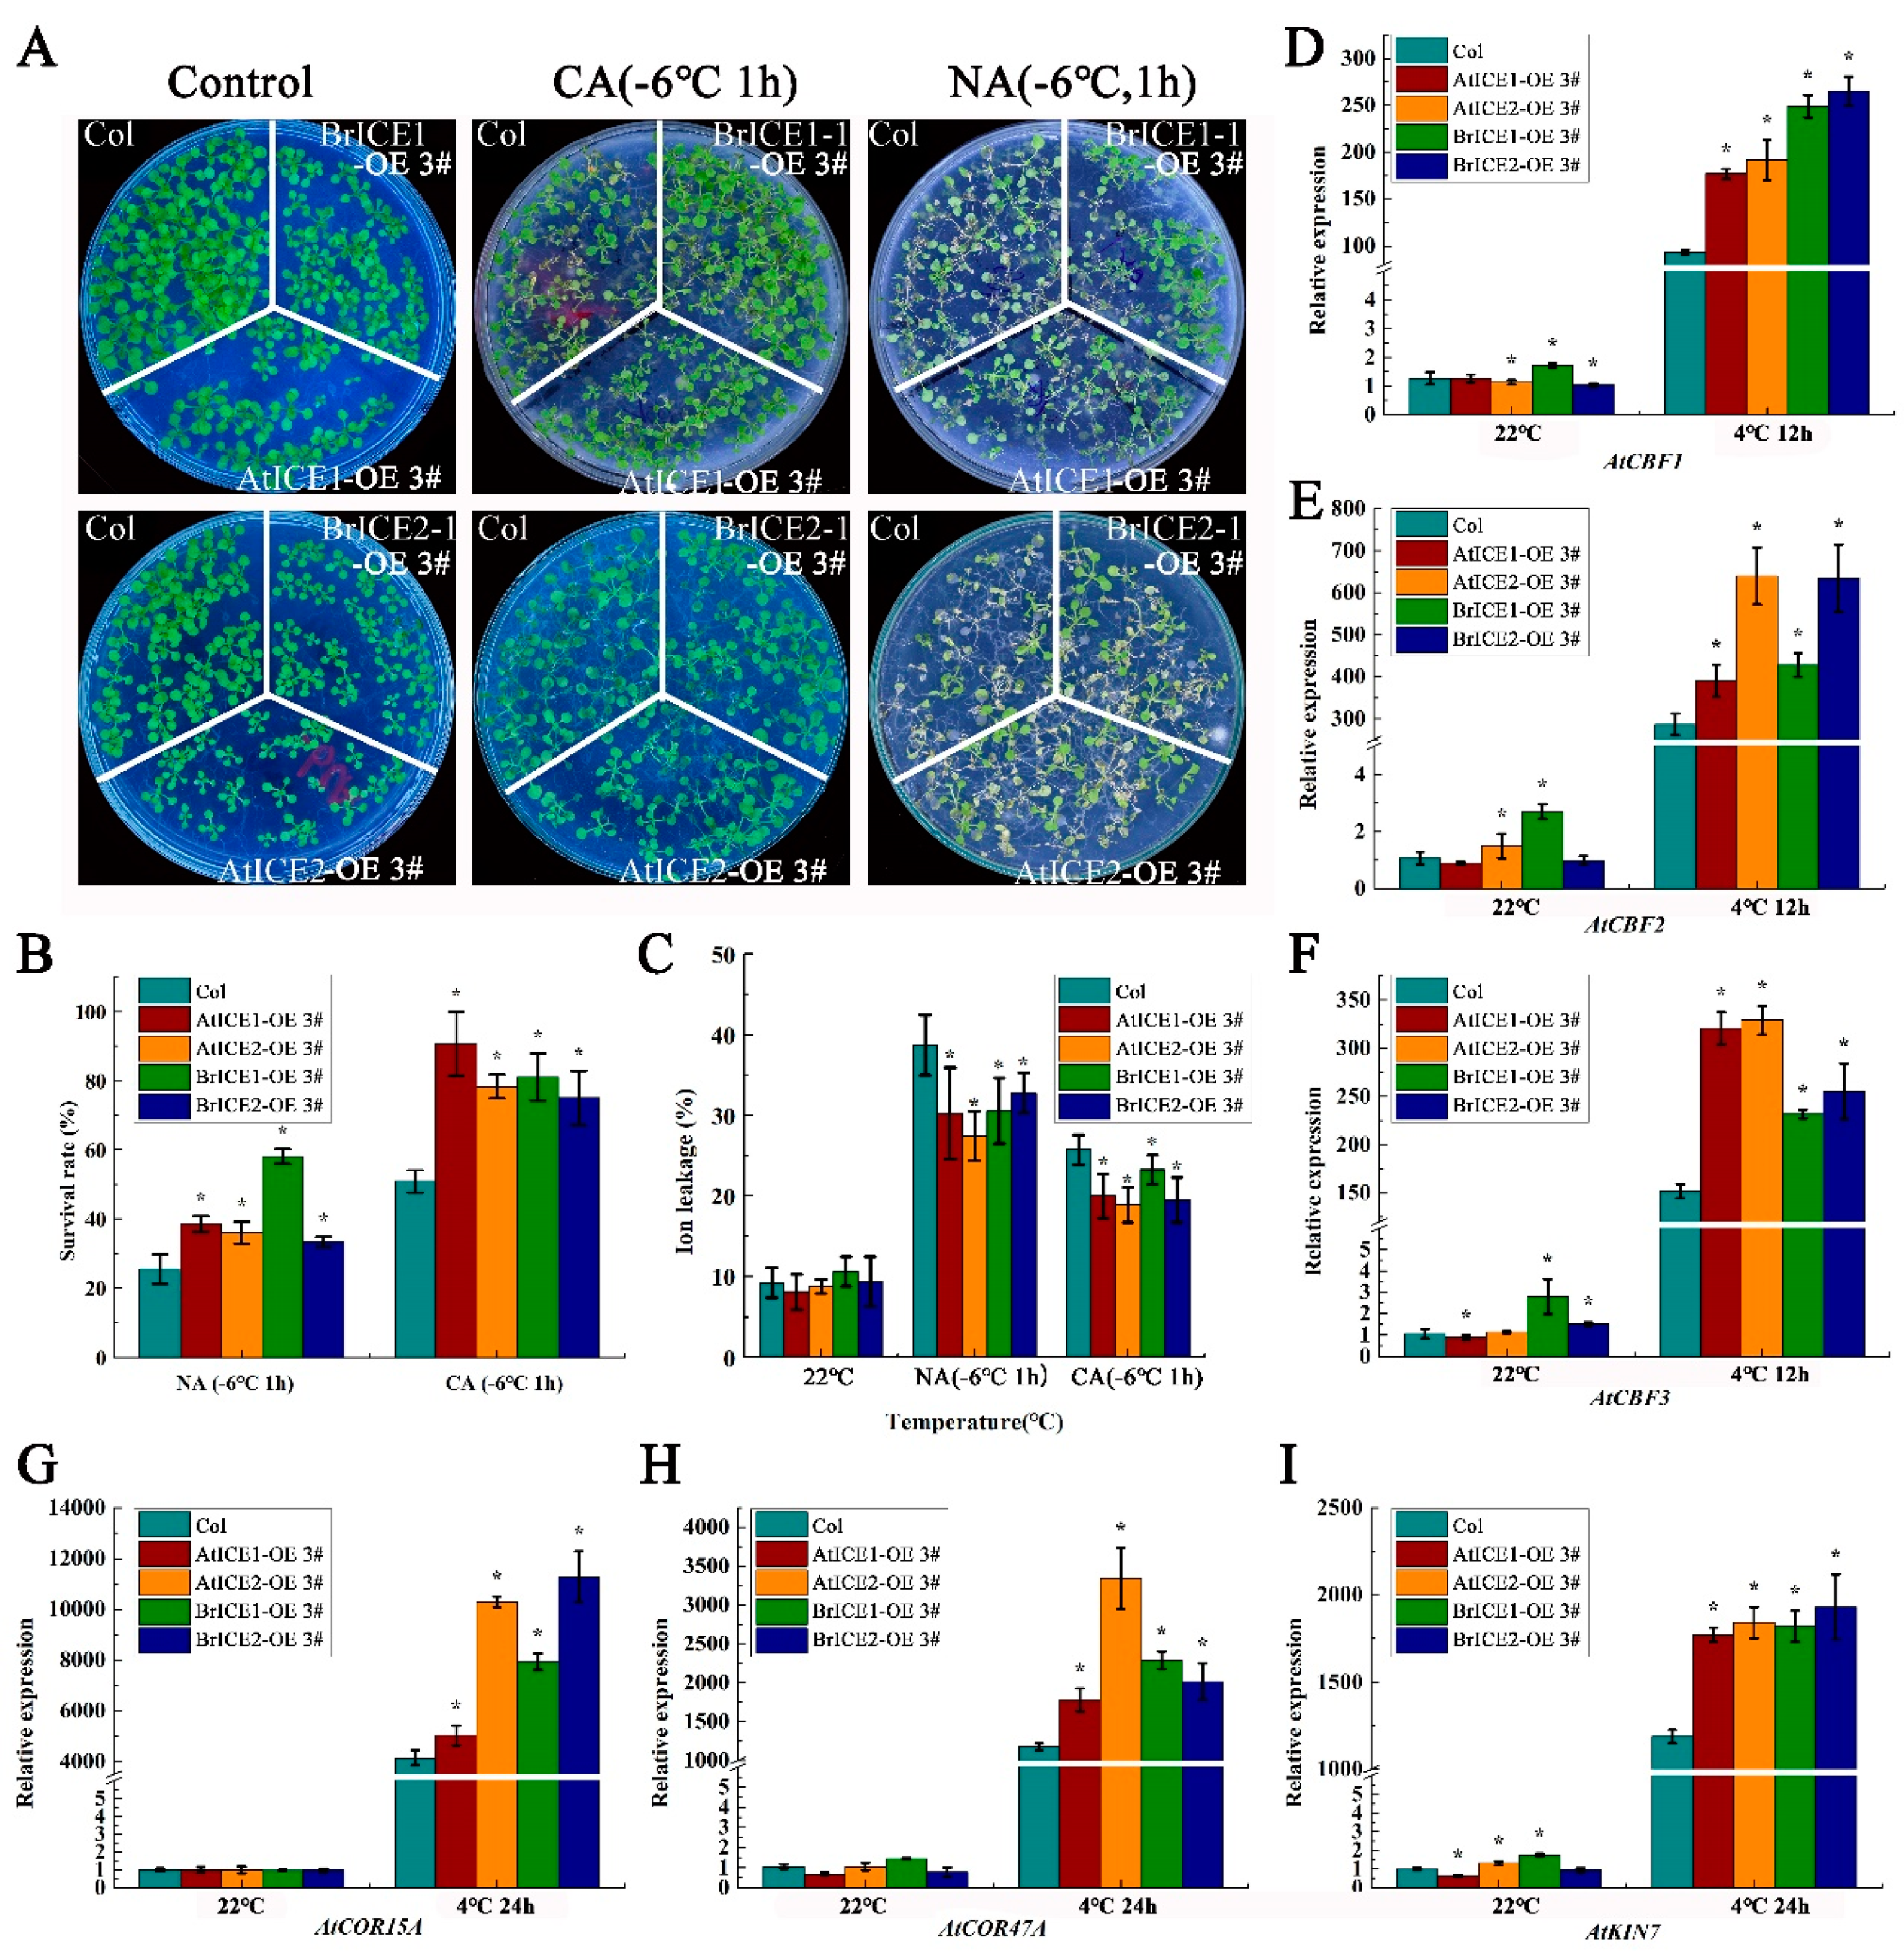
2.5. BrICE1 and BrICE2 Positively Regulate Cold Tolerance via the CBF-Dependent Pathway in Transgenic Arabidopsis
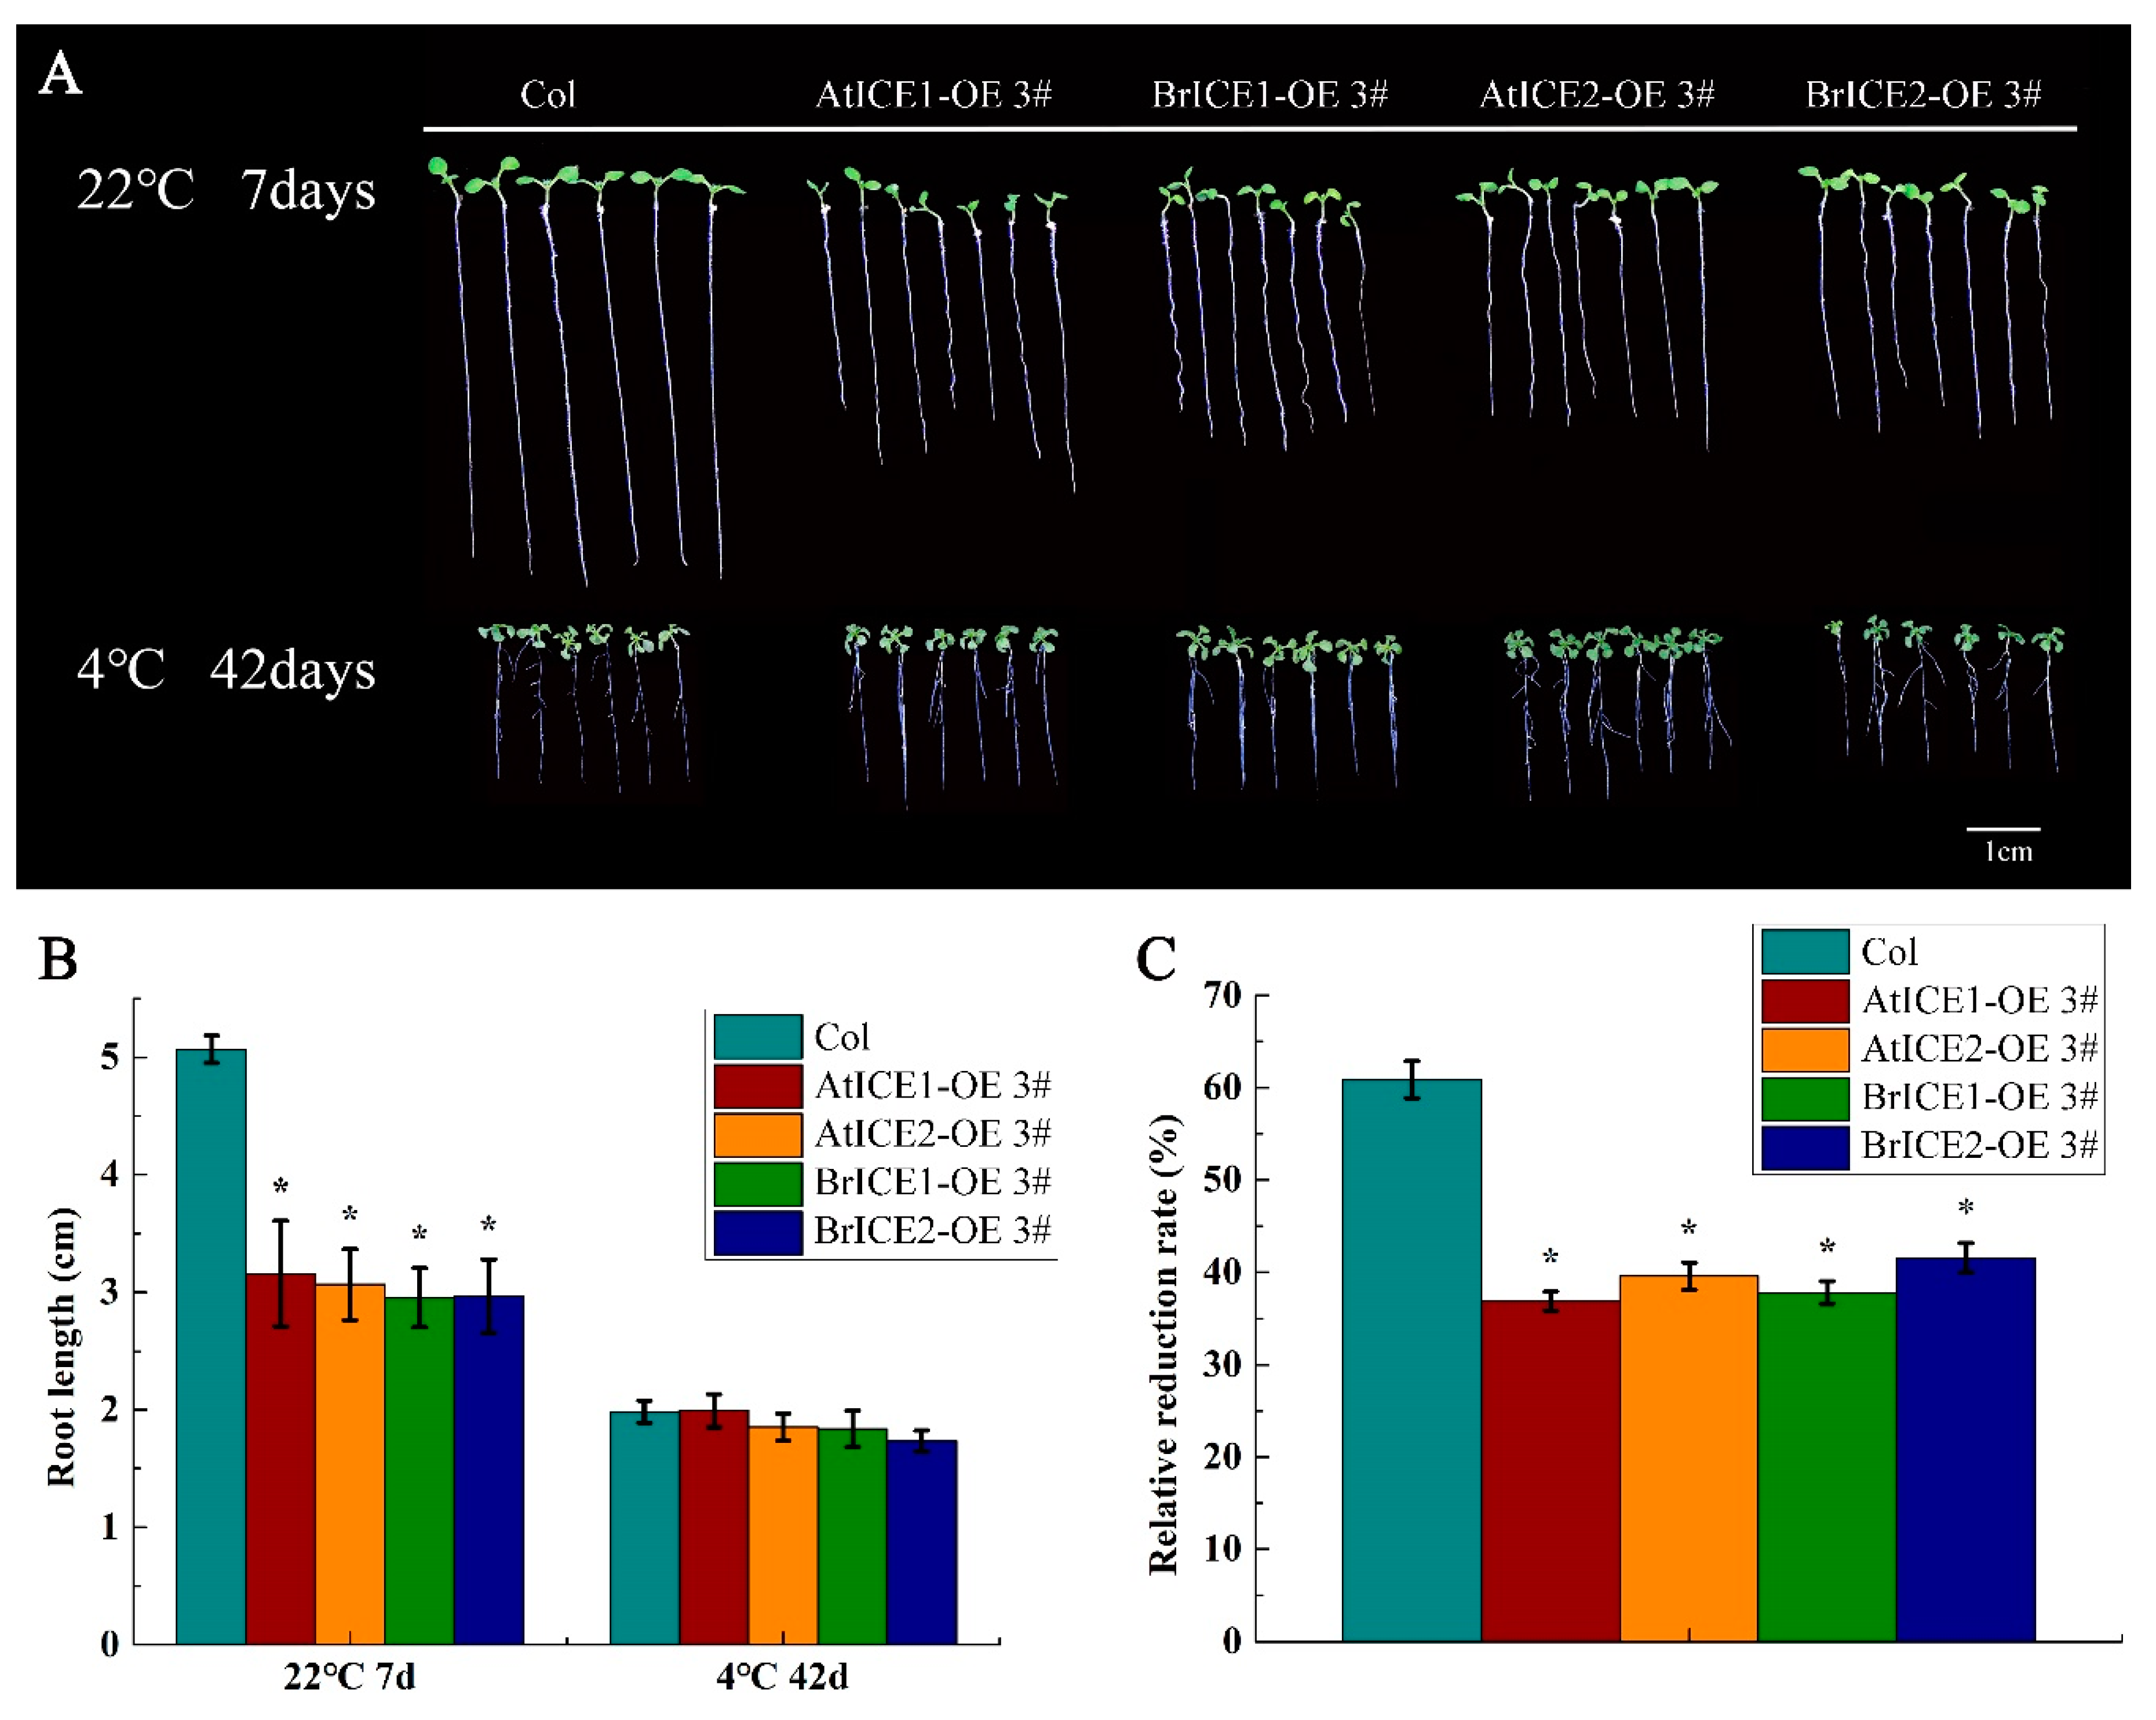
2.6. Overexpression of BrICE1 and BrICE2 Inhibits Root Growth in Arabidopsis
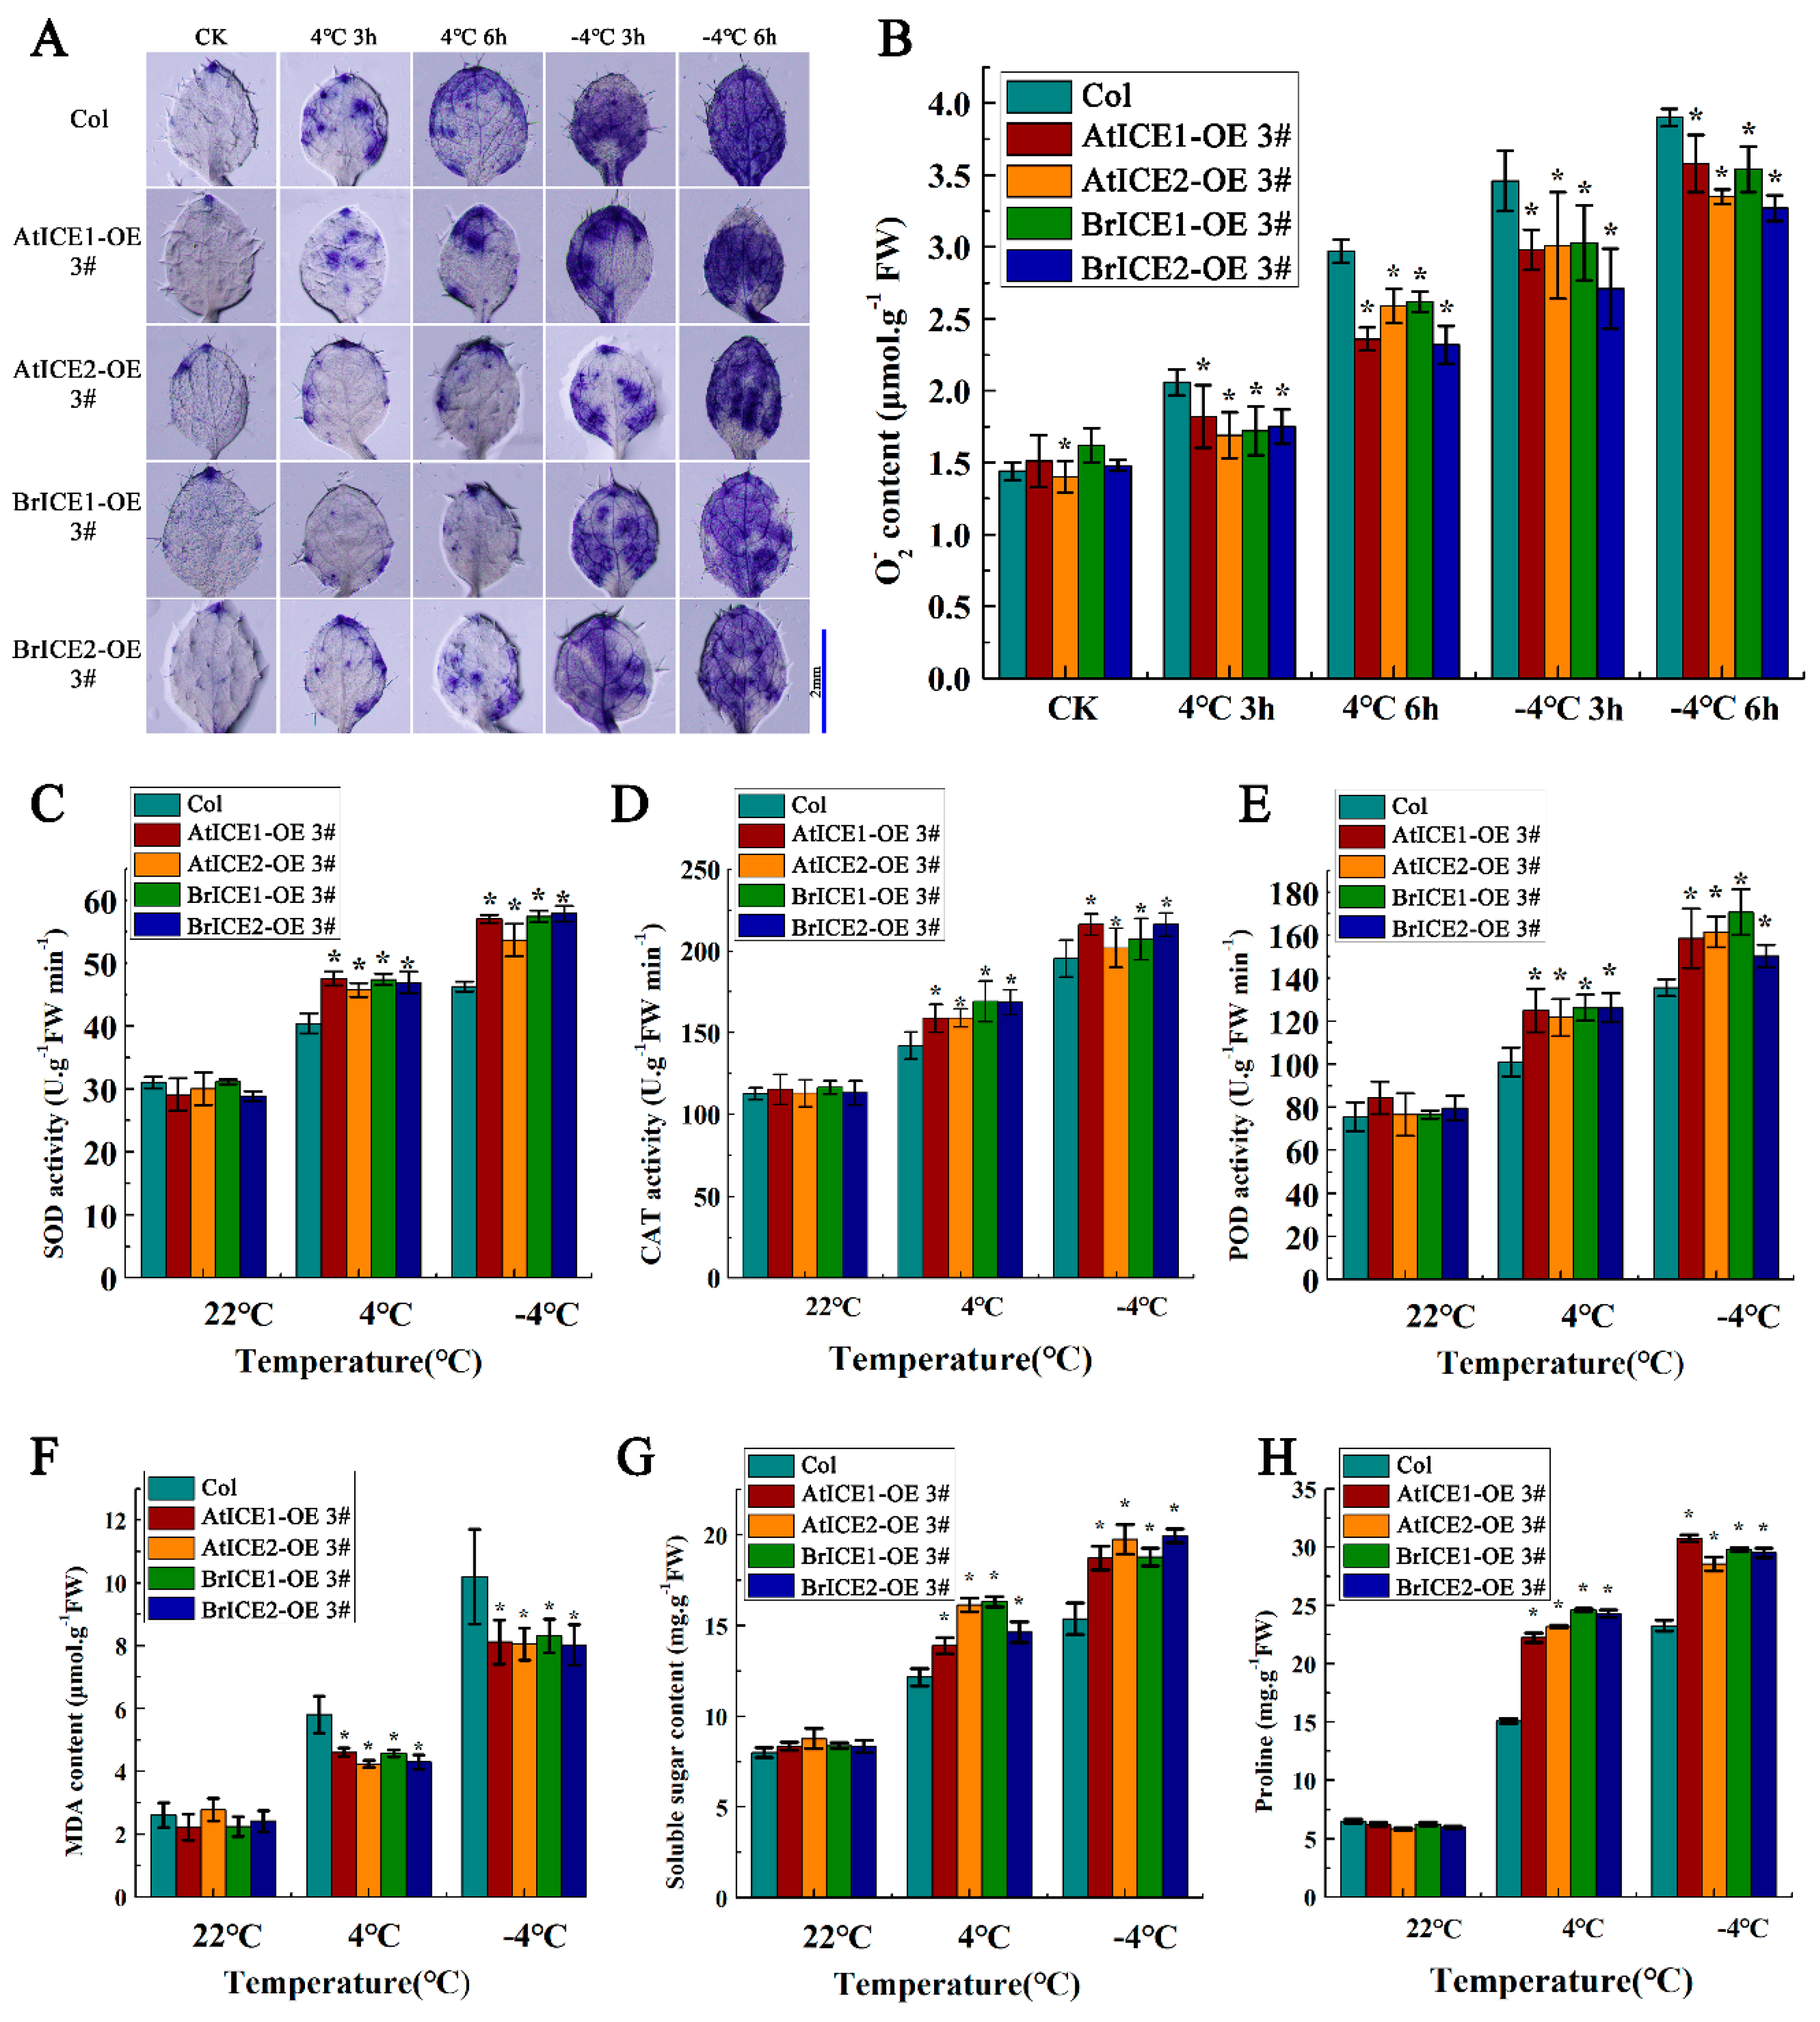
2.7. Overexpression of BrICE1 and BrICE2 Enhances ROS Scavenging by Elevating Enzymatic Antioxidants in Arabidopsis
2.8. BrICE1 and BrICE2 are Degraded via the 26S-Proteasome Pathway in Response to Cold Stress Pathway
3. Discussion
3.1. ICE1 Homologs Exhibit High Conservation Across Brassica Species
3.2. Overexpression of BrICE1 and BrICE2 in Arabidopsis Enhance Cold Tolerance Through CBFs, and ROS Scavenging Pathway
3.3. BrICE1 and BrICE2 Balance Development and Cold Defense
3.4. Post-Translational Modifications is Crucial for BrICE1 and BrICE2 Response to Cold Stress
4. Materials and Methods
4.1. Plant Materials and Growth Conditions
4.2. Identification and Phylogenetic Analysis of ICE1 Homologous Genes
4.3. Plant Freezing Tolerance and Physiological Assays
4.4. RNA Preparation and qRT–PCR Assays
4.5. Gene Cloning and Plasmid Construction
4.6. GFP Fluorescence Assay
4.7. Root Growth Inhibition Assays
4.8. Histochemical Staining and O2-· Detection of ROS
4.9. Yeast Two-Hybrid Assays
4.10. Protein Extraction and Immunoblotting Assays
4.11. Statistical Analysis
5. Conclusions
Supplementary Materials
Author Contributions
Funding
Data Availability Statement
Acknowledgments
Conflicts of Interest
References
- Guo, X.; Liu, D.; Chong, K. Cold Signaling in plants: insights into mechanisms and regulation. J. Integr. Plant Biol. 2018, 60, 745–756. [Google Scholar] [CrossRef] [PubMed]
- Thomashow, M.F. Plant cold acclimation: freezing tolerance genes and regulatory mechanisms. Annu. Rev. Plant. Physiol. Plant. Mol. Biol. 1999, 50, 571–599. [Google Scholar] [CrossRef] [PubMed]
- Knight, M.R.; Knight, H. Low-temperature perception leading to gene expression and cold tolerance in higher plants. New Phytol. 2012, 195, 737–751. [Google Scholar] [CrossRef] [PubMed]
- Ding, Y.; Shi, Y.; Yang, S. Advances and challenges in uncovering cold tolerance regulatory mechanisms in plants. New Phytol. 2019, 222, 1690–1704. [Google Scholar] [CrossRef]
- Guy, C.L.; Niemi, K.J.; Brambl, R. Altered gene expression during cold acclimation of spinach. Proc. Natl. Acad. Sci. USA. 1985, 82, 3673–3677. [Google Scholar] [CrossRef]
- Chinnusamy, V.; Ohta, M.; Kanrar, S.; Lee, B.; Hong, X.; Agarwal, M.; Zhu, J.-K. ICE1: A regulator of cold-induced transcriptome and freezing tolerance in Arabidopsis. Genes Dev. 2003, 17, 1043–1054. [Google Scholar] [CrossRef]
- Tang, K.; Zhao, L.; Ren, Y.; Yang, S.; Zhu, J.; Zhao, C. The Transcription factor ICE1 functions in cold stress response by binding to the promoters of CBF and COR genes. J. Integr. Plant Biol. 2020, 62, 258–263. [Google Scholar] [CrossRef]
- Kidokoro, S.; Kim, J.-S.; Ishikawa, T.; Suzuki, T.; Shinozaki, K.; Yamaguchi-Shinozaki, K. DREB1A/CBF3 is repressed by transgene-induced DNA methylation in the Arabidopsis ice1-1 mutant. Plant Cell 2020, 32, 1035–1048. [Google Scholar] [CrossRef]
- Kurbidaeva, A.; Ezhova, T.; Novokreshchenova, M. Arabidopsis thaliana ICE 2 gene: phylogeny, structural evolution and functional diversification from ICE1. Plant Sci. 2014, 229, 10–22. [Google Scholar] [CrossRef]
- Fursova, O.V.; Pogorelko, G.V.; Tarasov, V.A. Identification of ICE2, a gene involved in cold acclimation which determines freezing tolerance in Arabidopsis thaliana. Gene 2009, 429, 98–103. [Google Scholar] [CrossRef]
- Kim, Y.S.; Lee, M.; Lee, J.-H.; Lee, H.-J.; Park, C.-M. The unified ICE–CBF pathway provides a transcriptional feedback control of freezing tolerance during cold acclimation in Arabidopsis. Plant Mol. Biol. 2015, 89, 187–201. [Google Scholar] [CrossRef] [PubMed]
- Ding, Y.; Li, H.; Zhang, X.; Xie, Q.; Gong, Z.; Yang, S. OST1 kinase modulates freezing tolerance by enhancing ICE1 stability in Arabidopsis. Dev. Cell 2015, 32, 278–289. [Google Scholar] [CrossRef] [PubMed]
- Dong, C.-H.; Agarwal, M.; Zhang, Y.; Xie, Q.; Zhu, J.-K. The negative regulator of plant cold responses, HOS1, is a RING E3 ligase that mediates the ubiquitination and degradation of ICE1. Proc. Natl. Acad. Sci. USA. 2006, 103, 8281–8286. [Google Scholar] [CrossRef] [PubMed]
- Miura, K.; Jin, J.B.; Lee, J.; Yoo, C.Y.; Stirm, V.; Miura, T.; Ashworth, E.N.; Bressan, R.A.; Yun, D.-J.; Hasegawa, P.M. SIZ1-mediated sumoylation of ICE1 controls CBF3/DREB1A expression and freezing tolerance in Arabidopsis. Plant Cell 2007, 19, 1403–1414. [Google Scholar] [CrossRef] [PubMed]
- Kanaoka, M.M.; Pillitteri, L.J.; Fujii, H.; Yoshida, Y.; Bogenschutz, N.L.; Takabayashi, J.; Zhu, J.-K.; Torii, K.U. SCREAM/ICE1 and SCREAM2 specify three cell-state transitional steps leading to Arabidopsis stomatal differentiation. Plant Cell 2008, 20, 1775–1785. [Google Scholar] [CrossRef]
- Thomashow, M.F.; Torii, K.U. SCREAMing twist on the role of ICE1 in freezing tolerance. Plant Cell 2020, 32, 816–819. [Google Scholar] [CrossRef]
- Lee, J.; Jung, J.; Park, C. Inducer of CBF expression 1 integrates cold signals into flowering locus C-mediated flowering pathways in Arabidopsis. Plant J. 2015, 84, 29–40. [Google Scholar] [CrossRef]
- MacGregor, D.R.; Zhang, N.; Iwasaki, M.; Chen, M.; Dave, A.; Lopez-Molina, L.; Penfield, S. ICE 1 and ZOU determine the depth of primary seed dormancy in Arabidopsis independently of their role in endosperm development. Plant J. 2019, 98, 277–290. [Google Scholar] [CrossRef]
- Hu, Y.; Han, X.; Yang, M.; Zhang, M.; Pan, J.; Yu, D. The transcription factor inducer of CBF expression 1 interacts with abscisic acid insensitive 5 and DELLA proteins to fine-tune abscisic acid signaling during seed germination in Arabidopsis. Plant Cell 2019, 31, 1520–1538. [Google Scholar] [CrossRef]
- Badawi, M.; Reddy, Y.V.; Agharbaoui, Z.; Tominaga, Y.; Danyluk, J.; Sarhan, F.; Houde, M. Structure and functional analysis of wheat ICE (Inducer of CBF expression) Genes 2008, 49, 1237–1249. [CrossRef]
- Deng, C.; Ye, H.; Fan, M.; Pu, T.; Yan, J. The Rice Transcription factors OsICE confer enhanced cold tolerance in transgenic Arabidopsis. Plant Signal. Behav. 2017, 12, e1316442. [Google Scholar] [CrossRef]
- Wu, C.-L.; Lin, L.-F.; Hsu, H.-C.; Huang, L.-F.; Hsiao, C.-D.; Chou, M.-L. Saussurea involucrata (Snow Lotus) ICE1 and ICE2 orthologues involved in regulating cold stress tolerance in transgenic Arabidopsis. Int. J. Mech. Sci. 2021, 22, 10850. [Google Scholar] [CrossRef] [PubMed]
- Lu, X.; Yang, L.; Yu, M.; Lai, J.; Wang, C.; McNeil, D.; Zhou, M.; Yang, C. A novel Zea Mays Ssp. Mexicana L. MYC-Type ICE-like transcription factor gene ZmmICE1, enhances freezing tolerance in transgenic Arabidopsis thaliana. Plant Physiol. Biochem 2017, 113, 78–88. [Google Scholar] [CrossRef] [PubMed]
- Feng, H.-L.; Ma, N.-N.; Meng, X.; Zhang, S.; Wang, J.-R.; Chai, S.; Meng, Q.-W. A novel tomato MYC-type ICE1-like transcription factor, SlICE1a, confers cold, osmotic and salt tolerance in transgenic tobacco. Plant Physiol. Biochem. 2013, 73, 309–320. [Google Scholar] [CrossRef] [PubMed]
- Zhang, Z.; Li, J.; Li, F.; Liu, H.; Yang, W.; Chong, K.; Xu, Y. OsMAPK3 phosphorylates OsbHLH002/OsICE1 and inhibits its ubiquitination to activate OsTPP1 and enhances rice chilling tolerance. Dev 2017, 43, 731–743.e5. [Google Scholar] [CrossRef] [PubMed]
- Li, H.; Ding, Y.; Shi, Y.; Zhang, X.; Zhang, S.; Gong, Z.; Yang, S. MPK3- and MPK6-mediated ICE1 phosphorylation negatively regulates ICE1 stability and freezing tolerance in Arabidopsis. Dev 2017, 43, 630–642.e4. [Google Scholar] [CrossRef]
- Zhao, C.; Wang, P.; Si, T.; Hsu, C.-C.; Wang, L.; Zayed, O.; Yu, Z.; Zhu, Y.; Dong, J.; Tao, W.A.; et al. MAP kinase cascades regulate the cold response by modulating ICE1 protein stability. Dev 2017, 43, 618–629.e5. [Google Scholar] [CrossRef]
- Wang, Y.-M.; Zhang, Y.-M.; Zhang, X.; Zhao, X.; Zhang, Y.; Wang, C.; Wang, Y.-C.; Wang, L.-Q. Poplar PsnICE1 enhances cold tolerance by binding to different cis-acting elements to improve reactive oxygen species-scavenging capability. Tree Physiol. 2021, 41, 2424–2437. [Google Scholar] [CrossRef]
- Ma, L.; Coulter, J.A.; Liu, L.; Zhao, Y.; Chang, Y.; Pu, Y.; Zeng, X.; Xu, Y.; Wu, J.; Fang, Y.; et al. Transcriptome analysis reveals key cold-stress-responsive genes in winter rapeseed (Brassica rapa L.). Int. J. Mech. Sci 2019, 20, 1071. [Google Scholar] [CrossRef]
- Pu, Y.; Liu, L.; Wu, J.; Zhao, Y.; Bai, J.; Ma, L.; Yue, J.; Jin, J.; Niu, Z.; Fang, Y.; et al. Transcriptome profile analysis of winter rapeseed (Brassica napus L.) in response to freezing stress, reveal potentially connected events to freezing stress. Int. J. Mech. Sci 2019, 20, 2771. [Google Scholar] [CrossRef]
- Wu, W.; Yang, H.; Xing, P.; Dong, Y.; Shen, J.; Wu, G.; Zheng, S.; Da, L.; He, J.; Wu, Y. Comparative transcriptome analysis revealed the freezing tolerance signaling events in winter rapeseed (Brassica rapa L.). Front. Genet 2022, 2022, 871825. [Google Scholar] [CrossRef]
- Wei, J.; Zheng, G.; Yu, X.; Liu, S.; Dong, X.; Cao, X.; Fang, X.; Li, H.; Jin, J.; Mi, W.; et al. Comparative transcriptomics and proteomics analyses of leaves reveals a freezing stress-responsive molecular network in winter rapeseed (Brassica rapa L.). Front. Plant Sci. 2021, 12, 664311. [Google Scholar] [CrossRef] [PubMed]
- Fang, Y.; Coulter, J.A.; Wu, J.; Liu, L.; Li, X.; Dong, Y.; Ma, L.; Pu, Y.; Sun, B.; Niu, Z.; et al. Identification of differentially expressed genes involved in amino acid and lipid accumulation of winter turnip rape (Brassica rapa L.) in response to cold stress. PLoS ONE 2021, 16, e0245494. [Google Scholar] [CrossRef] [PubMed]
- Zeng, X.; Xu, Y.; Jiang, J.; Zhang, F.; Ma, L.; Wu, D.; Wang, Y.; Sun, W. Identification of cold stress responsive microRNAs in two winter turnip rape (Brassica rapa L.) by high throughput sequencing. BMC Plant Biol 2018, 18, 52. [Google Scholar] [CrossRef] [PubMed]
- Xu, P.; Zhang, W.; Wang, X.; Zhu, Y.; Liang, W.; He, Y.; Yu, X. Multiomics analysis reveals a link between Brassica-specific miR1885 and rapeseed tolerance to low temperature. Plant Cell Environ. 2023, 46, 3405–3419. [Google Scholar] [CrossRef] [PubMed]
- Xu, Y.; Zeng, X.; Wu, J.; Zhang, F.; Li, C.; Jiang, J.; Wang, Y.; Sun, W. iTRAQ-based quantitative proteome revealed metabolic changes in winter turnip rape (Brassica rapa L.) under cold stress. Int. J. Mech. Sci 2018, 19, 3346. [Google Scholar] [CrossRef]
- Niu, Z.; Liu, L.; Pu, Y.; Ma, L.; Wu, J.; Hu, F.; Fang, Y.; Li, X.; Sun, W.; Wang, W.; et al. iTRAQ-based quantitative proteome analysis insights into cold stress of winter rapeseed (Brassica rapa L.) grown in the field. Sci. Rep 2021, 11, 23434. [Google Scholar] [CrossRef]
- White, T.C.; Simmonds, D.; Donaldson, P.; Singh, J. Regulation of BN115, a low-temperature-responsive gene from winter Brassica napus. Plant Physiol. 1994, 106, 917–928. [Google Scholar] [CrossRef]
- Dahal, K.; Gadapati, W.; Savitch, L.V.; Singh, J.; Hüner, N.P.A. Cold acclimation and BnCBF17-over-expression enhance photosynthetic performance and energy conversion efficiency during long-term growth of Brassica napus under elevated CO2 conditions. Planta 2012, 236, 1639–1652. [Google Scholar] [CrossRef]
- Song, M.; Linghu, B.; Huang, S.; Hu, S.; An, R.; Wei, S.; Mu, J.; Zhang, Y. Identification of nuclear pore complexes (NPCs) and revealed outer-ring component BnHOS1 related to cold tolerance in B. napus. Int. J. Biol. Macromol. 2022, 223, 1450–1461. [Google Scholar] [CrossRef]
- Dong, X.; Liu, Z.; Mi, W.; Xu, C.; Xu, M.; Zhou, Y.; Zhen, G.; Cao, X.; Fang, X.; Mi, C. Overexpression of BrAFP1 gene from winter rapeseed (Brassica rapa) confers cold tolerance in Arabidopsis. Plant Physiol. Bioch. 2020, 155, 338–345. [Google Scholar] [CrossRef]
- Wu, W.; Yang, H.; Shen, J.; Xing, P.; Han, X.; Dong, Y.; Wu, G.; Zheng, S.; Gao, K.; Yang, N.; et al. Identification of Brassica rapa BrEBF1 homologs and their characterization in cold signaling. J. Plant Physiol. 2023, 288, 154076. [Google Scholar] [CrossRef] [PubMed]
- Francis, A.; Lujan-Toro, B.; Warwick, S.; Macklin, J.; Martin, S. Update on the Brassicaceae species checklist. Biodivers. Data J. 2021, 9, e58773. [Google Scholar] [CrossRef] [PubMed]
- Nagaru, U. Genome analysis in Brassica with special reference to the experimental formation of B. napus and peculiar mode of fertilization. Jap. J. Bot. 1935, 7, 389–452. [Google Scholar]
- Yin, X.; Yang, Y.; Lv, Y.; Li, Y.; Yang, D.; Yue, Y.; Yang, Y. BrrICE1.1 Is associated with putrescine synthesis through regulation of the arginine decarboxylase gene in freezing tolerance of turnip (Brassica rapa var. rapa). BMC Plant Biol. 2020, 20, 504. [Google Scholar] [CrossRef] [PubMed]
- Zhang, T.; Mo, J.; Zhou, K.; Chang, Y.; Liu, Z. Overexpression of Brassica campestris BcICE1 gene increases abiotic stress tolerance in tobacco. Plant Physiol. Bioch. 2018, 132, 515–523. [Google Scholar] [CrossRef]
- Wang, X.; Wang, H.; Wang, J.; Sun, R.; Wu, J.; Liu, S.; Bai, Y.; Mun, J.-H.; Bancroft, I.; et al. The genome of the mesopolyploid crop species Brassica rapa. Nat. Genet. 2011, 43, 1035–1039. [Google Scholar] [CrossRef]
- Xie, H.; Sun, Y.; Cheng, B.; Xue, S.; Cheng, D.; Liu, L.; Meng, L.; Qiang, S. Variation in ICE1 methylation primarily determines phenotypic variation in freezing tolerance in Arabidopsis thaliana. Plant Cell Physiol. 2019, 60, 152–165. [Google Scholar] [CrossRef]
- Zarka, D.G.; Vogel, J.T.; Cook, D.; Thomashow, M.F. Cold induction of Arabidopsis CBF genes involves multiple ICE (Inducer of CBF expression) promoter elements and a cold-regulatory circuit that is desensitized by low temperature. Plant Physiol. 2003, 133, 910–918. [Google Scholar] [CrossRef]
- Jung, J.-H.; Seo, P.J.; Park, C.-M. The E3 ubiquitin ligase HOS1 regulates Arabidopsis flowering by mediating CONSTANS degradation under cold stress. J. Biol. Chem. 2012, 287, 43277–43287. [Google Scholar] [CrossRef]
- Lee, J.-H.; Park, C.-M. Integration of photoperiod and cold temperature signals into flowering genetic pathways in Arabidopsis. Plant Signal. Behav. 2015, 10, e1089373. [Google Scholar] [CrossRef]
- Achard, P.; Renou, J.-P.; Berthomé, R.; Harberd, N.P.; Genschik, P. Plant DELLAs restrain growth and promote survival of adversity by reducing the levels of reactive oxygen species. Curr. Biol. 2008, 18, 656–660. [Google Scholar] [CrossRef] [PubMed]
- Gilmour, S.J.; Sebolt, A.M.; Salazar, M.P.; Everard, J.D.; Thomashow, M.F. Overexpression of the Arabidopsis CBF3 transcriptional activator mimics multiple biochemical changes associated with cold acclimation. Plant Physiol. 2000, 124, 1854–1865. [Google Scholar] [CrossRef] [PubMed]
- Hincha, D.K.; Zuther, E. Plant cold acclimation and winter survival methods and protocols., 2nd ed.; Hincha, D.K., Zuther, E., Eds.; Springer US: New York, USA, 2020; ISBN 978-1-07-160659-9. [Google Scholar]
- Ma, L.; Wu, J.; Qi, W.; Coulter, J.A.; Fang, Y.; Li, X.; Liu, L.; Jin, J.; Niu, Z.; Yue, J.; et al. Screening and verification of reference genes for analysis of gene expression in winter rapeseed (Brassica rapa L.) under abiotic stress. PLoS ONE 2020, 15, e0236577. [Google Scholar] [CrossRef] [PubMed]
- Xiang, D.; Chai, Y.; Man, L.; Sun, Y.; Zhang, T.; Wei, C.; Xie, Z.; Li, H.; Zhang, W.; Liu, D.; et al. Overexpression of a heading chinese cabbage ICE1 gene confers freezing tolerance in transgenic rice. Plant Cell Tiss Org. 2017, 128, 43–54. [Google Scholar] [CrossRef]
- Maere, S.; De Bodt, S.; Raes, J.; Casneuf, T.; Van Montagu, M.; Kuiper, M.; Van De Peer, Y. Modeling gene and genome duplications in eukaryotes. Proc. Natl. Acad. Sci. USA. 2005, 102, 5454–5459. [Google Scholar] [CrossRef]
- Force, A.; Lynch, M.; Pickett, F.B.; Amores, A.; Yan, Y.; Postlethwait, J. Preservation of duplicate genes by complementary, degenerative mutations. Genetics 1999, 151, 1531–1545. [Google Scholar] [CrossRef]
- Panchy, N.; Lehti-Shiu, M.; Shiu, S.-H. Evolution of gene duplication in plants. Plant Physiol. 2016, 171, 2294–2316. [Google Scholar] [CrossRef]
- Yuan, H.-M.; Sheng, Y.; Chen, W.-J.; Lu, Y.-Q.; Tang, X.; Ou-Yang, M.; Huang, X. Overexpression of Hevea brasiliensis HbICE1 enhances cold tolerance in Arabidopsis. Front. Plant Sci. 2017, 8, 1462. [Google Scholar] [CrossRef]
- Lee, B.; Henderson, D.A.; Zhu, J.-K. The Arabidopsis cold-responsive transcriptome and its regulation by ICE1. Plant Cell 2005, 17, 3155–3175. [Google Scholar] [CrossRef]
- Tamura, K.; Stecher, G.; Peterson, D.; Filipski, A.; Kumar, S. MEGA6: Molecular evolutionary genetics analysis version 6.0. Mol. Biol. Evol. 2013, 30, 2725–2729. [Google Scholar] [CrossRef]
- Ye, K.; Li, H.; Ding, Y.; Shi, Y.; Song, C.-P.; Gong, Z.; Yang, S. Brassinosteroid-insensitive 2 negatively regulates the stability of transcription factor ICE1 in response to cold stress in Arabidopsis. Plant Cell 2019, tpc.00058.2019. [Google Scholar] [CrossRef] [PubMed]
- Shi, Y.; Tian, S.; Hou, L.; Huang, X.; Zhang, X.; Guo, H.; Yang, S. Ethylene signaling negatively regulates freezing tolerance by repressing expression of CBF and type-A ARR genes in Arabidopsis. Plant Cell 2012, 24, 2578–2595. [Google Scholar] [CrossRef] [PubMed]
- Conklin, M.E.; Smith, H.H. Peroxidase isozymes: a measure of molecular variation in ten herbaceous species of datura. Am. J. Bot. 1971, 58, 688–696. [Google Scholar] [CrossRef]
- Weydert, C.J.; Cullen, J.J. Measurement of superoxide dismutase, catalase and glutathione peroxidase in cultured cells and tissue. Nat. Protoc. 2010, 5, 51–66. [Google Scholar] [CrossRef] [PubMed]
- Shin, L.-J.; Lo, J.-C.; Yeh, K.-C. Copper Chaperone antioxidant protein1 is essential for copper homeostasis. Plant Physiol. 2012, 159, 1099–1110. [Google Scholar] [CrossRef]
- Gou, X.; He, K.; Yang, H.; Yuan, T.; Lin, H.; Clouse, S.D.; Li, J. Genome-wide cloning and sequence analysis of leucine-rich repeat receptor-like protein kinase genes in Arabidopsis thaliana. BMC Genomics 2010, 11, 19. [Google Scholar] [CrossRef]
- Clough, S.J.; Bent, A.F. Floral Dip: A simplified method for agrobacterium-mediated transformation of Arabidopsis thaliana. Plant J. 1998, 16, 735–743. [Google Scholar] [CrossRef]
Disclaimer/Publisher’s Note: The statements, opinions and data contained in all publications are solely those of the individual author(s) and contributor(s) and not of MDPI and/or the editor(s). MDPI and/or the editor(s) disclaim responsibility for any injury to people or property resulting from any ideas, methods, instructions or products referred to in the content. |
© 2024 by the authors. Licensee MDPI, Basel, Switzerland. This article is an open access article distributed under the terms and conditions of the Creative Commons Attribution (CC BY) license (http://creativecommons.org/licenses/by/4.0/).


