1. Introduction
The fission-track method for dating and retracing the thermal histories of geological samples is based on counting and measuring the damage trails from uranium fission in minerals. Apatite is the most important mineral: separated grains are mounted in resin, polished and etched for microscopic inspection. Etching creates channels along the damage trails. Etched fission tracks have distinct shapes and dimensions depending on their orientation and that of the etched surface. It is not evident how their numbers and lengths are related to those of the unetched tracks. For that reason, experimental protocols and a calibration against age standards must guarantee accurate results.
This contribution deals with matters related to etching, selection and measurement of confined fission tracks. Reasonable requirements of a confined-track sample are that it is a sufficient size for statistical treatment, representative of the track population, consistent with the modelling assumptions and calibration data, and that the measurements are reproducible and consistent between analysts. The variation of the mean track length amounts to ~3% for replicate measurements by an experienced scientist and ~5% for different scientists measuring the same sample (Gleadow et al., 1986; Green et al., 1986; Carlson et al. 1999; Barbarand et al., 2003). It is <0.5% for two scientists measuring the same track images (Tamer et al., 2019). However it rises to ≳10% for complex samples (Barbarand et al., 2003) and when the results of different observers, etching and measurement protocols are compared (Miller et al., 1993; Ketcham et al., 2015; 2018). Although we know of no statistical comparisons, is reasonable to suppose that the track length distributions are less reproducible than their means (Barbarand et al., 2003 - Figure 7). Several factors are known to bias confined-track measurements. Following Barbarand et al. (2003), we distinguish between geometrical bias, etching bias, observer bias and measurement bias.
Geometrical biases include length bias, orientation bias, fracture and host-track thickness bias, and edge- and surface-proximity bias (Laslett et al., 1982; 1984; Galbraith et al., 1990; Galbraith, 2002; 2005; Ketcham, 2003; 2005). Geometrical biases are not under the scientist’s control but can be dealt with on a theoretical basis. Measurement biases are related to the experimental setup: microscope magnification, use of reflected or transmitted light, oil immersion, inclusion of dipping tracks, or TinCLE’s, and Cf- or ion-irradiation (Watt et al., 1984; 1985; Crowley et al., 1991; Ketcham et al., 1999; Barbarand et al., 2003; Li et al., 2018; Tamer and Ketcham, 2023). Measurement biases can be held in check by standardizing measurement procedures. Unintentional observer bias occurs when scientists measure different lengths on the same tracks. This effect is moderated by normalizing to a “zero”-length specific to the scientist (Kohn et al., 2002; Spiegel et al., 2007; Ketcham et al., 2015; 2018). Intentional observer bias occurs when a subset of confined tracks is selected for modelling, and other tracks are discarded as “not suitable for measurement”.
We formulated an etch model for apatite and measured the corresponding etch rates (Aslanian et al., 2021; Jonckheere et al., 2022; Fu et al., 2024; Trilsch et al., 2024). This enables us, from observation of a confined track, to infer its c-axis orientation, its effective etch time, and its etch rate, in addition to its length. This releases us from the rigid etching protocols in common use and provides insight in the relationship between etching and sampling (intentional observer) bias. We consider how to use this to improve the confined-track sample and the resulting thermal histories.
2. Step-Etching
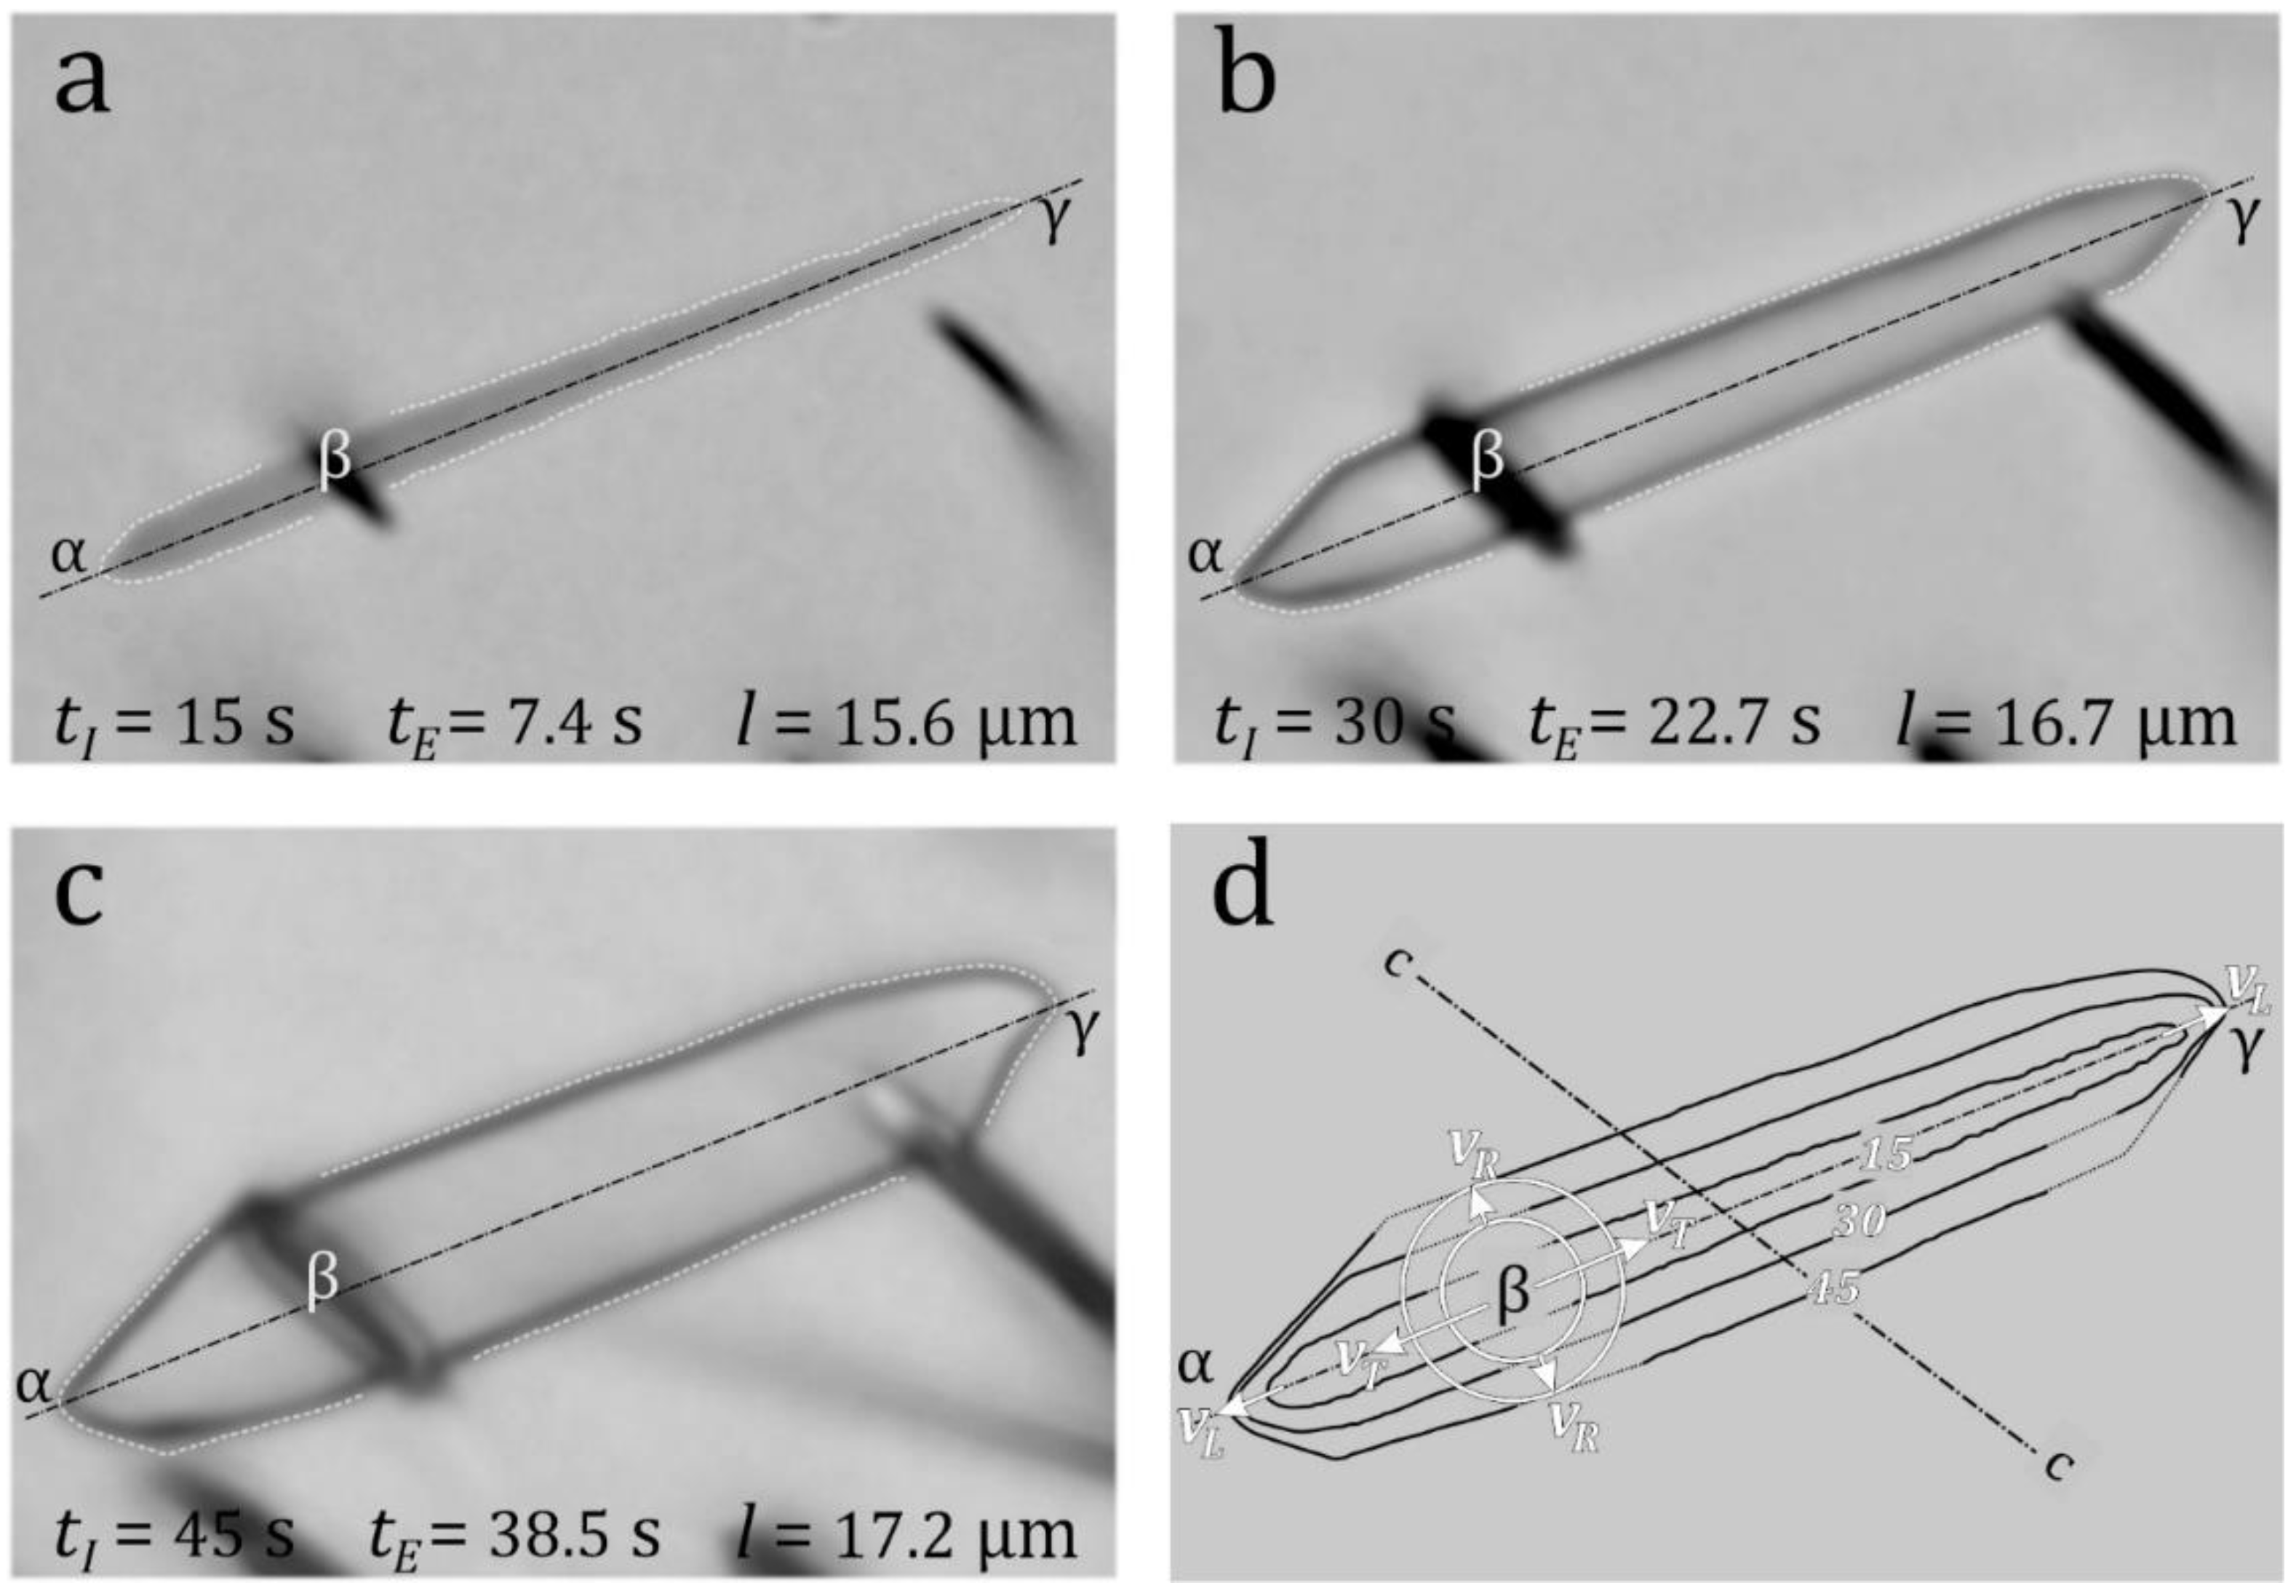
Figure 1 shows a horizontal confined induced track (αγ) at ~60° to the
c-axis in a prism face of Durango apatite after 15, 30 and 45 s immersion in 5.5 M HNO
3 at 21 °C (Carlson et al., 1999). It is intersected at ¼ of its length by the host track (β). It is widest at β and narrows towards α and γ, implying a finite track etch rate
vT. The ruler-straight edges show that
vT is constant over almost its entire length (Fleischer et al., 1969). The track width at β is ~0.9 µm, indicating that it was etched for the last ~7.4 seconds of its immersion, while during the first ~7.6 s the acid progressed down the host track and across to the confined track. For an average track etch rate
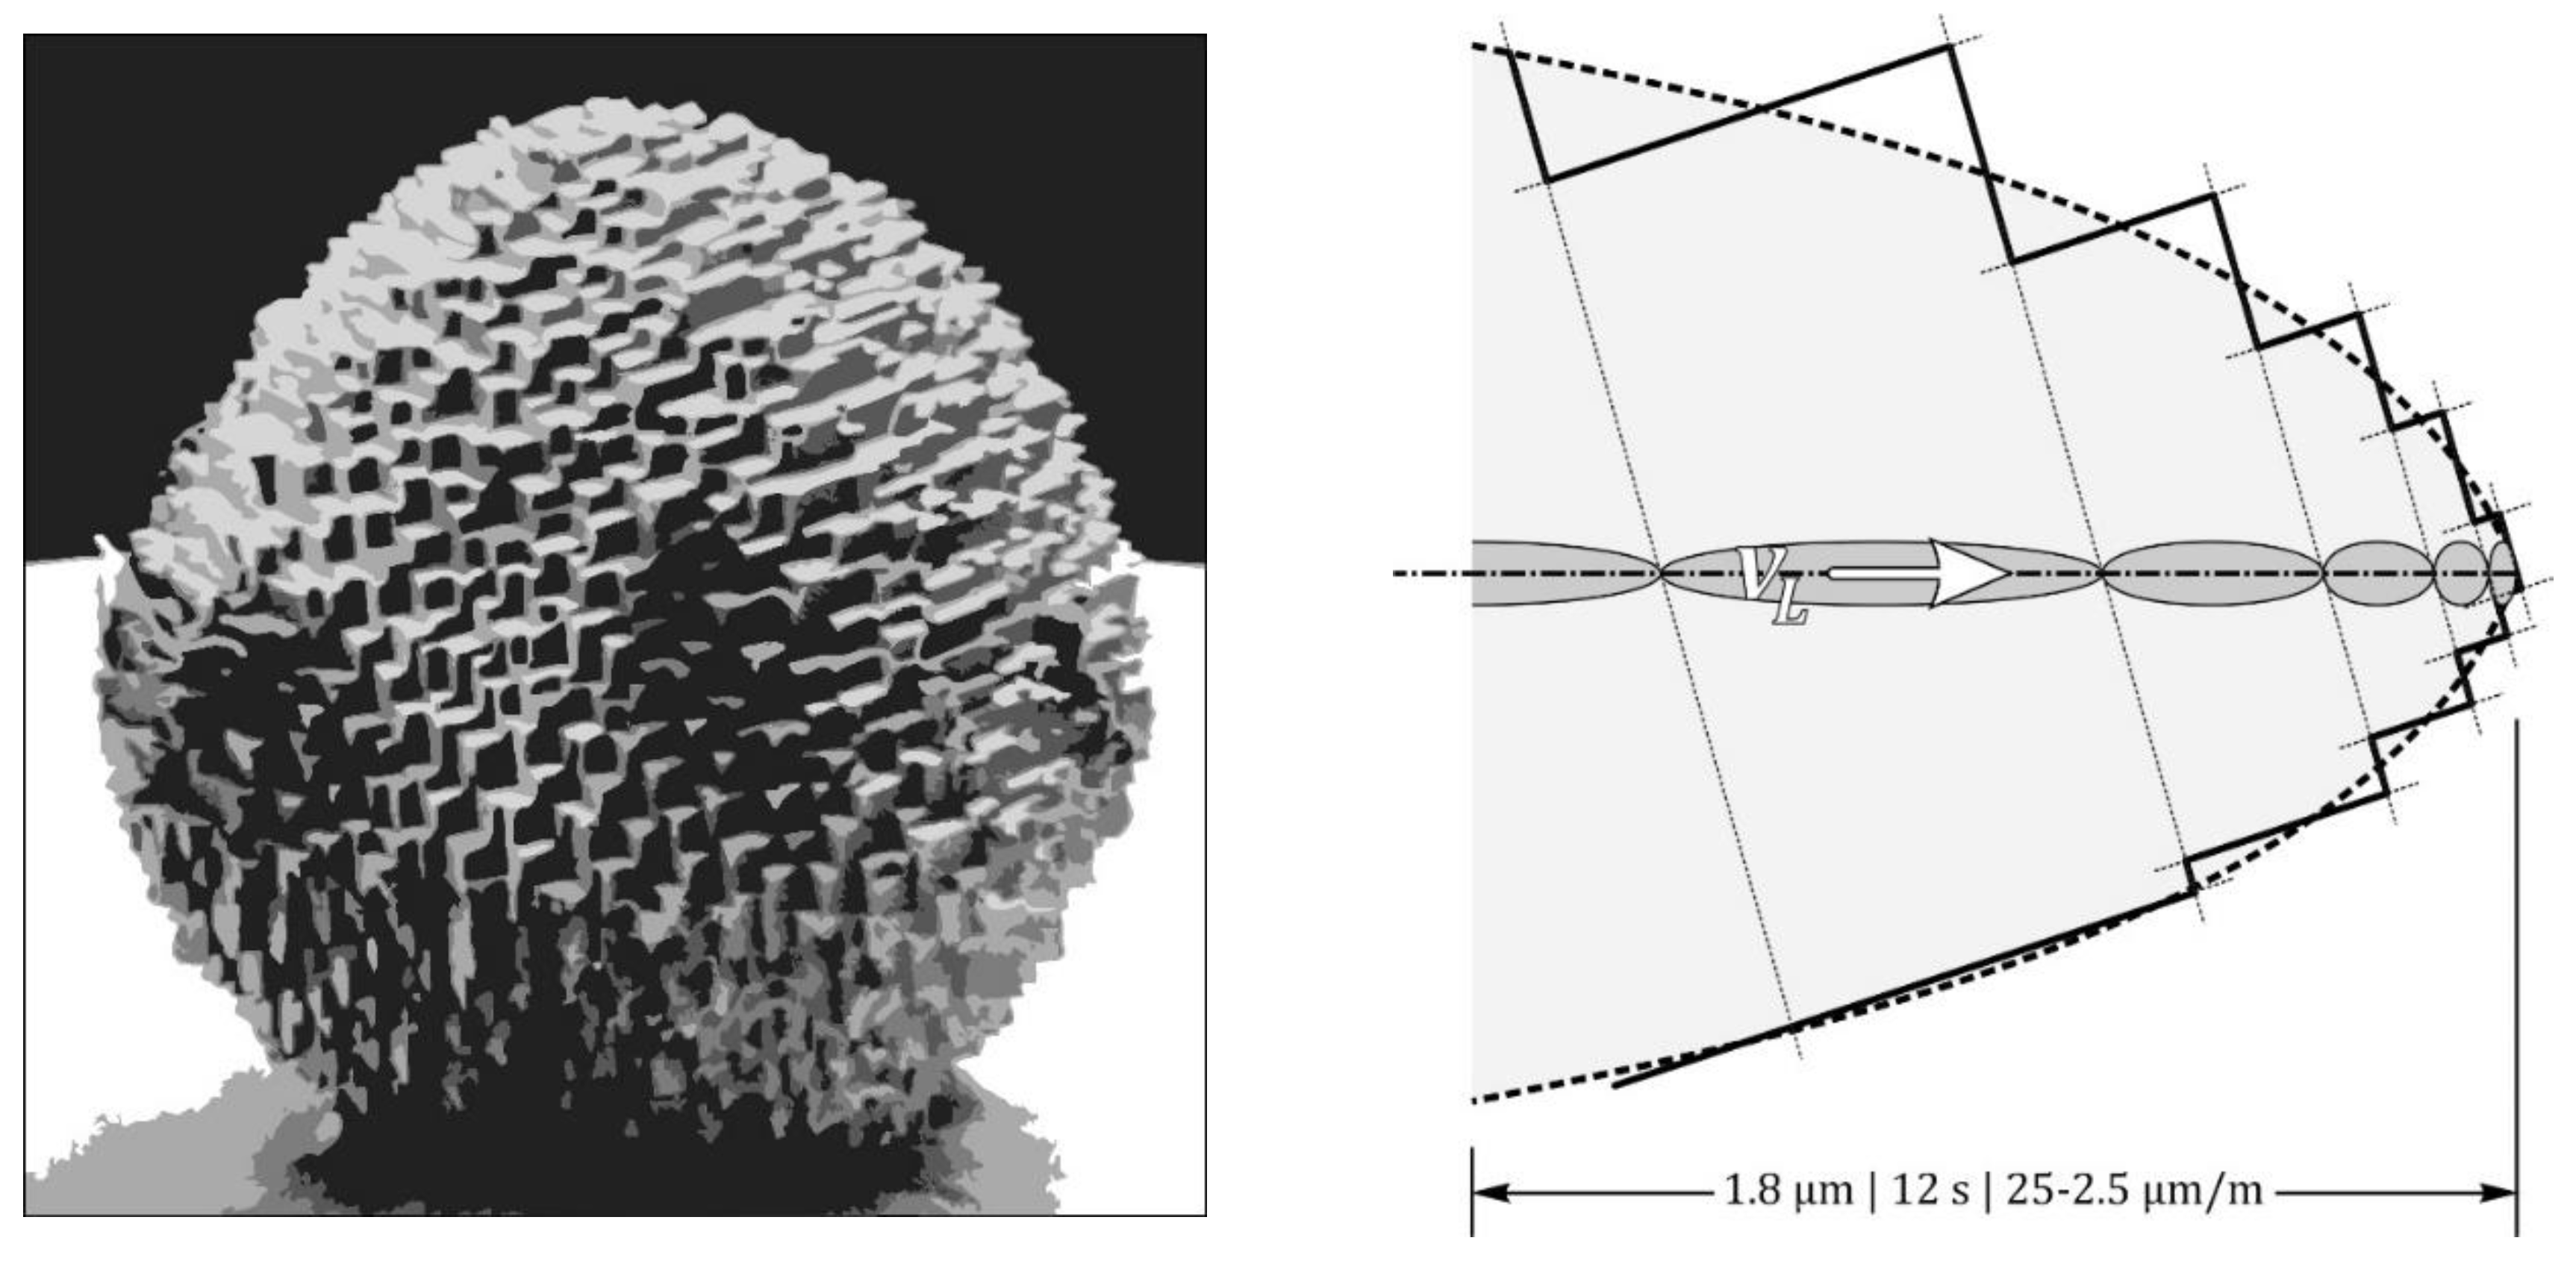
vT the tip (α) closest to β was etched for about five seconds, whereas (γ) was etched for two seconds at most. Nevertheless γ is blunt (rounded), which has been taken as a sign that the track is well-etched or even over-etched (Laslett et al., 1984; Figure 7). In contrast, α just begins to develop a polygonal shape bounded by slow etching basal and prism faces (Jonckheere et al., 2019, Figure 11; Aslanian et al., 2021,
Figure 2) in agreement with the theories of crystal growth and dissolution (etching). In crystal growth and dissolution, it is rounded rather than polygonal forms that require explaining. But that is straightforward: a constant
vT accounts for the straight track, a deceasing
vT accounts for a rounded tip (motorboat effect; Fleischer et al., 1969,
Figure 2), and zero
vT for a termination determined by the apatite etch rates
vR. It is thus not before a confined track has developed polygonal terminations at both ends that it can be considered as fully etched.
After the second immersion the width of the track in
Figure 1 increases to three times that after the first immersion, and after the third to more than five times, whereas its length has increased <10%. This is because both ends become bounded by basal and prism faces, which limit the rate of length increase to that controlled by the lowest apatite etch rates. At high angles to the
c-axis, the basal face grows faster in extent; at low angles, the prism face grows faster (Jonckheere et al., 2019 - Figure 11; Aslanian et al., 2021 -
Figure 2). A short etch gives thin tracks with rounded tips that are easier to measure, but underetched, whereas a longer etch produces broad tracks with angular terminations that are to an extent overetched and appear more difficult to measure. It is however per definition right to measure the track length from the intersection between the basal and prism face at one end of the track to that at its opposite end (
Figure 1d). Supplement-
Figure 1 shows that the measurements of confined track lengths by two analysts are more consistent after 30 s immersion (correlation coefficient
rl = 0.99) than after 15 s (
rl = 0.95); there is no further improvement after 45 s immersion (
rl = 0.99). The same appears to be the case for the track widths (
w) and effective etch times (
tE). The fact that the etch times are less consistent than the track widths underlines the importance of the track orientations (
ϕ) for calculating
tE = ½
w/vR(
ϕ).
Figure 1 illustrates that there is no time at which a confined track is well-etched at both ends. At the moment that one end goes from track etching (
vT,
vL) to bulk etching (
vR), the other will be overetched if it is closer to the host track, or underetched if it is more distant. On top of that, shorter tracks will, on average, be overetched relative to longer tracks (Laslett et al., 1984). Therefore different confined tracks not only have different formation and geological histories but also different etching histories. The aim of etching protocols should be to minimize etching artefacts. This raises the question what to aim for. An etching protocol that achieves the closest possible approximation to the intrinsic (latent) tracks lengths, or one that produces the best fit with the published annealing datasets on which the current Tt-modelling equations are based. In either case, the next question is whether the goal is best achieved by a uniform, standardized protocol or by protocols tailored to the etching properties of the samples and the tracks (fossil or induced).
3. Ion Irradiation
Besides a representative sample and accurate measurements, the number of tracks is important for modelling the thermal histories of geological samples. It is not uncommon to expose samples to fission fragments from a
252Cf source (Donelick and Miller, 1991). This creates tracks that act as conduits along which the etchant gains access to fission tracks in the grain interior. The “Cf-tracks” from “Cf-irradiation” are short and expose confined tracks within half a full track length of the surface. This method uses the same immersion times and etch protocols as for unirradiated samples. The increase of the confined track sample can reach almost an order of magnitude in suitable apatite samples (Donelick and Miller, 1991;
Figure 3) but appears to be less in zircon Yamada et al. (1998). These authors also studied artificial fracturing and accelerator-ion irradiation as alternatives to Cf-irradiation, while Ito (2004) used extended etching for increasing the sample size.
Ions from a linear accelerator can have GeV-energies, enabling them to traverse entire apatite grains. Nevertheless, fission tracks at ≳10 µm depth are in general underetched at standard immersion times because it takes time for the etchant to advance down the ion tracks. However, we are less bound by protocols if we can calculate the effective etch time of each confined track from its width at its intersection with the host track (Aslanian et al., 2021; Fu et al., 2024; Trilsch et al., 2024). It is then advantageous to combine ion irradiation with an extended etch time or with step-etching. The result depends on the sample, the beam properties and the etch protocol. Just increasing the immersion time, keeping all else constant, can increase the confined track sample by an order of magnitude, for the most part due to the widening of the ion tracks (Jonckheere et al., 2007;
Figure 3 and Figure 6). This approach has other advantages:
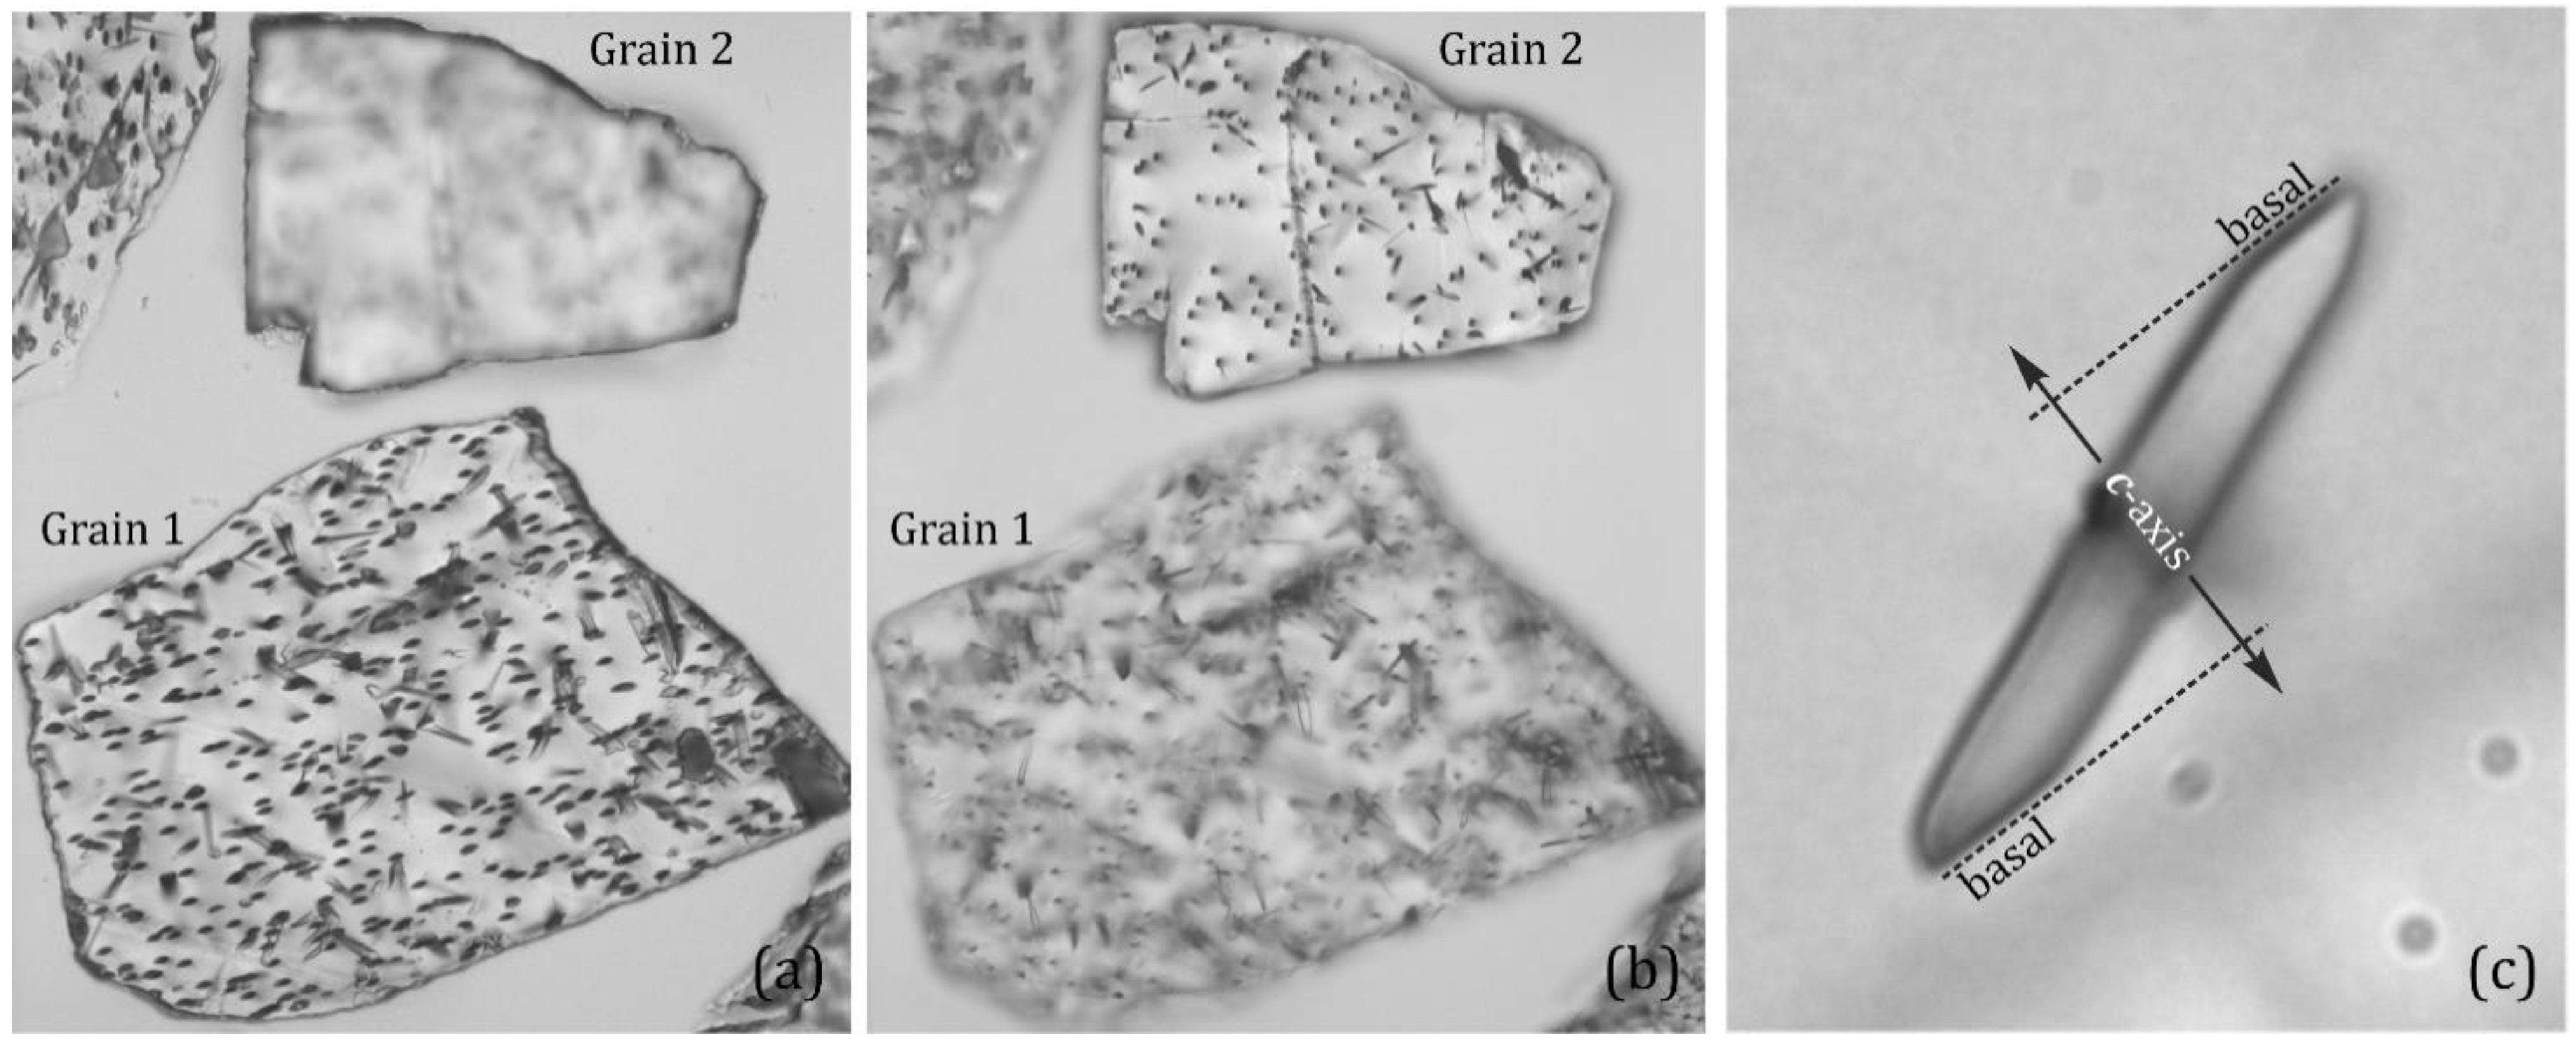
Figure 3a,b shows two apatite grains etched for 40 s in 5.5 M HNO
3 at 21 °C. The obvious focus difference between the fast-etching and the slow-etching grains facilitates rapid grain selection at moderate magnification.
Figure 3c shows a confined fission track at a depth below the surface beyond the deepest surface tracks, etched to a point where it is terminated at both ends a basal and prism face. Thus the outline of a single well-etched confined track suffices for determining the orientation of the apatite
c-axis.
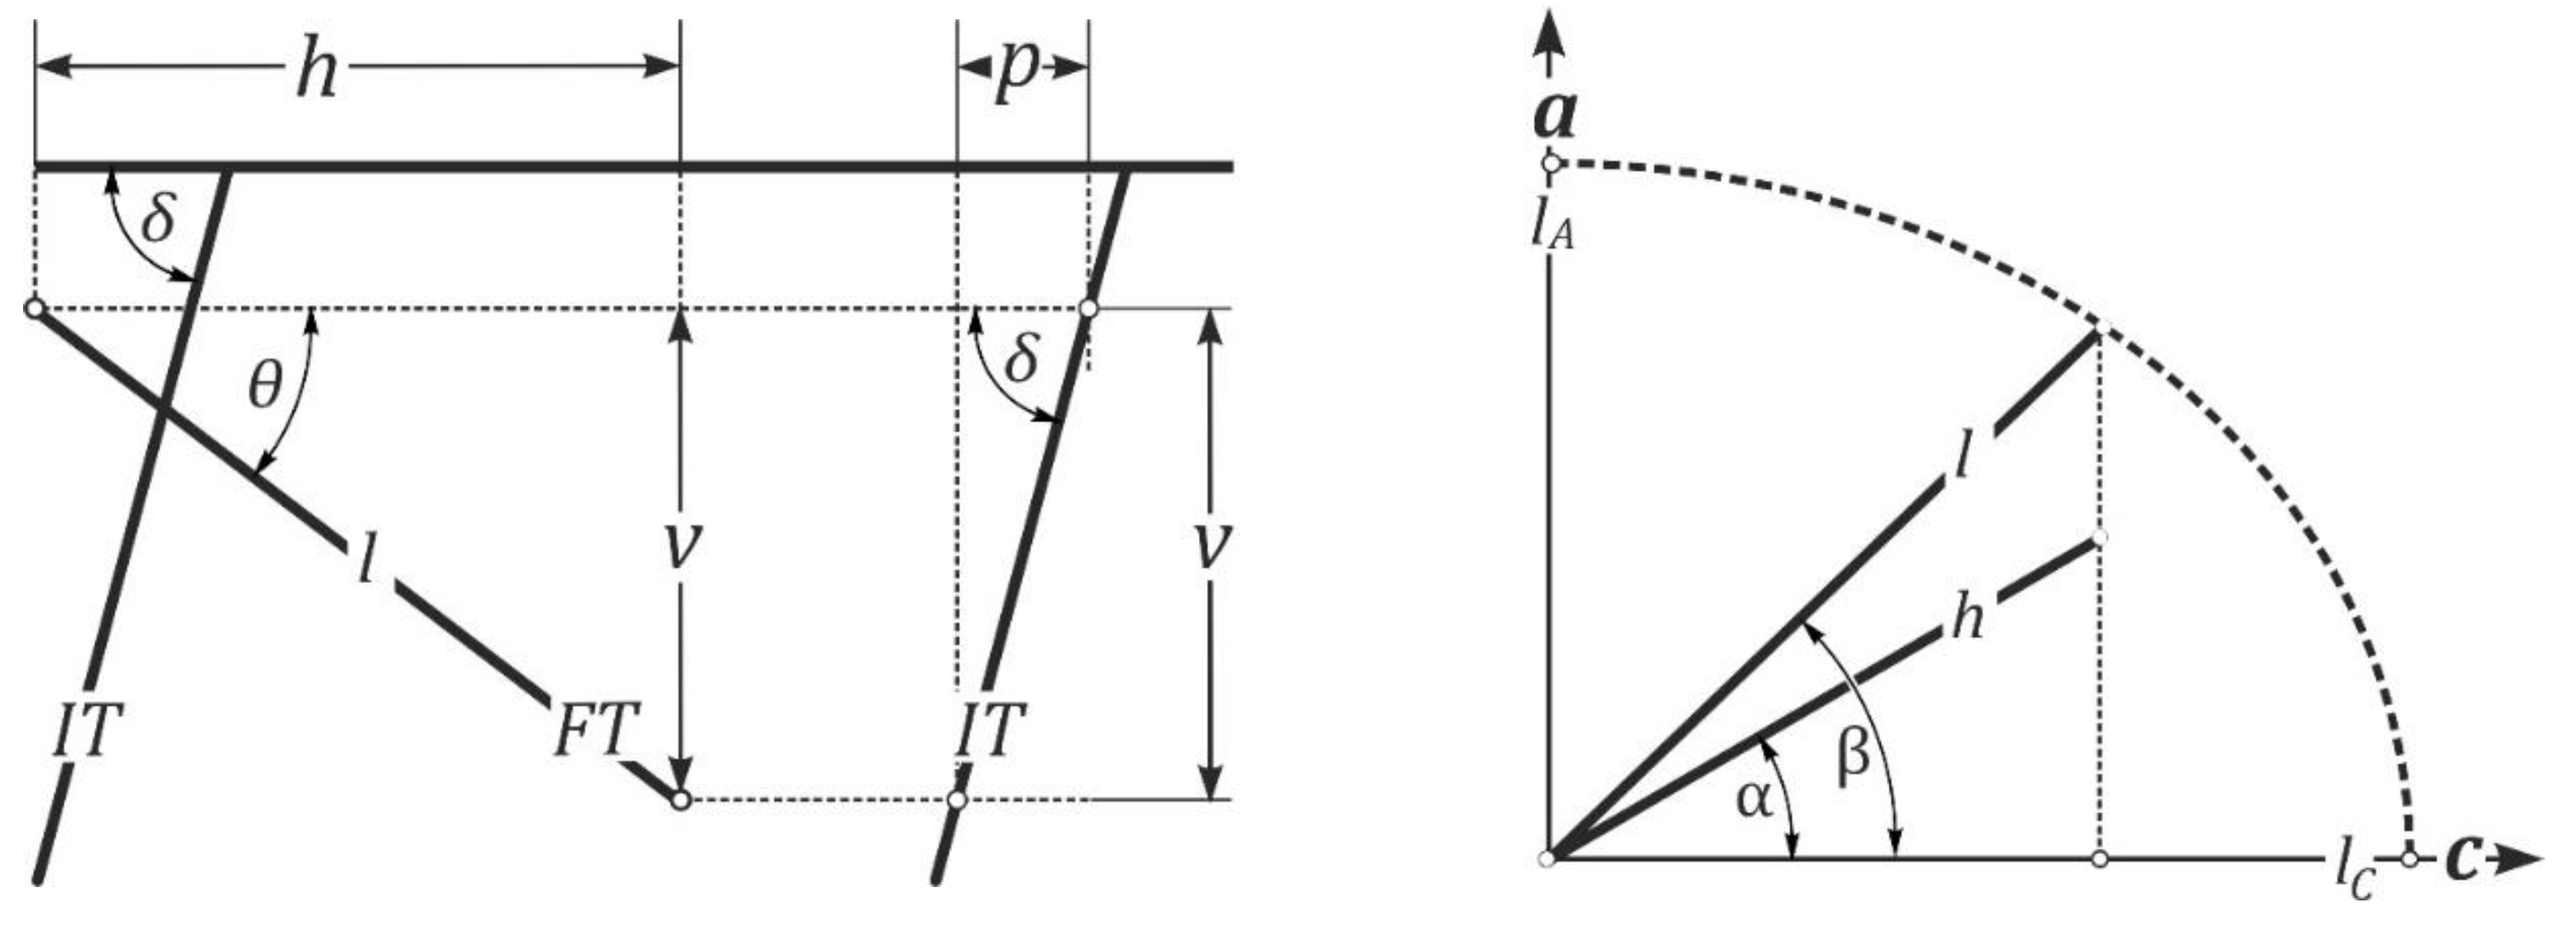
In relative terms, ion irradiation reveals more non-horizontal confined tracks than Cf-irradiation. Their lengths and orientations can be measured with dedicated software but also without. The ion tracks at a fixed angle (
δ) to the surface allow converting a horizontal distance (
p) into a height (
v), requiring no correction for refraction. One measures the horizontal distances
h and
p and the apparent angle to the
c-axis
α while focussing, as normal, on the upper and lower end of the confined fission track (
Figure 4). Its true length
l and
c-axis angle
β are then calculated as (Jonckheere and Ratschbacher, 2010):
Measuring two or more ion tracks (averaging
p) around each confined track increases precision, which is at least as good as that of 3D length measurements on image stacks (Supplement
Figure 2; Tamer et al., 2019). In contrast to the orientation-dependent surface openings of fission tracks (Sobel and Seward, 2010) the identical ion track openings also permit precise
Dpar estimates for each individual grain. Video supplement 1 of an apatite grain irradiated with 2.5 10
6 cm
−2 Xe-ions and etched 40 s in 5.5 M HNO
3 at 21 °C shows the advantages of ion irradiation and an extended etch time.
4. Apatite Etch Rates
Because of their sub-microscopic diameters, fission tracks in apatite are made visible under an optical microscope by chemical etching. This is because the disordered region along the trajectories of the fission fragments reacts faster than the ordered lattice (Price and Walker, 1962). Fleischer and Price (1963) described track development in polymers and glasses in terms of the etch rate vT along the track and the bulk etch rate vB of the detector. With a notable exception (Maurette, 1966), this concept has also been adopted as a framework for describing track revelation in apatite (Tagami and O’Sullivan, 2005; Hurford, 2017), which affords the rationale for using prism faces for dating. However, a (vT, vB)-model cannot explain the varied appearances of etched fission tracks depending on their orientation and that of the etched surface (Jonckheere et al., 2019).
Aslanian et al. (2021) proposed a new model with three etch rates;
vT is as before the track etch rate, and
vR is the anisotropic apatite etch rate. In contrast to
vB, which is the etch rate of a point on an etched surface (Huygens-Fresnel principle),
vR is the rate of displacement of a complete lattice plane as in the theories of crystal growth and dissolution (Wulff, 1901; Gross, 1918). For practical reasons we further distinguish
vL, the rate of increase of confined track lengths;
vL is a combination of apatite and track etch rates, which at present cannot be resolved in its components (
Figure 2).
Step-etch experiments are used for measuring etch rates (Aslanian et al., 2021;2022; Fu et al., 2024; Trilsch et al., 2024);
vR is calculated from the width increase of confined tracks between successive immersions, and
vL from their length increase (
Figure 1);
vT is calculated from
vR and the angle between facing edges of the track channel. Tracks with different orientations permit to calculate
vR,
vL and
vT as a function of
c-axis angle (
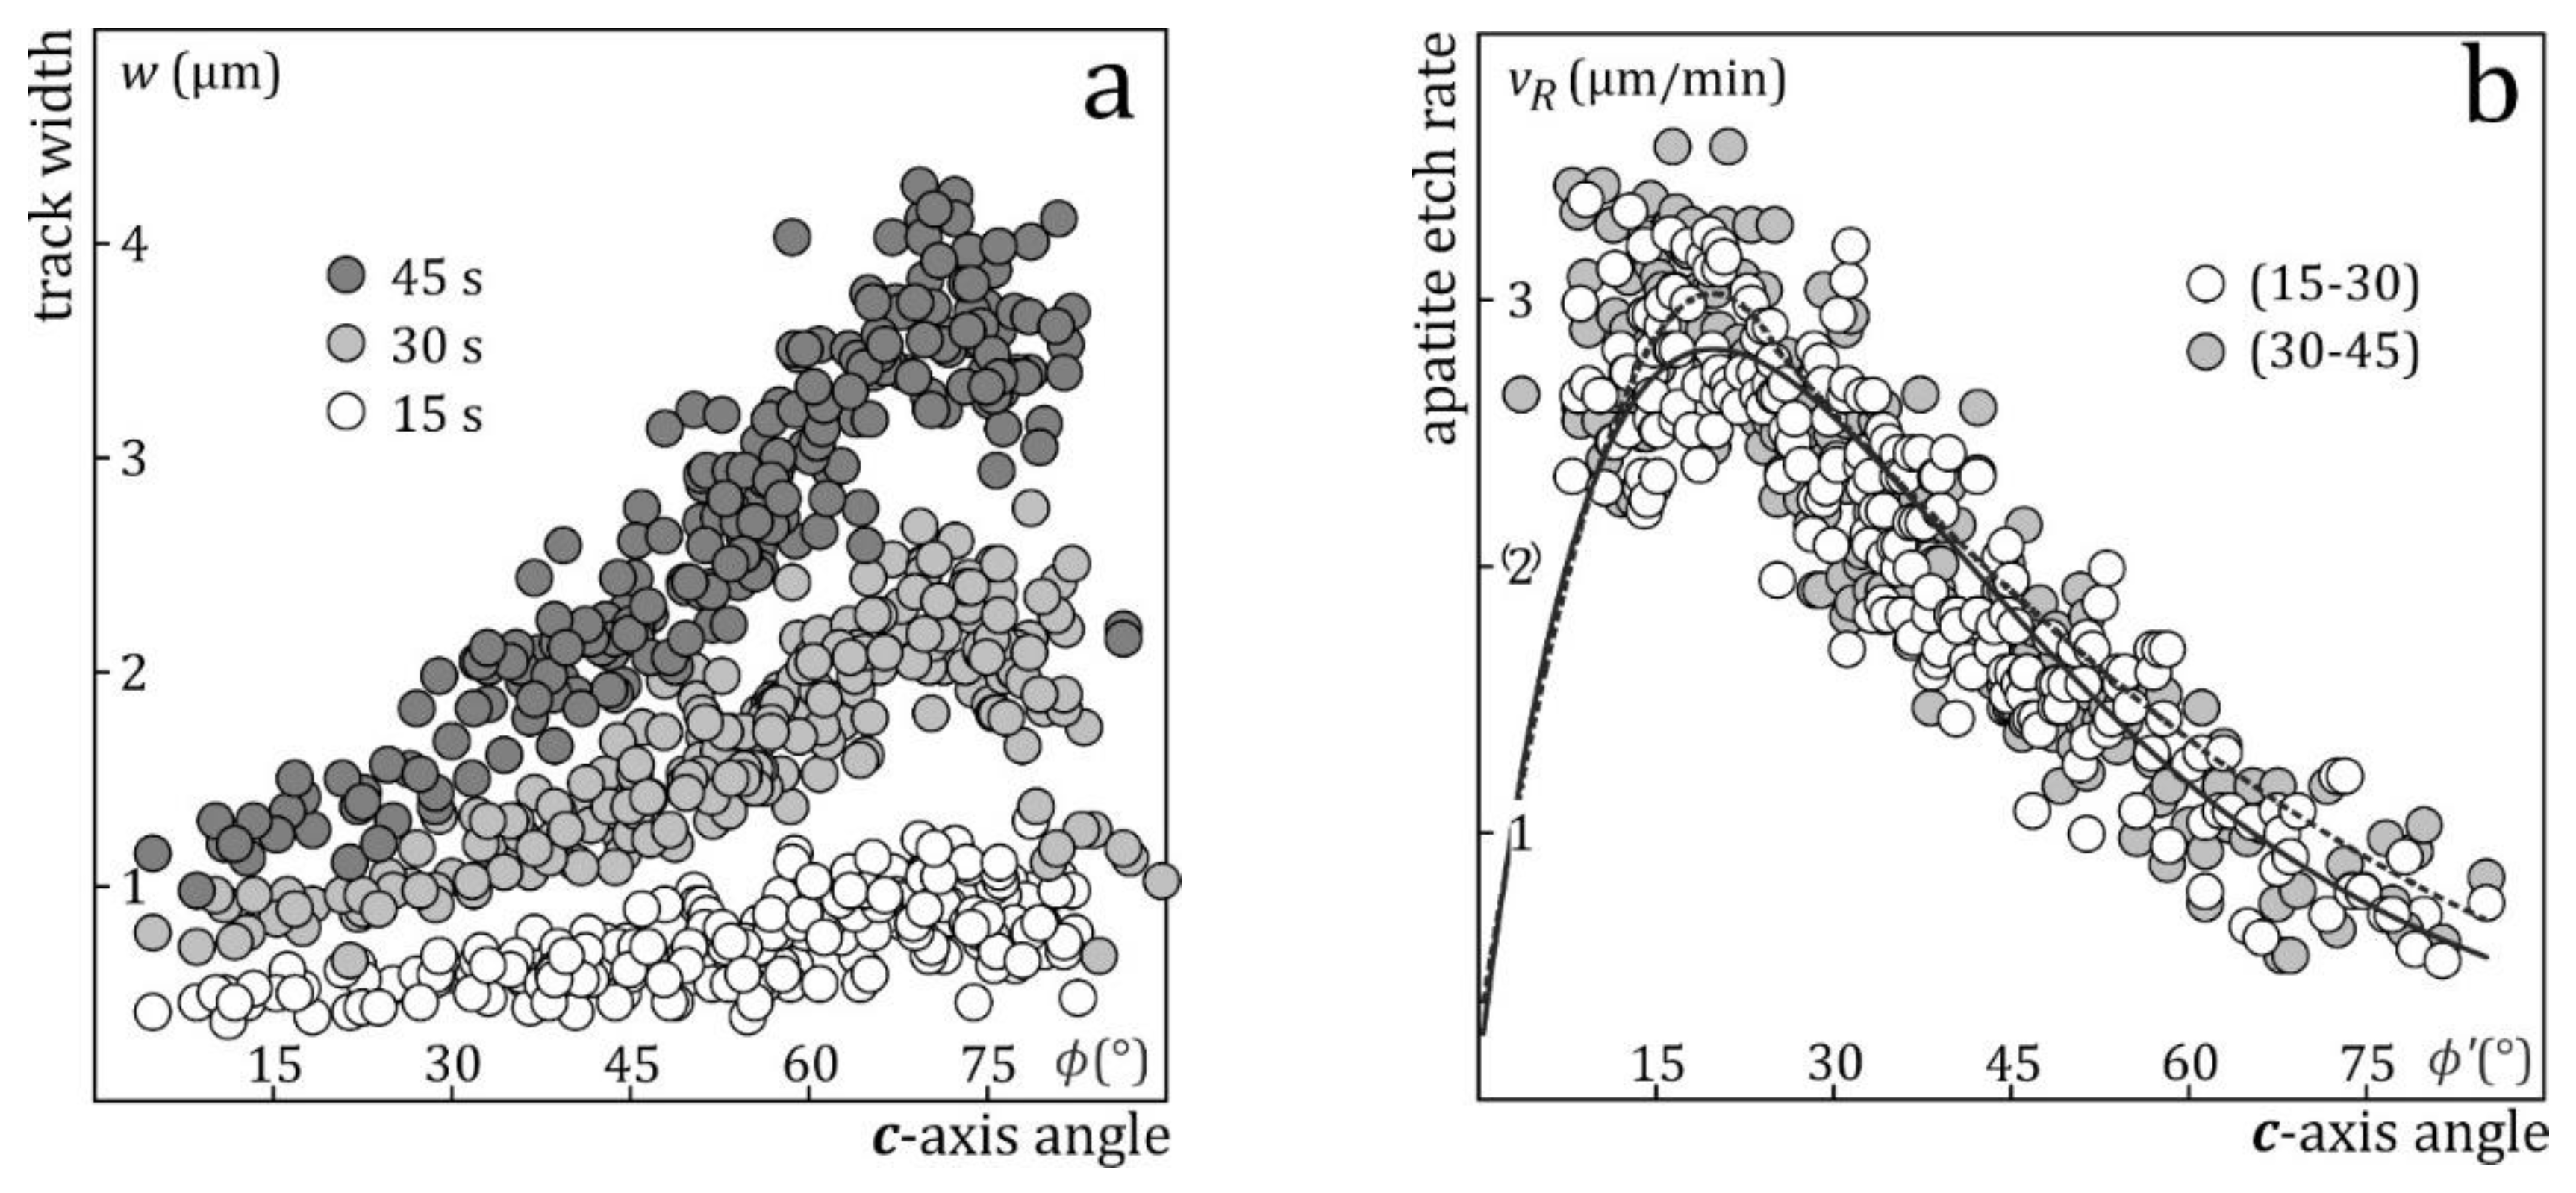
Figure 5). The apatite etch rate
vR is lowest parallel and perpendicular to the
c-axis and highest at ~20° to
c;
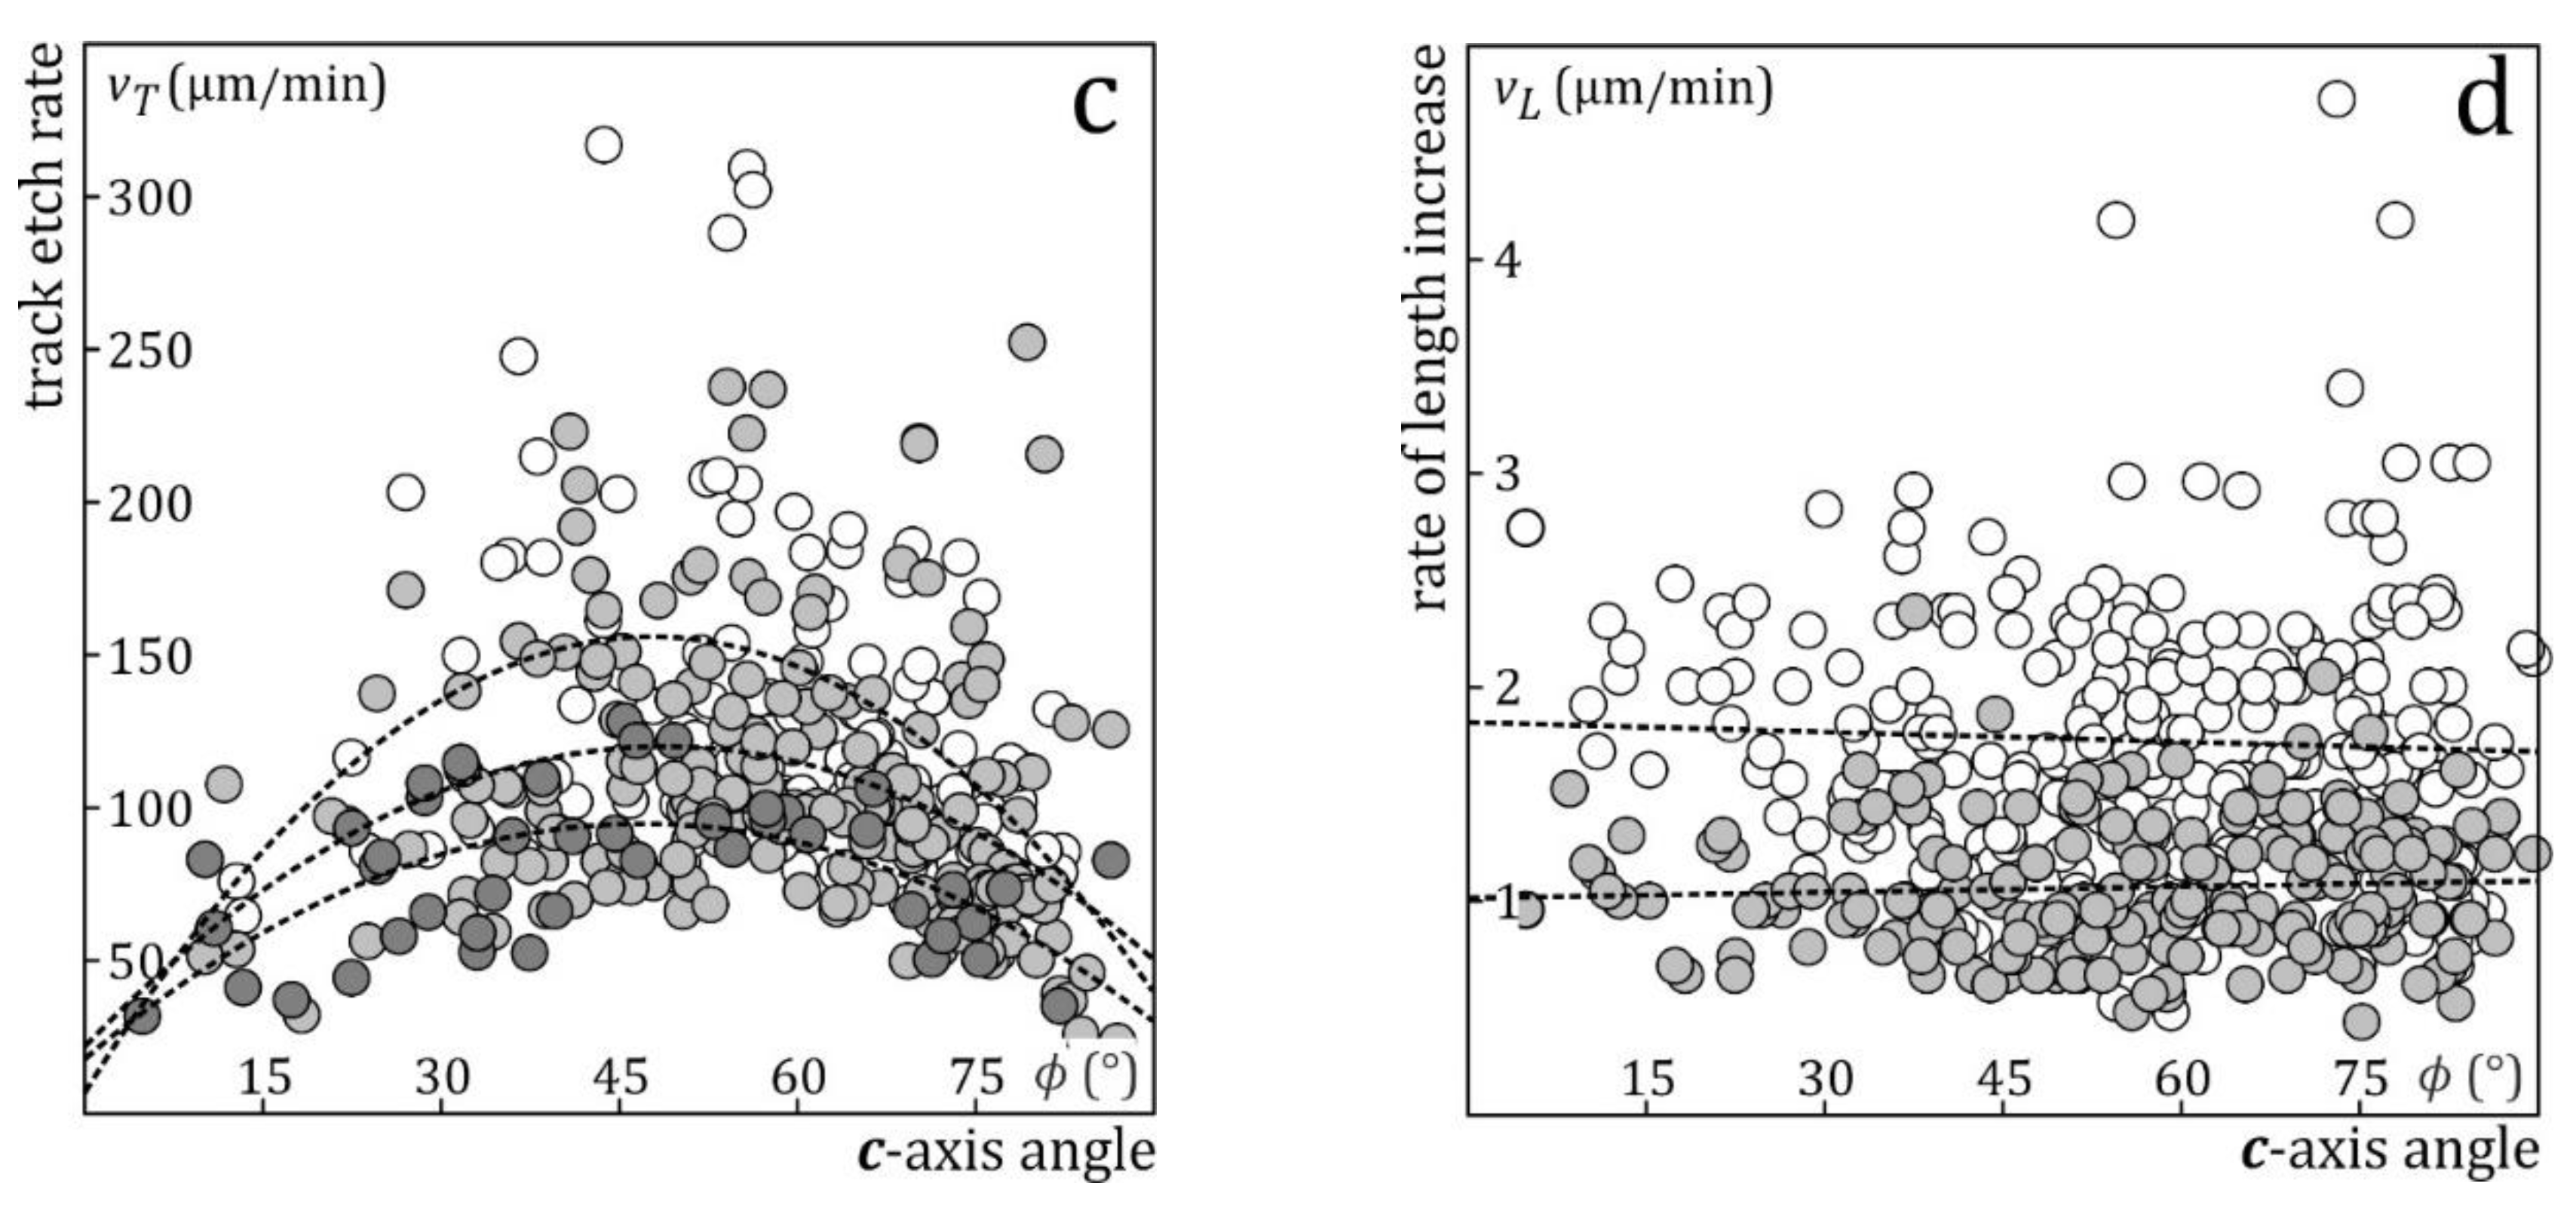
vT differs from track to track, also with lower average values parallel and perpendicular to
c, (Gleadow, 1981). Measurements of induced tracks in Durango apatite after 15, 30 and 45 s immersion in 5.5 M HNO
3 at 21 °C give decreasing
vT-estimates due to the fact that during the second and third immersion the etchant needs a finite time to reach the track tips again (Trilsch et al., 2024). The first and highest estimates are thus closest to the true track etch rates
vT. Since the track length measures its extent of annealing,
vL has the greatest effect on the thermal histories of geological samples;
vL shows significant differences from track to track but on average no angular dependence, it can be higher or lower than the apatite etch rate along the axis of the track and decreases with increasing immersion time. This shows that
vL is a combination of track and apatite etch rates, which converges with increasing immersion time to the lowest apatites etch rates, as the influence of
vT decreases and vanishes when the tips become bounded by basal and prism faces (
Figures 1, 2, and 5).
The etch rates allow us to calculate the duration for which individual confined tracks have been etched (effective etch time tE), providing a quantitative criterion for judging whether a track is under- or overetched, and to consider the effect of the resulting track lengths on the thermal histories of geological samples. The practical advantage is that it liberates us from strict adherence to established protocols and allows to tailor the etching conditions to the properties of the samples.
5. Immersion Time
Supplement Figure S3 plots the lengths of induced and fossil confined tracks in Durango apatite against effective etch time. It shows the striking difference between the low-
tE interval, where different lengths increase at different rates, and the high-
tE region, where most lengths increase at about the same rate. The different rates at low
tE reflect the etching histories of the tracks. At higher
tE the tracks enter the bulk etching stage. From then on their length increase is controlled by a similar constant
vR in all directions (Jonckheere et al., 2019, Figure 11). Their etching histories are overwritten and the lengths of induced tracks come to reflect their formation histories, related to the masses, charges, energies and trajectories of the fission fragments. All track lengths continue to increase with
tE but the differences between them are little changed. The length differences between the fossil tracks come to reflect their combined geological and formation histories. It is interesting to speculate if the order of their lengths continues to reflect their formation histories or if there are significant crossovers due to the different individual thermal histories of the tracks. This is more likely to be the case in cases of slow cooling than rapid cooling.
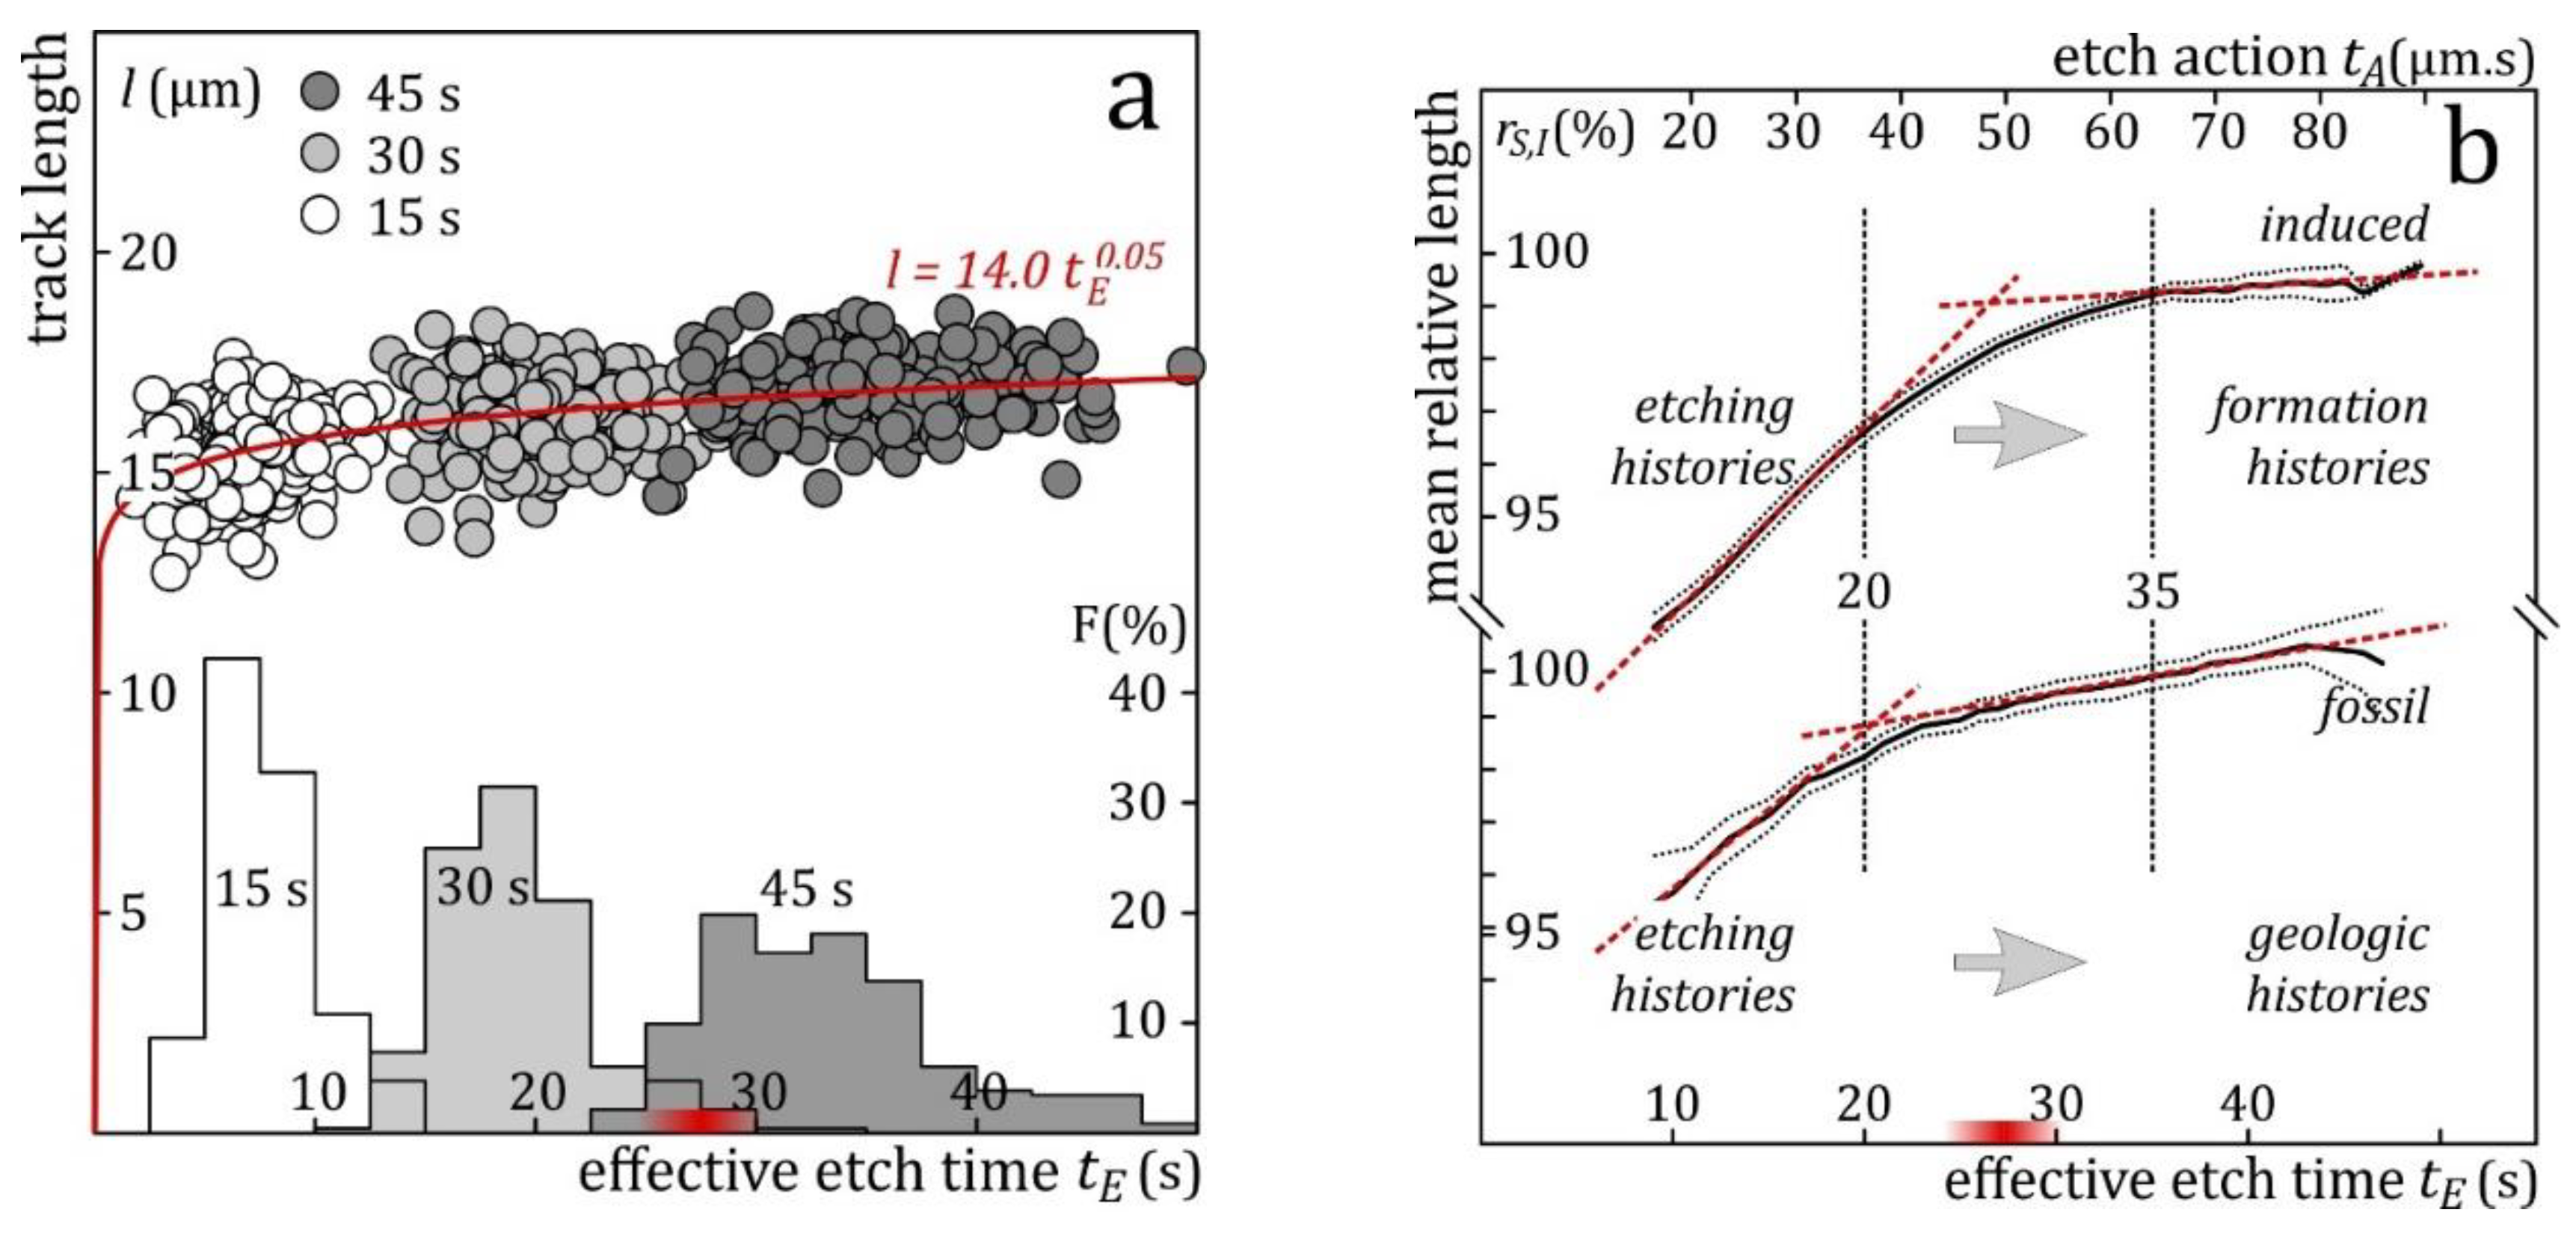
Figure 6a plots the measured lengths of induced tracks in Durango apatite against the effective etch times calculated from their widths. The fitted power function shows that most tracks reach something close to their full lengths in a matter of seconds, as reported before for similar etchants (5.0-5.5 M HNO
3; Laslett et al., 1984; Green et al., 1986; Carlson et al., 1999; Barbarand et al., 2003; Moreira et al., 2010). This supports an average track etch rate
vT of the order of ~100 µm/min. (Aslanian et al., 2021; Jonckheere, 2023; Fu et al., 2024). The lengths thereafter increase at a diminishing rate.
Figure 6b shows the track lengths normalized to their final values, measured after 45 s. This eliminates most of the intrinsic length differences between the tracks and exposes the general dependence of the confined track length on effective etch time. At
tE ≲ 20 s, the sample-
vL is an average of tracks in less and more advanced etching stages. The differences are due to the track length, its etch rate
vT, and the host track intersection point. From
tE ≳20 s onward, an increasing fraction enters the bulk etching stage, lowering the average
vL. At
tE ≳ 35 s, all tracks are in bulk etching, so that their lengths in all orientations increase at more or less the same rate (Jonckheere et al., 2017,
Figure 6; 2019, Figure 11; Tamer and Ketcham, 2020,
Figure 3).
The fossil track data show the same general trend, except for some details: (1) at tE ≲ 20 s, the length increase of fossil tracks is slower than that of the induced tracks; (2) fossil tracks enter the bulk etching stage before the induced tracks, and the transition is shorter and less gradual than that of the induced tracks; (3) from then on, their length increases faster than that of the induced tracks. The fossil track data are compiled from several experiments and thus less homogeneous and perhaps less certain than the induced-track data. They are however consistent with earlier observations, indicating that the track etch rate vT of fossil tracks is in general lower than that of induced tracks (Aslanian et al., 2021; Jonckheere, 2023; Fu et al., 2024;), whereas the rate of length increase vL due to bulk etching is higher (Jonckheere et al., 2017; Trilsch et al., 2024). Observations (2, 3) are thought to be related to increased apatite etch rates due to the accumulated radiation damage in the fossil-track samples which is annealed in the induced-track samples.
Plots of track length against effective etch time are independent of the number of etch steps, of their respective immersion times, and of the set of tracks selected for measurement. At
tE ≳ 35 s, all induced tracks in Durango apatite are in “bulk etching”, of which a fraction is over-etched. Their mean length increases 2.5% from
tE = 20 s to 35 s, 1.1% from 25 to 35 s and 0.4% from 30 to 35 s. It thus seems practical to aim for an average effective etch time of 25-30 s. Confined tracks in this interval have well-defined outlines (
Figure 1b) and allow reproducible length and width measurements (
Figure S1). In contrast to their lengths, the number of tracks in the chosen interval depends on the etch protocol and initial selection. Our three-step protocol is not efficient at generating confined tracks in the
tE-range 25-30 s; after 15+15 s immersion, most tracks fall short of the goal, while after 15+15+15 s most tracks overshoot it (
Figure 6a). A single 45 s immersion produces the same tracks as after three 15-s-steps, but also a long left-tail, extending to short
tE. A one-step immersion is thus much more efficient at revealing an adequate number of confined tracks. A disadvantage of long immersion times, whether in a single step or several, is that the increasing dimensions of the etched surface tracks can come to obscure the confined tracks. On the other hand, an extended immersion time, combined with deep ion irradiation, allows to measure confined tracks well below, and with minimal interference from, the surface tracks. In an ongoing geological investigation of geological Fluor-apatites, we combine deep ion irradiation with a single 40-s-immersion in 5.5 M HNO
3 at 21 °C (
Figure 3 and Video supplement 1).
The definition of
vR requires that the apatite etch rate remains constant during the immersion of a sample (
tI;
Figure 5ab; Sobel and Seward 2010). It follows that
vR is interchangeable with
tI and that samples with equal
vR ×
tI are etched to the same degree. This applies to the effective etch times
tE of confined tracks as well: those for which the same
vR ×
tE present similar widths and shapes. This applies to tracks with different orientations within a sample but also across apatite species. Their etch rates depend on their compositions and scale with
Dpar (Donelick et al., 1999; 2005; Fu et al., 2024). It thus makes sense to plot step-etch data not against the etch or immersion time but against etch action:
tA =
Dpar ×
tE (or
tA =
Dpar ×
tI).
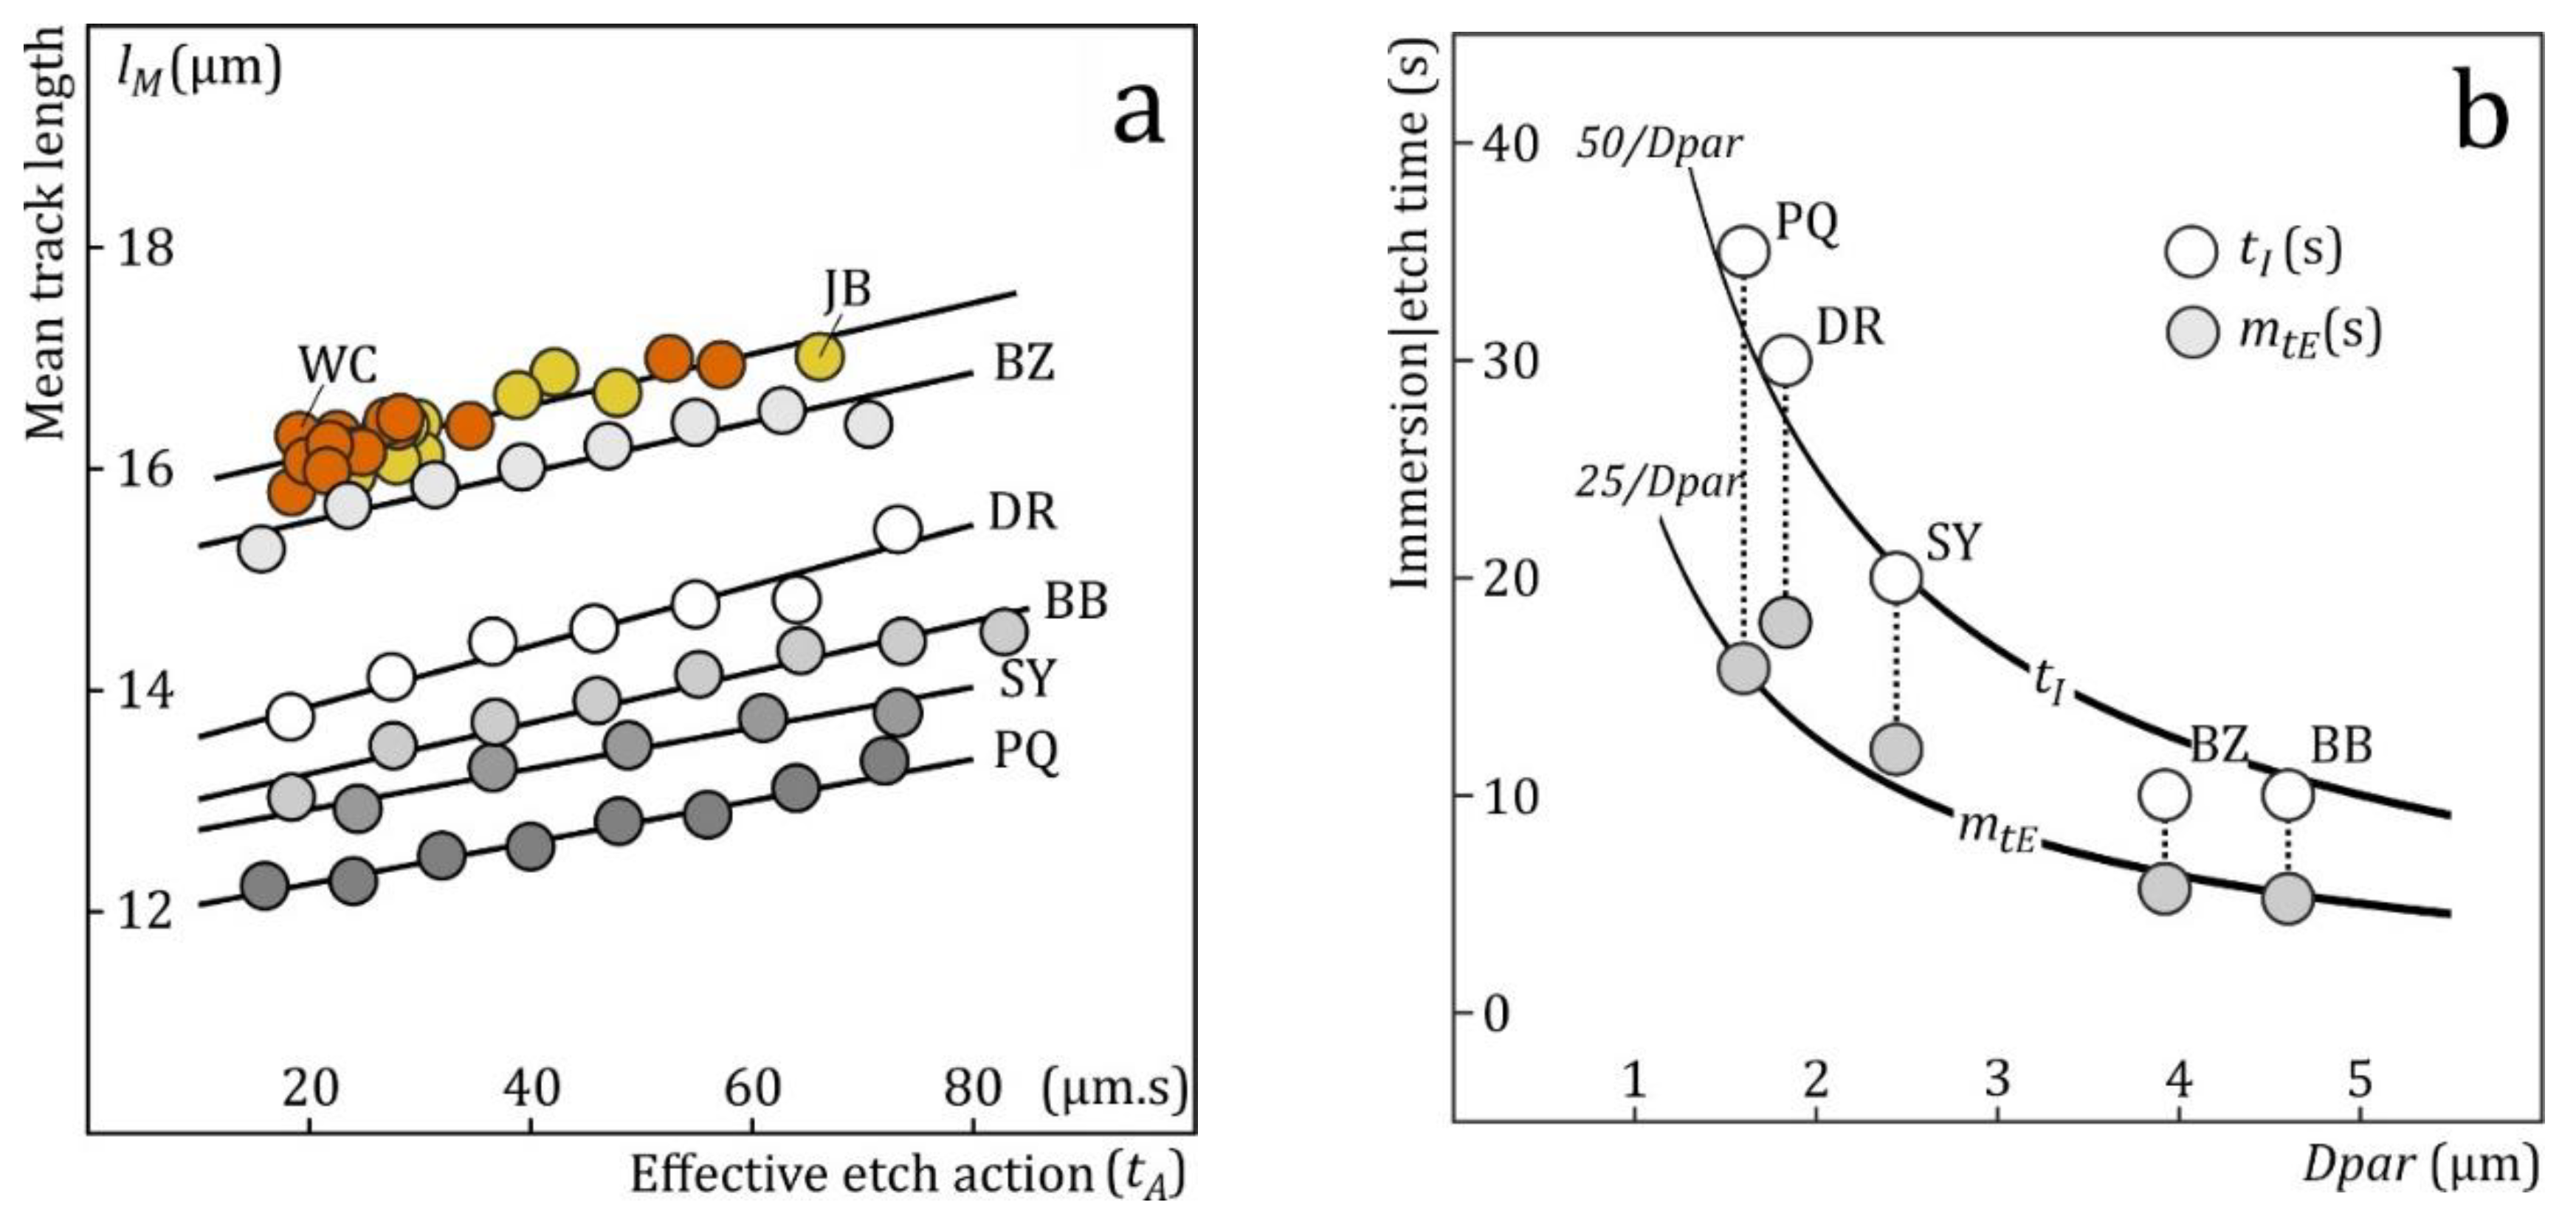
Figure 7a illustrates the power of
tA: it shows the mean interpolated lengths (
lM) of step-etched fossil confined tracks in five samples with different compositions, and
Dpar’s ranging from 1.6 µm to 4.6 µm, against
tA. From
tA ≳ 20 µm.s onward the rate of length increase in all five samples is the same. The constant rate also agrees with the fact that fossil tracks are in bulk etching at
tA ≳ 20 µm.s (
Figure 5b).
Figure 7a also shows the mean lengths of induced tracks in various apatites etched for the same immersion time (
tI) against
tA (Carlson et al., 1999: 20s in 5.5 M HNO
3 at 21 °C; Barbarand et al. 2003: 20s in 5.0 M HNO
3 at 20 °C; reported lengths corrected 2% for the lower etchant concentration; Tamer et al., 2019). Here, the trend for each dataset is due to different
Dpar, not different
tE. The striking fact that all the data define a common slope testifies to the fact that “etch action
tA” has physical meaning. It shows that track etching is not so complicated that each variable has to be considered on its own, and that confined track lengths can be corrected using a common rate. On closer inspection, the length data of Carlson et al. (1999;
Figure 1) and Barbarand et al. (2003;
Figure 8) show a slight drop at
Dpar ≲ 2 µm, suggesting that their immersion times (
tI = 20 s) are a little too short for the slowest etching samples (
tA ≲
Dpar × ½
tI = 20 µm.s;
Figure 6b). It seems useful to recommend selecting immersion times for apatite in inverse proportion to
Dpar (
tI =
k ×
Dpar−1;
Figure 7b), or, which amounts to the same thing, to step-etch different samples to the same
Dpar, as for zircon (Yamada et al., 1995). The value of
k can be decided based of the estimates that the mean and standard deviation of the effective etch time distribution of the confined tracks are
mtE ≈ ½ ×
tI and
stE ≈ ⅕ ×
tI for a single immersion step (Fu et al., 2024).
6. Length vs. Angle
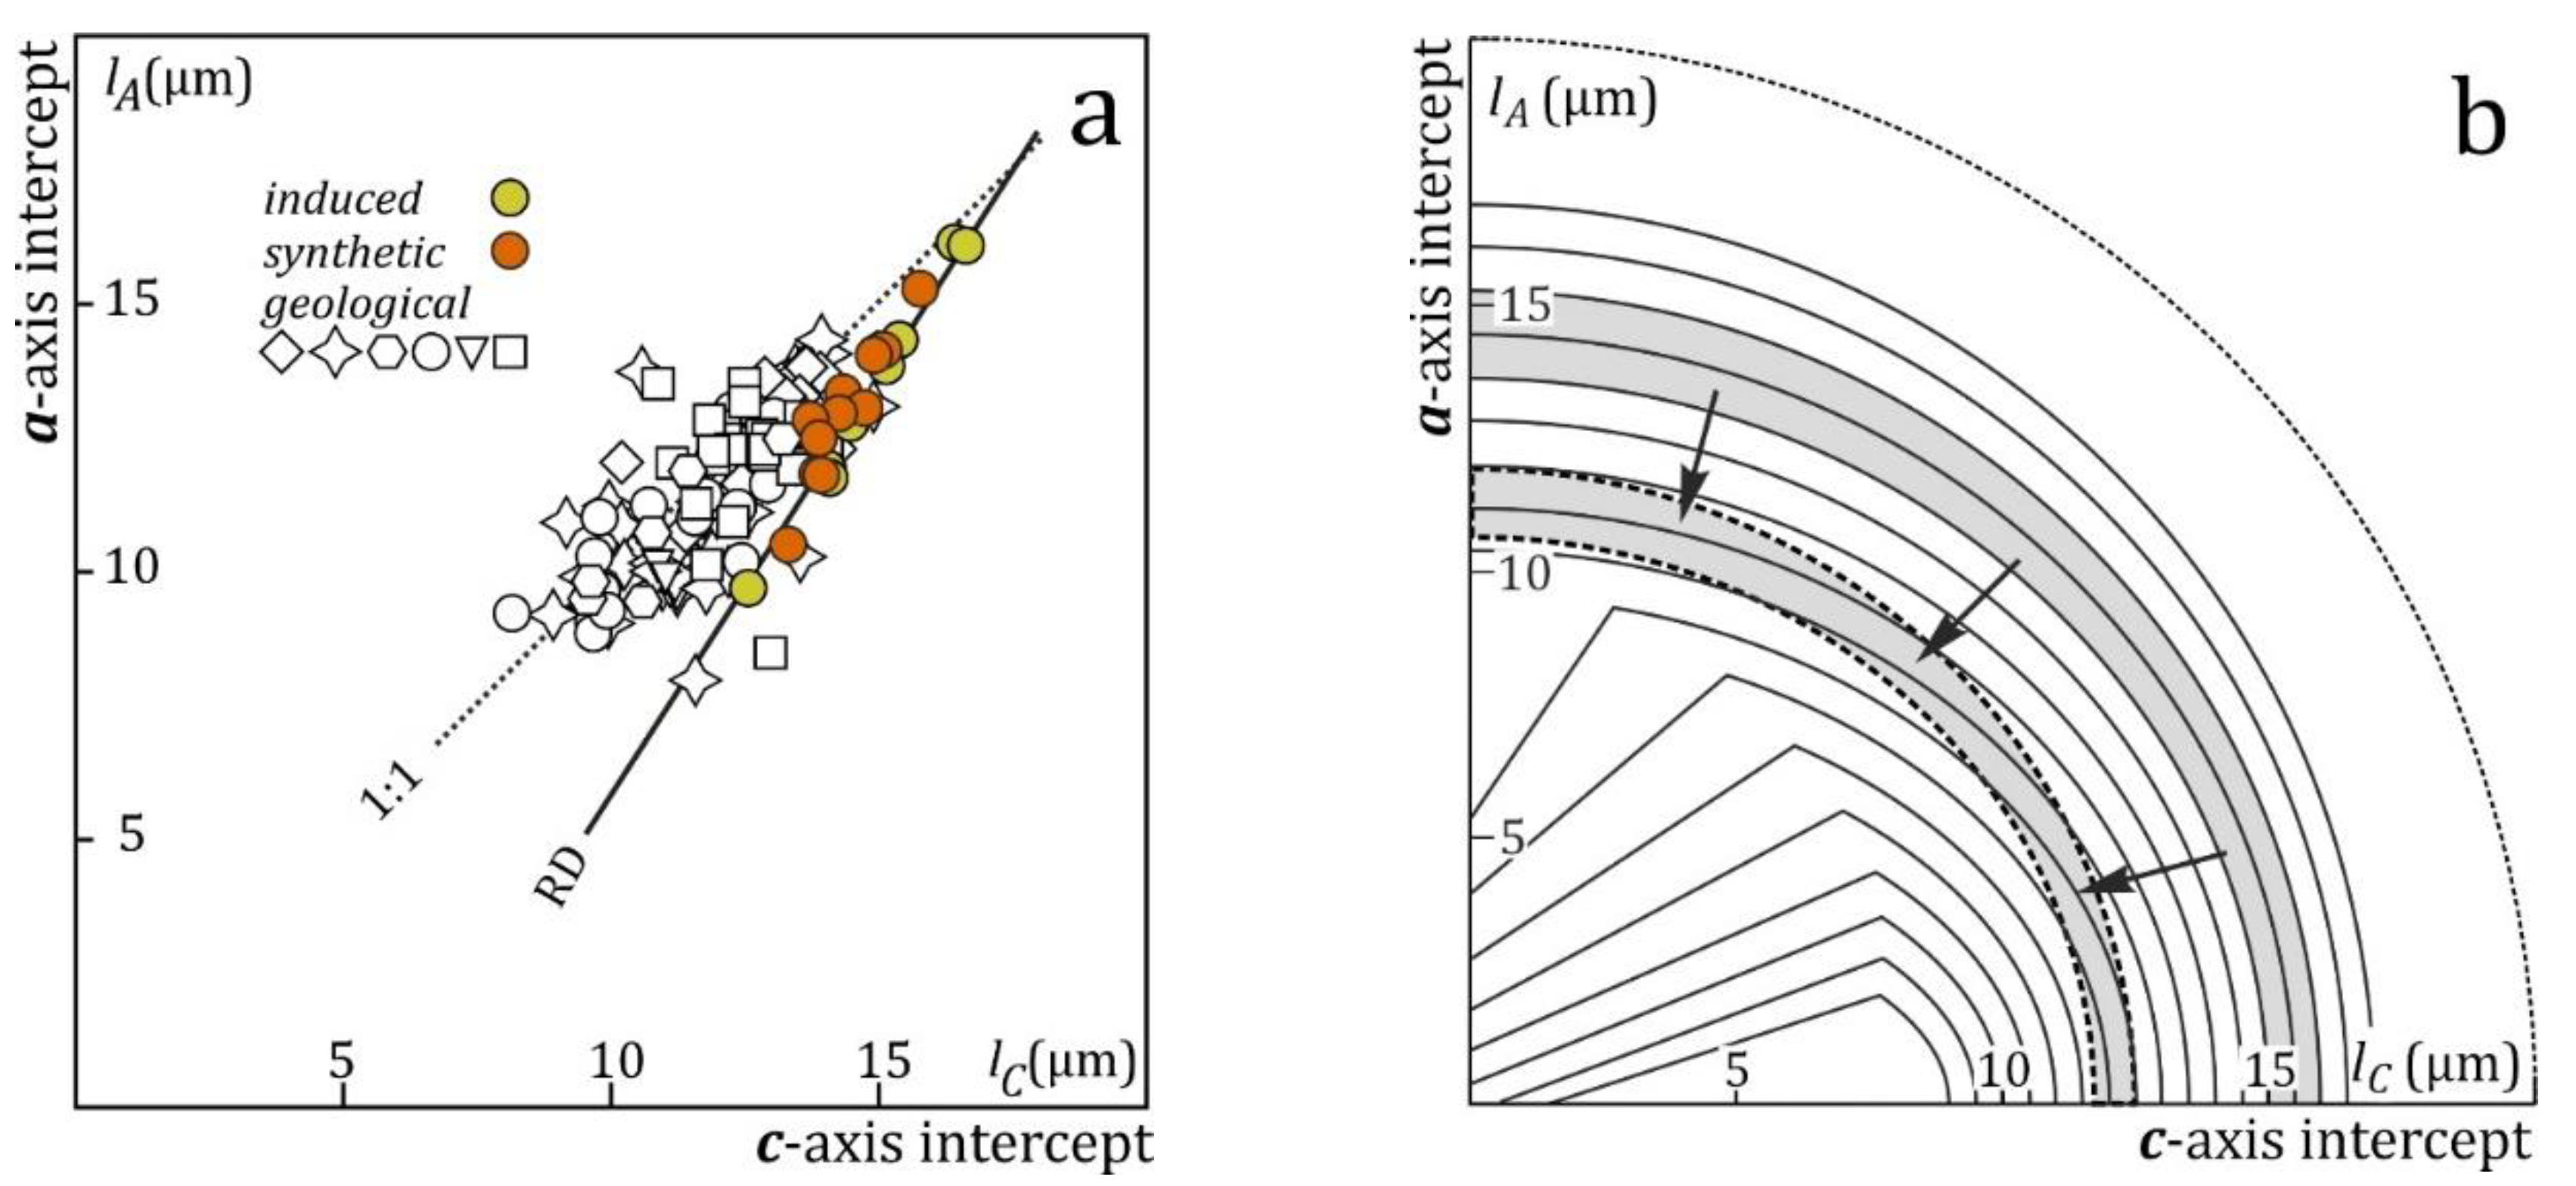
Figure 8a plots the
a- vs.
c-axis intercepts of ellipses fitted to the length vs. orientation data for different confined-track samples (Donelick, 1991). All the tracks in individual unannealed and annealed induced-track samples, with mean lengths from ~16 to ~10 µm, have “identical” thermal histories, and their
a- and
c-axis intercepts plot on a line:
lA = 1.632
lC -10.978 (Donelick et al., 1999; Ketcham, 2003). Tracks in the fossil-track samples, on the other hand, have different geological thermal histories. Most fossil-track data plot above the induced-track line, i.e., fossil tracks appear to be more isotropic than induced tracks of comparable length. This observation is consistent with one reported before based on 390 geological samples (Donelick et al., 1999, Figure 12), which was ascribed to suspected experimental factors related to the measurements and ellipse fitting. Although the scientists stressed the need for further investigation, none has been forthcoming. Length bias complicates fitting ellipses to complex populations because the differences between the constituent populations are greater at higher angles to the
c-axis. Unequal angular distributions of the constituent populations with different degrees of annealing (Ketcham, 2003,
Figure 5) changes the relative weights of the components at different
c-axis angles. Neither factor is expected to be of much consequence within the length-range of our samples however (
lC and
lA ≳ 10 µm). E.g., the simulated complex samples in
Figure 8a deviate little from the induced-track line, even though several have standard deviations greater than 2.5 and even 3 µm.
The offset of the fossil-track data from the induced-track model is in our opinion due to the fact that fossil tracks are under-etched compared to induced tracks etched with the same protocol.
Figure 8b shows how an isotropic length deficit (arrows) results in more isotropic lengths than expected for a given mean. It also shows that
c-axis projection over-estimates the
c-axis equivalents of high-angle tracks relative to those of low-angle tracks although both, of course, underestimate their true values. Apart from the ample data of Donelick et al. (1999) and in
Figure 8a, etch experiments indicate that fossil track do not etch in the same manner as induced tracks (
Figure 6b) and there are indications from direct
vT-measurements that the average track etch rate of fossil tracks is lower than that of induced tracks in Durango apatite (Aslanian et al., 2021; Jonckheere, 2023).
We interpolated the step-etch data (
Figure 6;
supplement Figure S3) to obtain the track lengths at fixed effective etch times, and fitted ellipses to the length vs. orientation data (
Figure 9a) and straight lines to the
c-axis-projected lengths vs. orientation (
Figure 9b). At
tE = 10-15 s, the track lengths are more isotropic than the model prediction, and the
c-axis projection over-corrects the high-angle data, causing the line of
c-axis-projected lengths vs. angle to have a positive slope. With increasing
tE, the track lengths increase at about the same rate in all directions (
Figure 5d) until, at
tE = 20-30 s, they are consistent with the model, and
c-axis projection produces a horizontal line (
Figure 9b). With continued etching the relationship is inverted as the track lengths become more anisotropic than the model predicts, and
c-axis projection produces a line with a negative slope. T,t-modelling of under- or over-etched tracks produces artefactual thermal histories. A plot of
c-axis-projected lengths vs. orientation is thus a powerful tool for detecting such artefacts. It is reasonable to assume that track lengths consistent with this model are the best estimates of their true values, regardless of the etch protocol that produced them (Trilsch et al., 2024). The best fit is obtained for effective etch times between 20 and 30 s, which correspond to longer immersion times than those of the annealing experiments on which the model is based (Carlson et al., 1999; Donelick et al., 1999). Because of differences between fossil and induced tracks (
Figure 6b), and between scientists’ selection criteria, it is not clear that strict adherence to the protocols underlying the annealing equations guarantees correct results, much like strict adherence to the ζ-procedure does not ensure accurate ages (Gleadow et al., 2019; Jonckheere et al., 2024).
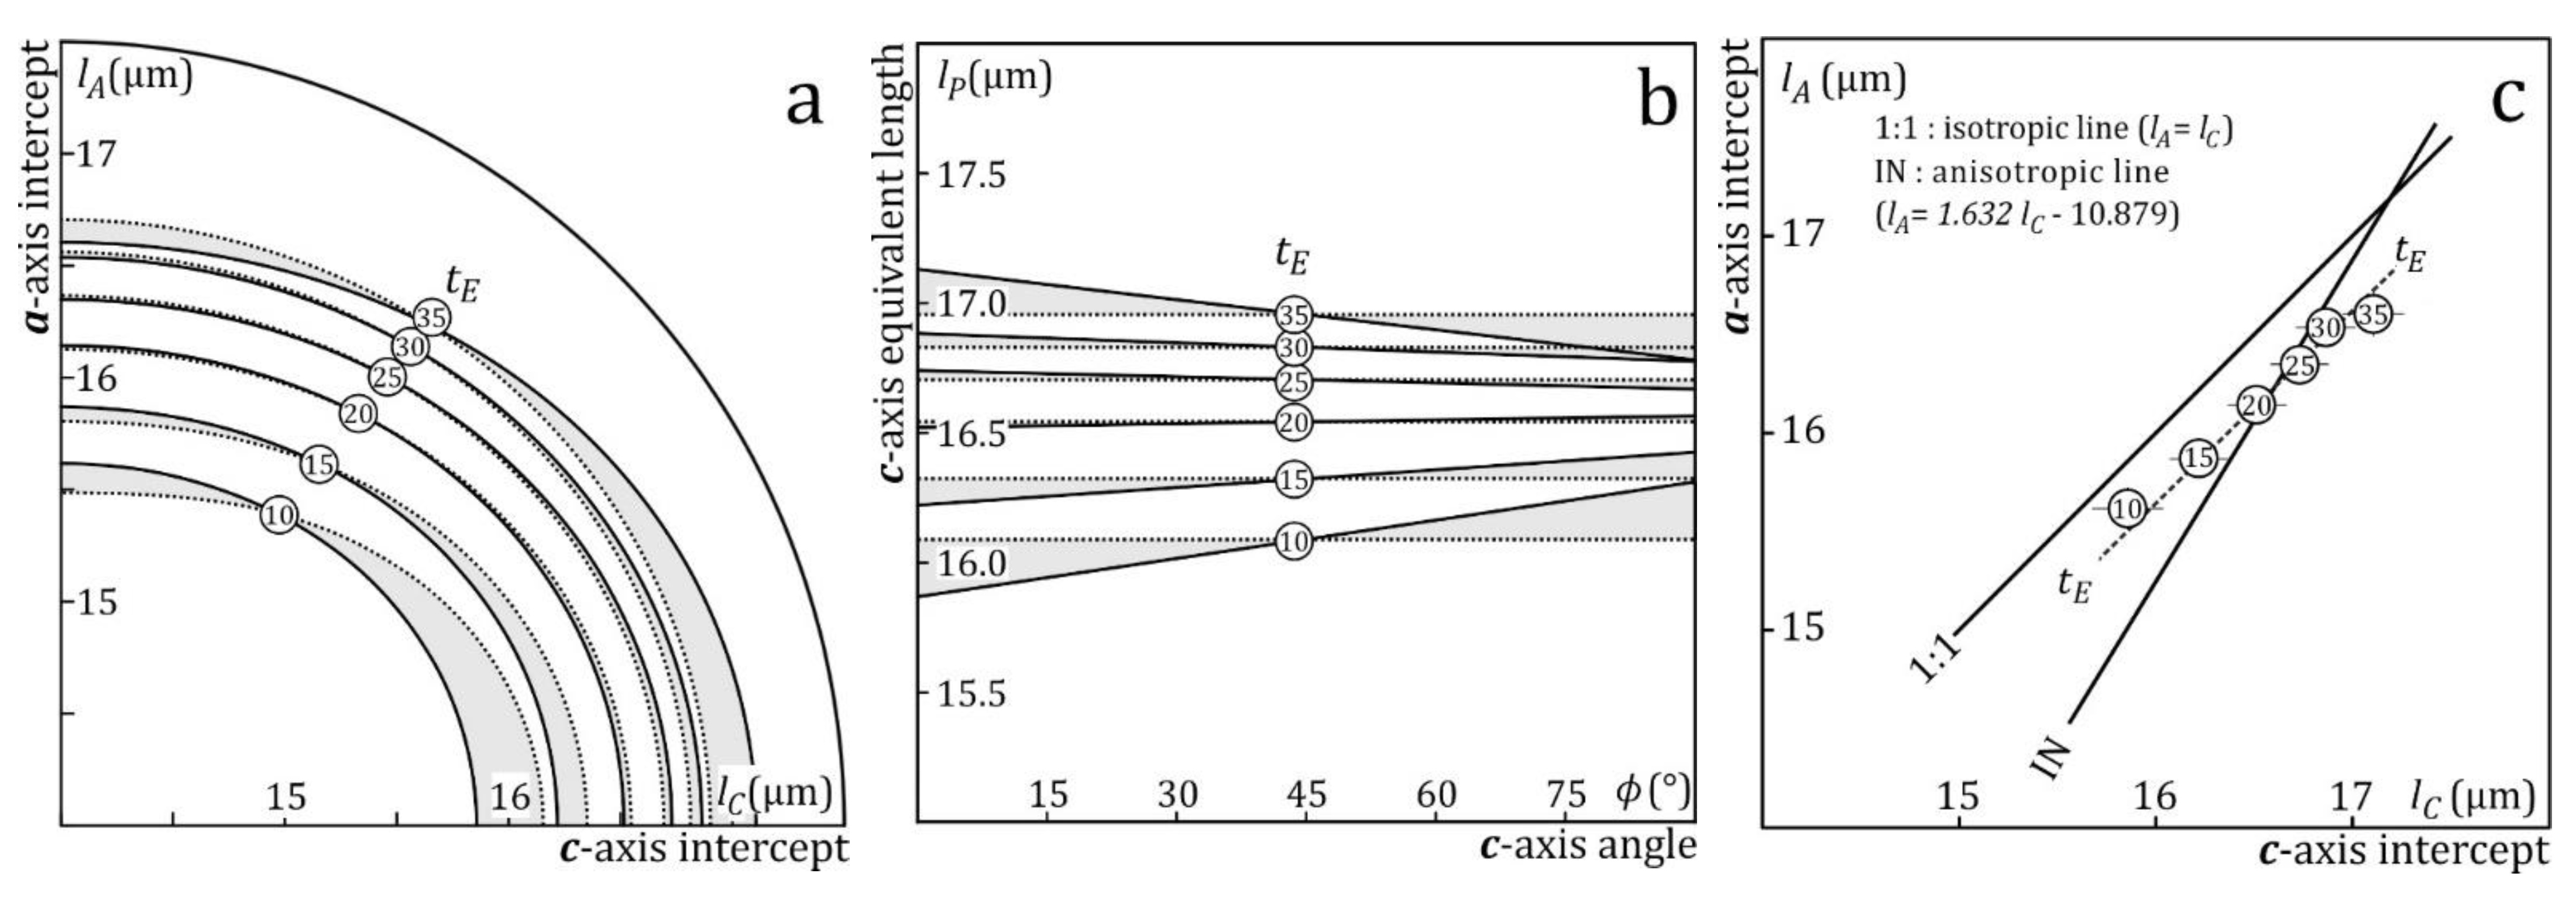
Figure 9c plots the
a-axis intercepts vs.
c-axis intercepts of ellipses fitted to the orientations and interpolated lengths of induced tracks in Durango apatite at effective etch times
tE = 10 – 35 s. At short
tE, the data plot above the model line for induced tracks, towards the isotropic line. With increasing
tE,
lA and
lC increase at a diminishing rate (
Figure 6) parallel to the isotropic line (
Figure 5d) and between
tE = 20 and 30 s cross the induced-track line (Donelick, 1991; Donelick et al., 1999).
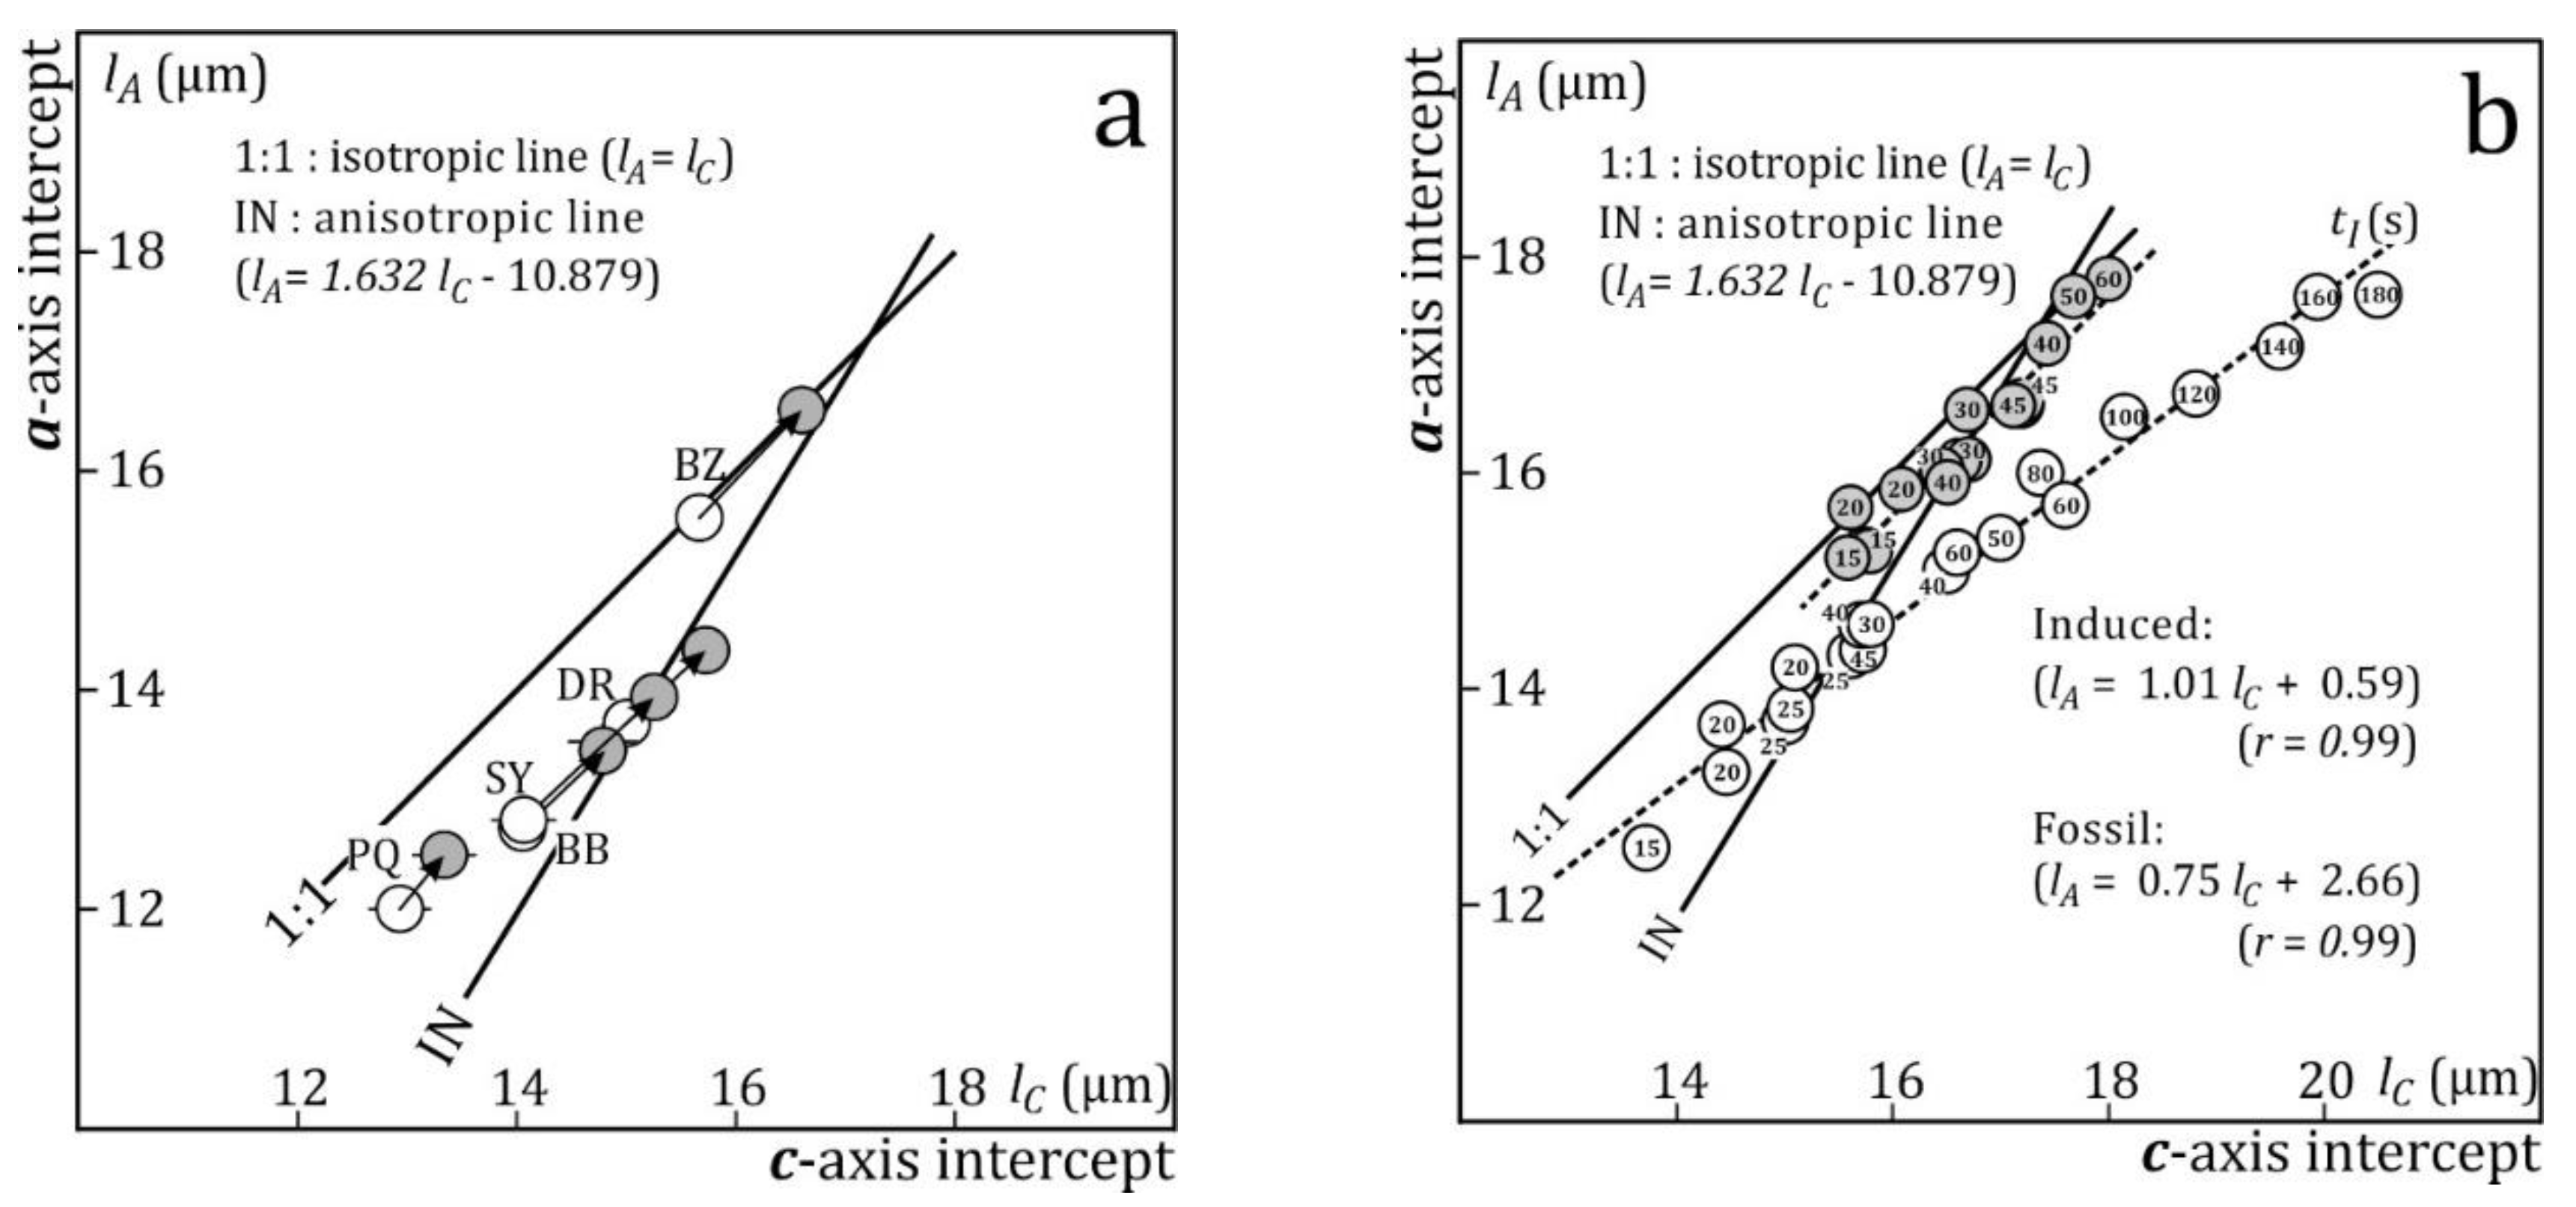
Figure 10a plots the data for step etched fossil-tracks in five apatite samples with different compositions and
Dpar (Fu et al., 2024). The measurements refer to consecutive immersion times rather than effective etch times but that is of no consequence for this discussion. After the first immersion for
tI ≈ 50/
Dpar (
Figure 7b), all samples except Durango plot above the model line for annealed induced tracks, towards the isotropic line, as did the under-etched induced tracks (
Figure 9c). Of the five samples, PQ has the shortest mean confined track length (
lM = 12.3 µm) with the greatest standard deviation (
σM = 1.7 µm). These values and those for all the samples are still well outside the limit for substantial departures from the model line either due to length bias or to unequal angular distributions of the constituents (Ketcham, 2003;
Figure 5; Jonckheere, 2023;
Figure 5). It is therefore reasonable to assume that the fossil tracks are still under-etched. Indeed, after an additional 15-s immersion, four out of five samples agree with the expected trend.
The increase of the fossil-track lengths after the second immersion appears to be isotropic, like that of the induced tracks. However more extensive step-etch data for fossil and induced tracks in Durango apatite (
Figure 10b) indicate that there is a difference. The increase of the induced track length is isotropic, but the lengths of low-angle fossil tracks appear to increase at a somewhat faster rate than those of high-angle tracks. This could be related to radiation damage or other defects in the unannealed samples, which have a greater effect on the etch rate of basal faces than on that of prism faces. Notwithstanding the lack of empirical evidence, this is a reasonable assumption because basal faces are F-faces, whose etch rate is more susceptible to defects than that of prism faces, which are S-faces (Hartmann and Perdok, 1955; Jonckheere et al., 2019;
Figure 4). It is not possible at this point to determine if this trend is the same for all fossil-track samples.
7. Conclusion
The related issues of etching protocol and track selection are difficult to untangle. There is to date no universal protocol for the different HNO
3-concentrations in use in different laboratories. Based on our experiments with 5.5 M HNO
3 at 21 °C (Carlson et al., 1999), we propose that the immersion time should be matched to the apatite etch rate, e.g.,
tI (s) ≈ 50 (µm.s)/
Dpar (µm), assuming that
Dpar is known. This is equivalent to etching different apatites to the same
Dpar. The calculated immersion time for Durango apatite is
tI ≈ 50/1.85 ≈ 27 s. This is just an estimate; in practice we used
tI = 30 s, which produces a large number of confined tracks terminated by basal and prism faces at both ends (
Figure 1b), enabling consistent length measurements by experienced scientists, and permitting to orient individual tracks relative to the
c-axis. The
Dpar-criterion implies that different immersion times are required for the components of multi-compositional samples. However, provided it is long enough, the immersion time is not so critical if the effective etch times (
tE) of the selected tracks are calculated from their measured widths. Then, whether the sample is mono- or multi-compositional, it is possible to select subsets of the confined tracks, in accordance with each grains’
Dpar, that are considered suitable for modelling. Up to a point, the etchant concentration and immersion time are interchangeable in well-stirred solutions at constant temperature (Jonckheere et al., 2017). While it is not to be relied upon, this could provide an initial estimate of the appropriate immersion time for weaker etchants than used in this work, until such time as an empirical relationship is established.
In general, this helps secure an adequate sample of well-etched tracks, but it does not guarantee that they are suitable for modelling. The lengths of fossil tracks in geological samples are often found to be more isotropic than expected for their average values, due to the fact that they are under-etched compared to induced tracks annealed to the same length. This should be assumed if a regression line to lP vs. ϕ has a positive slope or if the semi-axes of a fitted ellipse (lC, lA) plot left of the induced-track line. In that case an additional etch can increase the track lengths to a point where they are consistent with the accepted model based on annealing of induced tracks, a condition for valid thermal histories. It is not clear how long a second immersion should be, or even whether model-consistent track lengths can be obtained within practical etch-time limits. However if the widths of confined tracks are measured along with their lengths and orientations, it should be possible to select a subset with effective etch times that are consistent with the model. If a second etch is not possible, e.g., because the mount was irradiated after the first etch, one might attempt to achieve the same result with numerical means, i.e., by increasing the measured lengths by a fixed amount until the regression line to lP vs. ϕ is flat or (lC, lA) plot on the model line. For the purpose of modelling this can be approximated by lowering the “zero-length” (l0), albeit to values well below any measured initial lengths or any calculated from compositional data. These remedies are indeed quite imperfect but the alternative of modelling fossil track data that are inconsistent with the model assumptions is unlikely to give valid thermal histories.
There is a growing interest in integrating thermochron data on regional and larger scales. This can involve merging newer and older data from labs using different protocols. We suggest that, where the track lengths and angles are available, the lP vs. ϕ and lA vs. lC plots mentioned above can help to evaluate the thermal histories. If unirradiated mounts are available, an additional etch and re-measurement, including the track widths as well as their lengths and angles, could be worthwhile. It would be interesting to see how this affects the intriguing recent worldwide exhumation, and the geological bias for curvilinear equations over lab-based linear annealing equations.
Supplementary Materials
The following supporting information can be downloaded at the website of this paper posted on Preprints.org, Figure S1: Comparison of independent track-length
(a-c) and effective-etch-time
(d-f) measurements by two analysts. For both measurements the agreement between them is greater for samples etched 30 s in 5.5 M HNO
3 at 21 °C than for those etched 15 s, but does not improve thereafter. Figure S2: Measurement of dipping confined induced fission tracks is ion-irradiated prism faces of Durango apatite; dark shading: apparent length vs. apparent angle (
Figure 4:
h vs.
α); light shading: true length vs. true
c-axis angle (
l vs.
β); white:
c-axis equivalent length vs.
c-axis angle (
lP vs.
β).
(a) unannealed;
(b) annealed 1h at 300 °C;
(c) annealed 1h at 300 °C;
(d) annealed 1h at 300 °C. Figure S3: Lengths of horizontal confined tracks vs. effective etch time; the lines connect the measurements for each track after 15 s, 30 s, and 45 s immersion in 5.5 M HNO3 at 21 °C;
(a) induced tracks;
(b) fossil tracks. Video supplement: transmitted-light microscope image of the prism face of an apatite from the
Kontinentale Tiefbohrung (1129 m); the mount was irradiated with 11.1 MeV/amu Xe-ions at 15°, and etched 40 s in 5.5 M HNO
3 at 21 °C, revealing numerous confined tracks throughout the grain.
Author Contributions
Conceptualization, Administration, Funding Acquisition, Supervision, Original Draft: R.J.; Methodology; Validation; Formal Analysis; Investigation; Resources; Data Curation; Writing; Visualization, R.J., C.A., H.F., F.T.
Funding
This research was funded by the German Research Council (Deutsche Forschungsgemeinschaft project Jo 358/4).
Data Availability Statement
Original data for this research are included in the supplements; other data are used are the from cited publications.
Acknowledgments
We are indebted to F. Krieger and L. Sarkosh for contributions to the data, to C. Trautmann and E. Toimil-Molares for irradiations at the GSI Helmholtzzentrum für Schwerionenforschung in Darmstadt, and to Jie Liu for irradiations at the HIRFL Heavy Ion Research Facility in Lanzhou, P.R. China.
References
- Aslanian C., Jonckheere R., Wauschkuhn B., Ratschbacher L. (2021) A quantitative description of fission-track etching in apatite. American Mineralogist 106, 518-526. [CrossRef]
- Aslanian C., Jonckheere R., Wauschkuhn B., Ratschbacher L. (2022) Short communication: Experimental factors affecting fission-track counts in apatite. Geochronology 4, 109-119. [CrossRef]
- Barbarand J., Hurford T., Carter A. (2003) Variation in apatite fission-track length measurement: implications for thermal history modelling. Chemical Geology 19, 77-106. [CrossRef]
- Carlson W.D., Donelick R.A, Ketcham R.A. (1999) Variability of apatite fission-track annealing kinetics: I. Experimental results. American Mineralogist 84, 1213-1223.
- Crowley K.D., Cameron M., Schaeffer L. (1991) Experimental studies on annealing of etched fission tracks in fluorapatite. Geochimica et Cosmochimica Acta 55, 1449-1465. [CrossRef]
- Donelick R.A. (1991) Crystallographic orientation dependence of mean etchable fission track length in apatite: An empirical model and experimental observations. American Mineralogist 76, 83-91.
- Donelick R.A., Ketcham R.A., Carlson W.D. (1999) Variability of apatite fission-track annealing kinetics: II. Crystallographic orientation effects. American Mineralogist 84, 1224-1234.
- Donelick R.A., Miller D.S. (1991) Enhanced tint fission track densities in low spontaneous track density apatites using 252Cf-derived fission fragment tracks: a model and experimental observations. Nuclear Tracks and Radiation Measurements 18, 301-307. [CrossRef]
- Donelick R.A., O’Sullivan P.B., Ketcham R.A. (2005) Apatite Fission-Track Analysis. Reviews in Mineralogy and Geochemistry 58, 49-94.
- Fleischer R.L., Price P.B. (1963) Charged particle tracks in glass. Journal of applied physics 34, 2903-2904. [CrossRef]
- Fleischer R.L., Price P.B., Woods R.T. (1969) Nuclear-particle-track identification in inorganic solids. Physical Review 188, 563-568. [CrossRef]
- Fu Hongyang, Trilsch F., Jonckheere R., Ratschbacher L. (2024) Compositional effects on the etching of fossil confined fission tracks in apatite. American Mineralogist, in press. [CrossRef]
- Galbraith, R.F. (2002). Some remarks on fission-track observational biases and crystallographic orientation effects. American Mineralogist 87, 991-995. [CrossRef]
- Galbraith, R.F. (2005) Statistics for fission track analysis. Interdisciplinary statistics series, eds. N. Keiding, B. Morgan, T. Speed, P van der Heijden. Chapman and Hall/CRC, Taylor and Francis Group, Boca Raton, 219 pp.
- Galbraith R.F., Laslett G.M., Green P.F., Duddy I.R. (1990) Apatite fission track analysis: geological thermal history analysis based on a three-dimensional random process of linear radiation damage. Philosophical Transactions of the Royal Society of London A332, 419-438. [CrossRef]
- Gleadow A.J.W. (1981) Fission track dating methods: what are the real alternatives? Nuclear Tracks 5, 3-14.
- Gleadow A.J.W., Duddy I.R., Green P.F., Lovering J.F. (1986b): Confined fission track lengths in apatite: a diagnostic tool for thermal history analysis. Contributions to Mineralogy and Petrology 94, 405-415.
- Gleadow, A., Kohn, B., Seiler, C., 2019. The future of fission-track thermochronology. In: M.G. Malusà and P.G. Fitzgerald, Eds., Fission-Track Thermochronology and its Application to Geology, Geography and Environment, 77-92.
- Green P.F., Duddy I.R., Gleadow A.J.W., Tingate P.R., Laslett G.M. (1986) Thermal annealing of fission tracks in apatite 1. A qualitative description. Chemical Geology (Isotope Geoscience Section) 59, 237-253. [CrossRef]
- Gross, R. (1918) On the theory of growth and dissolution processes of crystalline matter. Abhandlungen der mathematisch-physischen Klasse der königlichen Sächsischen Gesellschaft der Wissenschaften zu Leipzig 35, 137-202 (in German).
- Hartman P., Perdok W.G. (1955) On the relation between structure and morphology of crystals I. Acta Crystallografica 8, 49–52. [CrossRef]
- Heimann, R.B. (1975) Dissolution of crystals. Theory and practical application. Applied Mineralogy, 8, Springer, pp. 270 (in German).
- Hurford, A.J., 2019. An historical perspective on fission-track thermochronology. In: M.G. Malusà and P.G. Fitzgerald, Eds., Fission-Track Thermochronology and its Application to Geology, Geography and Environment, 3-23.
- Ito H. (2004). On a simple approach to increase TINT numbers in apatite. Fission Track News Letter 17, 1-7 (in Japanese with English abstract).
- Jonckheere R. (2023) On etching, selection and measurement of confined fission tracks in apatite. Geochronology Discussions [preprint]. [CrossRef]
- Jonckheere R., Aslanian C., Wauschkuhn B., Ratschbacher L. (2022) Fission-track etching in apatite: A model and some implications. American Mineralogist 107, 1190-1200. [CrossRef]
- Jonckheere R., Härtel B., Iwano H. (2024) Fission-track age calibration: Phi and Zeta, never the twain shall meet? Chemical Geology 648, 121898.
- Jonckheere, R., Ratschbacher, L. (2010). On sampling effects in apatite fission-track T,t-modelling. Abstracts of Thermo 2010, 12th International Conference on Thermochronology, Glasgow, 16-20 Au-gust 2010, p. 205.
- Jonckheere R., Tamer M.T., Wauschkuhn B., Wauschkuhn F., Ratschbacher L. (2017) Single-track length measurements of step-etched fission tracks in Durango apatite: “Vorsprung durch Technik”. American Mineralogist 102, 987-996. [CrossRef]
- Jonckheere R., Wauschkuhn B., Ratschbacher L. (2019) On growth and form of etched fission tracks in apatite: A kinetic approach. American Mineralogist 104, 569-579. [CrossRef]
- Ketcham R.A. (2003) Observations on the relationship between crystallographic orientation and biasing in apatite fission-track measurements. American Mineralogist 88, 817-829. [CrossRef]
- Ketcham R.A. (2005) Forward and inverse modeling of low-temperature thermochronometry data. Reviews in mineralogy and geochemistry 58(1), 275-314. [CrossRef]
- Ketcham R.A., Carter A., Hurford A.J. (2015) Inter-laboratory comparison of fission track confined length and etch figure measurements in apatite. American Mineralogist 100, 1452-1468. [CrossRef]
- Ketcham R.A., van der Beek P., Barbarand J., Bernet M., Gautheron C. (2018) Reproducibility of thermal history reconstruction from apatite fission-track and (U-Th)/He data. Geochemistry, Geophysics, Geosystems 19, 2411–2436.
- Kohn B. P., Gleadow A. J. W., Brown R. W., Gallagher K., O’Sullivan P. B. and Foster D. A. (2002) Shaping the Australian crust over the last 300 million years: insights from fission track thermotectonic imaging and denudation studies of key terranes. Australian Journal of Earth Science 49, 697–717. [CrossRef]
- Laslett G.M., Gleadow A.J.W., Duddy I.R. (1984) The relationship between fission track length and track density in apatite. Nuclear Tracks 9, 29-38. [CrossRef]
- Laslett G.M., Kendall W.S., Gleadow A.J.W., Duddy I.R. (1982) Bias in measurement of fission-track length distributions. Nuclear Tracks 6, 79-85. [CrossRef]
- Li Qingyang, Gleadow A., Seiler C., Kohn B., Vermeesch P., Carter A., Hurford A. (2018) Observations on three-dimensional measurement of confined fission track lengths in apatite using digital imagery. American Mineralogist 103, 430-440. [CrossRef]
- Maurette M. (1966) Investigation of heavy ion tracks in natural minerals of terrestrial and extra-terrestrial origin. Bulletin de la Société Française de Minéralogie et Cristallographie 89, 41-75 (in French).
- Miller, D.S., Crowley, K.D., Dokka, R.K., Galbraith, R.F., Kowallis, B.J., Naeser, C.W., 1993. Results of interlaboratory comparison of fission-track ages for the 1992 fission track workshop. Nuclear Tracks and Radiation Measurements 21, 565-573. [CrossRef]
- Moreira P.A.F.P., Guedes S., Iunes P.J., Hadler J.C. (2010) Fission track chemical etching kinetic model. Radiation Measurements 45, 157–162. [CrossRef]
- Paul T.A., Fitzgerald P.G. (1992) Transmission electron microscopic investigation of fission tracks in fluorapatite. American Mineralogist 77, 336-344.
- Price P.B., Walker R.M. (1962) Chemical etching of charged particle tracks. Journal of Applied Physics 33, 3407-3412.
- Sobel E.R., Seward D. (2010) Influence of etching conditions on apatite fission-track etch pit diameter. Chemical Geology 271, 59-69. [CrossRef]
- Spiegel C., Kohn B., Raza A., Rainer T., and Gleadow A.J.W. (2007) The effect of long-term low-temperature exposure on apatite fission track stability: A natural annealing experiment in the deep ocean. Geochimica et Cosmochimica Acta 71, 4512-4537 (doi:10.1016/j.gca.2007.06.060).
- Tagami T., O’Sullivan P.B. (2005) Fundamentals of fission-track thermochronology. Reviews in Mineralogy and Geochemistry 58, 19-47. [CrossRef]
- Tamer M.T., Chung L., Ketcham R.A., Gleadow A.J.W. (2019) Analyst and etching protocol effects on the reproducibility of apatite confined fission-track length measurement, and ambient-temperature annealing at decadal timescales. American Mineralogist 104, 1421-1435.
- Tamer M.T., Ketcham R.A. (2020) The along-track etching structure of fission tracks in apatite: Observations and implications. Chemical Geology 553, 119809. [CrossRef]
- Tamer M.T., Ketcham R.A. (2023) How many vs. which: On confined track selection criteria for apatite fission track analysis. Chemical Geology 634, 121584. [CrossRef]
- Trilsch F., Fu Hongyang, Jonckheere R., Ratschbacher L. (2024) Effective etch times of fossil fission tracks in geological apatite samples and impact on temperature-time modelling. Lithosphere 2023, Number Special 14, Article ID lithosphere_2023_339, 17. [CrossRef]
- Watt S., Durrani S.A. (1985) Thermal stability of fission tracks in apatite and sphene: using confined track length measurements. Nuclear Tracks 10, 349-357.
- Watt S., Green P.F., Durrani S.A. (1984) Studies of annealing anisotropy of fission tracks in mineral apatite using track-in-track (tint) length measurements. Nuclear Tracks and Radiation Measurements 8, 371-375. Wulff, 1901. [CrossRef]
- Yamada R., Yoshioka T., Watanabe K., Tagami T., Nakamura H., Hashimoto T., Nishimura S. (1998) Comparison of experimental techniques to increase the number of measurable confined fission tracks in zircon. Chemical Geology 149, 99-107. [CrossRef]
- Yamada R., Tagami T., Nishimura S. (1995) Confined fission track length measurement in zircon: assessment of factors affecting the paleotemperature estimate. Chemical Geology (Isotope Geoscience Section) 119, 293-30. [CrossRef]
Figure 1.
Unannealed induced horizontal confined track in Durango apatite after (a)15s, (b) 30 s, and (c) 45 s immersion in 5.5 M HNO3 at 21 °C, and superimposed outlines (d). The host track intersects at ¼ track length from endpoint α.
Figure 1.
Unannealed induced horizontal confined track in Durango apatite after (a)15s, (b) 30 s, and (c) 45 s immersion in 5.5 M HNO3 at 21 °C, and superimposed outlines (d). The host track intersects at ¼ track length from endpoint α.
Figure 2.
(a) An etched single-crystal sphere reveals that rounded shapes are not its natural boundaries (modified, after Heimann, 1975) (b) The rounded track tip at γ in
Figure 1 is the result of a decreasing track etch rate (motorboat effect), caused by an intermittent latent track structure (Paul and Fitzgerald, 1992).
Figure 3.
(a-b) two grains etched for 40 s in 5.5 M HNO3 at 21 °C illustrate the contrast between fast- and slow-etching surfaces; (c) the outline of a single track well-etched confined track allows to determine the c-axis azimuth.
Figure 3.
(a-b) two grains etched for 40 s in 5.5 M HNO3 at 21 °C illustrate the contrast between fast- and slow-etching surfaces; (c) the outline of a single track well-etched confined track allows to determine the c-axis azimuth.
Figure 4.
Calculation of the true length (l) and c-axis angle (β) of a dipping confined fission track (FT) from measurements of its projection (h) and that of a section of ion track (IT; p) extending over the same depth (v) as the fission track.
Figure 4.
Calculation of the true length (l) and c-axis angle (β) of a dipping confined fission track (FT) from measurements of its projection (h) and that of a section of ion track (IT; p) extending over the same depth (v) as the fission track.
Figure 5.
Track widths and etch rates vs. angle to the c-axis; (a) widths of induced confined tracks in Durango apatite after 15, 30 and 45 s immersion in 5.5 M HNO3 at 21 °C, vs. the c-axis angle of the track (ϕ); (b) apatite etch rate vR vs.c-axis angle of the etch rate vector (ϕ’ = 90 - ϕ); open symbols: calculated from the width increase from 15 to 30 s immersion; shaded: calculated from the increase from 30 to 45 s; dashed line: Aslanian et al. (2021); solid line: Fu et al., (2024); (c) track etch rate vT vs. angle to the c-axis; white: 15 s data; light shading: 30 s data, dark shading: 45 s data; the dashed lines are second-degree polynomial fits; (d) rate of length increase vL vs. angle to the c-axis; white: calculated from the length increase from 15 to 30 s immersion; shaded: calculated from the increase from 30 to 45 s.
Figure 6.
(a) Induced confined track lengths in Durango apatite plotted against the effective etch times calculated from their widths measured after 15 (white), 30 (light shading) and 45 s immersion (dark shading) in 5.5 M HNO3 at 21 °C; the histograms represent the effective-etch-time frequencies after 15, 30, and 45 s immersion; (b) arithmetic means of the interpolated induced and fossil track lengths normalized to their final values, plotted against effective etch time (tE; lower scale) and effective etch action (tA = tE × Dpar; upper scale); solid line: mean normalized lengths; dotted lines 2σ-confidence interval of the mean. The dashed red lines have been added to illustrate linear sections; the red band at the bottom a represents a possible suitable effective-etch time interval for fossil and induced tracks in Durango apatite.
Figure 7.
(a) Mean track length lM vs. etch action tA = Dpar × tE. Data: Aslanian et al. (2021; fossil tracks - DR), Fu et al. (2024; fossil tracks - BZ, BB, SY, PQ), Carlson et al. (1999; induced tracks - WC) and Barbarand et al. (2003; induced tracks - JB). In the samples with fossil tracks, variation along the tA-axis is due to step-etching and the associated increase of tE, while Dpar is constant for each sample. In the case of the induced-track data, apatites with different compositions (Dpar) were etched for the same immersion time tI. For plotting the data we assumed that their average effective etch times are half the immersion time: tE ≈ ½ tI. (b) Aslanian et al. (2021; DR) and Fu et al. (2024; PQ, SY, BZ, BB) used immersion times tI ≈ 50 × Dpar−1 for samples in the Dpar range 1.6-4.6 µm etched in 5.5 M HNO3 at 21 °C, resulting in mean effective etch times mtE ≈ 25 × Dpar−1.
Figure 8.
(a) a-axis vs. c-axis intercepts of ellipses fitted to (1) induced tracks annealed to different lengths (yellow), (2) artificial complex length distributions made by combining two to four induced-track samples into one (orange), (3) fossil-track samples from various geological studies (white). (b) conceptual illustration of how (isotropic) under-etching leads to more isotropic length distributions than expected for their mean lengths.
Figure 9.
(a) Unconstrained (solid lines) and constrained (
lA = 1.632
lC -10.978; Donelick et al., 1999 dotted lines) ellipses fitted to the interpolated length and angle data for effective etch times of 10, 15, 20, 25, 30 and 35 s.
(b) Unconstrained (solid) and constrained (dotted;
lA =
lC) lines fitted to the
c-axis projected lengths vs.
c-axis angles.
(c) The
a-axis intercepts vs.
c-axis intercepts of ellipses fitted to the interpolated lengths and orientations of step-etched induced confined tracks in Durango apatite (
Figure 9a).
Figure 10.
(b) The
a-axis intercepts vs.
c-axis intercepts of ellipses fitted to the lengths and orientations of step-etched fossil confined tracks in apatites with different compositions (open circles: first etch step; filled circles: second step). Immersion times for the first step are shown in
Figure 7b; the second measurement was performed after an additional immersion of 15 s in 5.5 M HNO
3 at 21 °C (Aslanian et al., 2021; Fu et al., 2024).
|
Disclaimer/Publisher’s Note: The statements, opinions and data contained in all publications are solely those of the individual author(s) and contributor(s) and not of MDPI and/or the editor(s). MDPI and/or the editor(s) disclaim responsibility for any injury to people or property resulting from any ideas, methods, instructions or products referred to in the content. |
© 2024 by the authors. Licensee MDPI, Basel, Switzerland. This article is an open access article distributed under the terms and conditions of the Creative Commons Attribution (CC BY) license (http://creativecommons.org/licenses/by/4.0/).
