1. Introduction & Overview of Caregiving in Canada
Family and friend caregivers continue to provide the vast majority of the care Canadians receive at home. In 2012, approximately 3 in 10, or 8.1 million Canadians provided care to a family member or friend with a long-term health condition or aging-related need (Turcotte, 2013). Most of this care is provided to aging parents, followed by a parent-in-law or another family member (excluding spouses, children and grandparents), a close friend or neighbor, a grandparent, a spouse, or a child (Turcotte, 2013).
Examining data from the 2012 General Social Survey (GSS) on Caregiving and Care Receiving, Sinha (2013) reports that at some point in their lives, nearly half (46%) of Canadians aged 15 and older have provided this care and that in 2012 women represented the slight majority of caregivers at 54%. Sinha (2013) also found that caregivers are most often between the ages of 45 and 64 (44%) while seniors (age 65 and over) are the least common group (12%). In 2012, the national average for providing care to an ill family member or friend was 28%. Regionally, people in Ontario (29%), Nova Scotia (31%), Manitoba (33%) and Saskatchewan (34%) were more likely to provide this type of care, while people on Quebec were less likely (25%) (Sinha, 2013). The author also revealed that people residing in Canada’s largest Census Metropolitan Areas (CMAs) (particularly Toronto, Montreal and Vancouver) were less likely to provide care compared to residents of smaller CMAs. The highest levels of care were found in rural areas, towns and smaller cities. Finally, with respect to income, Sinha (2013) reported that just over half (53%) of caregivers had a household income of more than $60,000 with 22% living in a household with an income of between $60,000 and $100,000 and 31% of $100,000 or more (the largest of any income group). In her analysis, Sinha did not examine ethnicity or immigrant status.
Although caregiving can be rewarding, it often results in poor caregiver health (Sherwood et al., 2005), increased use of health services, and most importantly to this study, financial impacts (Donner et al., 2015; Adelman et al., 2014; Bastawrous, 2013). Turcotte (2013) determined that all types of Canadian caregivers would have liked more governmental financial assistance than they received. He found that in 2012, 30% of caregivers of children received assistance but 52% would have liked more, and that 14% of caregivers of spouses received assistance, with 42% wanting more, and that 5% of caregivers of parents were in receipt of assistance, where-as 28% of would have liked more.
To date, it appears that little research has been directed at federal-level tax supports, which are a form of financial aid for those Canadians who undertake a caregiving role for any number of dependents. Given the high prevalence of caregivers and care-recipients in Canada, our objective is to explore the uptake of these supports in the hope that our findings may contribute to inform tax policy in a way that better supports caregivers moving forward. This is especially important considering the expected increase in older dependents following the baby-boomer demographic shift and population aging (Statistics Canada, 2018).
2. Canadian Tax Credits: The Caregiver Amount and the Family Caregiver Amount
All residents in Canada and non-residents (e.g., those living overseas who earned income in Canada) are required to report their income to the Canada Revenue Agency (CRA) when they file their annual tax return. In 2018, there were just over 27 million tax filers, representing about 73% of the total Canadian population and about 93% of people aged 20 and over (Milke 2017). The amount of tax one pays is based on their taxable income for the previous year, after tax credits and deductions are accounted for. Tax credits reduce the tax owing, where-as tax deductions reduce taxable income that is used to calculate tax owing. Tax credits are based upon a number of considerations and are targeted at individuals of varying situations that are deemed worthy of governmental aid including new home buyers; those receiving higher education; new parents, and those with disabilities. The number and type of tax credits vary by Canadian province. For example, in Ontario in 2020, there are 25 non-refundable and 6 refundable tax credits available to tax filers, as well a number of other credits and grants (Canada Revenue Agency, 2021).
There are several tax credits related to caregiving in Canada. In this paper, we focus on the Caregiver Amount (defined below) as we believe it to be the credit most directed at unpaid family caregivers and one of the most commonly received. Introduced in 1998, this tax credit is targeted at caregivers (tax filers) of dependent relatives permanently residing with the caregiver, who are either 18 years or older and physically and/or mentally infirm, or simply age 65 or older. The amount can be claimed for any number of dependents, so long as they all individually qualify (Canada Revenue Agency, 2011). Thus, the Caregiver Amount can be claimed in situations where the dependent is not physically or mentally impaired. This includes having a parent or grandparent aged 65 and over. There is no income restriction on a tax filer claiming the amount, but the dependent must have had a net income of less than the specified amount for the tax year (e.g., $17,745 in 2007). The tax filer cannot claim this amount for someone that is only visiting them. The Family Caregiver Amount (FCA) was established in 2012 and is an additional tax credit for caregivers of dependents with a physical or mental impairment. It does not replace the Caregiver Amount but rather provides for an additional amount of up $2,000. Only a minority of caregivers received the tax credit in 2012, with only 3% of those who provided care to their parents receiving it, in comparison to 28% of those who cared for their child (Turcotte, 2013).
A profile for the Caregiver Amount will now be provided using 2011 Canadian currency and amounts ($CDN). This is prior to 2012 (the year of the introduction of the FCA), thus, this calculation does not incorporate the FCA. The calculation of the Caregiver Amount for one dependent is the ‘Base Amount’ specified for that year - $18,906, less the dependent’s net income for that year. This value cannot exceed the ‘Max Amount’ specified for the year, $4,282. If it does, only the ‘Max Amount’ may be claimed. Only one claim can be made per dependent (e.g., if they have two caregivers, only one may claim the Caregiver Amount). As mentioned, the actual credit for this amount is the federal non-refundable tax credit rate multiplied by the calculated amount value. At a rate of 15 percent, the maximum final credit received by a tax filer for one qualified dependent would be roughly $642 for a year of unpaid care for a low-earning dependent (Canada Revenue Agency, 2011). One issue illustrated here is the relatively small size of this monetary support compared to the financial impact a year of caregiving would entail. Not accounting for time or energy expended in providing care, the out-of-pocket expenses that caregivers spend related to their caregiving role appear to vary, from a median of $300 in the last 12 months for caregivers of extended kin and non-kin to between $1,900-$2,300 for those caring for immediate family members (Turcotte, 2013).
As stated, the objective of this paper is to examine the uptake of these caregiving tax credits to determine if they are being fully utilized by the broad spectrum of people who provide caregiving as an essential (and in many cases complex and arduous) daily activity. We argue that for a tax credit to be successful as a policy instrument it needs to be sufficiently realized by the targeted population. The financial benefits derived by the credit (even if they are modest in some cases) are important in helping caregivers and care receivers cope with the economic strain that they can find themselves in. Based on the review of the profile of caregivers in Canada, as described above including the analysis by Turcotte (2013) and Sinha (2013), we would expect that the distribution of the uptake in the caregiver credits would: favour women, those aged 45 to 64, people living in households with lower incomes (less than $100,000), residents of Ontario and the Prairies, and caregivers residing in rural areas and small towns.
3. Data & Methods
Statistics Canada’s Longitudinal Administrative Databank (LAD) (1998 to 2015) was employed in the study. The LAD is a subset of the T1 Family File (T1FF). The T1FF is a yearly cross-sectional file of all tax filers and their families. The LAD is a random, 20% sample of the T1FF. Selection for the LAD is based on an individual’s social insurance number (SIN). There is no age restriction, but people without a SIN can only be included in the family component. Once a person is selected for the LAD, the individual remains in the sample and is picked up each year from the T1FF if he or she appears on the T1 that year. The T1FF is a modified file of the T1, which is the annual tax form submitted to the CRA by tax filers in Canada. Our research employed records for the entire LAD (20% of tax filers) and did not consist of a sub-sample. To protect confidentiality, Statistics Canada provides a disturbance measure that must be applied to all analysis. In addition, vetted output must be weighted and rounded to reflect the Canadian population. In our case, this meant multiplying cases by 5 (since the LAD is a 20% sample) and further rounding. Therefore, the results presented in our paper are based on weighted and rounded measures.
We created graphs that tracked the uptake of the Caregiver Amount from 1998 to 2015 among various population groups. All graphs and analysis were done using statistical software Stata 15. These graphs track what we refer to as the ‘uptake ratio’ of the Caregiver Amount. That is, the proportion (or percentage) of tax filers from a particular group that has received some positive amount of the tax credit within a year, compared to the total tax filer population of that same group for that year. The socio-demographic subcategories of analysis used (groups of peoples based on certain characteristics) were:
Geographic region of permanent residence;
Income percentile group;
Gender (male, female);
Population density of area of permanent residence;
Age cohort (group), and;
Immigration status (immigrant or non-immigrant).
It should be noted that the LAD’s definition of an immigrant refers to only those who arrived in Canada between 1980 and 2015.
4. Results: Uptake of the Caregiver Amount from 1998 to 2015
4.1. Region
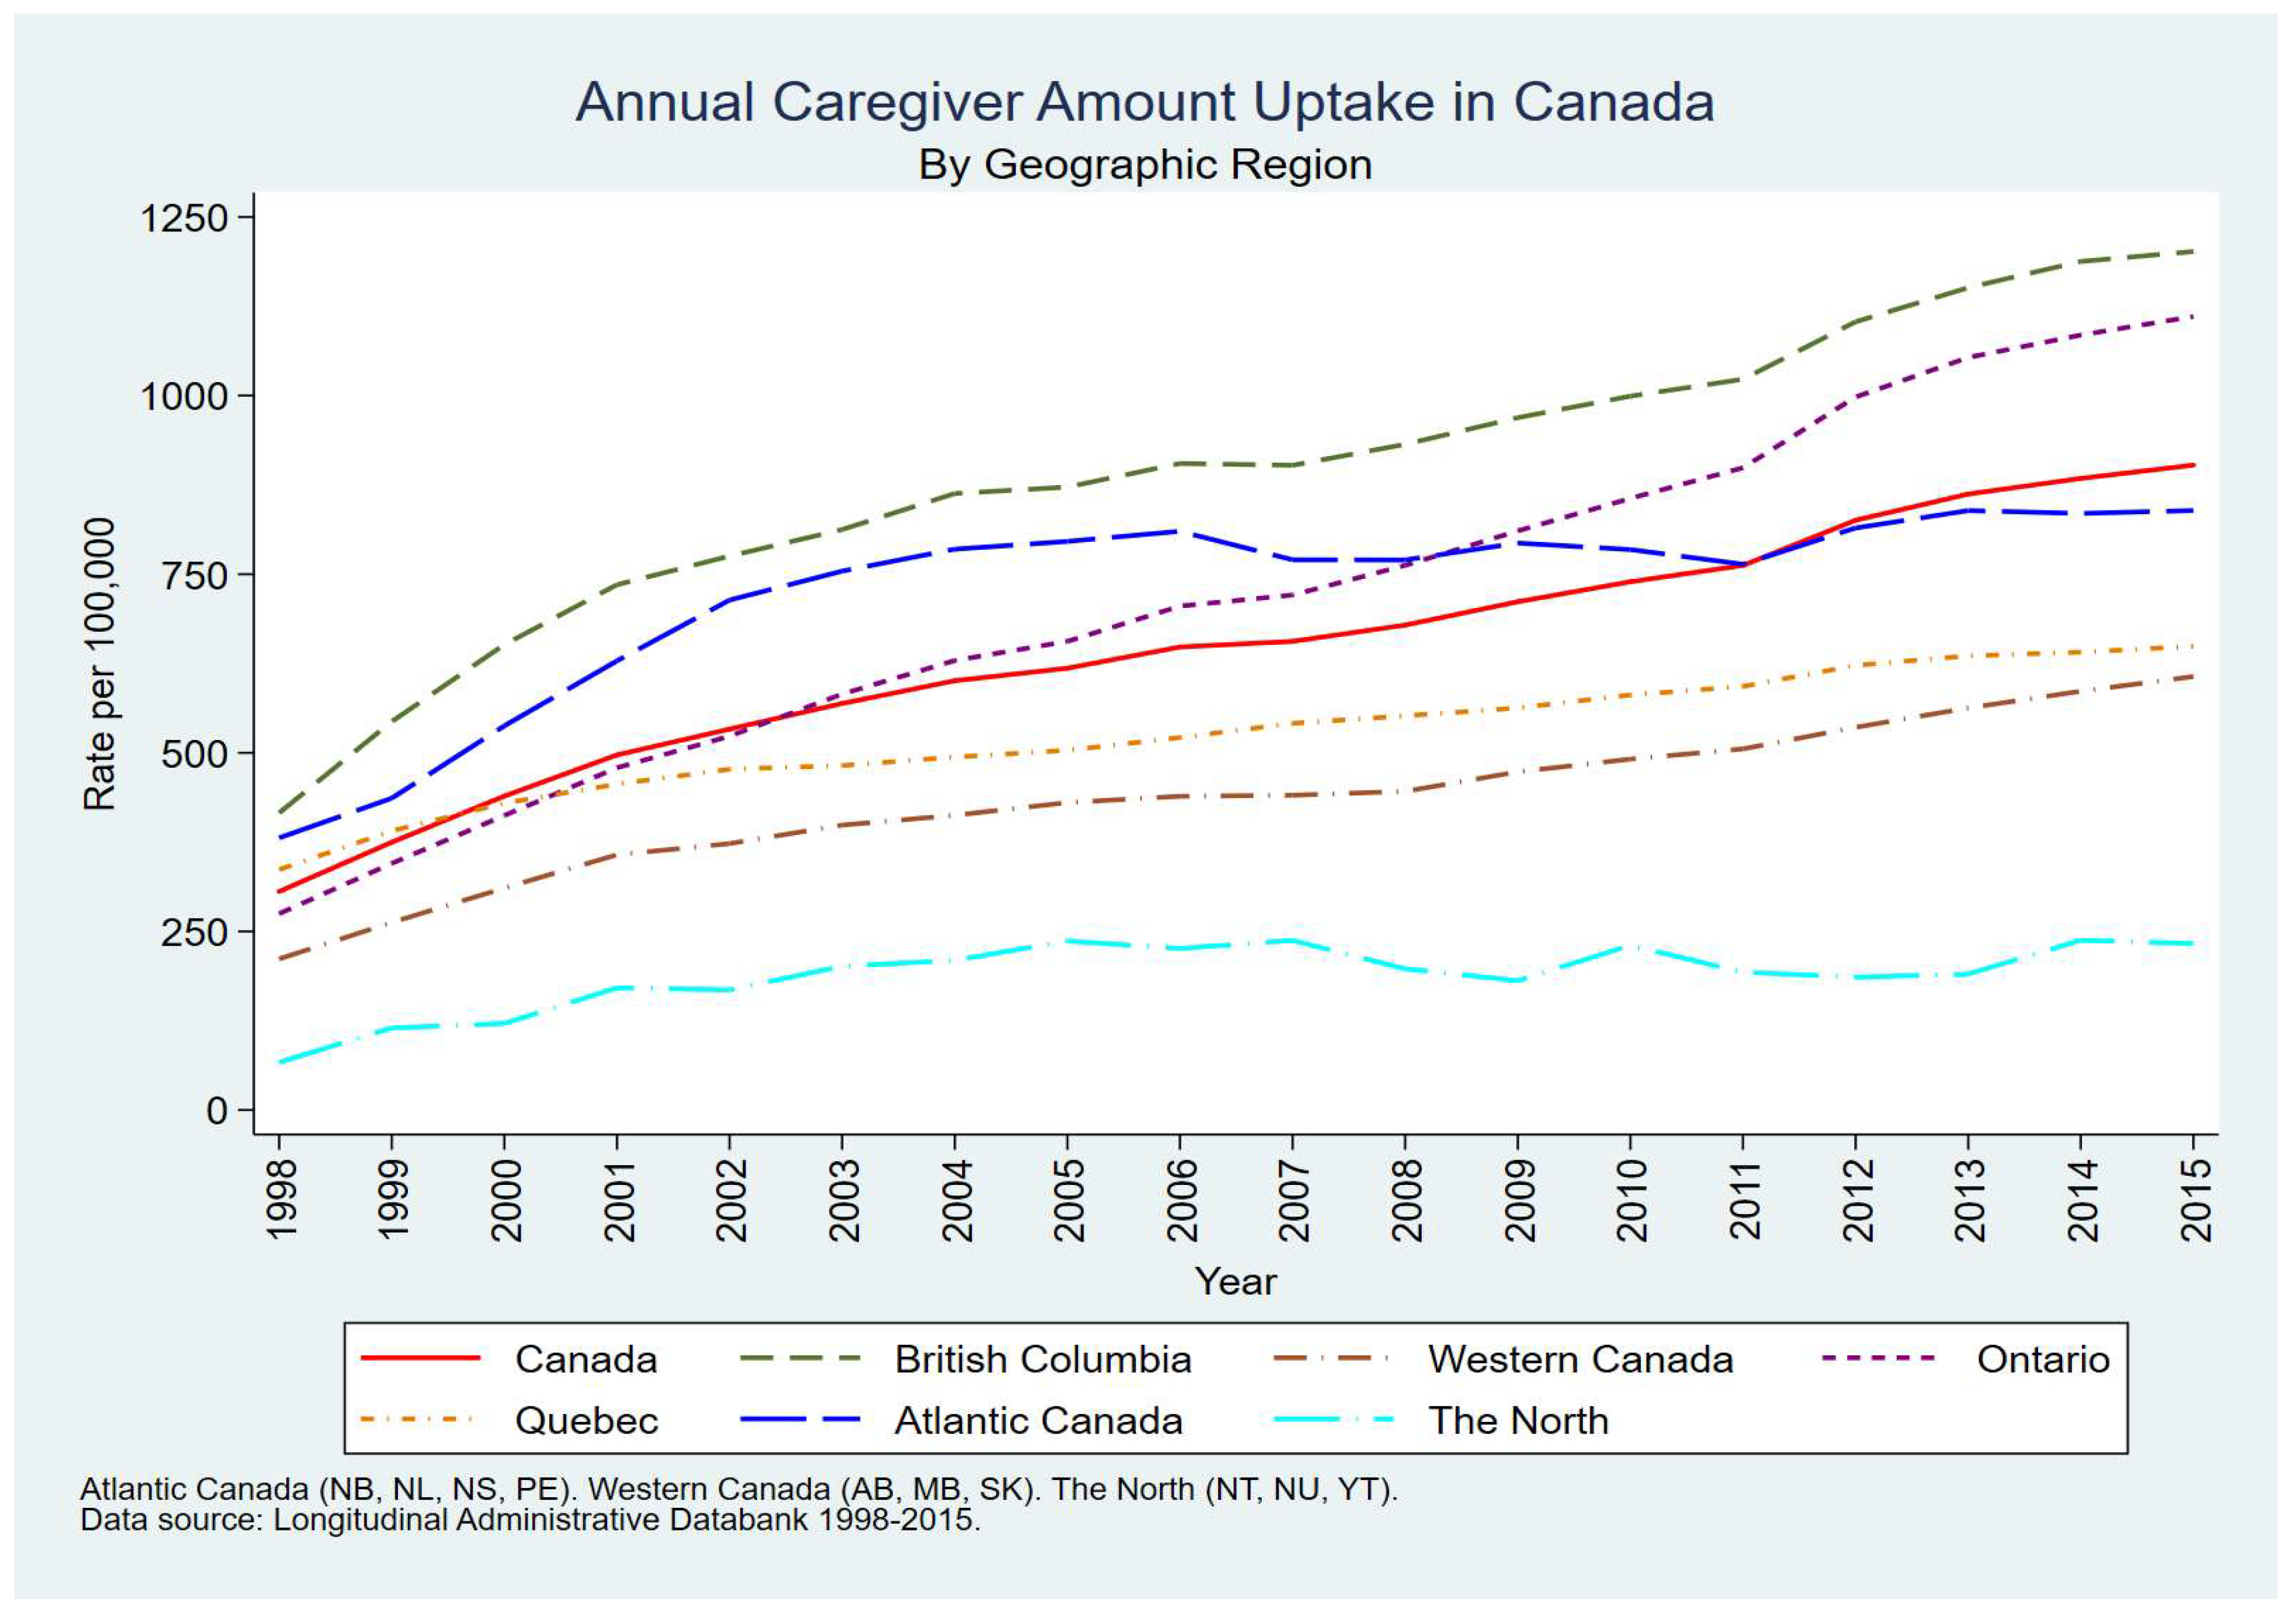
Figure 1 plots the uptake ratio per 100,000 tax filers over the 17-year study period in Canada and six geographic regions. The graph shows a general upward trend in all regions. Specific rates can be achieved by dividing by 100,000. To illustrate, for all tax filers in Canada (represented by the solid red line) about 300 in every 100,000 in 1998 (0.3%) claimed the credit, growing to 875 per 100,000 in 2015 (0.9%). Throughout the study period British Columbia remained well above the national average, with a steady increase from 400 per 100,000 in 1998 (0.4%) to 1,200 per 100,000 in 2015 (1.2%). Atlantic Canada also had steady growth rates until 2005/2006, before plateauing and dipping below the national average – 800 per 100,000 (0.8%) in 2015. Uptake in Ontario remained close to the national average from 1998 to 2006 before rising considerably in the latter half of the time frame, reaching 1,125 per 100,000 (1.1%) in 2015. By comparison,
Figure 1 clearly illustrates that Quebec and Western Canada had rates well below the national average, while the three territories (the North) together had very low levels of uptake of the Caregiver Amount.
4.2. Income
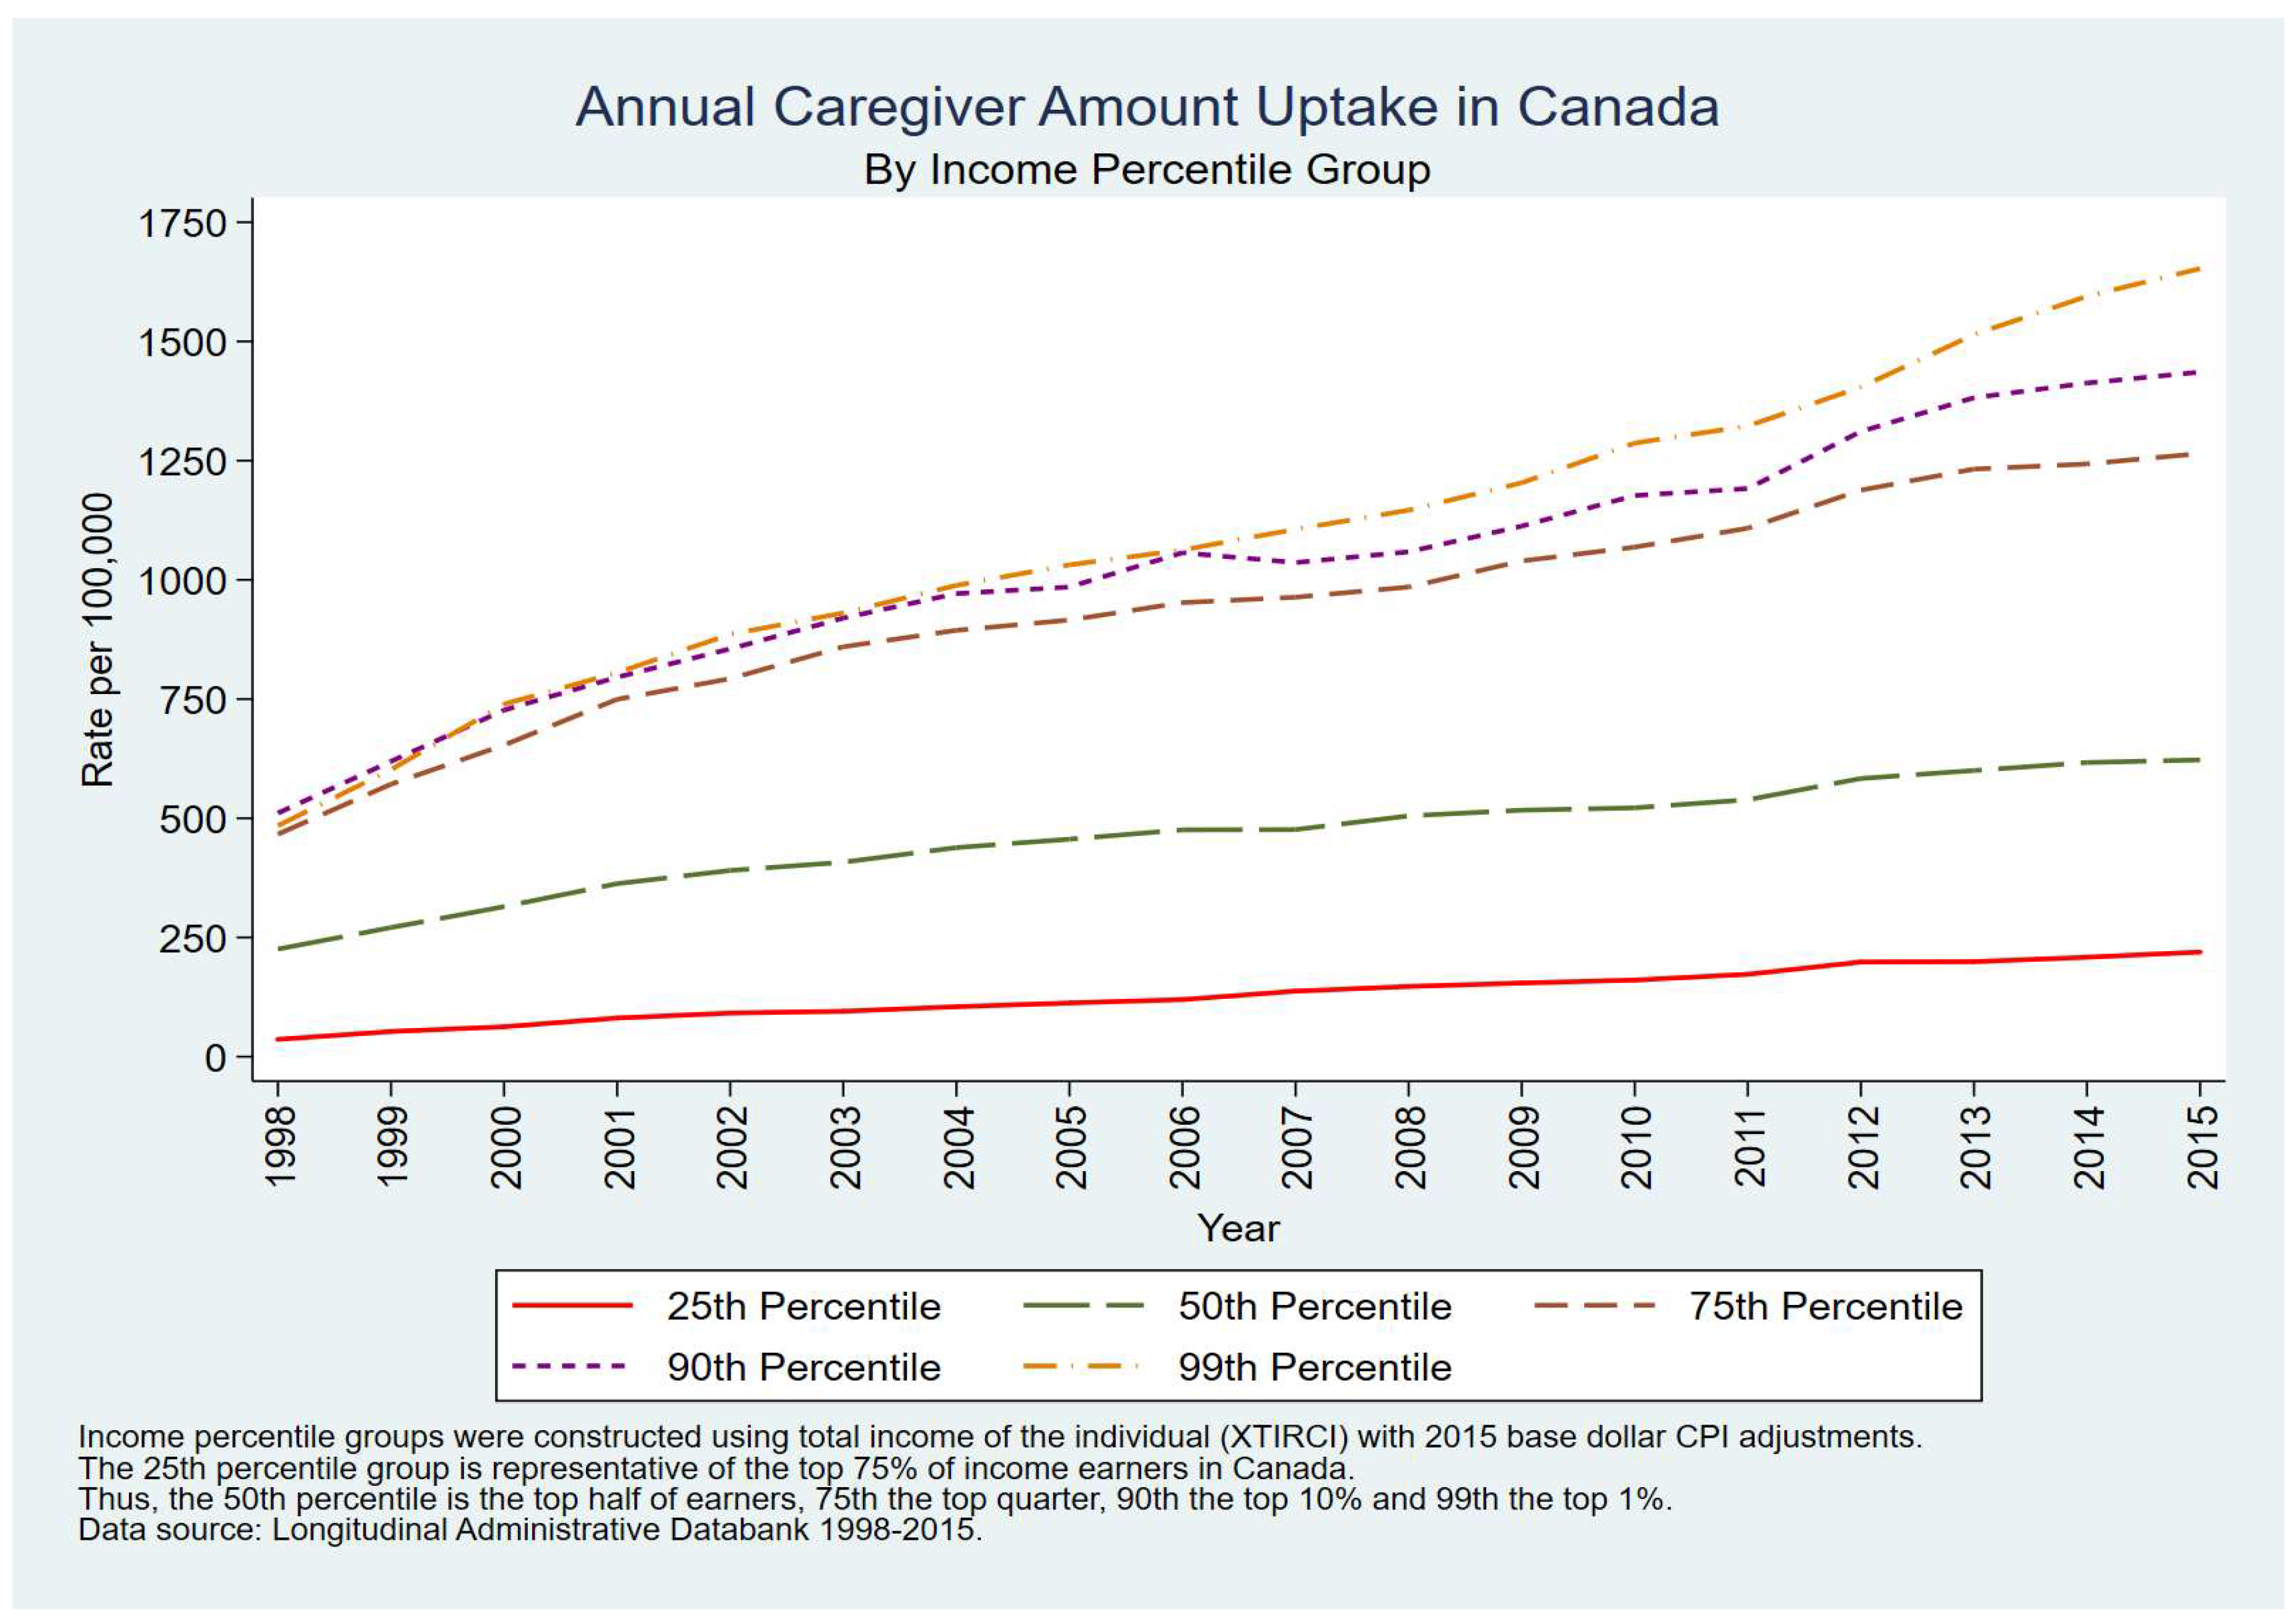
Figure 2 demonstrates that a clear and direct association exists between the uptake of the Caregiver Amount and the higher income of the tax filer. It also conveys a consistent and widening income gap. In fact, in 1998, the 3 highest percentile income groups (25%, 10%, 1%) each had uptake ratios of about 500 per 100,000 (0.5%), compared to about 250 per 100,000 (0.25%) for the 50th percentile, and just 75 per 100,000 (0.075%) for the 75th percentile (the lowest income group). Furthermore, this gap widened considerably over the 17-year study period with the top income group (1%) achieving an uptake ratio in 2015 of 1,650 per 100,000 (1.65%) compared to 200 per 100,000 (0.2%) for the lowest income group.
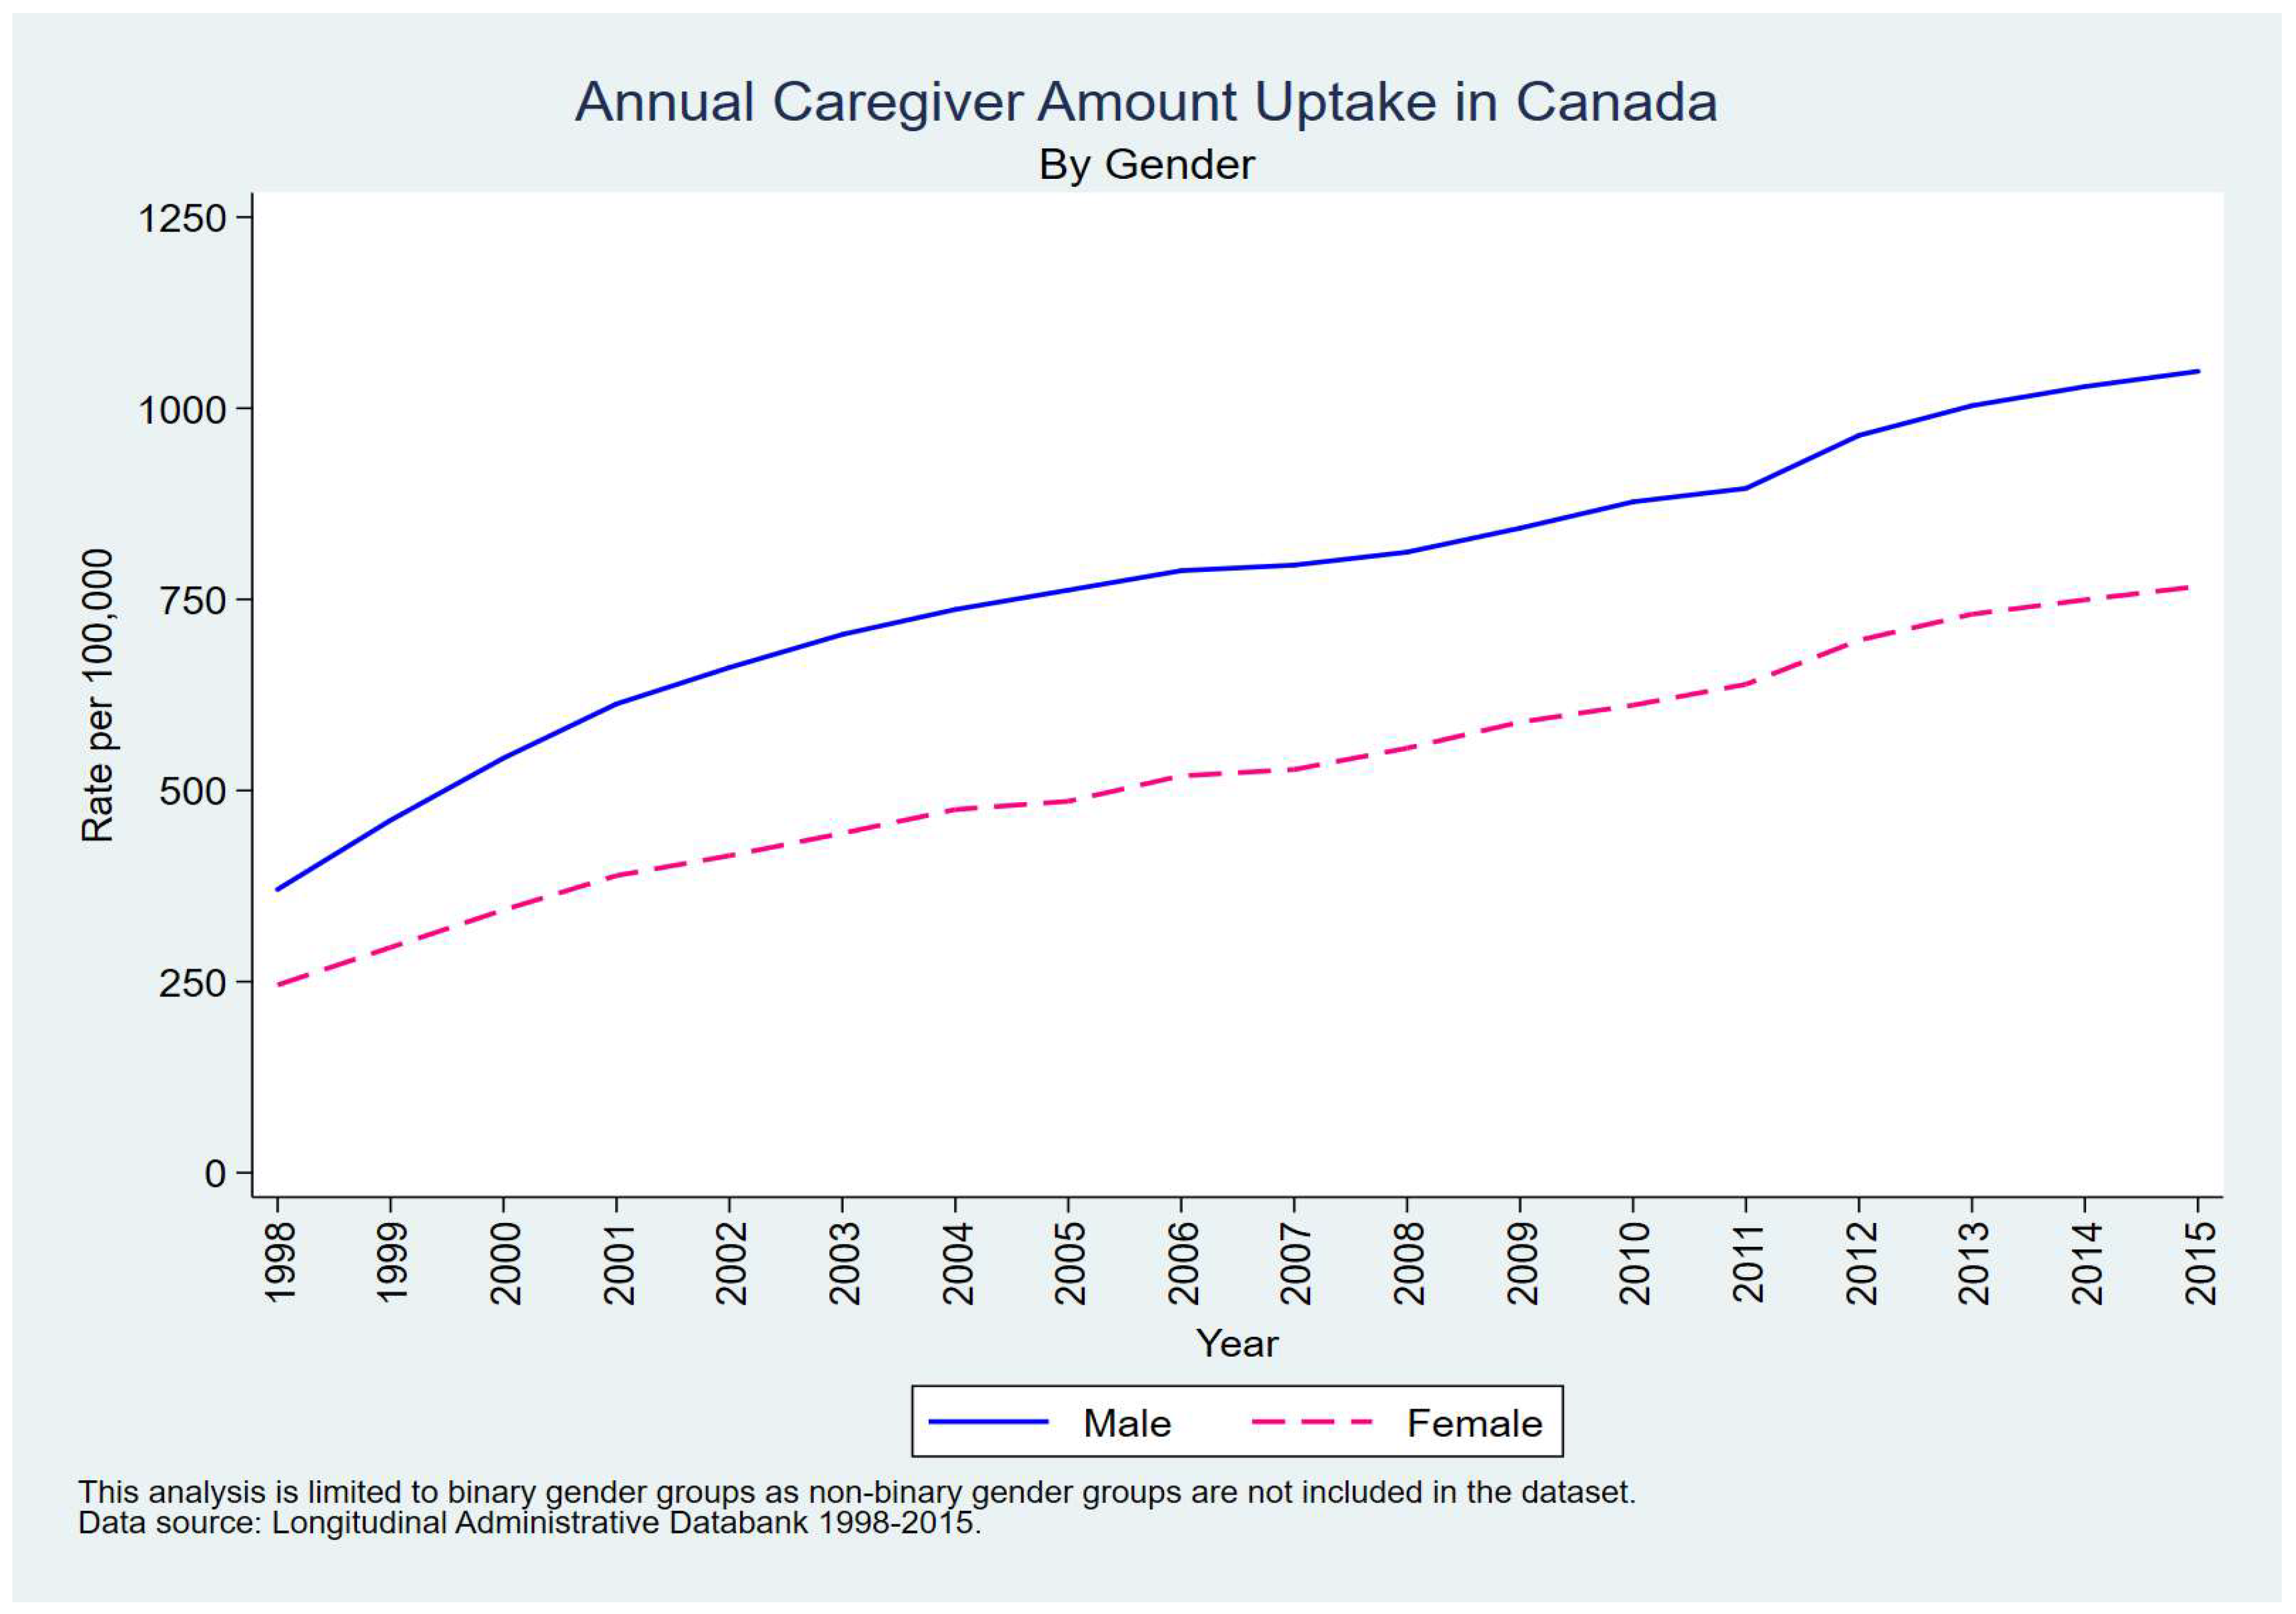
Figure 3 reveals that a gap between male and female tax filers claiming the Caregiver Amount has persisted over the years. This gap was fairly narrow in 1998 (375 per 100,000 males – 0.4% and 250 per 100,000 females – 0.25%) but had widened slightly by 2015 (1,000 per 100,000 males – 1% and 700 per 100,000 females – 0.7%).
Furthermore, additional analysis (not shown due to space constraints) pointed to the fact that married men were more likely to take advantage of these credits.
4.3. Population Density
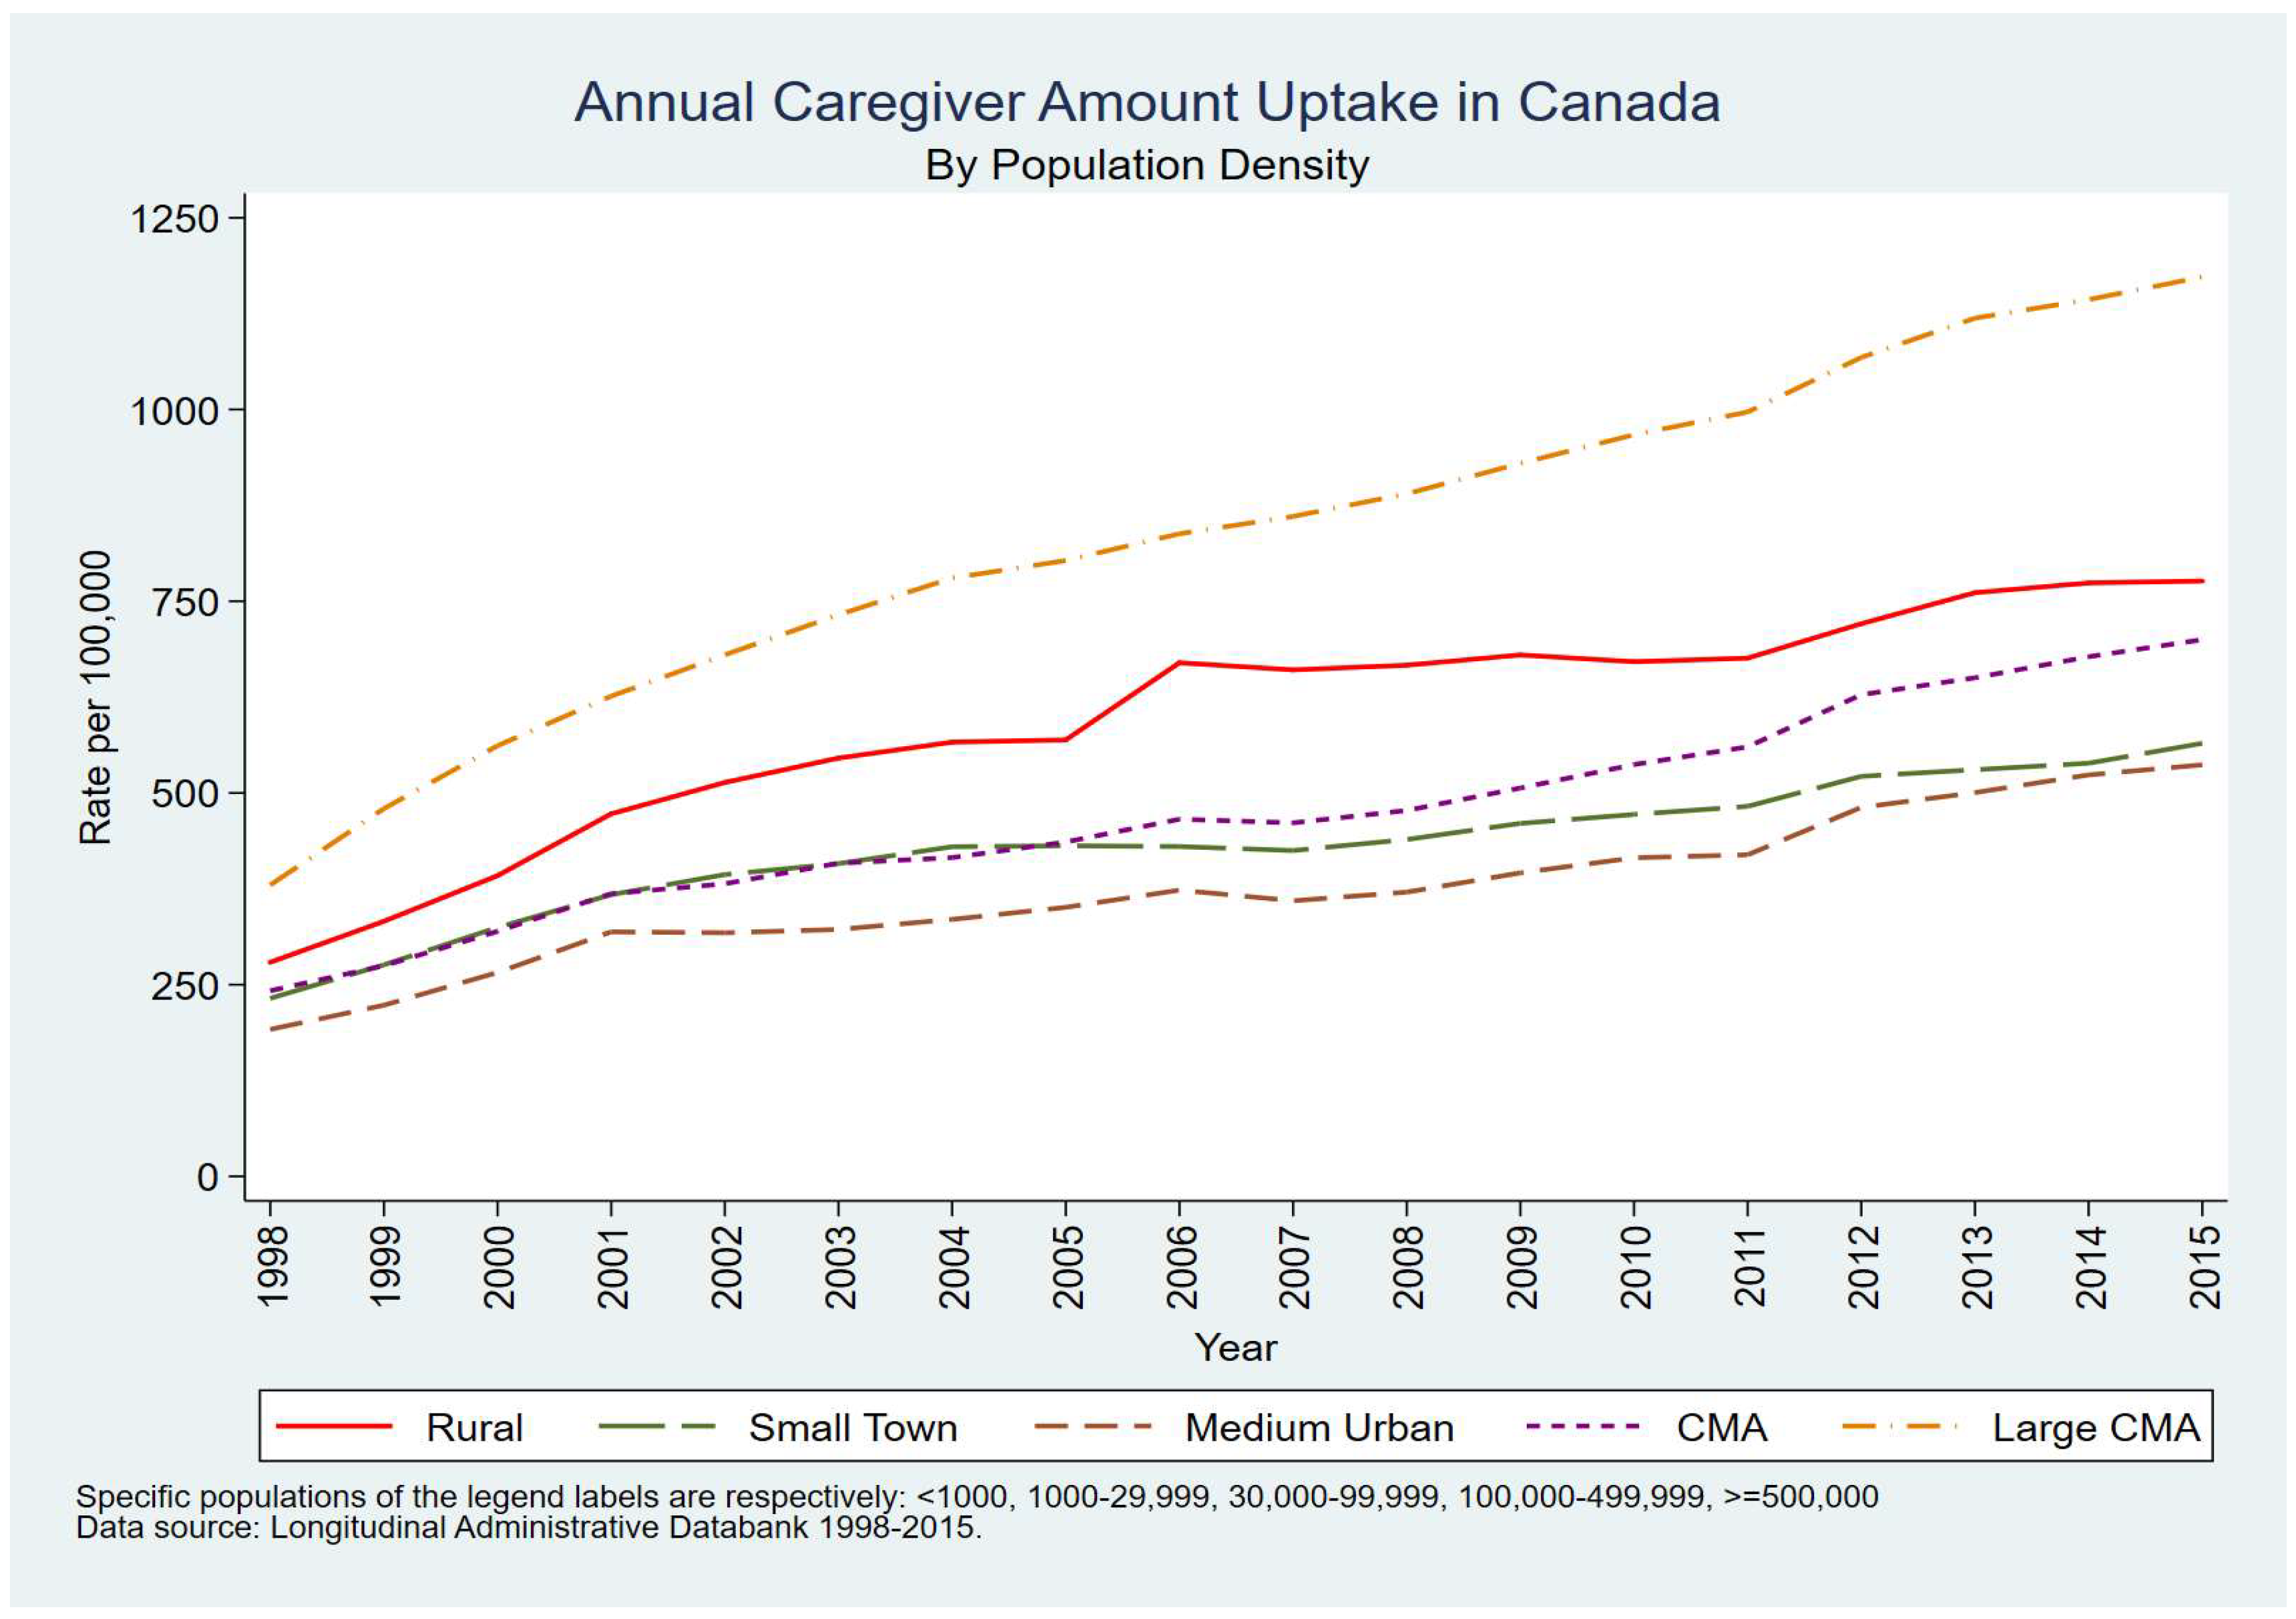
Figure 4 depicts the uptake of the annual Caregiver Amount according to settlement type between 1998 and 2015. In the early part of the study period there was a relatively tight clustering of rates in the five settlement types (between 200 to 300 per 100,000) but this was followed by a considerable widening by the early 2000s with large CMAs (such as Toronto, Montreal and Vancouver) and rural areas having the highest rates. In fact, by 2015, tax filers in the largest CMAs (500,000 or more) were the most likely to claim the credit (1,200 per 100,000 – 1.2%) compared to those in small towns or medium sized urban areas (about 500 per 100,000 – 0.5%).
4.5. Age Cohort
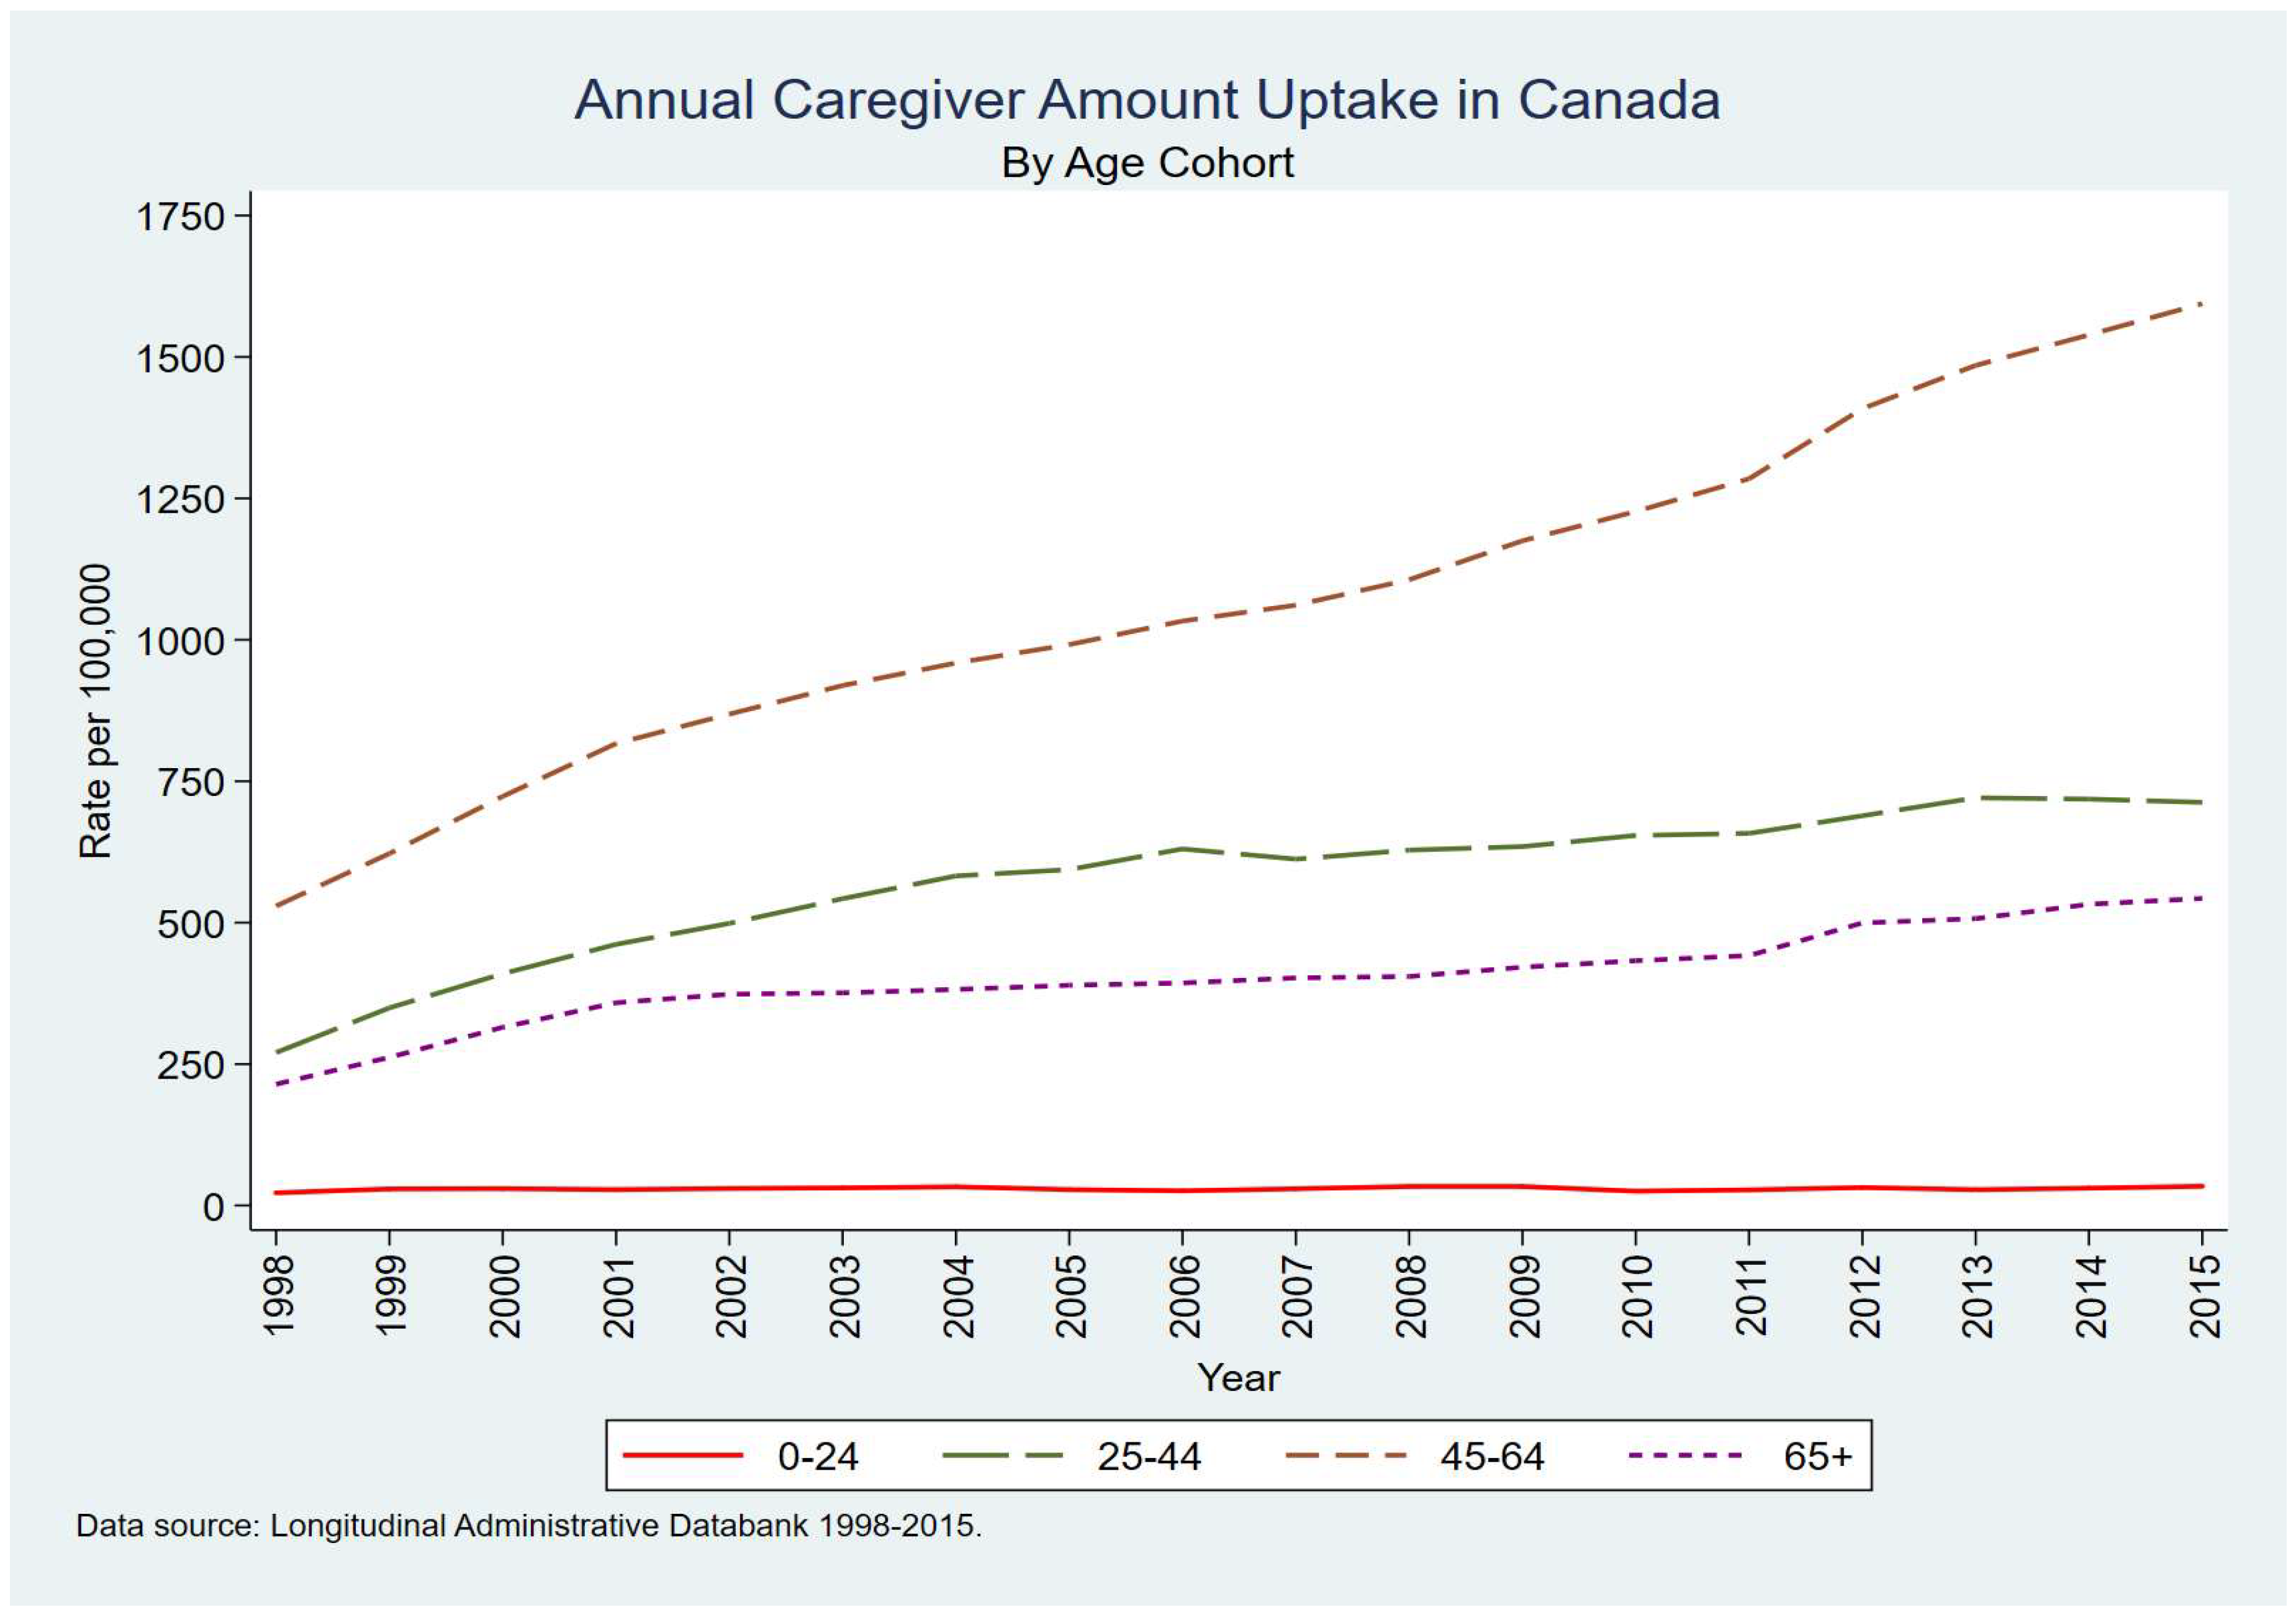
Essentially,
Figure 5 conveys the rapid increase over the study period of tax filers in the age group of 45 to 64 claiming the Caregiver Amount. The rate for this group increased from 500 per 100,000 (0.5%) in 1998 to 1,625 per 100,000 (1.65%) in 2015. By comparison, the other three age groups had much lower rates of uptake and these rates remained more or less stable over the study period. Not surprisingly, there were few young people under the age of 24 claiming the credit.
4.6. Immigrant Status
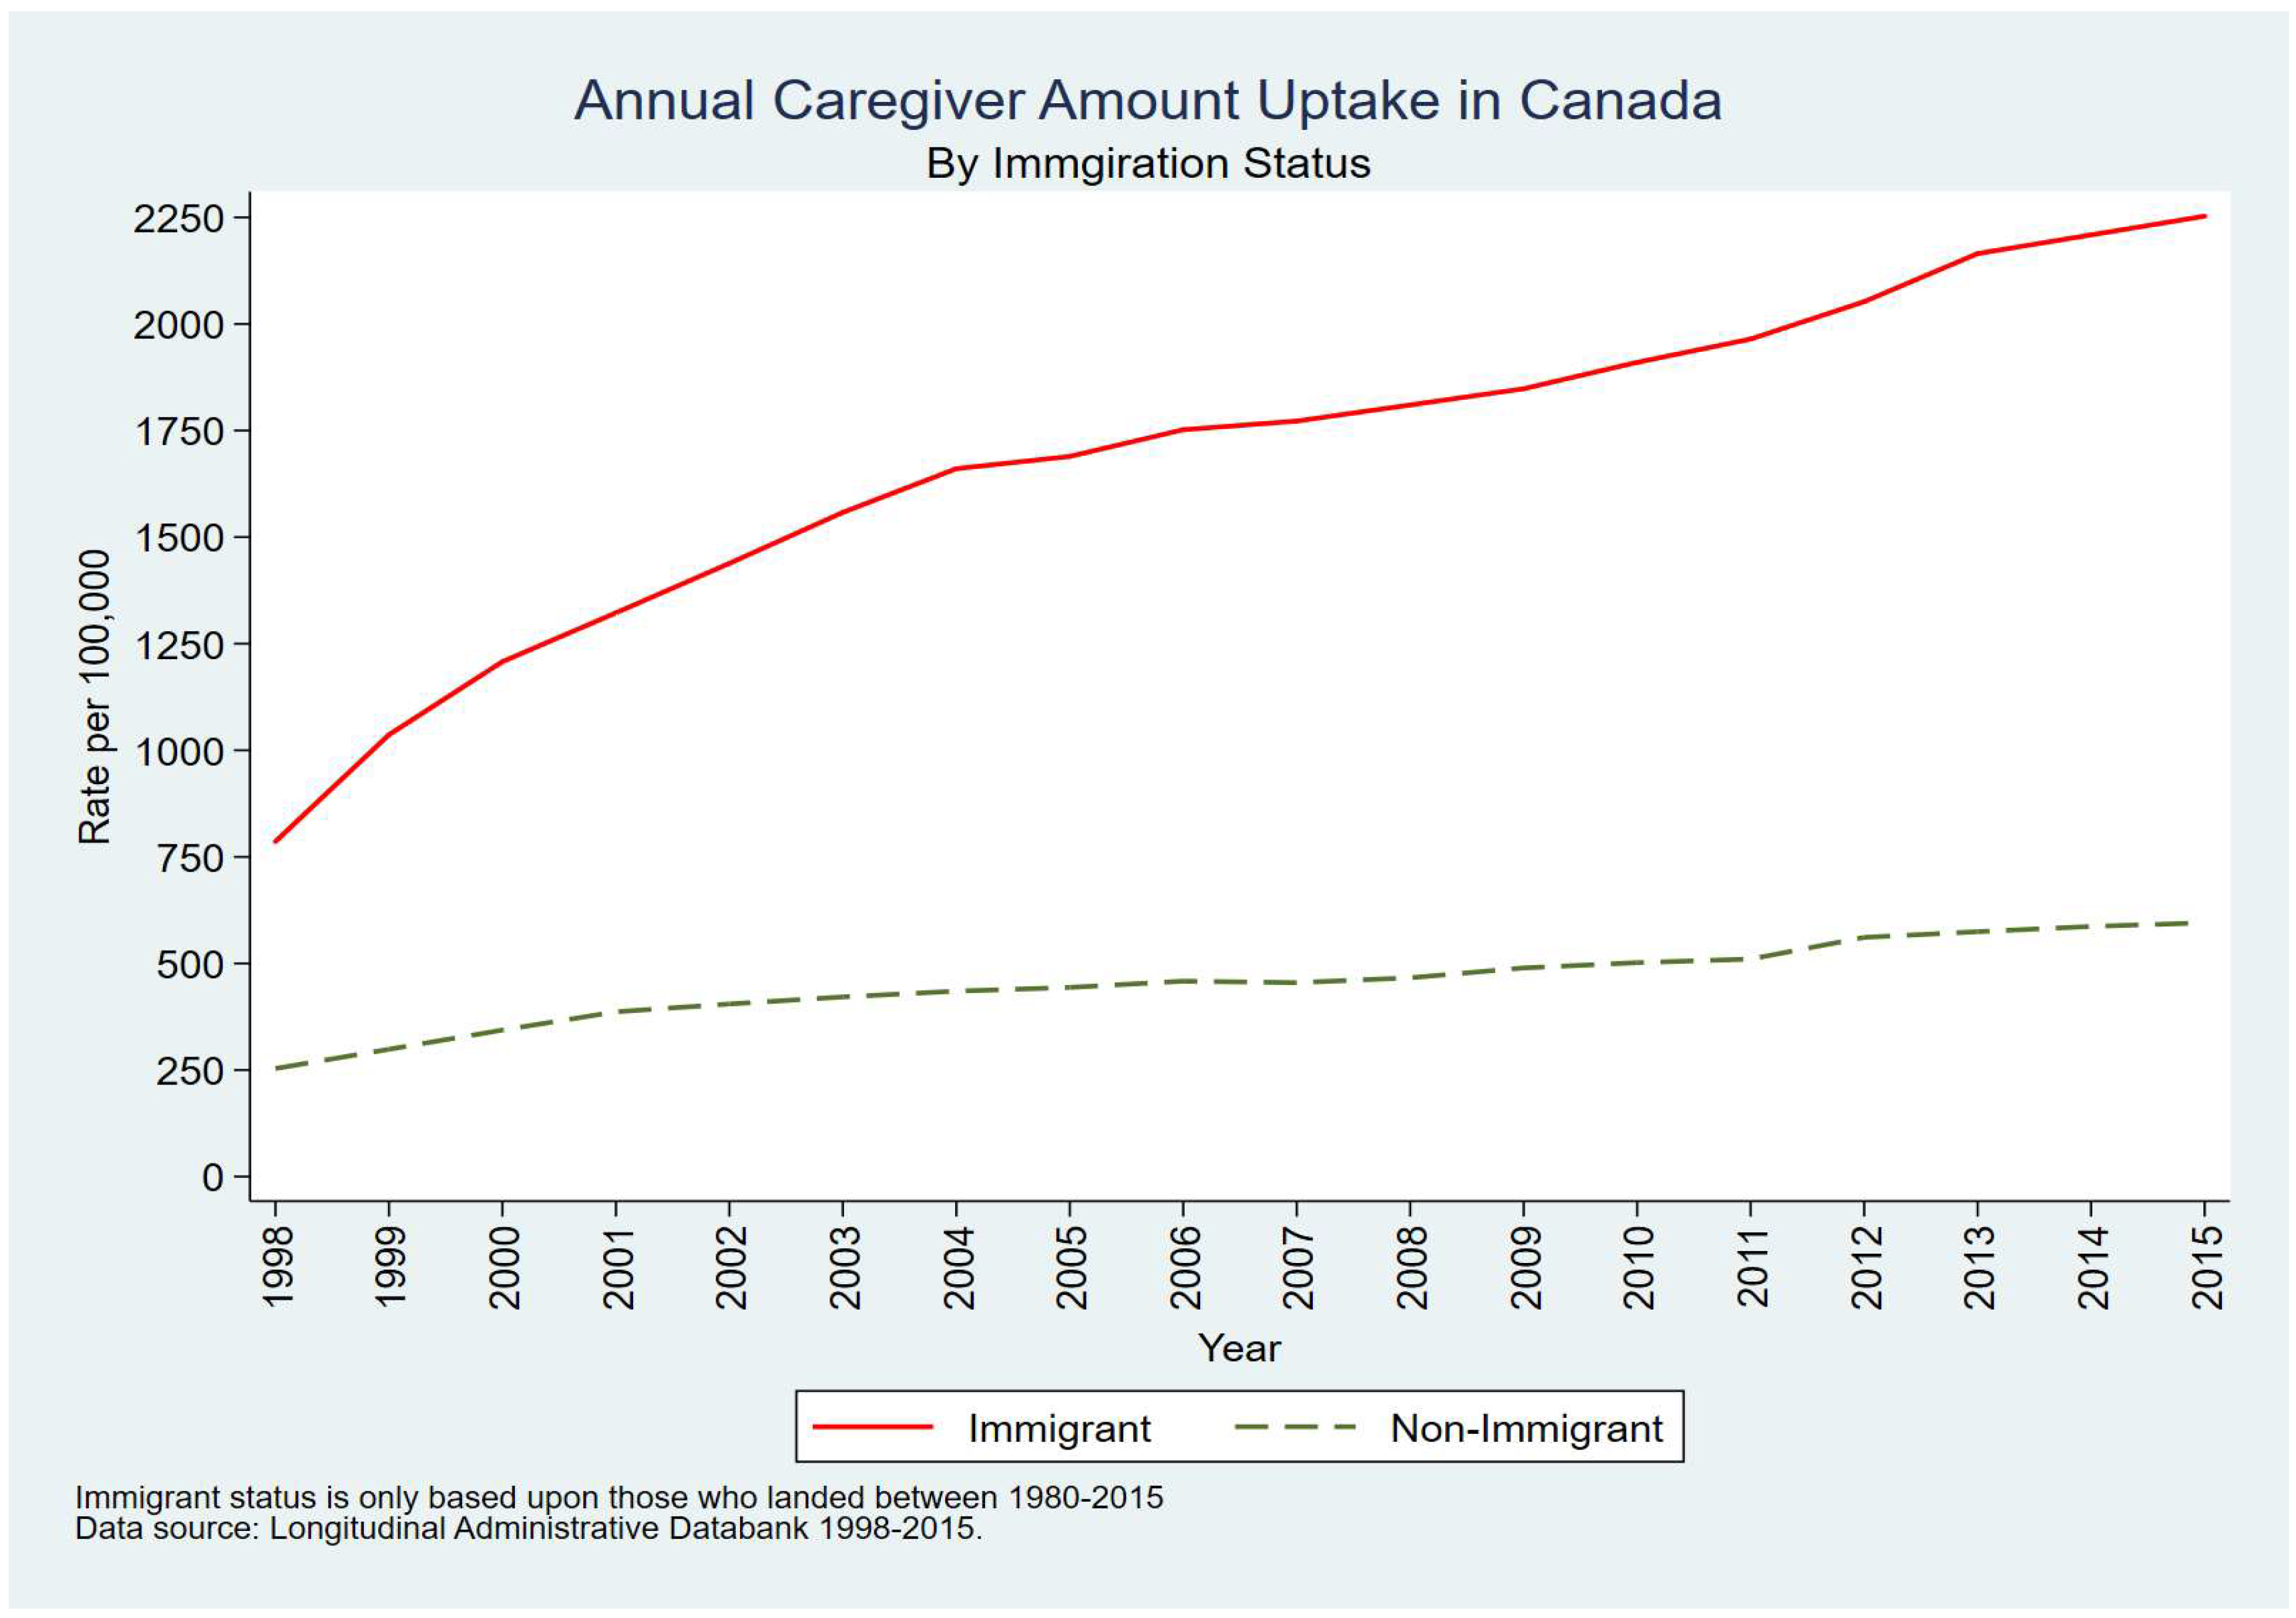
In the LAD, an immigrant is identified as someone who came to Canada in 1980 or later. As a result, for the purpose of this analysis, ‘Canadian-born’ tax filers include those arriving to Canada prior to 1980. Interestingly,
Figure 6 clearly shows a significantly greater and increasing uptake among immigrant tax filers. While the rate among the ‘Canadian-born’ was relatively flat over the 17-year period (between 250 to 500 per 100,000) the rate among immigrants rose impressively from 750 per 100,000 (0.75%) in 1998 to 2,250 per 100,000 (2.25%) in 2015. The rate among immigrants in 2015 is the highest achieved by any group of tax filers examined in this paper.
5. Summary of Findings and Discussion
Over the 17-year study period there was a steady growth in Canadian tax filers claiming the Caregiver Amount – almost a tripling between 1998 and 2015. While residents of British Columbia and Ontario were well above the national average, those in Quebec, Western Canada and the North were well below. A widening income gap was apparent, with tax filers in the highest income percentiles (90th and 99th or top 10% or 1%) being far more likely to claim the credit. A sizeable gender gap was also visible with men having a higher uptake then women. Tax filers in the largest cities (CMAs with a population of 500,000 or more) were far more likely to claim the Caregiver Amount and there was a rapid increase over the study period of filers in the 45 to 64 age group. Finally, there was a significant and increasing uptake among immigrants compared to the ‘Canadian-born’.
This profile of tax filers is somewhat different than the characteristics of caregivers presented by Turcotte (2013) and Sinha (2013) in their analysis of the 2012 General Social Survey (GSS). While a direct comparison may be difficult, it is interesting to note that the two authors found that 28% of Canadians provided care to an ill family member or friend, while just about 1% of tax filers claimed the Caregiver Amount in 2015. The GSS indicated that women were more likely to provide care while male tax filers were more likely to claim the credit. Both sources (GSS and LAD) were in-line with respect to the age cohort (25 to 64) but differed with respect to income. Analysis of the GSS found that nearly half of caregivers (47%) had a household income of less than $60,000 but findings from the LAD pointed to the highest income groups (total individual income) being favoured to claim the credit. The GSS found that people in the largest CMAs were far less likely to provide care while tax filers in these places were far more likely to apply and receive the credit. Since newcomers to Canada concentrate more in large urban areas, this may partially explain why immigrants had a much greater uptake of the Caregiver Amount then the ‘Canadian born’, an issue that Turcotte (2013) and Sinha (2013) did not report on.
Several of the incongruences identified above can be subjected to interpretation. First and chief among these is that it appears that fewer lower income tax filers are claiming the Caregiver Amount. One would expect that those with lower income status would be more likely to benefit from the credit. We believe this may be partly attributed to the greater awareness of tax credits for filers with comparatively higher income, as well as their ready access to guidance provided by relevant professionals (i.e., accountants), given the complexities of Canada’s tax system. Second is the fact that these tax filers are more likely to be men. This runs head-on with the widespread belief (and supported by the data) that females undertake a caregiving role more often than men, but may reflect the fact that there are far more male tax filers in higher income groups then females. Data from Statistics Canada (2021) shows that in 2015, 65% of tax filers with a total income of $75,000 and over were male and 71% of tax filers with a total income of $100,000 and over were male. The analysis does not reveal who the caregivers are, but rather who the caregivers are that qualify for the credit. Third, is the somewhat surprising revelation that immigrants are more likely to obtain the Caregiver Amount. One would assume that ‘Canadian-born’ tax filers have more awareness and understanding of the tax system than those coming from other countries. However, one possible interpretation could be that because they are new to the country, immigrants either rely on tax professionals within their closely knit social networks, and/or have done research on Canadian taxes prior to immigration, and are, therefore, more aware of tax policies or credits. It is also quite possible that the higher rates of uptake among immigrants could be related to the fact that immigrants tend to concentrate in the largest urban areas, in line with the related finding that these tax filers are far more likely to live in large CMAs.
6. Conclusion
There are limitations with this research. The first is that the LAD lacks certain variables that would allow for a more detailed analysis. These include the number of dependents that the Caregiver Amount was claimed for. Second, the LAD is a databank and not a census or survey. Therefore, we are uncertain how representative the findings are of the entire Canadian population, although we compared our results to the findings of Turcotte (2013) and Sinha (2013) from the 2012 General Social Survey.
It appears that married, working-age, immigrant males living in large urban areas, particularly in Ontario and British Columbia, have the highest rates of uptake of the Caregiver Amount. While those who did receive it are fully deserving, these findings are unexpected and suggest that policy makers did not entirely reach the target population when this tax credit was devised. Ideally, it should be more accessible to informal caregivers who are most burdened by the financial impacts of caregiving, particularly those from lower income groups.
Given the overall low rates of claims and the distribution of these tax credits, we suggest that federal-level tax supports for caregivers can be improved through promotion and awareness in order to further aid those caregivers in need. It is revealing that the calculation for the tax credit amount is based solely upon the dependent’s net income and does not consider that of the caregiver, allowing for higher income earners to claim these credits more than those financially worse off.
We propose that an adequate knowledge of the various tax credits and their stipulations can be overwhelming, perhaps confusing, and even time-consuming for many tax filers. For example, the Canada Revenue Agency (CRA) does not require documentation to be submitted in support of the claim for a carer tax credit. However, the agency may ask for a signed statement from a medical practitioner showing when the impairment began, and what the duration of the impairment is expected to be. Of course, this is an important aspect of the claim that must be adhered to, but we can speculate that many busy and, at times, overwhelmed caregivers simply don’t have the time or inclination to request the statement. Some may even feel that they are inconveniencing their busy family doctors. It is possible that persons with higher socio-economic status have access to resources that allow them to apply for and receive additional tax credits compared to those who may have qualified but missed the opportunity without access to relevant information and/or a tax professional. Finally, we can speculate that some caregivers are aware of the tax credits but simply chose not to apply as they don’t want to be ‘compensated’ for activities that they feel are normal or expected when dealing with an ill family member or friend.
Government campaigns targeted at education and awareness of these available supports are necessary and must be structured in an accessible manner so that they reach busy caregivers in their day-to-day lives. Moreover, revisions are needed to reduce the complexities of applying for these tax credits, in addition to accounting for the caregiver’s income in the calculation of the amounts themselves.
In 2017, the Canada Caregiver Credit (CCC) was established. The CCC is similar to the Caregiver Amount. However, it combines and replaces the FCA, Caregiver Amount, and the Infirm Dependent Credit. The latter which is a credit for caregivers of a child or grandchild that is 18 years or older and physical and/or mentally infirm and cannot be claimed if the Caregiver Amount is already being claimed for that dependent. With the new transition to the CCC, one of the additional changes was the removal of the qualifier previously mentioned for caring for a dependent aged 65 or older who is not mentally or physically infirm. Thus, it can be argued that federal-level tax support has been removed for the caregivers of this demographic group of dependents altogether (Canada Revenue Agency, 2018).
One benefit in the recent change to the CCC in 2017 was that the dependent no longer has to live with the caregiver. However, as previously mentioned, it has also removed the qualifier, and thus support, of caring for a dependent aged 65 or older. Consequently, it is solely designed for those caregivers of dependents with a physical and/or mental infirmity (Canada Revenue Agency, 2018). This removal of support, in combination with historically low uptake, points to a lack of financial support for informal caregivers characterized as having low economic status, and calls into question whether future caregivers will have the financial ability to maintain healthy lifestyles for both themselves and their dependent(s).
This is the start of a rich research area, given the many possible directions for analysis. Additional work would help to develop the goal of providing stable financial support for informal caregivers in Canada and elsewhere. Both Canadian and international researchers could learn from the models of caregiver support seen in many European countries (Keefe et al., 2008). Of particular interest would be a comparative study of the uptake of various tax credits and benefits to assess their effectiveness as a policy tool. Do they fully benefit those being targeted?
Acknowledgments
“This research was supported by funds to the Canadian Research Data Centre Network (CRDCN) from the Social Science and Humanities research Council (SSHRC), the Canadian Institute for Health Research (CIHR), the Canadian Foundation for Innovation (CFI) and Statistics Canada”. “Although the research and analysis are based on data from Statistics Canada, the opinions expressed do not represent the views of Statistics Canada or the Canadian Research Data Centre Network (CRDCN).”
References
- Adelman R.D., Tmanova L.L., Delgado D., Dion S., Lachs M.S. (2014). Caregiver Burden: A Clinical Review. JAMA. 2014;311(10):1052–1060. [CrossRef]
- Bastawrous, M. (2013). Caregiver burden – A critical discussion. International Journal of Nursing Studies. Vol 50 (3) March 2013, Pages 431-441. [CrossRef]
- Canada Revenue Agency. (January 04, 2011). ARCHIVED - 5000-G-2011 General Income Tax and Benefit Guide 2011 - All Provinces Except Non-Residents. Retrieved from https://www.canada.ca/en/revenue-agency/services/forms-publications/tax-packages-years/archived-general-income-tax-benefit-package-2011/archived-5000-2011-general-income-tax-benefit-guide-2011-provinces-except-non-residents/archived-general-income-tax-benefit-guide-2011.html.
- Canada Revenue Agency. (July 27, 2018). Consolidation of Caregiver Credits. Retrieved from https://www.canada.ca/en/revenue-agency/programs/about-canada-revenue-agency-cra/federal-government-budgets/budget-2017-building-a-strong-middle-class/consolidation-caregiver-credits.html.
- Canada Revenue Agency. (February 5, 2021). Provincial and territorial tax and credits for individuals. Retrieved from https://www.canada.ca/en/revenue-agency/services/tax/individuals/topics/about-your-tax-return/tax-return/completing-a-tax-return/provincial-territorial-tax-credits-individuals.html.
- Donner, G., McReynolds, J., Smith, K., Fooks, C., Sinha, S., and Thomson, D. (2015). Bringing Care Home: Report of the Expert Group on Home and Community Care. Toronto, ON: Expert Group on Home and Community Care. Retrieved from http://health.gov.on.ca/en/public/programs/lhin/docs/hcc_report.pdf.
- Keefe, J., Glendinning, C., Fancey P. (2008) Financial Payments for Family Carers: Policy Approaches and Debates. In Aging and Caring at the Intersection of Work and Home Life: Blurring the Boundaries (Edited by Anne Martin-Matthews, Judith E. Phillips). Taylor & Francis Group, NY, NY. pp. 166-184.
- Milke, M. (2017) Who pays income tax? The Canadian Taxpayers Federation.
- Sherwood, P.R., Given, C.W., Given, B.A., von Eye, A. (2005). Caregiver Burden and Depressive Symptoms: Analysis of Common Outcomes in Caregivers of Elderly Patients. J Aging Health. 2005 Apr;17(2):125-47. [CrossRef]
- Sinha, M. (2013) Portrait of caregivers, 2012. Spotlight on Canadians: Results from the General Social Survey. Statistics Canada. Catalogue no. 89-652-X — No. 001 ISBN 978-1-100-22502-9.
- Statistics Canada (2021) Tax filers and dependants with income by total income, sex and age. Retrieved from https://www150.statcan.gc.ca/t1/tbl1/en/cv.action?pid=1110000801.
- Statistics Canada. (January 17, 2018). Seniors. Retrieved from https://www150.statcan.gc.ca/n1/pub/11-402-x/2011000/chap/seniors-aines/seniors-aines-eng.htm.
- Turcotte, M. (2013). Family caregiving: What are the consequences? Insights on Canadian Society. Statistics Canada Catalogue no. 75-006-X. Retrieved from https://www150.statcan.gc.ca/n1/en/pub/75-006-x/2013001/article/11858-eng.pdf?st=tgFvr4xD.
|
Disclaimer/Publisher’s Note: The statements, opinions and data contained in all publications are solely those of the individual author(s) and contributor(s) and not of MDPI and/or the editor(s). MDPI and/or the editor(s) disclaim responsibility for any injury to people or property resulting from any ideas, methods, instructions or products referred to in the content. |
© 2024 by the authors. Licensee MDPI, Basel, Switzerland. This article is an open access article distributed under the terms and conditions of the Creative Commons Attribution (CC BY) license (https://creativecommons.org/licenses/by/4.0/).
