Preprint
Article

Activated Metabolic Transcriptional Program in Tumor Cells from Hepatoblastoma

Altmetrics

Downloads

80

Views

55

Comments

0

Submitted:

09 September 2024

Posted:

10 September 2024

You are already at the latest version

Alerts
Abstract
(1) Background: Hepatoblastoma is the most common primary liver malignancy in children. During its development, metabolic reprogramming becomes particularly relevant due to the liver's intrinsic metabolic functions. Enhanced glycolysis, glutaminolysis, and fatty acid synthesis have been implicated in the proliferation and survival of hepatoblastoma cells. In this study we screened altered over expression of metabolic enzymes in hepatoblastoma tumors at tissue and single cell level. A hepatoblastoma tumor expression metabolic score was established and validated by machine learning; (2) Methods: Starting from Mammalian Metabolic Enzyme Database, bulk RNA-sequencing from GSE104766 dataset was investigated by supervised analyses (tumors versus adjacent liver tissue). Overexpressed enzymes in hepatoblastoma tumors were functionally enriched on KEGG metabolic database to draw a metabolic network with Cytoscape. Activated metabolic markers were used to compute a single-cell metabolic score in human and PDX hepatoblastoma samples from GSE180665 dataset (sc-RNAseq). ROC and area under curve (AUC) were computed on metabolic score. Elasticnet model tuning for metabolic marker expression was performed with r-caret on single cell transcriptome and revealed importance of individual marker to predict tumor cell status; (3) Results: Differential expression analysis on bulk transcriptome identified 287 significantly regulated enzymes between tumor and adjacent liver tissues: 59 of them were found overexpressed in tumors. 45 of the 59 over expressed enzymes were recognized in KEGG database which highlighted a main metabolic network enriched in amino acid metabolism but also carbohydrate, steroid, one carbon, purine, and glucoaminoglycan metabolisms. Based on expression of the 59 over expressed enzymes, the single cell metabolism score computed on GSE180665 dataset allowed to predict tumor cell status with and AUC of 0.98 (sensibility 0.93, specificity: 0.94). Elasticnet model tuned at 0.97 of AUC on individual marker single cell expression ranked top tumor predictive markers by decreasing importance: FKBP10, ATP1A2, NT5DC2, UGT3A2, PYCR1, CKB, GPX7, DNMT3B, GSTP1, and OXCT1; (4) Conclusion: An activated metabolic transcriptional program potentially affecting epigenetic functions was observed by bulk RNAseq in tumors of hepatoblastoma and confirmed at single cell levels in tumor cells.
Keywords: 
Subject: Biology and Life Sciences  -   Biochemistry and Molecular Biology

1. Introduction

Hepatoblastoma is the most common primary liver malignancy in children, accounting for approximately 1% of all pediatric cancers and 80% of liver cancers in children under the age of five [1,2]. Despite being a rare disease, hepatoblastoma has garnered significant attention due to its aggressive nature and the challenges it poses in pediatric oncology. The etiology of hepatoblastoma remains largely unknown, although it is thought to involve a combination of genetic, environmental, and developmental components of undefined importance [2]. The survival rate for patients with localized hepatoblastoma has improved with advances in surgical techniques and chemotherapy; however, the prognosis for those with metastatic or recurrent disease remains poor [3,4,5,6]. This underscores the urgent need to elucidate the molecular mechanisms underlying hepatoblastoma development and progression to identify novel therapeutic targets.
The liver is a central hub for metabolic processes, including gluconeogenesis, glycolysis, fatty acid oxidation, and the metabolite detoxification [7]. These metabolic pathways are tightly regulated to maintain homeostasis and support the liver's diverse physiological functions. In the context of liver cancer, including hepatoblastoma, metabolic reprogramming is a well-recognized phenomenon [8,9,10,11]. Cancer cells often undergo a metabolic shift known as the Warburg effect, characterized by increased glycolysis and lactate production even in the presence of sufficient oxygen [12,13]. This shift supports rapid cell proliferation by providing the necessary building blocks for biomass production and by maintaining redox balance [14,15].
In hepatoblastoma, metabolic reprogramming is particularly relevant due to the liver's intrinsic metabolic functions. Alterations in metabolic pathways can influence tumor growth, survival, and resistance to therapy. For instance, enhanced glycolysis, glutaminolysis, and fatty acid synthesis have been implicated in the proliferation and survival of hepatoblastoma cells [16,17,18]. Understanding how these metabolic pathways are regulated in hepatoblastoma can provide insights into the disease's pathogenesis and identify potential metabolic vulnerabilities that can be targeted therapeutically.
Epigenetics refers to heritable changes in gene expression that do not involve alterations in the DNA sequence. These changes are often mediated by modifications such as DNA methylation, histone modifications, and non-coding RNAs [19,20,21]. DNA methylation, in particular, plays a critical role in regulating gene expression and maintaining cellular identity. It is mediated by a family of enzymes known as DNA methyltransferases (DNMTs), including DNMT1, DNMT3A, and DNMT3B, which add methyl groups to cytosine residues in DNA, typically leading to gene silencing[22,23,24]. In liver cancer, aberrant DNA methylation patterns are common and contribute to tumorigenesis by silencing tumor suppressor genes or activating oncogenes [25,26,27]. Hepatoblastoma, like other cancers, exhibits widespread epigenetic dysregulation, including abnormal DNA methylation [28,29]. The role of DNMTs in hepatoblastoma is of particular interest, as these enzymes can modulate the expression of genes involved in key oncogenic pathways and metabolic processes. Investigating the epigenetic landscape of hepatoblastoma can reveal critical insights into how DNA methylation and other epigenetic modifications contribute to tumor development and progression.
Oxidative stress, characterized by an imbalance between the production of reactive oxygen species (ROS) and the cell's antioxidant defenses, plays a pivotal role in cancer biology. Mitochondria, the cell's powerhouse, are both a major source and target of ROS [30,31]. In liver cancer, including hepatoblastoma, mitochondrial dysfunction and oxidative stress are common features that drive tumorigenesis. ROS can induce DNA damage, promote genetic instability, and activate signaling pathways that support cancer cell survival and proliferation [32,33,34].
In hepatoblastoma, oxidative stress and mitochondrial dysfunction are intertwined with metabolic reprogramming and epigenetic regulation. For example, impaired mitochondrial oxidative phosphorylation can increase ROS production, while DNA methylation changes can alter the expression of genes involved in oxidative stress responses [35,36,37]. Understanding the interplay between oxidative stress, mitochondrial function, and the metabolic and epigenetic landscape of hepatoblastoma can provide a comprehensive view of the molecular mechanisms driving this disease.
Given the importance of metabolic and epigenetic regulation in liver physiology and cancer, our study aims to explore these aspects in hepatoblastoma using single-cell RNA sequencing (scRNAseq). By profiling the transcriptomes of individual cells within hepatoblastoma tumors, we can uncover the cellular heterogeneity and identify distinct metabolic and epigenetic states. Specifically, we aim to elucidate the relationship between the metabolic status of hepatoblastoma cells and their developmental trajectory, as well as the role of DNMT-mediated DNA methylation in regulating these processes.
Our results reveal a complex interplay between metabolic reprogramming and epigenetic dysregulation in hepatoblastoma through overexpression of DNMT3B and implication of one carbon metabolism in tumor cells, highlighting potential therapeutic targets and biomarkers for this aggressive pediatric cancer. This study provides novel insights into the molecular underpinnings of hepatoblastoma and underscores the value of integrated single-cell analyses in understanding cancer biology.

2. Results

2.1. Differential Expressed Enzymes in Tumors as Compared to Normal Adjacent Liver Tissues from Hepatoblastoma Human Samples

RNA-sequencing dataset GSE104766 [38] comprising samples of human hepatoblastoma tumors and adjacent liver tissue was preprocessed with edgeR normalization, voom transformation, low expression filtration, and quantile normalization (Figure S1). Normalized data were investigated for supervised analyses according to the expression of Mammalian metabolic enzymes. Differential expression gene analyses between tumors and adjacent liver tissue identified 287 significantly regulated enzymes (Table S1, and Figure 1A). Principal component analysis allowed to stratify correctly the majority of samples according to the origin of the tissues (Figure 1B). Similarly, unsupervised clustering (Euclidean distances, Ward.D2 method) with expression heatmap based on the expression 287 significant enzyme allowed a relevant clustering of the majority of samples according to their tissue origin (Figure 1C). These results suggest that a dysregulated metabolic program characterized hepatoblastoma tumors as compared to adjacent liver tissue.

2.2. Activated Metabolic Transcriptional Program in Hepatoblastoma Tumors

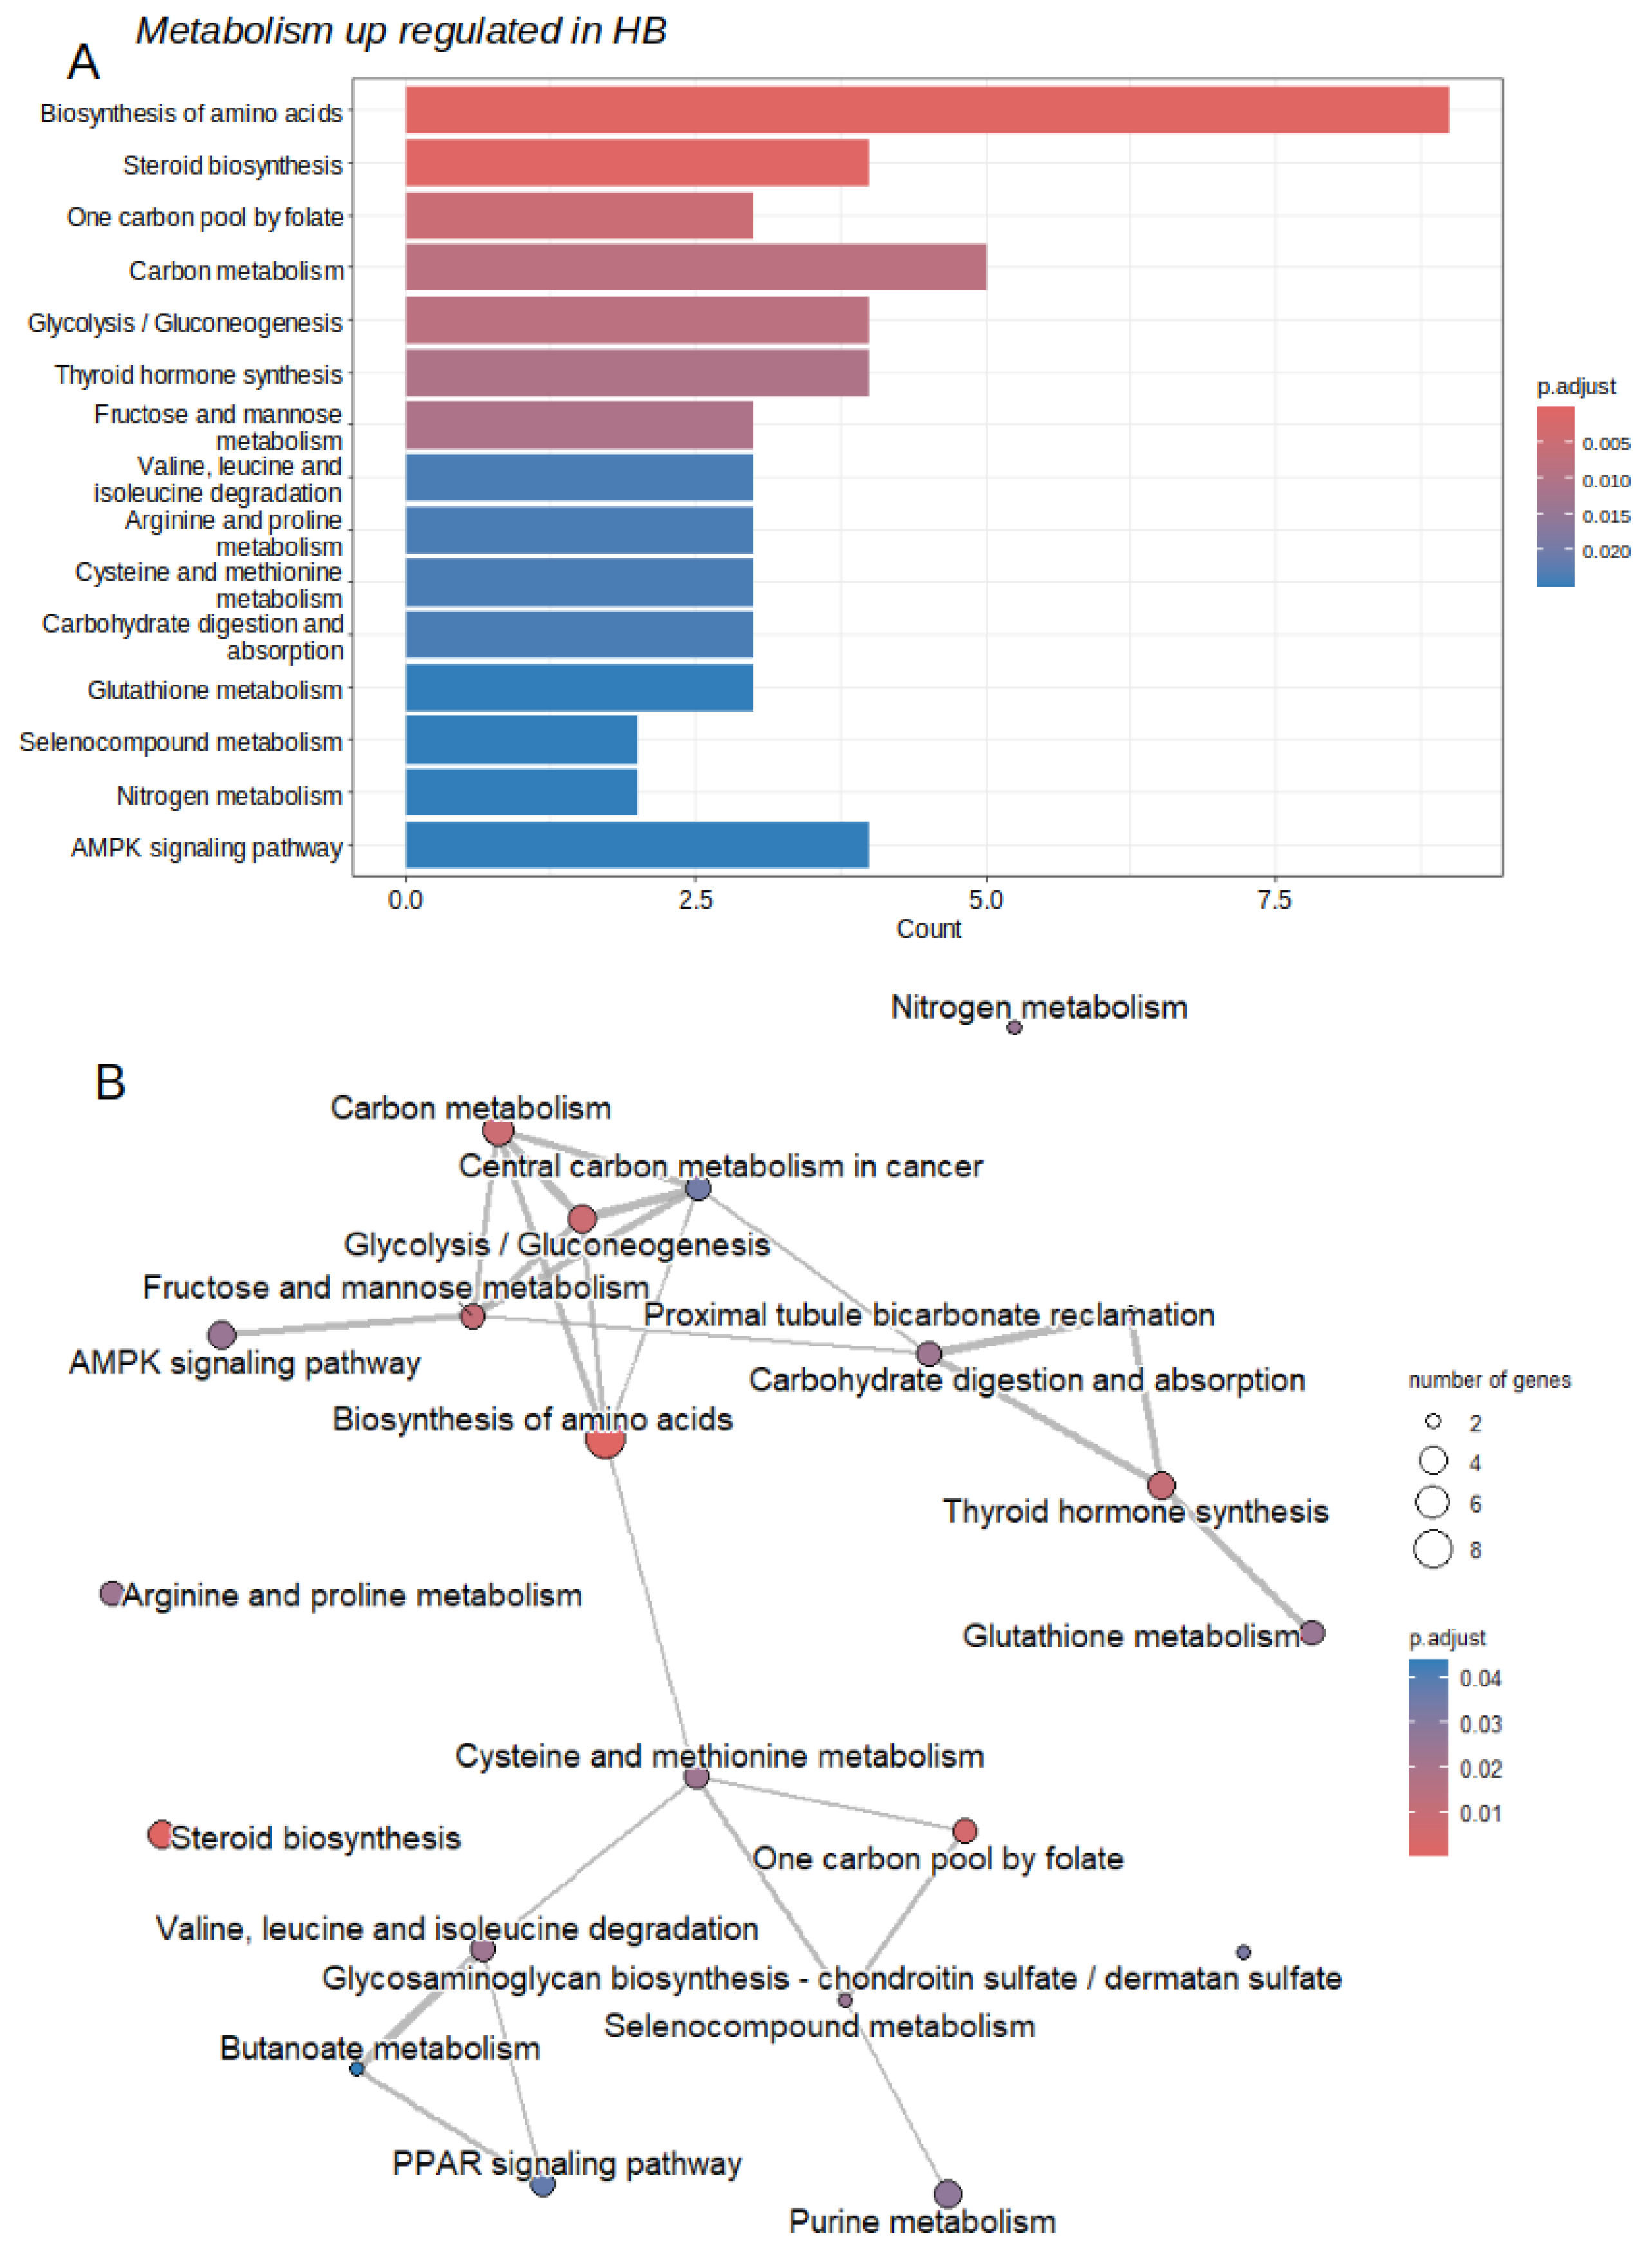
Because the Warburg effect considerably reduces hepatocyte metabolism during hepatic tumorigenesis [9], we focused our analysis on the metabolic enzymes found overexpressed in the tumor. Among 287 differentially expressed enzymes in bulk transcriptome analyses, 59 of them were found over expressed in tumor samples as compared to adjacent liver tissue (Figure 1A, Table S1). Functional enrichment of over expressed enzymes was performed on Kyoto Encyclopedia of Genes and Genomes (KEGG) database. During this enrichment 45 of 59 enzymes were found recognized by KEGG database. This enrichment highlighted significance for molecules implicated in amino acid, carbohydrate, steroid, one carbon, purine, and glucoaminoglycan metabolisms (Figure 2 and Table 1).

2.3. Activated Metabolic Network in Hepatoblastoma Tumors

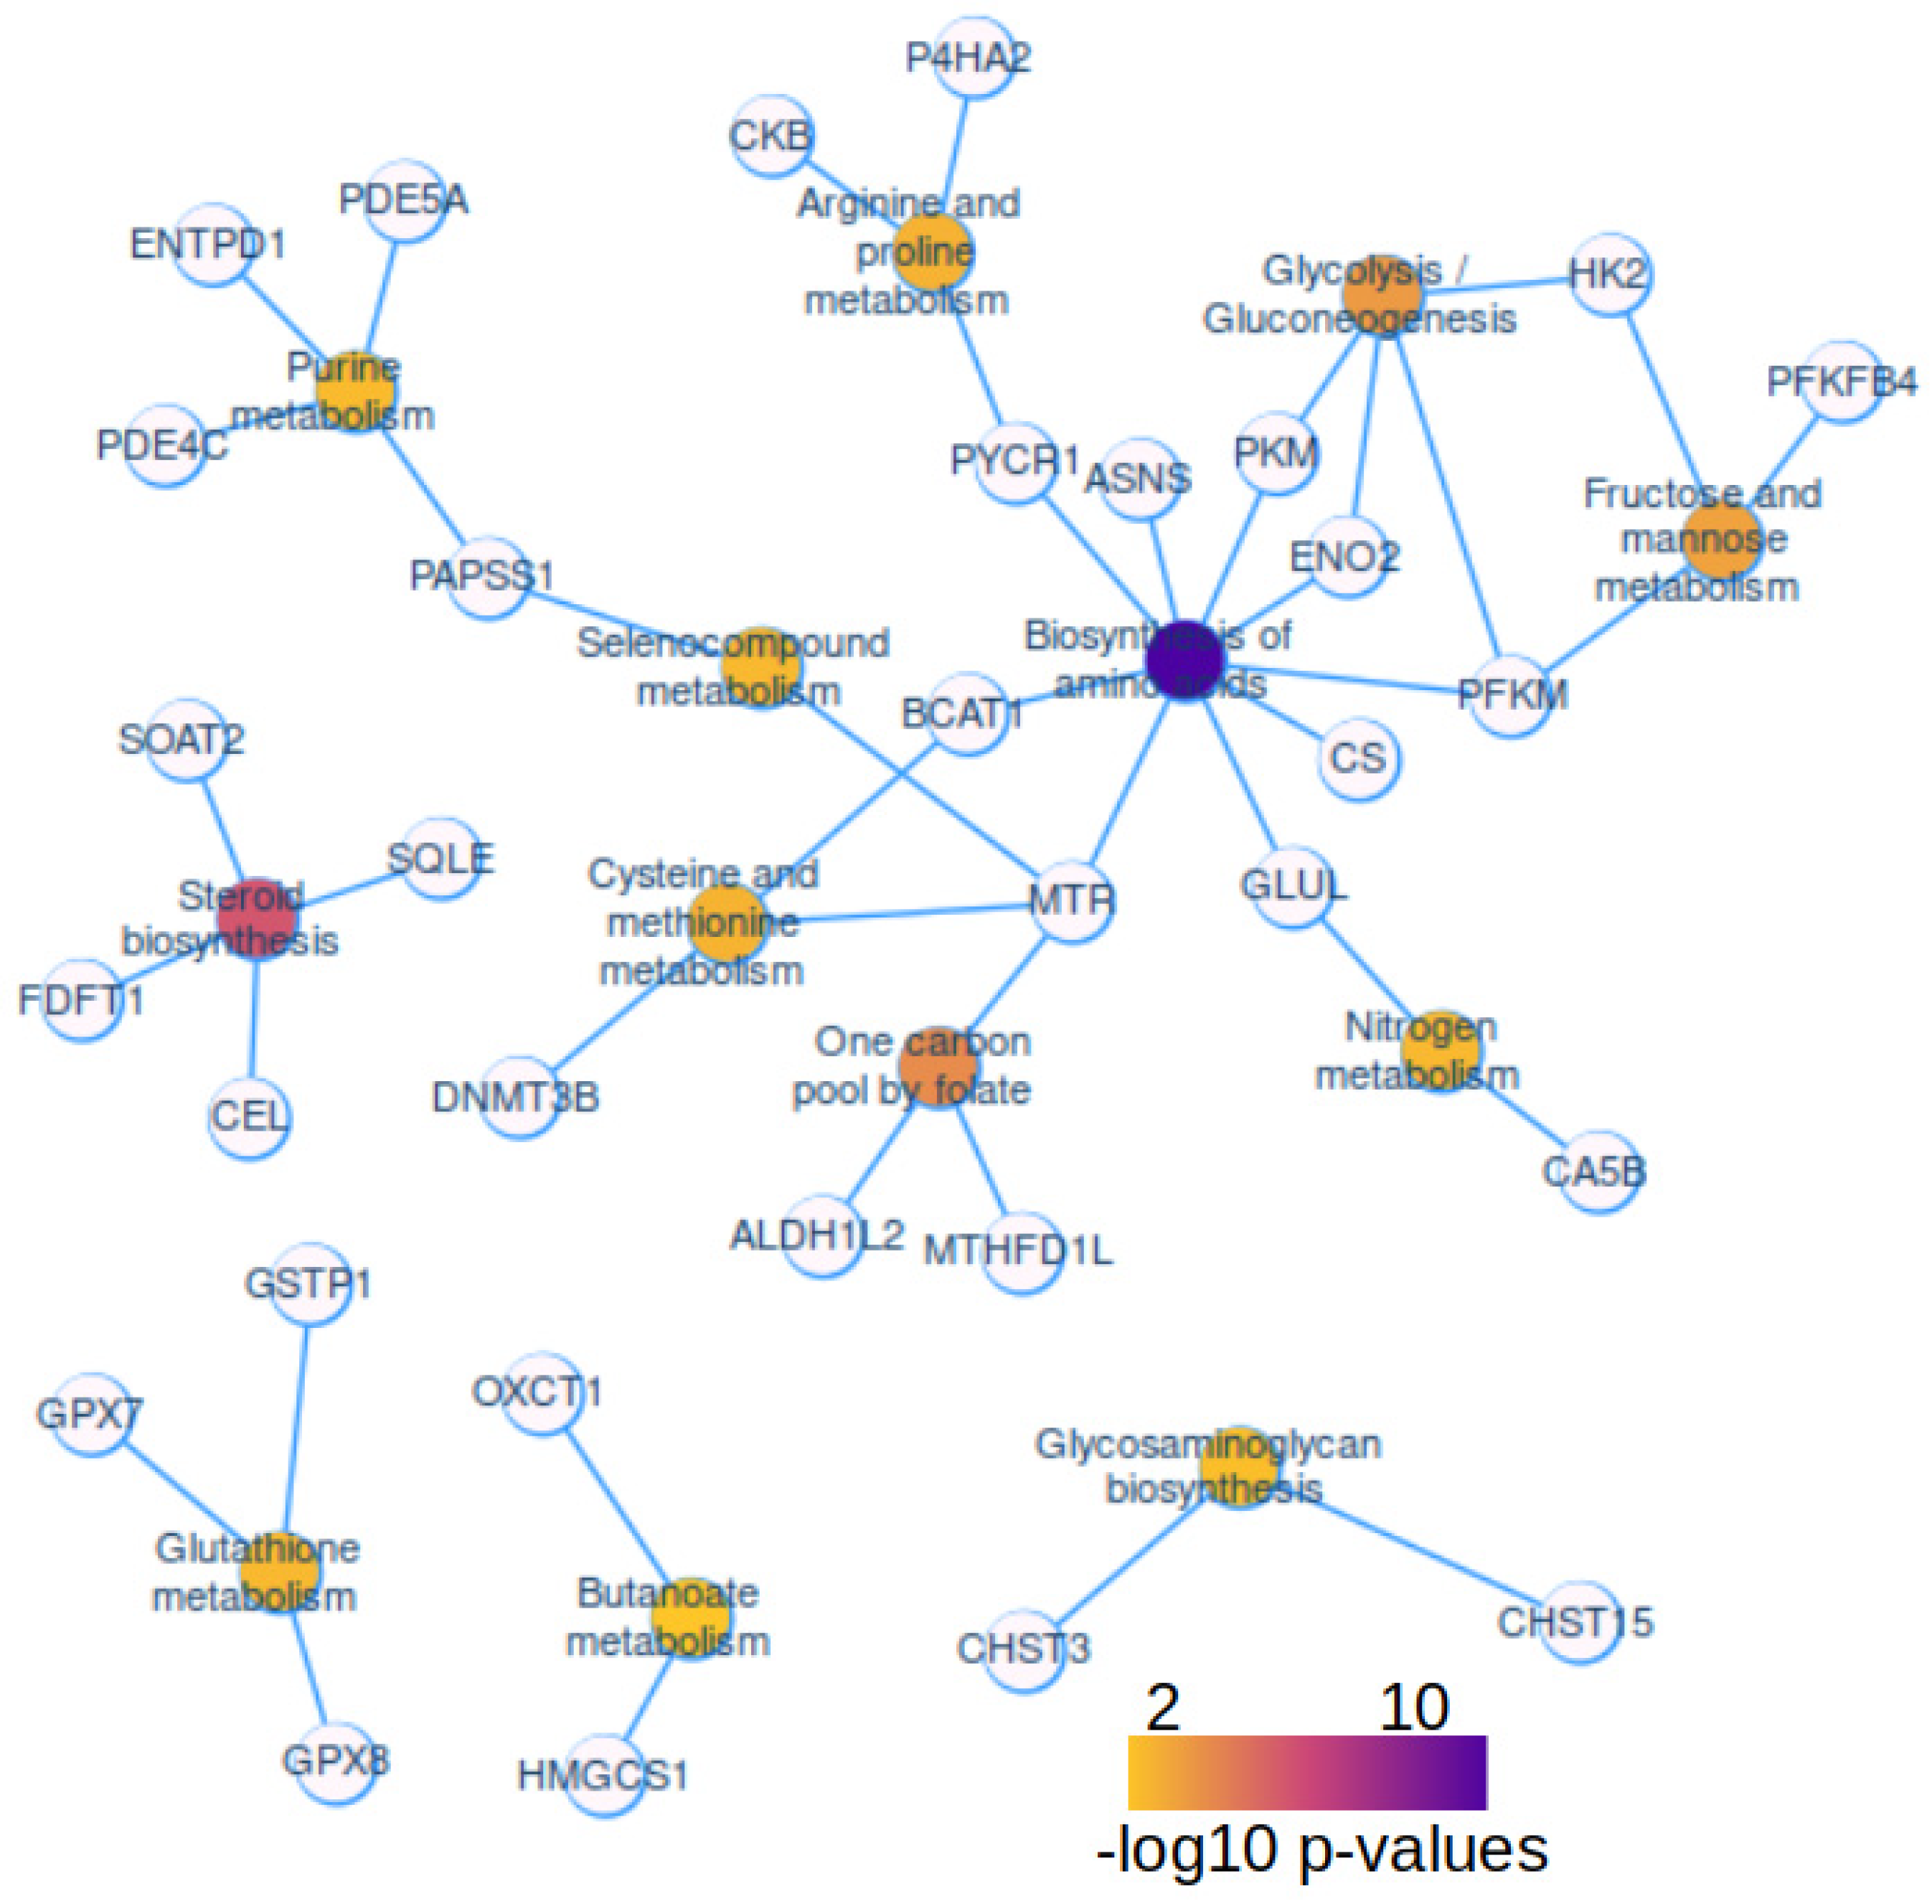
With KEGG enrichment performed on metabolic enzymes over expressed in hepatoblastoma tumors, a functional enrichment network was built with Cytoscape application. This network highlighted high connectivity and central implication around biosynthesis of amino acid metabolism (Figure 3). Biosynthesis of amino acid metabolism enrichment harbored 9 direct connections with enzymes: pyrroline-5-carboxylate reductase 1 (PYCR1), asparagine synthetase (glutamine-hydrolyzing) (ASNS), pyruvate kinase M1/2 (PKM), enolase 2 (ENO2), phosphofructokinase, muscle (FPKM), citrate synthase (CS), glutamate-ammonia ligase (GLUL), 5-methyltetrahydrofolate-homocysteine methyltransferase (MTR), and branched chain amino acid transaminase 1 (BCAT1). Biosynthesis of amino acid is the most significant enrichment (FDR q-value= 7.40E-09, Table 1). On this metabolic network it is interesting to notice the implication of DNA methyltransferase 3 beta (DNMT3B) in cysteine and methionine metabolism (Figure 3). The second most significant metabolism: steroid metabolism (FDR q-value=1.03E-04, Table 1) was isolated in the KEGG network. It includes four enzymes: squalene epoxidase (SQLE), carboxyl ester lipase (CEL), farnesyl-diphosphate farnesyltransferase 1 (FDFT1), and sterol O-acyltransferase 2 (SOAT2) (Figure 3). One carbon pool of folate was found implicated with three enzymes (FDR q-value= 3.39E-03, Table 1): 5-methyltetrahydrofolate-homocysteine methyltransferase (MTR), aldehyde dehydrogenase 1 family member L2 (ALDH1L2), and methylenetetrahydrofolate dehydrogenase (NADP+ dependent) 1 like (MTHFD1L). Carbohydrate metabolism was found represented by several partners: hexokinase 2 (HK2), 6-phosphofructo-2-kinase (PFKFB4), some of them shared with amino acid biosynthesis metabolism (like PKM, PFKM, and ENO2) (Figure 3).

2.4. High Level of Metabolic Score at Single Cell Level in Tumor Cells from Hepatoblastoma

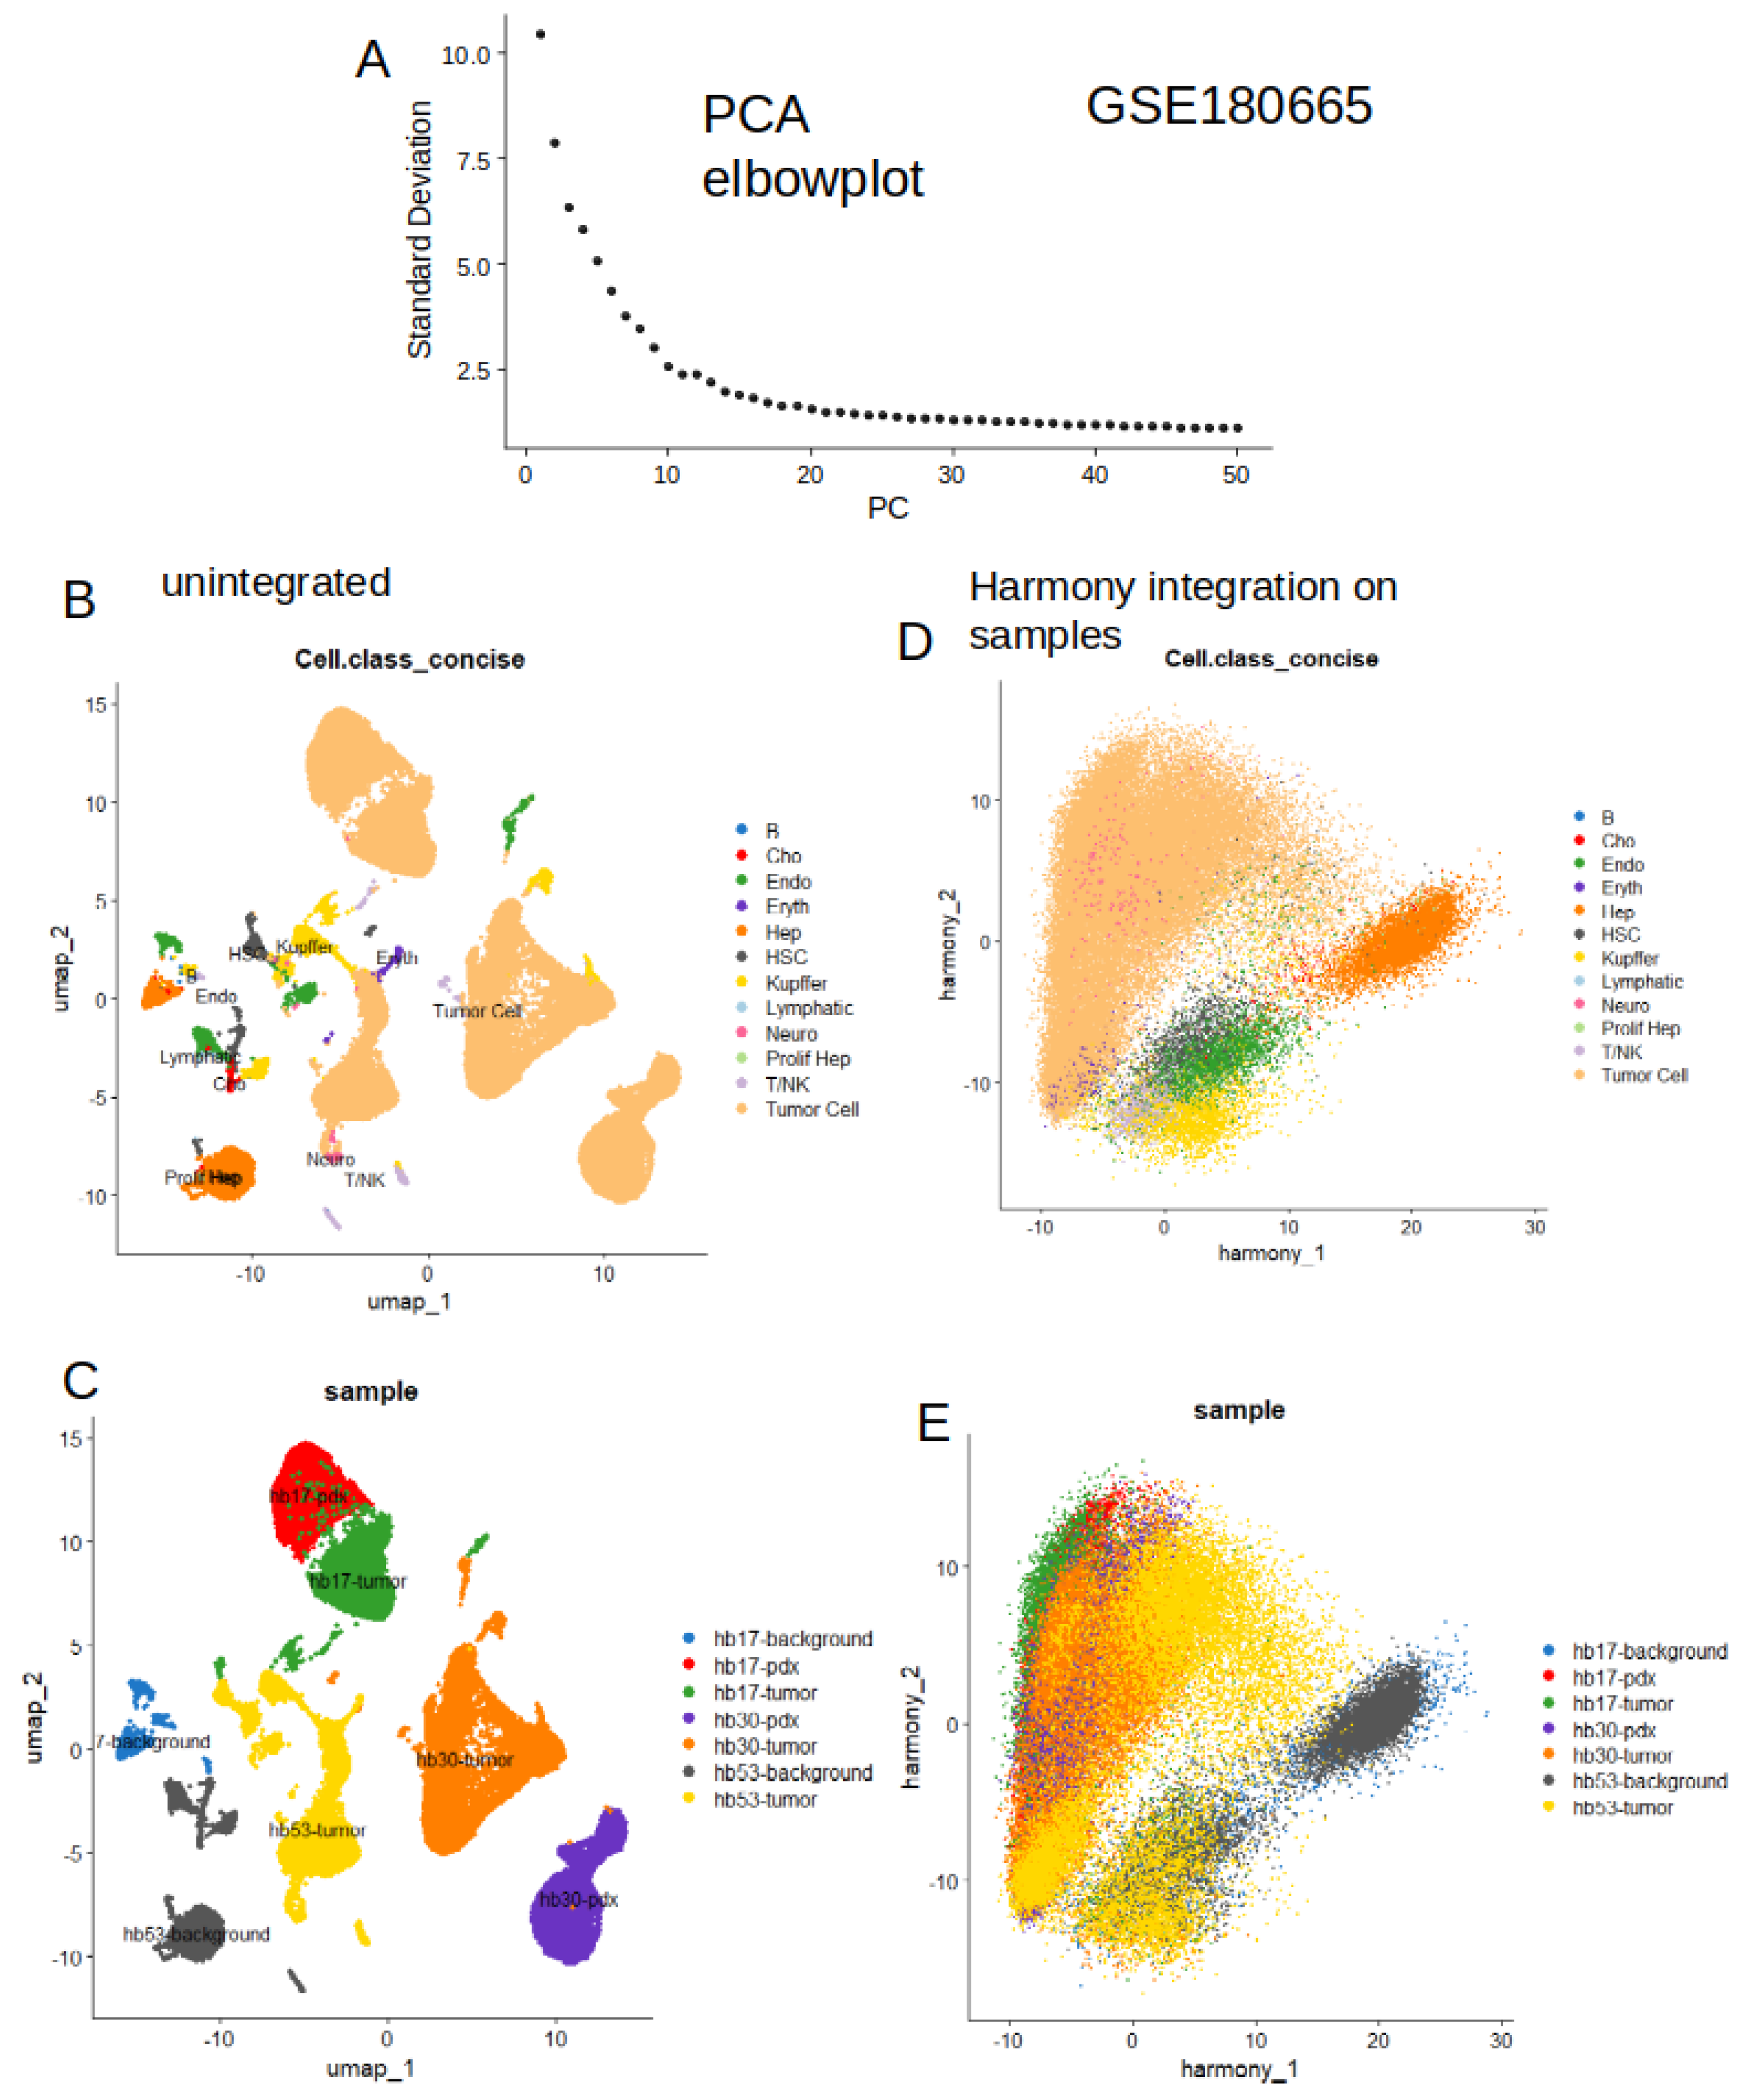
To validate metabolic signature observed in bulk RNA-sequencing, single cell expression of these tumor up regulated enzymes was investigated in single cell RNA-sequencing dataset GSE180665 [39]. This dataset comprised seven experiments of 10x Genomics single cell RNA-seq performed on three hepatoblastoma tumors, two patients derived-xenotransplant models (PDX) and two liver adjacent tissues. Sequencing counts from the seven experiments were integrated in a same single cell Seurat object to perform dimension reduction by principal component analysis (Figure 4A) follow by UMAP pipeline (Figure 4B). Cells were annotated with their original cell annotation (Figure 4B). Sample identity projection on UMAP dimension reduction revealed an heterogenous integration of the seven samples (Figure 4C). A harmony integration was done this single-cell object according split by sample origin. Harmony integration well stratified original cell annotation (Figure 4D) and also allowed good integration of samples according to their origins (Figure 4E). These results suggest that harmony integration allowed to integrate correctly the seven experiments of GSE180665 dataset with a satisfying stratification of the original cell type annotation.
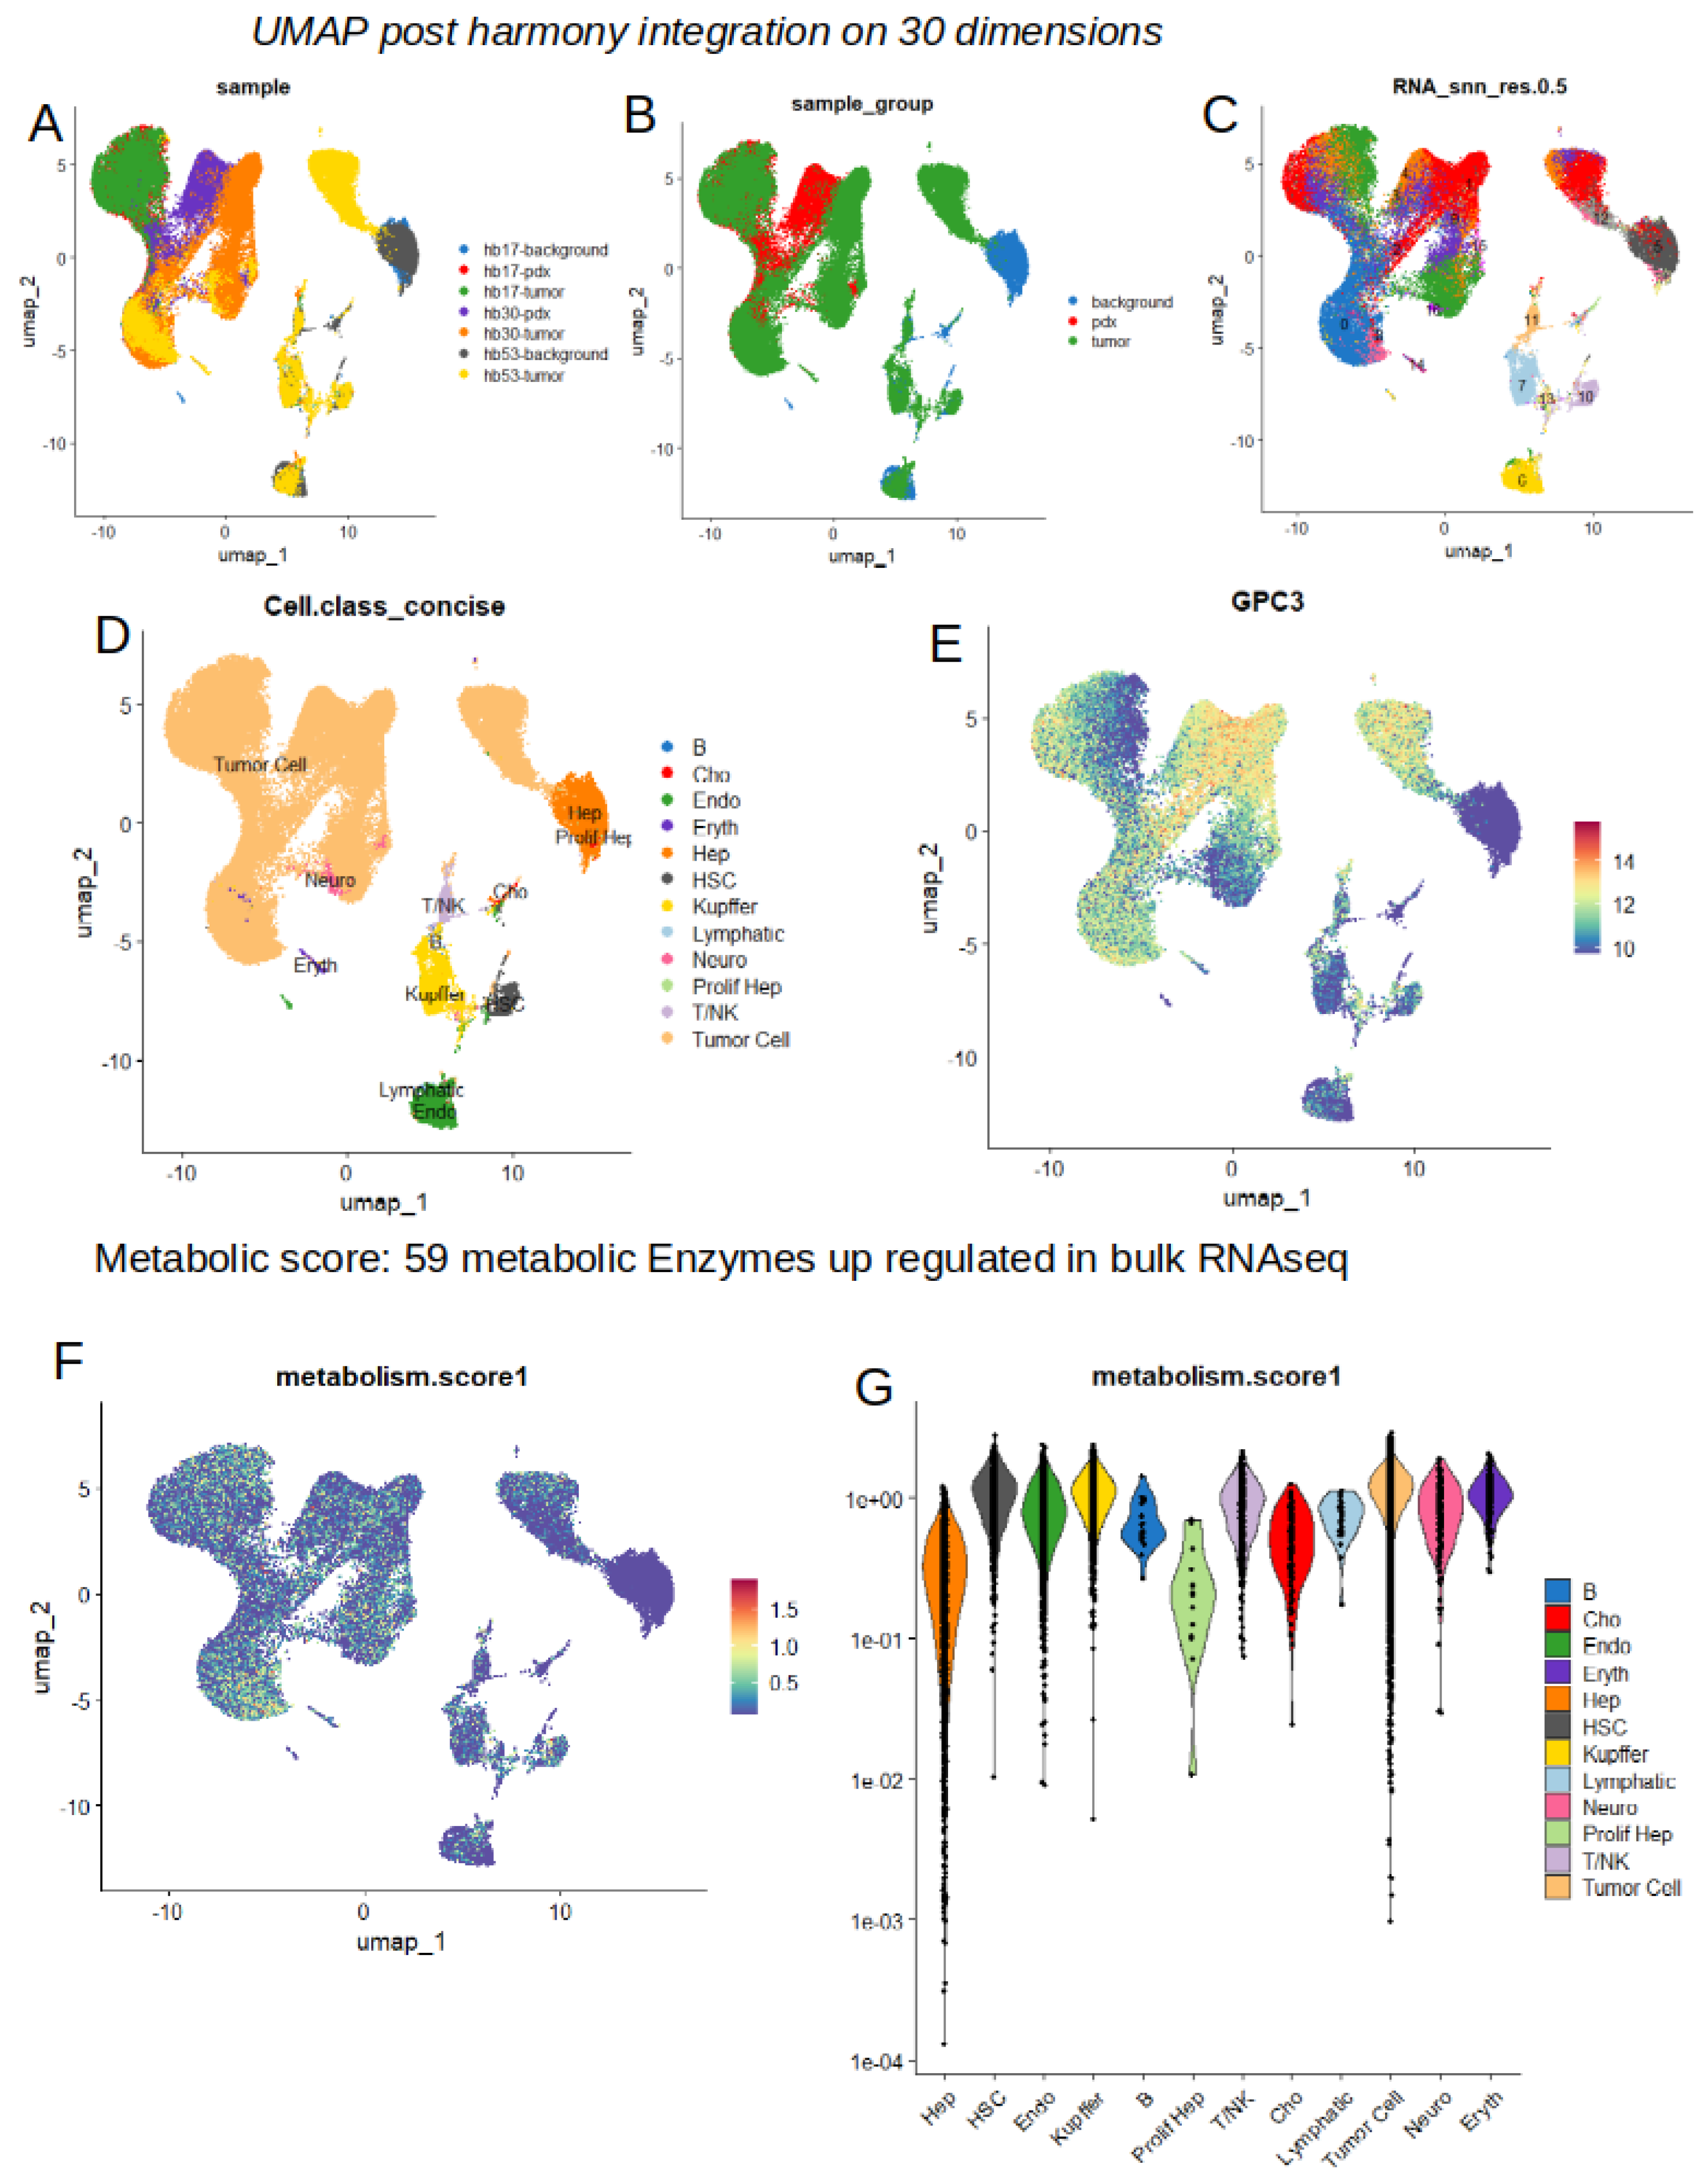
A second UMAP dimension reduction was performed on Harmony post integrate single cell object. This dimension reduction distributed correctly samples (Figure 5A) according to their sample groups (tumor, PDX, liver, Figure 5B), original cell clustering (Figure 5C), and original cell type annotation (Figure 5D). Glypican 3 is a known marker expressed in hepatoblastoma tumors [40], and effectively majority of hepatoblastoma tumor cells expressed this marker but not expressed in normal hepatocytes (Figure 5D). With “AddModuleScore” Seurat function [41], a metabolic score was computed according to the expression of the 59 enzymes found to be over expressed in hepatoblastoma tumors (Table S1). As expected, this metabolic score was found particularly higher in hepatoblastoma tumor cells as compared to other cell types present in the samples (Figures 5F and 5G).

2.5. Increase of Metabolic Score is Highly Predictive of Tumor Cell Status in Single Cell Transcriptome from Hepatoblastoma

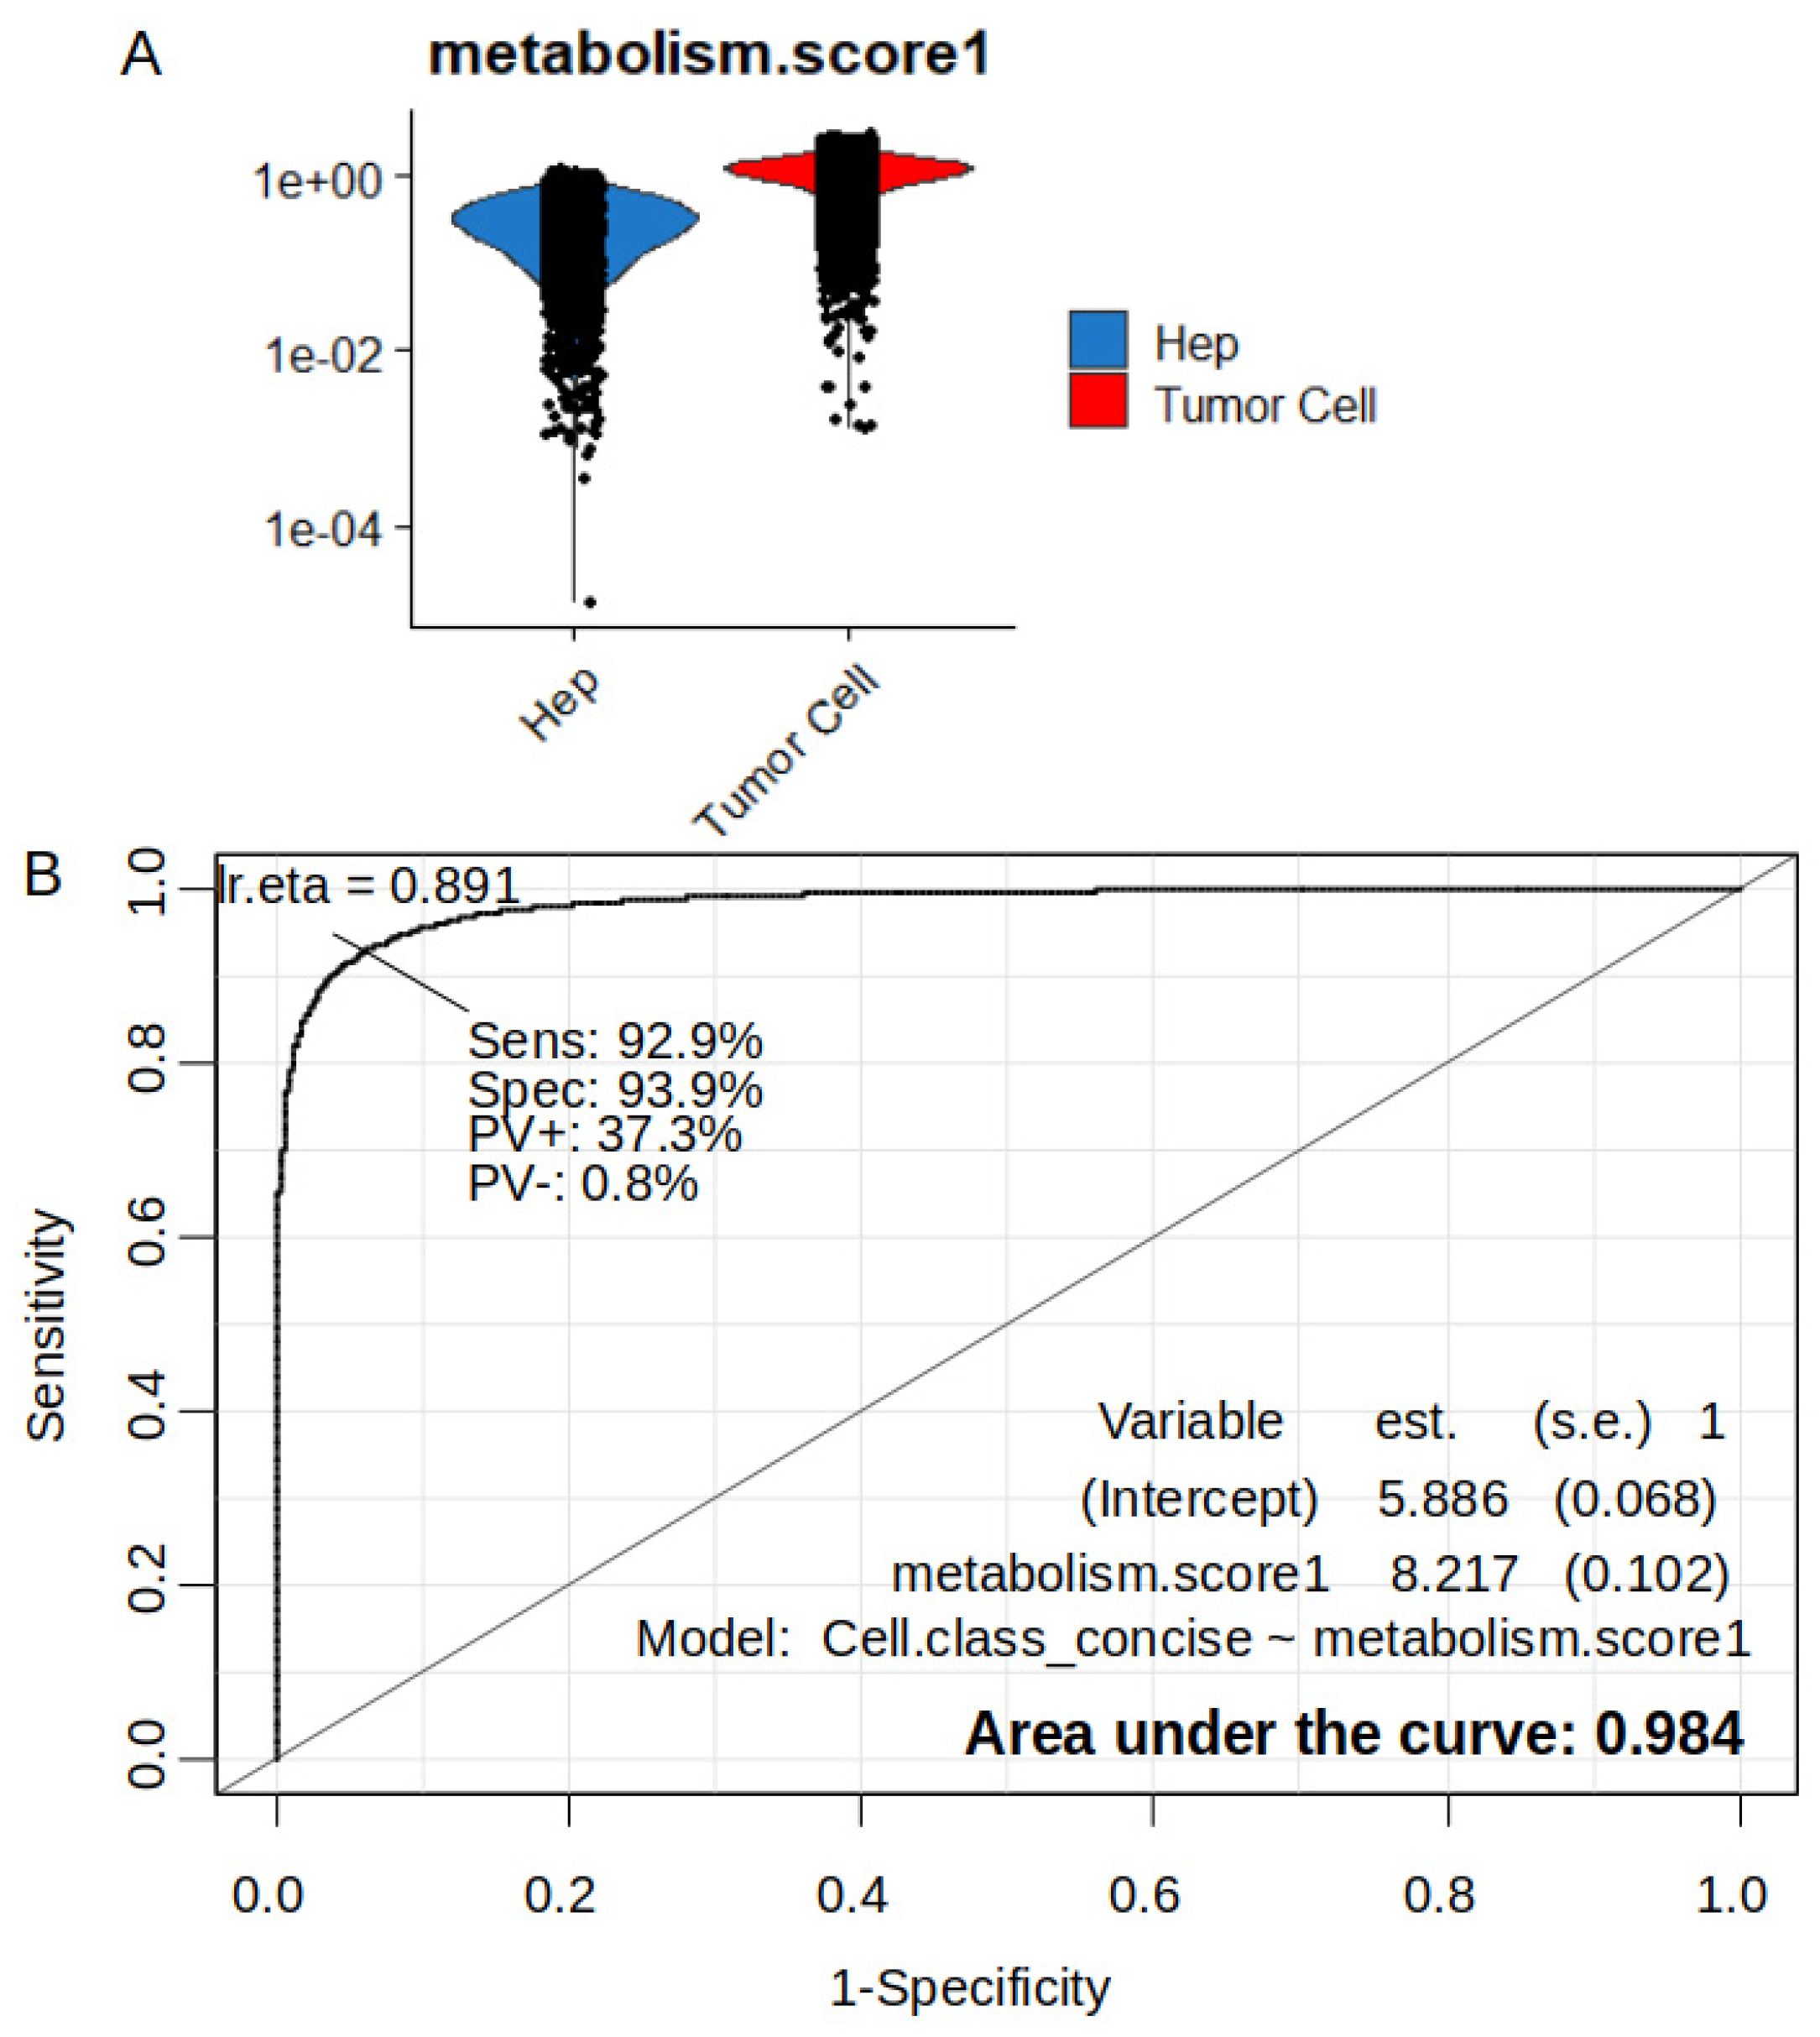
Computing metabolic score at single cell level in dataset GSE180665 allowed to confirm that this metabolic score was particularly higher in tumor cells (human or PDX) as compared to normal hepatocytes. Single-cell object was subset according to tumor cell and hepatocytes identities (Figure 6A) and metabolic score was confirmed higher in tumor cells as compared to normal hepatocytes (2-sided t-test, p-value<2.2e-16, Figure 6A). ROC curve computed on metabolic score to predict tumor cell identity versus normal hepatocyte allowed to highlight an area under curve (AUC) of 0.984 (Figure). Metabolic score predicted tumor cell status with a sensibility of 0.93 and a specificity of 0.94 (Figure 6B). These results suggest that metabolic score is highly predictive of the tumor cell status at single cell level.

2.6. Importance of Over Expressed Metabolic Markers to Predict Tumor Cell Status in sc-RNAseq of Hepatoblastoma Samples

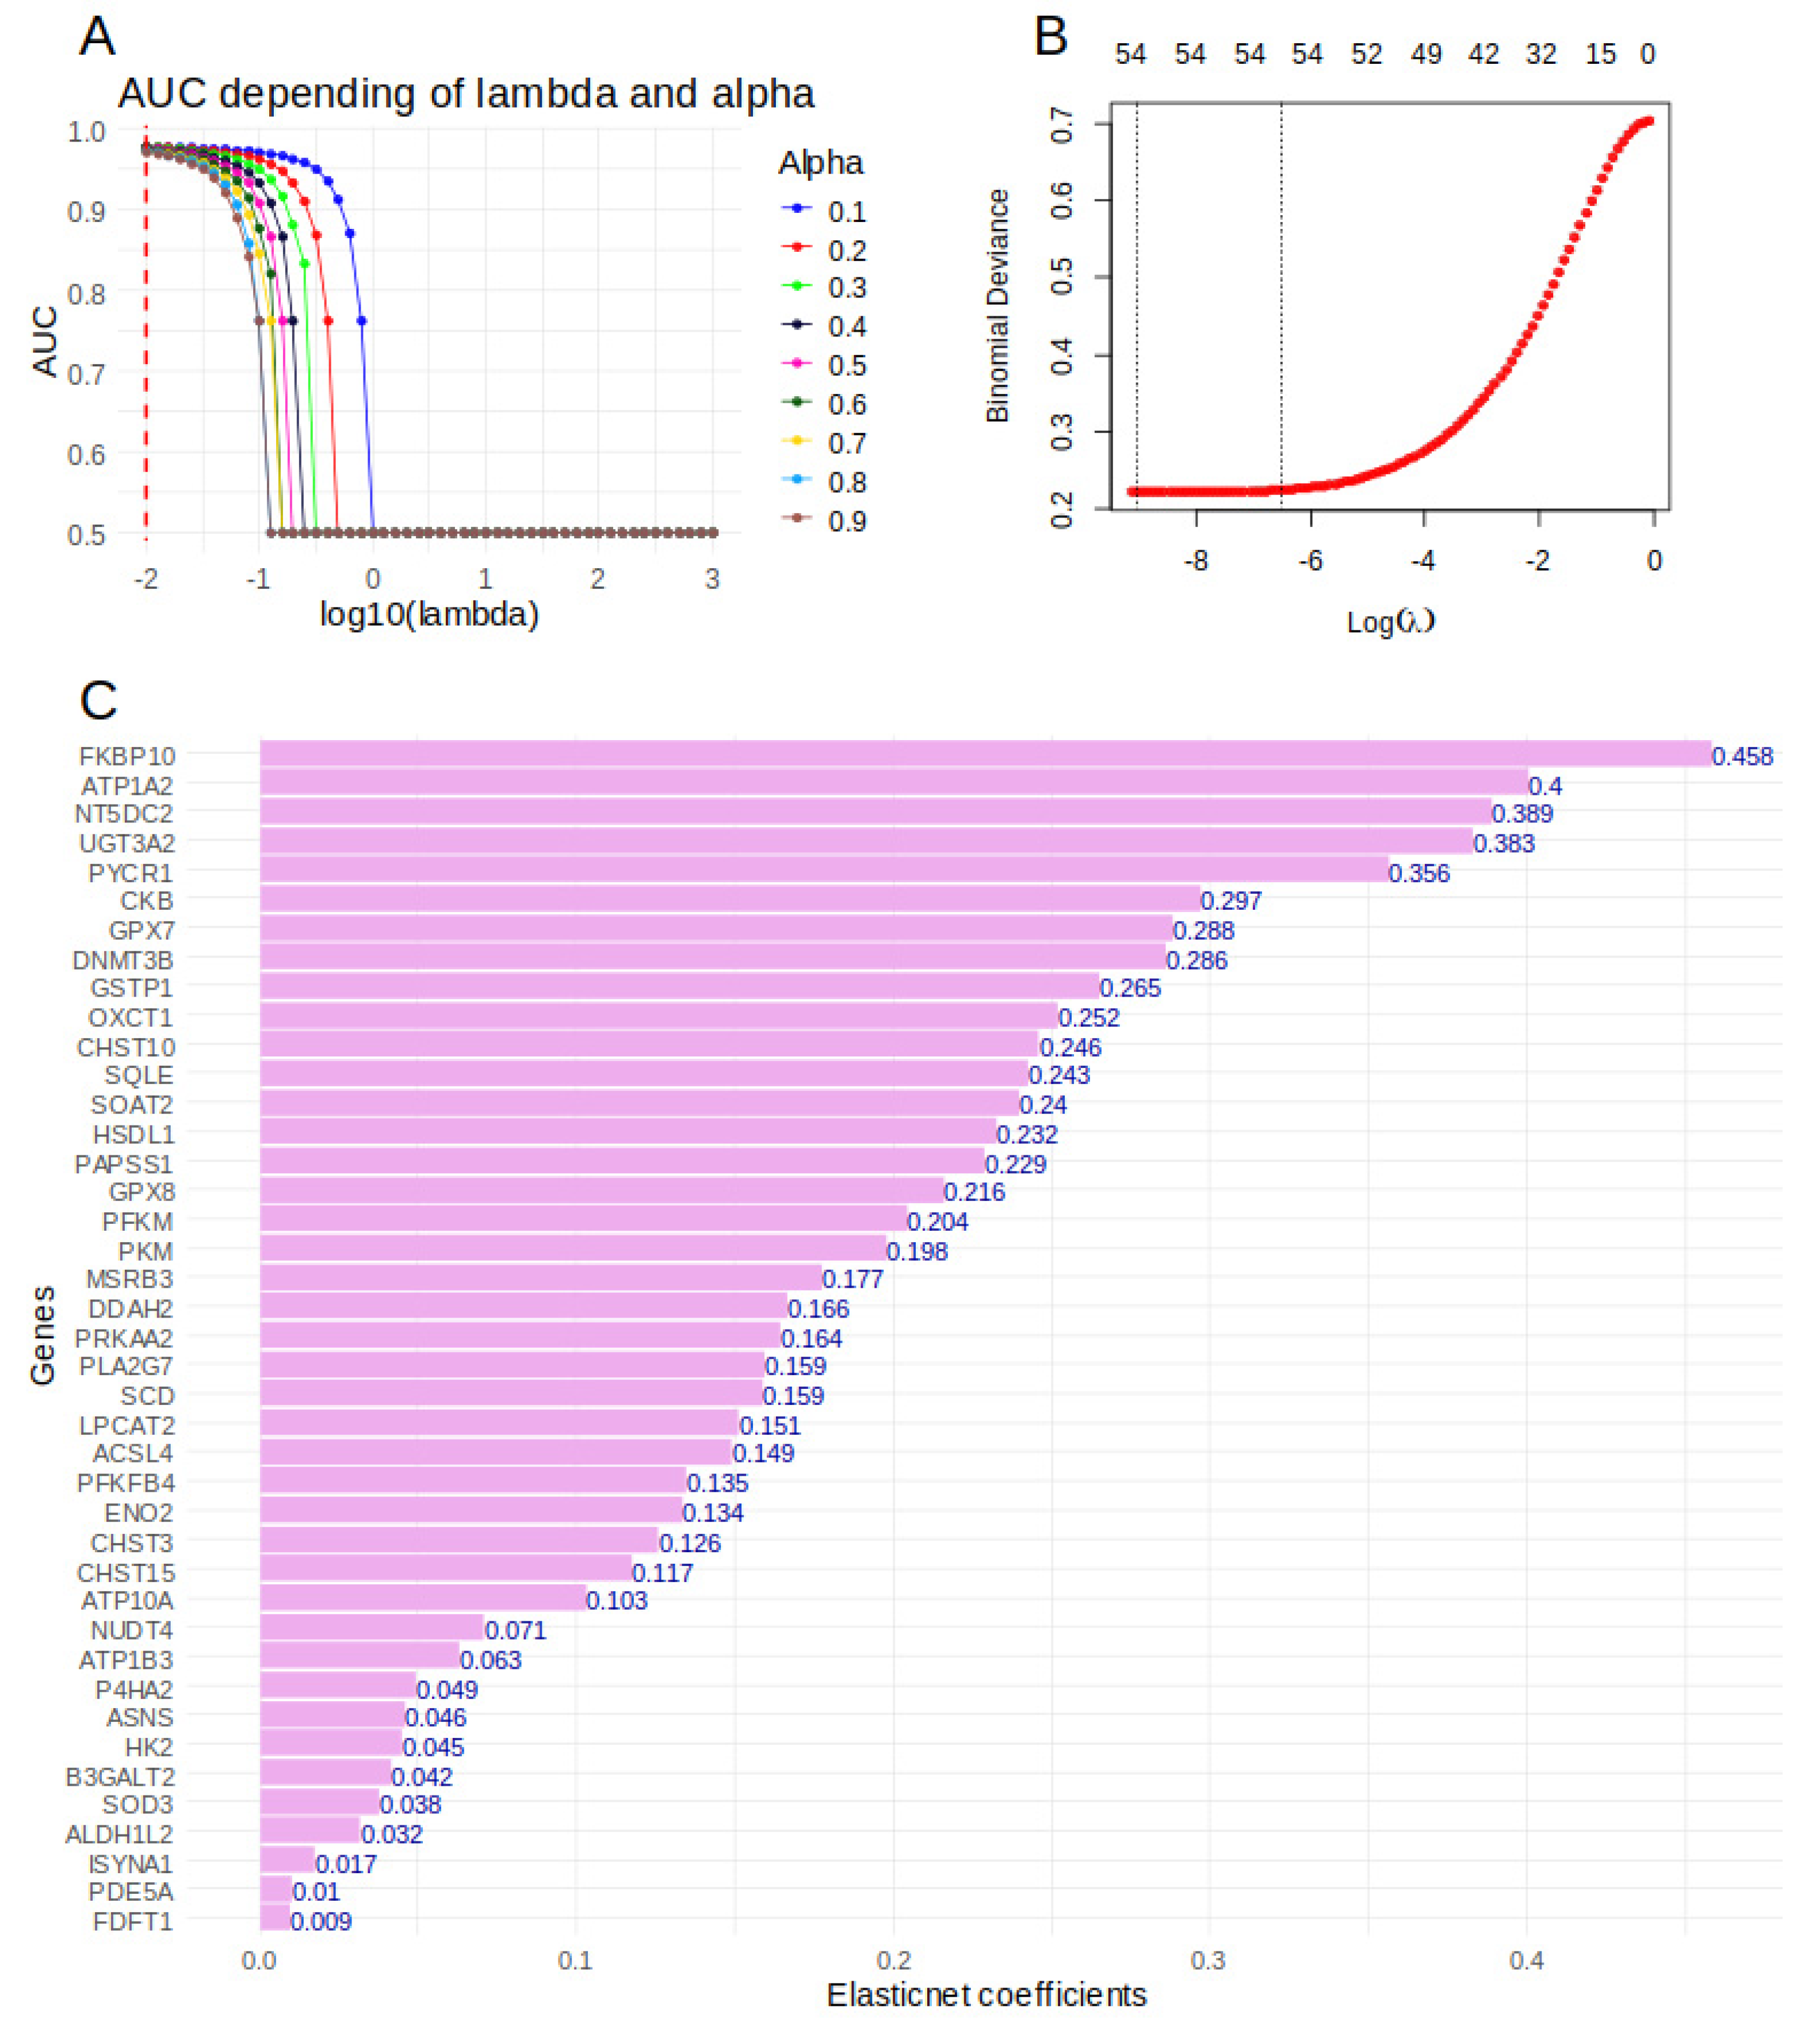
The metabolic score has been demonstrated at the single-cell level to be highly predictive of tumor cell status. On the sc-RNAseq dataset GSE180665, an artificial intelligence model by Elasticnet was therefore established in order to demonstrate the individual importance of each enzyme participating in the calculation of the metabolic score. The single cell object restrained to tumor cell and hepatocytes identities was splitted in training and validation set (ratio 0.7/0.3). Tuning of alpha and lambda parameters in elastinet model to predict tumor cell status was performed (Figure 7A). Area under curve (AUC=0.975) was found best for an alpha value of 0.1 (Figure 7B). In second step optimal elasticnet model was fit for an alpha value of 0.1 (Figure S2A). Elasticnet coefficients estimation was performed by determination of coefficient of variation in an interval of best lambda parameter (Figure 7B). On the 59 over expressed enzymes in hepatoblastoma tumors, 41 of them were found with a positive coefficient in the elasticnet model which predict tumor cell status at single cell level (Figure 7C). Combined expression of these 41 enzymes with positive elasticnet coefficient still predict tumor cell status with an AUC of 0.965, a sensibility of 0.88 and a specificity of 0.95 (Figure S2B). This optimal Elasticnet model (alpha=0.1, AUC 0.975) allowed to rank markers by their decreasing importance to predict tumor cell status, the top ten was: FKBP prolyl isomerase 10 (FKBP10), ATPase Na+/K+ transporting subunit alpha 2 (ATP1A2), 5'-nucleotidase domain containing 2 (NT5DC2), UDP glycosyltransferase family 3 member A2 (UGT3A2), pyrroline-5-carboxylate reductase 1(PYCR1), creatine kinase B (CKB), glutathione peroxidase 7 (GPX7), DNA methyltransferase 3 beta (DNMT3B), glutathione S-transferase pi 1 (GSTP1), and 3-oxoacid CoA-transferase 1 (OXCT1).

3. Discussion

In hepatoblastoma, metabolic reprogramming is particularly relevant due to the liver's intrinsic metabolic functions. For instance, enhanced glycolysis, glutaminolysis, and fatty acid synthesis have been implicated in the proliferation and survival of hepatoblastoma cells [16,17,18]. In the present work, up regulation of metabolic enzyme program was investigated in hepatoblastoma tumor at tissue and single cell level. We confirmed main alteration of carbohydrate metabolism which share some enzymes with amino acid biosynthesis metabolism such as: PKM, PFKM and ENO2. PKM2 is an alternative-splice isoform of the PKM gene. The M2 pyruvate kinase (PKM2) isoform is upregulated in most cancers and plays a crucial role in regulation of the Warburg effect, which is characterized by the preference for aerobic glycolysis over oxidative phosphorylation for energy metabolism. Antisense oligonucleotide-based PKM splice switching has been proposed as a targeted therapy for liver cancer [42]. During hepatocellular carcinoma, ZEB1 has been shown to enhance Warburg effect, facilitating tumorigenesis and metastasis of liver cancer by transcriptionally activating PFKM [12]. In amino acid biosynthesis GLUL and ASNS have been shown to be correlated to overall survival during hepatoblastoma. Hepatoblastoma samples showed strong GLUL expression and glutamine synthesis, generally as a result of CTNNB1 mutations. Glutamine depletion resulted in the inhibition of proliferation and of cell viability in embryonal hepatoblastoma cell lines [43]. In metabolic enrichment network, steroid metabolism was also highlighted as isolated subnetwork implicating: SQLE, SOAT2, FDFT1, and CEL. Carboxyl ester lipase is implicated in reverse cholesterol transport [44] , and confers susceptibility to alcoholic liver cirrhosis[45]. Squalene epoxidase (SQLE) is known to promote the growth and migration of the hepatocellular carcinoma cells [46]. During Zebrafish embryogenesis, Sterol O-Acyltransferase 2 contributes to the yolk cholesterol trafficking [47].
During our work interconnection between metabolism and epigenetics were observed and especially with potential regulations of DNA methylation. DNMT3B belongs to epigenetic machinery implicated in DNA methylation. During hepatoblastomas a general disrupted expression of genes from the epigenetic machinery was observed, mainly UHRF1, TET1, and TET2 upregulation, in association with an enrichment of 5hmC content. These alterations support a model of active demethylation by TETs in hepatoblastoma, probably during early stages of liver development, which in combination with UHRF1 overexpression would lead to DNA hypomethylation and an increase in overall 5hmC content [48]. During development of metabolic disfunction associated to liver cancer, it was observed some associations between the rare and common germline variants in one-carbon metabolism and DNA methylation genes [49]. KEGG enrichment network of hepatoblastoma tumor cells has shown enrichment in one carbon metabolism enzymes, regulating pool of folates. Depletion of folates is connected to the aggressiveness of cancer phenotype [50], and folate pool can be dependent of purine nucleotide biosynthesis. Hepatoblastoma tumor cells were displaying in up regulation of purine metabolism through enhance expression of ENTPD1, PDE4C, PDE5A, and PAPSS1. Disruption of ENTPD1 (Cd39) perturbates metabolism (purinergic signaling) during liver development [51]. Use phosphodiesterase inhibitor during chronic liver injury and metabolic diseases potentially impact on Cyclic AMP (cAMP) signaling, particularly in the regulation of fatty acid (FA) β-oxidation and pro-inflammatory polarization of tissue-resident lymphocytes [52]. in HEpG2 cell line, PAPSS1/2 knockdown significantly activated farnesoid X receptor (FXR), retinoid-related orphan receptor, and pregnane X receptor responsive reporters, and treatment with the FXR agonist GW4064[53].
One carbon metabolism deregulation in hepatoblastoma tumor implicated: 5-methyltetrahydrofolate-homocysteine methyltransferase (MTR), aldehyde dehydrogenase 1 family member L2 (ALDH1L2), and methylenetetrahydrofolate dehydrogenase (NADP+ dependent) 1 like (MTHFD1L). Mitochondrial folate-dependent one-carbon (1-C) metabolism converts 1-C donors such as serine and glycine to formate, which is exported and incorporated into the cytoplasmic tetrahydrofolate (THF) 1-C pool [54]. The folate cycle, through transfer of a carbon unit between tetrahydrofolate and its derivatives in the cytoplasmic and mitochondrial compartments, produces other metabolites that are essential for cell growth, including nucleotides, methionine, and the antioxidant NADPH Folate cycle enzyme MTHFD1L is known to confer metabolic advantages in hepatocellular carcinoma [55]. During embryonic development, the methylation of DNA and histones drives cell division and regulation of gene expression through epigenesis and imprinting. Folate cycle and methyltransferase enzymes are important actors of methyl transfer processes [56].
At single cell level, machine learning model ranked top ten mRNAs to predict tumor cell status during hepatoblastoma: FKBP10, ATP1A2, NT5DC2, UGT3A2, PYCR1, CKB, GPX7, DNMT3B, GSTP1, and OXCT1. FKBP10, is a member of the FK506-binding protein (FKBP) family, and has been implicated in cancer development [57]. During lung cancer, gain- and loss-of-function assays show that FKBP10 boosts cancer growth and stemness via its peptidyl-prolyl-cis-trans-isomerase (PPIase) activity. Also, FKBP10 interacts with ribosomes, and its downregulation leads to reduction of translation elongation at the beginning of open reading frames (ORFs), particularly upon insertion of proline residues [58]. ATP1A2 has been shown highly expressed during platinum-resistant ovarian cancer [59]. During hepatocellular carcinoma, NT5DC2 promotes tumor cell proliferation by stabilizing EGFR [60]. UGT3A2 an UDP-glycosyltransferase (UGT) is implicated in exogenous polycyclic aromatic hydrocarbons (PAHs) detoxification [61]. pyrroline-5-carboxylate reductase (PYCR1) participates to mitochondrial proline metabolism reprogramming and promotes liver tumorigenesis [62]. Creatine kinase B (CKB) suppresses ferroptosis by phosphorylating GPX4[63]. GPX7 with GPX4 are known to be overexpressed in hepatocellular carcinoma tissues [64]. GSTP1 gene is preceded by a large CpG-rich region that is frequently affected by methylation during cancer[65]. 3-oxoacid CoA-transferase 1 (OXCT1), a rate-limiting ketolytic enzyme whose expression is suppressed in normal adult liver tissues, is re-induced by serum starvation-triggered mTORC2-AKT-SP1 signaling in HCC cells [66]. Top ten enzymes of the hepatoblastoma metabolic score confirmed potential reprogramming of these tumoral cells.
During this work, a complex interplay between metabolic reprogramming and epigenetic dysregulation in hepatoblastoma through overexpression of DNMT3B and implication of one carbon metabolism in tumor cells, highlighting potential therapeutic targets and biomarkers for this aggressive pediatric cancer. This study provides novel insights into the molecular underpinnings of hepatoblastoma and underscores the value of integrated single-cell analyses in understanding cancer biology.

4. Conclusions

During this work, a complex interplay between metabolic reprogramming and epigenetic dysregulation in hepatoblastoma through overexpression of DNMT3B and implication of one carbon metabolism in tumor cells, highlighting potential therapeutic targets and biomarkers for this aggressive pediatric cancer. This study provides novel insights into the molecular underpinnings of hepatoblastoma and underscores the value of integrated single-cell analyses in understanding cancer biology.

5. Materials and Methods

5.1. Public Dataset of RNA-Sequencing Performed on Human Hepatoblastoma Tissues

RNA-sequencing performed on tumor and adjacent liver tissue from human hepatoblastoma was investigated through Gene Expression Omnibus (GEO) [67,68] dataset GSE104766 [38]. Original RNA-seq counts from this study was downloaded at the following web address: https://www.ncbi.nlm.nih.gov/geo/query/acc.cgi?acc=GSE104766 (accessed on 2024, August 1st ).

5.2. Public Dataset of Single Cell RNA_Sequencing Performed on Hepatoblastoma Samples

Single cell RNA-sequencing experiments from GEO dataset GSE180665 [39] were downloaded at the following web address: https://www.ncbi.nlm.nih.gov/geo/query/acc.cgi?acc=GSE180665 accessed on 2024, August 1st ). This dataset comprised comprised seven sc-RNAseq 10xGenomics experiments performed on: three hepatoblastoma tumors, two patient derived xenotransplantation (PDX) models, and two liver adjacent tissue. Raw counts in H5AD format were converted and in single cell experiment object with zellkonverter R-bioconductor package [69]. Original cell annotation was added to the metadata of the scRNAseq object after its transformation in Seurat object [41].

5.3. Mammaliam Metabolic Transcriptional Program

Mammalian Metabolic Enzyme Database [70], was downloaded at the following web address: https://esbl.nhlbi.nih.gov/Databases/KSBP2/Targets/Lists/MetabolicEnzymes/MetabolicEnzymeDatabase.html (accessed on 2024, August 1st ) and annotated with Ensembl Biomart database version 110 [71] through geneconverter R-package accessible at the address: https://github.com/cdesterke/geneconverter (accessed on 2024, August 1st ).

5.4. RNA-Sequencing Analyses

Bioinformatics analyses were performed in R software environment version 4.4.1. RNA-sequencing counts were normalized with edgeR R-bioconductor package version 4.2.0 [72], and normalized count were voom transformed with limma R-bioconductor package version 3.60.3 [73,74]. For batch adjustment, a quantile normalization was applied on voom data with preprocessCore R-bioconductor package version 1.66.0 [75]. Differential expression analysis and transcriptome data visualization: heatmap, principal component analysis, and volcanoplot were performed with transpipe R-package version 1.4 available at the following web address: https://github.com/cdesterke/transpipe14 (accessed on 2024, August 1st ) [76]. With over expressed enzymes found in hepatoblastoma tumors, a functional enrichment was performed on Kyoto Encyclopedia of Genes and Genomes (KEGG) database [77] , clusterProfiler R-bioconductor package version 4.12.2 [78]. A metabolic functional enrichment network was built with Cytoscape stadalone application version 3.10.1 [79].

5.5. Single Cell RNA-Sequencing Metabolic Score Quantification

Based on single cell expression of the enzyme found over expressed in hepatoblastoma tumors by bulk RNA-sequencing, a metabolic score was computed at single cell level in sc-RNAseq dataset with “AddModuleScore” Seurat function [41]. ROC curve and area under curve to predict tumor cell status with metabolic score were determined with pROC R-package version 1.18.5 [80].

5.6. Machine Learning Elasticnet Model on Metabolic Markers

Single cell expression of overexpressed enzymes was extracted from tumor cell and normal hepatocyte in dataset GSE180665 and combined to the corresponding metadata. After data splitting data in training and validation sets (0.7/0.3 ratio), Elasticnet model (tumor cell status binary outcome) was tuning on alpha and lambda parameters with caret R-package version 6.0-94 [81]. Final Elasticnet was fit with best alpha parameter (alpha=0.1) with glmnet R-package version 4.1-8 [82].

Supplementary Materials

The following supporting information can be downloaded at the website of this paper posted on Preprints.org, Supplemental Figures: Figure S1: RNA-sequencing preprocessing of dataset GSE104766; Figure S2: Predictive values of activated metabolic markers in tumor cells from hepatoblastoma at single cell level; Supplemental tables: Table S1: Differential expressed metabolic markers in human hepatoblastoma tumors (10.6084/m9.figshare.26413144) available at address: https://figshare.com/articles/dataset/Table_S1_Differential_expressed_metabolic_markers_in_human_hepatoblastoma_tumors/26413144?file=48042013 (accessed on 2024, July 31th).

Author Contributions

C.D. P.P. and J.M-G. designed the study. C.D. and J.M-G. analyzed and interpreted data and wrote the manuscript. C.D. performed most of the experiments, with contributions from R.F. and C.M. A.M. and P.P. contributed to manuscript correction and data analysis. All authors have read and agreed to the published version of the manuscript.

Funding

P.P. and J.M-G. provided the funding of this article by MEAE AMBASS FRANCE AU PEROU FSPI - S-AC23007, Filière Santé Maladie Rare du Foie de l’Adulte et de l’Enfant.

Data Availability Statement

The bioinformatics scripts used during this work are accessible at the following address: https://github.com/cdesterke/hepatoblastoma2024_script (accessed on 2024, August 1st).

Acknowledgments

Thanks to the authors which let accessible omics data used during this work: for RNA-seq from dataset GSE104766, thanks to Katarzyna B Hooks et al. from university of Bordeaux (France), for single cell RNA-seq dataset thanks to Bruce J Aronow et al. from Cincinnati Children's Hospital Medical Center (Cincinnati, OH, USA).

Conflicts of Interest

The authors declare no conflict of interest.

References

  1. Spector, L.G.; Birch, J. The Epidemiology of Hepatoblastoma. Pediatric Blood & Cancer 2012, 59, 776–779. [Google Scholar] [CrossRef]
  2. Hager, J.; Sergi, C.M. Hepatoblastoma. In Liver Cancer; Departments of Pediatrics, Laboratory Medicine and Pathology, Stollery Children’s Hospital, University of Alberta, Edmonton, AB, Canada, Sergi, C.M., Eds.; Exon Publications, 2021; pp. 145–164 ISBN 978-0-645-00172-3.
  3. Yang, T.; Whitlock, R.S.; Vasudevan, S.A. Surgical Management of Hepatoblastoma and Recent Advances. Cancers 2019, 11, 1944. [Google Scholar] [CrossRef] [PubMed]
  4. Cao, Y.; Wu, S.; Tang, H. An Update on Diagnosis and Treatment of Hepatoblastoma. BST 2023, 17, 445–457. [Google Scholar] [CrossRef]
  5. Hasegawa, M.; Sugiyama, M.; Terashita, Y.; Cho, Y.; Manabe, A. Hepatoblastoma with Bone/Bone Marrow Metastasis in Li-Fraumeni Syndrome Patient. Pediatrics International 2022, 64, e15135. [Google Scholar] [CrossRef] [PubMed]
  6. Rai, P.; H. Feusner, J. Cerebral Metastasis of Hepatoblastoma: A Review. Journal of Pediatric Hematology/Oncology 2016, 38, 279–282. [Google Scholar] [CrossRef] [PubMed]
  7. Trefts, E.; Gannon, M.; Wasserman, D.H. The Liver. Current Biology 2017, 27, R1147–R1151. [Google Scholar] [CrossRef]
  8. Bao, M.H.-R.; Wong, C.C.-L. Hypoxia, Metabolic Reprogramming, and Drug Resistance in Liver Cancer. Cells 2021, 10, 1715. [Google Scholar] [CrossRef]
  9. Yang, F.; Hilakivi-Clarke, L.; Shaha, A.; Wang, Y.; Wang, X.; Deng, Y.; Lai, J.; Kang, N. Metabolic Reprogramming and Its Clinical Implication for Liver Cancer. Hepatology 2023, 78, 1602–1624. [Google Scholar] [CrossRef]
  10. Clavería-Cabello, A.; Herranz, J.M.; Latasa, M.U.; Arechederra, M.; Uriarte, I.; Pineda-Lucena, A.; Prosper, F.; Berraondo, P.; Alonso, C.; Sangro, B.; et al. Identification and Experimental Validation of Druggable Epigenetic Targets in Hepatoblastoma. Journal of Hepatology 2023, 79, 989–1005. [Google Scholar] [CrossRef]
  11. Wang, H.; Lu, J.; Chen, X.; Schwalbe, M.; Gorka, J.E.; Mandel, J.A.; Wang, J.; Goetzman, E.S.; Ranganathan, S.; Dobrowolski, S.F.; et al. Acquired Deficiency of Peroxisomal Dicarboxylic Acid Catabolism Is a Metabolic Vulnerability in Hepatoblastoma. Journal of Biological Chemistry 2021, 296, 100283. [Google Scholar] [CrossRef]
  12. Zhou, Y.; Lin, F.; Wan, T.; Chen, A.; Wang, H.; Jiang, B.; Zhao, W.; Liao, S.; Wang, S.; Li, G.; et al. ZEB1 Enhances Warburg Effect to Facilitate Tumorigenesis and Metastasis of HCC by Transcriptionally Activating PFKM. Theranostics 2021, 11, 5926–5938. [Google Scholar] [CrossRef] [PubMed]
  13. Duda, P.; Janczara, J.; McCubrey, J.A.; Gizak, A.; Rakus, D. The Reverse Warburg Effect Is Associated with Fbp2-Dependent Hif1α Regulation in Cancer Cells Stimulated by Fibroblasts. Cells 2020, 9, 205. [Google Scholar] [CrossRef] [PubMed]
  14. Alasadi, A.; Cao, B.; Guo, J.; Tao, H.; Collantes, J.; Tan, V.; Su, X.; Augeri, D.; Jin, S. Mitochondrial Uncoupler MB1-47 Is Efficacious in Treating Hepatic Metastasis of Pancreatic Cancer in Murine Tumor Transplantation Models. Oncogene 2021, 40, 2285–2295. [Google Scholar] [CrossRef] [PubMed]
  15. Parkinson, E.K.; Adamski, J.; Zahn, G.; Gaumann, A.; Flores-Borja, F.; Ziegler, C.; Mycielska, M.E. Extracellular Citrate and Metabolic Adaptations of Cancer Cells. Cancer Metastasis Rev 2021, 40, 1073–1091. [Google Scholar] [CrossRef]
  16. Povero, D.; Chen, Y.; Johnson, S.M.; McMahon, C.E.; Pan, M.; Bao, H.; Petterson, X.-M.T.; Blake, E.; Lauer, K.P.; O’Brien, D.R.; et al. HILPDA Promotes NASH-Driven HCC Development by Restraining Intracellular Fatty Acid Flux in Hypoxia. Journal of Hepatology 2023, 79, 378–393. [Google Scholar] [CrossRef]
  17. Sprinzl, M.F.; Puschnik, A.; Schlitter, A.M.; Schad, A.; Ackermann, K.; Esposito, I.; Lang, H.; Galle, P.R.; Weinmann, A.; Heikenwälder, M.; et al. Sorafenib Inhibits Macrophage-Induced Growth of Hepatoma Cells by Interference with Insulin-like Growth Factor-1 Secretion. Journal of Hepatology 2015, 62, 863–870. [Google Scholar] [CrossRef]
  18. Buscher, H.-P. Defective Drug Uptake Contributing to Multidrug Resistance in Hepatoma Cells Can Be Evaluated in Vitro. Klin Wochenschr 1990, 68, 443–446. [Google Scholar] [CrossRef]
  19. Rivera-Aguirre, J.; López-Sánchez, G.N.; Chávez-Tapia, N.C.; Uribe, M.; Nuño-Lámbarri, N. Metabolic-Associated Fatty Liver Disease Regulation through Nutri EpigeneticMethylation. MRMC 2023, 23, 1680–1690. [Google Scholar] [CrossRef]
  20. El Taghdouini, A.; Van Grunsven, L.A. Epigenetic Regulation of Hepatic Stellate Cell Activation and Liver Fibrosis. Expert Review of Gastroenterology & Hepatology 2016, 10, 1397–1408. [Google Scholar] [CrossRef]
  21. Mandrekar, P. Epigenetic Regulation in Alcoholic Liver Disease. WJG 2011, 17, 2456. [Google Scholar] [CrossRef]
  22. Wang, S.; Zha, L.; Cui, X.; Yeh, Y.; Liu, R.; Jing, J.; Shi, H.; Chen, W.; Hanover, J.; Yin, J.; et al. Epigenetic Regulation of Hepatic Lipid Metabolism by DNA Methylation. Advanced Science 2023, 10, 2206068. [Google Scholar] [CrossRef] [PubMed]
  23. Moran-Salvador, E.; Mann, J. Epigenetics and Liver Fibrosis. Cellular and Molecular Gastroenterology and Hepatology 2017, 4, 125–134. [Google Scholar] [CrossRef] [PubMed]
  24. Hyun, J.; Jung, Y. DNA Methylation in Nonalcoholic Fatty Liver Disease. IJMS 2020, 21, 8138. [Google Scholar] [CrossRef] [PubMed]
  25. Raggi, C.; Invernizzi, P. Methylation and Liver Cancer. Clinics and Research in Hepatology and Gastroenterology 2013, 37, 564–571. [Google Scholar] [CrossRef] [PubMed]
  26. Hernandez-Meza, G.; Von Felden, J.; Gonzalez-Kozlova, E.E.; Garcia-Lezana, T.; Peix, J.; Portela, A.; Craig, A.J.; Sayols, S.; Schwartz, M.; Losic, B.; et al. DNA Methylation Profiling of Human Hepatocarcinogenesis. Hepatology 2021, 74, 183–199. [Google Scholar] [CrossRef]
  27. Wang, Q.; Liang, N.; Yang, T.; Li, Y.; Li, J.; Huang, Q.; Wu, C.; Sun, L.; Zhou, X.; Cheng, X.; et al. DNMT1-Mediated Methylation of BEX1 Regulates Stemness and Tumorigenicity in Liver Cancer. Journal of Hepatology 2021, 75, 1142–1153. [Google Scholar] [CrossRef]
  28. Rivas, M.; Aguiar, T.; Fernandes, G.; Lemes, R.; Caires-Júnior, L.; Goulart, E.; Telles-Silva, K.; Maschietto, M.; Cypriano, M.; De Toledo, S.; et al. DNA Methylation as a Key Epigenetic Player for Hepatoblastoma Characterization. Clinics and Research in Hepatology and Gastroenterology 2021, 45, 101684. [Google Scholar] [CrossRef]
  29. Cui, X.; Liu, B.; Zheng, S.; Dong, K.; Dong, R. Genome-Wide Analysis of DNA Methylation in Hepatoblastoma Tissues. Oncology Letters 2016, 12, 1529–1534. [Google Scholar] [CrossRef]
  30. O’Malley, J.; Kumar, R.; Inigo, J.; Yadava, N.; Chandra, D. Mitochondrial Stress Response and Cancer. Trends in Cancer 2020, 6, 688–701. [Google Scholar] [CrossRef]
  31. Fromenty, B.; Roden, M. Mitochondrial Alterations in Fatty Liver Diseases. Journal of Hepatology 2023, 78, 415–429. [Google Scholar] [CrossRef]
  32. Lee, H.-Y.; Nga, H.T.; Tian, J.; Yi, H.-S. Mitochondrial Metabolic Signatures in Hepatocellular Carcinoma. Cells 2021, 10, 1901. [Google Scholar] [CrossRef] [PubMed]
  33. Tabassum, H.; Waseem, M.; Parvez, S.; Qureshi, M.I. Oxaliplatin-Induced Oxidative Stress Provokes Toxicity in Isolated Rat Liver Mitochondria. Archives of Medical Research 2015, 46, 597–603. [Google Scholar] [CrossRef] [PubMed]
  34. Lee, J.; Gong, Y.-X.; Xie, D.-P.; Jeong, H.; Seo, H.; Kim, J.; Park, Y.H.; Sun, H.-N.; Kwon, T. Anticancer Effect of ERM210 on Liver Cancer Cells Through ROS/Mitochondria-Dependent Apoptosis Signaling Pathways. In Vivo 2021, 35, 2599–2608. [Google Scholar] [CrossRef] [PubMed]
  35. Lockman, K.A.; Baren, J.P.; Pemberton, C.J.; Baghdadi, H.; Burgess, K.E.; Plevris-Papaioannou, N.; Lee, P.; Howie, F.; Beckett, G.; Pryde, A.; et al. Oxidative Stress Rather than Triglyceride Accumulation Is a Determinant of Mitochondrial Dysfunction in in Vitro Models of Hepatic Cellular Steatosis. Liver International 2012, 32, 1079–1092. [Google Scholar] [CrossRef]
  36. Esmaeili, M.A.; Farimani, M.M.; Kiaei, M. Anticancer Effect of Calycopterin via PI3K/Akt and MAPK Signaling Pathways, ROS-Mediated Pathway and Mitochondrial Dysfunction in Hepatoblastoma Cancer (HepG2) Cells. Mol Cell Biochem 2014, 397, 17–31. [Google Scholar] [CrossRef]
  37. Yumnam, S.; Hong, G.E.; Raha, S.; Saralamma, V.V.G.; Lee, H.J.; Lee, W.; Kim, E.; Kim, G.S. Mitochondrial Dysfunction and Ca 2+ Overload Contributes to Hesperidin Induced Paraptosis in Hepatoblastoma Cells, HepG2. Journal Cellular Physiology 2016, 231, 1261–1268. [Google Scholar] [CrossRef]
  38. Hooks, K.B.; Audoux, J.; Fazli, H.; Lesjean, S.; Ernault, T.; Dugot-Senant, N.; Leste-Lasserre, T.; Hagedorn, M.; Rousseau, B.; Danet, C.; et al. New Insights into Diagnosis and Therapeutic Options for Proliferative Hepatoblastoma. Hepatology 2018, 68, 89–102. [Google Scholar] [CrossRef]
  39. Bondoc, A.; Glaser, K.; Jin, K.; Lake, C.; Cairo, S.; Geller, J.; Tiao, G.; Aronow, B. Identification of Distinct Tumor Cell Populations and Key Genetic Mechanisms through Single Cell Sequencing in Hepatoblastoma. Commun Biol 2021, 4, 1049. [Google Scholar] [CrossRef]
  40. Zhou, S.; O’Gorman, M.R.G.; Yang, F.; Andresen, K.; Wang, L. Glypican 3 as a Serum Marker for Hepatoblastoma. Sci Rep 2017, 7, 45932. [Google Scholar] [CrossRef]
  41. Butler, A.; Hoffman, P.; Smibert, P.; Papalexi, E.; Satija, R. Integrating Single-Cell Transcriptomic Data across Different Conditions, Technologies, and Species. Nat. Biotechnol. 2018, 36, 411–420. [Google Scholar] [CrossRef]
  42. Ma, W.K.; Voss, D.M.; Scharner, J.; Costa, A.S.H.; Lin, K.-T.; Jeon, H.Y.; Wilkinson, J.E.; Jackson, M.; Rigo, F.; Bennett, C.F.; et al. ASO-Based PKM Splice-Switching Therapy Inhibits Hepatocellular Carcinoma Growth. Cancer Res 2022, 82, 900–915. [Google Scholar] [CrossRef] [PubMed]
  43. Schmidt, A.; Armento, A.; Bussolati, O.; Chiu, M.; Ellerkamp, V.; Scharpf, M.O.; Sander, P.; Schmid, E.; Warmann, S.W.; Fuchs, J. Hepatoblastoma: Glutamine Depletion Hinders Cell Viability in the Embryonal Subtype but High GLUL Expression Is Associated with Better Overall Survival. J Cancer Res Clin Oncol 2021, 147, 3169–3181. [Google Scholar] [CrossRef]
  44. Camarota, L.M.; Woollett, L.A.; Howles, P.N. Reverse Cholesterol Transport Is Elevated in Carboxyl Ester Lipase-Knockout Mice. FASEB J 2011, 25, 1370–1377. [Google Scholar] [CrossRef] [PubMed]
  45. Fjeld, K.; Beer, S.; Johnstone, M.; Zimmer, C.; Mössner, J.; Ruffert, C.; Krehan, M.; Zapf, C.; Njølstad, P.R.; Johansson, S.; et al. Length of Variable Numbers of Tandem Repeats in the Carboxyl Ester Lipase (CEL) Gene May Confer Susceptibility to Alcoholic Liver Cirrhosis but Not Alcoholic Chronic Pancreatitis. PLoS One 2016, 11, e0165567. [Google Scholar] [CrossRef] [PubMed]
  46. Sui, Z.; Zhou, J.; Cheng, Z.; Lu, P. Squalene Epoxidase (SQLE) Promotes the Growth and Migration of the Hepatocellular Carcinoma Cells. Tumour Biol 2015, 36, 6173–6179. [Google Scholar] [CrossRef]
  47. Chang, N.-Y.; Chan, Y.-J.; Ding, S.-T.; Lee, Y.-H.; HuangFu, W.-C.; Liu, I.-H. Sterol O-Acyltransferase 2 Contributes to the Yolk Cholesterol Trafficking during Zebrafish Embryogenesis. PLoS One 2016, 11, e0167644. [Google Scholar] [CrossRef]
  48. Rivas, M.P.; Aguiar, T.F.M.; Fernandes, G.R.; Caires-Júnior, L.C.; Goulart, E.; Telles-Silva, K.A.; Cypriano, M.; De Toledo, S.R.C.; Rosenberg, C.; Carraro, D.M.; et al. TET Upregulation Leads to 5-Hydroxymethylation Enrichment in Hepatoblastoma. Front. Genet. 2019, 10, 553. [Google Scholar] [CrossRef]
  49. Antwi, S.O.; Heckman, M.; White, L.; Yan, I.; Sarangi, V.; Lauer, K.P.; Reddy, J.; Ahmed, F.; Veliginti, S.; Mejías Febres, E.D.; et al. Metabolic Liver Cancer: Associations of Rare and Common Germline Variants in One-Carbon Metabolism and DNA Methylation Genes. Hum Mol Genet 2023, 32, 2646–2655. [Google Scholar] [CrossRef]
  50. Ashkavand, Z.; O’Flanagan, C.; Hennig, M.; Du, X.; Hursting, S.D.; Krupenko, S.A. Metabolic Reprogramming by Folate Restriction Leads to a Less Aggressive Cancer Phenotype. Mol Cancer Res 2017, 15, 189–200. [Google Scholar] [CrossRef]
  51. Sun, X.; Han, L.; Seth, P.; Bian, S.; Li, L.; Csizmadia, E.; Junger, W.G.; Schmelzle, M.; Usheva, A.; Tapper, E.B.; et al. Disordered Purinergic Signaling and Abnormal Cellular Metabolism Are Associated with Development of Liver Cancer in Cd39/ENTPD1 Null Mice. Hepatology 2013, 57, 205–216. [Google Scholar] [CrossRef]
  52. Staller, D.W.; Panigrahi, S.S.; Jayasinghe, Y.P.; Dong, Y.; Mahto, S.; Kumar, V.; Ronning, D.R.; Mahato, R.I. A Novel Phosphodiesterase Inhibitor for the Treatment of Chronic Liver Injury and Metabolic Diseases. Hepatology 2024. [Google Scholar] [CrossRef] [PubMed]
  53. Barrett, K.G.; Fang, H.; Gargano, M.D.; Markovich, D.; Kocarek, T.A.; Runge-Morris, M. Regulation of Murine Hepatic Hydroxysteroid Sulfotransferase Expression in Hyposulfatemic Mice and in a Cell Model of 3’-Phosphoadenosine-5’-Phosphosulfate Deficiency. Drug Metab Dispos 2013, 41, 1505–1513. [Google Scholar] [CrossRef] [PubMed]
  54. Pike, S.T.; Rajendra, R.; Artzt, K.; Appling, D.R. Mitochondrial C1-Tetrahydrofolate Synthase (MTHFD1L) Supports the Flow of Mitochondrial One-Carbon Units into the Methyl Cycle in Embryos. J Biol Chem 2010, 285, 4612–4620. [Google Scholar] [CrossRef] [PubMed]
  55. Lee, D.; Xu, I.M.-J.; Chiu, D.K.-C.; Lai, R.K.-H.; Tse, A.P.-W.; Lan Li, L.; Law, C.-T.; Tsang, F.H.-C.; Wei, L.L.; Chan, C.Y.-K.; et al. Folate Cycle Enzyme MTHFD1L Confers Metabolic Advantages in Hepatocellular Carcinoma. J Clin Invest 2017, 127, 1856–1872. [Google Scholar] [CrossRef] [PubMed]
  56. Menezo, Y.; Elder, K.; Clement, A.; Clement, P. Folic Acid, Folinic Acid, 5 Methyl TetraHydroFolate Supplementation for Mutations That Affect Epigenesis through the Folate and One-Carbon Cycles. Biomolecules 2022, 12, 197. [Google Scholar] [CrossRef]
  57. Fu, Y.; Chen, J.; Ma, X.; Chang, W.; Zhang, X.; Liu, Y.; Shen, H.; Hu, X.; Ren, A.-J. Subcellular Expression Patterns of FKBP Prolyl Isomerase 10 (FKBP10) in Colorectal Cancer and Its Clinical Significance. Int J Mol Sci 2023, 24, 11415. [Google Scholar] [CrossRef]
  58. Ramadori, G.; Ioris, R.M.; Villanyi, Z.; Firnkes, R.; Panasenko, O.O.; Allen, G.; Konstantinidou, G.; Aras, E.; Brenachot, X.; Biscotti, T.; et al. FKBP10 Regulates Protein Translation to Sustain Lung Cancer Growth. Cell Rep 2020, 30, 3851–3863. [Google Scholar] [CrossRef]
  59. Zhang, X.; Wei, X.; Bai, G.; Huang, X.; Hu, S.; Mao, H.; Liu, P. Identification of Three Potential Prognostic Genes in Platinum-Resistant Ovarian Cancer via Integrated Bioinformatics Analysis. Cancer Manag Res 2021, 13, 8629–8646. [Google Scholar] [CrossRef]
  60. Li, K.-S.; Zhu, X.-D.; Liu, H.-D.; Zhang, S.-Z.; Li, X.-L.; Xiao, N.; Liu, X.-F.; Xu, B.; Lei, M.; Zhang, Y.-Y.; et al. NT5DC2 Promotes Tumor Cell Proliferation by Stabilizing EGFR in Hepatocellular Carcinoma. Cell Death Dis 2020, 11, 335. [Google Scholar] [CrossRef]
  61. Vergara, A.G.; Watson, C.J.W.; Watson, J.M.; Chen, G.; Lazarus, P. Altered Metabolism of Polycyclic Aromatic Hydrocarbons by UDP-Glycosyltransferase 3A2 Missense Variants. Chem Res Toxicol 2020, 33, 2854–2862. [Google Scholar] [CrossRef]
  62. Ding, Z.; Ericksen, R.E.; Lee, Q.Y.; Han, W. Reprogramming of Mitochondrial Proline Metabolism Promotes Liver Tumorigenesis. Amino Acids 2021, 53, 1807–1815. [Google Scholar] [CrossRef] [PubMed]
  63. Wu, K.; Yan, M.; Liu, T.; Wang, Z.; Duan, Y.; Xia, Y.; Ji, G.; Shen, Y.; Wang, L.; Li, L.; et al. Creatine Kinase B Suppresses Ferroptosis by Phosphorylating GPX4 through a Moonlighting Function. Nat Cell Biol 2023, 25, 714–725. [Google Scholar] [CrossRef] [PubMed]
  64. Guerriero, E.; Capone, F.; Accardo, M.; Sorice, A.; Costantini, M.; Colonna, G.; Castello, G.; Costantini, S. GPX4 and GPX7 Over-Expression in Human Hepatocellular Carcinoma Tissues. Eur J Histochem 2015, 59, 2540. [Google Scholar] [CrossRef] [PubMed]
  65. Gurioli, G.; Martignano, F.; Salvi, S.; Costantini, M.; Gunelli, R.; Casadio, V. GSTP1 Methylation in Cancer: A Liquid Biopsy Biomarker? Clin Chem Lab Med 2018, 56, 702–717. [Google Scholar] [CrossRef]
  66. Huang, D.; Li, T.; Wang, L.; Zhang, L.; Yan, R.; Li, K.; Xing, S.; Wu, G.; Hu, L.; Jia, W.; et al. Hepatocellular Carcinoma Redirects to Ketolysis for Progression under Nutrition Deprivation Stress. Cell Res 2016, 26, 1112–1130. [Google Scholar] [CrossRef]
  67. Davis, S.; Meltzer, P.S. GEOquery: A Bridge between the Gene Expression Omnibus (GEO) and BioConductor. Bioinformatics 2007, 23, 1846–1847. [Google Scholar] [CrossRef]
  68. Barrett, T.; Wilhite, S.E.; Ledoux, P.; Evangelista, C.; Kim, I.F.; Tomashevsky, M.; Marshall, K.A.; Phillippy, K.H.; Sherman, P.M.; Holko, M.; et al. NCBI GEO: Archive for Functional Genomics Data Sets--Update. Nucleic Acids Res. 2013, 41, D991–995. [Google Scholar] [CrossRef]
  69. Zappia, L.; Lun, A.; Kamm, J.; Cannoodt, R. Zellkonverter: Conversion Between scRNA-Seq Objects 2024.
  70. Corcoran, C.C.; Grady, C.R.; Pisitkun, T.; Parulekar, J.; Knepper, M.A. From 20th Century Metabolic Wall Charts to 21st Century Systems Biology: Database of Mammalian Metabolic Enzymes. American Journal of Physiology-Renal Physiology 2017, 312, F533–F542. [Google Scholar] [CrossRef]
  71. Cunningham, F.; Allen, J.E.; Allen, J.; Alvarez-Jarreta, J.; Amode, M.R.; Armean, I.M.; Austine-Orimoloye, O.; Azov, A.G.; Barnes, I.; Bennett, R.; et al. Ensembl 2022. Nucleic Acids Research 2022, 50, D988–D995. [Google Scholar] [CrossRef]
  72. Robinson, M.D.; McCarthy, D.J.; Smyth, G.K. edgeR: A Bioconductor Package for Differential Expression Analysis of Digital Gene Expression Data. Bioinformatics 2010, 26, 139–140. [Google Scholar] [CrossRef]
  73. Law, C.W.; Chen, Y.; Shi, W.; Smyth, G.K. Voom: Precision Weights Unlock Linear Model Analysis Tools for RNA-Seq Read Counts. Genome Biol. 2014, 15, R29. [Google Scholar] [CrossRef] [PubMed]
  74. Ritchie, M.E.; Phipson, B.; Wu, D.; Hu, Y.; Law, C.W.; Shi, W.; Smyth, G.K. Limma Powers Differential Expression Analyses for RNA-Sequencing and Microarray Studies. Nucleic Acids Res. 2015, 43, e47. [Google Scholar] [CrossRef] [PubMed]
  75. Zhao, Y.; Wong, L.; Goh, W.W.B. How to Do Quantile Normalization Correctly for Gene Expression Data Analyses. Sci Rep 2020, 10, 15534. [Google Scholar] [CrossRef] [PubMed]
  76. Desterke, C.; Xiang, Y.; Elhage, R.; Duruel, C.; Chang, Y.; Hamaï, A. Ferroptosis Inducers Upregulate PD-L1 in Recurrent Triple-Negative Breast Cancer. Cancers 2023, 16, 155. [Google Scholar] [CrossRef]
  77. Ogata, H.; Goto, S.; Sato, K.; Fujibuchi, W.; Bono, H.; Kanehisa, M. KEGG: Kyoto Encyclopedia of Genes and Genomes. Nucleic Acids Res. 1999, 27, 29–34. [Google Scholar] [CrossRef]
  78. Wu, T.; Hu, E.; Xu, S.; Chen, M.; Guo, P.; Dai, Z.; Feng, T.; Zhou, L.; Tang, W.; Zhan, L.; et al. clusterProfiler 4.0: A Universal Enrichment Tool for Interpreting Omics Data. The Innovation 2021, 2, 100141. [Google Scholar] [CrossRef]
  79. Cline, M.S.; Smoot, M.; Cerami, E.; Kuchinsky, A.; Landys, N.; Workman, C.; Christmas, R.; Avila-Campilo, I.; Creech, M.; Gross, B.; et al. Integration of Biological Networks and Gene Expression Data Using Cytoscape. Nat Protoc 2007, 2, 2366–2382. [Google Scholar] [CrossRef]
  80. Robin, X.; Turck, N.; Hainard, A.; Tiberti, N.; Lisacek, F.; Sanchez, J.-C.; Müller, M. pROC: An Open-Source Package for R and S+ to Analyze and Compare ROC Curves. BMC Bioinformatics 2011, 12, 77. [Google Scholar] [CrossRef]
  81. Kuhn, M. Building Predictive Models in R Using the Caret Package. J. Stat. Soft. 2008, 28. [Google Scholar] [CrossRef]
  82. Tay, J.K.; Narasimhan, B.; Hastie, T. Elastic Net Regularization Paths for All Generalized Linear Models. J. Stat. Soft. 2023, 106. [Google Scholar] [CrossRef]
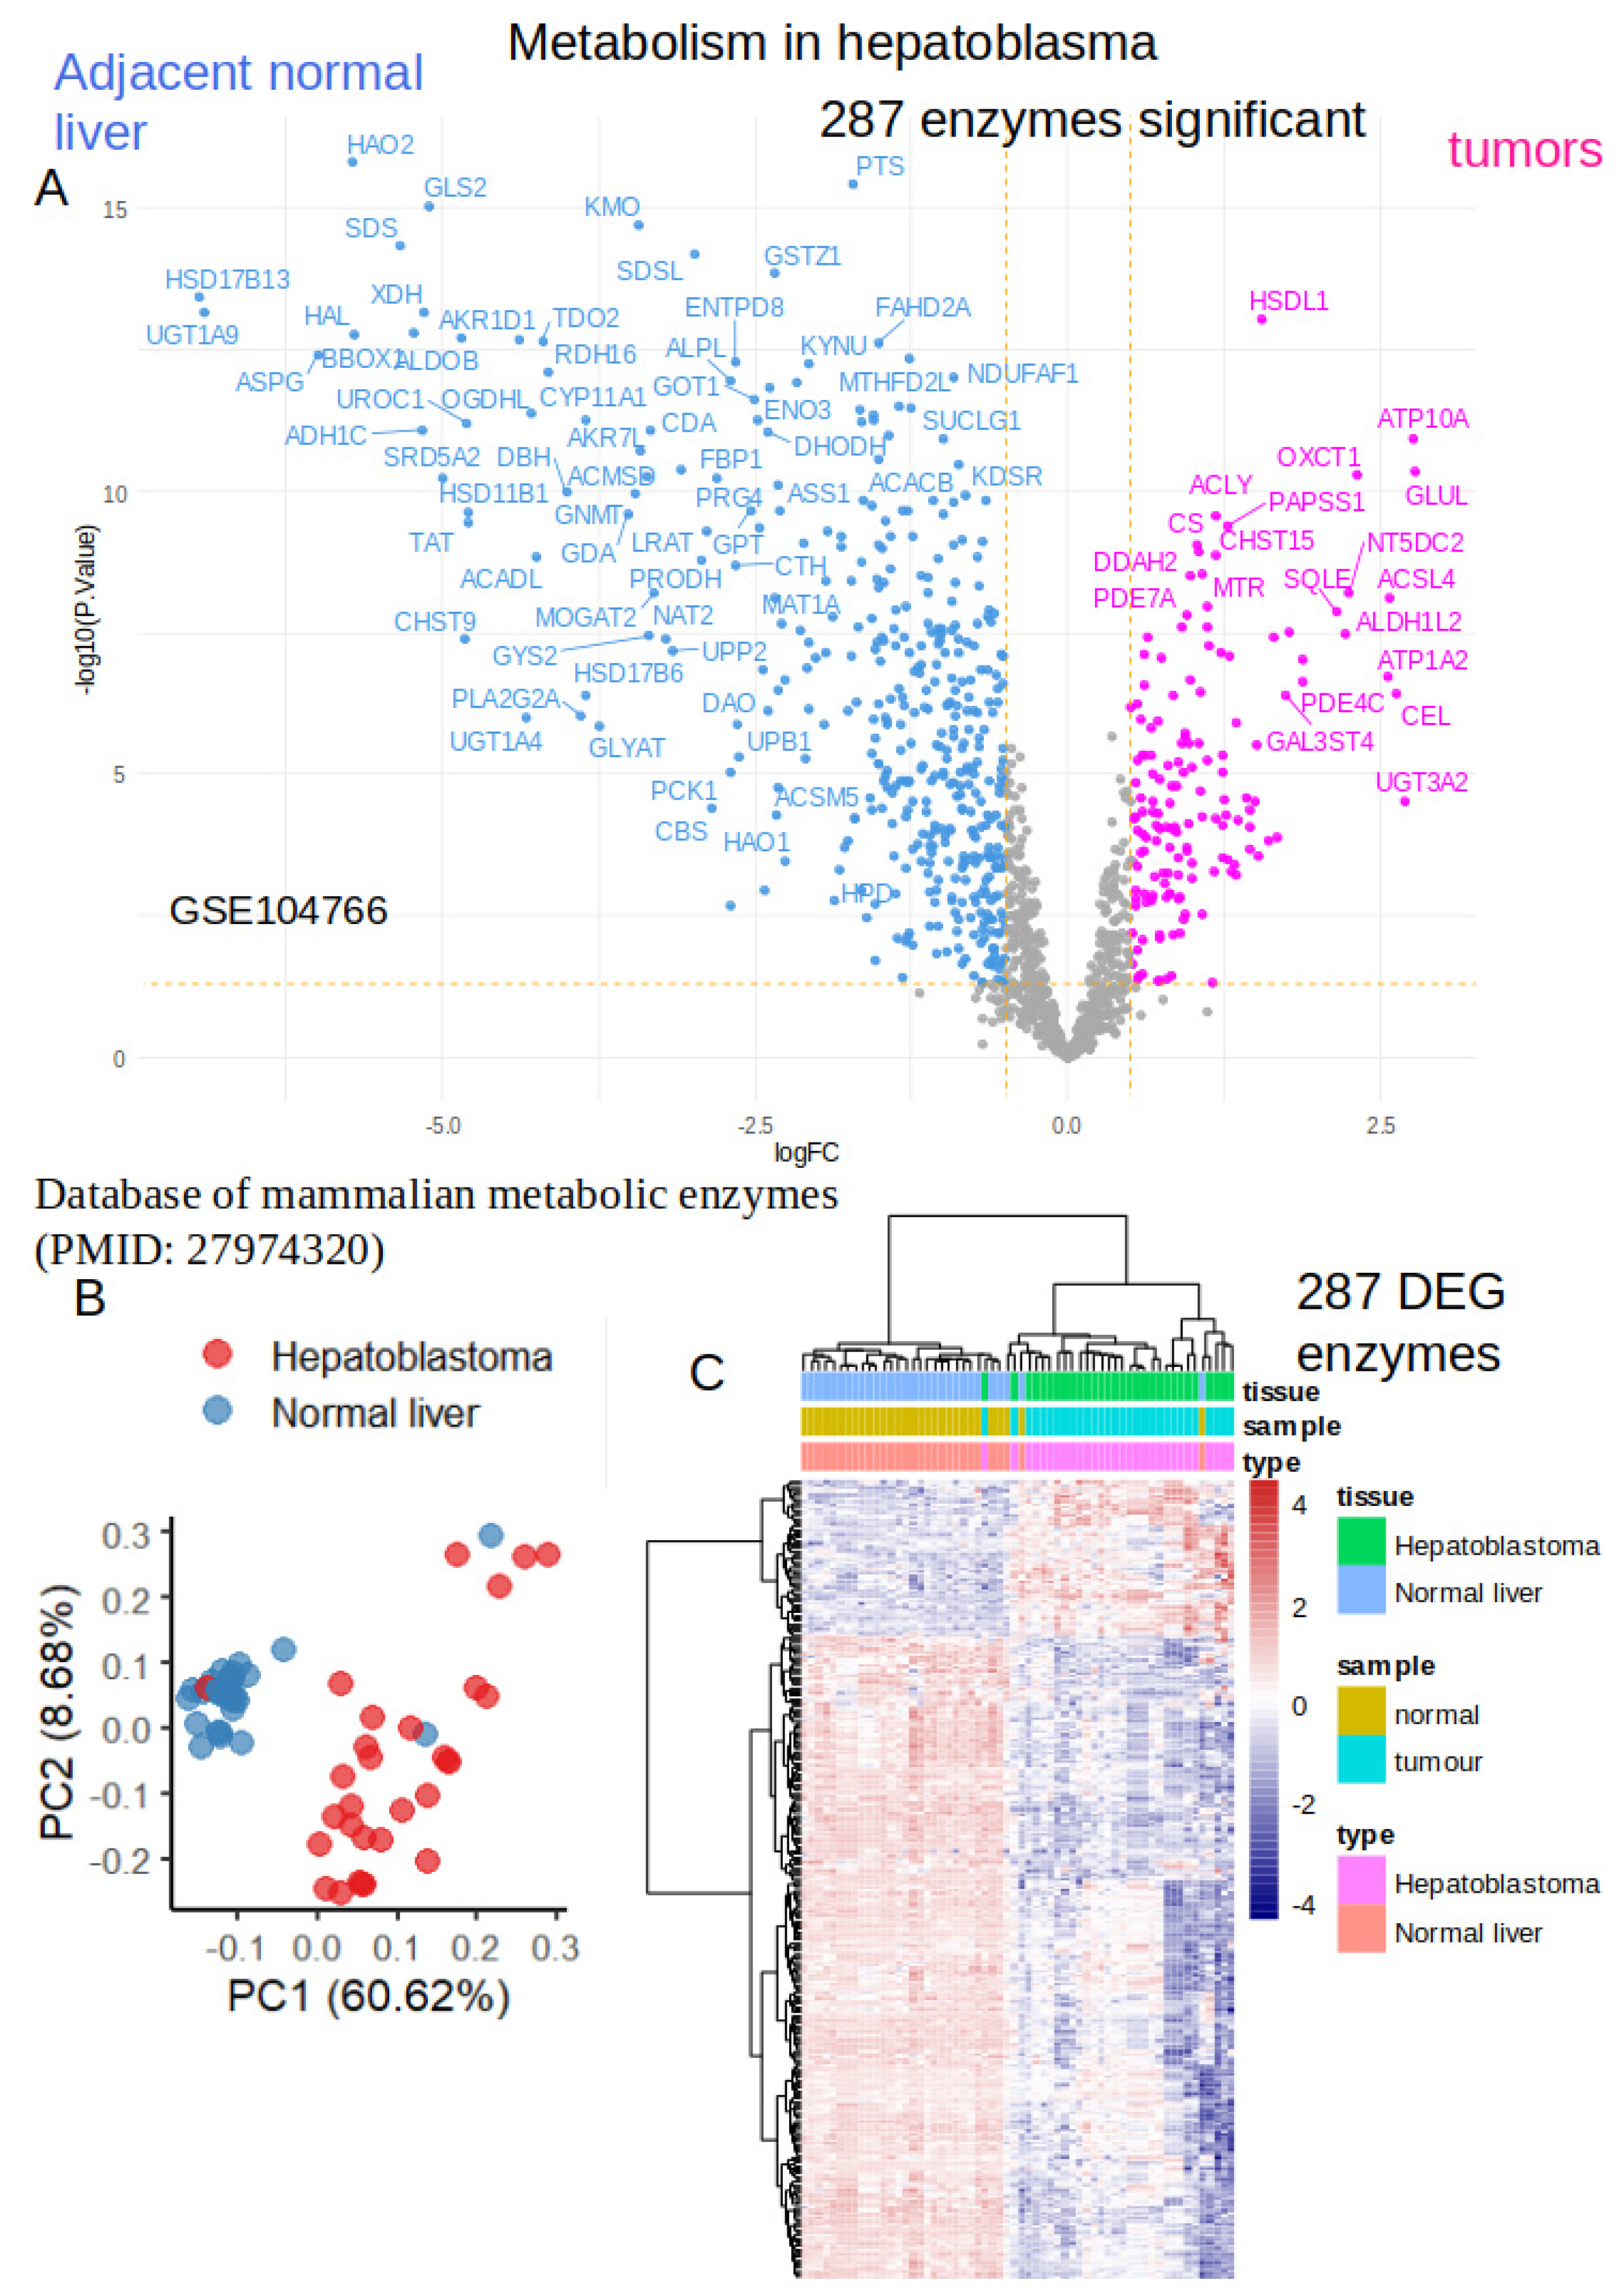
Figure 1. Differential expressed enzymes in tumors as compared to normal adjacent liver tissues from hepatoblastoma human samples: A/ Volcanoplot of differential expressed enzymes in GSE104766 transcriptome dataset; B/ Principal component analysis on 287 differential expressed enzymes; C/Unsupervized clustering (Euclidean distances) with expression heatmap of the 287 differential expressed enzymes.
Preprints 117670 g001
Figure 2. Activated metabolic transcriptional program in hepatoblastoma tumors: GSE104766;; A/Barplot of functional enrichment (KEGG database) performed on 59 enzymes found over expressed in hepatoblastoma tumors; B/ Emaplot of functional enrichment (KEGG database) performed on 59 enzymes found over expressed in hepatoblastoma tumors.
Preprints 117670 g002
Figure 3. Activated metabolic network in human hepatoblastoma tumors: GSE104766, Functional enrichment network of metabolic enzyme actors found over expressed in human hepatoblastoma tumors (enrichment on KEGG database), color scale from yellow to purple represent the negative logarithm base 10 of the enriched p-values.
Preprints 117670 g003
Figure 4. Harmonization of single transcriptome from human hepatoblastoma tissue samples: GSE180665; A/ Principal component analysis elbowplot of unintegrated single cell transcriptome data; B/ Unintegrated UMAP dimension reduction with original cell annotation; C/Unintegrated UMAP dimension reduction with sample origin annotation; D/ Dimension reduction post harmony integration with original cell annotation; E/Dimension reduction post harmony integration with sample origin annotation.
Preprints 117670 g004
Figure 5. High level of metabolic score at single cell level in tumor cells from hepatoblastoma: GSE180665; A/ UMAP dimension reduction post harmony with sample origin annotation; B/ UMAP dimension reduction post harmony with group sample annotation; C/ UMAP dimension reduction post harmony with original cluster annotation; D/UMAP dimension reduction post harmony with original cell annotation; E/Featureplot on UMAP with expression of Glypican 3 (GPC3) hepatoblastoma tumor cell marker; F/ Featureplot of metabolic score (computed on 59 HB activated enzymes) on UMAP dimension reduction; G/ Violinplot of metabolic score stratified on cell types.
Preprints 117670 g005
Figure 6. Increase of metabolic score is highly predictive of tumor cell status in single cell transcriptome from hepatoblastoma: GSE180665; A/ Violinplot of metabolic score comparing normal hepatocyte (Hep) versus tumor cells (PDX + human tumors) by scRNAseq; B/ ROC curve and area under curve for metabolic score for predicting hepatoblastoma tumor cells as compared to normal hepatocytes.
Preprints 117670 g006
Figure 7. Importance of over expressed metabolic markers to predict tumor cell status in sc-RNAseq of hepatoblastoma samples: GSE180665; A/ Alpha and lambda parameters tuning from elasticnet model with 0.7 training / 0.3 validation split of GSE180665 dataset : tumor cells versus normal hepatocyte status prediction; B/ Best lambda estimation for alpha parameter fixed to 0.1 in elasticnet model; C/ Positive elasticnet coefficients for 41 metabolic markers expressed in HB tumor cells at single cell level.
Preprints 117670 g007
Table 1. KEGG functional enrichment of activated metabolic enzymes in tumor cells from hepatoblastoma.
ID Description subcategory count qvalue
hsa01230 Biosynthesis of amino acids Amin acid 9 7.40E-09
hsa00100 Steroid biosynthesis Lipid 4 1.03E-04
hsa00670 One carbon pool by folate Cofactors and vitamins 3 3.39E-03
hsa01200 Carbon metabolism Carbon 5 5.46E-03
hsa00010 Glycolysis / Gluconeogenesis Carbohydrate 4 5.46E-03
hsa00051 Fructose and mannose metabolism Carbohydrate 3 7.25E-03
hsa00280 Valine, leucine and isoleucine degradation Amino acid 3 1.60E-02
hsa00330 Arginine and proline metabolism Amino acid 3 1.60E-02
hsa00270 Cysteine and methionine metabolism Amino acid 3 1.60E-02
hsa00480 Glutathione metabolism Amino acid 3 1.70E-02
hsa00450 Selenocompound metabolism Amino acid 2 1.70E-02
hsa00910 Nitrogen metabolism Energy 2 1.70E-02
hsa00230 Purine metabolism Nucleotide 4 1.90E-02
hsa00532 Glycosaminoglycan biosynthesis Glycan 2 2.26E-02
hsa00650 Butanoate metabolism Carbohydrate 2 3.00E-02
Disclaimer/Publisher’s Note: The statements, opinions and data contained in all publications are solely those of the individual author(s) and contributor(s) and not of MDPI and/or the editor(s). MDPI and/or the editor(s) disclaim responsibility for any injury to people or property resulting from any ideas, methods, instructions or products referred to in the content.
Copyright: This open access article is published under a Creative Commons CC BY 4.0 license, which permit the free download, distribution, and reuse, provided that the author and preprint are cited in any reuse.
Prerpints.org logo

Preprints.org is a free preprint server supported by MDPI in Basel, Switzerland.

Subscribe

© 2024 MDPI (Basel, Switzerland) unless otherwise stated