1. Introduction
Colorectal cancer (CRC) remains the third most deadly cancer diagnosed worldwide, and shows an increasing incidence in both developing and developed countries [
1]. Individuals bearing CRC display backgrounds that cover a wide range of genetic or epigenetic alterations [
2,
3]. Sporadic or induced mutations in the CRC scenario often fall within a discrete set of tumor suppressor genes, like adenomatous polyposis coli (APC), SMAD4 family member (SMAD4), or those traditionally involved in the regulation of cell proliferation and cell cycle, like p53 [
4]. In addition, mutations in oncogenes, particularly concerning genes such as Kristen rat sarcoma virus (KRAS), phosphatidylinositol 4,5-bisphosphate 3-kinase catalytic subunit-α (PIK3CA), or b-raf proto-oncogene (BRAF), confer hyperproliferative traits to intestinal epithelial cells, that promote a genetic hypermutability scenario [
5]. Lifestyle, environmental mutagens or, more recently, dysbiotic metabolites, are emerging as pivotal ingredients in CRC onset and development [
6], although mechanistically, a number of queries remain unaddressed and novel potential candidates need to be disclosed. Food additive inorganic polyphosphate (iPolyP) is a biological polymer, structurally composed by from 3 to over 1000 orthophosphates linked together by ATP-like bonds [
7], can spontaneously arise from non-living matter or be enzymatically produced by living organisms, including bacteria and eukaryotes [
8]. While synthesis and degradation of iPolyP in bacterial cells has been well-studied, the corresponding metabolic pathways in the eukaryotic counterpart are still poorly understood [
9]. Mammalian iPolyP has been found in nuclei, mitochondria, lysosomes, platelets dense granules, mast cells- and basophils-derived granules [
10,
11,
12,
13]. iPolyP architecture makes it an obvious participant of energy metabolism. It is, in fact, nowadays considered a phosphate donor for ATP synthesis [
14]. Thus, considered an optimal source of energy, emerging literature has started to associate iPolyP to various pathophysiological processes over the past few decades, including inflammation-driven diseases [
15,
16,
17,
18,
19,
20], tumorigenesis [
9], tumor metastasis [
21,
22] and cellular proliferation [
23,
24]. It has been shown that iPolyP mediates cellular proliferation by selectively upregulating the mechanistic target of rapamycin (mTOR) phosphorylation at Ser2481 [
23]. Three binding receptors have been identified for iPolyP: namely the advanced glycosylation end-product specific receptor (RAGE), purinergic receptor P2Y1 and transient receptor potential cation channel subfamily M (melastatin) member 8 (TRPM8) [
25,
26]. Preliminary evidences lighted up a novel pathway involving iPolyP/RAGE receptor linked to Wingless-related integration site (Wnt)/β-catenin signaling axis, of crucial importance for the regulation of major pathophysiological processes in tumor cells [
27]. However, besides slight evidences about iPolyP-mediated cell proliferation, not many studies have yet reported associations between iPolyP, its receptor and cancer [
28], perhaps due to difficulties in iPolyP quantification and lack of comparative data for neoplastic and corresponding normal counterpart. Parallelly, recent literature has reported an overexpression of TRPM8 receptor in CRC specimens, which correlates with poorer survival [
29]. TRPM8 belong to the transient receptor potential (TRP) cation channel superfamily, subfamily melastatin (M), member 8 (TRPM8), also known as the cold and menthol receptor 1 (CMR1) [
30]. However, its clinical relevance remains largely fragmented. In our study we tested the amount of iPolyP in tumoral and peritumoral tissues of enrolled colorectal cancer subjects, showing a significant discrepancy. Moreover, we determined the role of TRPM8 receptor as mediator of iPolyP signaling, which, ultimately, leads to the activation of proliferative marker in CRC. Overall, these findings might add iPolyP to the list of early biomarkers of CRC, together with DNA, RNA and proteins, shown to prolong the overall survival of patients [
31], thus potentially paving the way for the development of novel anticancer agents as supplement to conventional chemotherapy.
2. Materials and Methods
2.1. Patients’ Samples
In this retrospective study, samples derived from 50 patients with CRC, who were candidates for surgical treatment, were studied. Patients provided written informed consent to the collection of blood samples for biomarker analysis under Prot. No. 397/C.E. of 16/09/2020 of the Local Ethics Committee “Gabriella Serio” IRCCS Istituto Tumori “Giovanni Paolo II”, Bari, Italy. Biopsy tissue specimens were provided by the Histopathology Unit of IRCCS “S. de Bellis”. The analyses were performed by comparing two different sections of histological sample from the same patients, so as to identify a healthy portion (Normal or Peritumoral) and a diseased portion (Pathological or Tumoral).
2.2. Tissue Preparation
Patients (Pt) tissues, subdivided into two counterparts, Peritumoral (PT) and Tumoral (T), were tested for the amount of iPolyP, by fluorometric assay, and for the level of PCNA and TRPM8 by immunoblotting. Tissues were lysed using a tissue homogenizer (TissueLyser II), (QIAGEN, Hilden, Germany; Cat. no. 85300) in Buffer III/Poly P Extraction Buffer, for iPolyP detection, described in detail in the Inorganic polyphosphate detection assay section, or in T-PERTM Tissue Protein Extraction Reagent supplemented with Halt™ Protease and Phosphatase Inhibitor Single-Use Cocktail, EDTA-Free (100X) for protein analysis, described in the immunoblotting section.
2.3. Inorganic Polyphosphate Detection Assay
Inorganic polyphosphate was detected in tumoral and peritumoral tissues, using the Inorganic Polyphosphate Assay Kit (Fluorometric), (Abcam, Cambridge Biomedical Campus, Cambridge, U.K.; Cat. no: ab284528) following relative manufacturer’s recommendations. Briefly, homogenized tissues were centrifuged at 10,000 x g for 15 minutes at 4°C and the clear supernatant was collected and treated with RNAse Positive Control/RNase, DNase and Proteinase K. 100 µL of the stock polyphosphate standard/iPolyP standard solution was mixed with 900 µL of water to prepare 10 µM polyphosphate standard/iPolyP standard solution used to assay and plot the polyphosphate standard curve. To test 5 μL of each sample in triplicate, 96-wells plates were prepared, adjusting the volume of each well to 50 μL using Polyphosphate Assay Buffer/iPolyP Assay Buffer. Reaction mix at 50 μL including 47 μL of Polyphosphate Assay Buffer and 3 µL of Polyphosphate Dye, was added to each well, including standards and samples. The plates were incubated for 10 minutes at room temperature and the fluorescence of all wells was measured at Ex/Em = 415/550 nm at room temperature in endpoint mode. Calculation of the amount of inorganic polyphosphate was performed using the following equation: Amount of iPolyP (pmol/mg) = A x D / W x Vt / Va, where: A = Amount of iPolyP was calculated from the polyphosphate standard/iPolyP standard curve (pmol), D = Sample dilution factor (D = 1, for undiluted samples), W = Weight of the tissue used (in mg) or protein amount as determined by the protein assay (mg), Vt = Total sample volume, Va = Volume of sample measured in the well. Protein amount (in mg) was determined using Bio-Rad (Bio-Rad Laboratories, Hercules, California, U.S.A.; Cat. no: Hercules, California, U.S.A.; Cat. no: 5000006EDU) protein assay dye reagent.
2.4. Cell Culture and Reagents
Human colorectal adenocarcinoma Caco-2 and SW620 cells were purchased from the American Tissue Culture Collection (ATCC, Manassas, Virginia, U.S.A.; Cat. no. HTB-37 and CCL-227, respectively). Human Colonic Epithelial Cells 1 transduced with CDK4 and Telomerase HCEC-1CT cells were purchased from Evercyte GmbH (Vienna, Austria; Cat. no. CkHT-039-0229). Caco-2 and SW620 cells were grown in Dulbecco’s Modified Eagle’s medium (DMEM), (Thermo Fisher Scientific, Waltham, Massachusetts, U.S.A.; Cat. no: 11965092), supplemented with 10% fetal bovine serum (Thermo Fisher Scientific, Waltham, Massachusetts, U.S.A.; Cat. no: A5256701), 1 mM Sodium Pyruvate (Thermo Fisher Scientific, Waltham, Massachusetts, U.S.A.; Cat. no: 11360039), 25 mM HEPES (Thermo Fisher Scientific, Waltham, Massachusetts, U.S.A.; Cat. no: 15630056) and 100 U/mL Antibiotic-Antimycotic (Thermo Fisher Scientific, Waltham, Massachusetts, U.S.A.; Cat. no: 15240062). Human Colonic Epithelial Cells 1 transduced with CDK4 and Telomerase (HCEC-1CT) were grown in ColoUp medium ready to use (Evercyte GmbH, Vienna, Austria; Cat. no: MHT-039), supplemented with 100 U/mL Antibiotic-Antimycotic. All cell lines were maintained in a humidified atmosphere at 37°C with 5% CO2. Cells were passaged and medium was changed every other day.
2.5. Cellular Treatments
HCEC-1CT, Caco-2 and SW-620 cell lines were seeded into 6-well plates (Corning, New York, New York, U.S.A.; Cat. no. 3516) at a density of 0.5 x 10⁶ cells/well in 2 mL of complete cell culture medium. Seeded cells were treated with 0.5 μM of sodium phosphate glass (iPolyP) (Sigma-Aldrich, St. Louis, Missouri, U.S.A.; Cat. no: S4379-500mg), or with 10 μM of TRPM8 receptor inhibitor N-(3-Aminopropyl)-2-[(3-methylphenyl)methoxy]-N-(2-thienylmethyl)benzamide hydrochloride (AMTB), (Santa Cruz Biotechnology, Dallas, Texas, U.S.A.; Cat. no: 926023-82-7), or in combination for 72 hours. Dimethyl sulfoxide (DMSO), (Sigma-Aldrich, St. Louis, Missouri, U.S.A.; Cat. no. D8418-100mL) was added to the control cells. Pharmacological inhibition of the iPolyP/TRPM8 axis was performed by adding AMTB to the HCEC-1CT, Caco-2 and SW620 cell lines. Pharmacological inhibition of the P2Y1 receptor was performed with Adenosine 2′,5′-diphosphate sodium salt (Santa Cruz Biotechnology, Dallas, Texas, U.S.A.; Cat. no: SC-214495); RAGE receptor inhibition was performed with (Abcam, Cambridge Biomedical Campus, Cambridge, U.K.; Cat. no. ab235552). Cells were centrifuged at 1100 rpm for 5 minutes at 4°C and washed with 1X of sterile Dulbecco’s phosphate buffered saline 1 (1X DPBS) (Thermo Fisher Scientific, Waltham, Massachusetts, U.S.A.; Cat. no. 14190-094) twice. Dried pellets were frozen at - 80°C or resuspended and lysed in 200 μL of T-PERTM Tissue Protein Extraction Reagent (Thermo Fisher Scientific, Waltham, Massachusetts, U.S.A.; Cat. no: 78510) supplemented with Halt™ Protease and Phosphatase Inhibitor Single-Use Cocktail, EDTA-Free (100X) (Thermo Fisher Scientific, Waltham, Massachusetts, U.S.A.; Cat. no. 78443) for immunoblotting analysis.
2.6. Immunoblotting
Both tissue and cellular lysates were incubated on ice for 30 minutes and vortexed every 10 minutes. Samples were then centrifuged at 16,000 rpm at 4°C for 20 minutes to clarify and precipitate insoluble debris. Total extracted proteins were assayed to measure concentrations using the Bio-Rad protein assay dye reagent concentrate (Bio-Rad Laboratories, Hercules, California, U.S.A.; Cat. No: 5000006EDU). Then, proteins were mixed with 4 x Laemmli Sample Buffer (Bio-Rad Laboratories, Hercules, California, U.S.A.; Cat. No: 1610747) and 10% of β-mercaptoethanol (Sigma-Aldrich, St. Louis, Missouri, U.S.A.; Cat. No: M6250-100mL) and denatured at 95°C for 5 minutes. 25 μg of proteins were loaded onto precast polyacrylamide 4-20% gels (Bio-Rad Laboratories, Hercules, California, U.S.A.; Cat. No: 4568094), subsequently blotted on a polyvinylidene fluoride (PVDF) membrane (Bio-Rad Laboratories, Hercules, California, U.S.A.; Cat. No: 1704156) using the trans-blot turbo transfer system (Bio-Rad Laboratories, Hercules, California, U.S.A.; Cat. No. 1704150). Membranes were blocked using Pierce™ Protein-Free Blocking Buffer (Thermo Fisher Scientific, Waltham, Massachusetts, U.S.A.; Cat. No: 37571) for 1 hour and stained overnight with primary antibodies. The next day membranes were washed three times with 1X of Tris Buffered saline (1X TBS), (Bio-Rad Laboratories, Hercules, California, U.S.A.; Cat. No: 1706435 diluted in ddH2O to reach 1X)/TWEEN20 (Sigma-Aldrich, St. Louis, Missouri, U.S.A.; Cat. No: P9416-100mL) incubated for 1 hour with the respective horseradish peroxidase-conjugated secondary antibodies. Proteins were detected using the Clarity Max Western ECL Substrate (Bio-Rad Laboratories, Hercules, California, U.S.A.; Cat. No: 1705062) and the signals were obtained using the Chemidoc MP Imaging System (Bio-Rad Laboratories, Hercules, California, U.S.A.; Cat. No. 1708280). The following primary antibodies were used: anti-PCNA, 1:1000 (Santa Cruz Biotechnology, Dallas, Texas, U.S.A.; Cat. No. SC-56); anti-TRPM8, 1:1000 (Thermo Fisher Scientific, Waltham, Massachusetts, U.S.A.; Cat. No. MA5-35474); anti-GAPDH, 1:1000 (Santa Cruz Biotechnology, Dallas, Texas, U.S.A.; Cat. No. SC-47724); anti-β-Actin, 1:1000 (Cell Signaling Technology, Danvers, Massachusetts, U.S.A.; Cat. No. 4970S); anti-P2Y1-R, 1:1000 (Abcam, Cambridge Biomedical Campus, Cambridge, U.K.; Cat. No. ab168918); anti-RAGE-R, 1:1000 (Abcam, Cambridge Biomedical Campus, Cambridge, U.K.; Cat. No. ab216329). GAPDH and β-Actin were used as loading controls. The following secondary antibodies were employed: Anti-rabbit IgG, HRP-linked Antibody, 1:2000 (Cell Signaling Technology, Danvers, Massachusetts, U.S.A.; Cat. no. 7074S); Goat anti-Mouse IgG (H+L)-HRP Conjugate (Bio-Rad Laboratories, Hercules, California, U.S.A.; Cat. no: 1706516).
2.7. Knockdown of TRPM8 with siRNA
For TRPM8-knockout experiments using siRNA, HCEC-1CT, Caco-2 and SW620 were electrophored with two TRPM8 Silencer siRNAs (Thermo Fisher Scientific, Cat. no. 4392420, ID: S35489 and ID: S35490, respectively) or with Silencer siRNA Negative Control (Thermo Fisher Scientific, Cat. no. 4390843). Electroporation was performed using the Neon™ NxT Electroporation System (Thermo Fisher Scientific, Cat. no. NEON1SK), according to the manufacturer’s recommendations.
2.8. Crystal Violet Assay
HCEC-1CT, Caco-2 and SW620 cells were seeded into 96-well plates (Corning, New York, New York, U.S.A.; Cat. No. 3599) at a density of 2 x 10³ cells/well in 100 μL of complete medium and left overnight to allow complete attachment. The next day (considered t = 0 hour), the medium was removed and replaced with 100 μL of fresh serum-free medium to allow cell cycle synchronization. Seeded cells in triplicate wells were treated and maintained in the different conditions: 0.5 μM of iPolyP, or 10 μM of AMTB, or both in combination, for 96 hours. Controls were cells treated with DMSO. After 96 hours, cells were fixed by adding 100 μL/well of 4% paraformaldehyde (PFA), (Sigma-Aldrich, St. Louis, Missouri, U.S.A.; Cat. no. P6148-500G), pH 7.6 at room temperature for 30 minutes to the medium (obtaining 2% PFA final concentration). Each well was subsequently stained with 0.02% of crystal violet solution (Sigma-Aldrich, St. Louis, Missouri, U.S.A.; Cat. no. HT90132-1L) for 10 minutes and washed with cold water to eliminate surplus staining. Images were collected with a Nikon Ti2 inverted laser-scanning confocal microscope equipped with a 10X objective (0.25 numerical aperture), as described in the immunofluorescence and confocal microscopy section, in bright-field and analyzed with NIS-Elements software (version 5.11.01) and ImageJ2 (version 2.14.0/1.54f) before complete solubilization. Finally, cell-bound crystal violet staining was redissolved in aqueous solution containing 1% sodium dodecyl sulfate (SDS), (Sigma-Aldrich, St. Louis, Missouri, U.S.A.; Cat. no. L3771-100G) at room temperature for 30 minutes and the absorbance was measured at λ = 595 nm with the iMarkTM Microplate Absorbance Reader (Bio-Rad Laboratories, Hercules, California, U.S.A.; Cat. No. 168-1130).
2.9. Immunofluorescence Microscopy
2 x 10⁵/mL cells were grown in 35-mm petri dishes, no. 1.5 coverglass (MatTek, Ashland, Massachusetts, U.S.A.; Cat. no. P35G-1.5-14-C). Fixative, permeabilization, and blocking buffers were prepared in 1X DPBS. Cells were fixed with 4% PFA for 30 minutes at room temperature and then washed twice using 1X DPBS. Permeabilization was performed for 5 minutes at room temperature using 0.15% Triton X-100 (in 1X DPBS). Washing was performed to remove permeabilization buffer. Cells were then blocked for 1 hour at room temperature using blocking buffer (3% bovine serum albumin (BSA), (Sigma-Aldrich, St. Louis, Missouri, U.S.A.; Cat. no. A7030-100G)/1X DPBS). Cells were incubated with primary antibody overnight. Nuclei were stained using PureBlu DAPI (Bio-Rad Laboratories, Hercules, California, U.S.A.; Cat. no. 1351303). Extensive washing steps were performed to remove unbound stain. Anti-Ki67 (ready-to-use, Abcam, Cambridge Biomedical Campus, Cambridge, U.K.; Cat. no. ab16667) was used as primary antibody. Images were collected with a Nikon Ti2 inverted laser-scanning confocal microscope equipped with Plan Apo 20X (0.75 numerical aperture) in bright-field and analyzed with NIS-Elements software (version 5.11.01) and ImageJ2 (version 2.14.0/1.54f). All fluorescence images were collected with a confocal Yokogawa spinning-disk on a Nikon Ti inverted microscope equipped with Plan Fluor 20X (0.75 numerical aperture) lens; bright-field micrographs relative to CRC organoids were acquired with Plan Fluor 60X (0.85 numerical aperture); bright-field micrographs relative to spheroids were acquired with Plan Fluor 40X (0.60 numerical aperture) and 20X. Images were acquired with a Hamamatsu ORCA ER cooled CCD camera controlled with NIS-Elements software (version 5.11.01). Images were collected using an exposure time of 700 milliseconds. Gamma, brightness, and contrast were adjusted on displayed images (identically for comparative image sets) using NIS-Elements software (version 5.11.01). The Perfect Focus System was kept running for continuous maintenance of focus. DMEM without phenol red (Thermo Fisher Scientific, Waltham, Massachusetts, U.S.A.; Cat. no. 21063-045) was used during image acquisition.
2.10. CRC Tumor Organoids
CRC specimens from surgically resected tumor tissue were washed three times with 1X DPBS and digested with collagenase/hyaluronidase mixture (Stemcell Technologies, Cat. no. 07912), diluted in HBSS solution (with CaCl
2 and MgCl
2, Thermo Fisher Scientific, Waltham, Massachusetts, U.S.A.; Cat. no. 14025-050) for 5 hours under gentle rocking at 37°C. A single cell suspension was obtained and cells were embedded in matrigel matrix basement membrane (Corning, New York, New York, U.S.A.; Cat. no. 356231), and cultured in IntestiCult-SF (ICT-SF) medium (Stemcell Technologies, Vancouver, British Columbia, Canada; Cat. no. 100-0340) medium diluted 1:2 in Advanced DMEM/F-12 (Thermo Fisher Scientific, Waltham, Massachusetts, U.S.A.; Cat. no. 12634-010), supplemented with N-2 (Thermo Fisher Scientific, Waltham, Massachusetts, U.S.A.; Cat. no. 17502-048), B27 supplement (Thermo Fisher Scientific, Waltham, Massachusetts, U.S.A.; Cat. no. 12587-010), 0.01% bovine serum albumin, antibiotic/antimycotic, and HEPES. Medium was renewed every two days until the organoids were fully developed (7-10 days). Mature organoids were split using TrypLE Select dissociation agent (Thermo Fisher Scientific, Waltham, Massachusetts, U.S.A.; Cat. no. A12177-01) according to [
32] and the suspended cells obtained were re-cultured at a lower density in matrigel.
2.11. CRC Tumor Organoid Growth Test
Mature CRC tumor organoids were split to obtain single cell suspensions. Cells were counted and 2,000 cells were embedded in 40 µL of matrigel (with a matrigel density of 65%) in 96-well plates, cultured in ICT-SF medium, and allowed to grow for 10 days in the presence or absence of iPolyP at a concentration of 0.5 µM. Medium and iPolyP were replaced every 2 days. At the end point of the experiment, microscopic images of organoids were acquired in bright-field with the Nikon Confocal Microscope Eclipse Ti2. The growth rate of organoids was determined using CellTiter 96 AQueous One Solution Cell Proliferation Assay (Promega Corporation, Fitchburg, Wisconsin, U.S.A.; Cat. no. G3580), according to the manufacturer’s recommendations.
2.12. Cell Lines-Derived Spheroids
1 x 10³ of Caco-2, SW620 and HCEC-1CT cells were seeded into 3D low attachment 96-well cell culture plates (Corning, New York, New York, U.S.A.; Cat. no. 4520) to obtain 3D cell line spheroids with 100 µL of growth medium in each well. Cells were kept in culture in the above-mentioned conditions. After seeding, all cell lines were treated with iPolyP and/or AMTB, while untreated cells were used as controls (untreated, UT). Spheroid cultures were observed at 24, and 96 hours and maintained in a humidified incubator set to 37°C and 5% CO2. After 96 hours, UT and treated cells were fixed with a 4% paraformaldehyde solution in 1X PBS and used for microscopy analysis.
2.13. Gene Expression Analysis by Real-Time Quantitative Reverse Transcription PCR
Caco-2 cells were seeded into 6-well plates at a density of 0.5 x 10⁶ cells/well in 2 mL of complete cell culture medium. Seeded cells were treated with 0.5 μM of iPolyP, for 72 hours; untreated cells were used as control. Caco-2 cells were seeded into 6-well plates at a density of 0.5 x 10⁶ cells/well in 2 mL of complete cell culture medium. Seeded cells were treated with 0.5 μM of iPolyP, for 72 hours; untreated cells were used as control. Untreated cells were used as control. RNA extraction was performed from frozen cell pellets using RNeasy Mini Kit (QIAGEN, Hilden, Germany; Cat. no: 74104) according to the manufacturer’s recommendations. The RNA concentration was measured using a NanoDrop 2000c (Thermo Fisher Scientific, Waltham, Massachusetts, U.S.A.; Cat. no. ND-2000) and 2 μg total RNA was reverse transcribed to cDNA using a High-Capacity cDNA Reverse Transcription Kit (Thermo Fisher Scientific, Waltham, Massachusetts, U.S.A.; Cat. no 4368814) following the relative protocol. Reactions were induced using the iTaq Universal SYBR Green Supermix (Bio-Rad Laboratories, Hercules, California, U.S.A.; Cat. no: 1725124) and the validated human primers purchased from Bio-Rad (Hercules, California, U.S.A.), with the following assay ID numbers: CCNA1, qHsaCID0008934; CCNB1, qHsaCID0010571; CCND1, qHsaCID0013833; GAPDH, qHsaCED0038674. Real-Time PCR analysis was performed with CFX96 Touch Deep Well Real-Time PCR Detection System (Bio-Rad Laboratories, Hercules, California, U.S.A.; Cat. no. 3600037) and experiments were conducted for three times in triplicate. Relative expression was calculated using the 2−ΔΔCt method.
2.14. Cell Cycle Assay
Caco-2 and SW620 cells were seeded into 24-well plates (Corning, New York, New York, U.S.A.; Cat. no. 3524) at a density of 2 x 10⁴ cells/well in 100 μL of complete medium and left overnight to allow complete attachment. The following day the medium was replaced with fresh serum-free medium to allow cell cycle synchronization. Cells were treated with 0.5 μM of iPolyP, or with 10 μM AMTB hydrochloride, or both in combination for 72 hours. Controls were cells treated with DMSO. After treatments 150 μL of cell-clock dye, from the Biocolor Cell-ClockTM Cell Cycle Assay (Ilex Life Science, Candler, North Carolina, U.S.A.; Cat. no. C1000) kit, were added to the center of each well and incubated for 1 hour at 37°C, according to the manufacturer’s recommendations. Culture medium added with reagent was softly discarded and replaced with 200 μL of fresh medium. Micrographs of live cells were acquired using a Nikon Confocal Microscope Eclipse Ti2 in bright field equipped with a Plan Fluor 20X (0.75 numerical aperture) lens, and all experiments were conducted in triplicate. The calculation of phase percentages was obtained by analysis made with ImageJ2 software. The Redox dye used in this test is uptaken by live cells and the outcome is a color-defined cell cycle stage; each color was associated to cells in G0-G1 (yellow staining), S (green staining), G2 and M (dark green/blue phases).
2.15. Statistical Analysis
Patients’ characteristics are reported as Mean and Standard Deviation (M ± SD), and as frequencies and percentages (%) for categorical. To compare iPolyP values between groups, Mann–Whitney rank test was used for continuous variables. Spearman rank correlation coefficient was used to test the strength and direction of associations between iPolyP and TRPM8/PCNA. When testing the null hypothesis of no association, the two-tailed probability level of error was set at 0.05. All statistical computations were made using StataCorp. (2021) Stata Statistical Software: Release 17 (StataCorp LLC, College Station, Texas, U.S.A.), while RStudio (“Chocolate Cosmos” Release, Posit PBC, Massachusetts, U.S.A.) was used for the plots.
4. Discussion
Despite the enormous efforts made striving towards the development of new therapeutical strategies targeting the molecular complexity discernible in colorectal cancer, CRC remains one of the deadliest human neoplasms [
33]. The CRC elusiveness is primarily due to the interplay between advanced age, environmental and lifestyle factors, mammalian- and microbiota-derived metabolites and genetic alterations, underlying each stage of tumorigenesis [
34,
35], which limit effective CRC-specific therapy [
36]. Cancer cell metabolism thrives best in a hypoxic environment and relies on alternative energy sources to survive and proliferate [
37]. The linear polymer composed of several up to hundreds of phosphate residues, named inorganic polyphosphate, fits the role of energy supplier well, with its phosphoanhydride ATP-like bonds [
38]. Not surprisingly, in fact, in vitro, an involvement of iPolyP in cancer cell proliferation and tumor progression has been recently proposed, and demonstrated [
22], although the evidence is still minor, perhaps due to the difficulty in visualizing this macromolecule in experimental conditions. Enzymatically synthesized iPolyP has two known sources, bacterial and human. In bacteria, iPolyP ranges from 100 to 1,000 units thanks to the high processivity of the enzyme polyphosphate kinase 1 (
ppk1), which uses ATP as substrate [
39,
40,
41]. Human-derived iPolyP shows an average of ~60-100 phosphate residues, and no known kinase has so far been linked [
42,
43,
44]. The different number of orthophosphate residues might affect the proliferative, pro-inflammatory and pro-tumorigenic tasks of iPolyP. Moreover, it is largely unknown whether iPolyP has peculiar strains within an altered intestinal flora (a condition termed dysbiosis) which contribute most strongly to iPolyP synthesis. However, emerging studies, assisted by state-of-the art methodologies, are revealing the influence of a dysbiotic phenotype in CRC onset and progression, which is bringing to light an exponential number of novel biomarkers [
45,
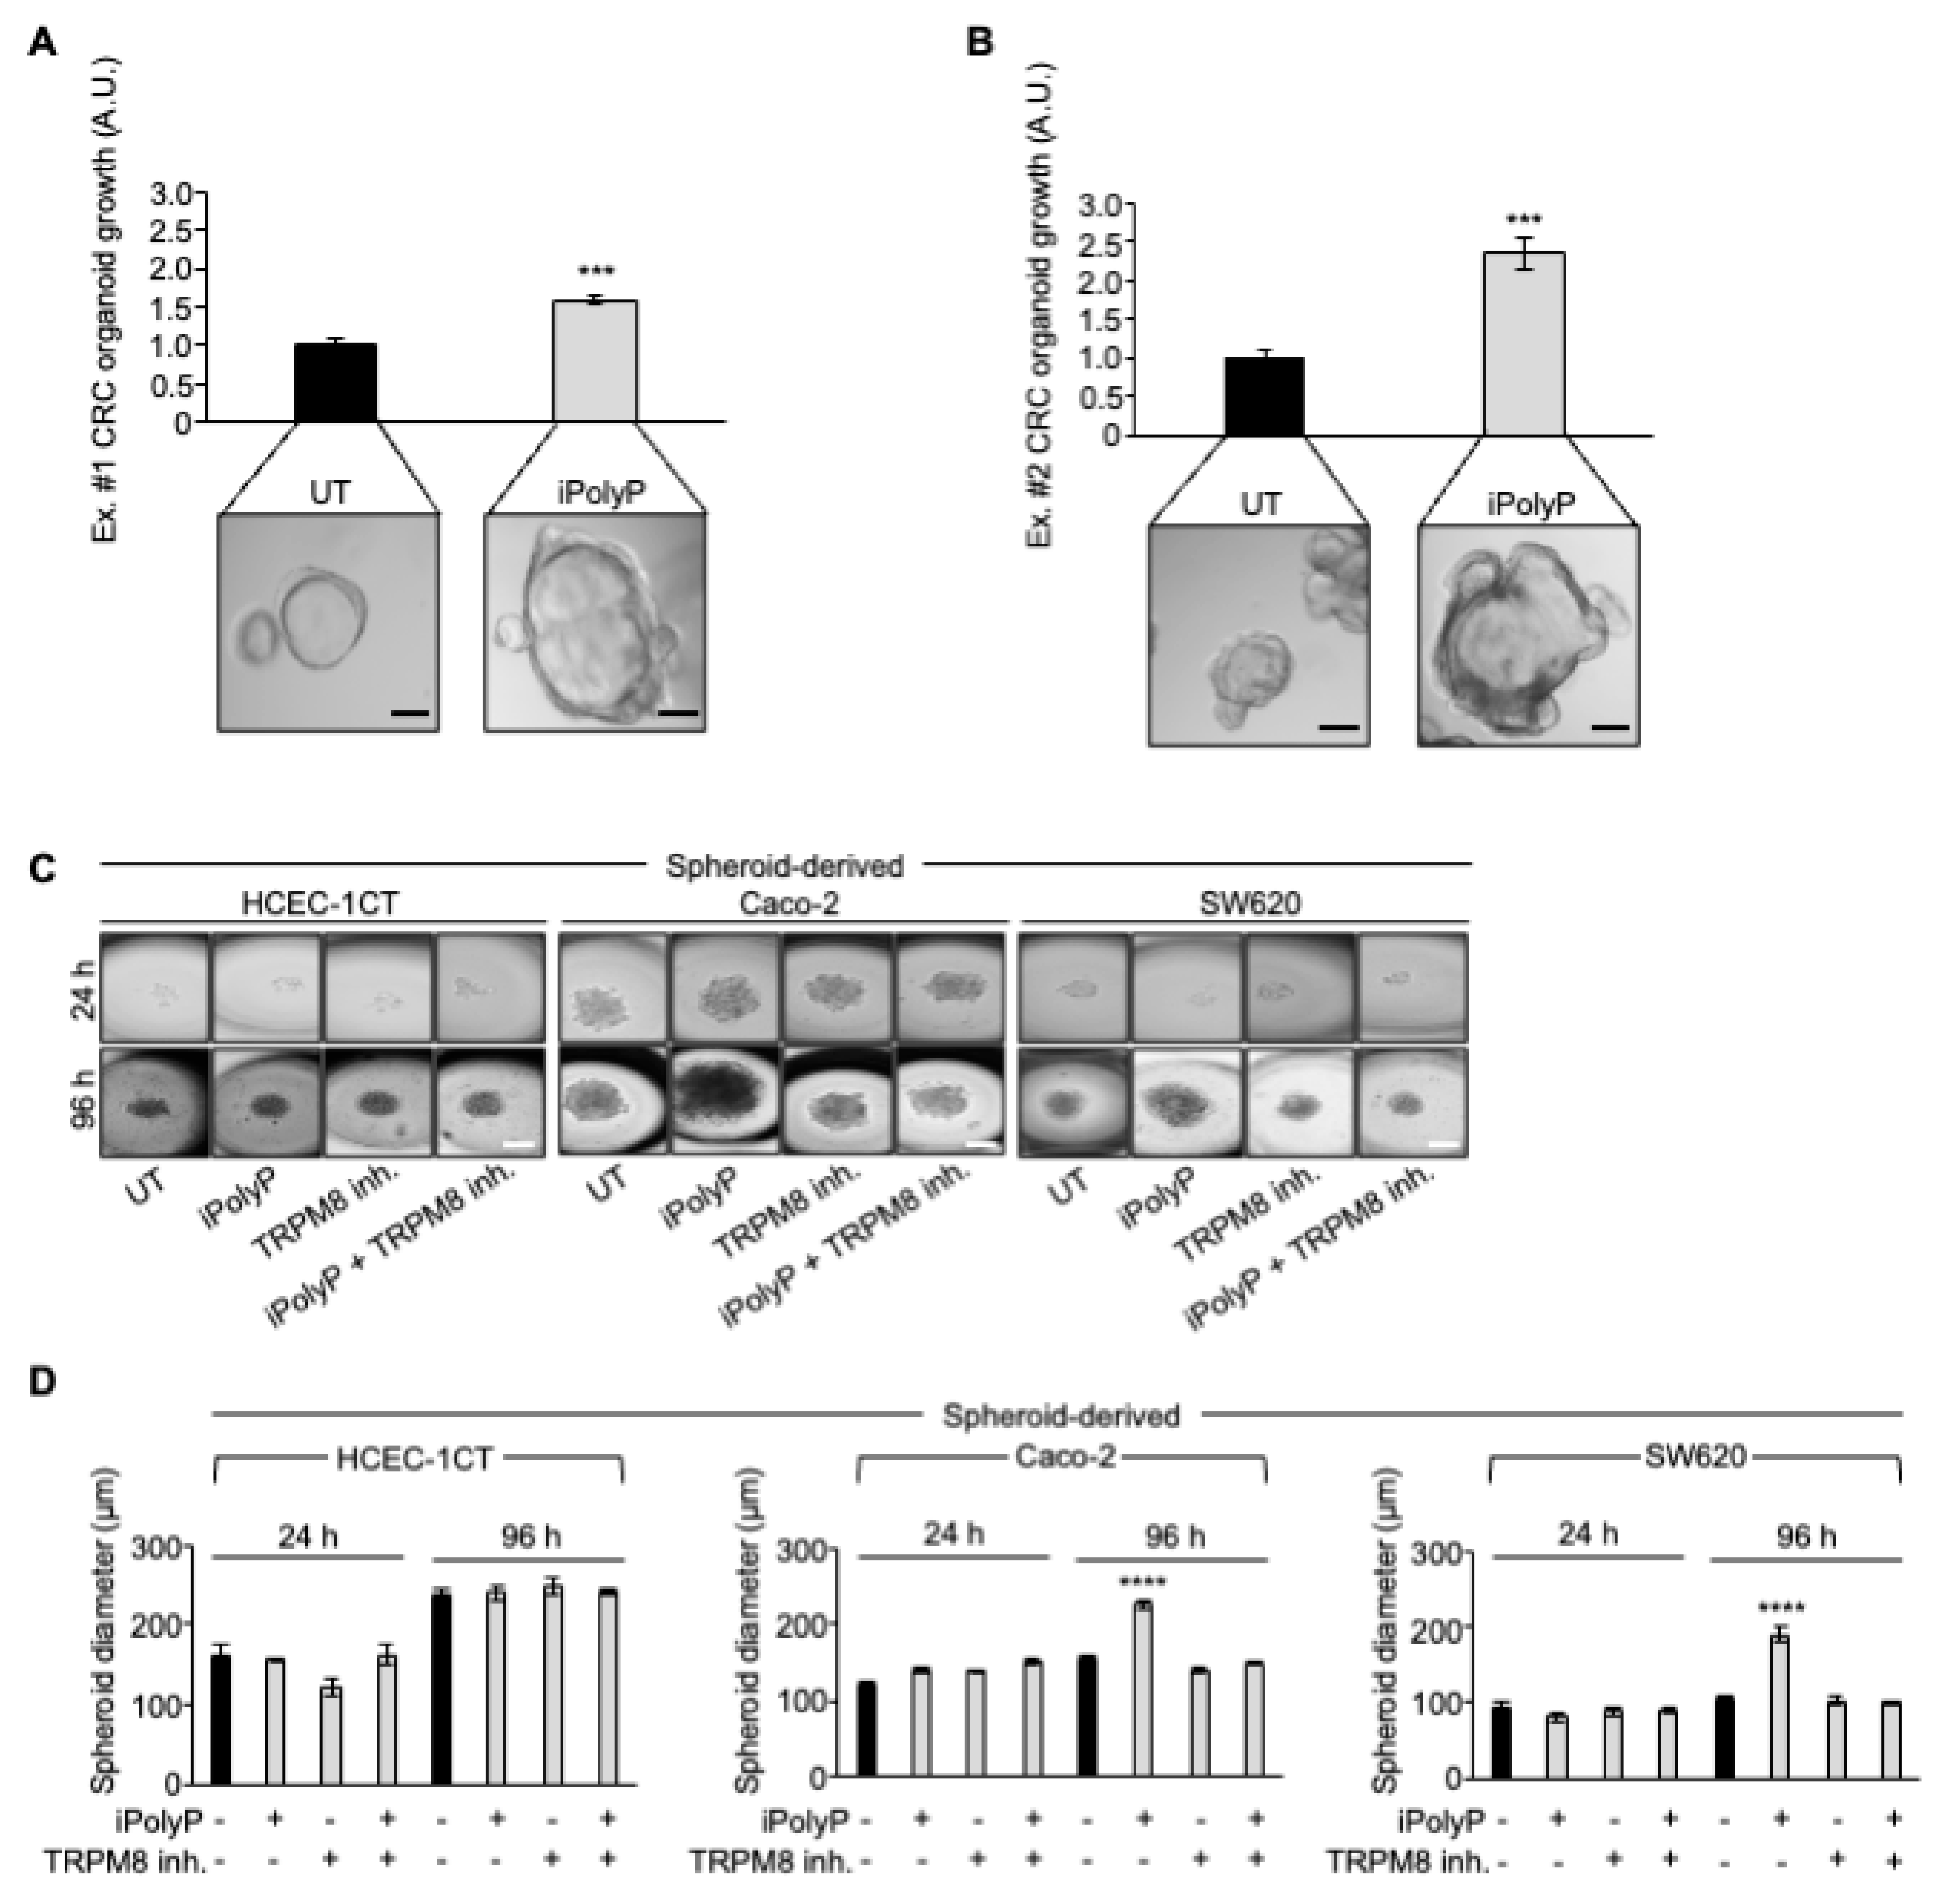
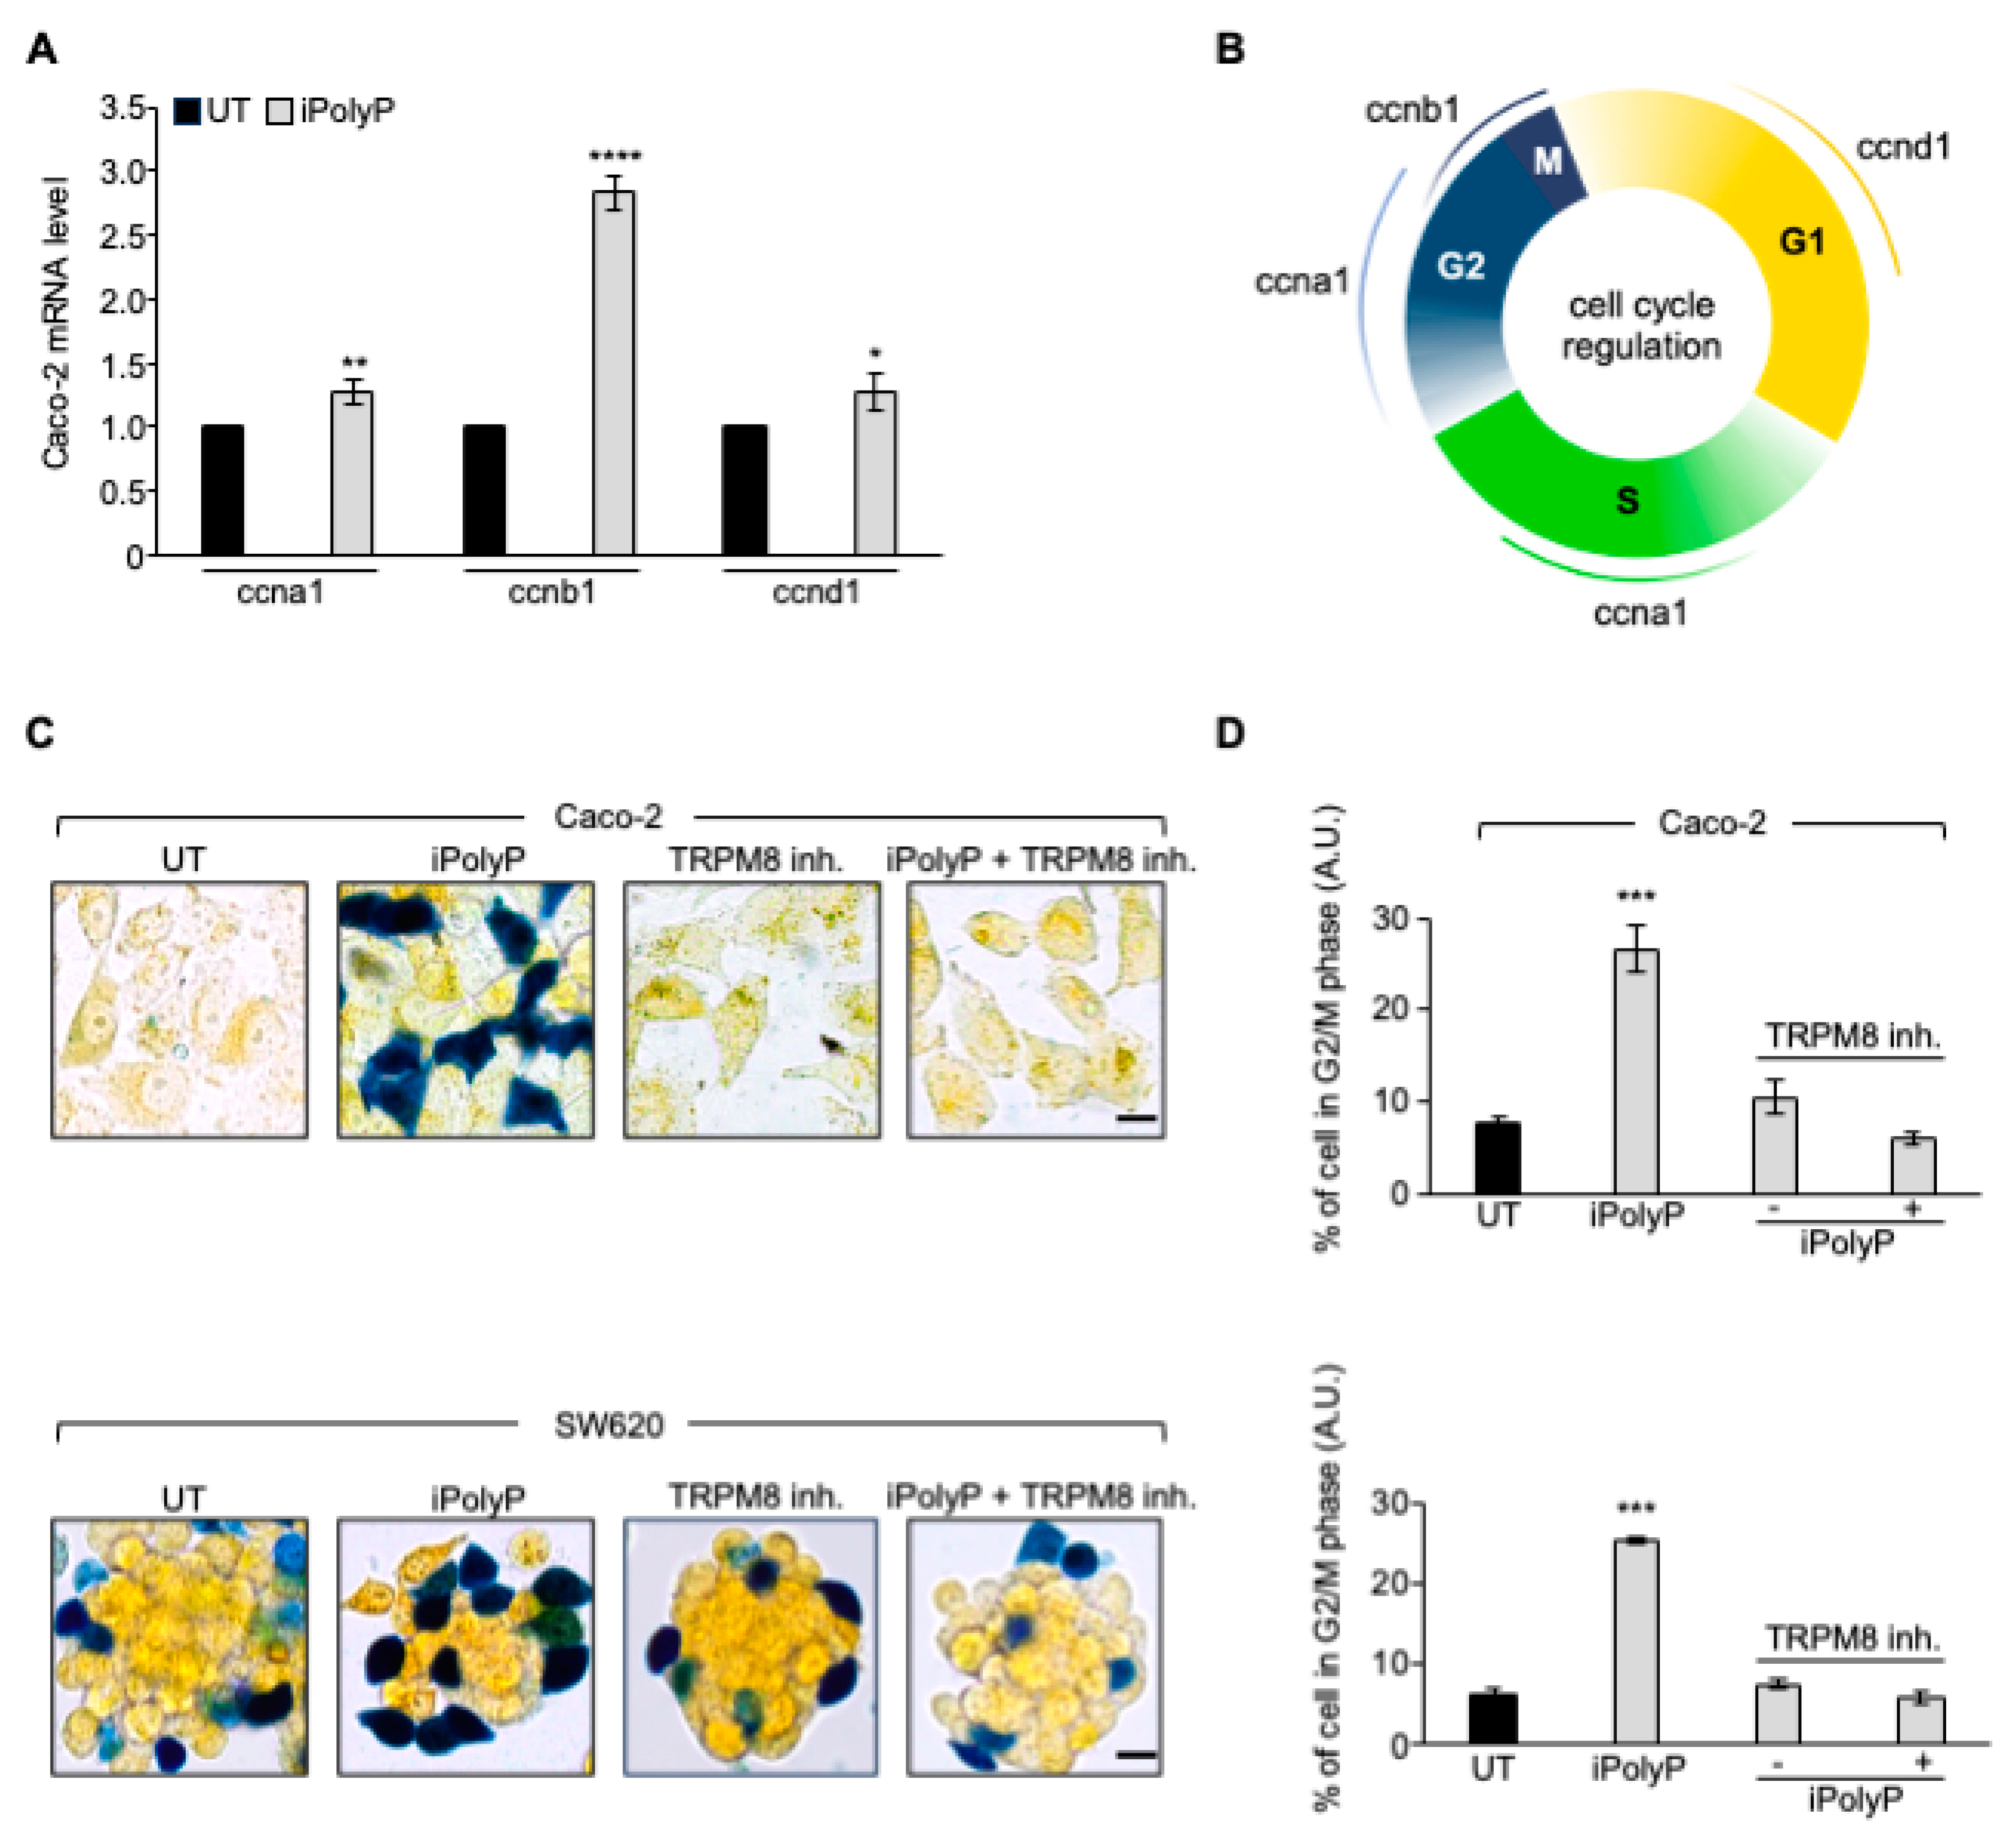
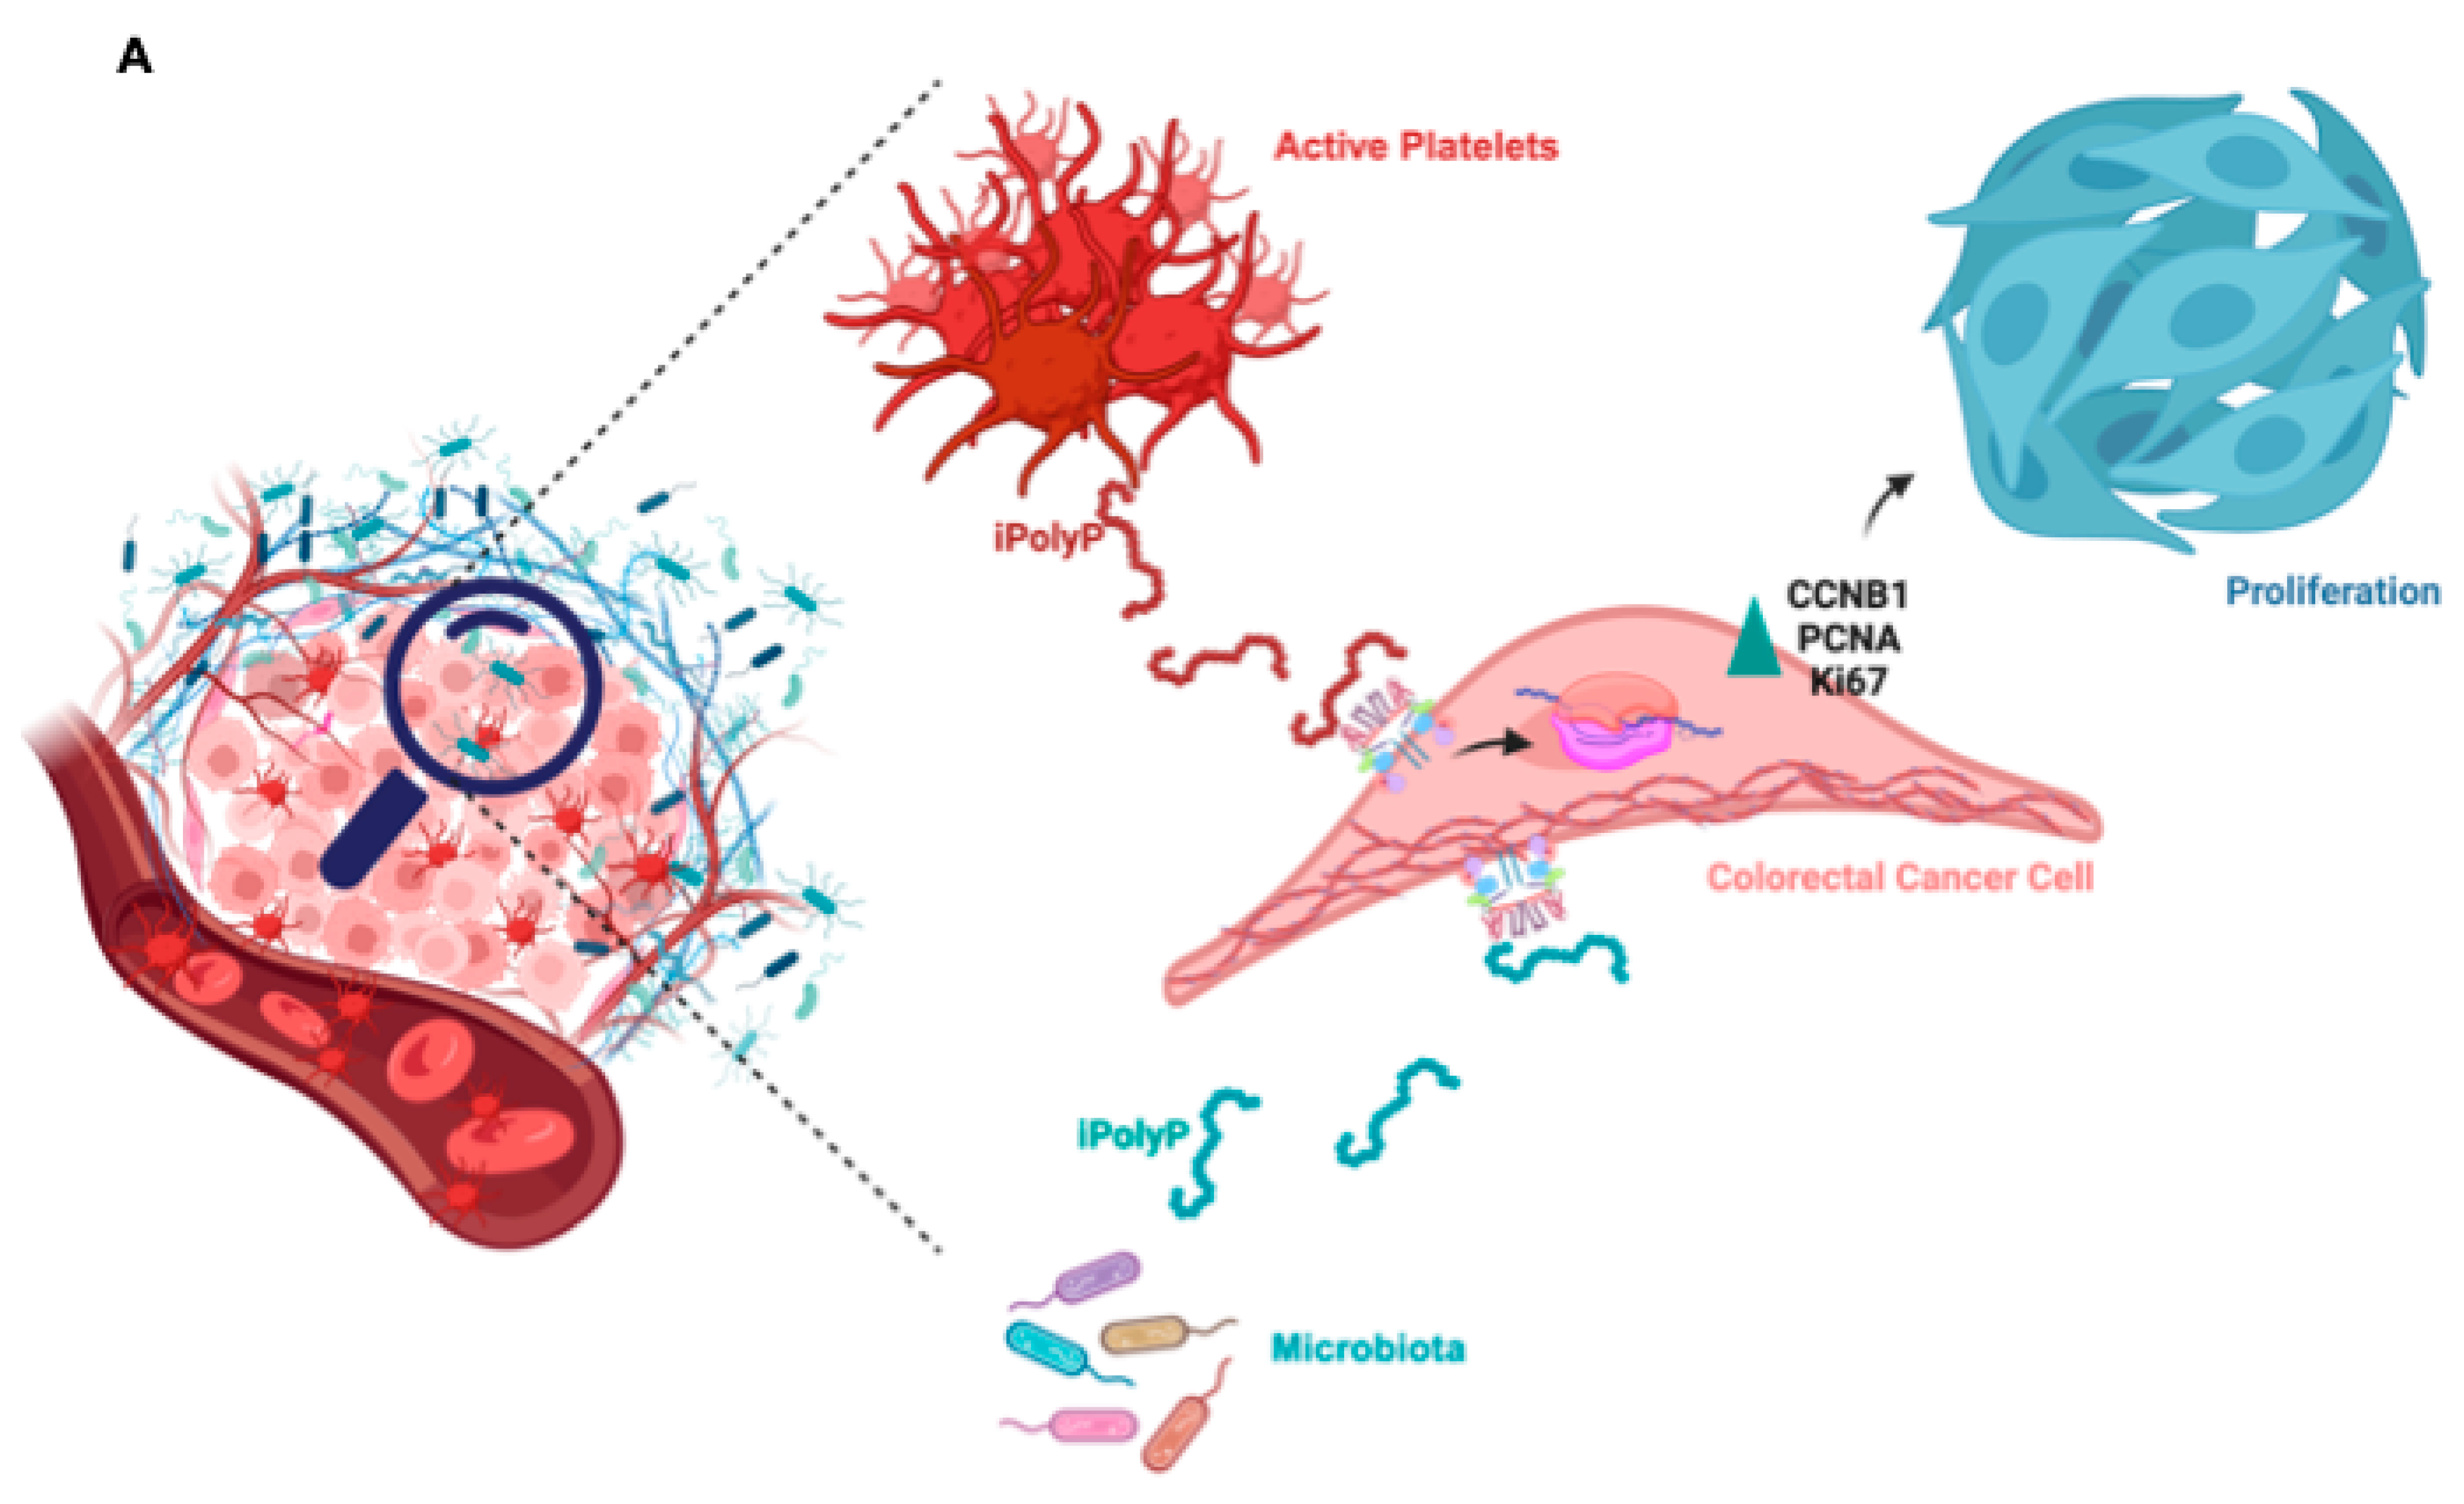
46]. In this context we studied whether iPolyP, either of bacterial or human origin, could somehow foster the pathogenesis of CRC. By applying in-vitro and ex-vivo approaches, we demonstrated for the first time that iPolyP facilitates CRC cells proliferation by markedly engaging the TRPM8 receptor channel. This conclusion is based on the following evidence, summarized in Figure 7A: (i) tumoral tissues isolated from CRC subjects betrayed elevated levels of iPolyP, proportional to the amount of the PCNA proliferation marker; (ii) iPolyP governs CRC cell lines proliferation by interacting with the TRPM8 receptor, found to be positively correlated with the concentrations of iPolyP within tumoral tissues; (iii) ex-vivo experiments, performed on CRC patients-derived organoids and in-vitro 3D cell culture, showed a significantly higher growth rate in the presence of iPolyP compared to untreated samples or samples in which TRPM8 was antagonized, (iv) the iPolyP-TRPM8 axis engagement triggers the expression of
ccnb1, whose corresponding protein product is Cyclin B, which drives the cells into the mitotic phase of the cell cycle. Understanding the source of iPolyP is becoming decisive to target the proliferative pathway. Several studies in the field of microbiology are nowadays focusing on pathogenic bacteria, such as
Salmonella enterica, with particular emphasis on the mechanism employed by iPolyP in the onset of disparate mammalian diseases [
47,
48,
49]. Intriguingly, a recent article led by Boyineni and colleagues showed that cancer cells are capable to endogenously produce iPolyP which fosters the metabolism under their period of starvation, as a result of insufficient tumor vascular supply [
50]. Thus, ongoing mass spectrometry experiments in our laboratory aim firstly to elucidate the provenience of iPolyP within CRC context, steering research toward the appropriate in-vivo models targeting either the bacterial or human kinase responsible for the inorganic polyphosphate biosynthesis. Although the molecular pathway needs to be fully interpreted, and more experimental evidences are required to confirm our hypothesis, these results uncover a novel, functional axis in the CRC background, shedding light on new directions for study and paving the way for the development of new therapeutic strategies for CRC patients.
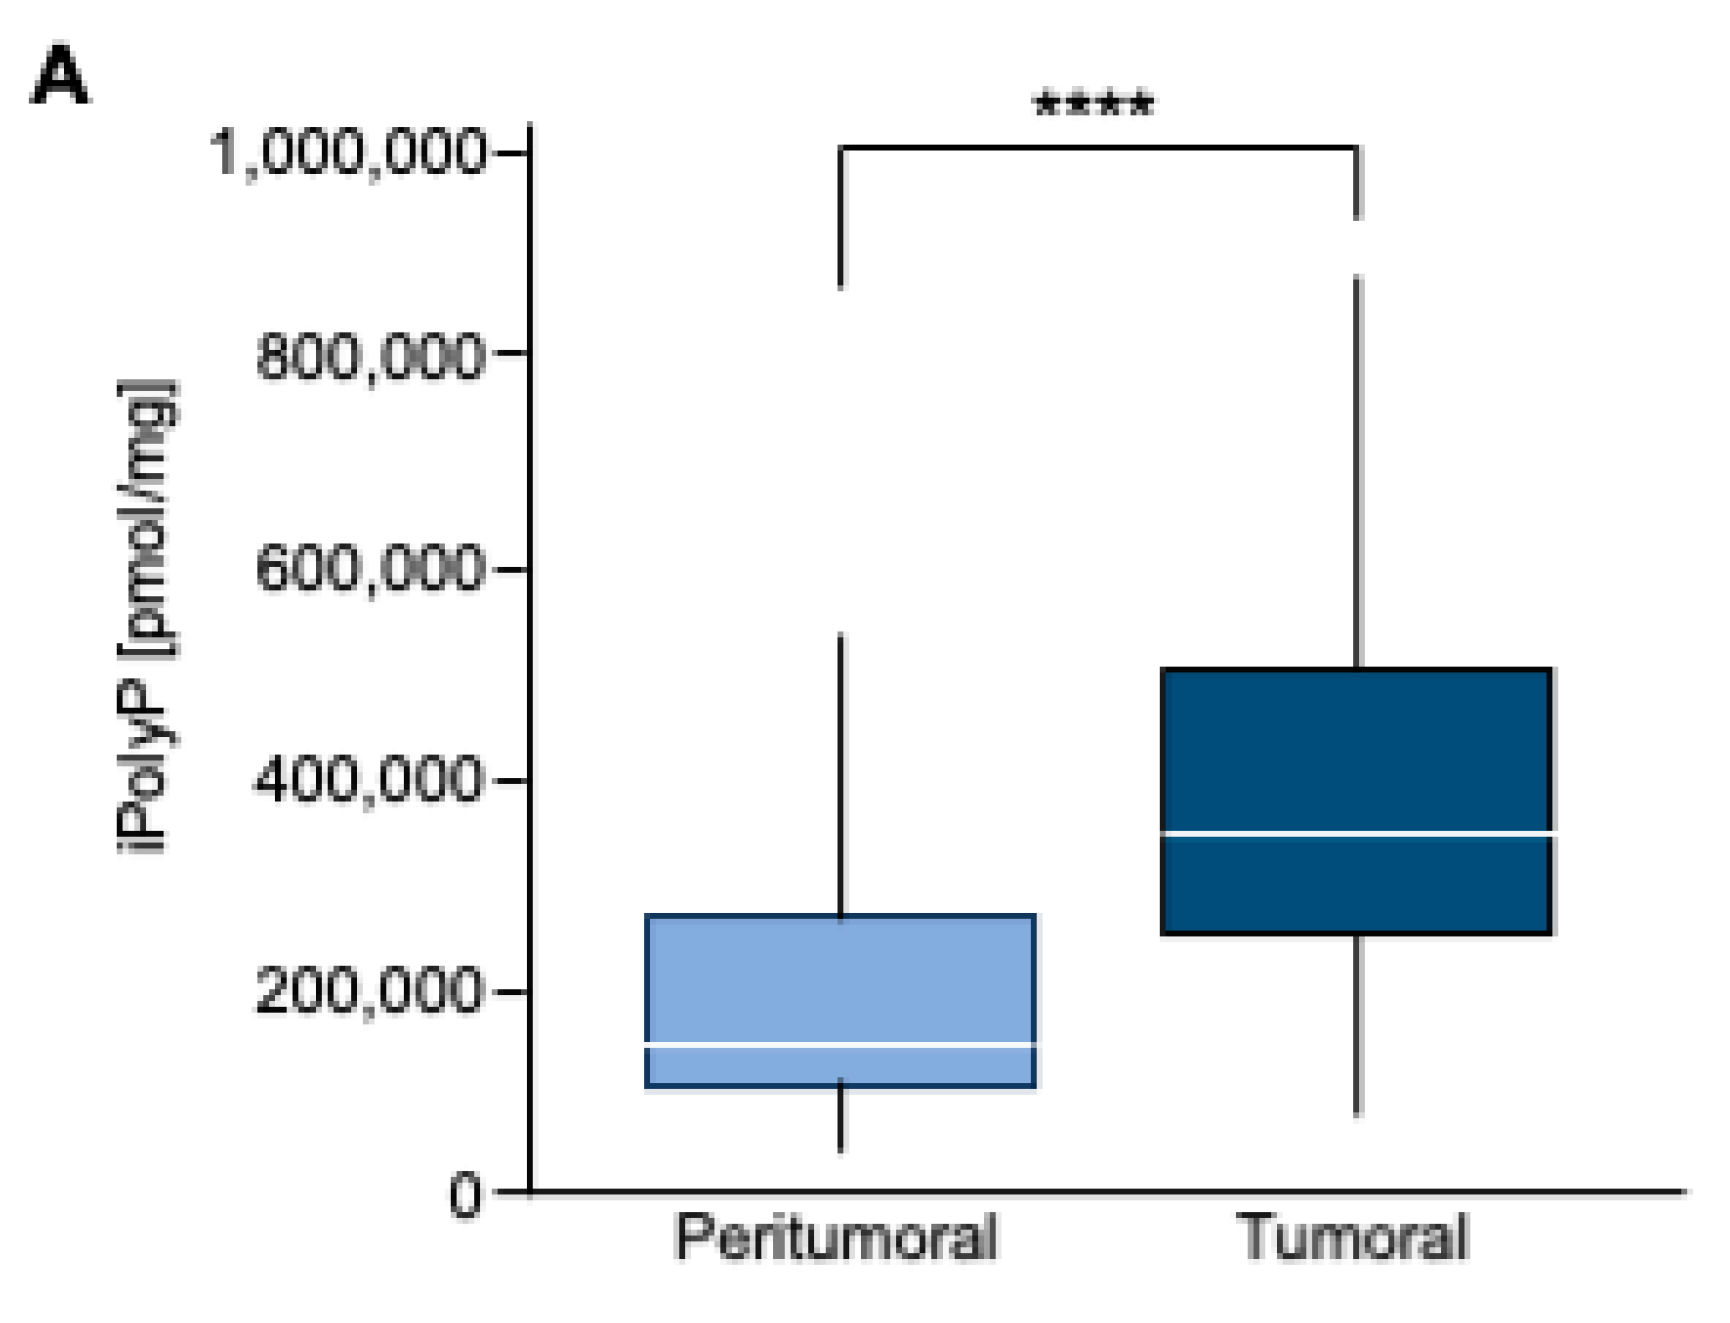
Figure 1.
A. Box Plot of iPolyP distribution, stratified by Peritumoral or Tumoral patients. Statistical difference was found (median value of 373097.70 ± 210216.20 pmol/mg for tumoral tissue vs 166102.70 ± 124618.80 pmol/mg for the peritumoral counterpart, **** p < 0.0001). Analysis was performed by Mann–Whitney rank test.
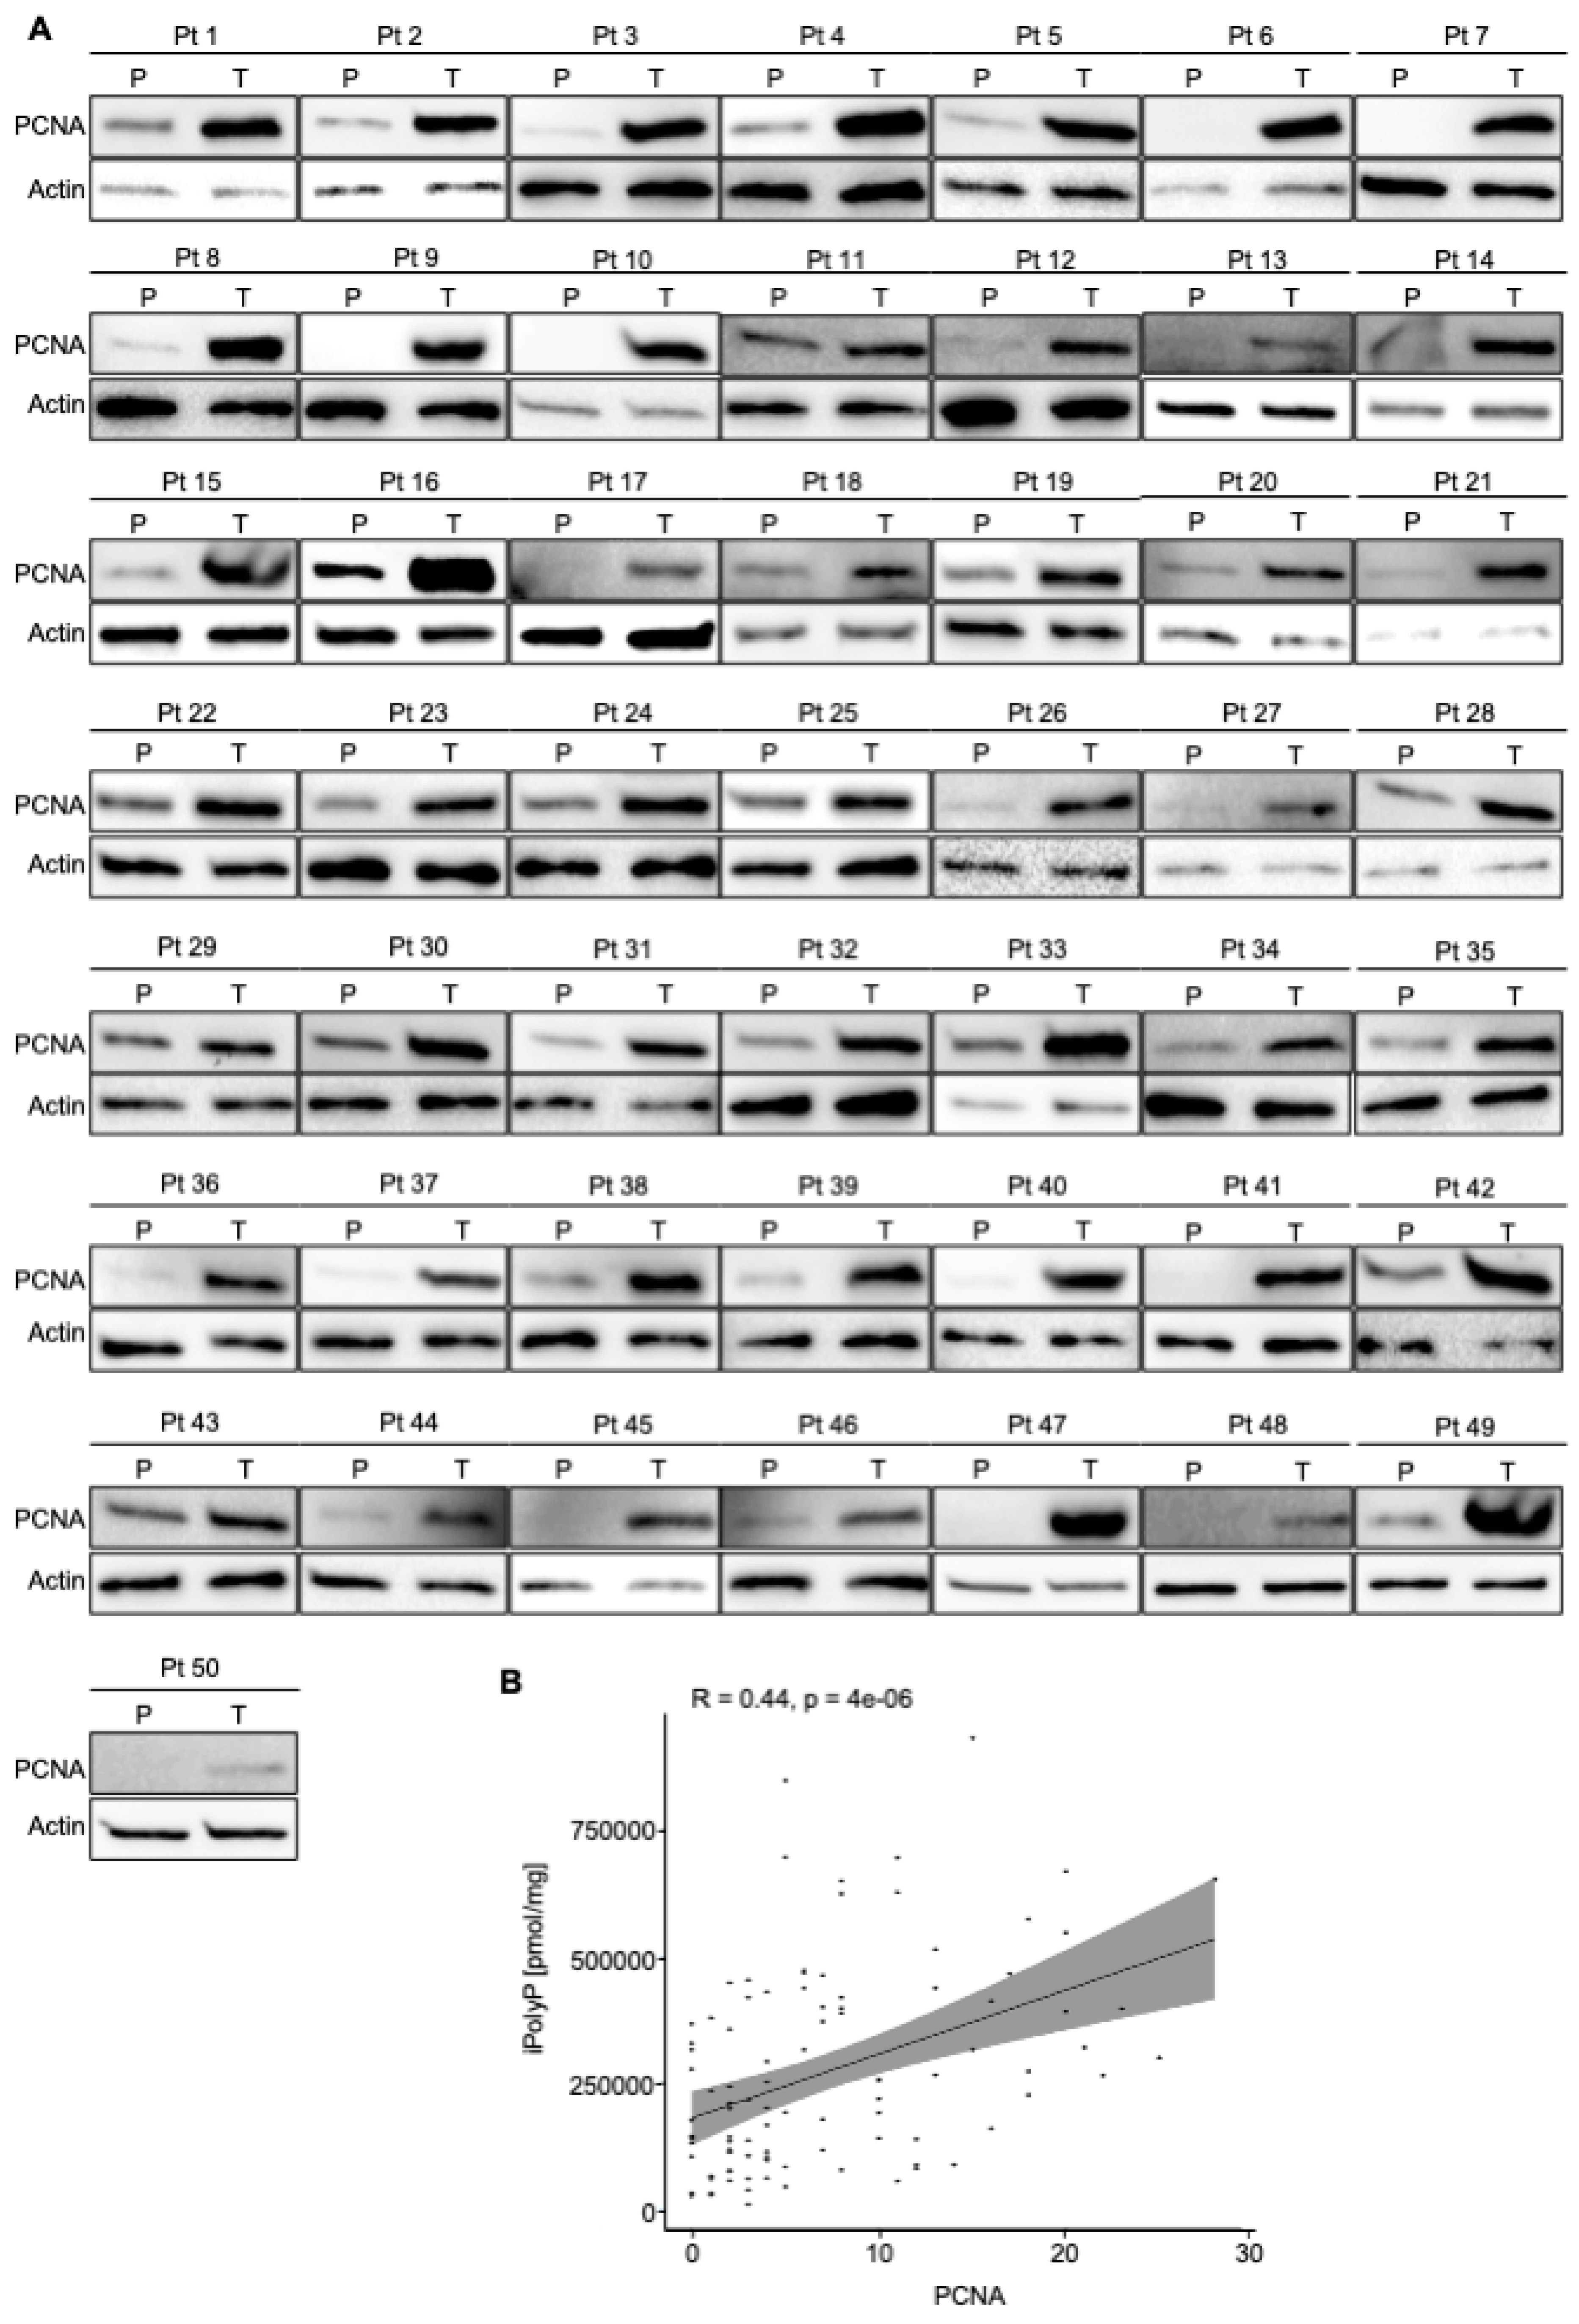
Figure 2.
CRC displays high level of PCNA. A. Cellular extracts from 50 human biopsies, where Tumoral sample (T) was plotted against the Peritumoral (P) counterpart of the same patient (Pt), were analyzed by immunoblotting for PCNA expression level. Actin was used as loading control for the normalization. B. Spearman correlation between iPolyP and PCNA in total cohort denoting a strong positive correlation (**** p < 0.0001). Fold changes versus Peritumoral (P), normalized to 1.
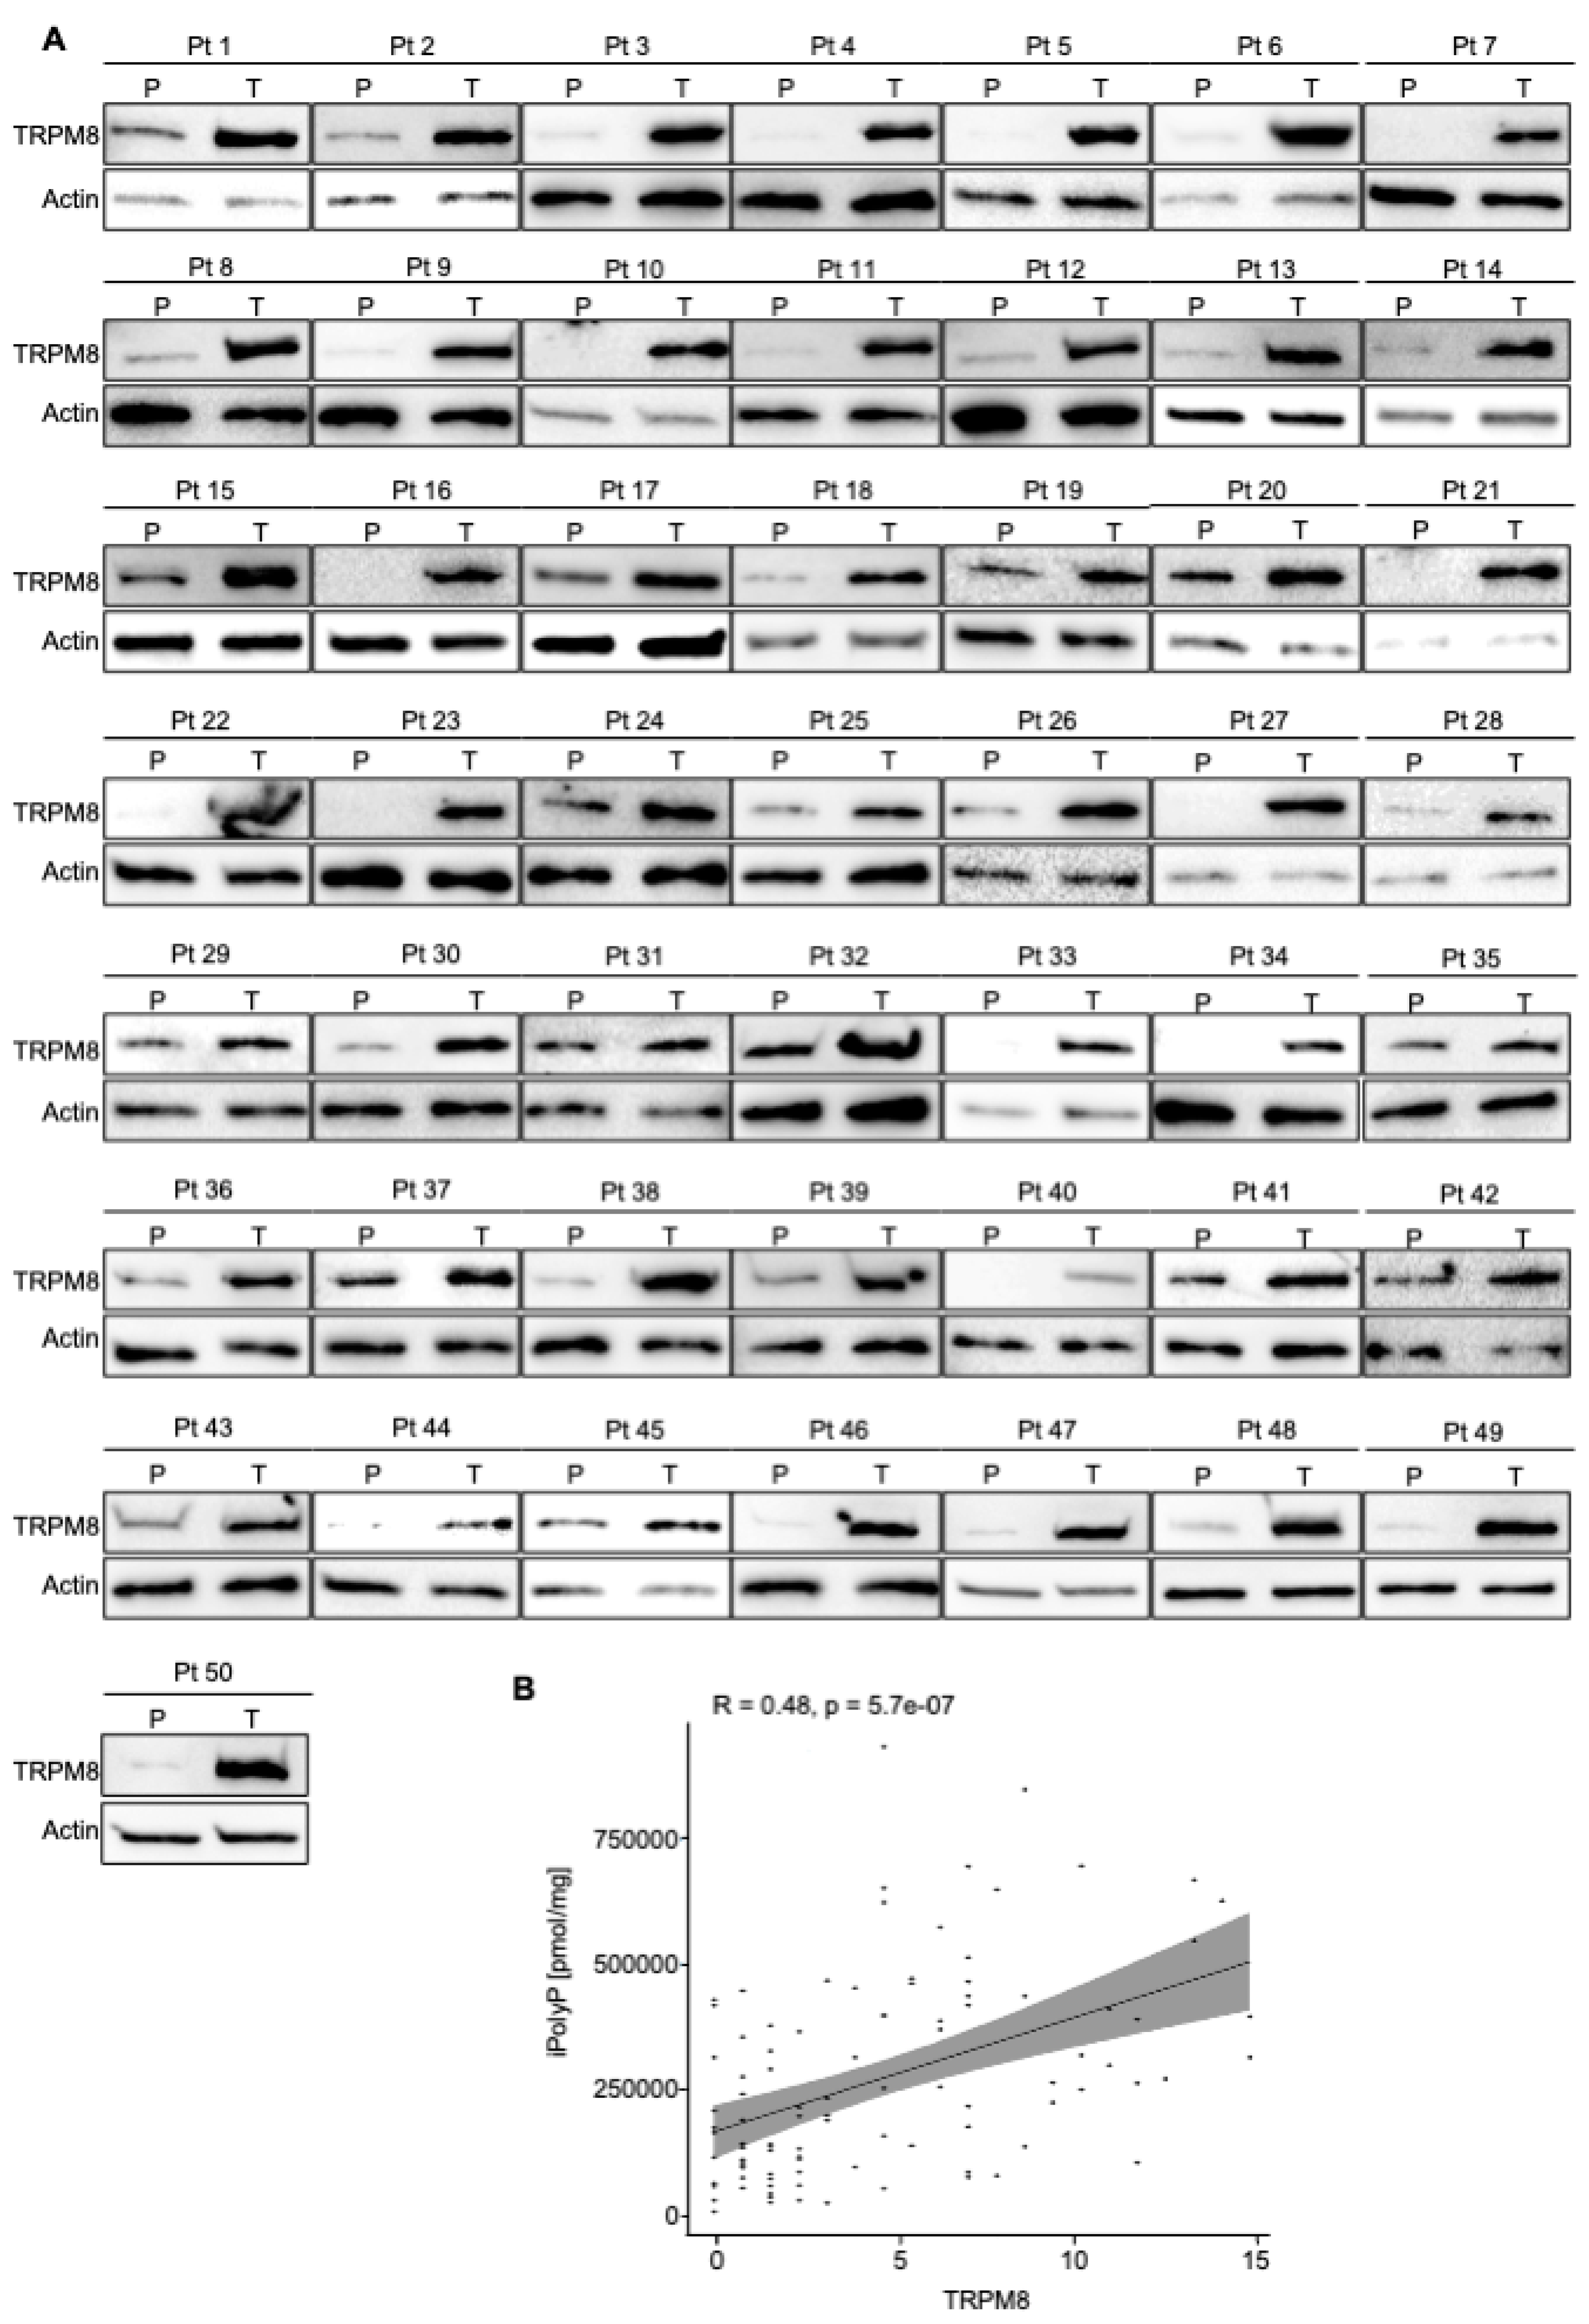
Figure 3.
CRC displays high level of TRPM8 receptor. A. Cellular extracts from 50 human biopsies, where Tumoral sample (T) was plotted against the Peritumoral (P) counterpart of the same patient (Pt), were analyzed by immunoblotting for TRPM8 expression level. Actin was used as loading control for the normalization. B. Spearman correlation between iPolyP and TRPM8 in total cohort denoting a strong positive correlation (**** p < 0.0001). Fold changes versus Peritumoral (P), normalized to 1.
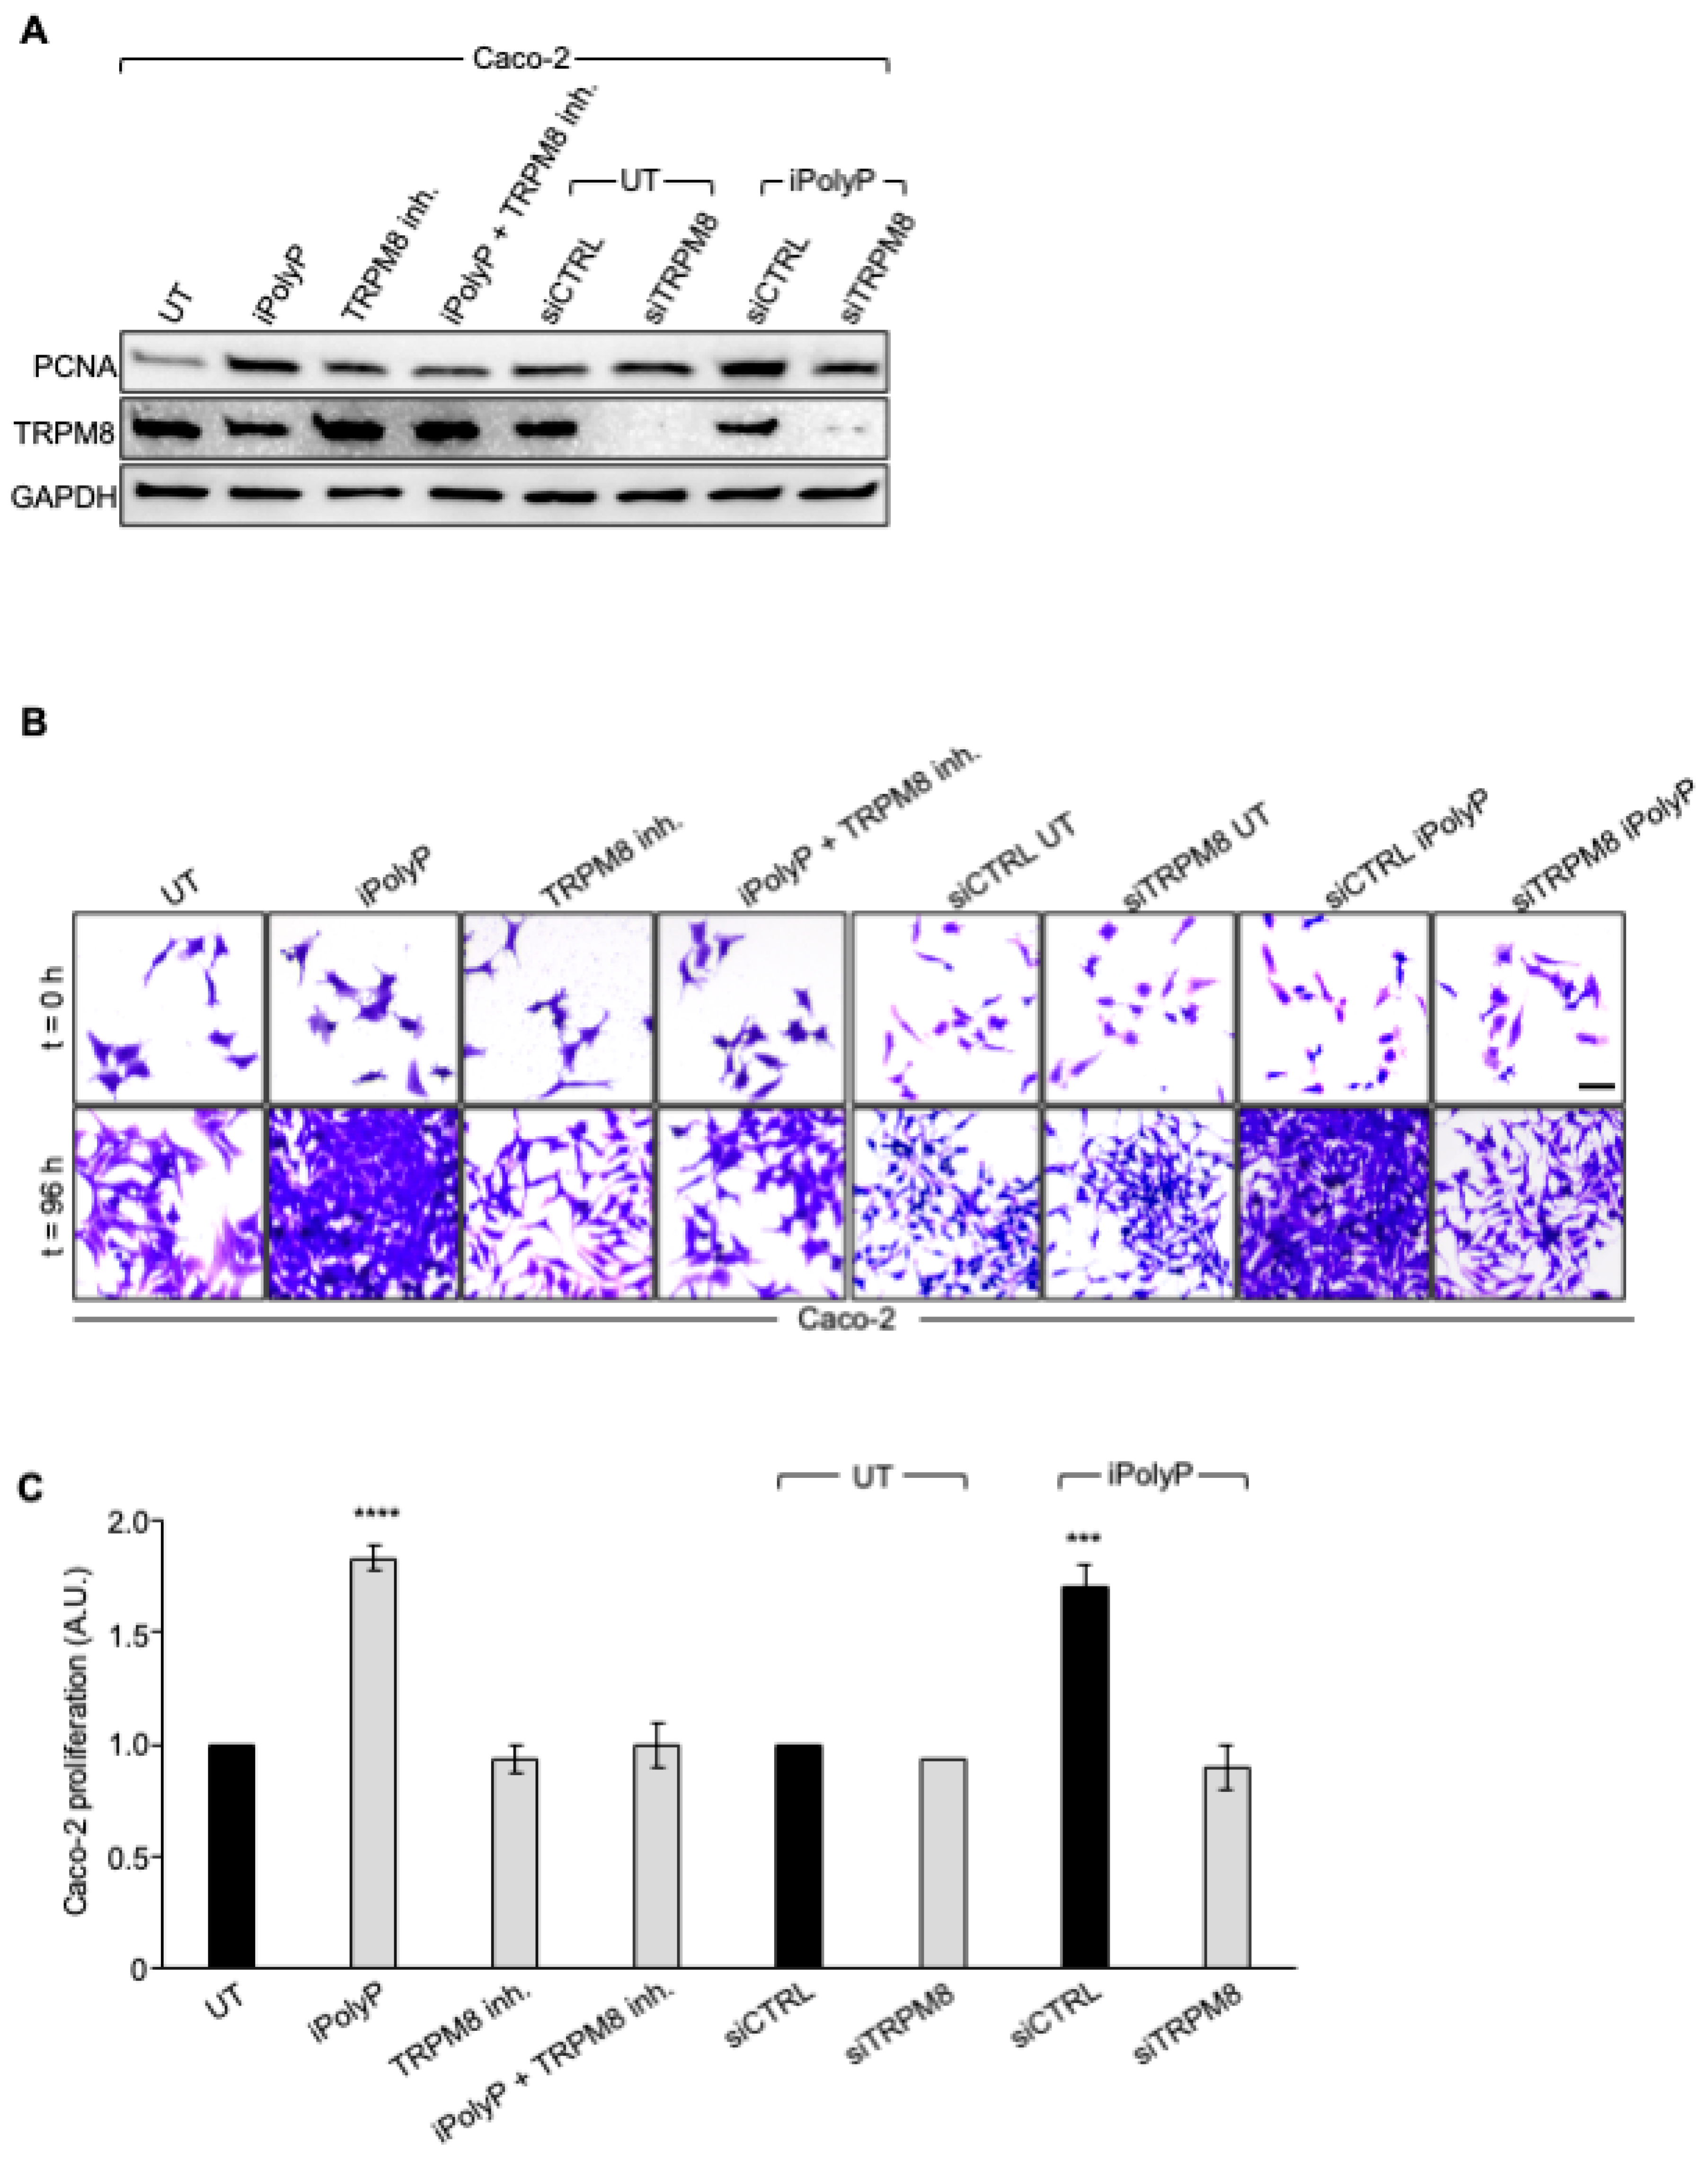
Figure 4.
iPolyP enhances PCNA expression and promotes Caco-2 colorectal cancer proliferation. A. Cellular extracts from WT and siRNA-mediated TRPM8 knockdown Caco-2 cell lines were analyzed by immunoblotting for PCNA expression level. GAPDH was used as loading control. B. Representative micrographs of the crystal violet assay performed on WT and siRNA-mediated TRPM8 knockdown Caco-2 cell lines upon treatment for 96 h with iPolyP, TRPM8 inhibitor or both. Scale bar 10 µm. Images are representative of three independent experiments. C. Statistical analysis of the crystal violet assay by Student’s t-test, respectively for panel C, (*** p < 0.001 and **** p < 0.0001). Fold changes versus control, untreated (UT), normalized to 1. Data are presented as mean ± SD for triplicate wells from three independent experiments.
Figure 5.
iPolyP promotes colorectal cancer patient-derived organoid and Caco-2- and SW620-derived 3D spheroids. A, B. Two independent experiments of CRC patient’s-derived organoids, assessed by light microscopy, in the absence (UT) or incubated for 10 days in the presence of iPolyP. Scale bar 100 µm. Fold changes versus control, untreated (UT), normalized to 1. Statistical analysis performed by Student’s t-test (*** p < 0.001). C. Representative bright-field images of 24 h- and 96 h-induced spheroid formation derived from HCEC-1CT, Caco-2 and SW620 cell line, respectively, upon treatment with iPolyP, TRPM8 inhibitor or both for 96 h. Scale bar 100 µm. Images are representative of three independent experiments. D. Quantification relative to panel C. Fold changes versus control, untreated (UT). Statistical analysis performed by Student’s t-test (**** p < 0.0001). Data are presented as mean ± SD for triplicate wells from three independent experiments.
Figure 6.
iPolyP drives cells into G2/M phase. A. Real-Time PCR on iPolyP-treated Caco-2 cell line for 72 h on cyclins implicated in difference phases of the cell cycle; untreated, UT, samples were normalized to 1. B. Sketch representing cyclins-dependent cell cycle regulation consisting of Gap 1 (G1), synthesis (S), Gap 2 (G2), and mitosis (M). Figure was created with BioRender. C. Representative micrographs of the cell cycle assay on Caco-2 (upper panel) and SW620 (lower panel) cell line treated for 72 h with iPolyP, TRPM8 inhibitor or both. Scale bar = 10 µm. Images are representative of three independent experiments. D. Percentage of cells in G2/M phase. Statistical analysis performed by Student’s t-test (*** p < 0.001). Fold changes versus control, untreated (UT). Data are presented as mean ± SD for triplicate wells from three independent experiments.
Figure 7.
Schematic of the role of iPolyP derived from platelets and microbiota on macrophages and CRC cancer cells. iPolyP-TRPM8 axis stimulates colorectal cancer expansion by enhancing the level of ccnb1 gene, which coordinates the M phase of the cell cycle, alongside the expression of two bona fide proliferative markers, PCNA and Ki67.
Table 1.
Patients index with age at the time of the surgery, sex, stage Tumor, Node, Metastasis (TNM) and grading.
Table 1.
Patients index with age at the time of the surgery, sex, stage Tumor, Node, Metastasis (TNM) and grading.
| Patient |
Age |
Sex |
Diagnosis |
TNM |
Grading |
| 1 |
58 |
f |
CRC |
T1N0MX |
G3 |
| 2 |
58 |
m |
CRC |
T1N0MX |
G2 |
| 3 |
58 |
f |
CRC |
T1N0MX |
G2 |
| 4 |
81 |
f |
CRC |
T2N0MX |
G3 |
| 5 |
72 |
m |
CRC |
T2N0MX |
G2 |
| 6 |
78 |
f |
CRC |
T2N0MX |
G3 |
| 7 |
76 |
m |
CRC |
T2N0MX |
G3 |
| 8 |
82 |
m |
CRC |
T2N0MX |
G2 |
| 9 |
85 |
m |
CRC |
T2N0MX |
G2 |
| 10 |
73 |
f |
CRC |
T2N0MX |
G3 |
| 11 |
82 |
f |
CRC |
T2N0MX |
G2 |
| 12 |
81 |
m |
CRC |
T2N1aMX |
G2 |
| 13 |
70 |
m |
CRC |
T2N1aMX |
G3 |
| 14 |
60 |
f |
CRC |
T2N1aM1 |
G3 |
| 15 |
71 |
m |
CRC |
T3N0MX |
G2 |
| 16 |
75 |
m |
CRC |
T3N0MX |
G2 |
| 17 |
59 |
f |
CRC |
T3N0MX |
G3 |
| 18 |
69 |
m |
CRC |
T3N0MX |
G3 |
| 19 |
89 |
m |
CRC |
T3N0MX |
G3 |
| 20 |
72 |
f |
CRC |
T3N0MX |
G3 |
| 21 |
59 |
f |
CRC |
T3N0MX |
G3 |
| 22 |
77 |
f |
CRC |
T3N0MX |
G3 |
| 23 |
70 |
m |
CRC |
T3N0MX |
G2 |
| 24 |
65 |
m |
CRC |
T3N0MX |
G3 |
| 25 |
43 |
f |
CRC |
T3N0MX |
G2 |
| 26 |
76 |
m |
CRC |
T3N0MX |
G2 |
|
| 27 |
65 |
f |
CRC |
T3N0MX |
G2 |
|
| 28 |
74 |
m |
CRC |
T3N0MX |
G2 |
|
| 29 |
69 |
f |
CRC |
T3N0MX |
G3 |
|
| 30 |
71 |
f |
CRC |
T3N0MX |
G2 |
|
| 31 |
70 |
f |
CRC |
T3N0M1b |
G2 |
|
| 32 |
88 |
m |
CRC |
T3N1aMX |
G2 |
|
| 33 |
74 |
m |
CRC |
T3N1aMX |
G2 |
|
| 34 |
80 |
f |
CRC |
T3N1aMX |
G3 |
|
| 35 |
74 |
m |
CRC |
T3N1aMX |
G3 |
|
| 36 |
70 |
f |
CRC |
T3N1aMX |
G3 |
|
| 37 |
67 |
f |
CRC |
T3N1aMX |
G3 |
|
| 38 |
78 |
m |
CRC |
T3N1bMX |
G2/G3 |
|
| 39 |
79 |
m |
CRC |
T3N1bMX |
G3 |
|
| 40 |
77 |
m |
CRC |
T3N1bMX |
G3 |
|
| 41 |
83 |
m |
CRC |
T3N2aMX |
G3 |
|
| 42 |
76 |
m |
CRC |
T4aN0MX |
G3 |
|
| 43 |
56 |
m |
CRC |
T4aN1MX |
G3 |
|
| 44 |
35 |
m |
CRC |
T4aN1bMX |
G3 |
|
| 45 |
86 |
m |
CRC |
T4aN2bMX |
G2 |
|
| 46 |
93 |
f |
CRC |
T4aN2bM1c |
G3 |
|
| 47 |
81 |
f |
CRC |
T4bN0MX |
G2 |
|
| 48 |
71 |
f |
CRC |
T4bN0MX |
G2 |
|
| 49 |
53 |
f |
CRC |
T4bN0MX |
G2 |
|
| 50 |
74 |
f |
CRC |
T4bN0MX |
G2 |
|
