1. Introduction
At present, high-subsonic civil aircraft technology has reached a high level in terms of safety, economy, comfort, and environment. However, with the continuous development of the world economy and the continuous improvement of people's living standards, the limitations of the slow flight speed of traditional subsonic civil aircraft have become increasingly prominent, especially in long-distance transoceanic and transcontinental flights, where the flight time is too long, which seriously affects the travel efficiency and comfort of flight passengers. In contrast, supersonic civil aircraft can achieve supersonic cruise, and the flight speed can reach more than twice that of traditional high-subsonic civil aircraft, which can greatly shorten the flight time in the air. Therefore, supersonic civil aircraft has become one of the main directions for the development of the next generation of civil aircraft.
Historically, there were only two types of supersonic civil aircraft in operation, namely Concorde and Tu-144. However, due to problems of economy, comfort, and safety, their social acceptance was relatively limited, which led to their eventual retirement [
1]. Therefore, it is very important to establish a method for evaluating the competitiveness of supersonic civil aircraft, which will help design supersonic civil aircraft with higher social acceptance and higher competitiveness. A series of competitiveness evaluation methods for civil aircraft have been proposed. Existing studies start from different perspectives and use comprehensive evaluation models with large differences.
After decades of development, subsonic civil aircraft have formed a mature market, and the corresponding evaluation methods for subsonic passenger aircraft are relatively complete. Han [
2] assessed the competitiveness of civil aircraft based on economics, incorporating route transportation cost and revenue models, as well as life cycle (including revenue, cost, and profit analysis) into the assessment model. Ren et al. [
3] analyzed the economic adaptability and competitiveness of different seat classes of an aircraft from an economic point of view based on operating costs and market demand. Based on the gray hierarchical analysis method, Yan et al. [
4] systematically analyzed factors such as route adaptability, airport adaptability, direct operation cost, indirect operation cost, etc., and established a set of quantitative comprehensive assessment models of aircraft type. By analyzing the routes and aircraft types of Pudong Airport, it is argued that the model they established is feasible and practical. Wei et al. [
5] conducted a refinement study on the performance indicators of civil aircraft, established 20 secondary indicators from four dimensions, namely airport adaptability, route adaptability, economy, and engine matching, and proposed the size ranking of indicator weights based on the Analytic Hierarchy Process. From the perspective of alternative aircraft types, Xu [
6] proposed four major analysis elements for aircraft selection and conducted a detailed decomposition study based on the actual operation situation, which is a strong practical guidance for airlines to carry out a refined analysis of the return on investment of aircraft types.
Sun et al. [
7] concluded that fuel accounts for the largest proportion of the many factors affecting aircraft competitiveness. Ozdemir et al. [
8] used the Analytic Network Process (ANP) to provide a set of evaluation methods for aircraft selection for Turkish Airlines by taking into account safety, aircraft's service life, purchase price, operating cost, maintenance cost, service quality, and delivery time. Gomes et al. [
9] included aircraft range, flexibility, cruise speed, replacement parts versatility, and takeoff and landing distances in the consideration of aircraft leasing operations in the Brazilian region. Economic factors and comfort aspects were also included in the evaluation to determine the final solution using uncertainty assessment and decision-making methods. Bruno et al. [
10] established a system of evaluation indicators containing criteria such as aircraft speed, the degree of aircraft automation, the price of the aircraft, the operating cost of the aircraft, the number of seats, cabin baggage capacity, and noise pollution.
Due to its uniqueness and rarity, supersonic civil aircraft still lacks a set of corresponding evaluation methods. Considering the potential of the passenger market of supersonic civil aircraft, this paper selects the key indicator elements and constructs the technical indicator system of supersonic civil aircraft. Based on the Analytic Hierarchy Process, the competitiveness evaluation model of supersonic civil aircraft is formed from the four aspects of economy comfort, adaptability, and environment. Finally, the expected future supersonic civil aircraft was proposed and compared with typical subsonic civil aircrafts to verify the competitiveness superiority of supersonic civil aircraft based on the evaluation method proposed.
2. Supersonic Civil Aircraft Indicator System
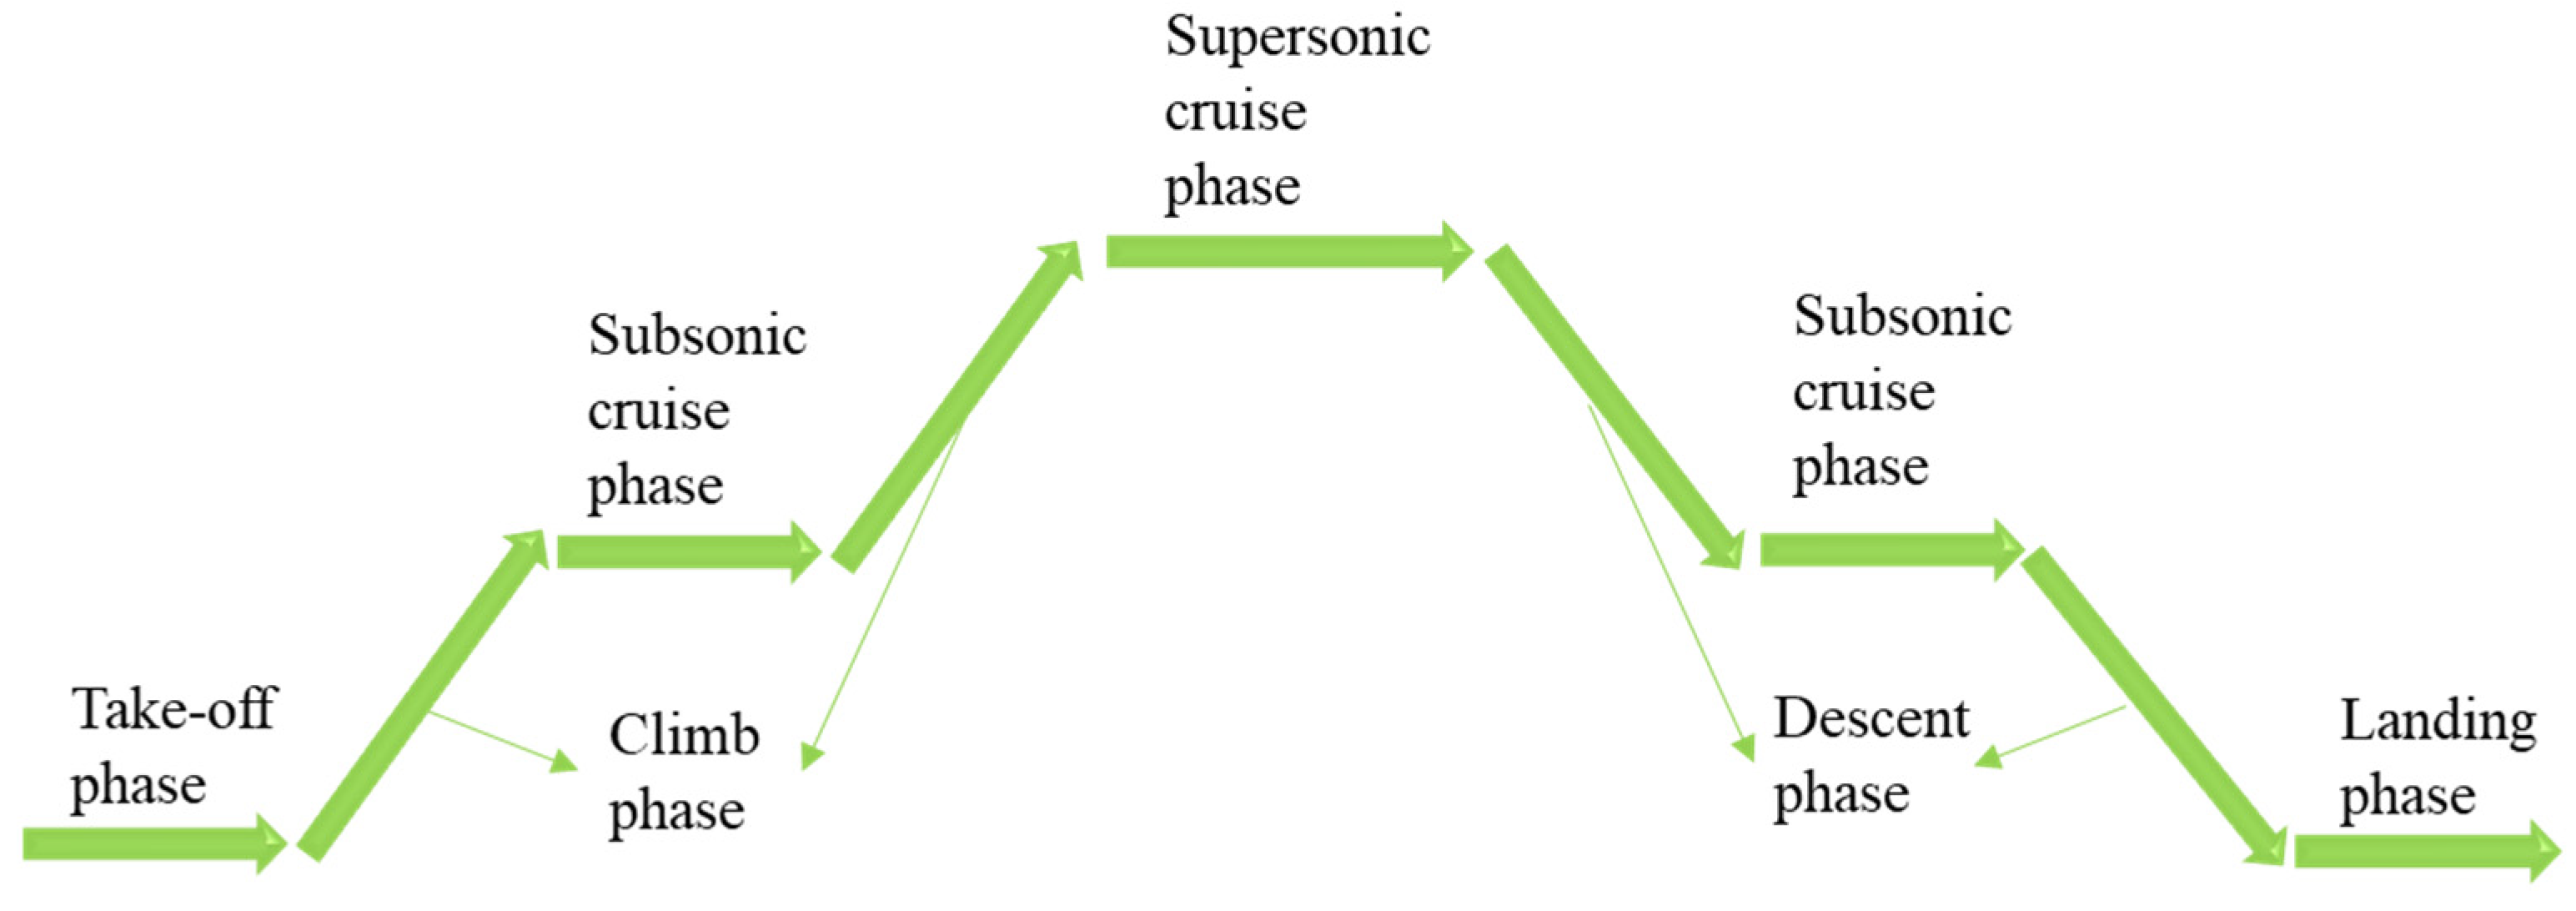
The potential market for supersonic civil aircraft is mainly focused on high-class passengers on long-distance flights, who might be willing to spend more money to save travel time. These customers have high demands for flight time, comfort, and convenience. As shown in
Figure 1, the flight profile of supersonic civil aircraft is different from that of subsonic civil aircraft. It will have different climb phase, a high flight speed and high fuel consumption. So, it is necessary to construct a new indicator system and evaluation method.
Considering the technical requirements of supersonic civil aircraft, all indicators of supersonic flight has been summarized into two categories, restrictive indicators and competitive indicators.
Restrictive indicators are those that are limited by conditions, design requirements, regulations, etc. They include technical standards and regulatory requirements that need to be met during the design, manufacture, and operation process to ensure its safety and reliability, such as wingspan, climb rate, emissions, and maintainability. Only aircraft that meet the requirements of the restrictive indicators can be authorized and put into operation to ensure the safety of passengers and crew. Therefore, when discussing competitiveness, these restrictive indicators could be considered as the basic conditions that have been achieved, which do not need to be compared.
While, competitive indicators can reflect the priority of target passengers and target airlines in choosing this civil aircraft and assess the performance of civil aircraft. We analyze competitive indicators from four aspects: economy, comfort, adaptability and environment.
2.1. Economy Indicator
The economy of civil aircraft relates to the operating costs, fuel efficiency, and maintenance costs of the aircraft. The three main indicators considered for economy are DOC, passenger capacity, and procurement costs.
The total operation cost of an aircraft can be divided into direct operation cost and indirect operation cost [
11], where the indirect operation cost depends on the airline's level of operation, therefore the direct operation cost is mainly considered. Subsonic, business, and supersonic aircraft cater to different user groups, and their seat numbers and classes vary accordingly. Therefore, the DOC of using only a certain type of aircraft cannot fully measure the competitiveness of supersonic civil aircraft. In the future, supersonic civil aircraft will mainly compete for the market with business jets and the business class market of conventional civil aircraft, and the DOC for conventional civil aircraft are corrected to take into account the business class fare factor for each model. The DOC correction process is as follows:
where
is the number of seats in business class,
is the number of seats in other classes,
is the direct operation cost of business class and
is the direct operation cost of other classes. The ratio of
to
is determined by the ratio of the average business class fare
to the average other class fare
.
Based on equations (1) and (2), the corrected
expression for business class can be derived as:
Substituting the data for business class and other classes for each typical model, the corrected
was calculated and summarized as shown in
Table 1.
The economy of supersonic civil aircraft cannot compete with conventional subsonic civil aircraft in the short term, so it was estimated conservatively on the economy indicator of supersonic civil aircraft. The corrected of civil aircraft was estimated to range from 0.5 to 2.8 CNY/km/seat.
Historically, supersonic civil aircraft that have been put into service were generally designed to be large airliners with a basic passenger capacity of around 100. Most of the current supersonic civil aircraft concepts are focused on business travel, and therefore carry fewer passengers, and are small business jets with dozens of seats. The price per seat of a business jet is roughly RMB 15 million, and if it is assumed that the procurement cost of a supersonic civil aircraft is expected to be close to the cost per seat of a business jet, the procurement cost of the next-generation supersonic civil aircraft can be roughly extrapolated accordingly.
2.2. Comfort Indicator
The comfort indicator of civil aircraft focused on comfort and experience of passengers during the flight, which includes aspects such as seat comfort, noise level, cabin pressure, and travel time, and etc. Appropriate seating arrangement can not only provide as many seats as possible in the cabin, but also provide enough leg space, which is very useful for improving passenger comfort. Currently, the vast majority of airlines have seat width between 400mm and 550mm and seat pitch between 750mm and 1100mm.Cabin altitude affects passenger comfort to some extent, with lower cabin altitude corresponding to pressures in the cabin closer to sea level, let passengers receive enough oxygen and feel comfortable during the flight. Civil aircraft cabin altitude is typically between 1100m and 3500m.The cabin noise environment is one of the main factors determining the comfort of an aircraft cabin, and sound quality is an important feature of the acoustic environment [
12] ,so modern civil aircraft cabin design usually focuses on reducing the impact of noise on passengers. One of the biggest challenges facing the development of supersonic aircraft remains reducing the noise generated by shock waves (also known as sonic booms) around the aircraft [
13]. Subsonic civil aircraft cabin noise levels are usually between 70dB and 85dB, while the Concorde cabin noise is as high as 95dB [
14], seriously affecting the comfort indicator. With the advancement of technology, the new generation of supersonic civil aircraft would make significant improvements in cabin noise with more advanced materials and soundproofing technologies.
In addition to the above three factors, travel time is the most critical factor affecting passenger comfort. For long-distance flights such as intercontinental flights, current subsonic aircraft generally take several hours or even a dozen hours. The long flight time will cause serious fatigue of passengers physiologically and psychologically [
15]. The gear time
was used to measure flight time [
16], and
is defined as
where
is the range and
is the cruise speed.
Existing survey results show that the fatigue of continuous riding of transportation begins to gradually strengthen after about 3 h of riding [
17]. In this paper, a dimensionless fatigue indicator
is introduced to assess the relationship between passengers' travel fatigue and travelling time, defined as
where
is the fatigue correction coefficient, taken as
.
is a dimensionless initial fatigue indicator, the value of which is affected by the cabin comfort experience of each model. Considering the effect of cabin noise on the cabin experience,
is defined as:
where
and
are the average noise values of the model and the average noise value of the model with the highest cabin noise among the comparison models, respectively.
Supersonic civil aircraft offer a notable advantage over conventional civil aircrafts in terms of passenger fatigue reduction, primarily due to their elevated cruise Mach numbers. This benefit is anticipated to increase as advancements in cabin comfort are integrated into future supersonic aircraft designs. To quantitatively assess and compare the fatigue indicators across various aircraft types, the Beijing-London route has been selected for analysis, with a range of 8160km. Combined with the cabin noise expectation value
is taken as 75dB, the fatigue indicator
is calculated as 1.054. The results of fatigue indicator calculation for different models are shown in
Table 2.
2.3. Adaptability Indicator
The adaptability of civil aircraft refers to its ability to adapt to different operating environments and market demands, including both route adaptability and airport adaptability. Adaptability requires that the aircraft meet the needs of the market and the customer while taking into account the current state of the art and cost constraints, as well as complying with the relevant. Route adaptability refers to the ability of an aircraft to operate on a specific route, which determines its applicability and operational efficiency on the route, including flight performance indicators such as range and practical ceiling.
For civil aircraft, longer range aircraft can provide more direct flight options, reducing the need for passengers to make intermediate transfers. Most civil aircraft designs require a range of around 6000km to 15000km. The practical ceiling is the altitude at which an aircraft climbs at equal speed in the vertical plane for a given weight and engine operating condition, with a maximum rate of climb of 0.5 m/s for subsonic flights and 5 m/s for supersonic flights [
18]. Conventional civil aircrafts have a practical ceiling of between 10,000m and 15,000m.
Airport adaptability refers to the adaptability of an aircraft to an airport runway, including indicators such as take-off and landing distance. At present, the take-off distance of most subsonic civil aircraft ranges from 2,500m to 3,500m, and the landing distance ranges from 1,500m to 2,000m. While focusing on supersonic performance, supersonic airliners should also focus on low-speed performance, using advanced aerodynamic designs to reduce the take-off and landing distance.
2.4. Environment Indicator
The environmental friendliness of civil aircraft is the extent of their impact on the environment, including emission reduction and noise pollution reduction. With the development of the air transportation industry, more and more attention is being paid to the impact of the aviation industry on the environment, mainly in terms of noise. Noise is subject to the airworthiness requirements of each country and region, mainly considering the two indicators of take-off and landing noise and transit noise indicators. At present, most civil aircraft take-off and landing noise and transit noise are between 80dB and 90dB.
2.5. Summary of the Indicator System
In response to the research question on the competitiveness of civil aircraft, representative Competitive indicators that are easy to compare quantitatively are selected and analyzed to derive their approximate ranges and reference expectations. The categories of indicators, their approximate ranges, and their expected values in the established system of Competitive indicators for competitiveness evaluation are summarized as shown in
Table 3.
3. Competitiveness Evaluation Method for Supersonic Civil Aircraft
Analytic Hierarchy Process (AHP) is a widely used multi-objective decision-making method based on hierarchical modeling [
19]. The method decomposes the relevant elements of the decision-making problem into a hierarchy of objective, criteria, and indicators, based on which quantitative and qualitative analyses can be performed. The basic steps of the AHP are as follows:
The application of the AHP method needs to clarify the objective of decision-making. Evaluation criteria are established according to the characteristics of the objective, and then decomposed into each indicator factor. The relationships and hierarchies between the factors aggregate to form a multi- layer hierarchy.
- 2.
Construction of judgment matrices
After forming the hierarchy, it is necessary to calculate the weights of the factors at each layer. By constructing a judgment matrix, the weights of the indicators in this layer can be obtained, while avoiding the difficulty of comparing various factors.
- 3.
Hierarchical single sorting and consistency test
Ideally, the judgement matrix should be a consistency matrix. When the matrix is large, the consistency of the indicators needs to be tested. After obtaining a judgement matrix that meets the consistency requirements, the factor weights for each layer can be derived.
- 4.
Hierarchical total sorting
Hierarchical total sorting refers to the calculation of the relative importance weights of each factor in each layer for the indicators in the uppermost layer, based on the results of hierarchical single sorting.
3.1. Hierarchy of the Indicator System
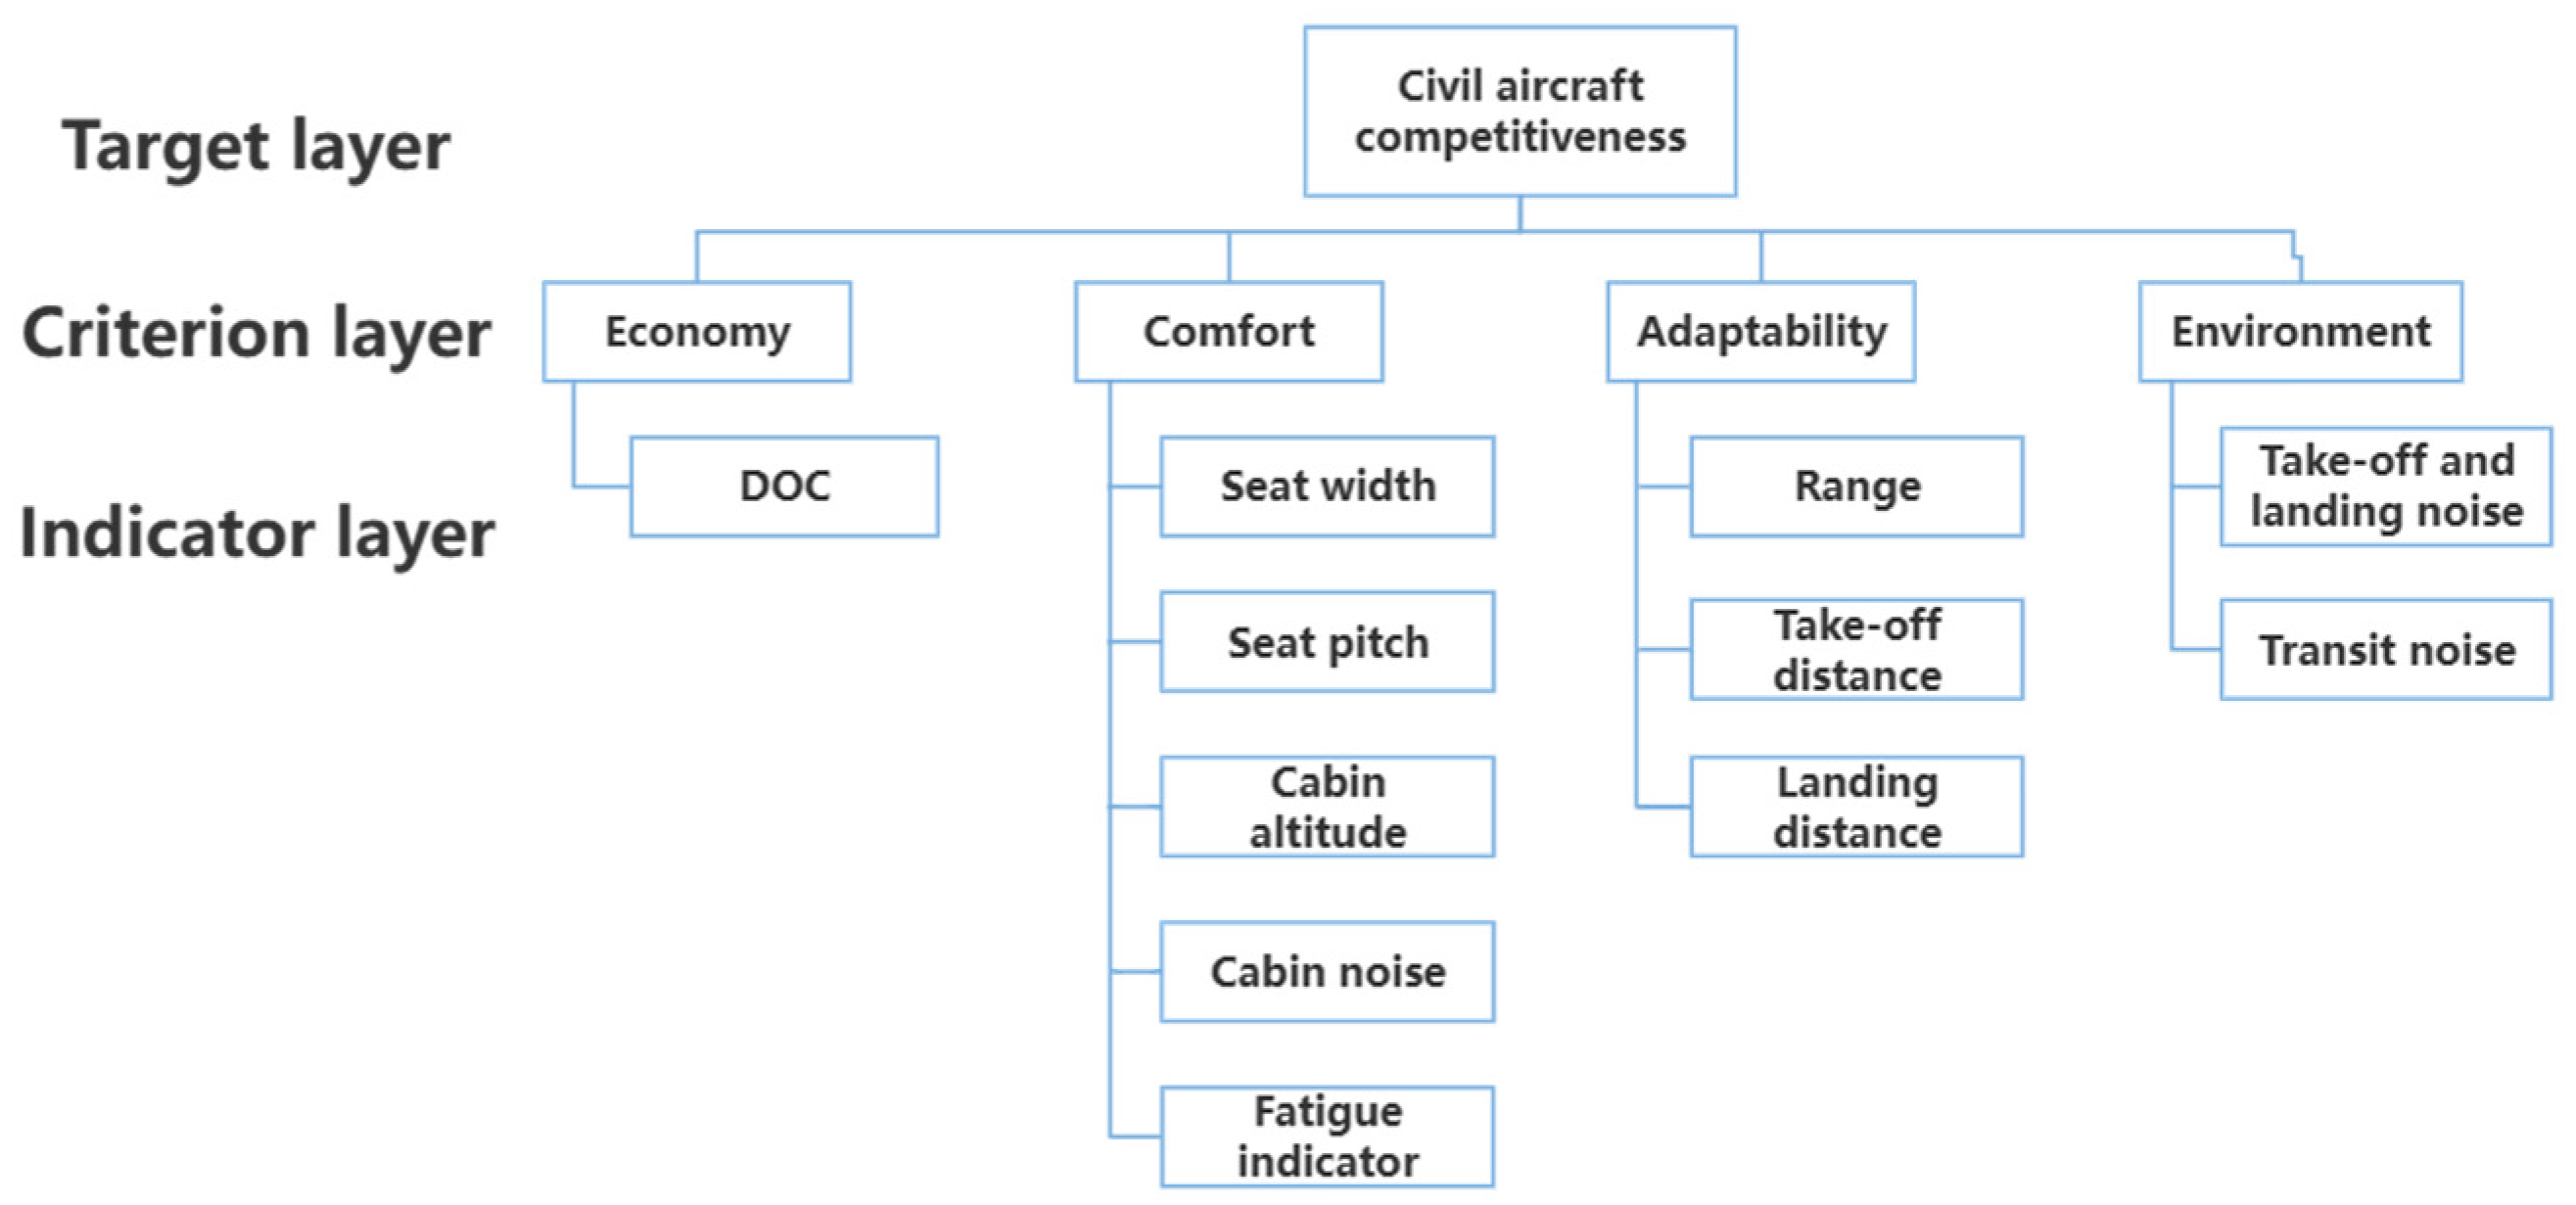
With the competitiveness of civil aircraft as the general evaluation objective, economy, comfort, adaptability, and environment form the criterion layer. Each criterion contains several specific evaluation indicators, which form the indicator layer. A hierarchy of "objective layer/ criterion layer/indicator layer" is formed. The hierarchy of the comprehensive evaluation indicator system for supersonic civil aircraft is shown in
Figure 2.
3.2. Hierarchy Weight Calculation and Sorting
The experts constructed judgment matrices based on the degree of importance among the factors in each layer. After the consistency test to ensure the consistency of the judgment matrix, the weights of the criterion layer on the objective layer and the indicator layer on the criterion layer are determined.
The calculation of the structural weights of the civil aircraft competitiveness criterion layer on the objective layer is taken as an example. The judgment matrix of civil aircraft competitiveness proposed by experts is shown in
Table 4.
is the importance of the ith indicator relative to the jth indicator in this judgment matrix, as an integer from 1-5 or a value taken from a fraction of 1/5-1. The judgment matrix is a positive inverse matrix:
The scaling method for
in the judgment matrix is shown in
Table 5.
The civil aircraft competitiveness judgment matrix is a consistency matrix that satisfies the following judgement conditions:
The maximum eigenvalue of the judgment matrix
is
and the corresponding weight vector is
Its consistency test indicator is:
When
tends to 0, the judgment matrix can be considered to have satisfactory consistency. However, as the matrix order n gets larger, the
actually increases, so the correction factor
is introduced [
19], and the value of
is shown in
Table 6.
The weights and rankings of the indicator system obtained by applying the above method are shown in
Table 7. The sum of the weights of the criterion layer relative to the objective layer is 1, and the sum of the weights of the indicators under the criterion layer is also 1. In the evaluation criterion layer, adaptability has the highest weight, comfort has the second highest weight, and economy has the third highest weight. In the evaluation indicator layer, DOC and range have a greater impact on competitiveness, and seat width, seat pitch, and cabin altitude have a lesser impact.
3.3. Normalization of Parameters at the Indicator Layer
As the indicator layer in the hierarchy contains a variety of indicators with different scales, the values of the indicators need to be normalized before the comprehensive evaluation of competitiveness is carried out. Converting indicators with different scopes and units to a uniform scale eliminates the differences in scale between indicators and prevents certain indicators from having too much influence on the model.
As shown in
Table 8, the indicator types were first categorized into very large indicators and Minimizing indicators. Separately, these indicators were pre-processed with data and then normalized.
Maximizing indicator is a type of indicator where the larger the parameter value, the better. Its positive transformation formula is:
Minimizing indicator is a type of indicator where the smaller the parameter value, the better. Its positive transformation formula is:
where
is the parameter value before transformation;
and
are the maximum and minimum values of the parameter, respectively; and
is the parameter value after the positive transformation.
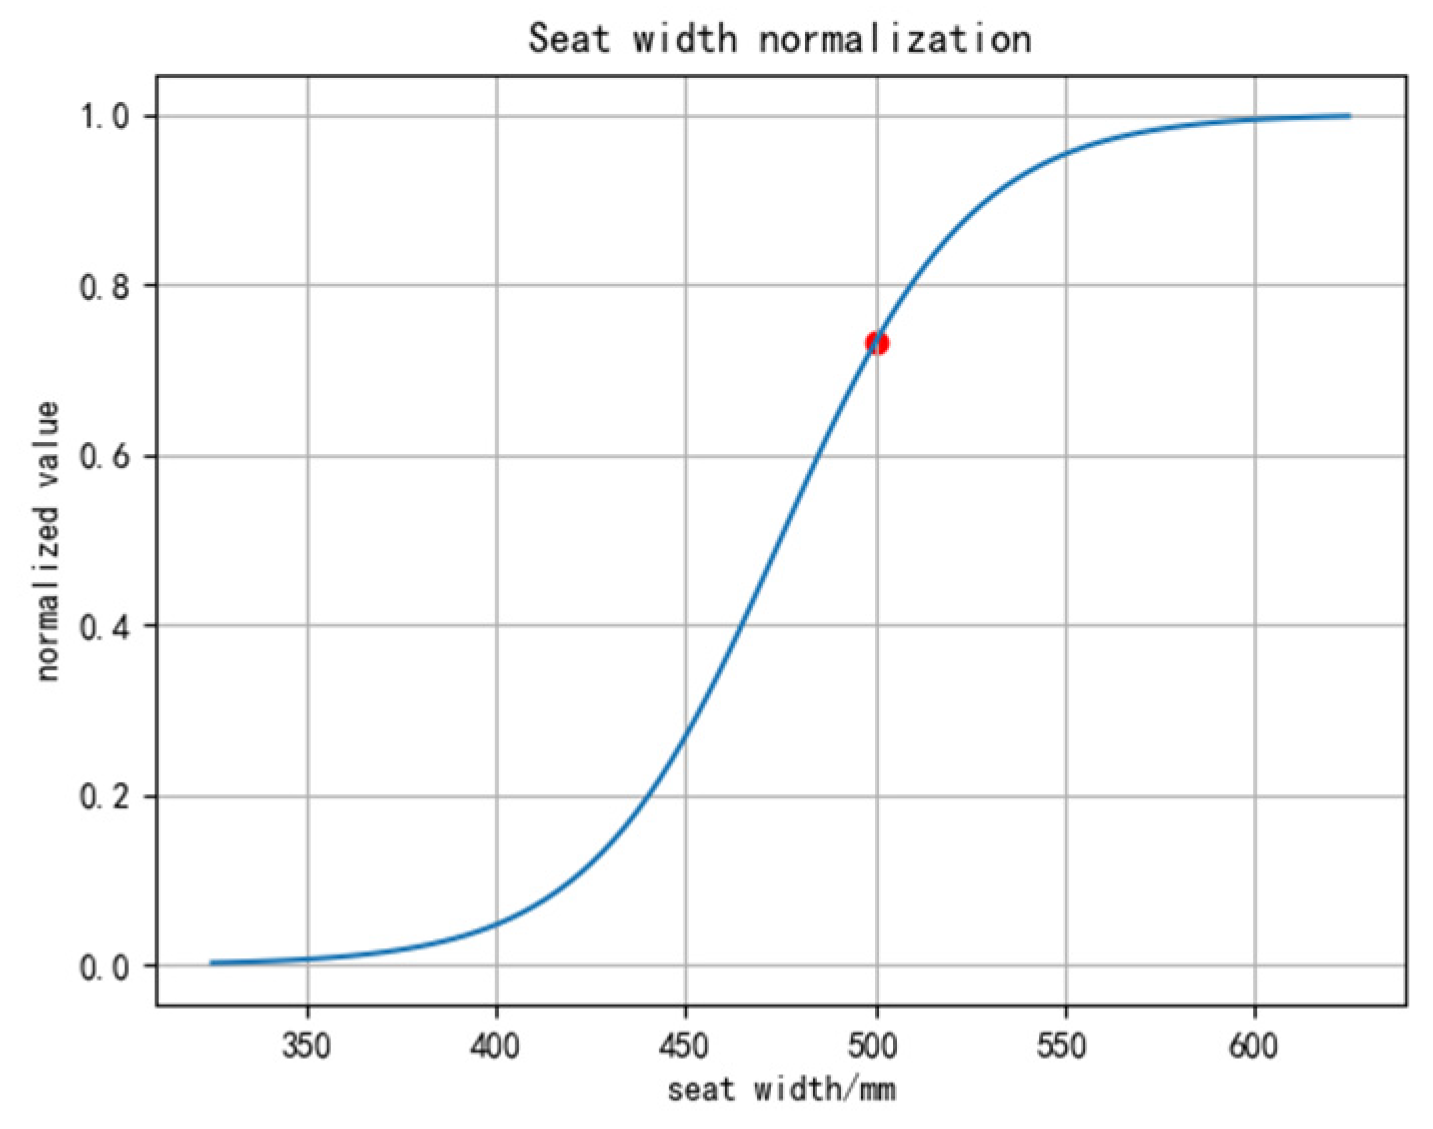
The normalization method of a non-linear S-shaped differentiable function is used to quantify the parameters of the positive transformation indicators, which can map the input values to a finite range while maintaining the smoothness and differentiability of the function [
20]. The normalization formula is:
where
is the normalized value;
and
are curve adjustment parameters.
Take the indicator "seat width" for example, the width of a seat in a civil aircraft is generally between 400mm and 550mm. Within this range, the comfort of passengers increases with the increase of width, and its sensitivity decreases when it exceeds this range. After normalizing the S-shaped function for this indicator, the parameter values are shown in
Figure 3.
3.4. Competitiveness Calculation for Civil Aircraft
To calculate the competitiveness of the civil aircraft, the normalized values of the indicator parameters of the civil aircraft program are first determined, and then accumulated step by step from the indicator layer to the objective layer using weighted summation. The values of the criterion layer are
where
is the normalized value of the
indicator under the
criterion and
is its weight.
The ultimate civil aircraft competitiveness is:
where
is the weight of the criterion layer for the objective layer.
4. Analysis of the Results of the Evaluation of the Competitiveness of Civil Aircraft
The proposed civil aircraft competitiveness evaluation method based on AHP is utilized to calculate the evaluation results of competitiveness, economy, comfort, adaptability, and environment. Based on the evaluation results, the competitiveness of existing models can be analyzed and the key to the future development of supersonic civil aircraft is summarized.
4.1. Competitive Analysis of Expected Program
Table 9 lists the expected and normalized standard values for each of its competitive indicators. Except for DOC, the standard values of the other competitive indicators of the desired program have higher values, indicating that the expected program is more feasible.
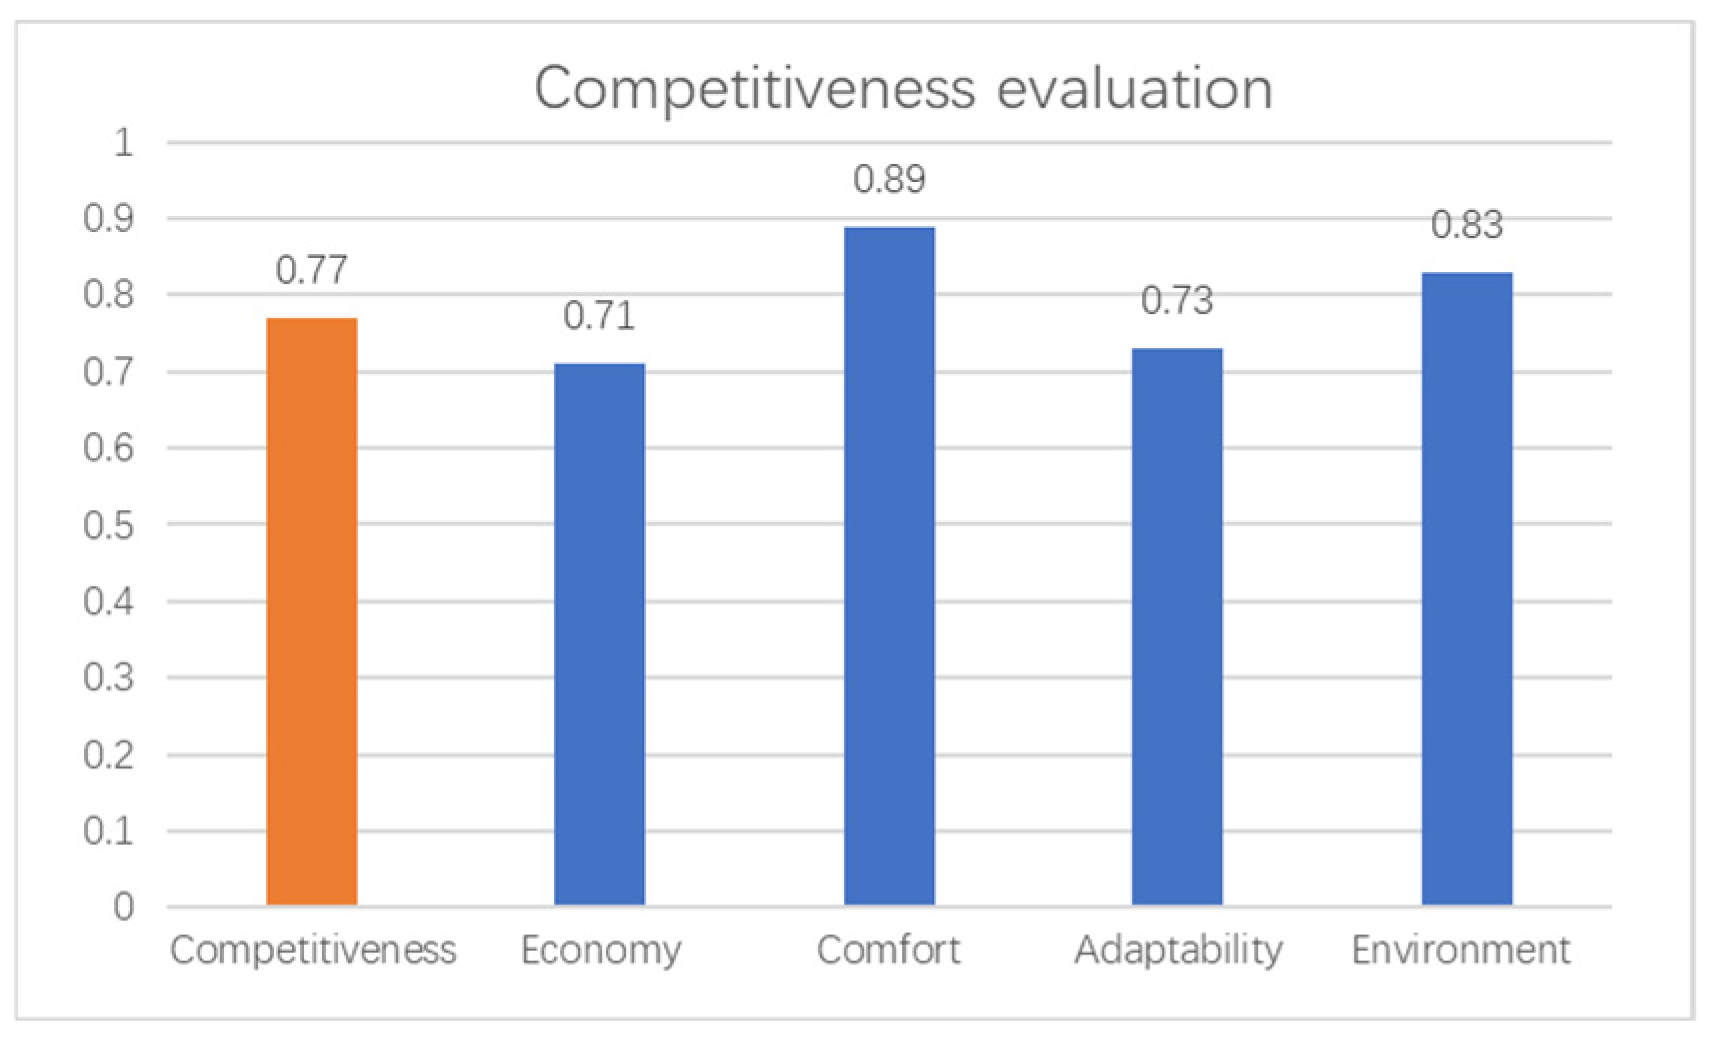
The evaluation results of the expected program are shown in
Figure 4. The expected program scores high on comfort, adaptability, and environment and low on economy, with good results in the overall competitiveness assessment. The evaluation results show that supersonic civil aircraft have significant advantages, especially in long-distance and long-endurance routes. However, supersonic flights also face some challenges, and in the short term, supersonic civil aircraft have high operating costs and negative impacts on the environment. However, with the continuous development and improvement of technology, supersonic civil aircraft will become an important transportation tool in the future.
4.2. Competitive Analysis of Typical Civil Aircraft
4.2.1. Concorde
Concorde first flew in 1969 and entered service in 1976. It takes only about 3 hours and 20 minutes to fly from Paris to New York, which is more than half of the time of a conventional civil aircraft, making it a popular choice for business travelers despite its high fares. As one of the few supersonic civil aircraft that have been put into commercial operation, the parameters of Concorde are important references for the development of future supersonic airliners, and its competitive indicators and standard values are shown in
Table 10.
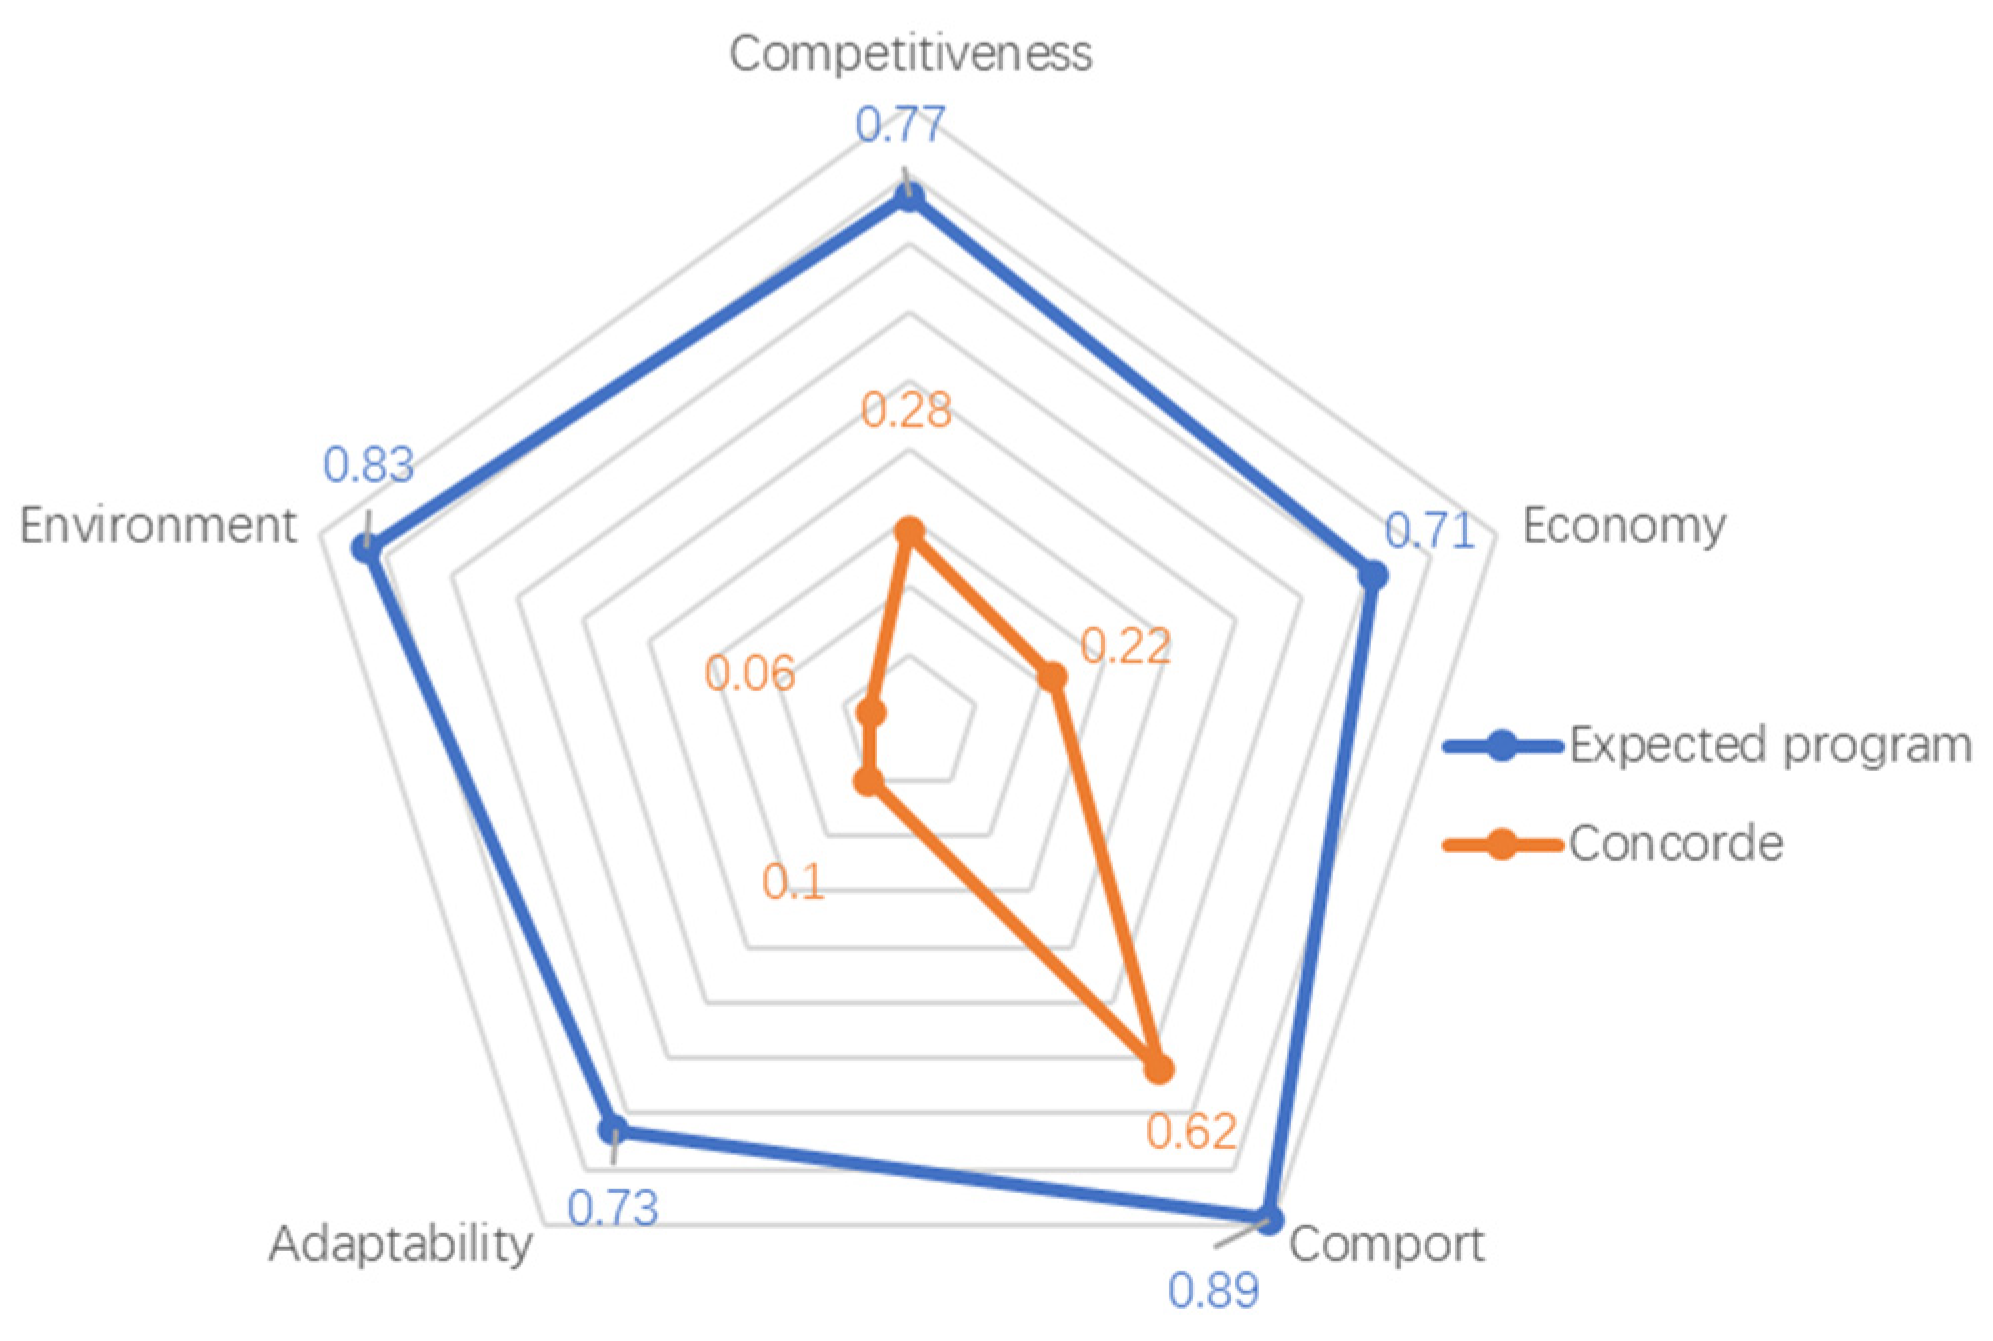
Concorde was extremely costly to use directly, with high cabin noise, take-off and landing noise, and transit noise. These shortcomings restricted Concorde to flights over the continent, and it ultimately did not remain on the historical stage.
Figure 5 compares the competitiveness of the Concorde with the expected program and the evaluation results of each criterion layer, and the expected program has a considerable improvement in all aspects. With the substantial improvement in economy, environment, and adaptability, the expected program has higher competitiveness compared with the Concorde and can perform better than the former Concorde in future market competition.
4.2.2. Airbus A350-900
Airbus A350-900 is a new generation of medium and large medium to ultra-long-haul wide-body airliners from Airbus Europe. the Airbus A350-900 competitive indicators and standard values are shown in
Table 11.
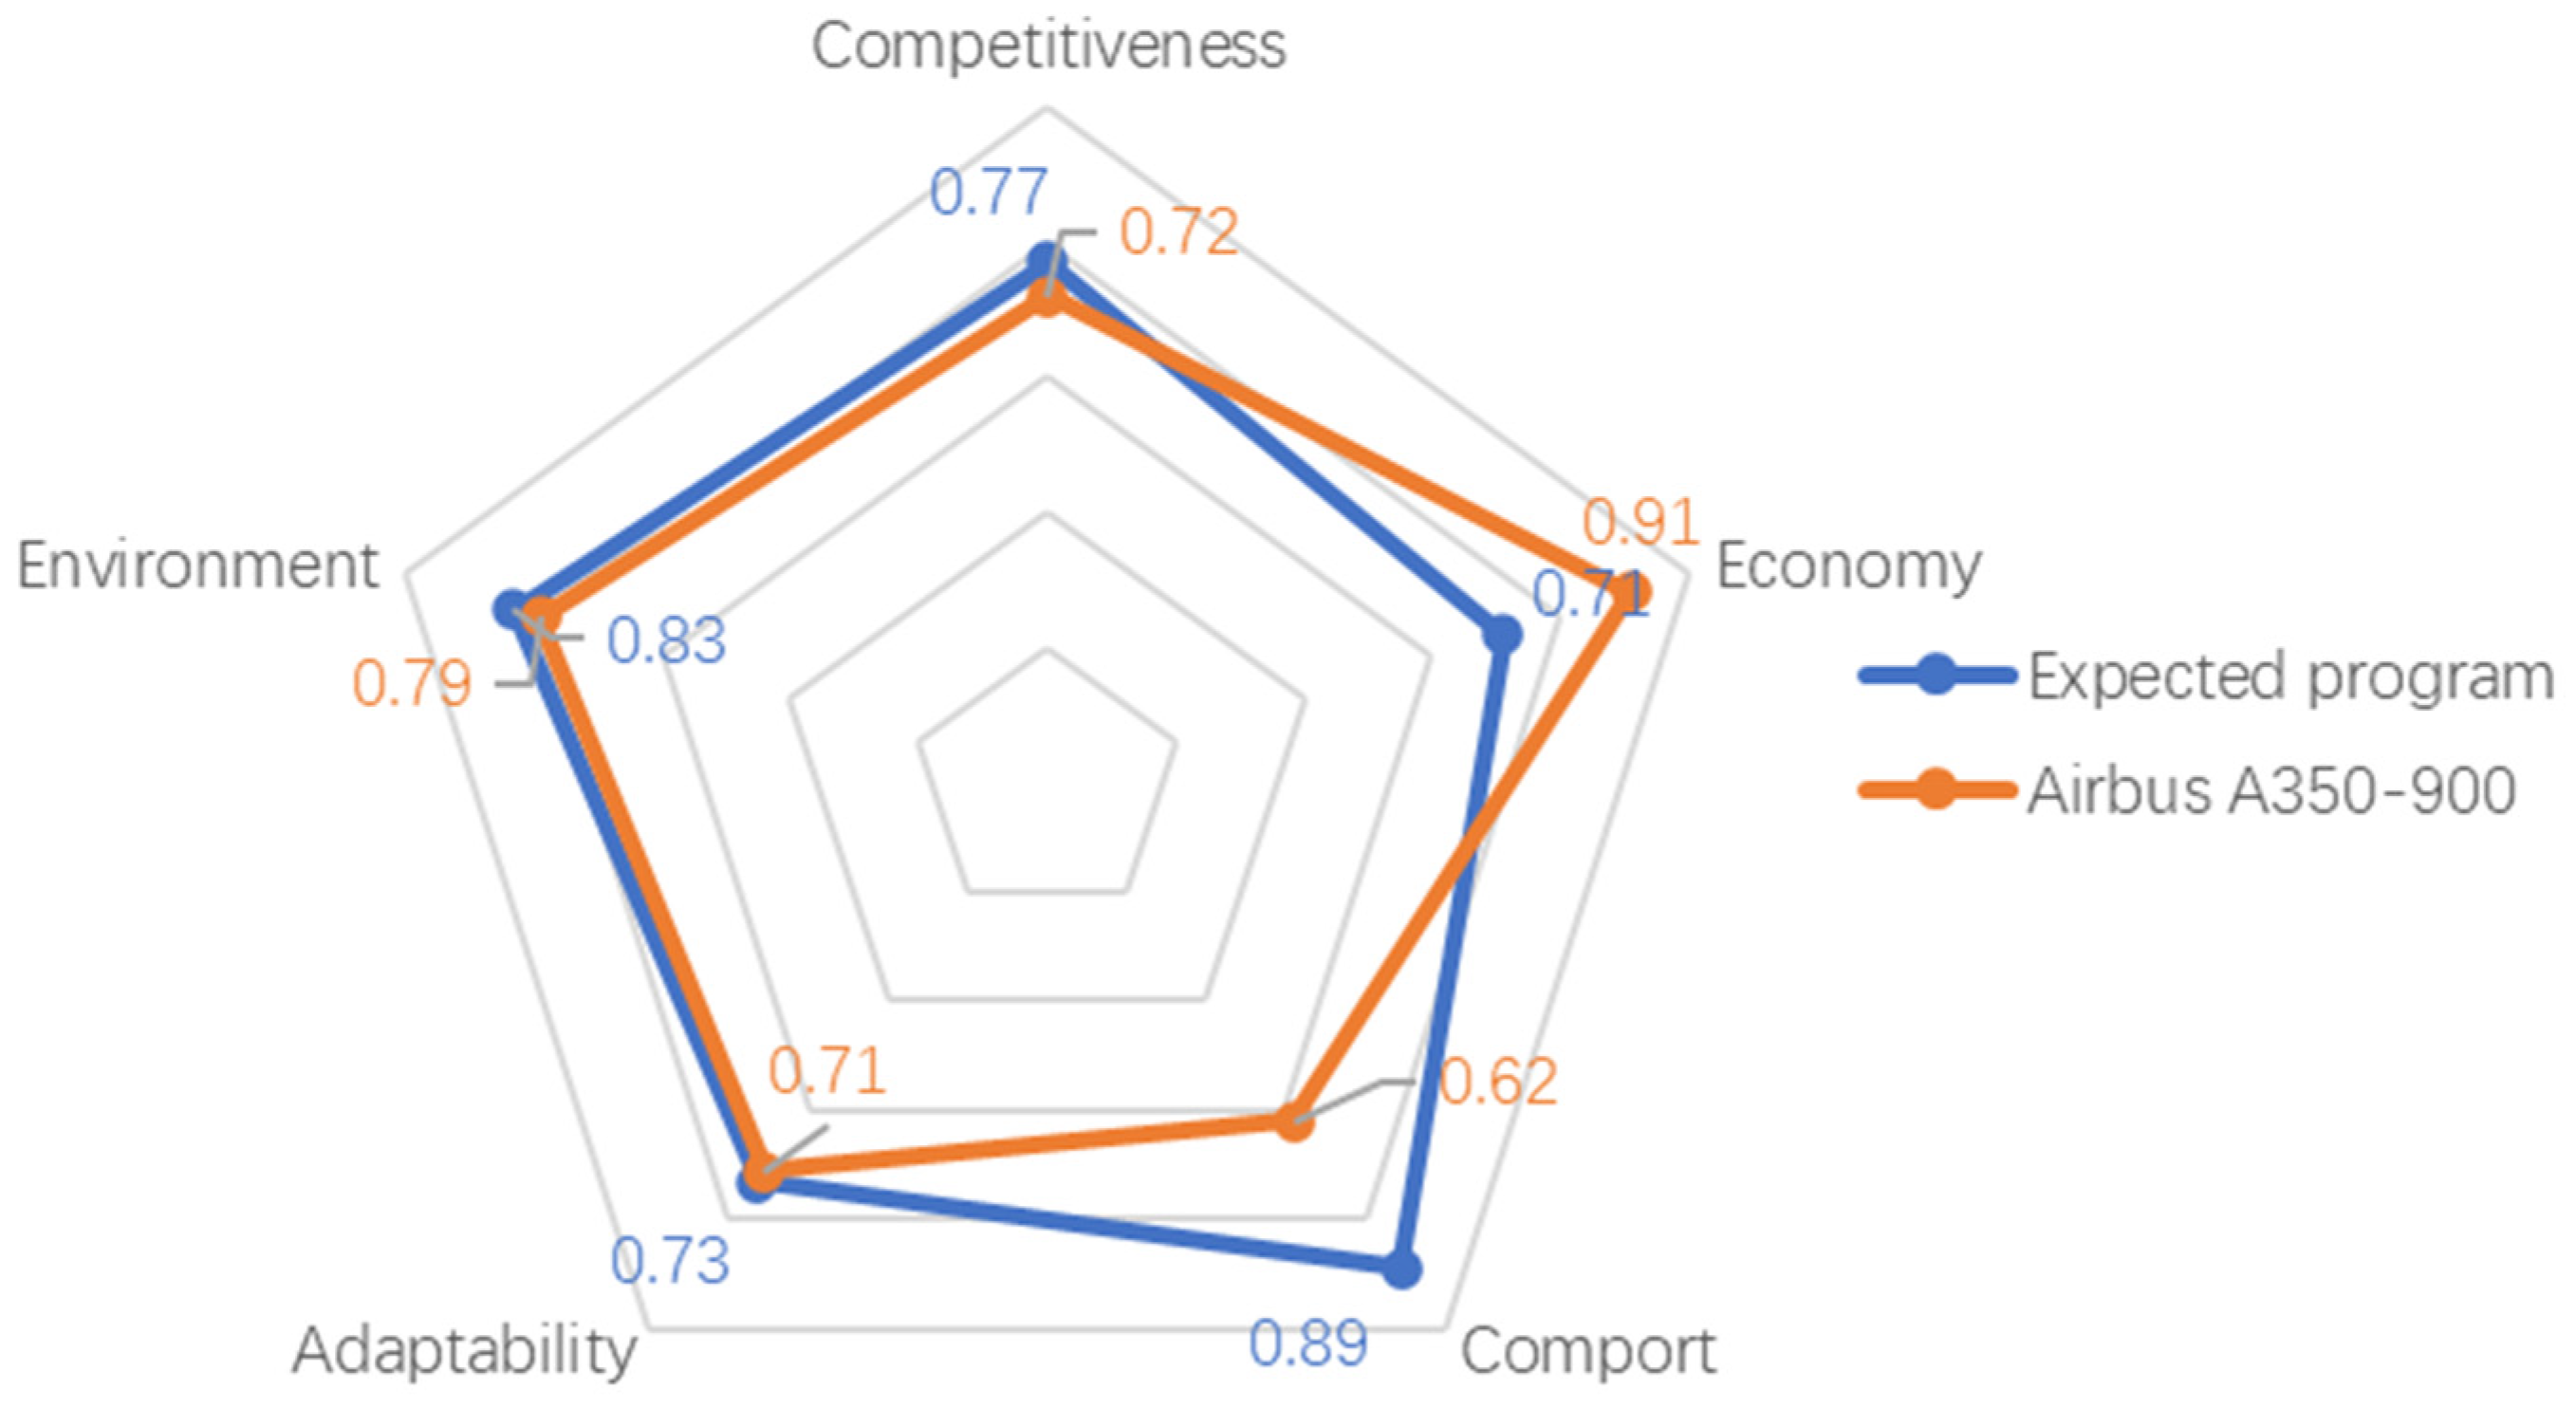
The Airbus A350-900 offers lower DOC, lower cabin noise, and greater range, but its higher travel fatigue indicator and longer take-off and landing distance are not advantageous in the future aviation market, which seeks to reach destinations quickly.
Figure 6 compares the evaluation results of the expected program and the Airbus A350. The expected program is superior in comfort, the Airbus A350 is superior in economy, and environmental protection and adaptability are basically equal. The higher evaluation result of the competitiveness of the expected program indicates that although in the short term, the economy of supersonic civil aircraft cannot compete with conventional subsonic civil aircraft. However, for business travelers or customers who need to travel urgently, its comfort advantage makes the expected program more competitive than the existing civil aircraft.
4.2.3. Gulfstream G650 Business Jet
The Gulfstream G650, a product of Gulfstream Aerospace, was launched in May 2014 and received Federal Aviation Administration (FAA) certification in October. it is the luxury business jet with the longest range, best performance, most spacious cabin, and best comfort. It is the fastest civil aircraft after Concorde, with speeds approaching the speed of sound. The Gulfstream G650 competitive indicators and standard values are shown in
Table 12.
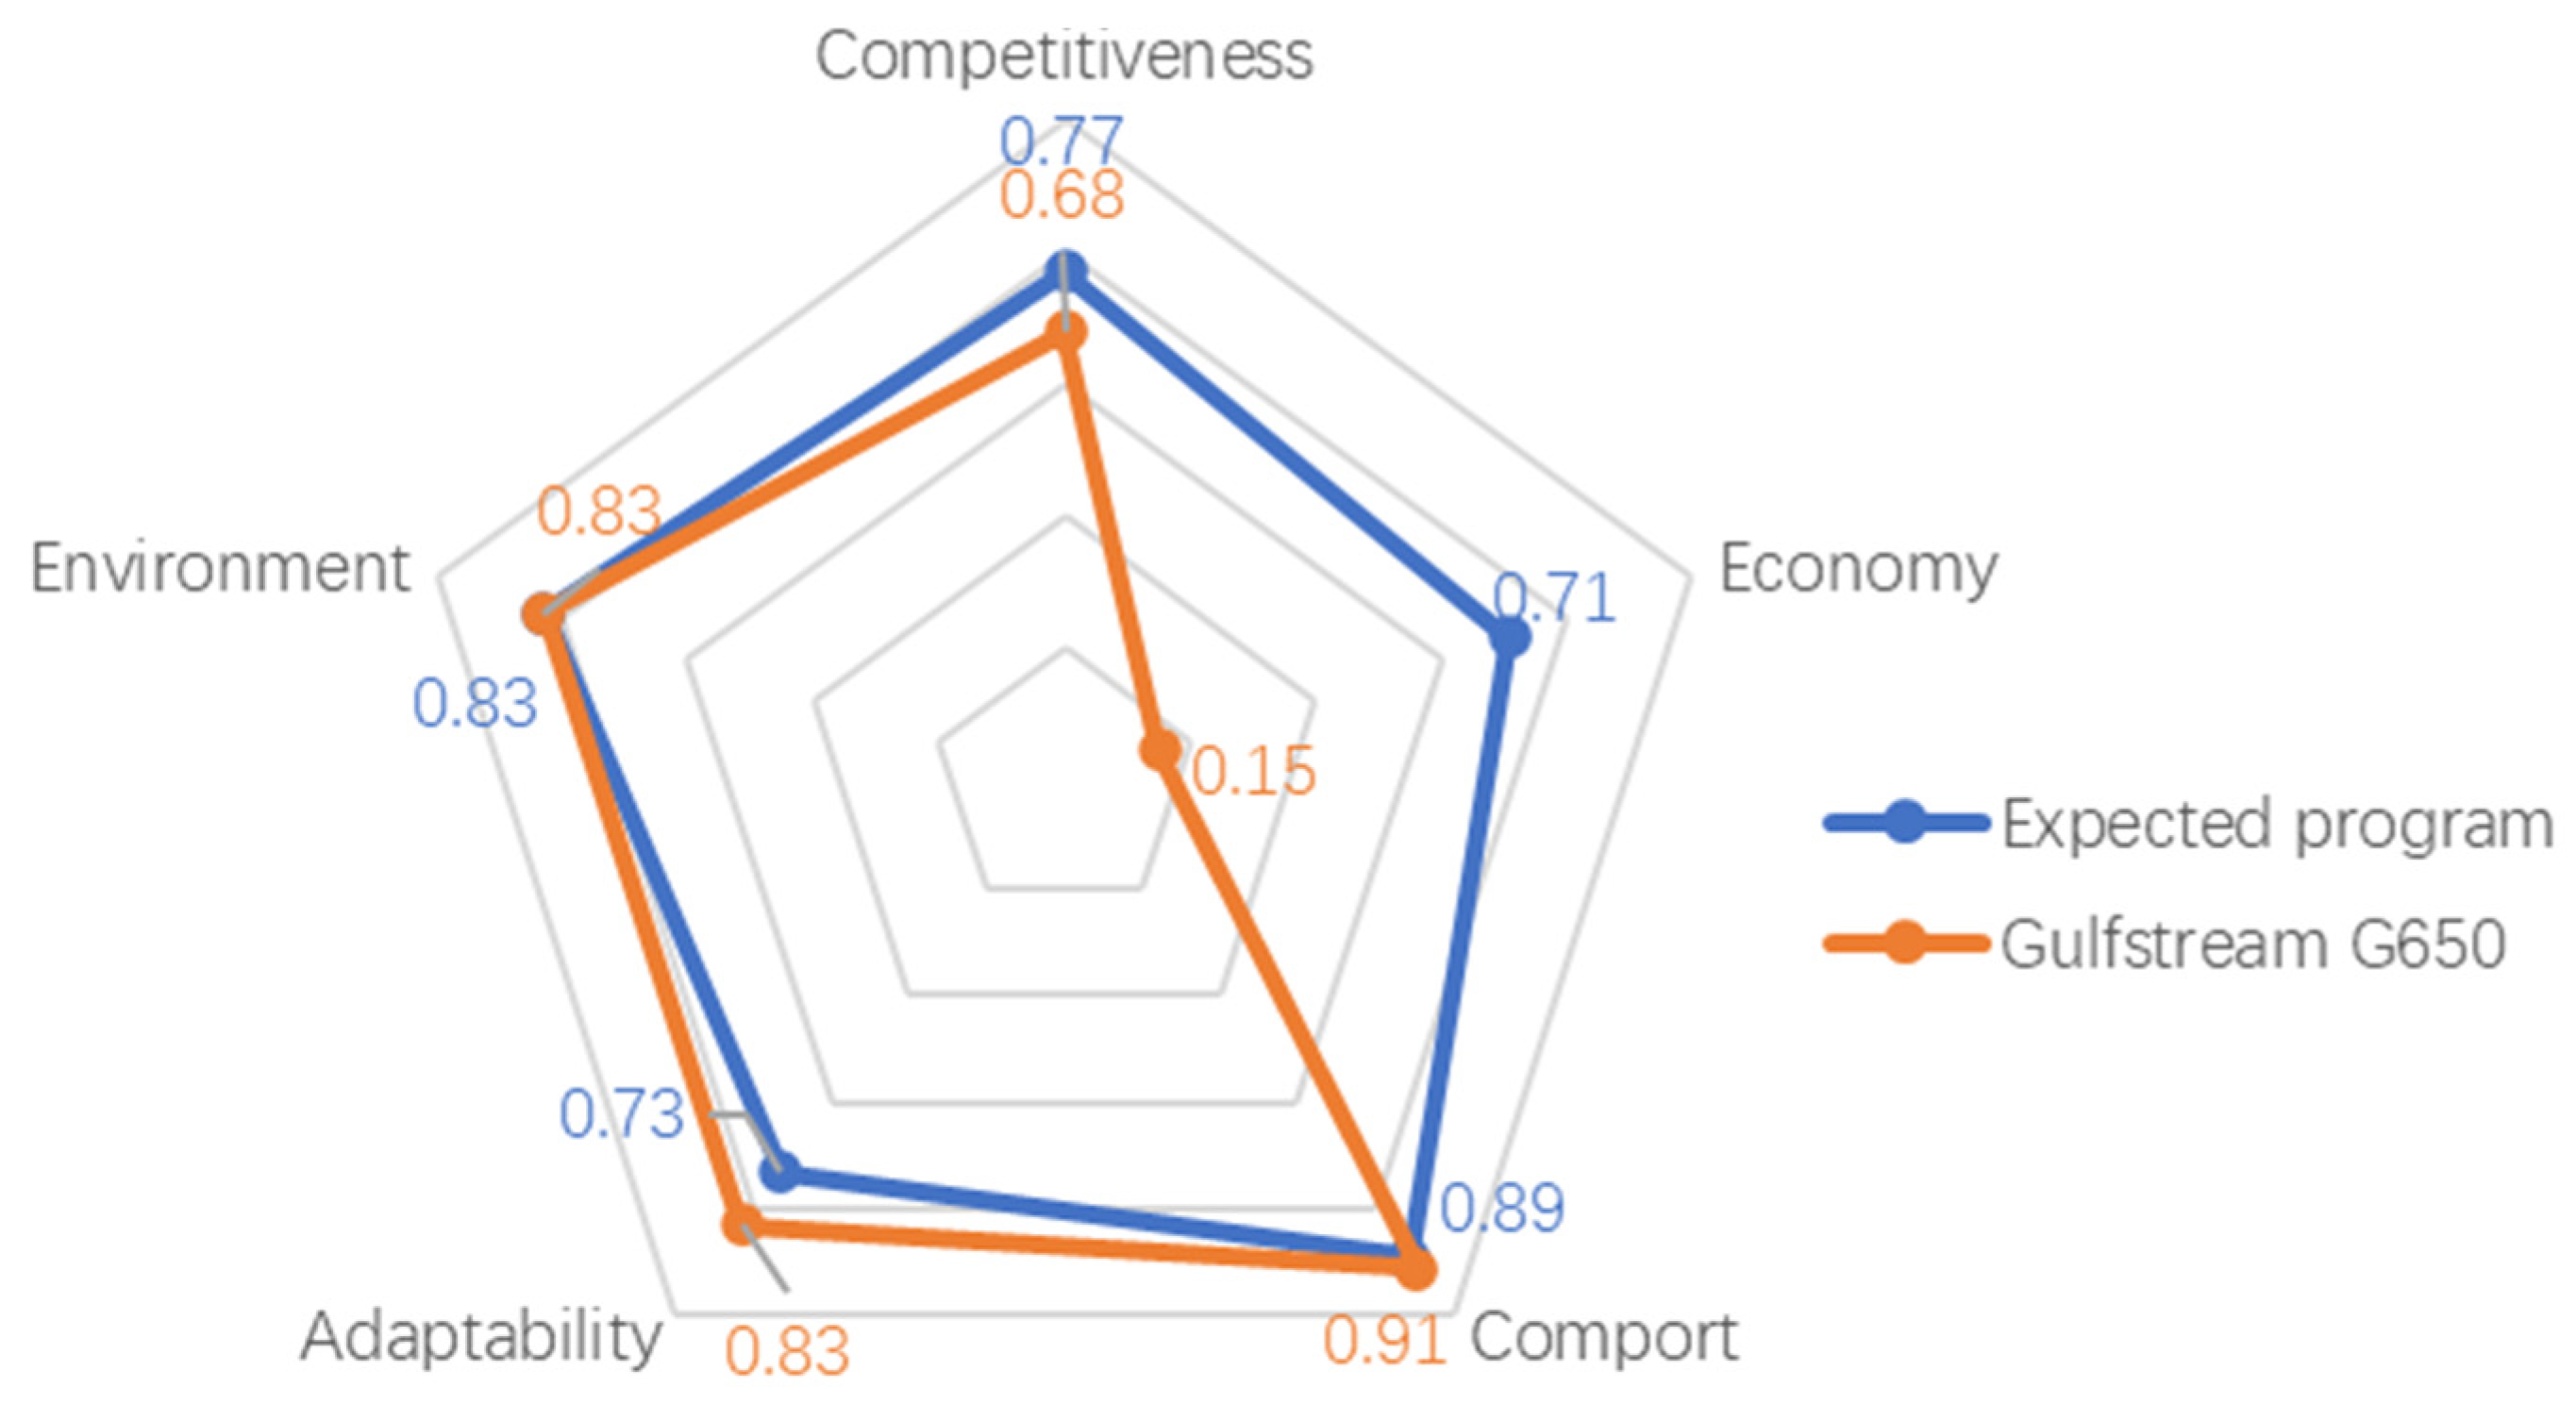
Figure 7 compares the evaluation results of the expected program with the Gulfstream G650. There is little difference between the two in terms of adaptability and environment, and the Gulfstream G650 is more adaptable, but the expected program has high economic evaluation results and final competitive evaluation results. This shows that the expected program supersonic airliner reduces the DOC based on similar adaptability and environment with the existing business aircraft, and the expected program has certain advantages and feasibility.
4. Conclusion
The development of supersonic civil aircraft has been dormant for many years, and with the breakthrough and development of related bottleneck technologies, it is particularly critical to carry out performance selection work at present. This paper studies the indicator system and competitiveness evaluation method of supersonic civil aircraft and achieves the following results:
Starting from the application scenario of supersonic civil airplanes, corresponding competitive indicators are designed and selected from four aspects: economy, comfort, adaptability and environment. This paper introduces a fatigue indicator for assessing passenger comfort experience during the journey, which contributes to the design and operation of supersonic civil aircraft. On this basis, the expected program of future supersonic civil aircraft is proposed, and a scientific and reliable indicator system is established.
Based on the research on the indicator system of supersonic civil aircraft, this paper constructs the competitiveness evaluation method of supersonic civil aircraft based on the Analytic Hierarchy Process, which contains four criterion factors of economy, comfort, adaptability, and environment, and several second-layer indicators. The application of the AHP not only helps to clarify the interrelationships among the factors of supersonic civil aircraft, but also enables the problem of competitiveness analysis to be transformed into the determination of the weights of the basic indicators and the calculation of the values of the relevant parameters. This method makes the analysis process and results more intuitive and easier to understand.
The competitiveness evaluation method proposed in this paper is applicable to both supersonic and subsonic aircraft, providing a unified reference framework for the design and evaluation of civil aircraft. By comparing with other models, it is easy to see that the expected program is reasonable and feasible. At the same time, the proposed evaluation method can well reflect the characteristics of different models and identify the models with higher competitiveness and each criterion layer, providing a reliable decision-making support model for airlines' selection work.
Author Contributions
Conceptualization, R.P., W.C. and Z.M.; methodology, J.H. and R.P.; validation, C.G.; formal analysis, J.H.; investigation, C.G.; resources, R.P.; data curation, X.X.; writing—original draft preparation, J.H.; writing—review and editing, J.H. and R.P.; visualization, J.H.; All authors have read and agreed to the published version of the manuscript.
Funding
This research received no external funding.
Data Availability Statement
Data are contained within the article.
Conflicts of Interest
The authors declare no conflicts of interest.
References
- Rötger, T.; Eyers, C.; Fusaro, R. A Review of the Current Regulatory Framework for Supersonic Civil Aircraft: Noise and Emissions Regulations. Aerospace 2023, 11, 19. [CrossRef]
- Han, X.L. Economic assessment mathematical model for civil aircraft selection. Journal of Civil Aviation University of China 1994, 12, 10-19.
- Ren, Q.H.; Wang, R.H. Market-Demand-Based Economic Analysis Method for Commercial Aircraft. Civil Aircraft Design & Research 2015, 3, 87.
- Yan, K.W.; Zhu, J.F.; Liu, F. Airline Aircraft Type Adaptability Comprehensive Evaluation Based on Grey Hierarchical Analysis Method. Mathematics in Practice and Theory 2009, 14, 19-24.
- Wei, Y.S.; Chu, S.L.; Zhang, T.C.; Jiang, Y.Z.; Zhu, H.L.; Tong, X. Research on Civil Aircraft Performance Selection indicator System. Journal of Changsha Aeronautical Vocational & Technical College 2019, 19, 38-42.
- Xu S.L. An evaluation method of aircraft selection for airlines. Journal of Nanjing University of Aeronautics & Astronautics 2020, 52,650⁃658.
- Sun, X.; Gollnick, V.; Stumpf, E. Robustness Consideration in Multi-Criteria Decision Making to an Aircraft Selection Problem. Journal of Multi-Criteria Decision Analysis 2011, 18, 55-64. [CrossRef]
- Ozdemir, Y.; Basligil, H.; Karaca, M. Aircraft Selection Using Analytic Network Process: A Case for Turkish Airlines. In Proceedings of the World Congress on Engineering 2011, 7, 6-8.
- Gomes, L.; Mattos, J.E.; Soares, J. A Fuzzy Stochastic Approach to the Multicriteria Selection of an Aircraft for Regional Chartering. Advancement Transportation 2012, 48, 223-237.
- Bruno, G.; Esposito, E.; Genovese, A. A Model for Aircraft Evaluation to Support Strategic Decisions. Expert System Application 2015, 4, 5580-5590. [CrossRef]
- Mo, Q.H. Economic Analysis Methods and Software Systems for the Use of Civil Aircraft. Master's thesis, Shanghai Jiao Tong University, Shanghai, 2011.
- Cui, X.K.; Fan, Y.Y.; Zhang, X.H. Analysis of Cabin Sound Quality Performance for Mainstream Domestic Aircraft Models. Civil Aircraft Design and Research 2021, 4, 57-62.
- Graziani, S.; Petrosino, F.; Jäschke, J.; Glorioso, A.; Fusaro, R.; Viola, N. Evaluation of Sonic Boom Shock Wave Generation with CFD Methods. Aerospace 2024, 11, 484. [CrossRef]
- Maglieri, D.J.; Bobbitt, P.J.; Plotkin, K.J.; Shepherd, K.P.; Coen, P.G.; Richwine, D.M. Sonic Boom: Six Decades of Research.
- Zhou, Y.T.; Wang, L.J. Identifying Factors of Comfort and Discomfort in Passenger Cabin. In Proceedings of the 30th Anniversary of the Establishment of Man-Machine-Environment System Engineering and the 11th Man-Machine-Environment System Engineering Conference 2011, 107-110.
- Cheng, B.S.; Li, Y.J.; Wang, Z.Y. Aircraft Design Manual, Volume 5: General Design of Civil Aircraft. 2005.
- Xu, S.G. Research on the Model Description and Application of High-Speed Railway Competitiveness. Master's thesis, Beijing Jiaotong University, Beijing, 2015.
- Xu, B.; Tan, L.X.; Yang, S.C.; Ji, F.Z. Matching Requirements of Pressurized Piston Engines for Aircraft Service Ceiling. Journal of Beijing University of Aeronautics and Astronautics 2014, 40, 1643-1647.
- Saaty, T.L. The analytic hierarchy process. McGraw Hill: New York, 1980.
- Li X; Chai X; Liu H. Conceptual design optimization of a wide-body commercial aircraft using a competitiveness model. Proceedings of the Institution of Mechanical Engineers, Part G: Journal of Aerospace Engineering, 2020, 234, 208-220. [CrossRef]
|
Disclaimer/Publisher’s Note: The statements, opinions and data contained in all publications are solely those of the individual author(s) and contributor(s) and not of MDPI and/or the editor(s). MDPI and/or the editor(s) disclaim responsibility for any injury to people or property resulting from any ideas, methods, instructions or products referred to in the content. |
© 2024 by the authors. Licensee MDPI, Basel, Switzerland. This article is an open access article distributed under the terms and conditions of the Creative Commons Attribution (CC BY) license (http://creativecommons.org/licenses/by/4.0/).
