1. Introduction
The homogeneity of matter distribution at large scales, known as the cosmological principle (CP), is a central assumption in the standard cosmological model (SCM). Rooted in a geometrical assumption outlined by Einstein in 1917, the cosmological principle posits that on a vast scale, the spatial distribution of matter is both homogeneous and isotropic [
1]. Despite the apparent lack of homogeneity and isotropy at small scales in the distributions of celestial objects, the cosmological principle implies the existence of a homogeneity scale, beyond which the distribution becomes statistically indistinguishable from a random one bringing the argument of whether or not the universe is homogeneous or fractal in nature as the scale evolves with time [
2].
In contemporary cosmological models within the framework of general relativity, the Friedmann-Lemaitre-Robertson-Walker (FLRW) metric serves as the common basis [
3]. Distinctions among these models arise not from the solutions to Einstein's equations but from the selection of the stress-energy tensor (
), specifically influencing the expansion factor, R(t), in the spatial line element [
4].
The SCM builds upon two fundamental tenets: the consideration of General Relativity as the foundational theory of gravity and the adherence to the CP, positing statistical homogeneity and isotropy at large scales [
5]. The CP, in its modern formulation, dictates that, at sufficiently large scales, the average evolution of the universe precisely adheres to the FLRW metric [
6]. While the homogeneous SCM model aligns well with observations, challenges such as the fine-tuning problems, Hubble tension, and cosmic coincidence issues suggest potential deviations from the SCM [
7,
8,
9]. Key to this discussion are the redshift-distance and light intensity-distance relations, which are fundamental tools in observational cosmology. The redshift-distance relation provides critical insights into the universe's expansion rate, serving as a direct test of cosmological models. Accurate measurements of redshift and corresponding distances allow cosmologists to map the large-scale structure of the universe, revealing patterns that either support or challenge the assumptions of homogeneity and isotropy. Similarly, the light intensity-distance relation, which describes how the observed brightness of an object diminishes with distance, is crucial for determining cosmological distances and, by extension, for understanding the universe's expansion history. Both relations are integral to testing the validity of the Friedmann model and the cosmological principle, particularly in light of the growing complexity observed in deep-space surveys.
To refine our understanding of these relations, recent studies have employed both parametric and nonparametric redshift models. Parametric models rely on predefined functional forms and assumptions about the universe’s expansion history, such as the commonly used SCM model, which assumes a specific functional form for the expansion rate and matter density[
10]. Nonparametric models, on the other hand, do not assume a particular functional form and instead use data-driven approaches to infer the redshift-distance relation directly from observations [
11]. These models offer greater flexibility and can capture deviations from the standard parametric assumptions, providing a more nuanced view of the universe's structure and evolution [
5,
12]. The integration of both parametric and nonparametric approaches allows for a more comprehensive analysis of the redshift-distance relation, potentially addressing discrepancies and refining our understanding of cosmological principle.
Compounding these theoretical challenges are the enigmatic dark matter (DM) and dark energy (DE), which together make up 95% of the universe's total mass-energy content. While DM is crucial for explaining the flat rotation curves of galaxies and the formation of large-scale structures, DE has been claimed to account for the observed acceleration in the universe's expansion—a phenomenon first detected through observations of Supernovae Type Ia [
13]. Nevertheless, the physical nature of these two phenomena remains a mystery. Einstein suggested a long-forgotten solution: gravitationally repulsive negative masses, which drive cosmic expansion and cannot coalesce into light-emitting structures [
14]. In addition, a type of cold dark matter in the universe is needed to explain the formation of the cosmic structure and galaxy dynamics. So far, it has been claimed that the cosmological constant is the best candidate to explain the so-called dark energy [
5]. These unresolved issues further complicate the cosmological models, demanding more precise observational data and innovative theoretical approaches.
The challenge of testing the cosmological principle and the SCM is further exacerbated by the limitations of current observational methods. Three-dimensional redshift surveys, despite their sophistication, often produce limited and potentially misleading data due to inherent uncertainties in cosmic distance measurements and the complexity of interpreting large-scale structures. For instance, while observational evidence generally supports isotropy on large scales—demonstrated by the Cosmic Microwave Background Radiation (CMBR), and isotropic distributions of radio sources, gamma-ray bursts, and supernovae [
15,
16] findings do not unequivocally confirm large-scale homogeneity. In particular, quasar distribution studies suggest homogeneity only beyond scales of
Mpc [
17], , highlighting the need for more rigorous testing.
In light of the unsettling discoveries detailed above, there exists a pervasive sense of uncertainty regarding the accuracy of current cosmological frameworks. To this regard, we present a model describing the universe’s dynamics, structure formation and evolution by taking into account its density and geometry. The investigation centers on three astronomical parameters: number density, light intensity, and redshift. We analyze the evolution of number density and light intensity across redshift, assessing their influence from the universe’s infancy to the present, and conduct a comparative evaluation with findings from other studies. In particular, we shall make comparisons with works of Langa et al. (2017) whose model we shall refer to as ‘approximate standard Friedmann redshift model’ and Nyagisera et al. (2024) whose model we shall refer to as ‘modified standard Friedmann redshift model’. The model developed in this paper shall be referred to as the ‘standard Friedmann redshift model’. Throughout our examination, we shall account for the influence exerted by dark matter and dark energy within these theoretical constructs. In order to validate our model, a histogram plot of observational data of galactic number count against redshift extracted from NASA/IPAC Extragalactic Database shall be performed.
The paper is structured as follows:
Section 2 introduces our model,
Section 3 and
Section 4 presents the analytical and graphical results of our study respectively, while
Section 5 is devoted to discussions of our results before culminating into conclusions in
Section 6.
2. Model Formulation
2.1. Parametric Model
The parametric model introduced by Bassett et al. [
10] in 2015 modifies the conventional redshift framework to enhance our understanding of cosmic dynamics. By introducing parameters that adjust the redshift space, this model allows for a more refined interpretation of observational data. It also tackles intricate aspects of cosmic phenomena by incorporating these specific parameters, offering a more precise and detailed representation of redshift-related observations. In this study, we shall compare our model with the parametric model
where c1 and c2 are arbitrary parameters (see details in Nyagisera et al., 2024).
2.2. Nonparametric Model
The non-parametric model developed by Wojtak and Prada [
11] in 2017 adopts a different approach by avoiding predefined parameters, offering greater flexibility in modeling cosmic phenomena. Unlike parametric models, this non-parametric model does not impose fixed parameters, allowing for a more adaptive and data-driven analysis of redshift-related phenomena. In this work, we shall compare our model with the nonparametric model
where γ(z) is a freely varying function of z (see details in Nyagisera et al., 2024).
2.3. The Einstein Field Equations Based on Friedmann Model
Consider the FLRW metric
where c is the speed of light,
, denotes the scale factor governing the time-dependent evolution of the spatial portion of the metric (specifically, the surfaces corresponding to constant time, t),
gives the geometry of the universe as open, flat, or closed respectively, and
is the rectangular coordinate representation of the three dimensional projection space.
Straightforward calculations based on equation (1) [
12,
19,
20] yield:
where
,
is the density of the observable universe and
Equations (2) and (3) are key in describing the dynamics, formation of structures and evolution of the universe. Earlier studies [
12,
20] used the Noether theorem pertinent to a matter-dominated Friedmann universe;
This theorem deduced Einstein field equations relation of the form
In contrast to these studies, this work treated the density of the universe and the cosmic scale factor as variables thus rearranged equation (2) to yield;
Equation (4) and equation (5) is the Friedmann model relation representing time taken by a light photon to travel a distance
describing the Friedmann Universe. Equation (5) brings a clearer description of the dynamics, structure formation and evolution of the universe as compared to equation (4) obtained through conservation theorem in existing works [
12,
20]. Equation (5) will be applied in deriving the light intensity-redshift and the number density-redshift relations in this work.
3. Analytical solutions
3.1. Light Intensity-Redshift Relation
Considering light emanating from an astronomical object (galaxy or a star) commencing its journey at
and progressing towards the spatial origin,
when time
. In this scenario, the FLRW metric (see Equation (1)) can be formulated to capture this dynamic spatial relationship for null geodesic as;
where
implying that
Performing integration of equation (7) over
and
and applying the reversibility of light principle while noting that
positive while
negative by our assumption,
Substituting equation (5) into equation (8) gives :
Equation (9) is more general and is suitable for describing the evolution and dynamics of the universe as it contains an extra cosmological term on its L.H.S earlier present in equation (5). Solving this equation for three different cases of
that is, for open universe
, flat universe
, and for a closed universe
it can easily be shown that:
where
The three cases in equation (10) can be generalized as
where
,
since
depends on
,
) and
is the density of the universe at observational time,
Equation (11) can be decomposed to;
where,
and
Consider an astronomical object, whether it be a luminous star or a galaxy, positioned at the origin,
, emitting light with absolute luminosity, L. Over a time, span of emission,
we contemplate the emission of light, each increment of which is encapsulated by
. Subsequently, at a distinct moment of observation,
an observer gauges the intensity of the emitted light, I, which is inevitably subject to a redshift
. The spatial coordinates of the observer are elegantly captured by Equation (11). This intricate interplay of emission, transmission, and observation culminates in Equation (13), expressed as:
where
is the surface area of the sphere of radius
at time
[
20].
Applying equation (12) in equation (13) and the fundamental theorem of integral calculus together with the relation
, we obtain:
Equation (14) unveils a profound connection between redshift z and the luminous intensity I. This equation serves as a pivotal conduit, allowing us to delve into the dynamics and evolution of the our universe.
3.2. Number Density Redshift Relation
Let us direct our focus toward celestial bodies, galaxies or supernovae for instance, which exhibit uniform distribution across the expanse of the universe within specific range of redshift. In this context, let N symbolize the number of galaxies existing per unit volume within a spatial metric denoted as
. Additionally, the volume element
encapsulates the spatial dimensions. This framework enables us to delineate the population of galaxies spanning the range from
to
, expressed as
[
19]. Subsequently, the number of galaxies between coordinate hyperspheres
and
is given by
Differentiating Equation (11) with respect to z and using equation (12) yield;
where
,
and
Substituting Equation (12) and Equation (16) into Equation (15) gives;
Equation (17) relates the evolution of the number density of astronomical objects with redshift in the Friedmann universe, which together with equation (14) constitutes the fundamental results in this paper.
4. Graphical Results
In the preceding section, we derived the interplay between galactic number density, redshift, and light intensity through analytical methods. We shall now transition to a visual exploration of our established outcomes, achieved through the development and execution of straightforward MATLAB programs. By implementing these programs, we are poised to generate graphical representations that illustrate the relationships between light intensity and redshift, as well as between number density and redshift, as dictated by equations (14) and (17) respectively. The range of redshift values employed in our MATLAB simulations spans from to , a spectrum that aligns harmoniously with existing statistical data and observations. This methodology permits us to illuminate the empirical significance of our theoretical constructs and enhance our grasp of the cosmic evolution landscape.
The program encompasses a range of universe densities, spanning from to . The velocity of light, the cosmic scale factor,, while the gravitational constant. The universe's curvature, assumes values of and and the cosmological constant. To enhance accuracy, logarithms of light intensity and number density are employed. For our exploration, we assign arbitrary values of 1 to the parameters N (number of galaxies per unit volume) and L (absolute power of a galaxy or star). This approach facilitates the determination of parameter combinations and that best align with experimental data without presuming assumptions about background geometry.
4.1. Light Intensity Redshift Relation
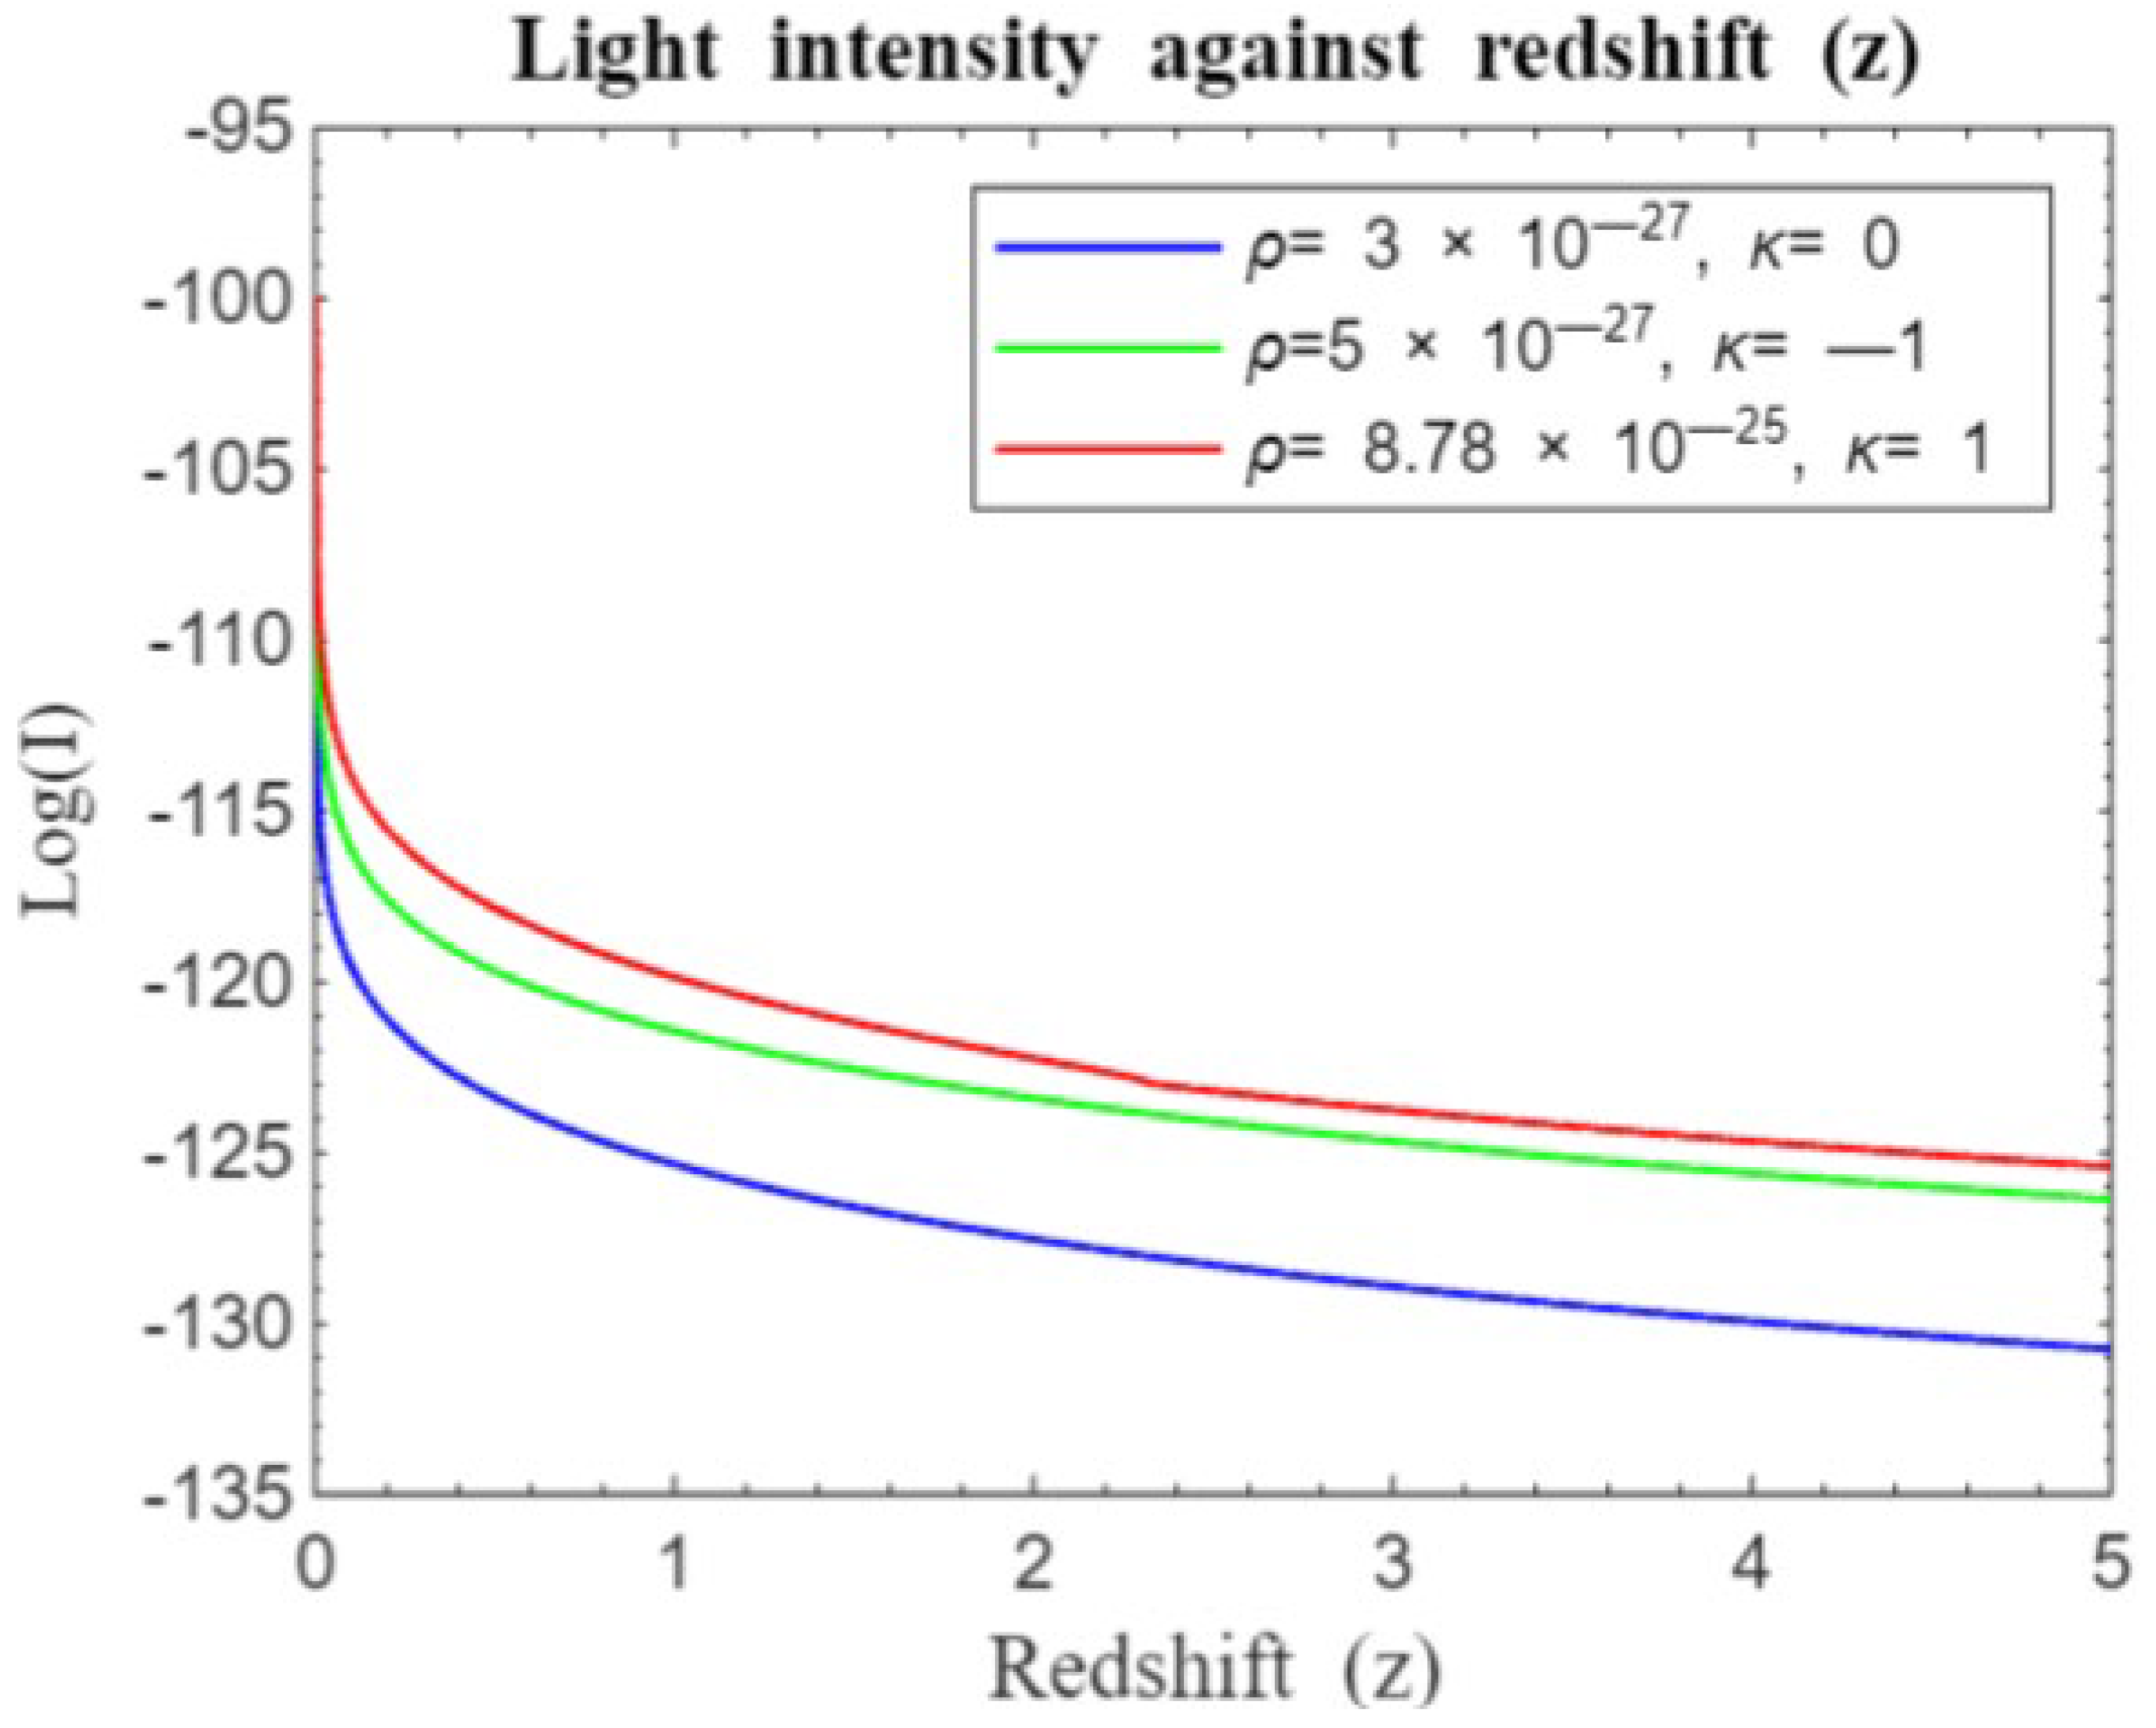
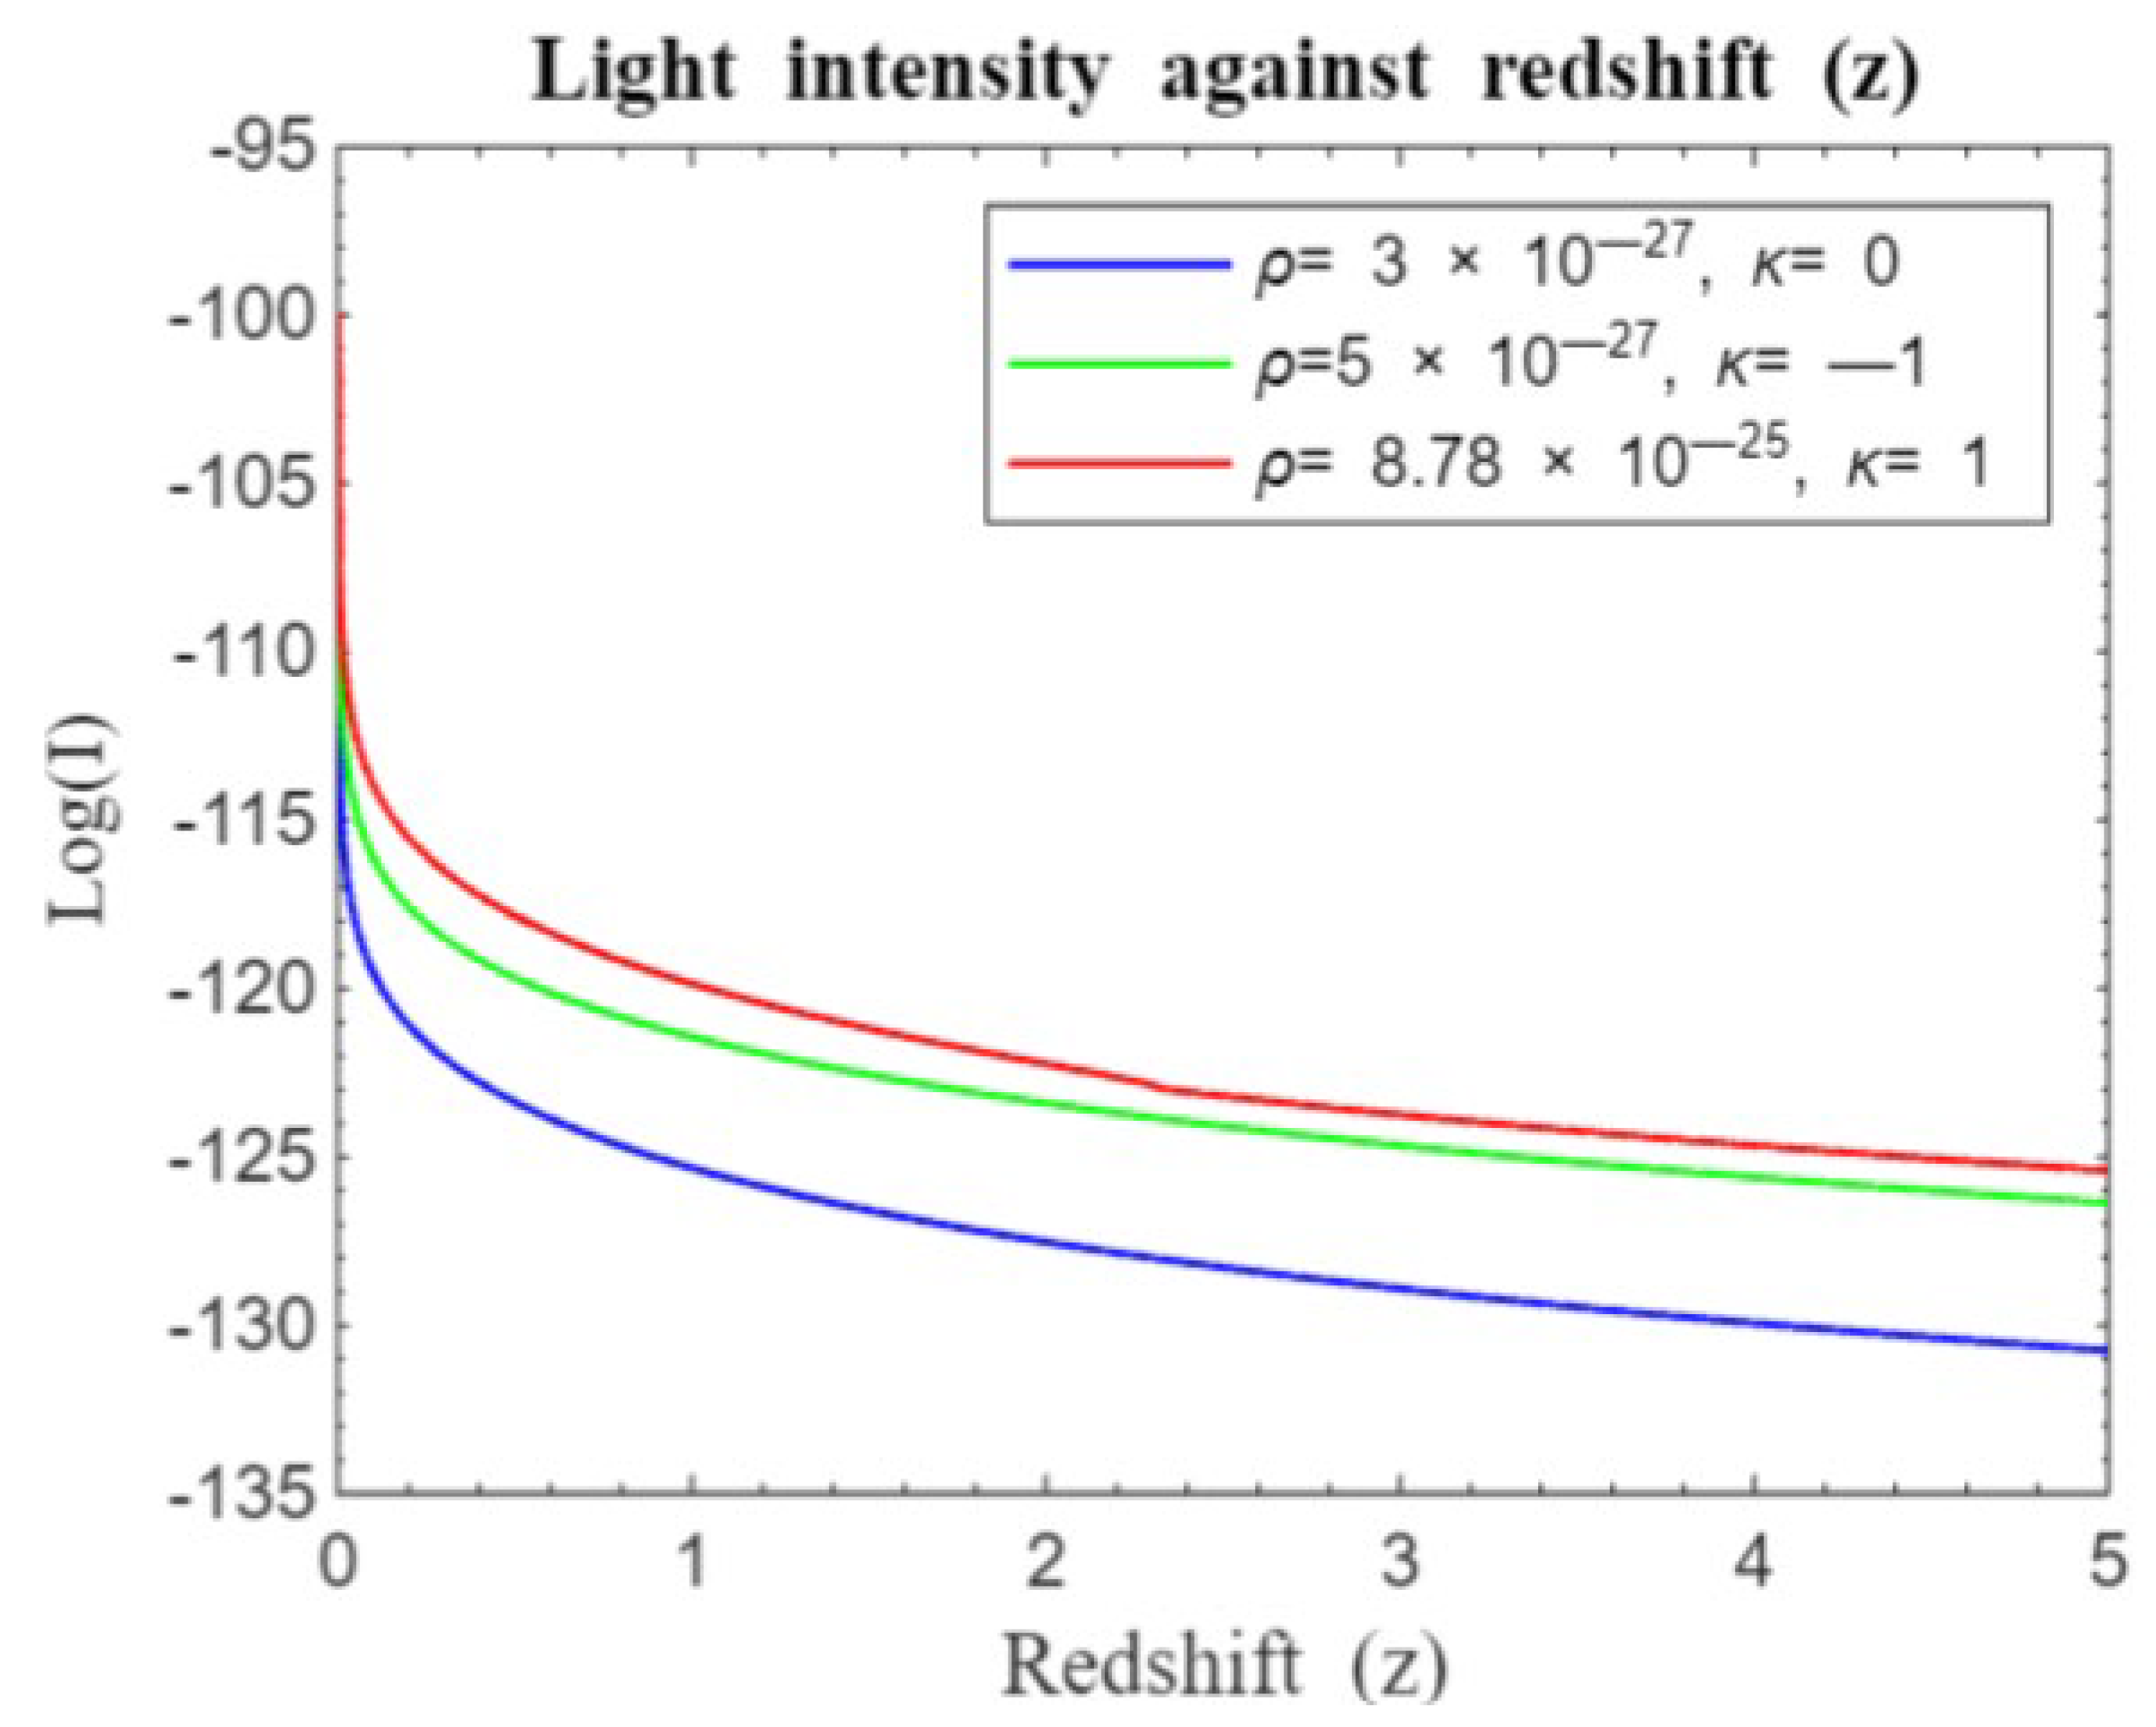
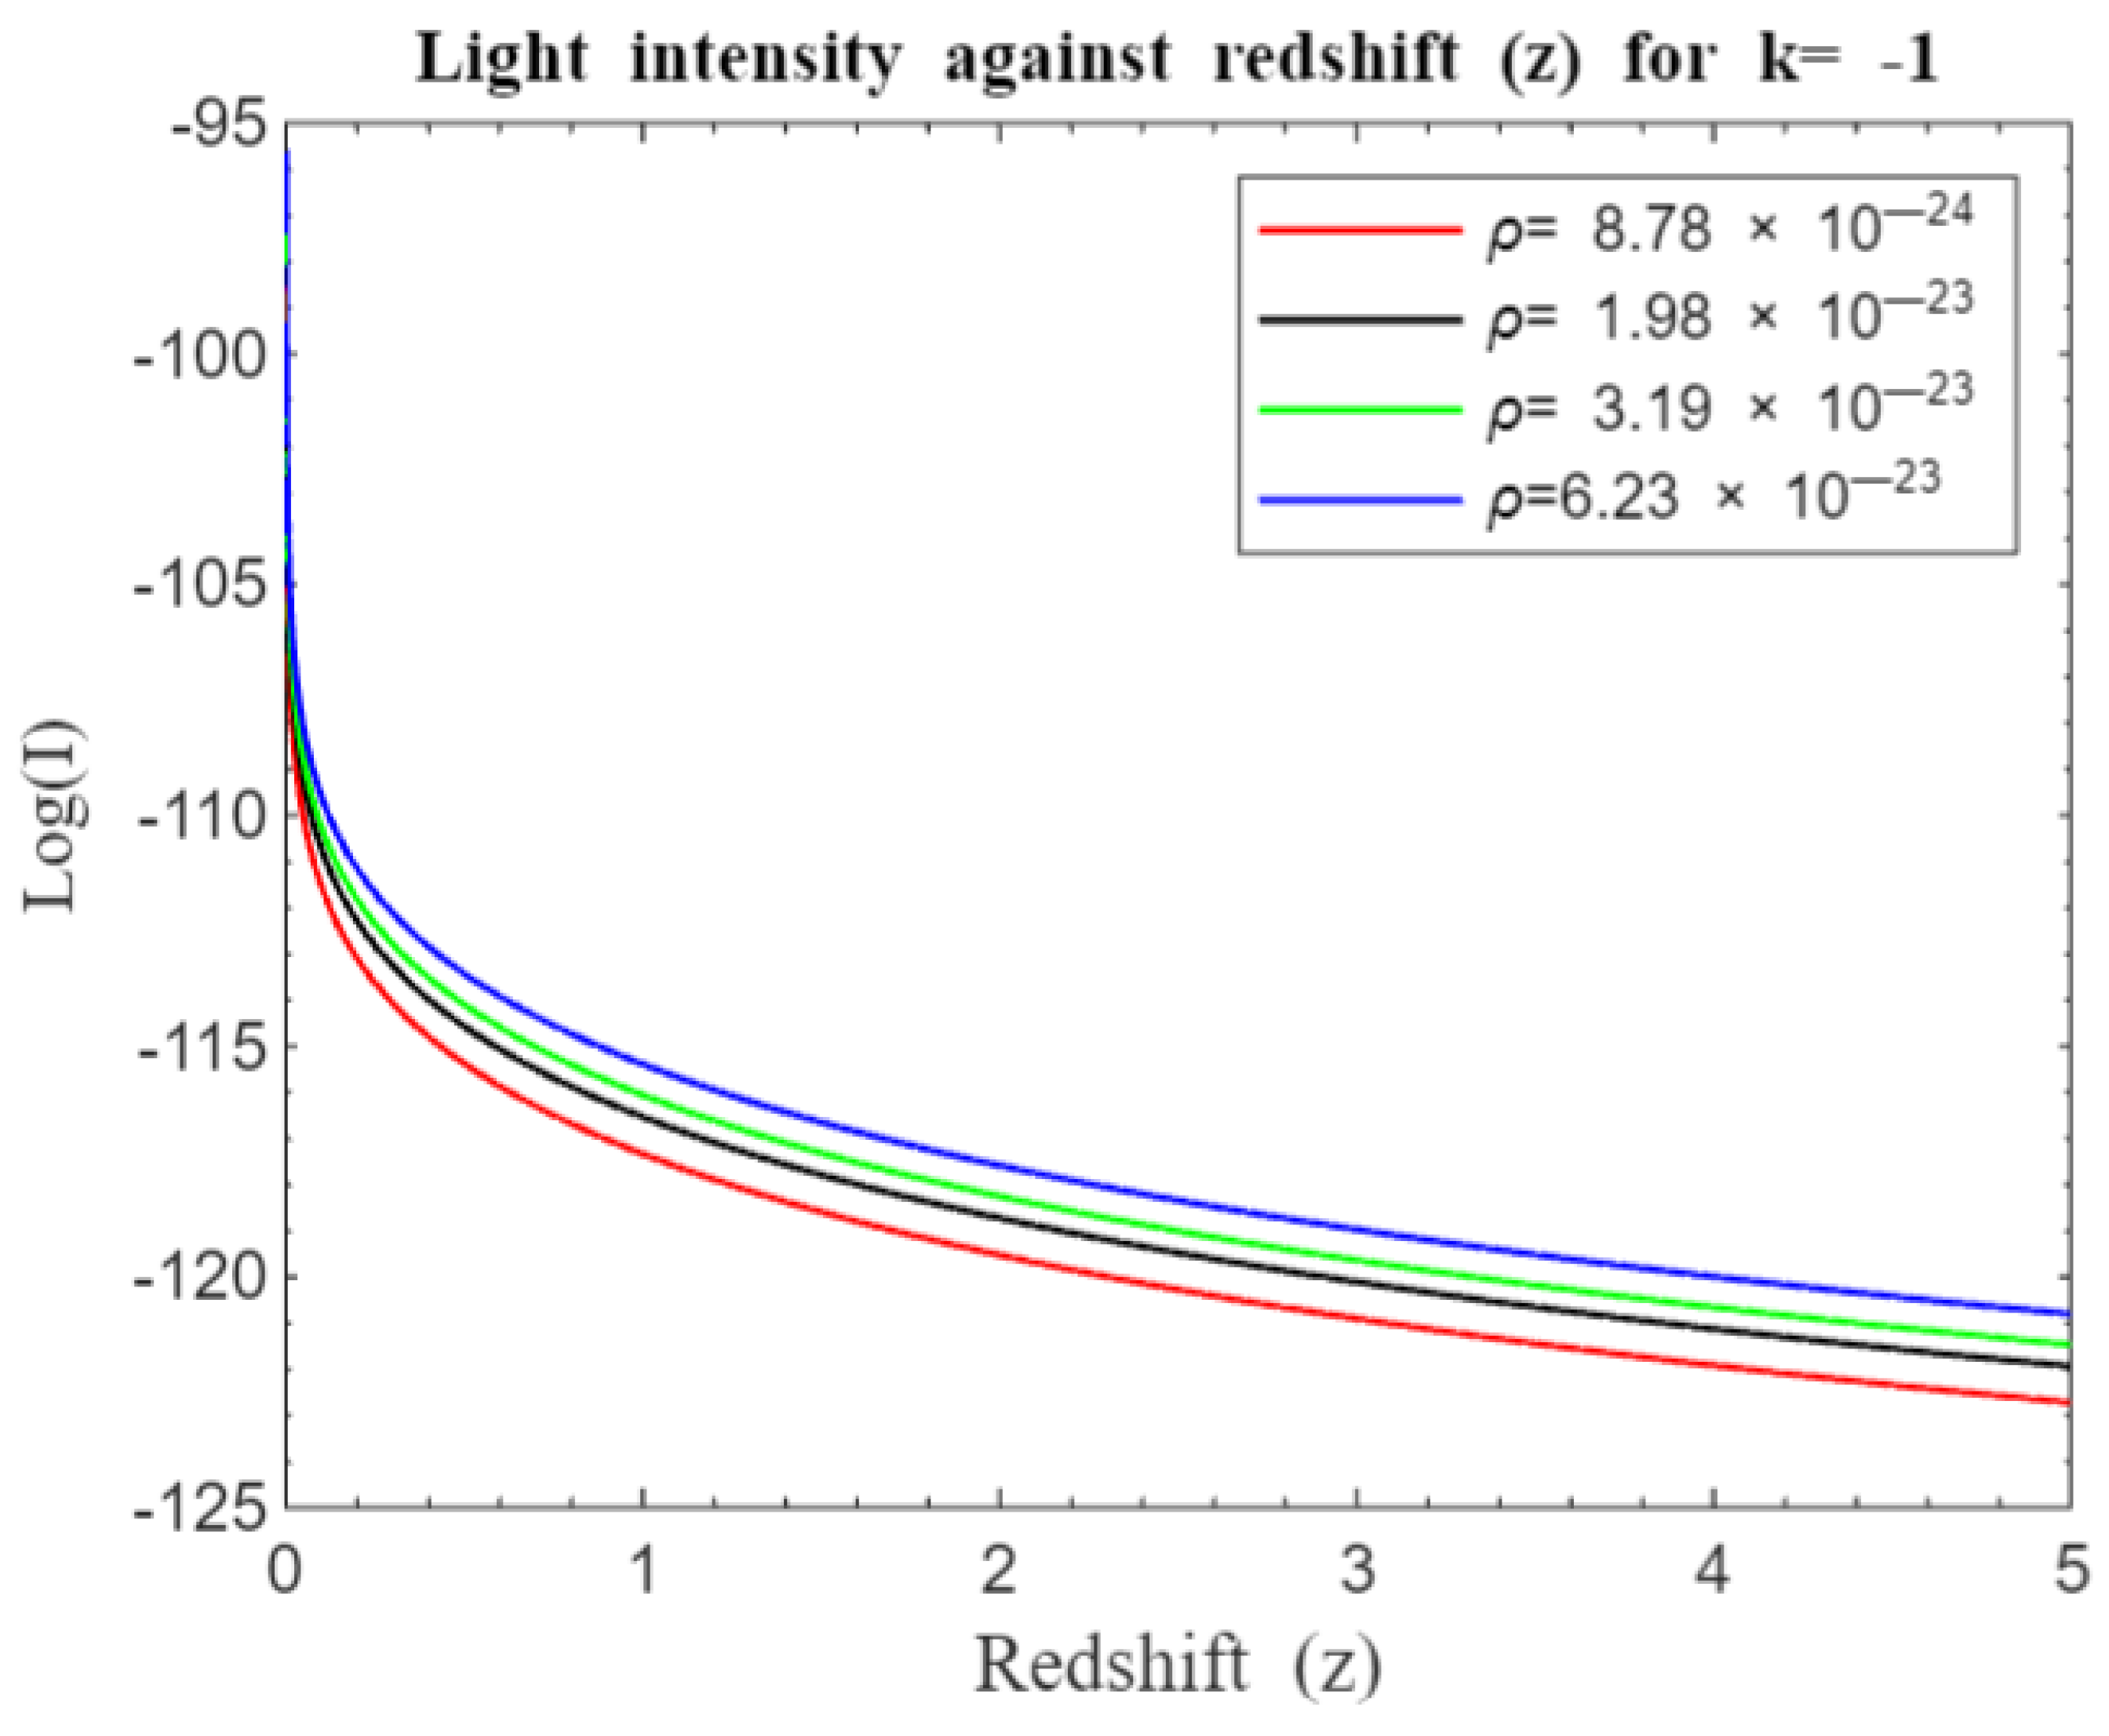
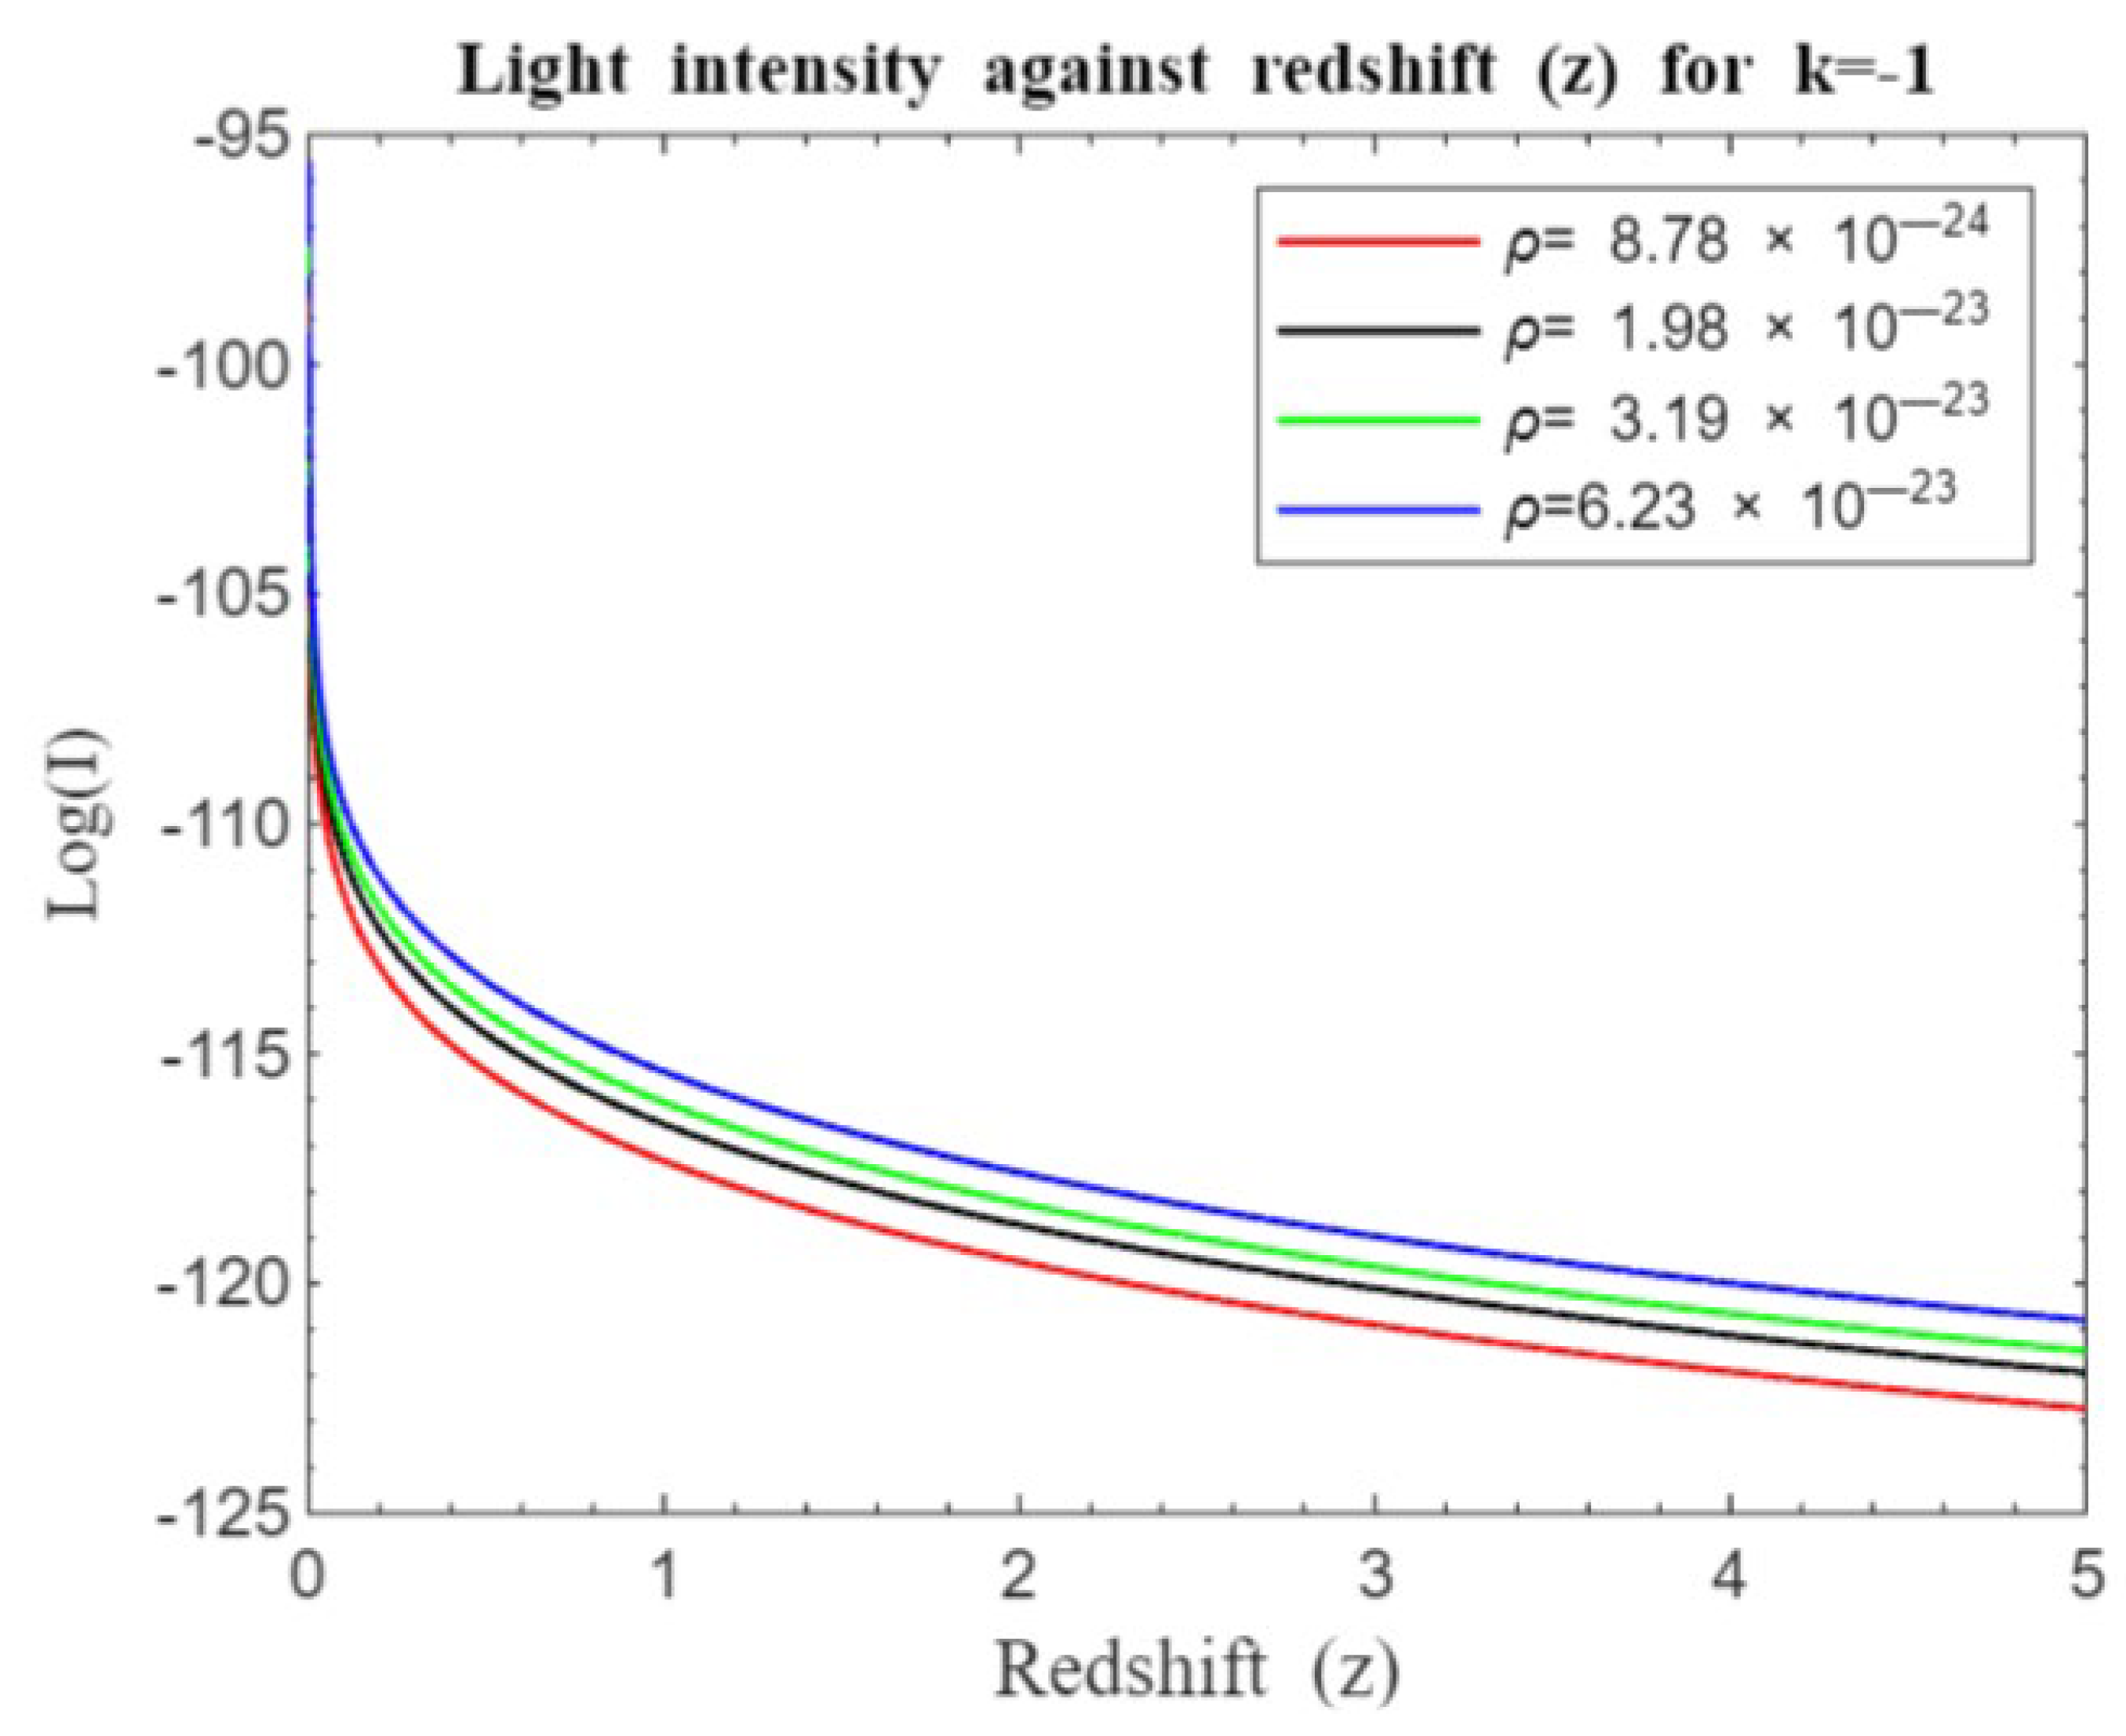
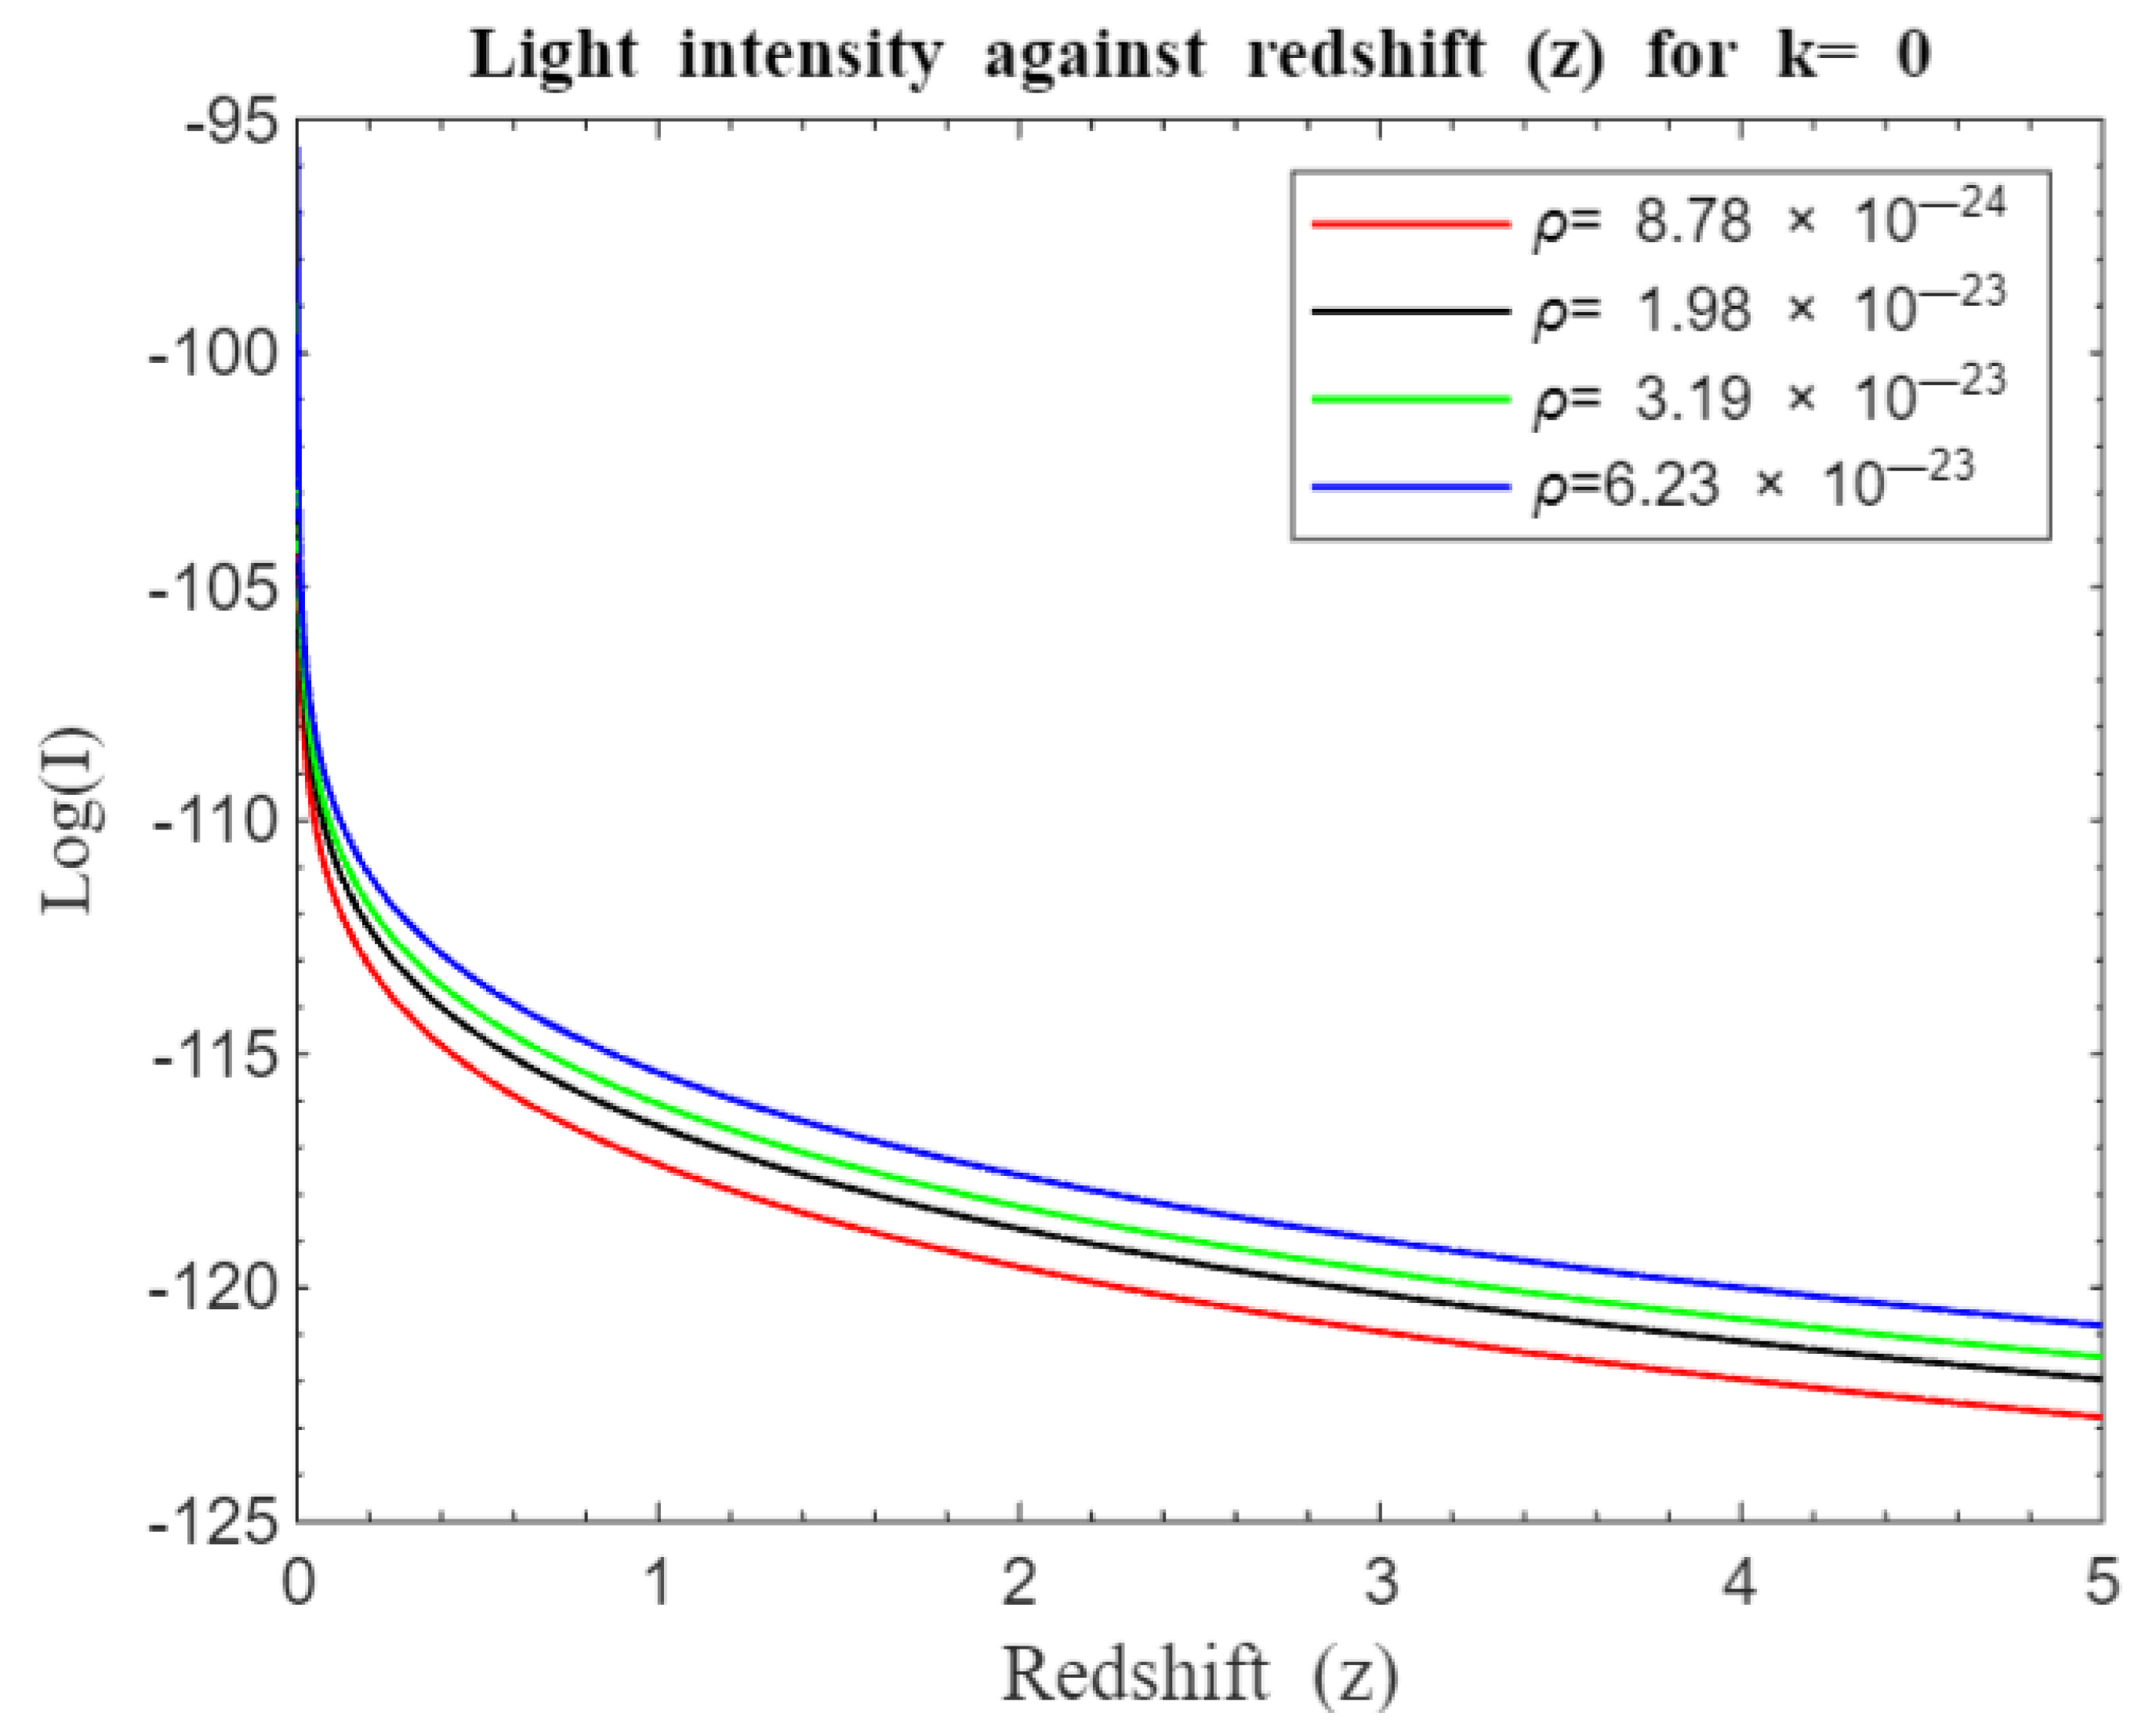
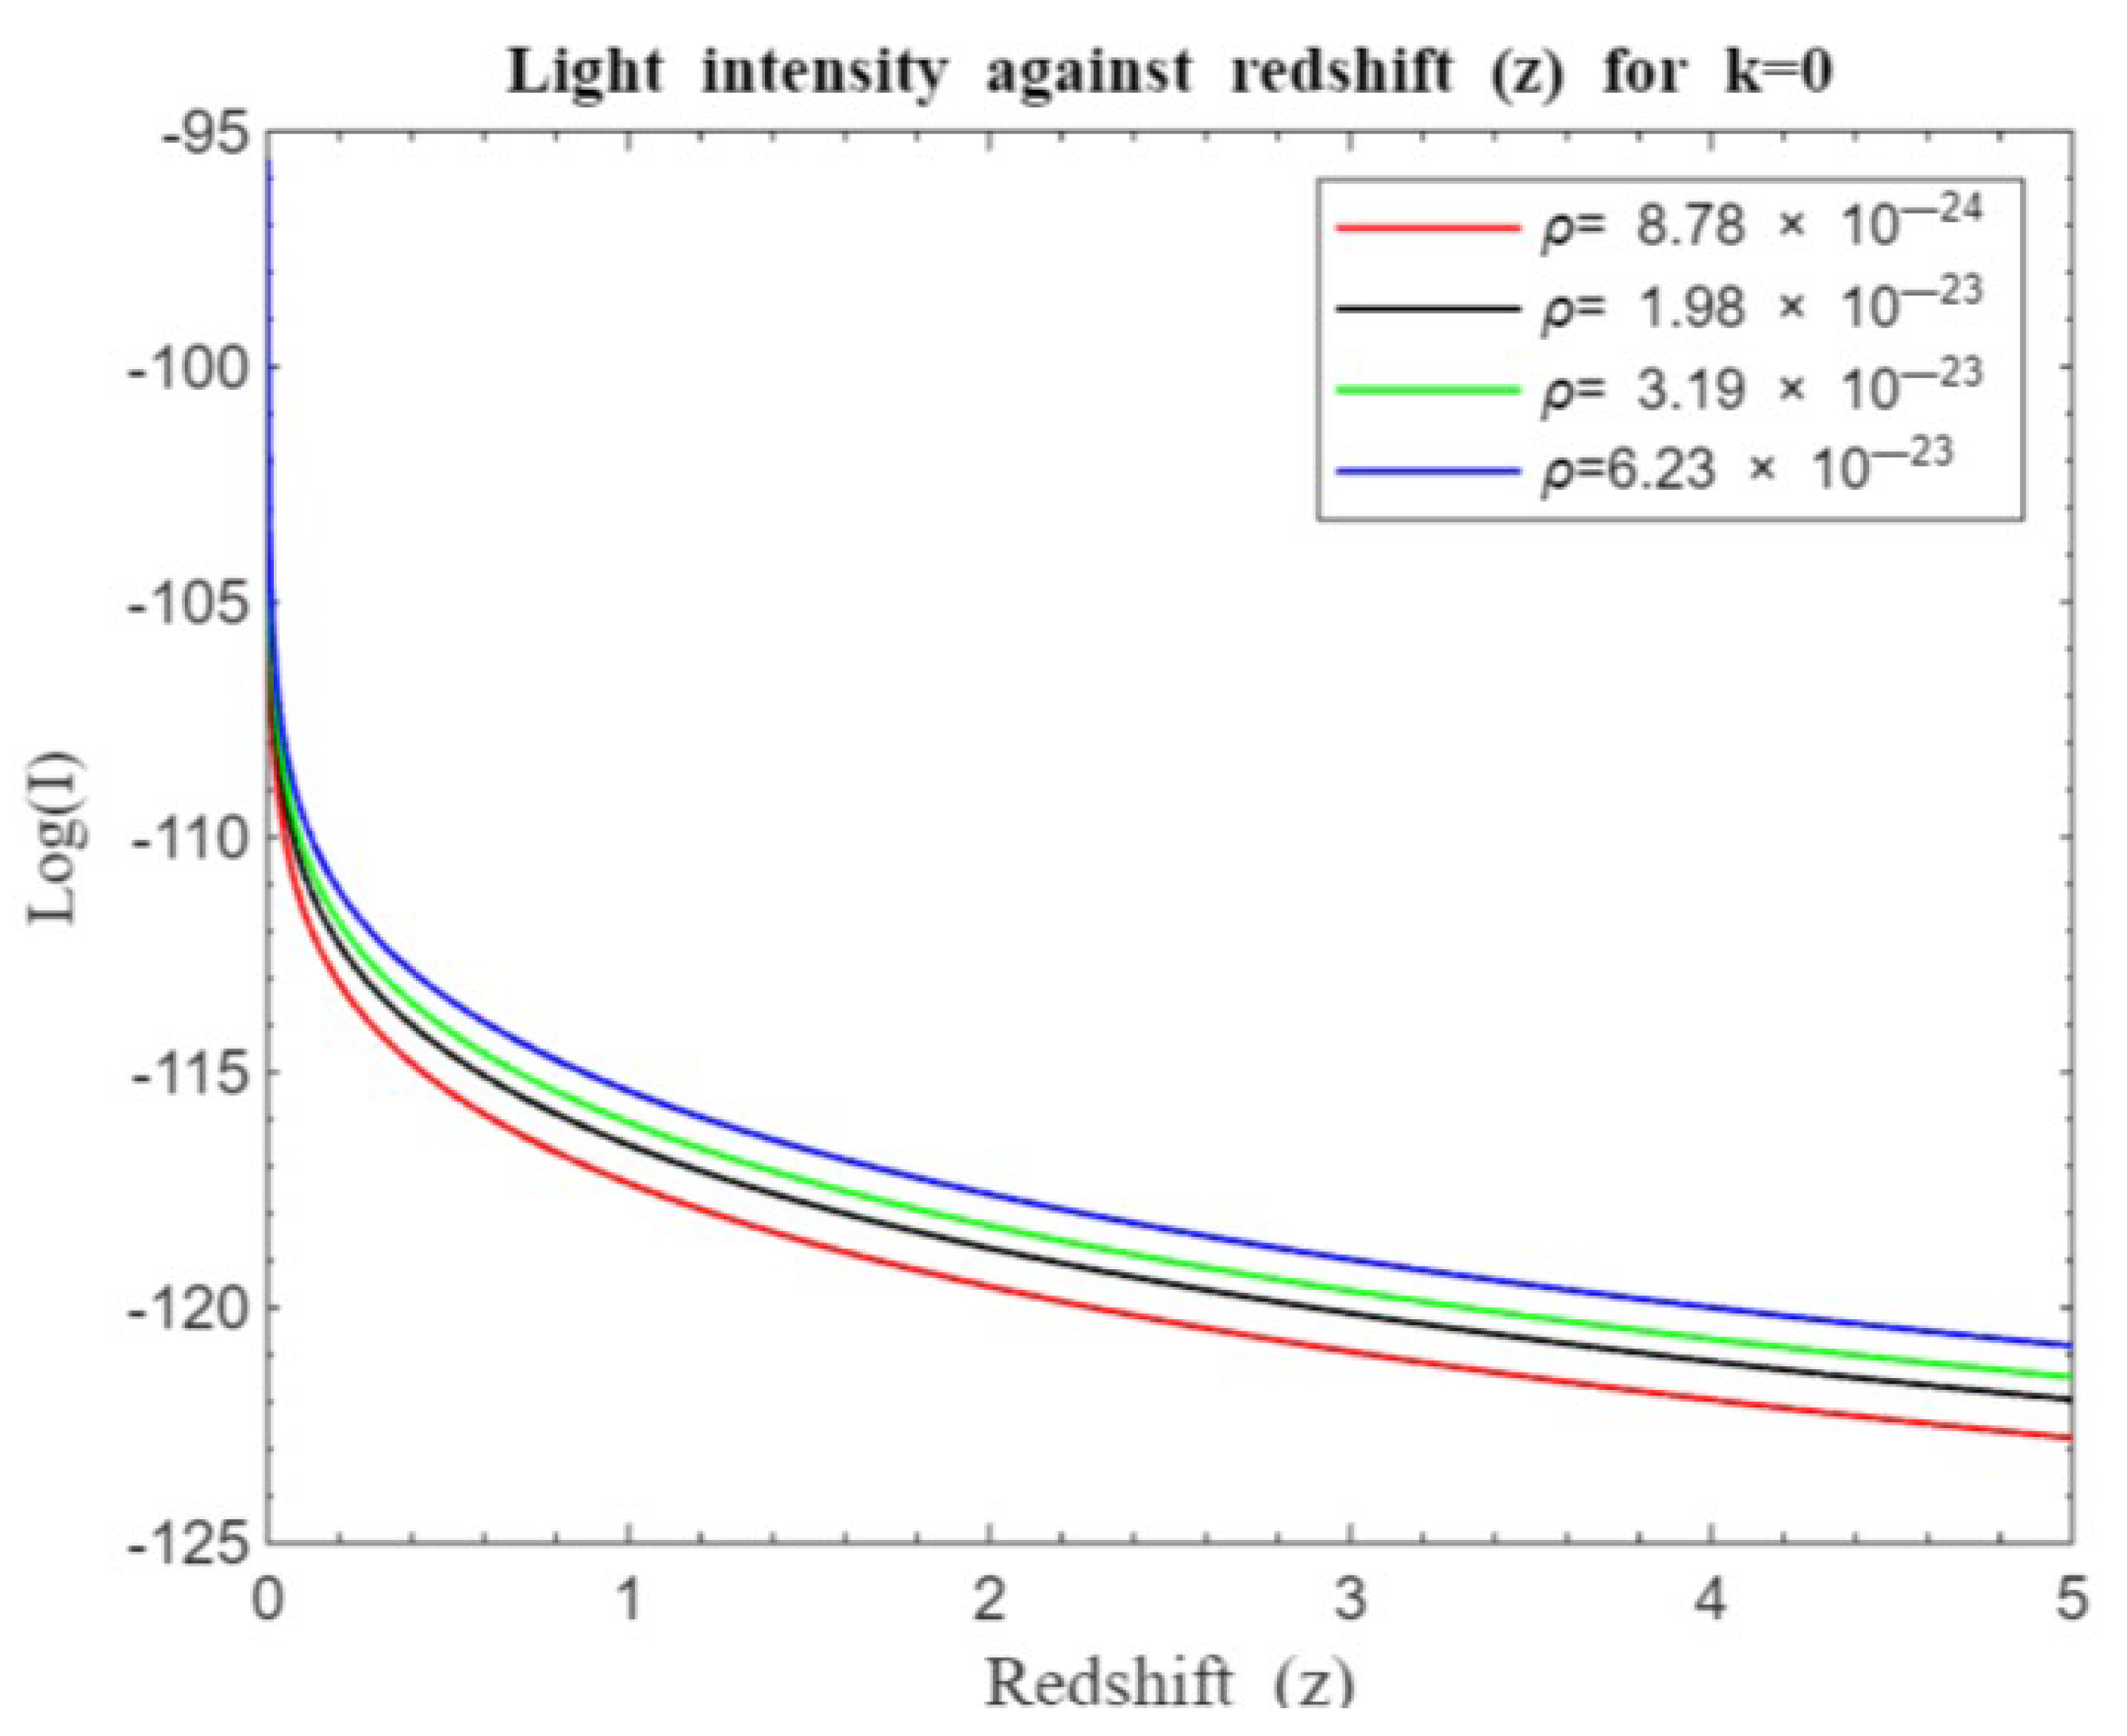
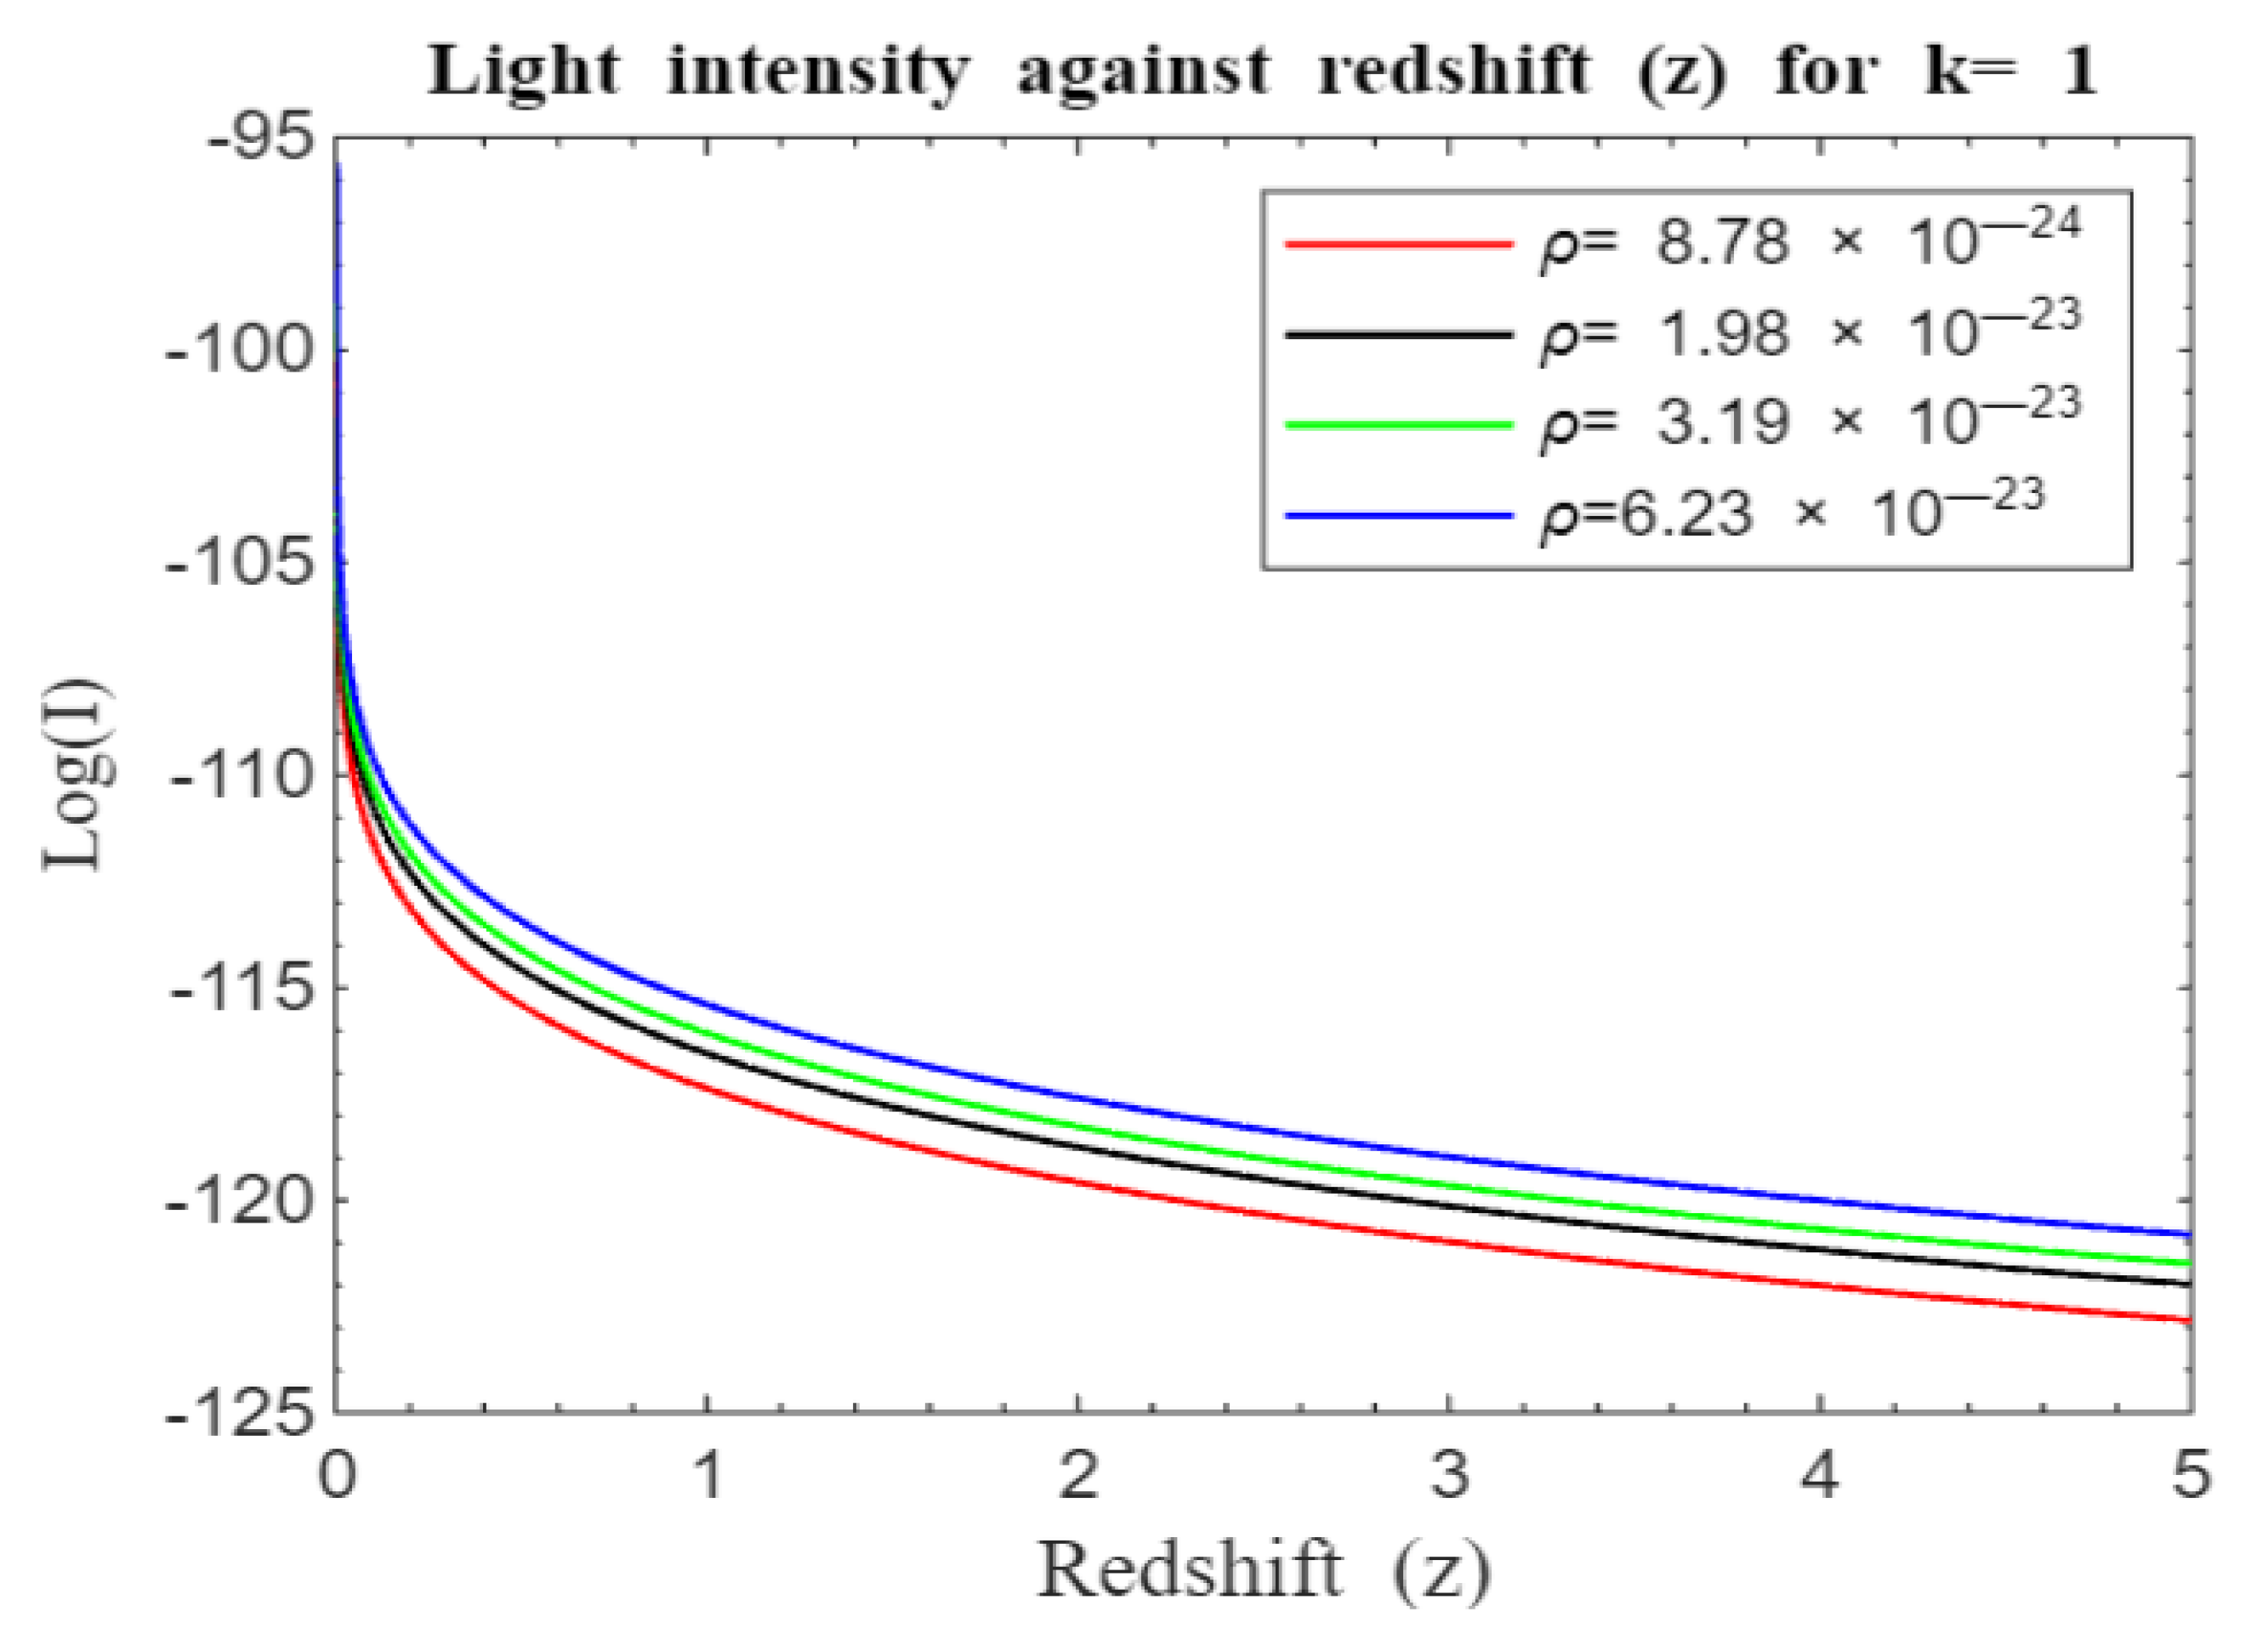
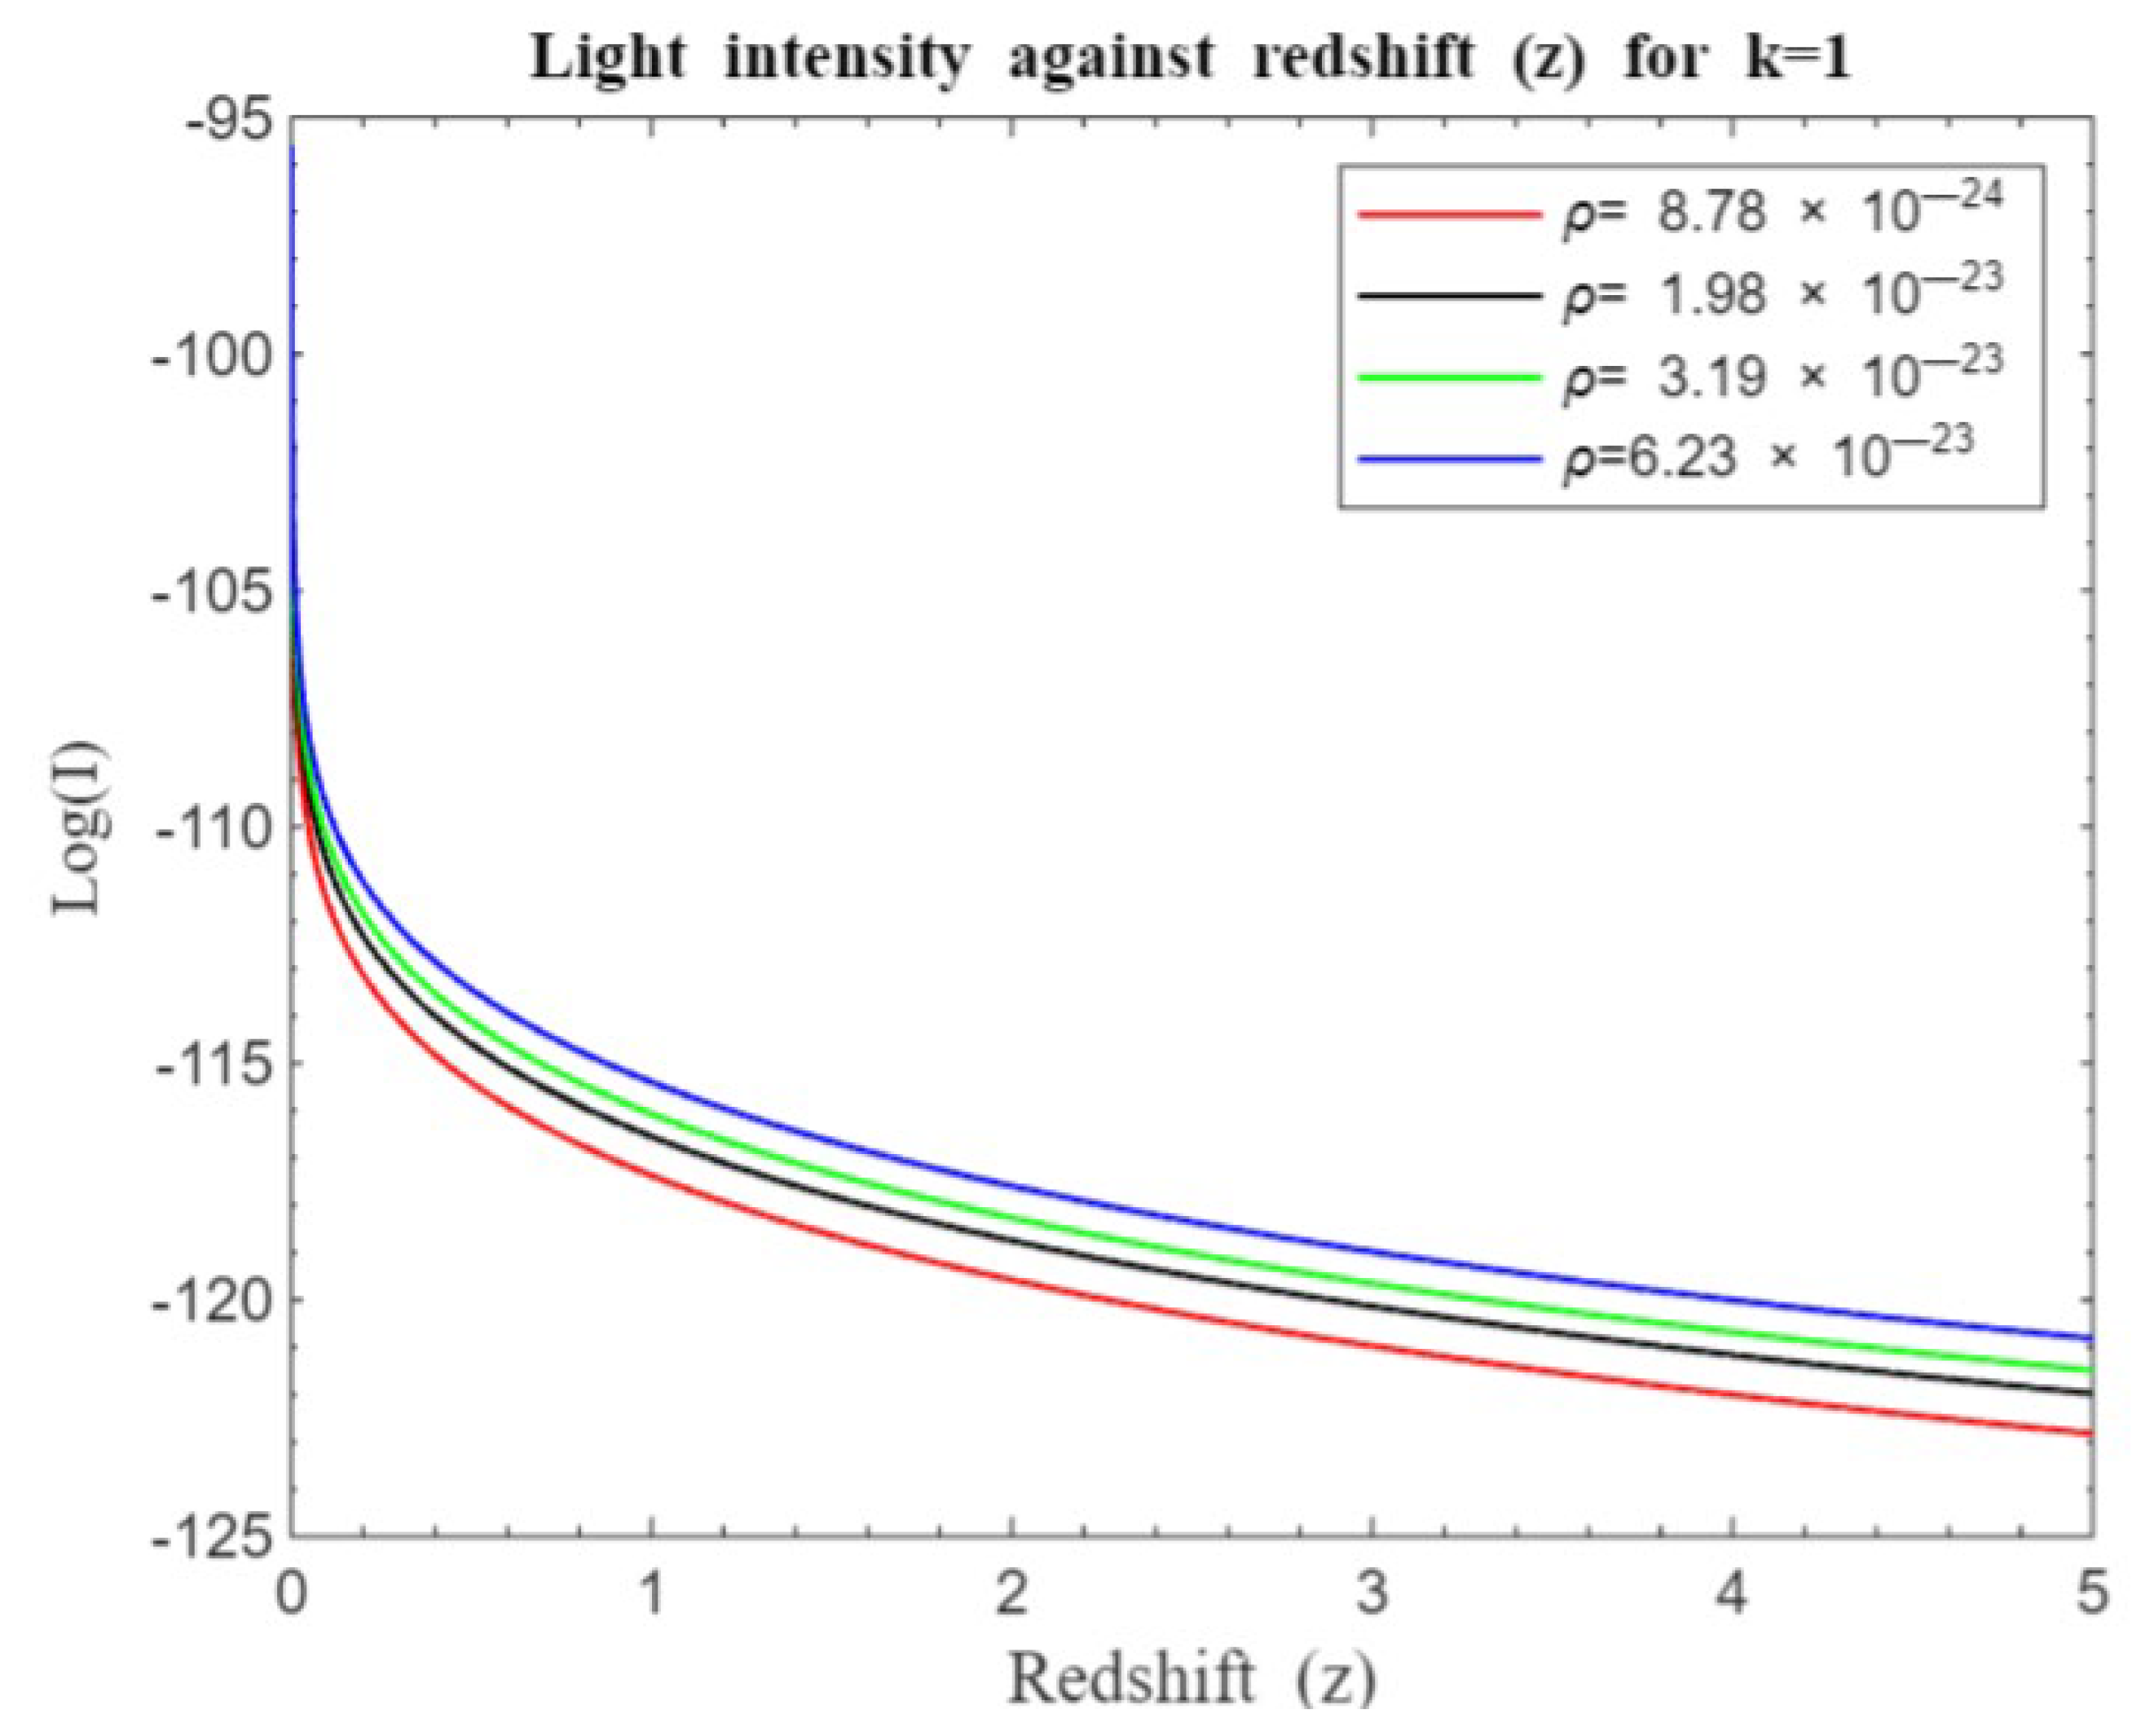
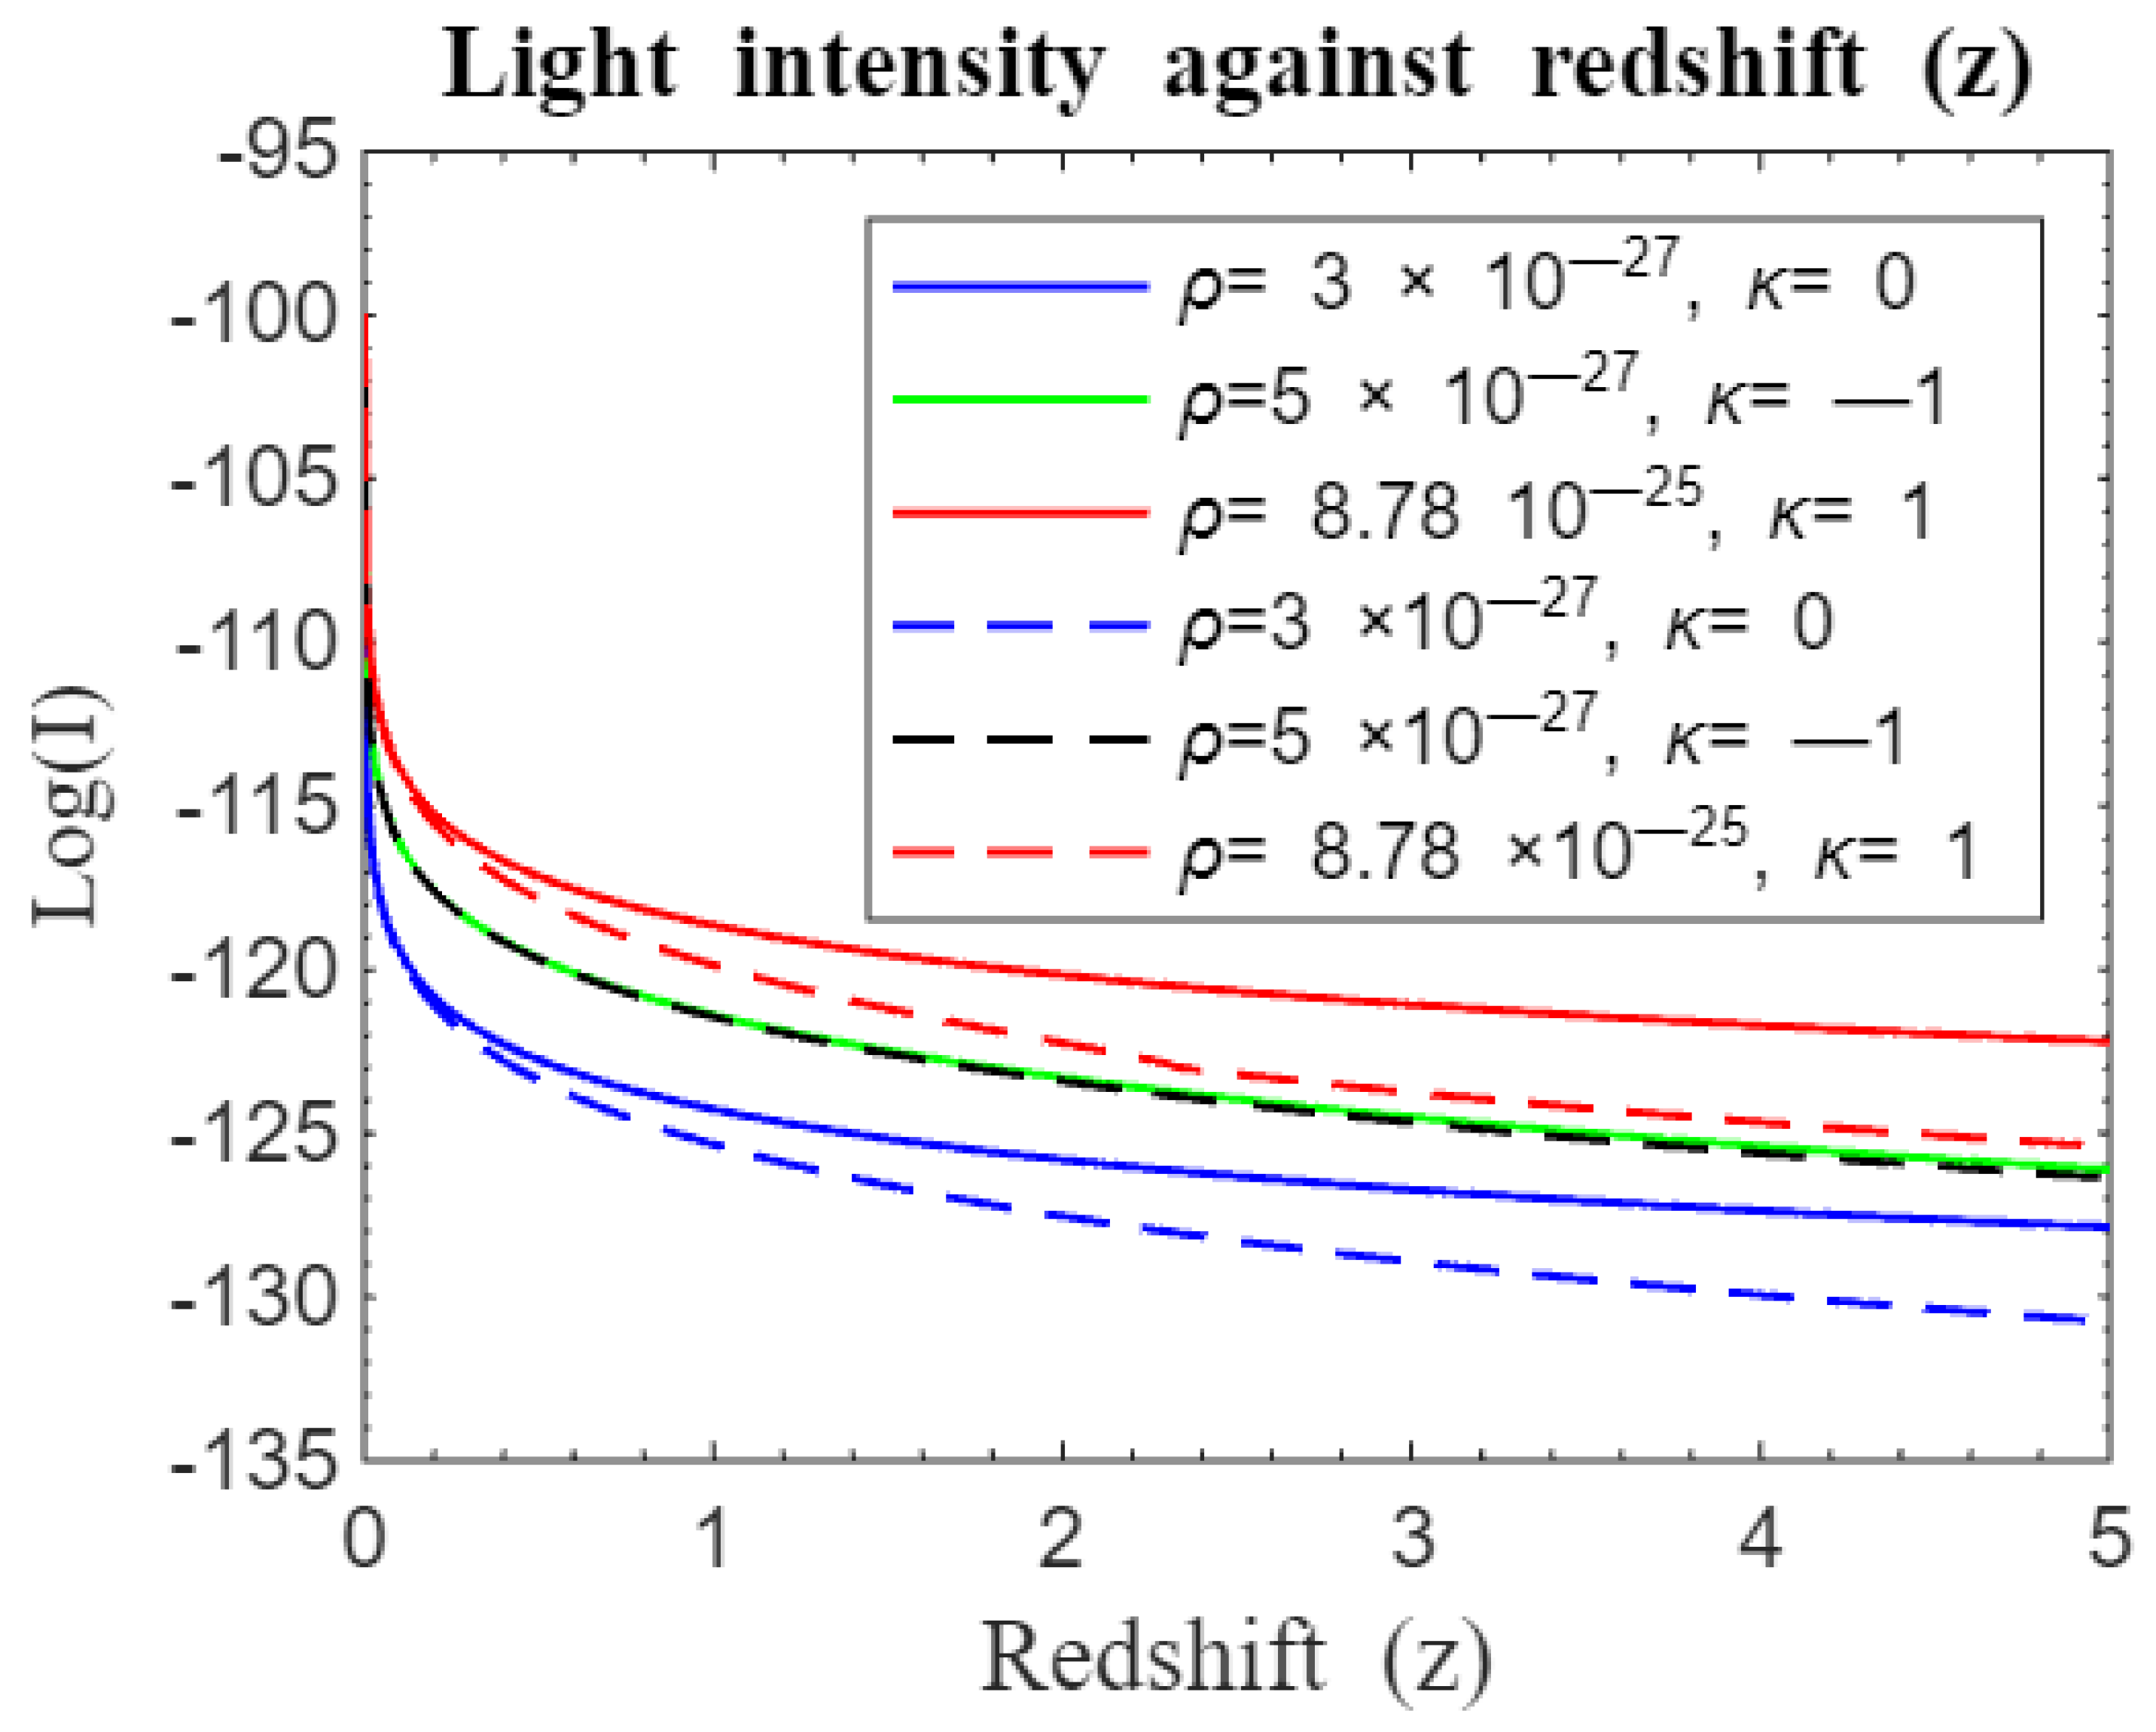
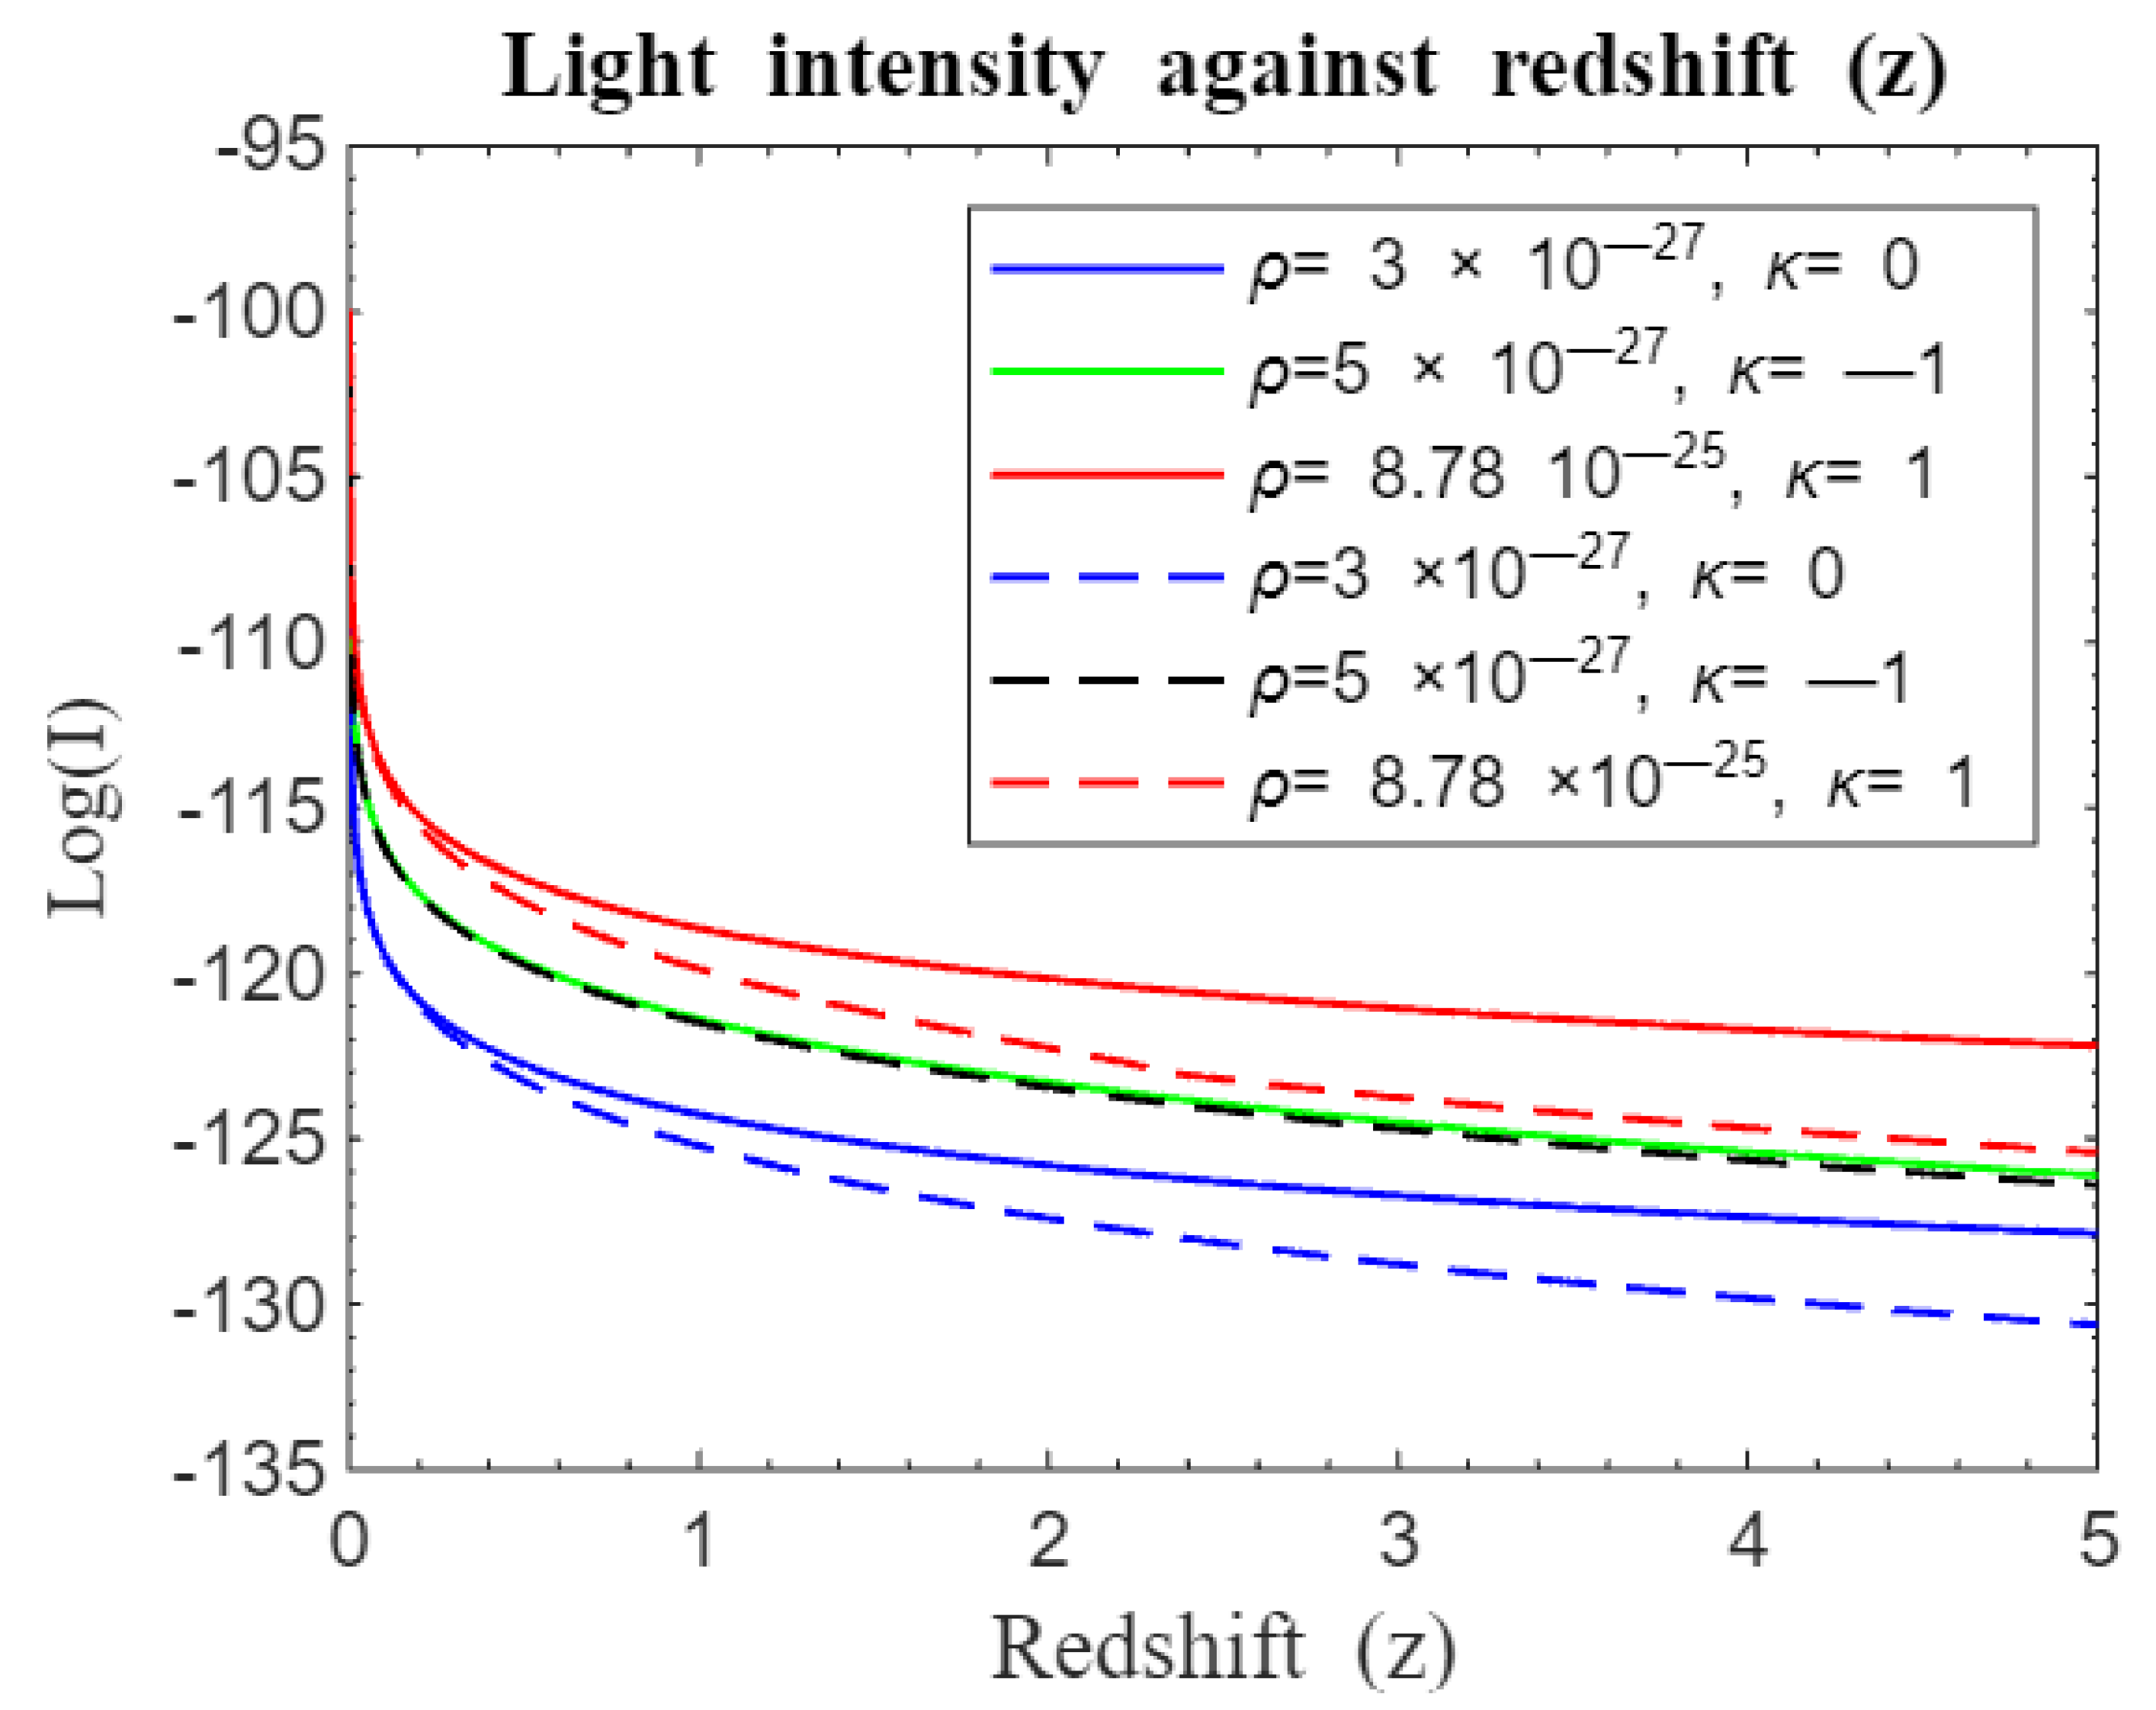
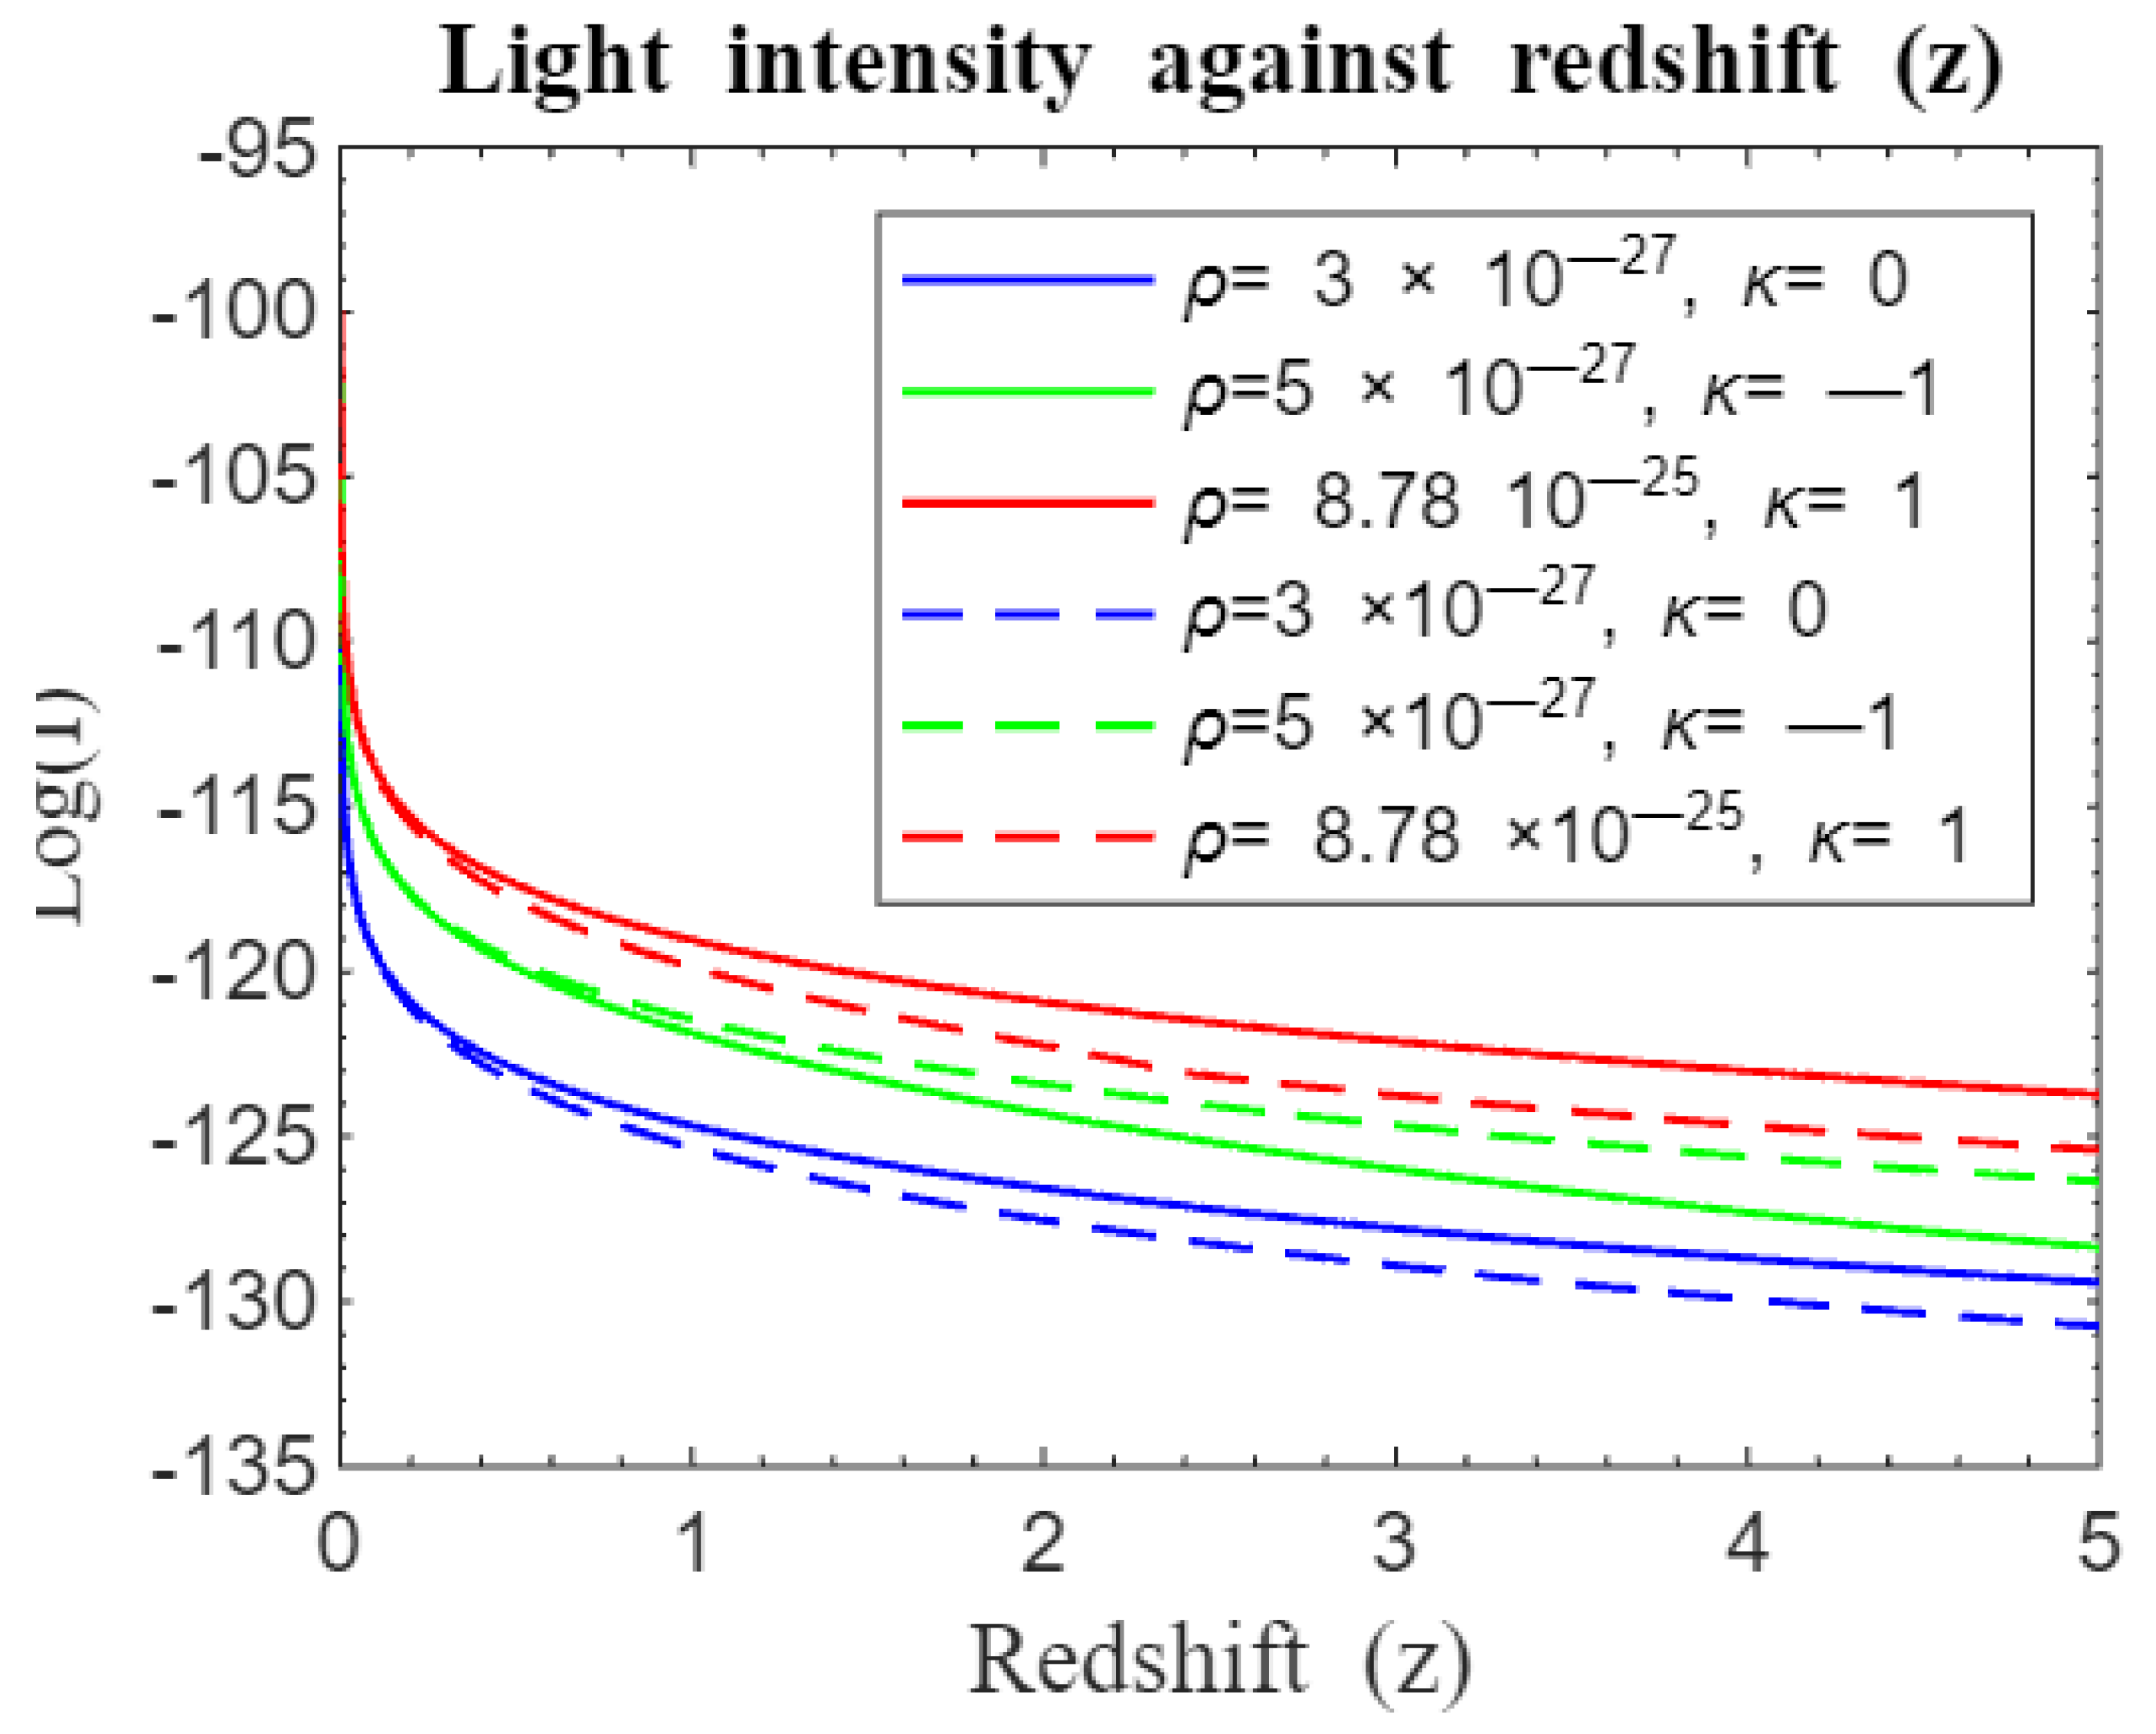
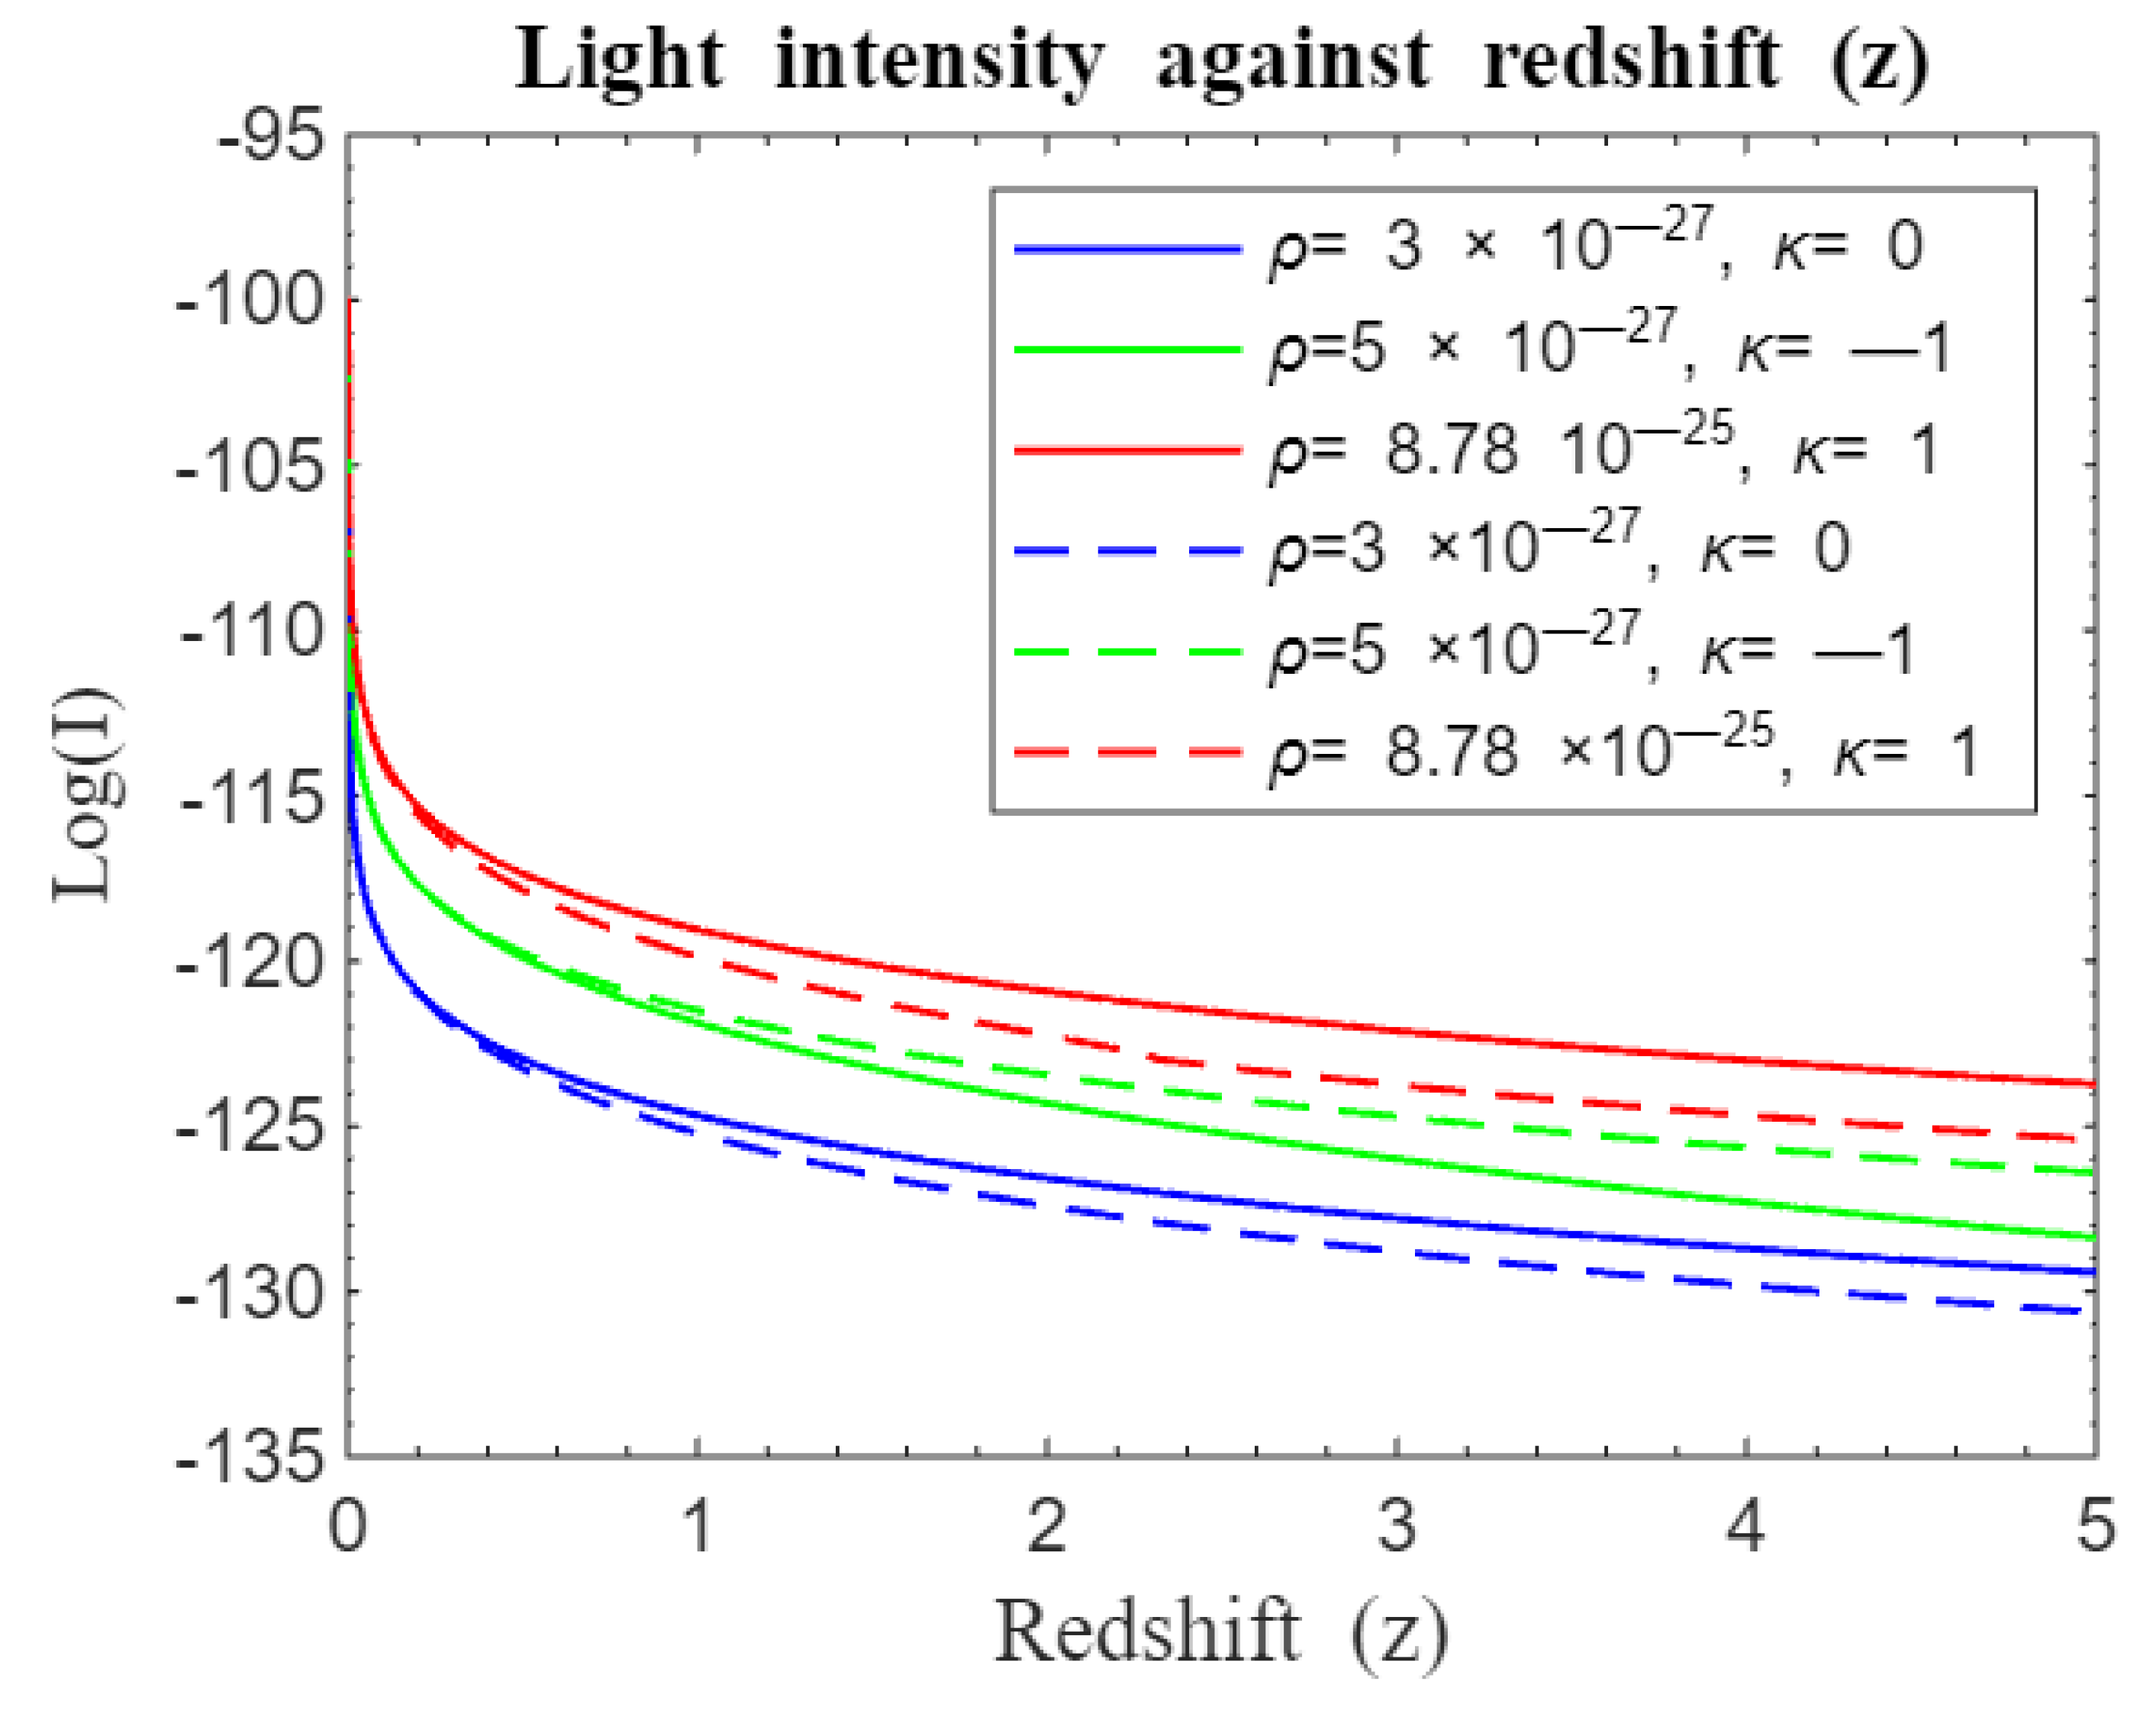
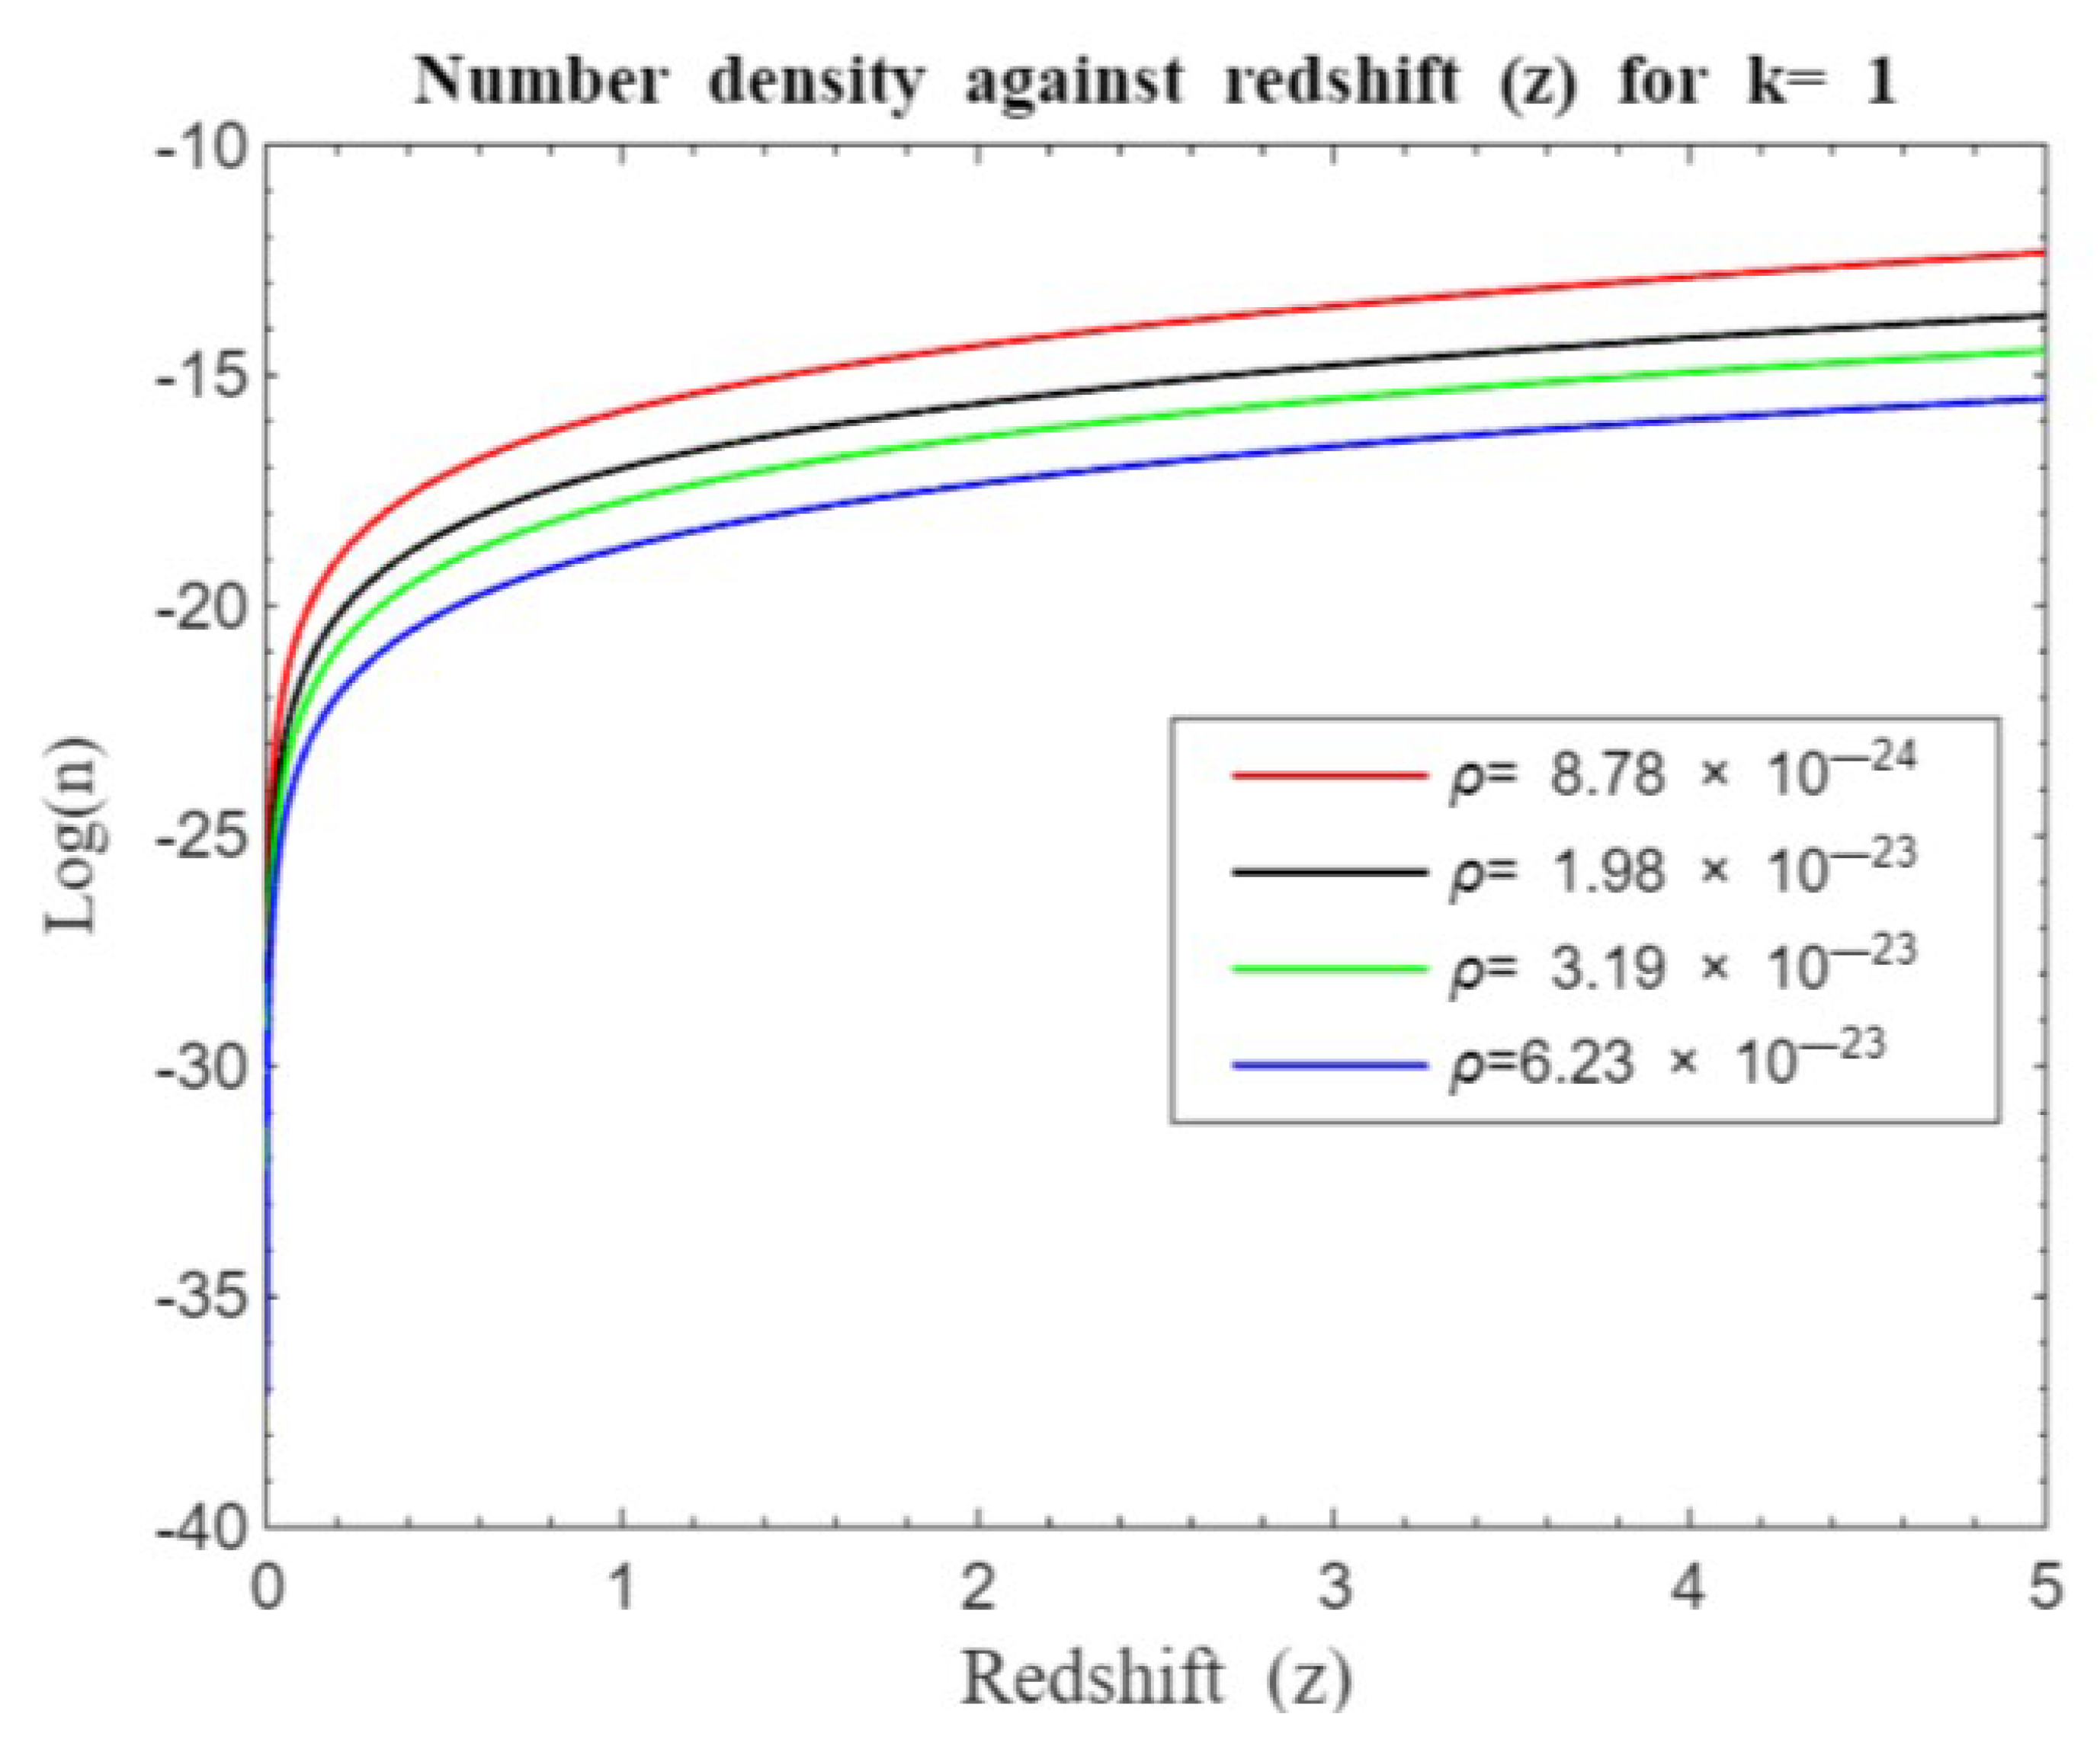
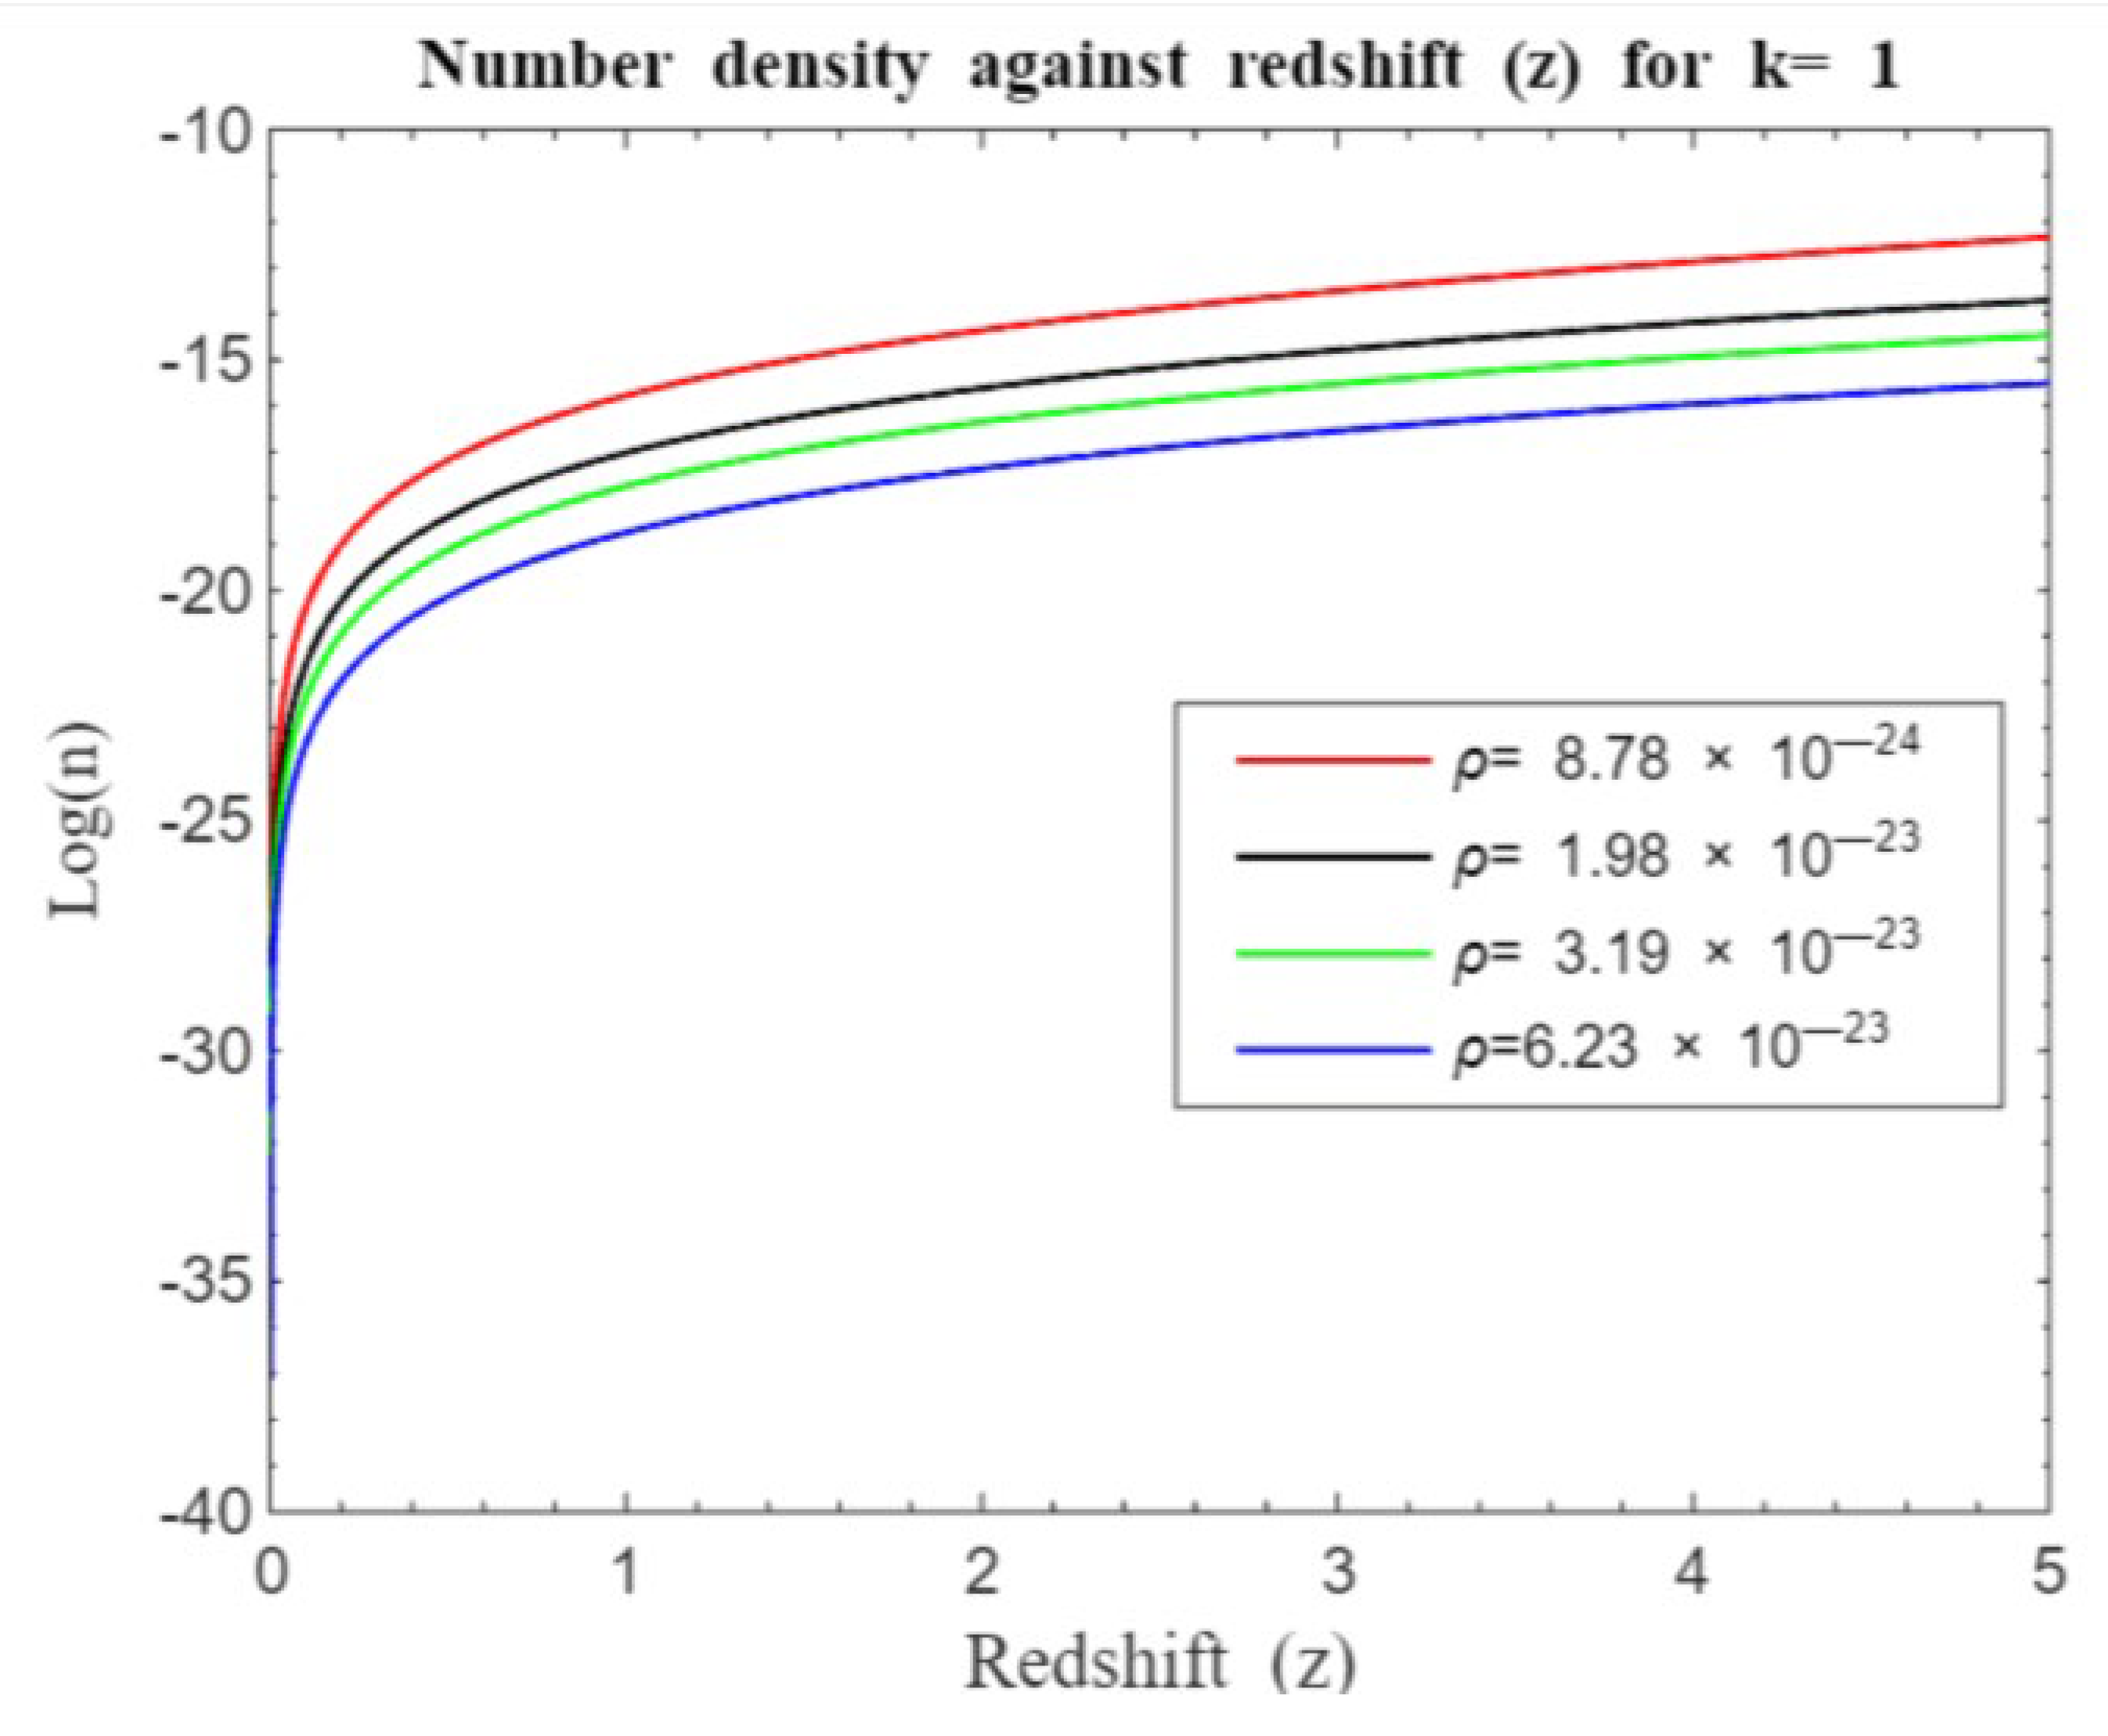
Executing our program using equation (14) for different and values yield the ensuing outcomes (refer to Figures 1 to 14) pertinent to light intensity.
Figure 1,
Figure 2,
Figure 3,
Figure 4,
Figure 5,
Figure 6,
Figure 7,
Figure 8,
Figure 9,
Figure 10,
Figure 11,
Figure 12,
Figure 13 and
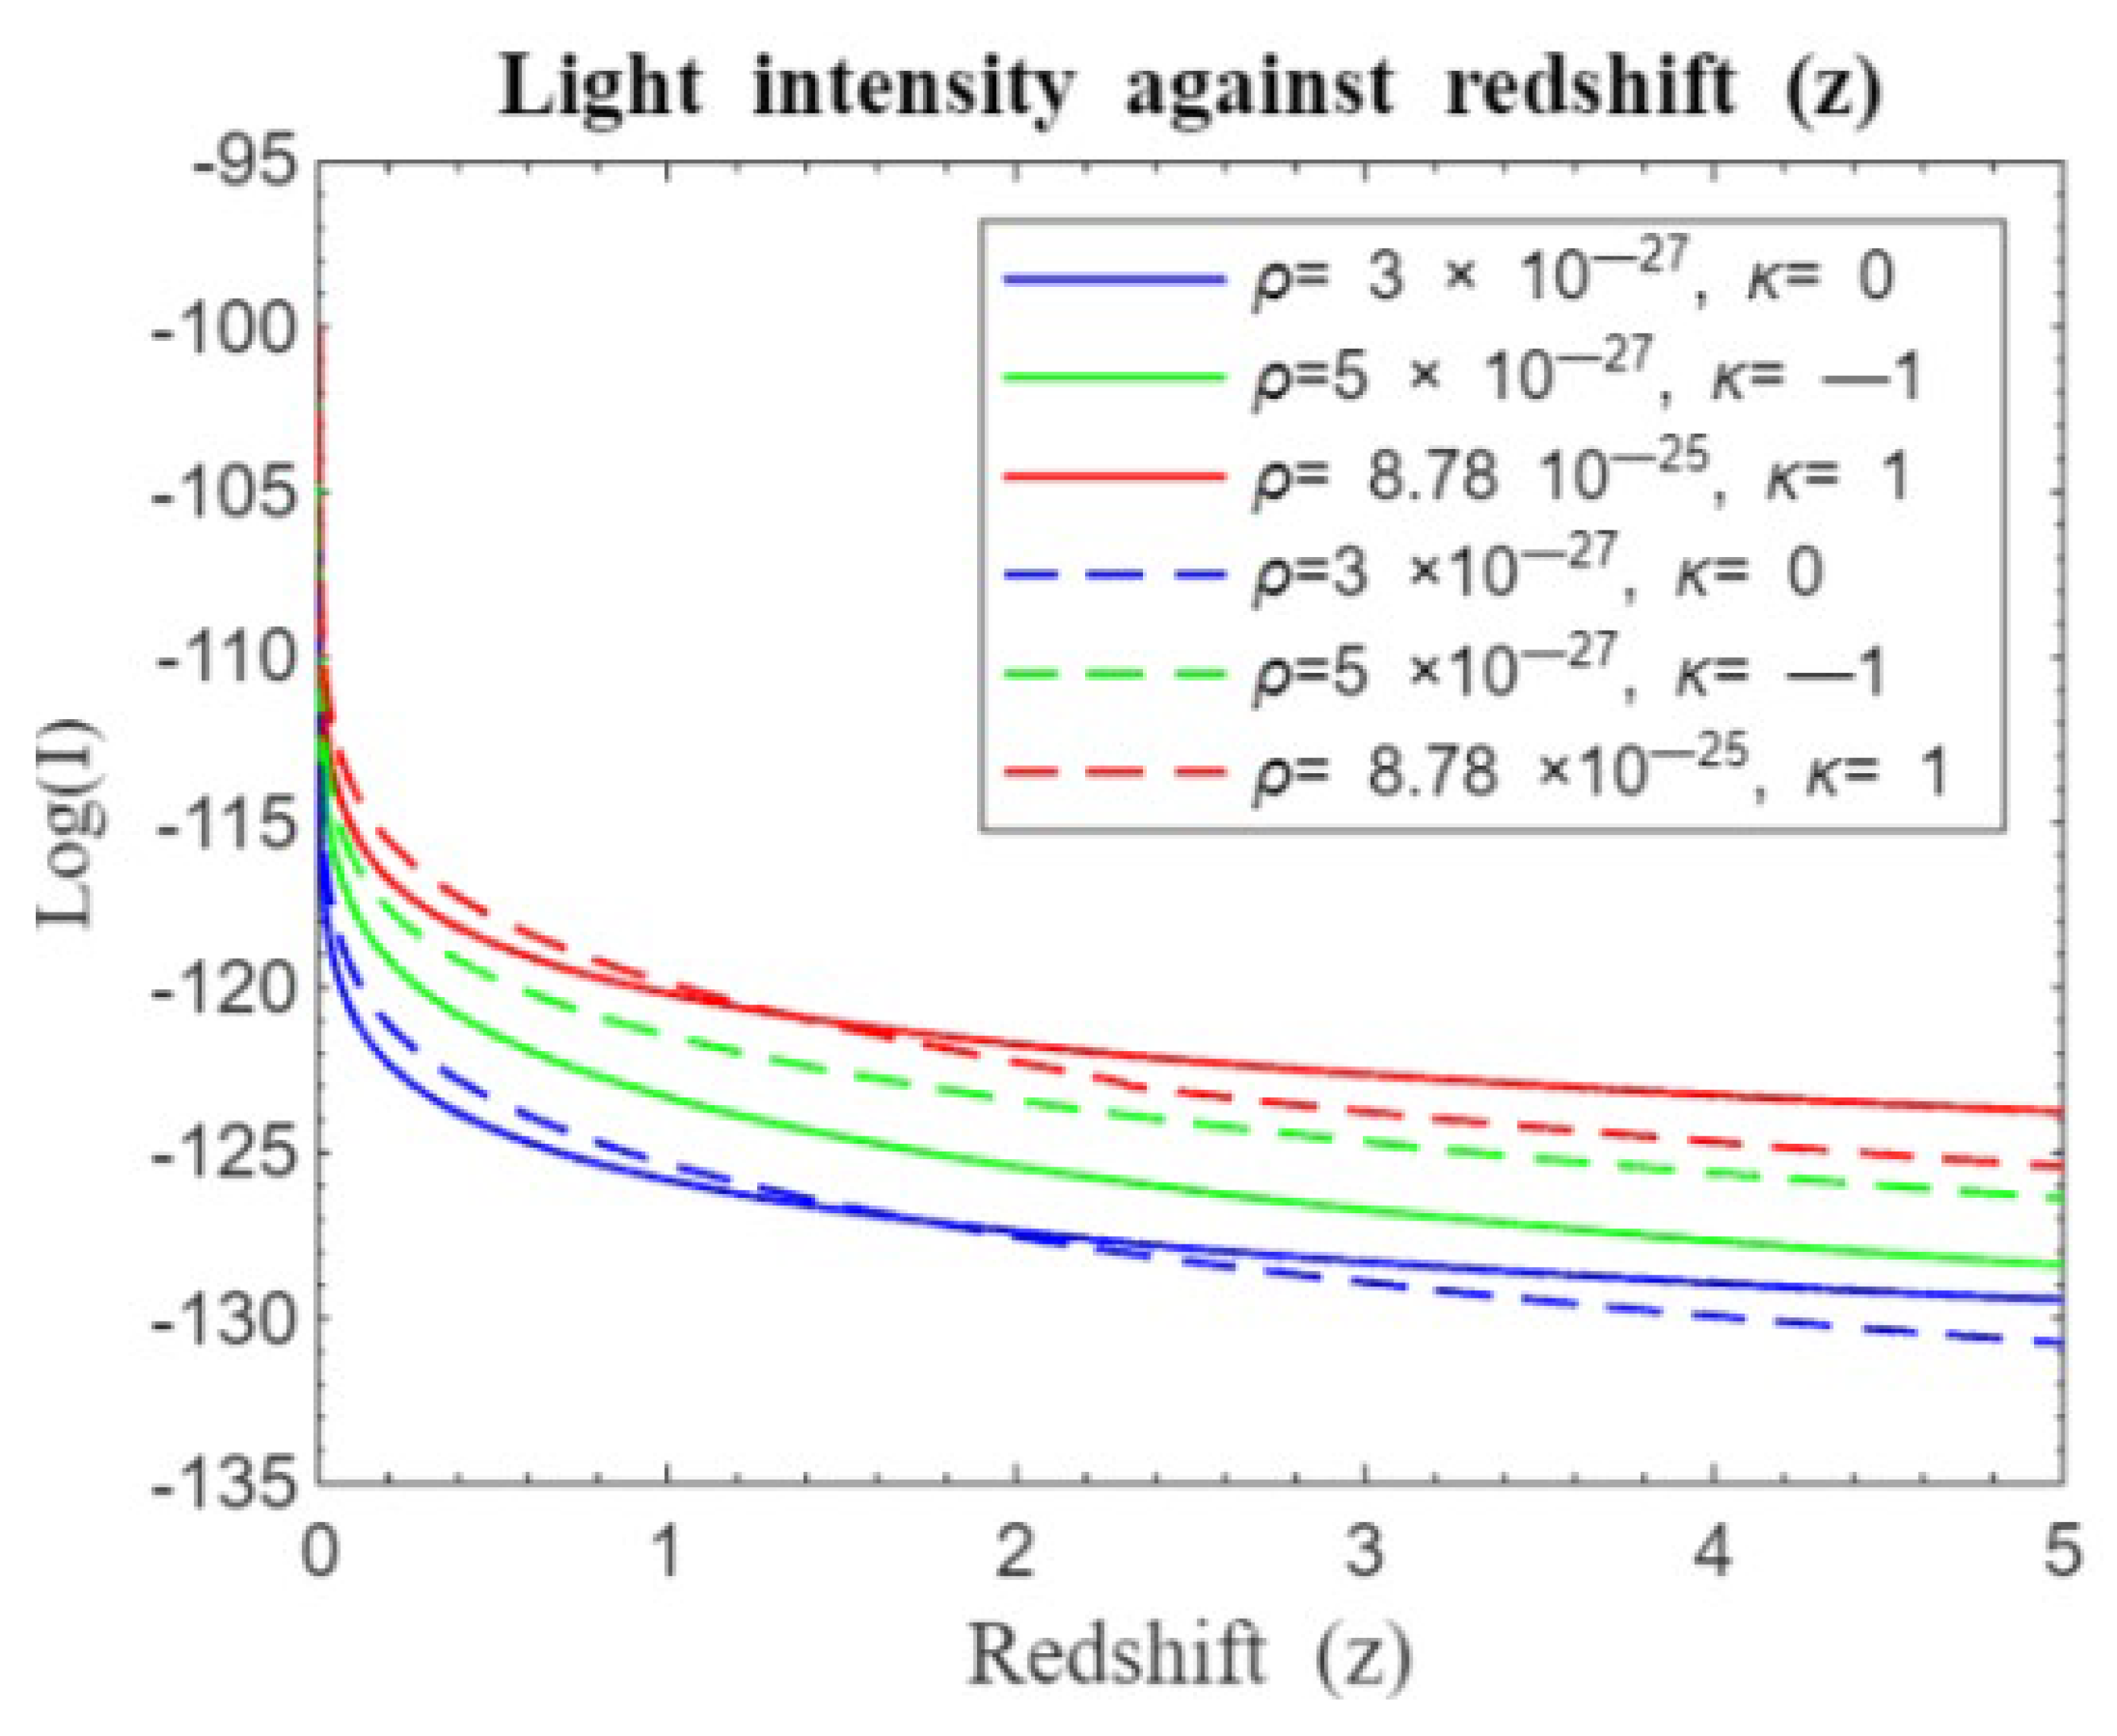
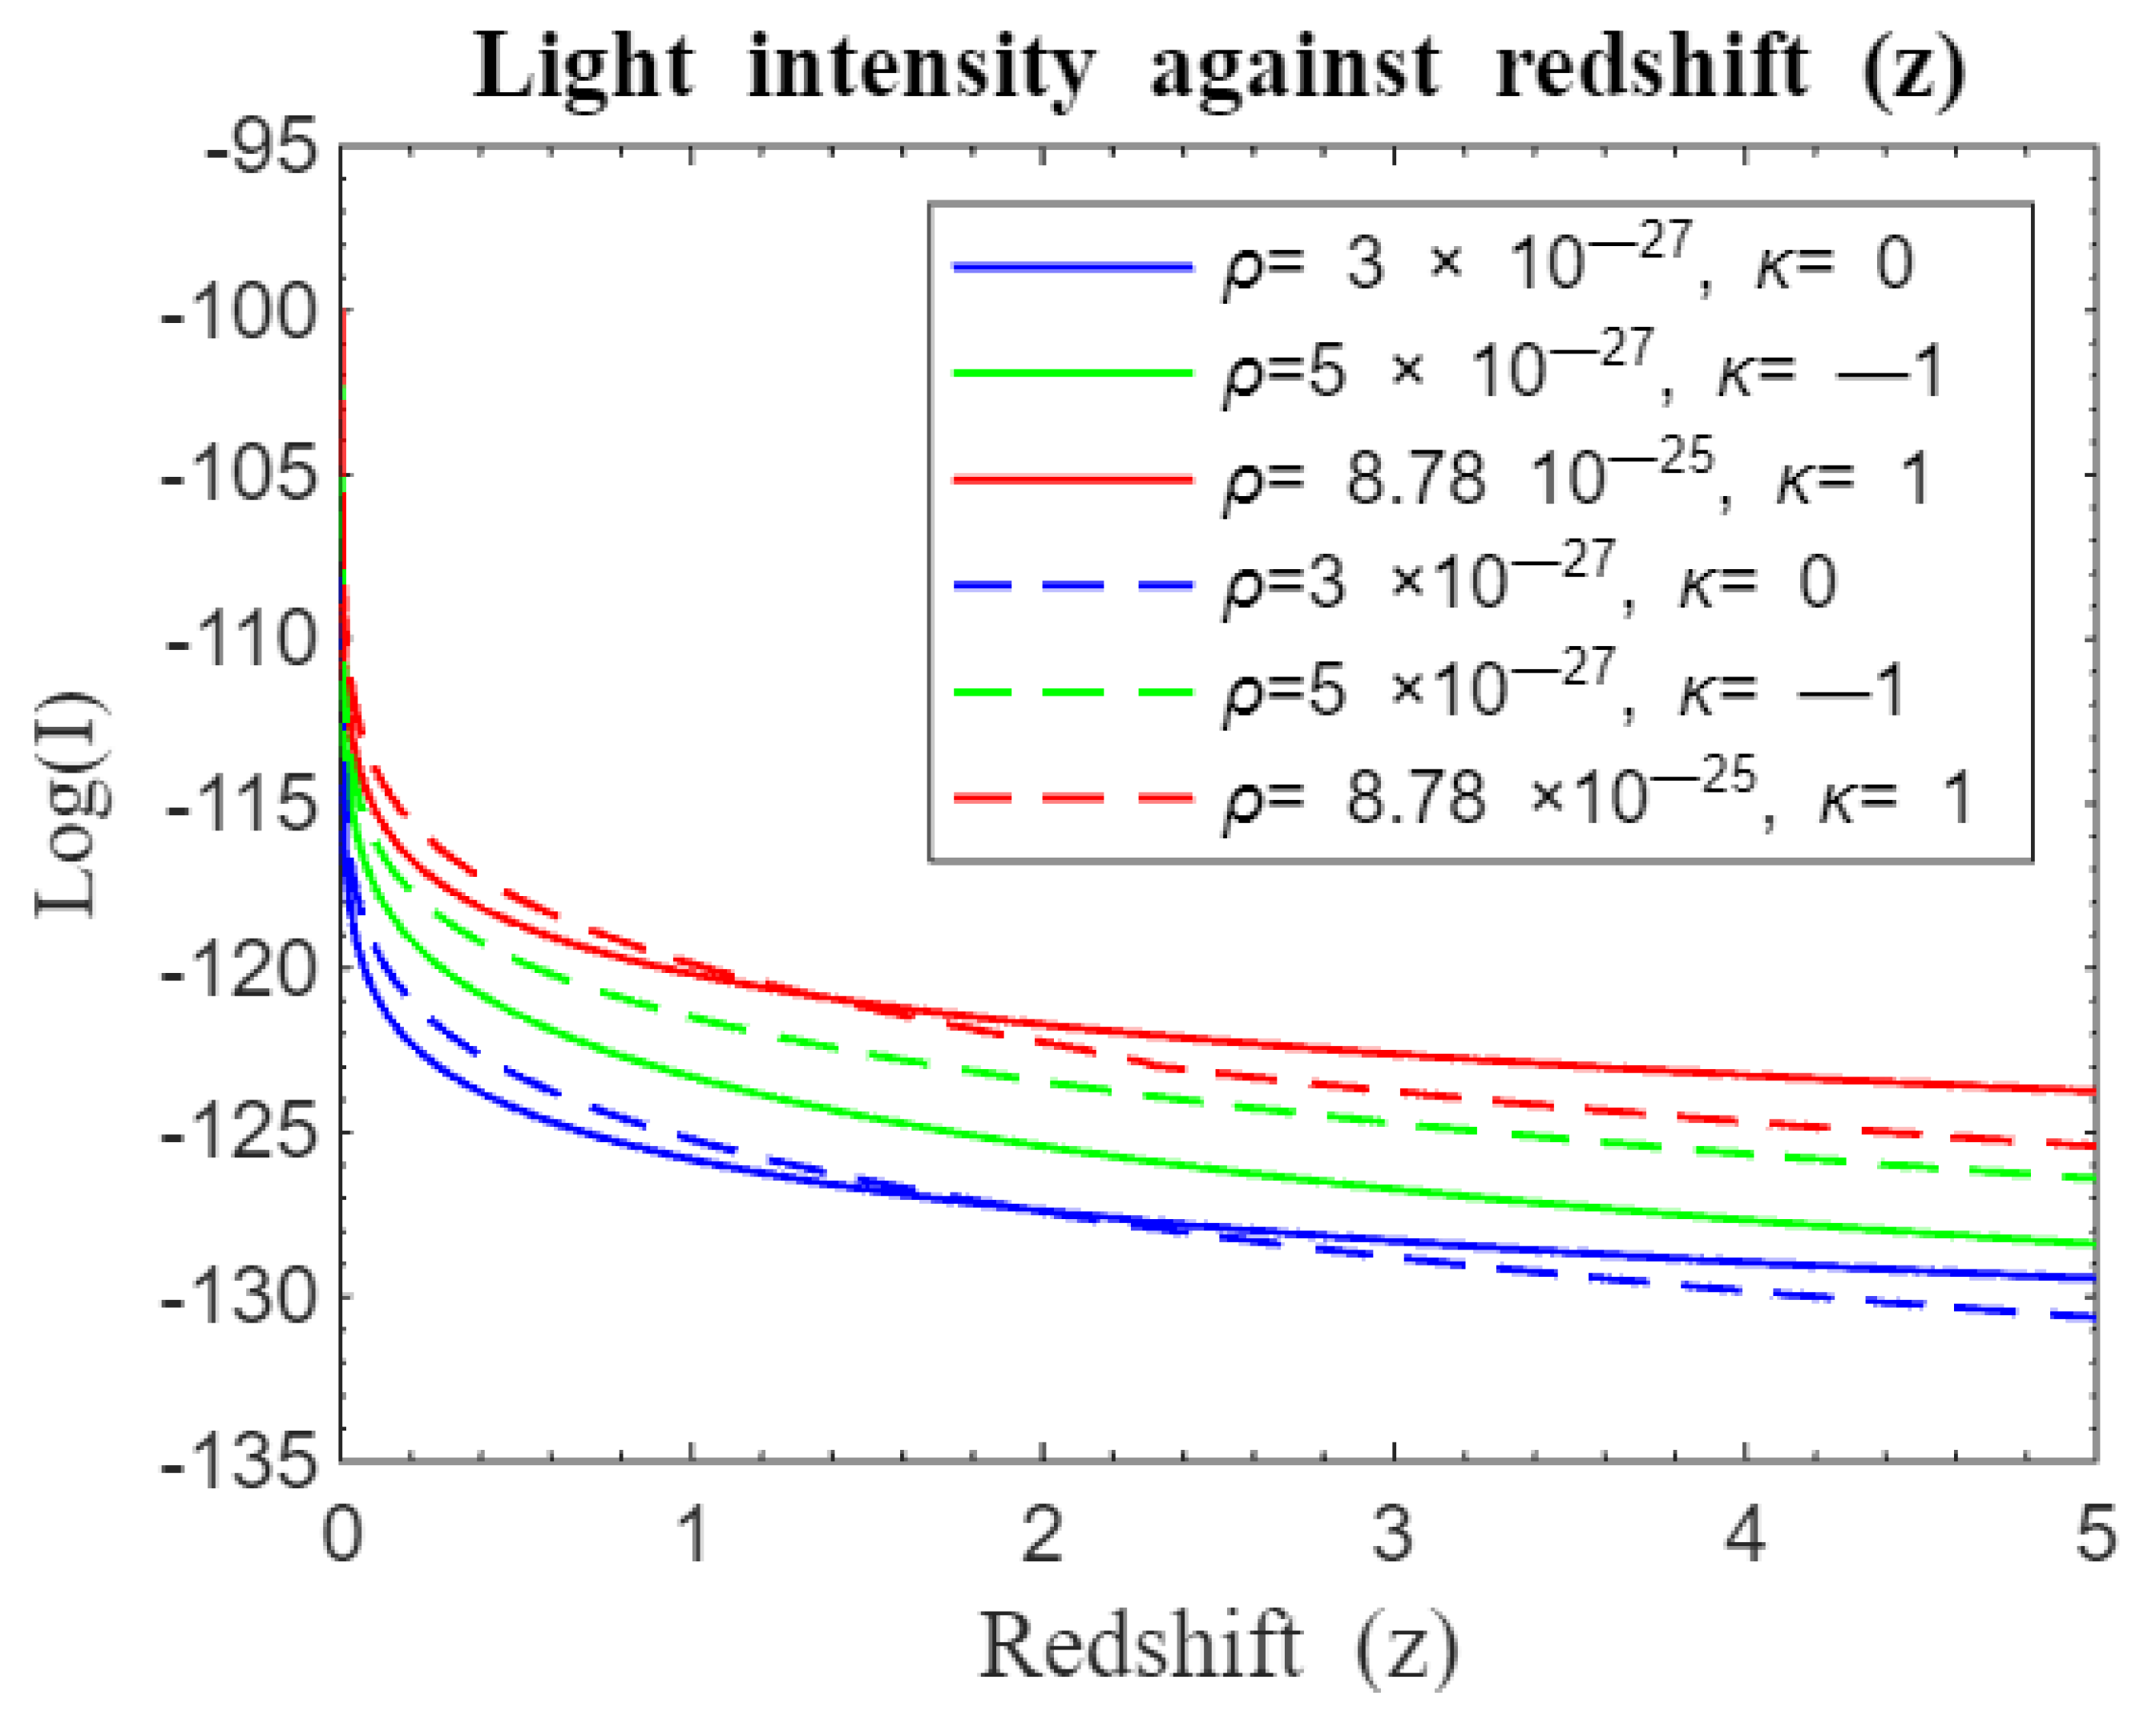
Figure 14 show the relationship between light intensity and redshift. The Y-axis (Log I) shows the logarithm of light intensity, where lower values correspond to reduced intensity. The X-axis (Redshift,
) tracks the evolution of the universe from its inception at
. Different initial values of log(I) across the curves indicate varying light intensities based on the universe's density
and curvature
.
4.2. Number Density Redshift Relation
Figure 15,
Figure 16,
Figure 17,
Figure 18,
Figure 19,
Figure 20,
Figure 21,
Figure 22,
Figure 23,
Figure 24,
Figure 25,
Figure 26,
Figure 27 and
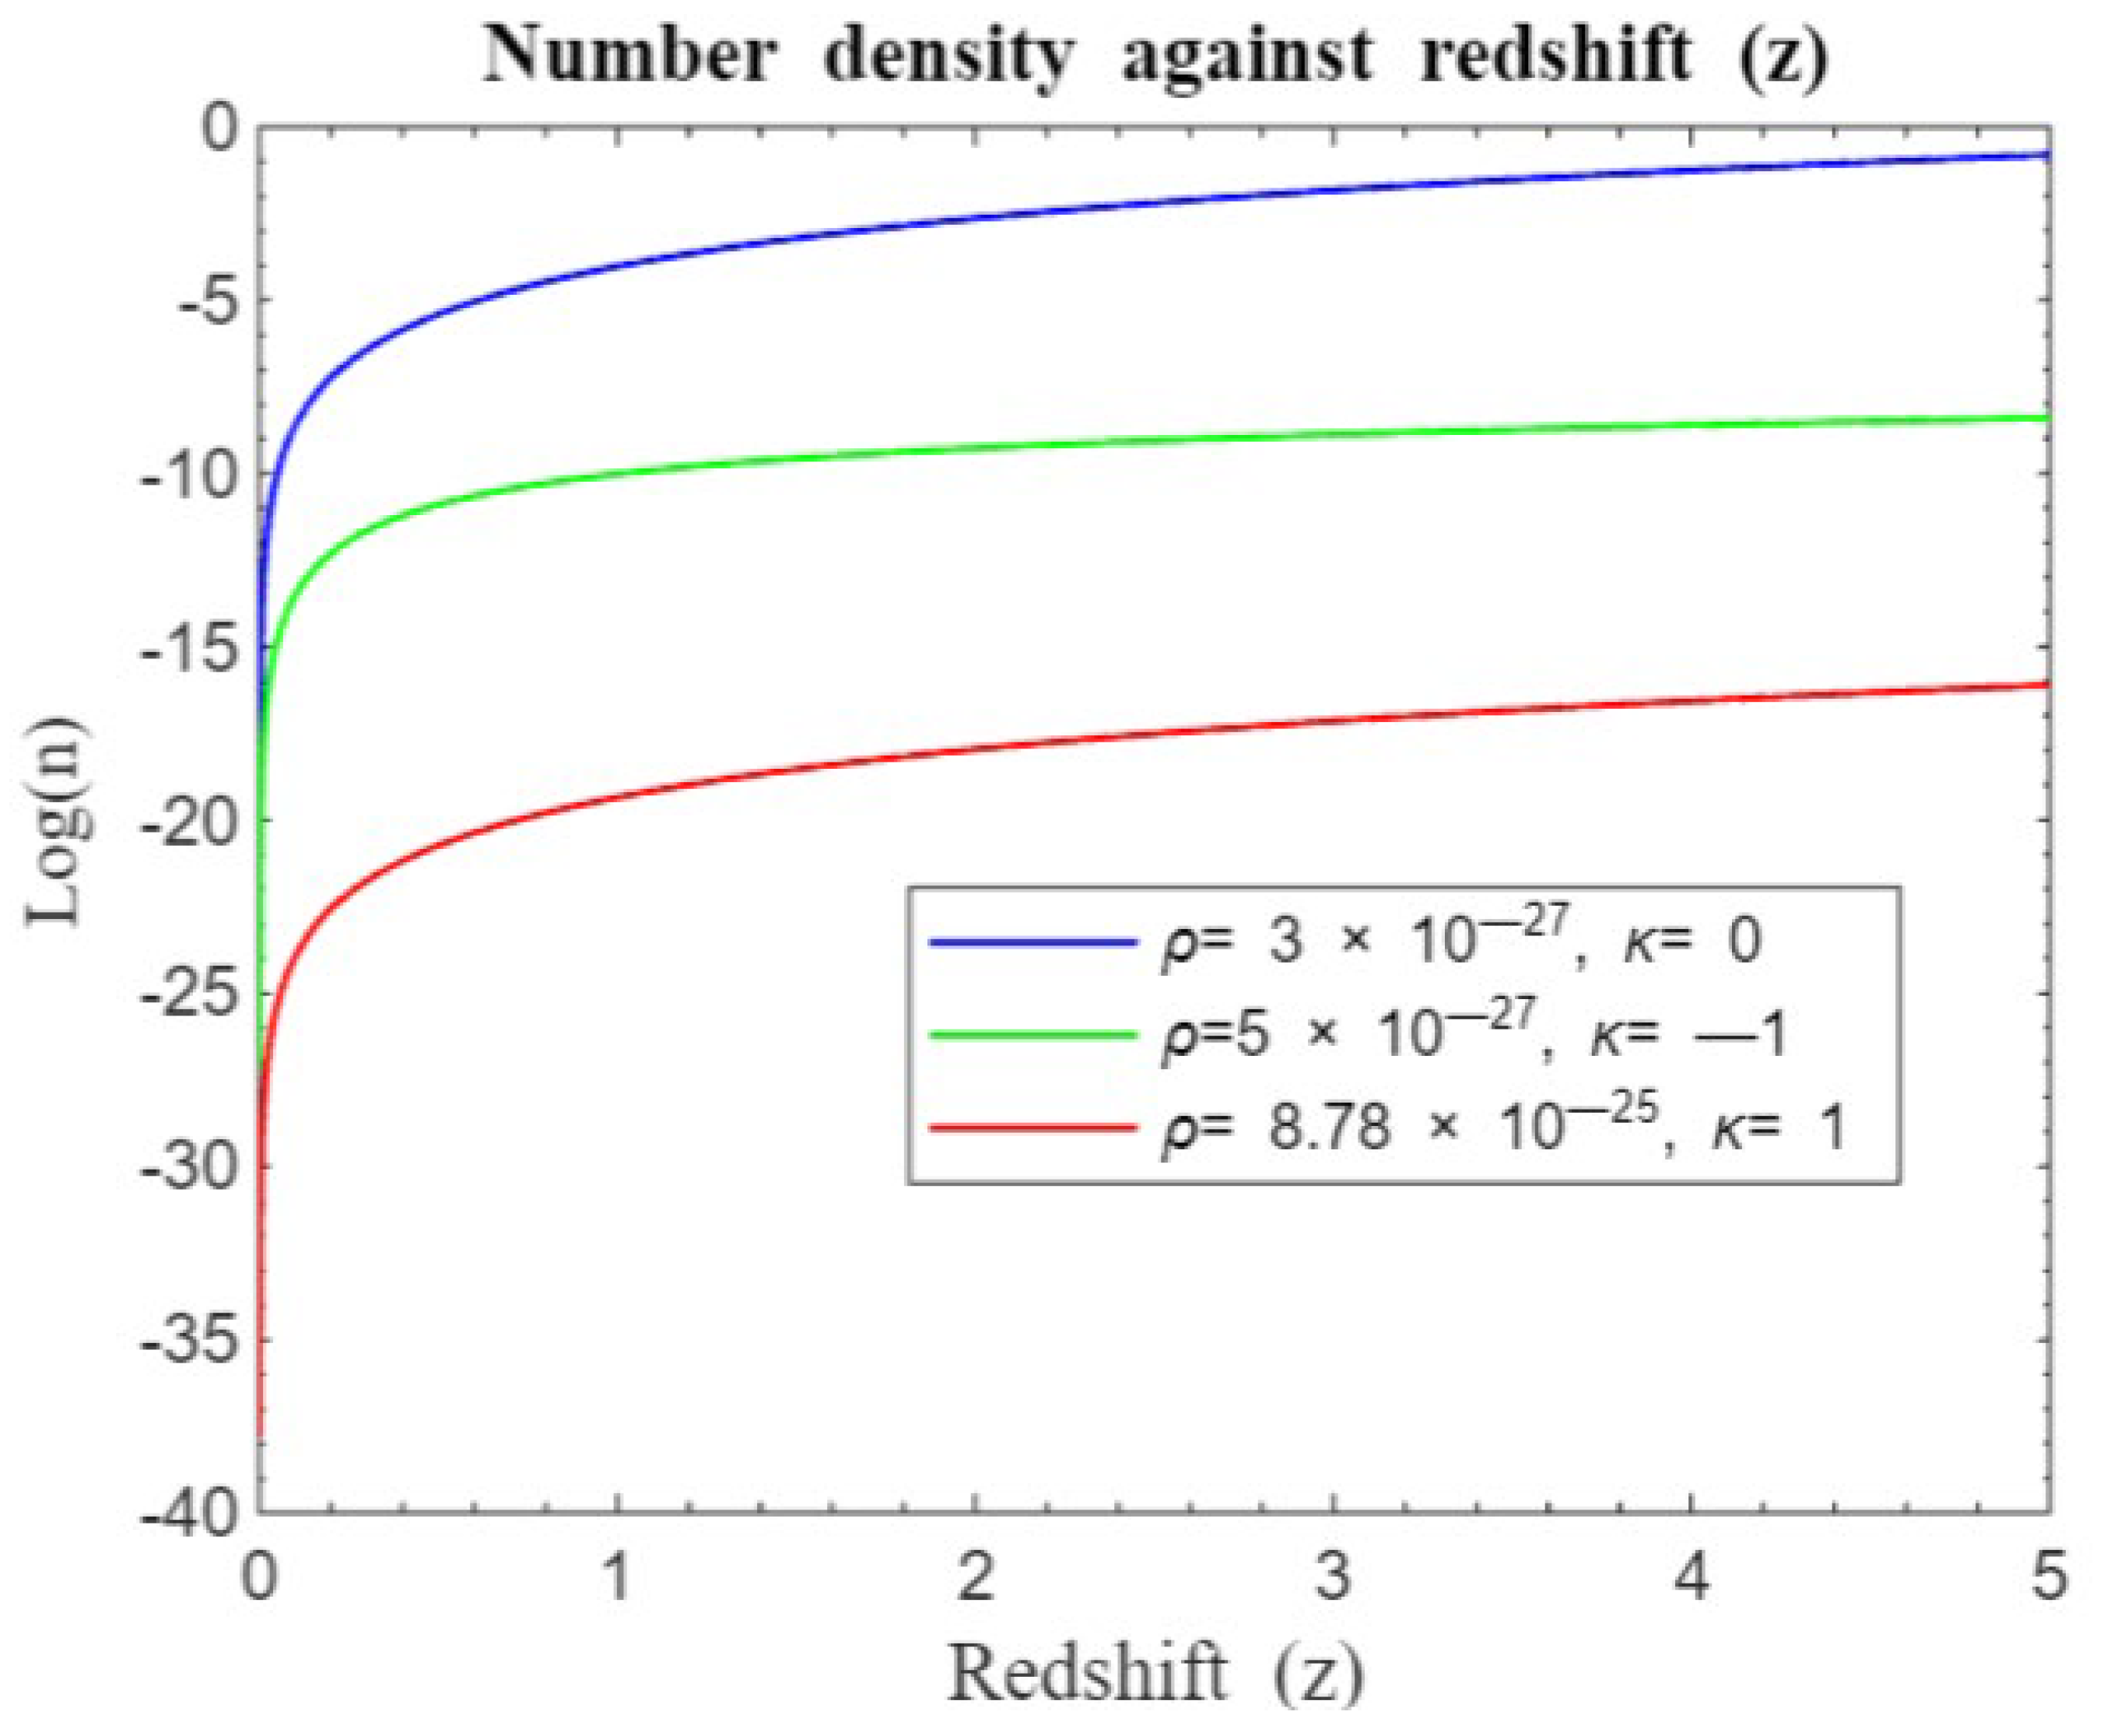
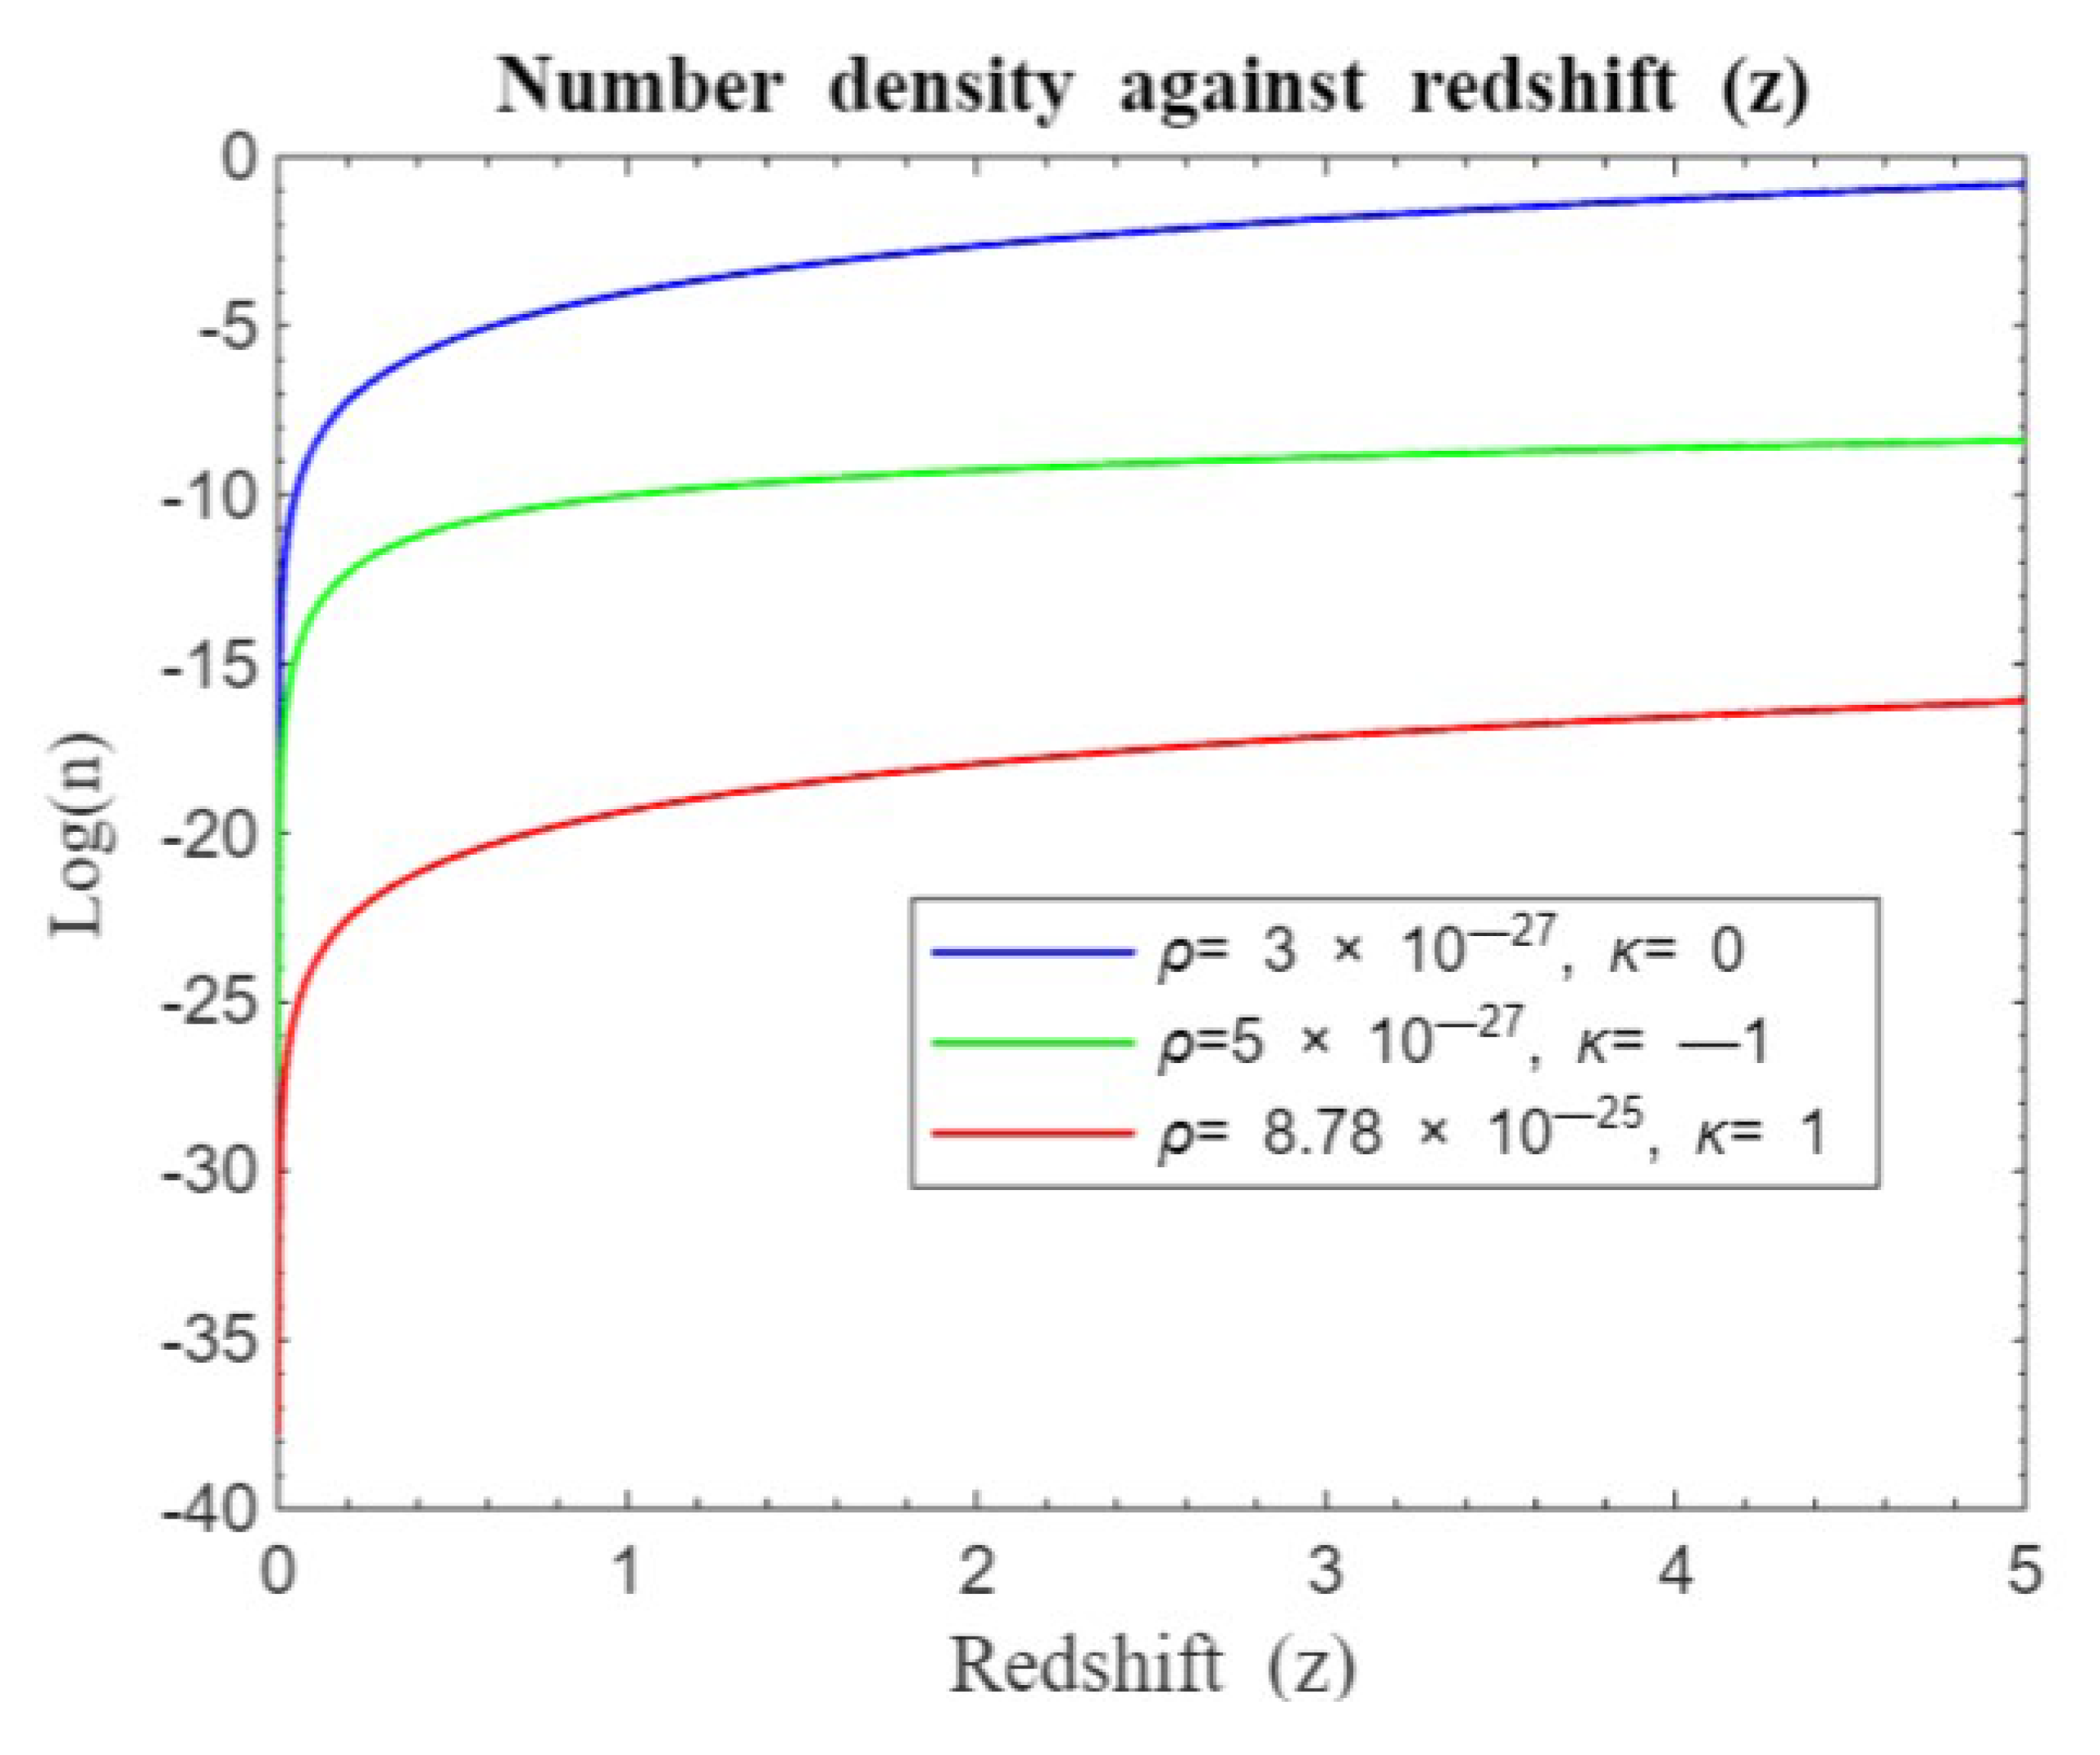
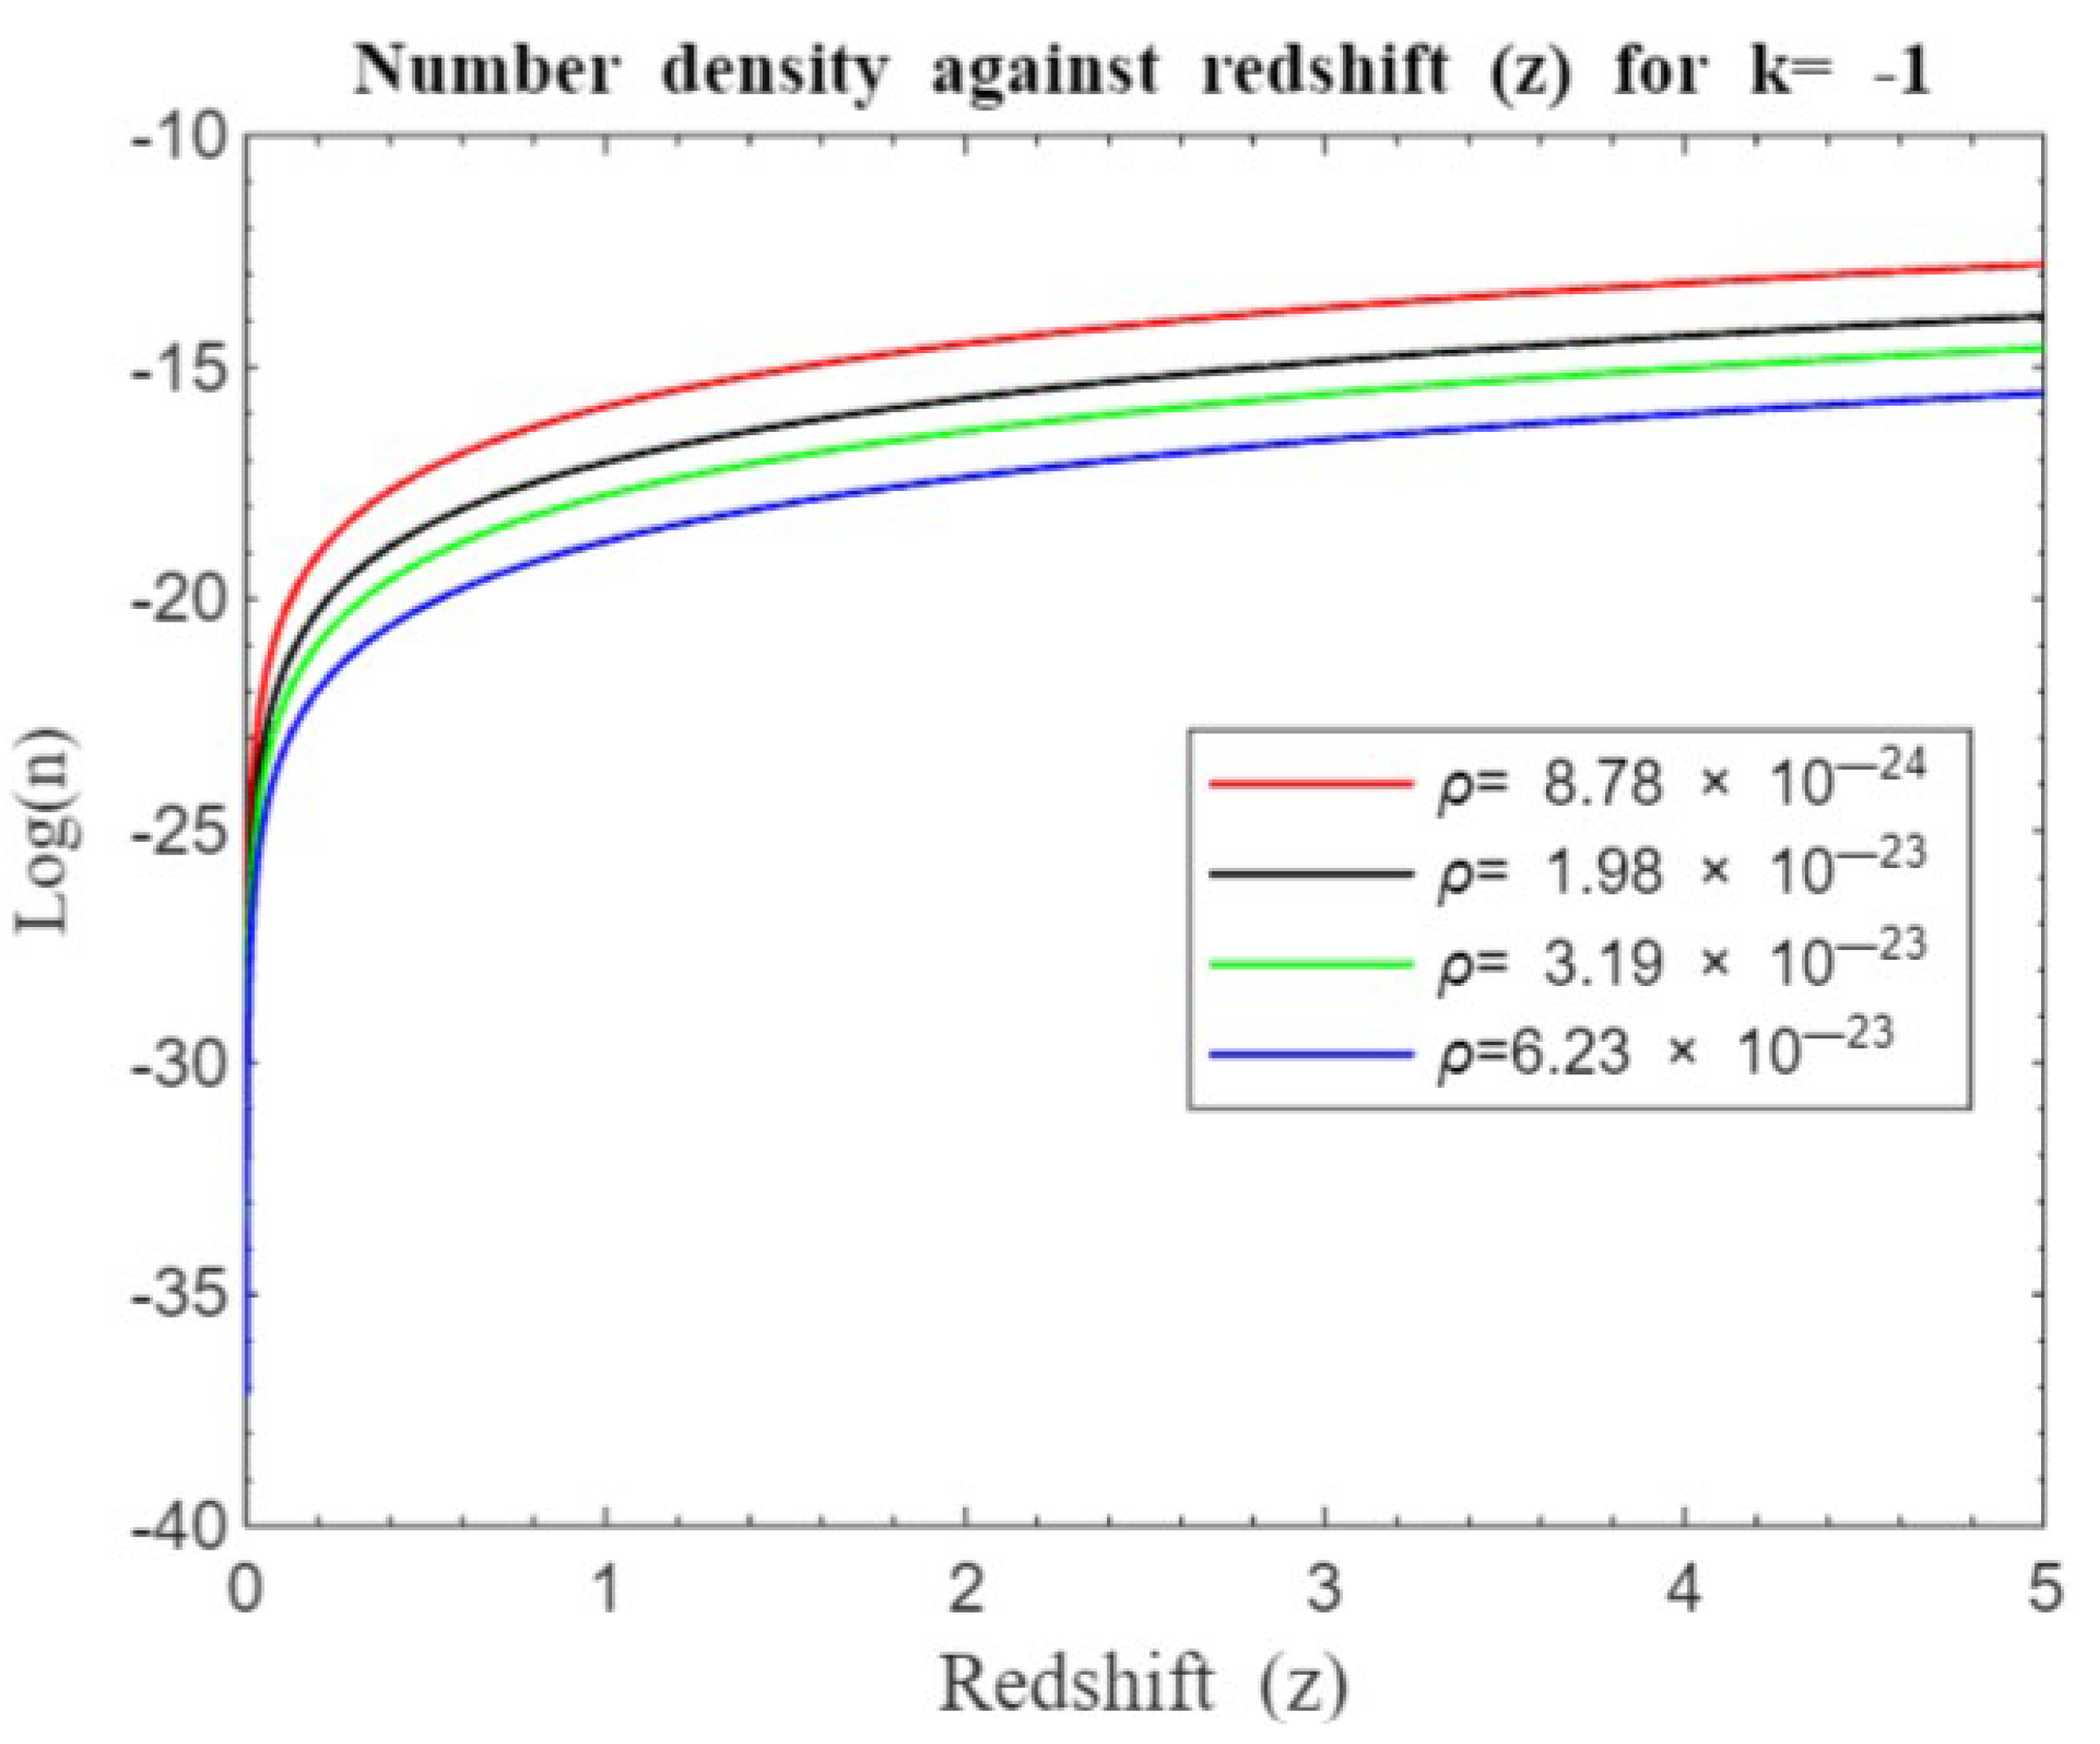
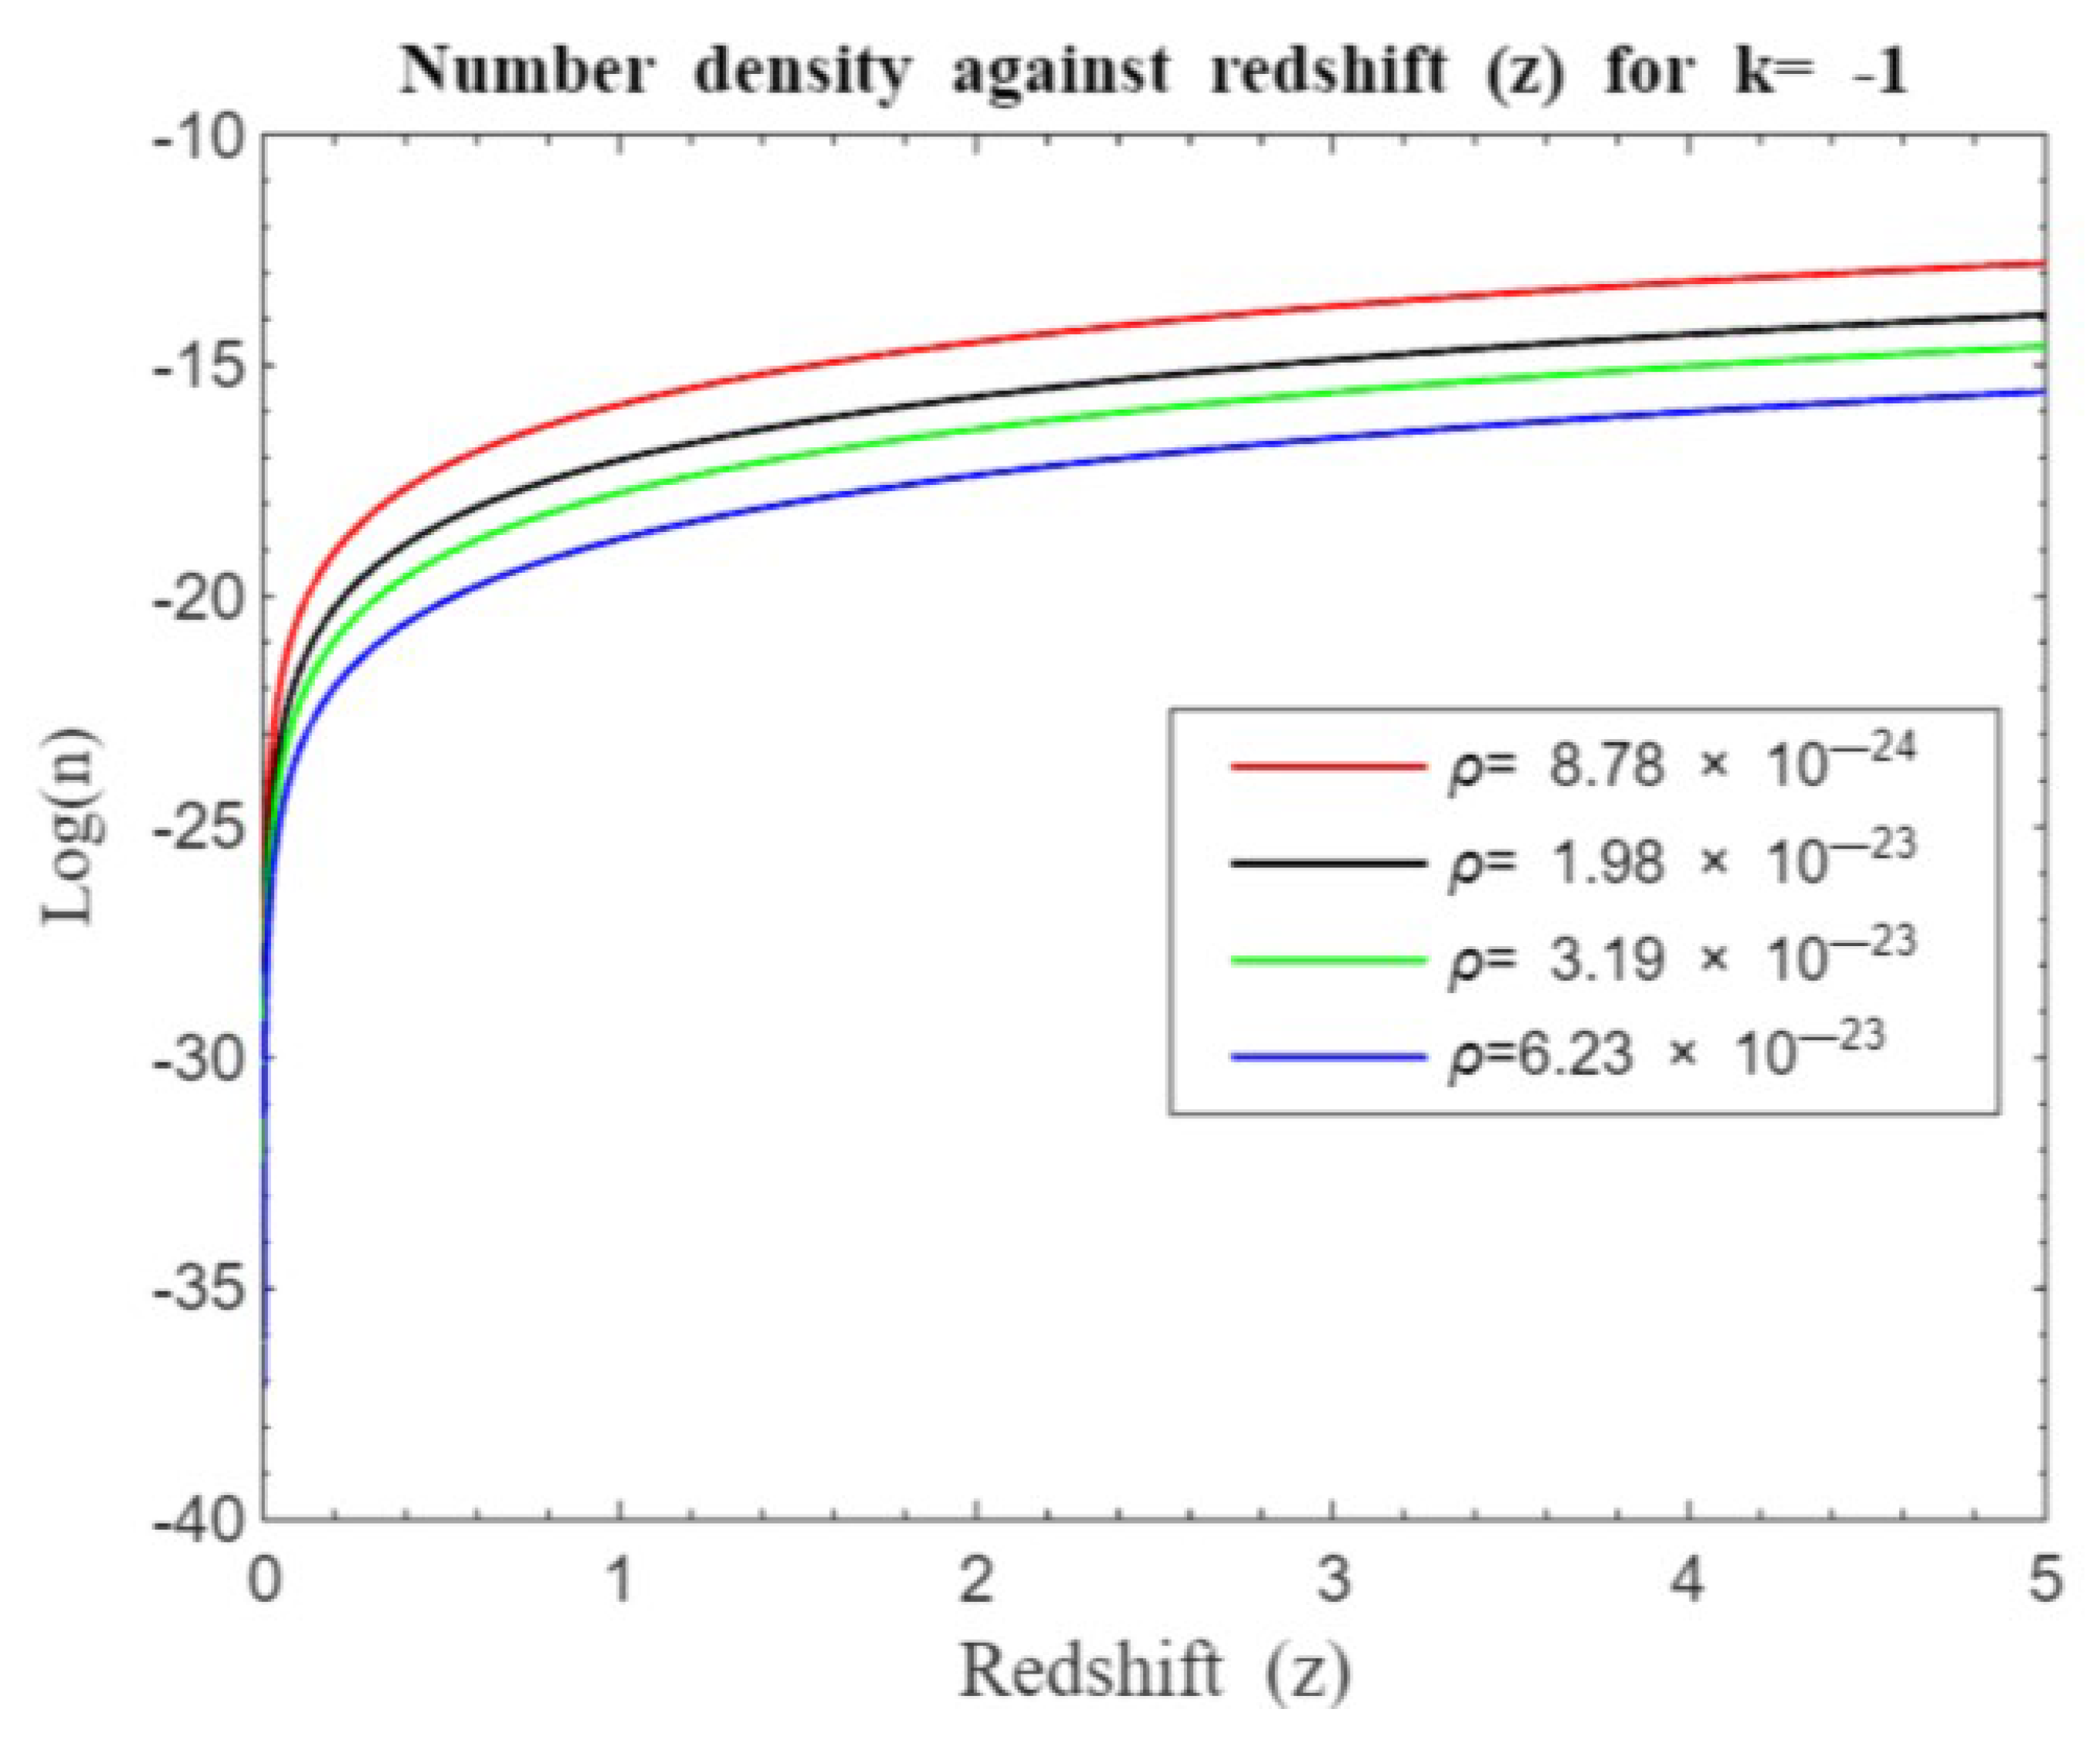
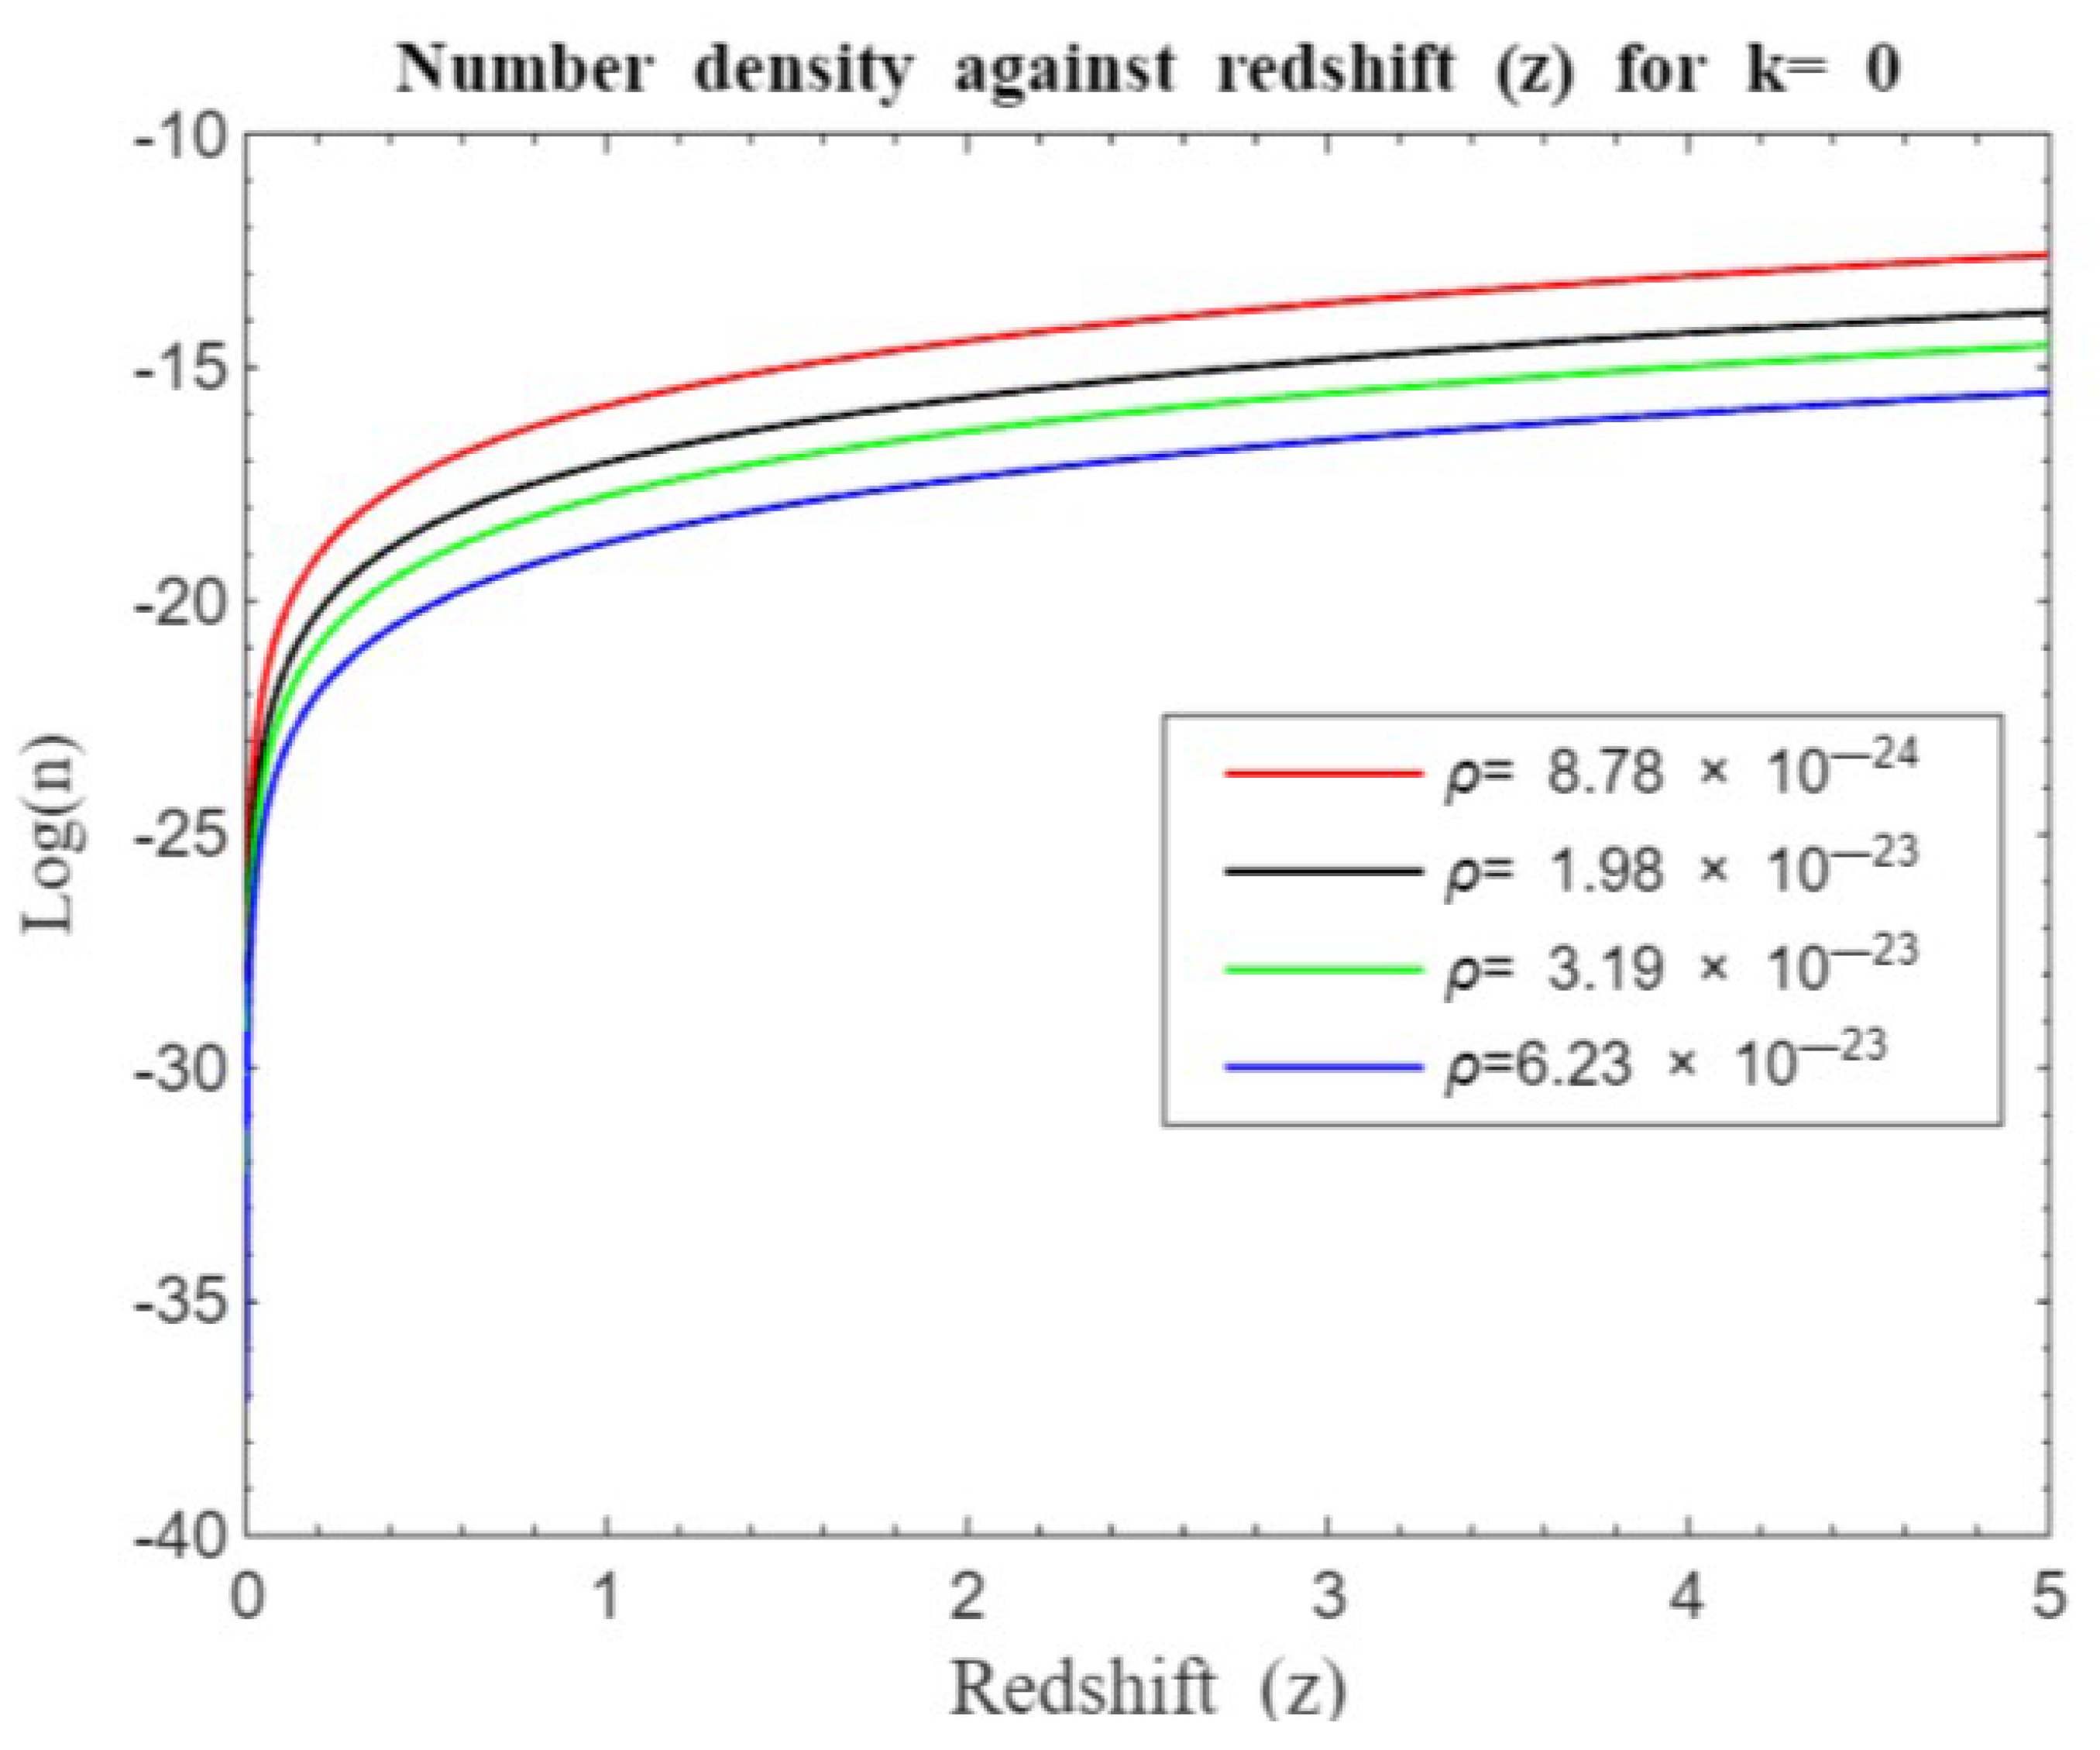
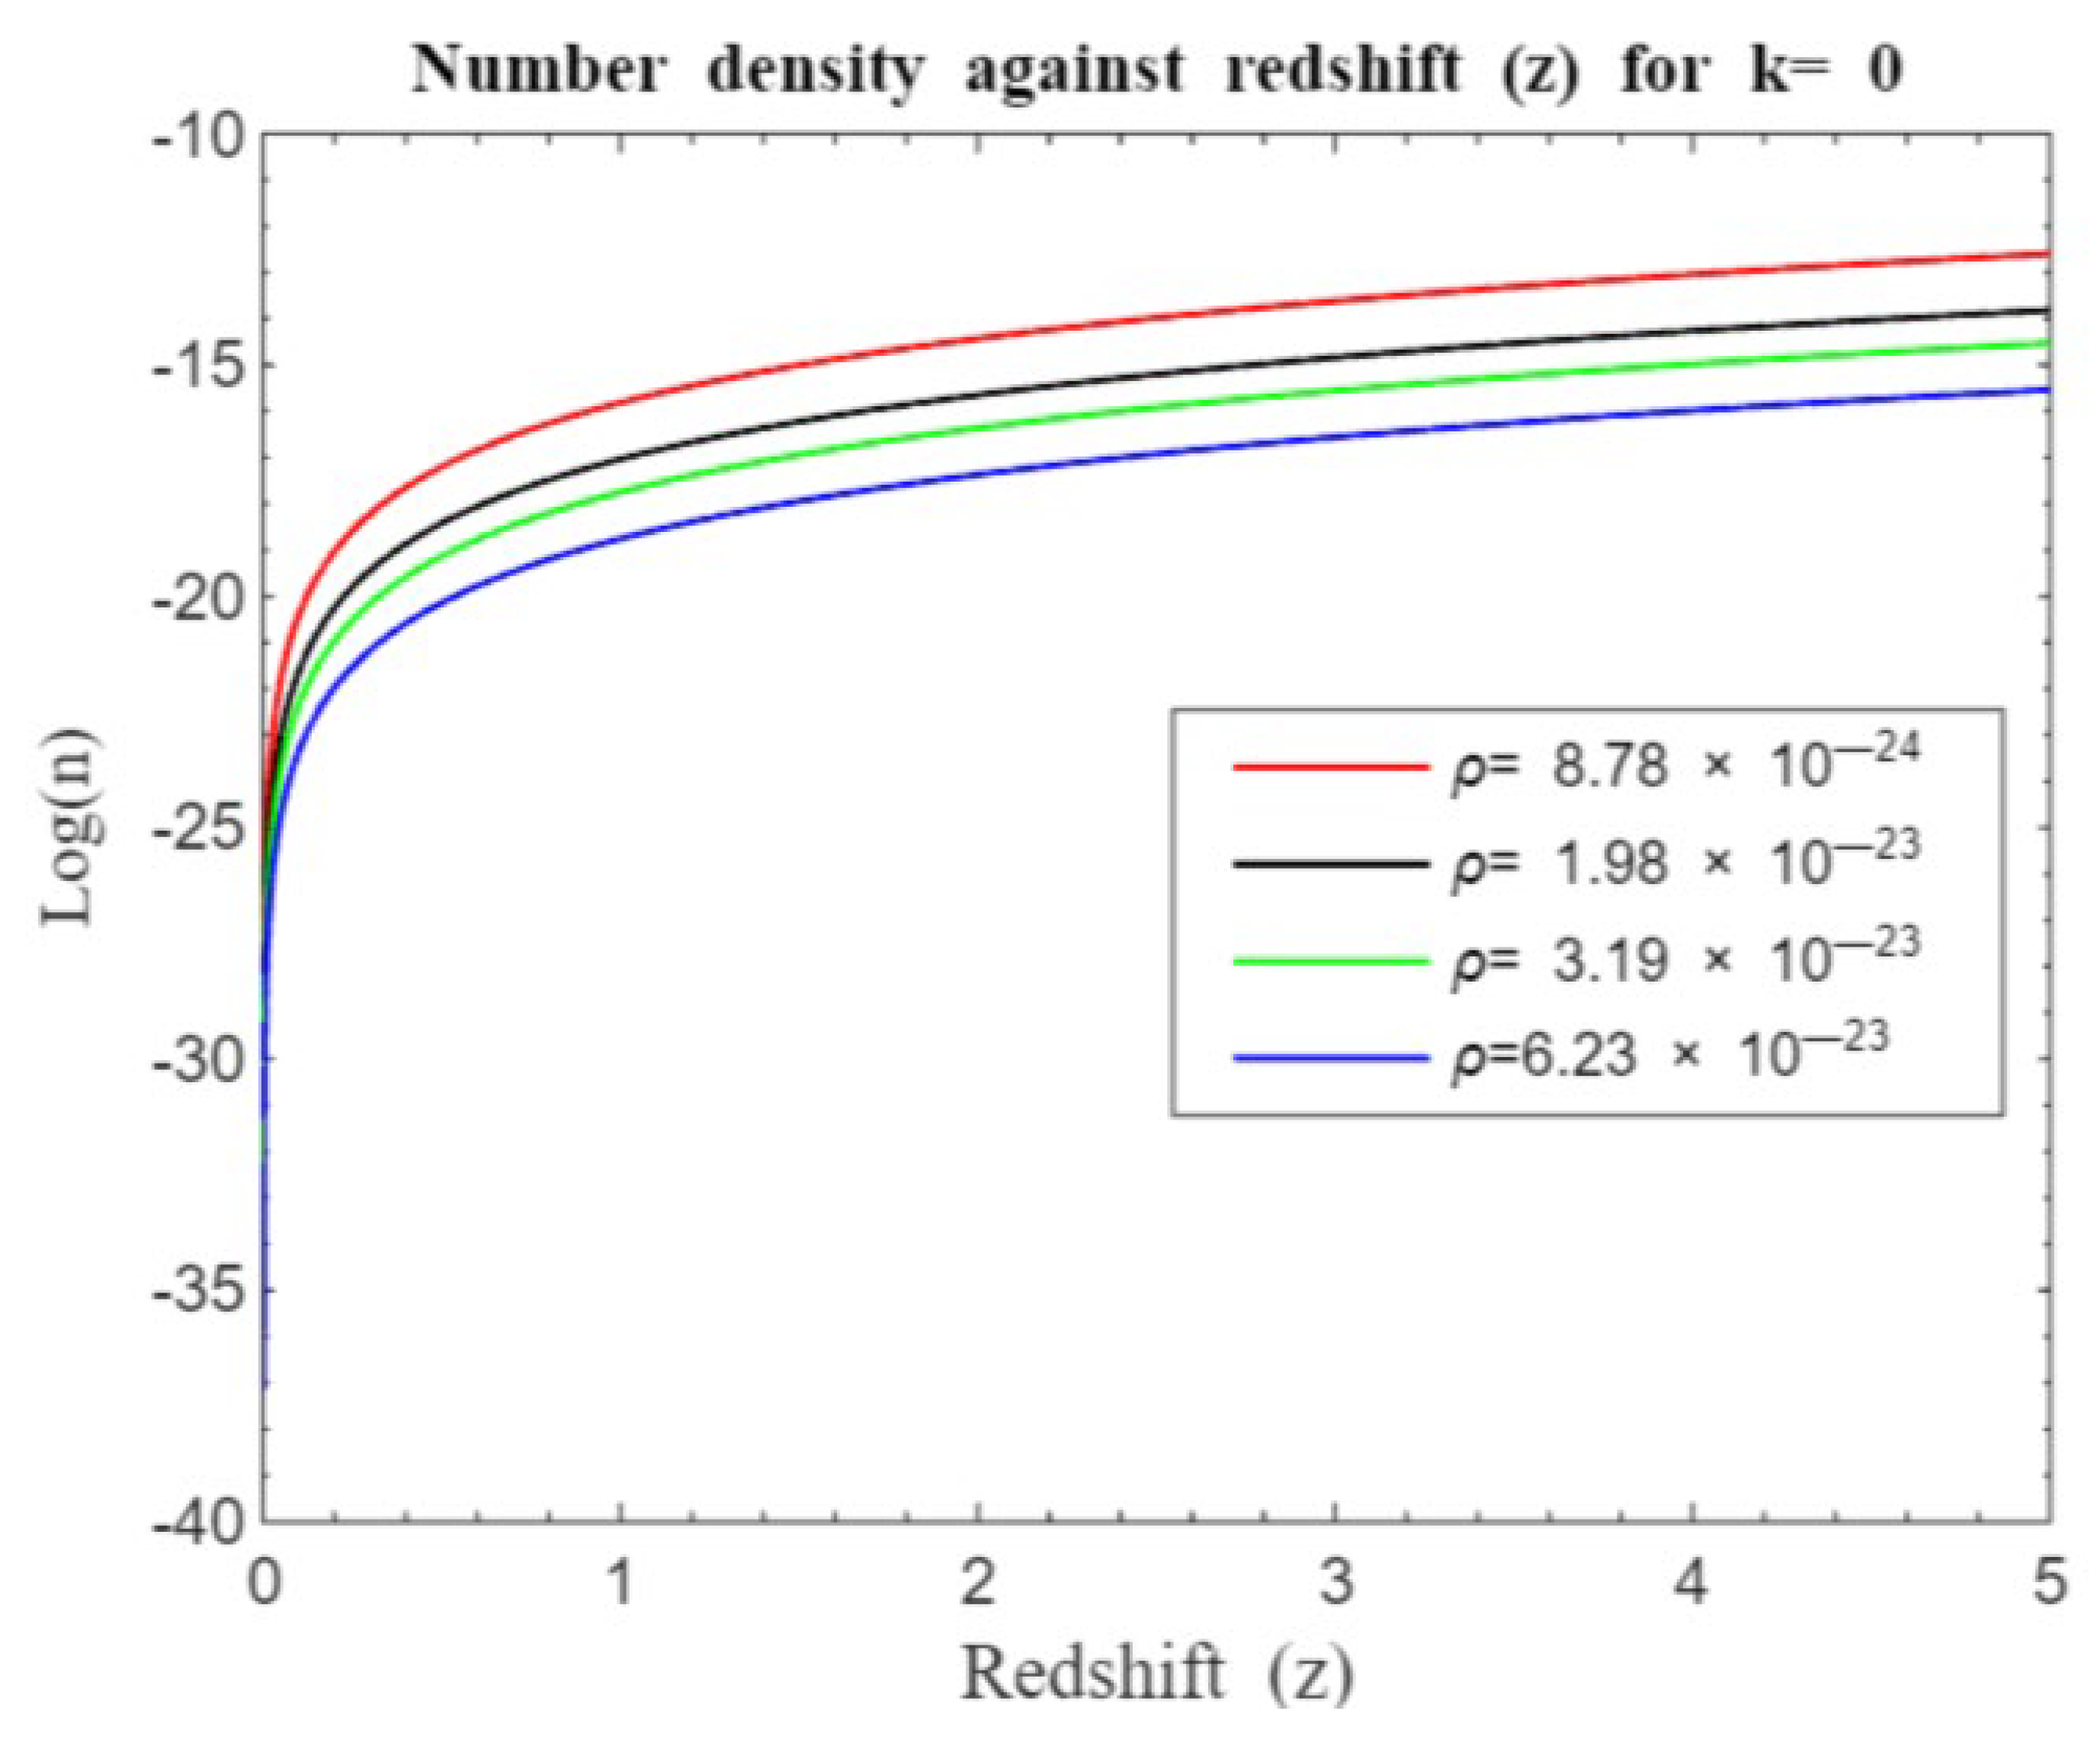
Figure 28 show the evolution of galaxy number density,
in relation to redshift
, as described by equation (17). The Y-axis (Log n) shows the logarithm of number density, where lower values correspond to reduced density. The X-axis (Redshift,
) tracks the evolution of the universe from its inception at
. Different initial values of Log(n) across the curves indicate varying number densities based on the density (
) of the universe and its curvature,
.
5. Discussion
5.1. Light Intensity Redshift Relation
In cosmological studies, the relationship between light intensity and redshift is a crucial indicator of galaxy formation and the evolution of large-scale structures. Let us consider the relationship between light intensity and redshift in light of structure formation.
Figure 1-14 demonstrates an exponential decay in light intensity with increasing redshift, consistent with classical theory. This decay results from the dilution of photons as the universe expands. As the universe grows, the wavelengths of photons stretch, causing a decrease in their energy density. This effect arises because the number of photons remains constant while they are distributed over an increasingly larger volume [
7,
8,
21,
22].
Figure 1 and
Figure 2 compare light intensity-redshift relationships under different geometries, both without and with the cosmological constant. These Figures reveal that in a flat universe, light intensity decays more rapidly compared to an open or closed universe.
Figure 3,
Figure 4,
Figure 5,
Figure 6,
Figure 7 and
Figure 8 illustrate how light intensity changes with redshift across various densities and curvatures. A significant drop in intensity is observed at redshifts
, with a more gradual decline at higher redshifts. At lower redshifts, the universe is relatively young, which influences intensity. As redshift increases, light comes from increasingly distant regions. The slower intensity decay at higher redshifts may result from cumulative factors like distance, cosmic expansion, and the evolving structure of the universe, reflecting the intricate interplay of spatial distance, temporal evolution, and cosmic morphology (Riess et al., 1998).
In a universe with positive curvature, a closed model akin to a spherical structure is represented. Here, we still observe light attenuation with increase in redshift. A case of positive curvature points to a closed universe whose 3-D space is similar to the surface of a sphere in which the r-sphere wipes out the entire universe leaving it unbounded as the coordinates of the sphere varies from 1 to 0. We observe that light curves seem not to converge for positive curvature according to our model in contrast to earlier works [
12,
20]. As the redshift parameter (
) increases, these geometric differences become more pronounced, showing how curvature affects light behavior. In all geometries, light intensity curves decay more rapidly at lower densities compared to higher densities.
Figure 9,
Figure 10,
Figure 11,
Figure 12,
Figure 13 and
Figure 14 compare our model with those from previous studies [
12,
20]. These Figures show that high-density universes consistently exhibit higher initial light intensity at early times, regardless of the model. This implies that a denser universe leads to stronger early cosmic structures with higher light intensity. The gradual decline over time in such models suggest that denser universes, with stronger gravitational influences, retain light longer due to slower expansion rates. In contrast, a flat universe
shows moderate initial intensity and a steady decrease, while an open universe
exhibits a lower initial intensity and rapid decline, indicating that accelerated expansion reduces observable light intensity quickly. A closed universe
shows higher initial intensity and a more prolonged decline, reflecting a slower expansion rate.
Figure 9 and
Figure 10 compares our standard Friedmann redshift model with the approximate standard Friedmann redshift model proposed by Langa et al. (2017).
Figure 10, which includes the cosmological constant, highlights the role of dark energy. Dark energy is known to accelerate the universe's expansion [
13,
14] . The approximate standard Friedmann redshift model suggests that early cosmic structures had higher initial light intensities with a slower decline, indicating that matter's gravitational influence moderate expansion and preserves light intensity. In contrast, the standard Friedmann redshift model shows lower initial light intensity and a more rapid decline, implying that insufficient matter to stabilize the expansion leads to faster reduction in light from early structures.
Further comparison with Nyagisera et al. (2024), who modified the approximate standard Friedmann redshift model with non-parametric (
Figure 11 and
Figure 12) and parametric (
Figure 13 and
Figure 14) redshift functions, provides additional insights.
Figure 11 and
Figure 12 show that light attenuation is more pronounced in the standard Friedmann redshift model compared to the modified standard Friedmann redshift nonparametric model. Even without dark energy, as indicated by the absence of a cosmological constant, the universe still experiences accelerated expansion, suggesting a significant role of dark matter in driving expansion and redshifting of light [
12].
Figure 13 and
Figure 14 exhibit similar trends in light attenuation with increasing redshift, particularly between redshifts 0 and 1, where attenuation is rapid for flat and closed geometries except in open geometry where our model attenuates slower than parametric model. The standard Friedmann redshift model shows faster attenuation compared to the modified standard Friedmann redshift parametric model, potentially due to factors like photon-electron recombination, Thomson scattering, or accelerated expansion. The absence of a cosmological constant in
Figure 13 implies that dark matter may primarily be responsible for driving accelerated expansion, overshadowing the cosmological constant's effects.
5.2. Number Density Redshift Relation
The number density redshift relation helps astronomers understand how the number of galaxies changes over time. By studying how galaxy number density evolves with redshift, scientists can infer the processes of galaxy formation, growth, and the effects of cosmic expansion on galactic structures. We shall, in particular, focus on the processes of galaxy formation and evolution. Our overall simulations (see
Figure 15,
Figure 16,
Figure 17,
Figure 18,
Figure 19,
Figure 20,
Figure 21,
Figure 22,
Figure 23,
Figure 24,
Figure 25,
Figure 26,
Figure 27 and
Figure 28) show that the number density of galaxies generally rises at the beginning from
and grows at uneven rate until a plateau before declining, leveling or showing slight rate of increase regardless of the model used. In particular, our model in
Figure 15,
Figure 16,
Figure 17,
Figure 18,
Figure 19,
Figure 20,
Figure 21 and
Figure 22 show that there is rapid structure formation at the beginning of the universe for
which gradually rises up to around
before structure formation proceeds at a slower rate regardless of the curvature and density of the universe. However, our standard Friedmann redshift model shows that the presence of a cosmological constant seems not to have pronounced impact on structure formation showing that dark energy presence seem to have negligible effects on galaxy formation in contrast to earlier works [
20]. This may probably be because dark energy primarily affects the large-scale expansion of the universe rather than local gravitationally bound systems like galaxies or galaxy clusters. It is believed that on small scales, gravity, driven by dark matter and ordinary matter, dominates over the effects of dark energy. However, the effect of dark matter seems to go beyond small-scale influence and dominates over dark energy for all redshift ranges as far as our model investigation is concerned.
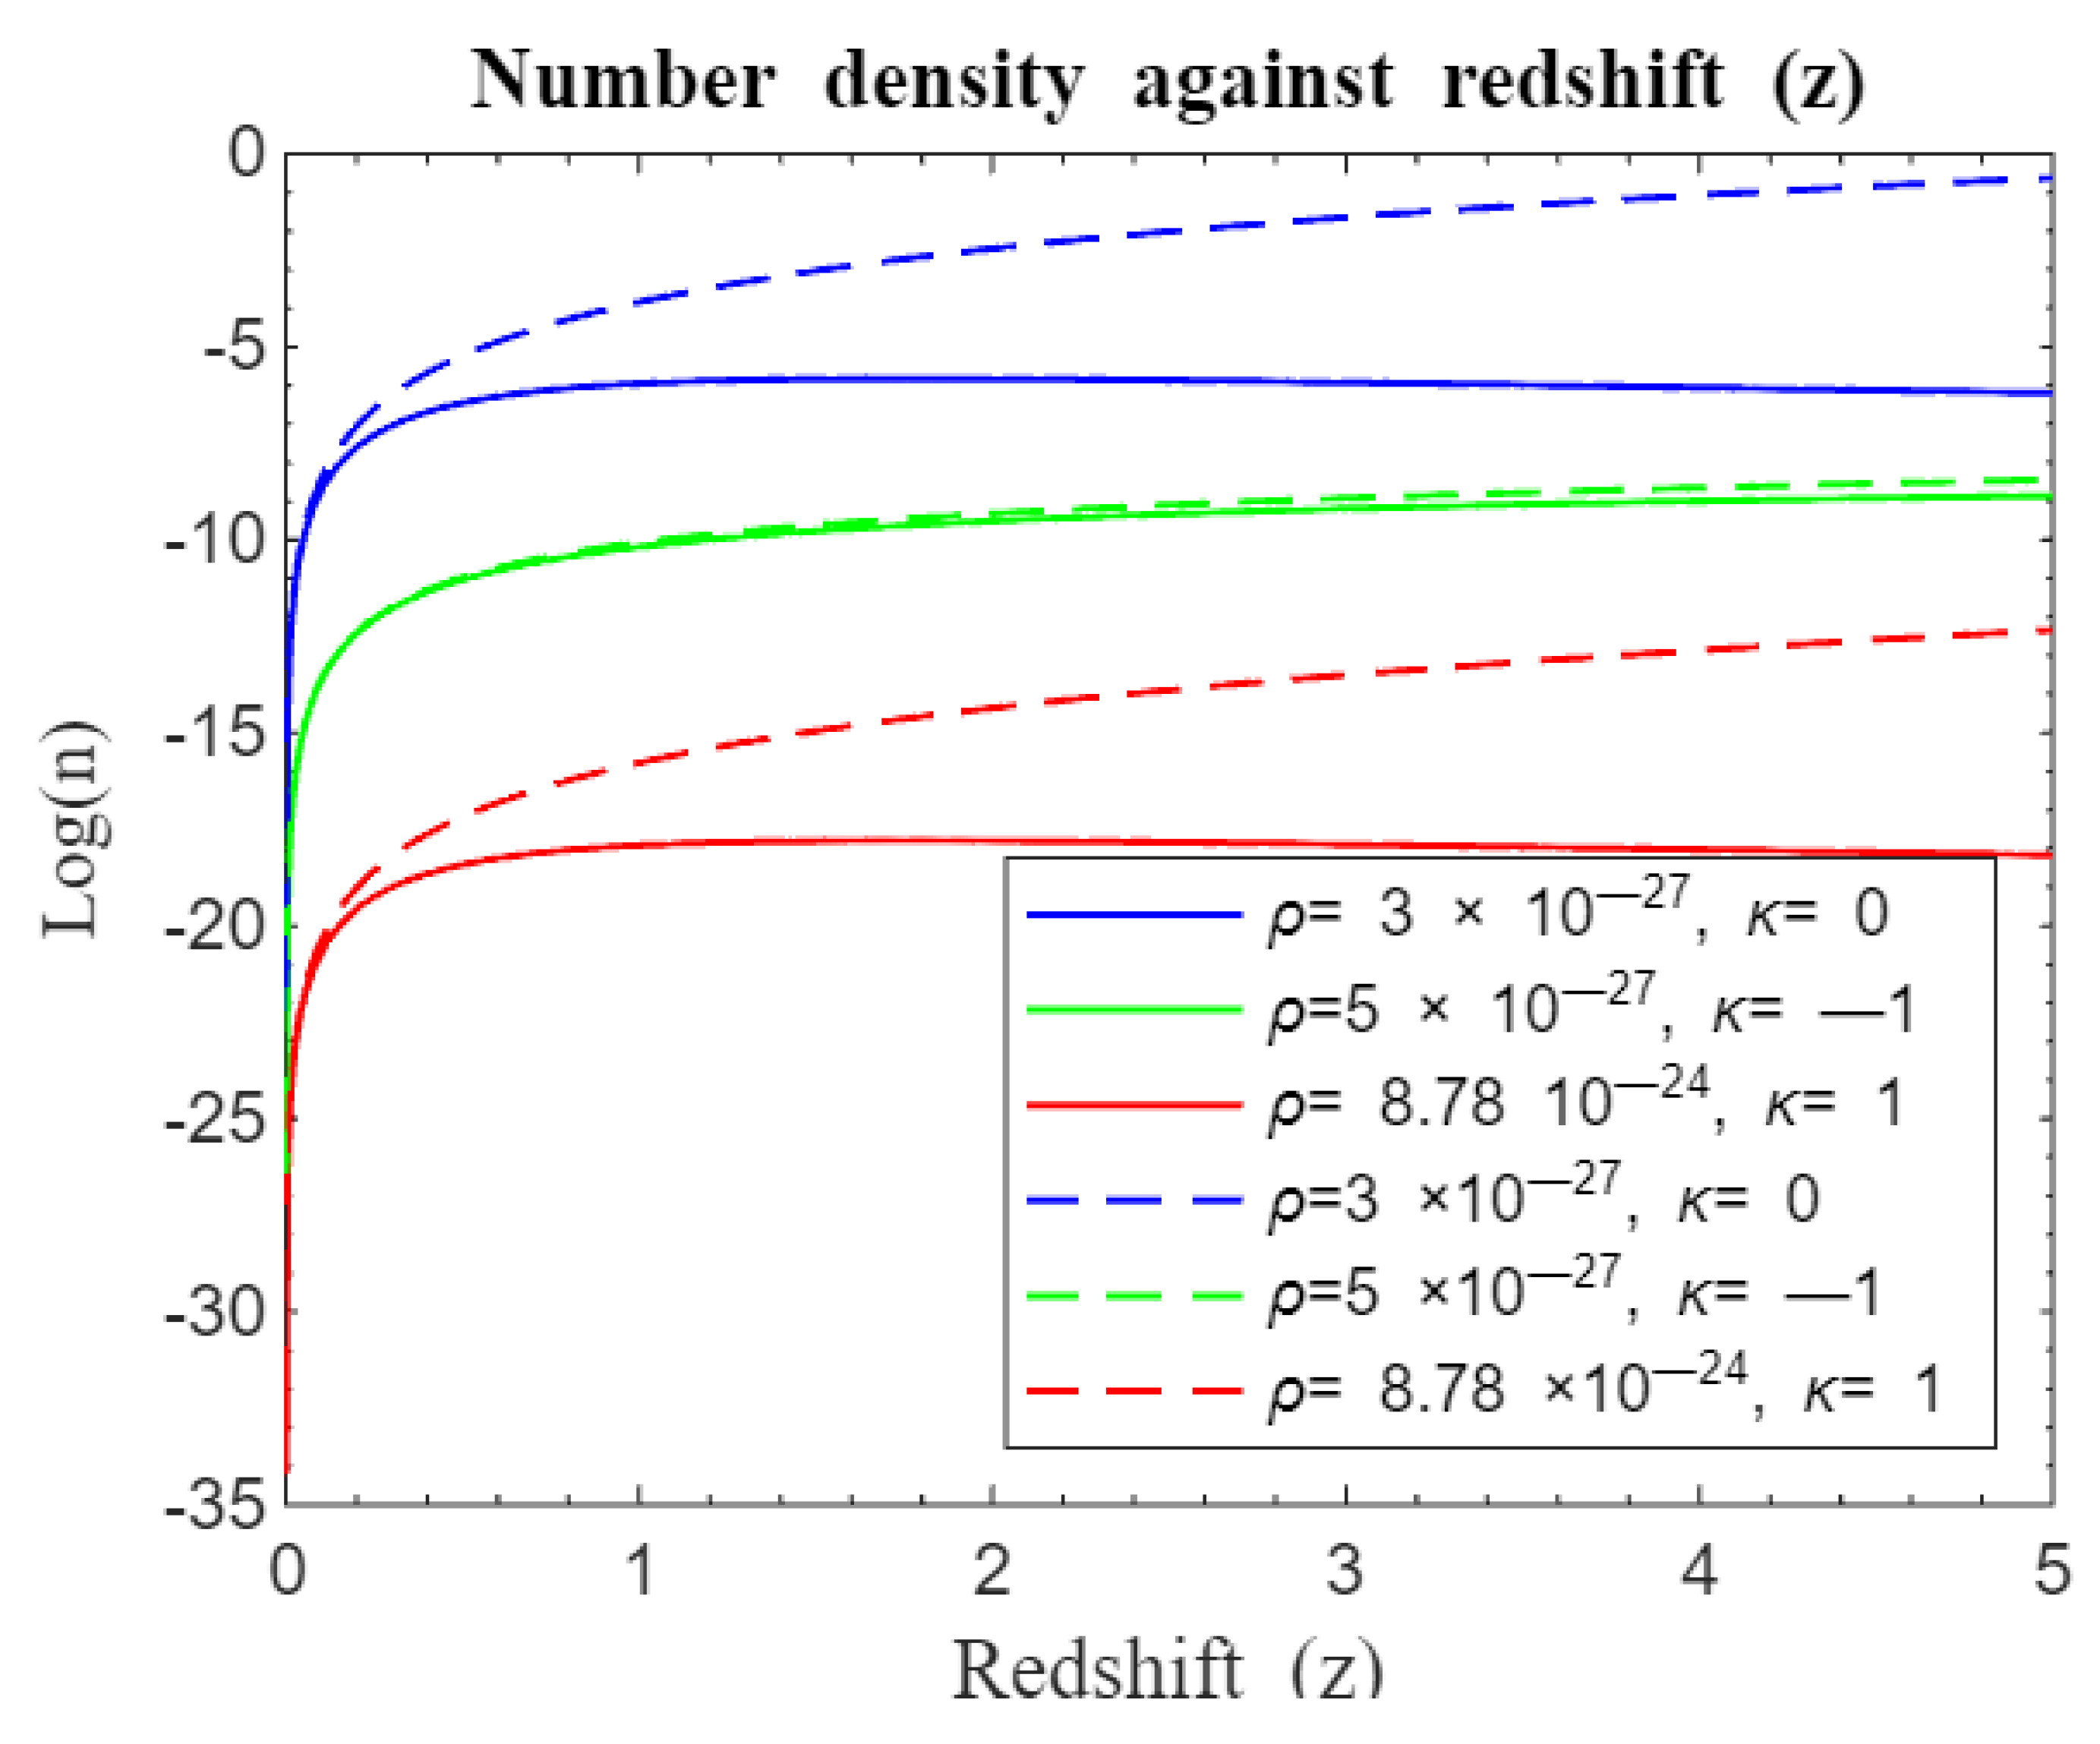
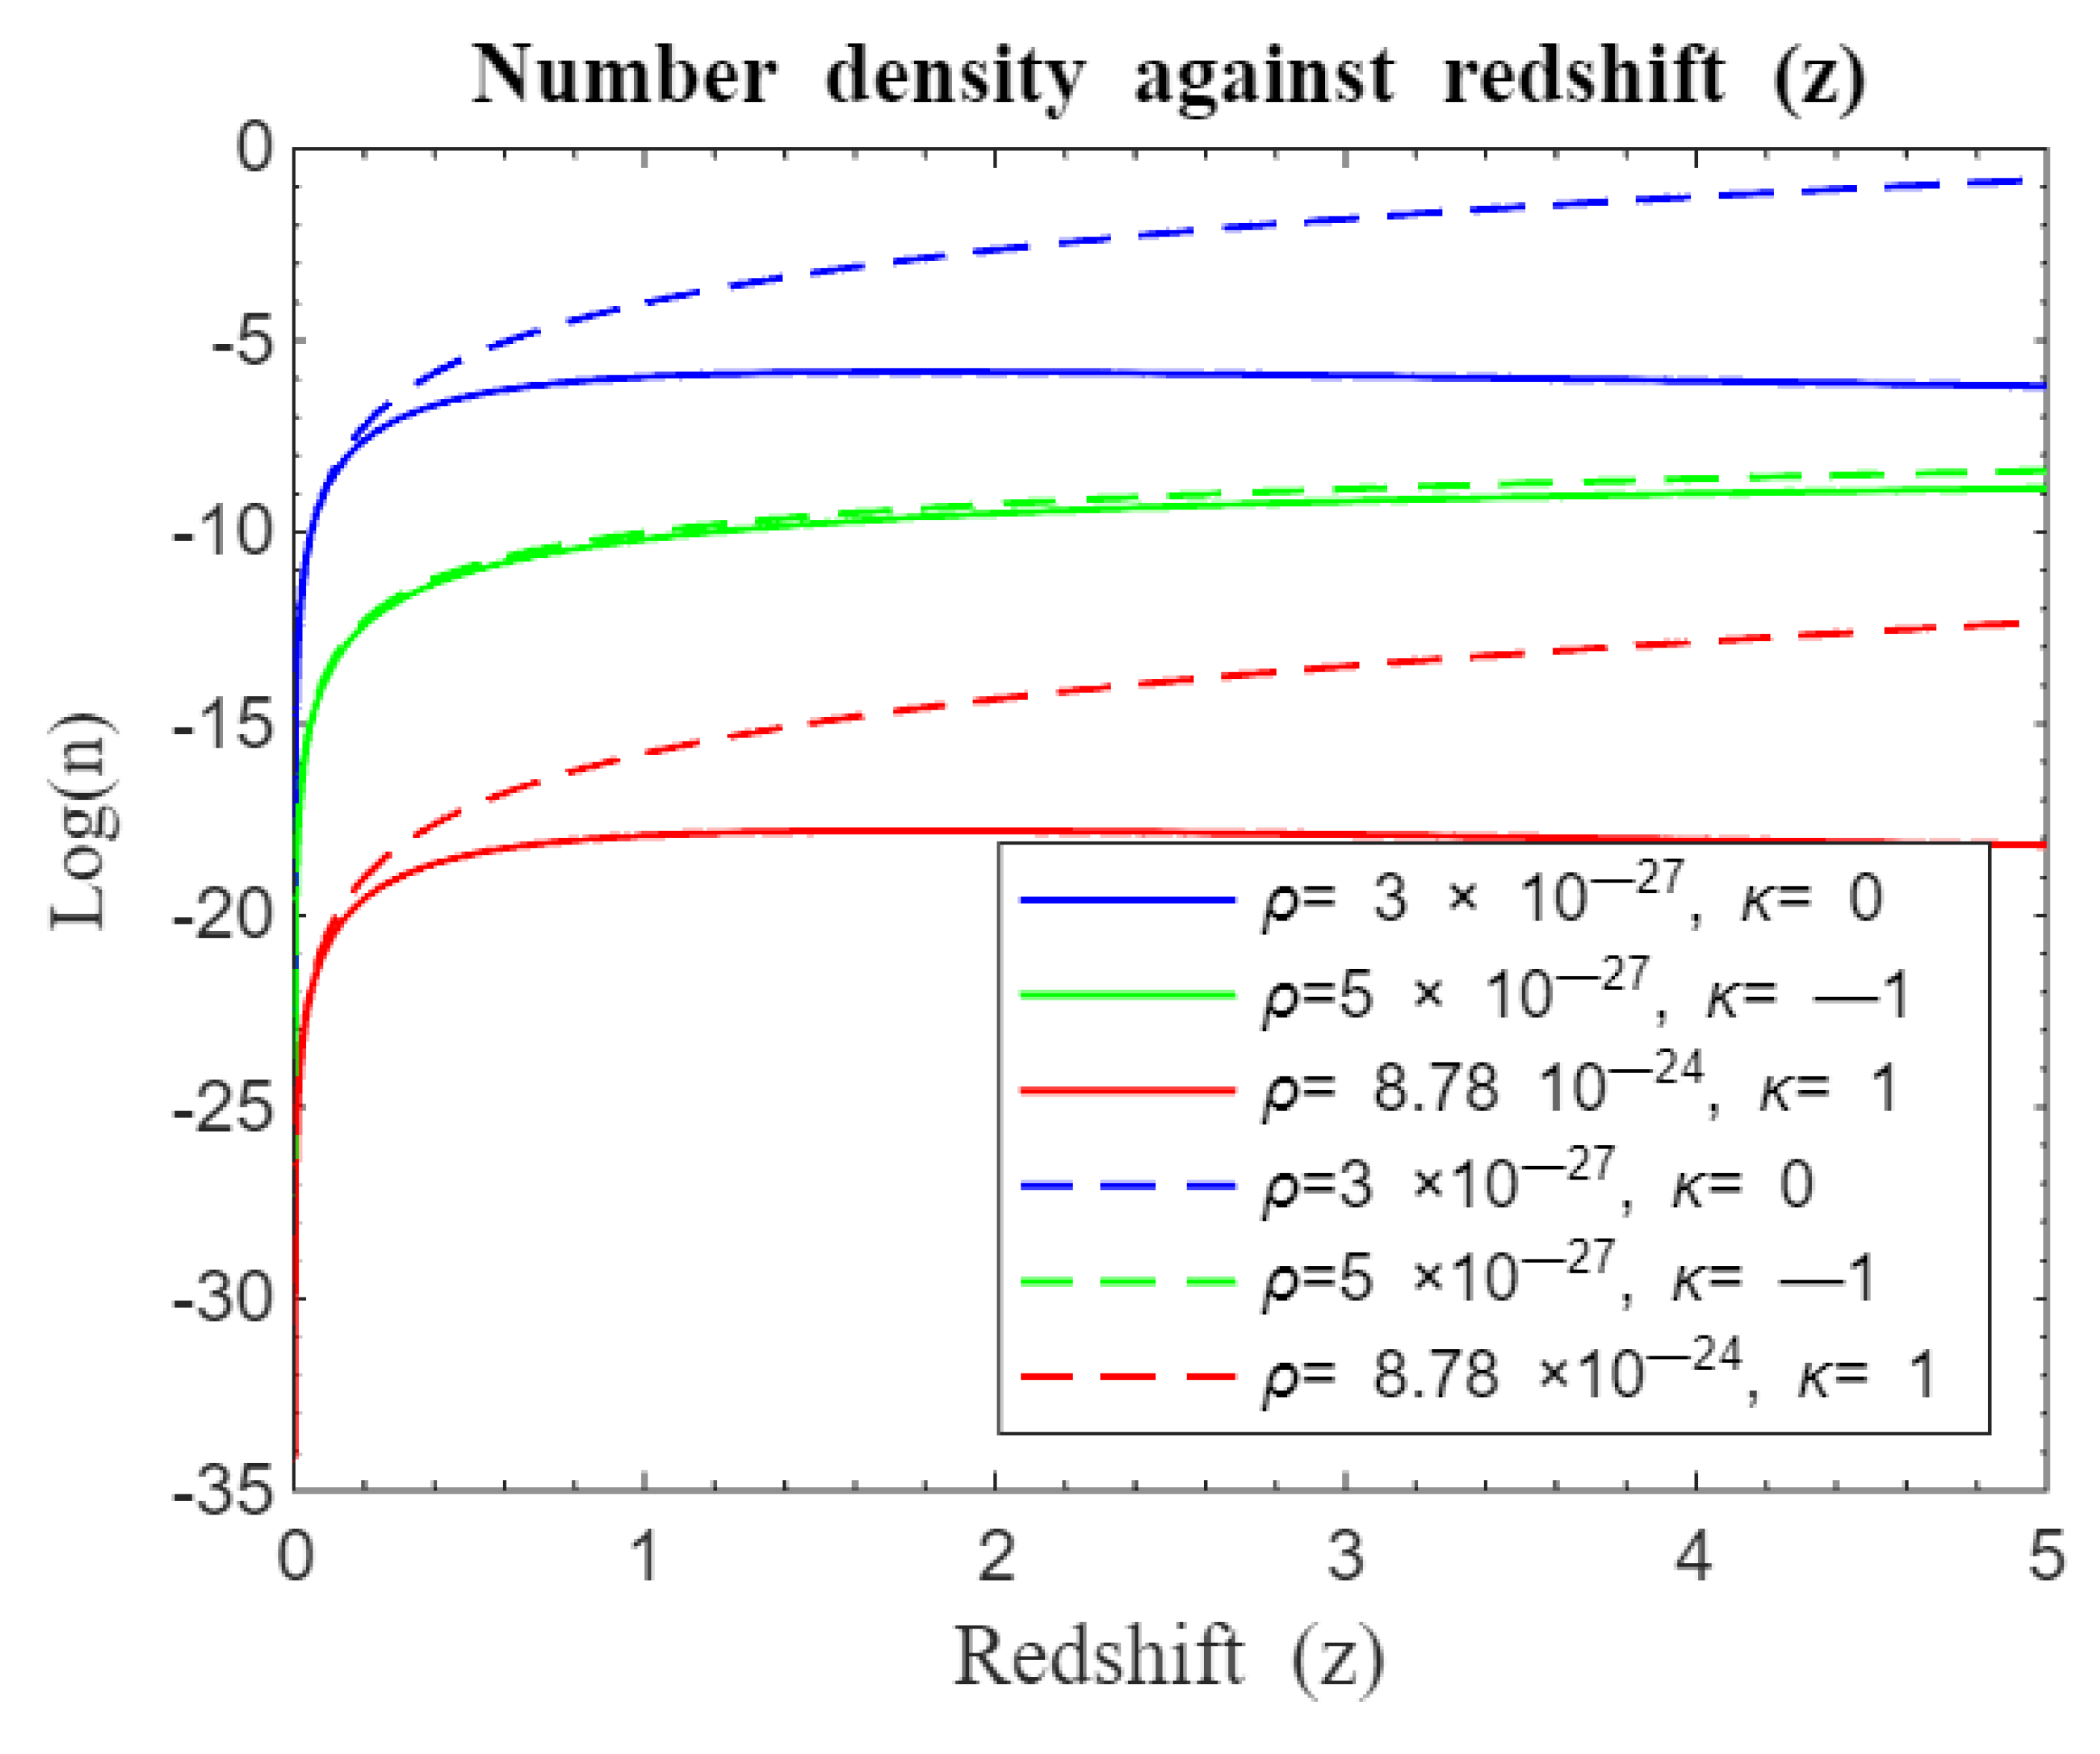
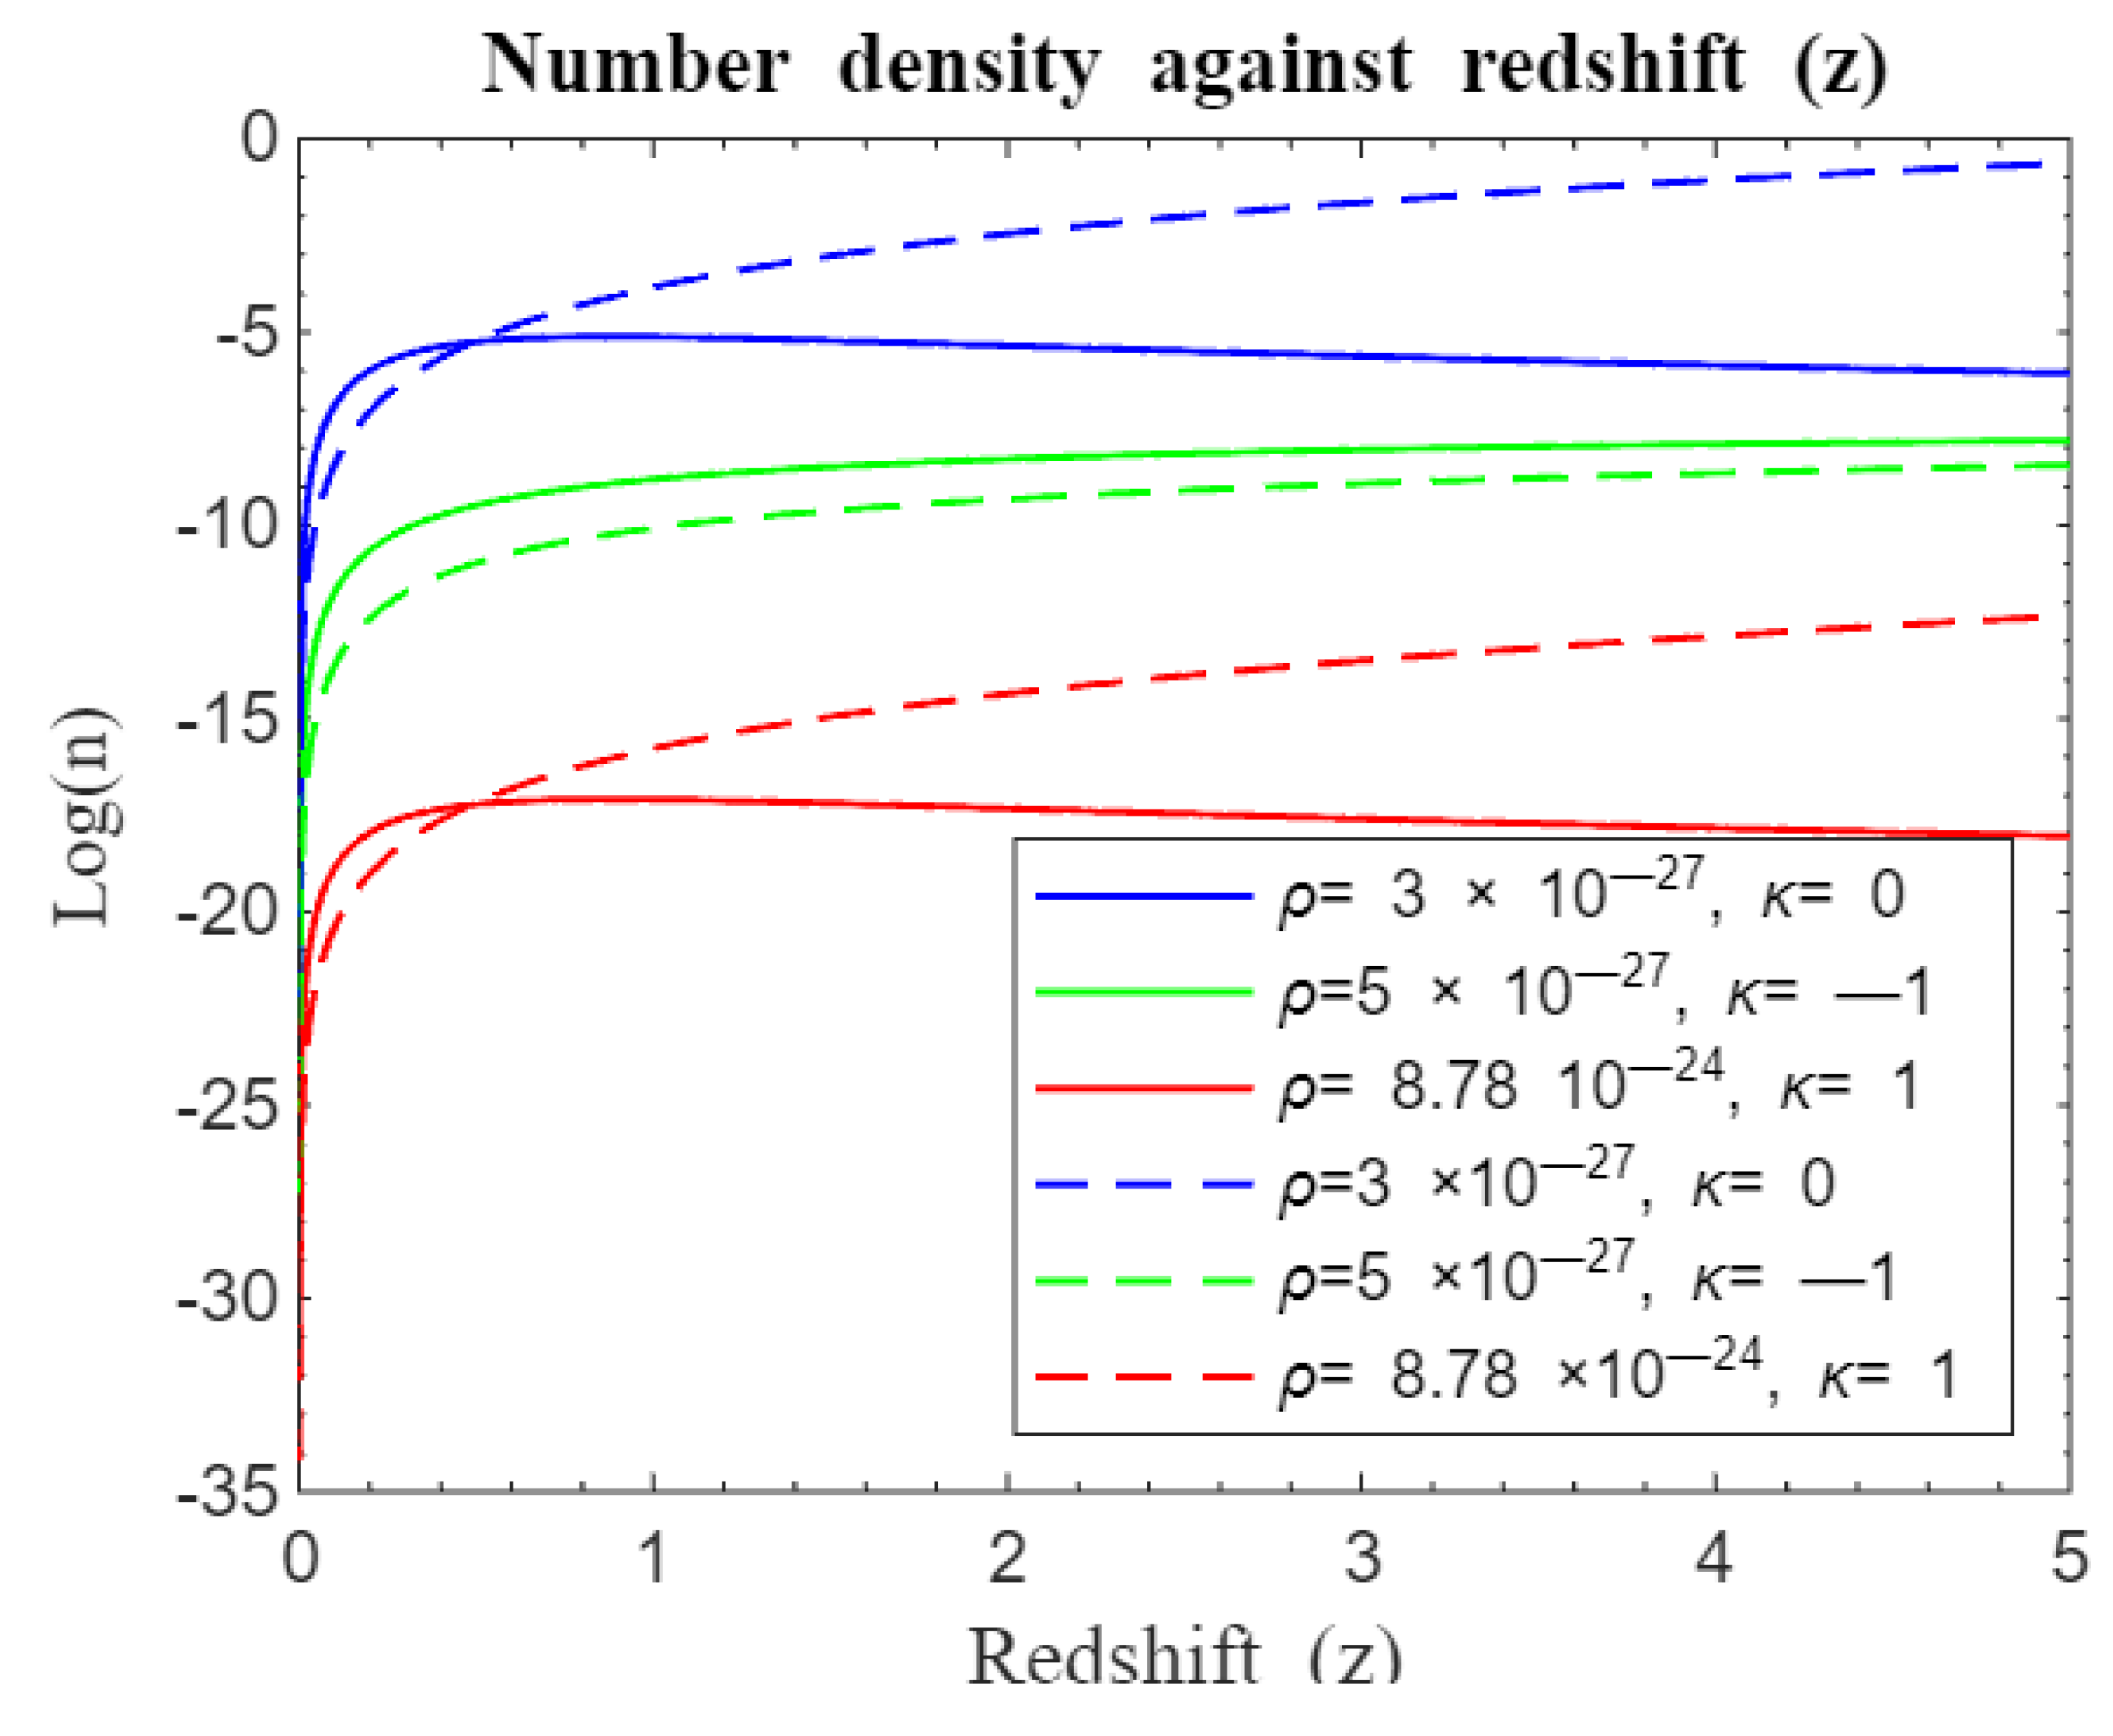
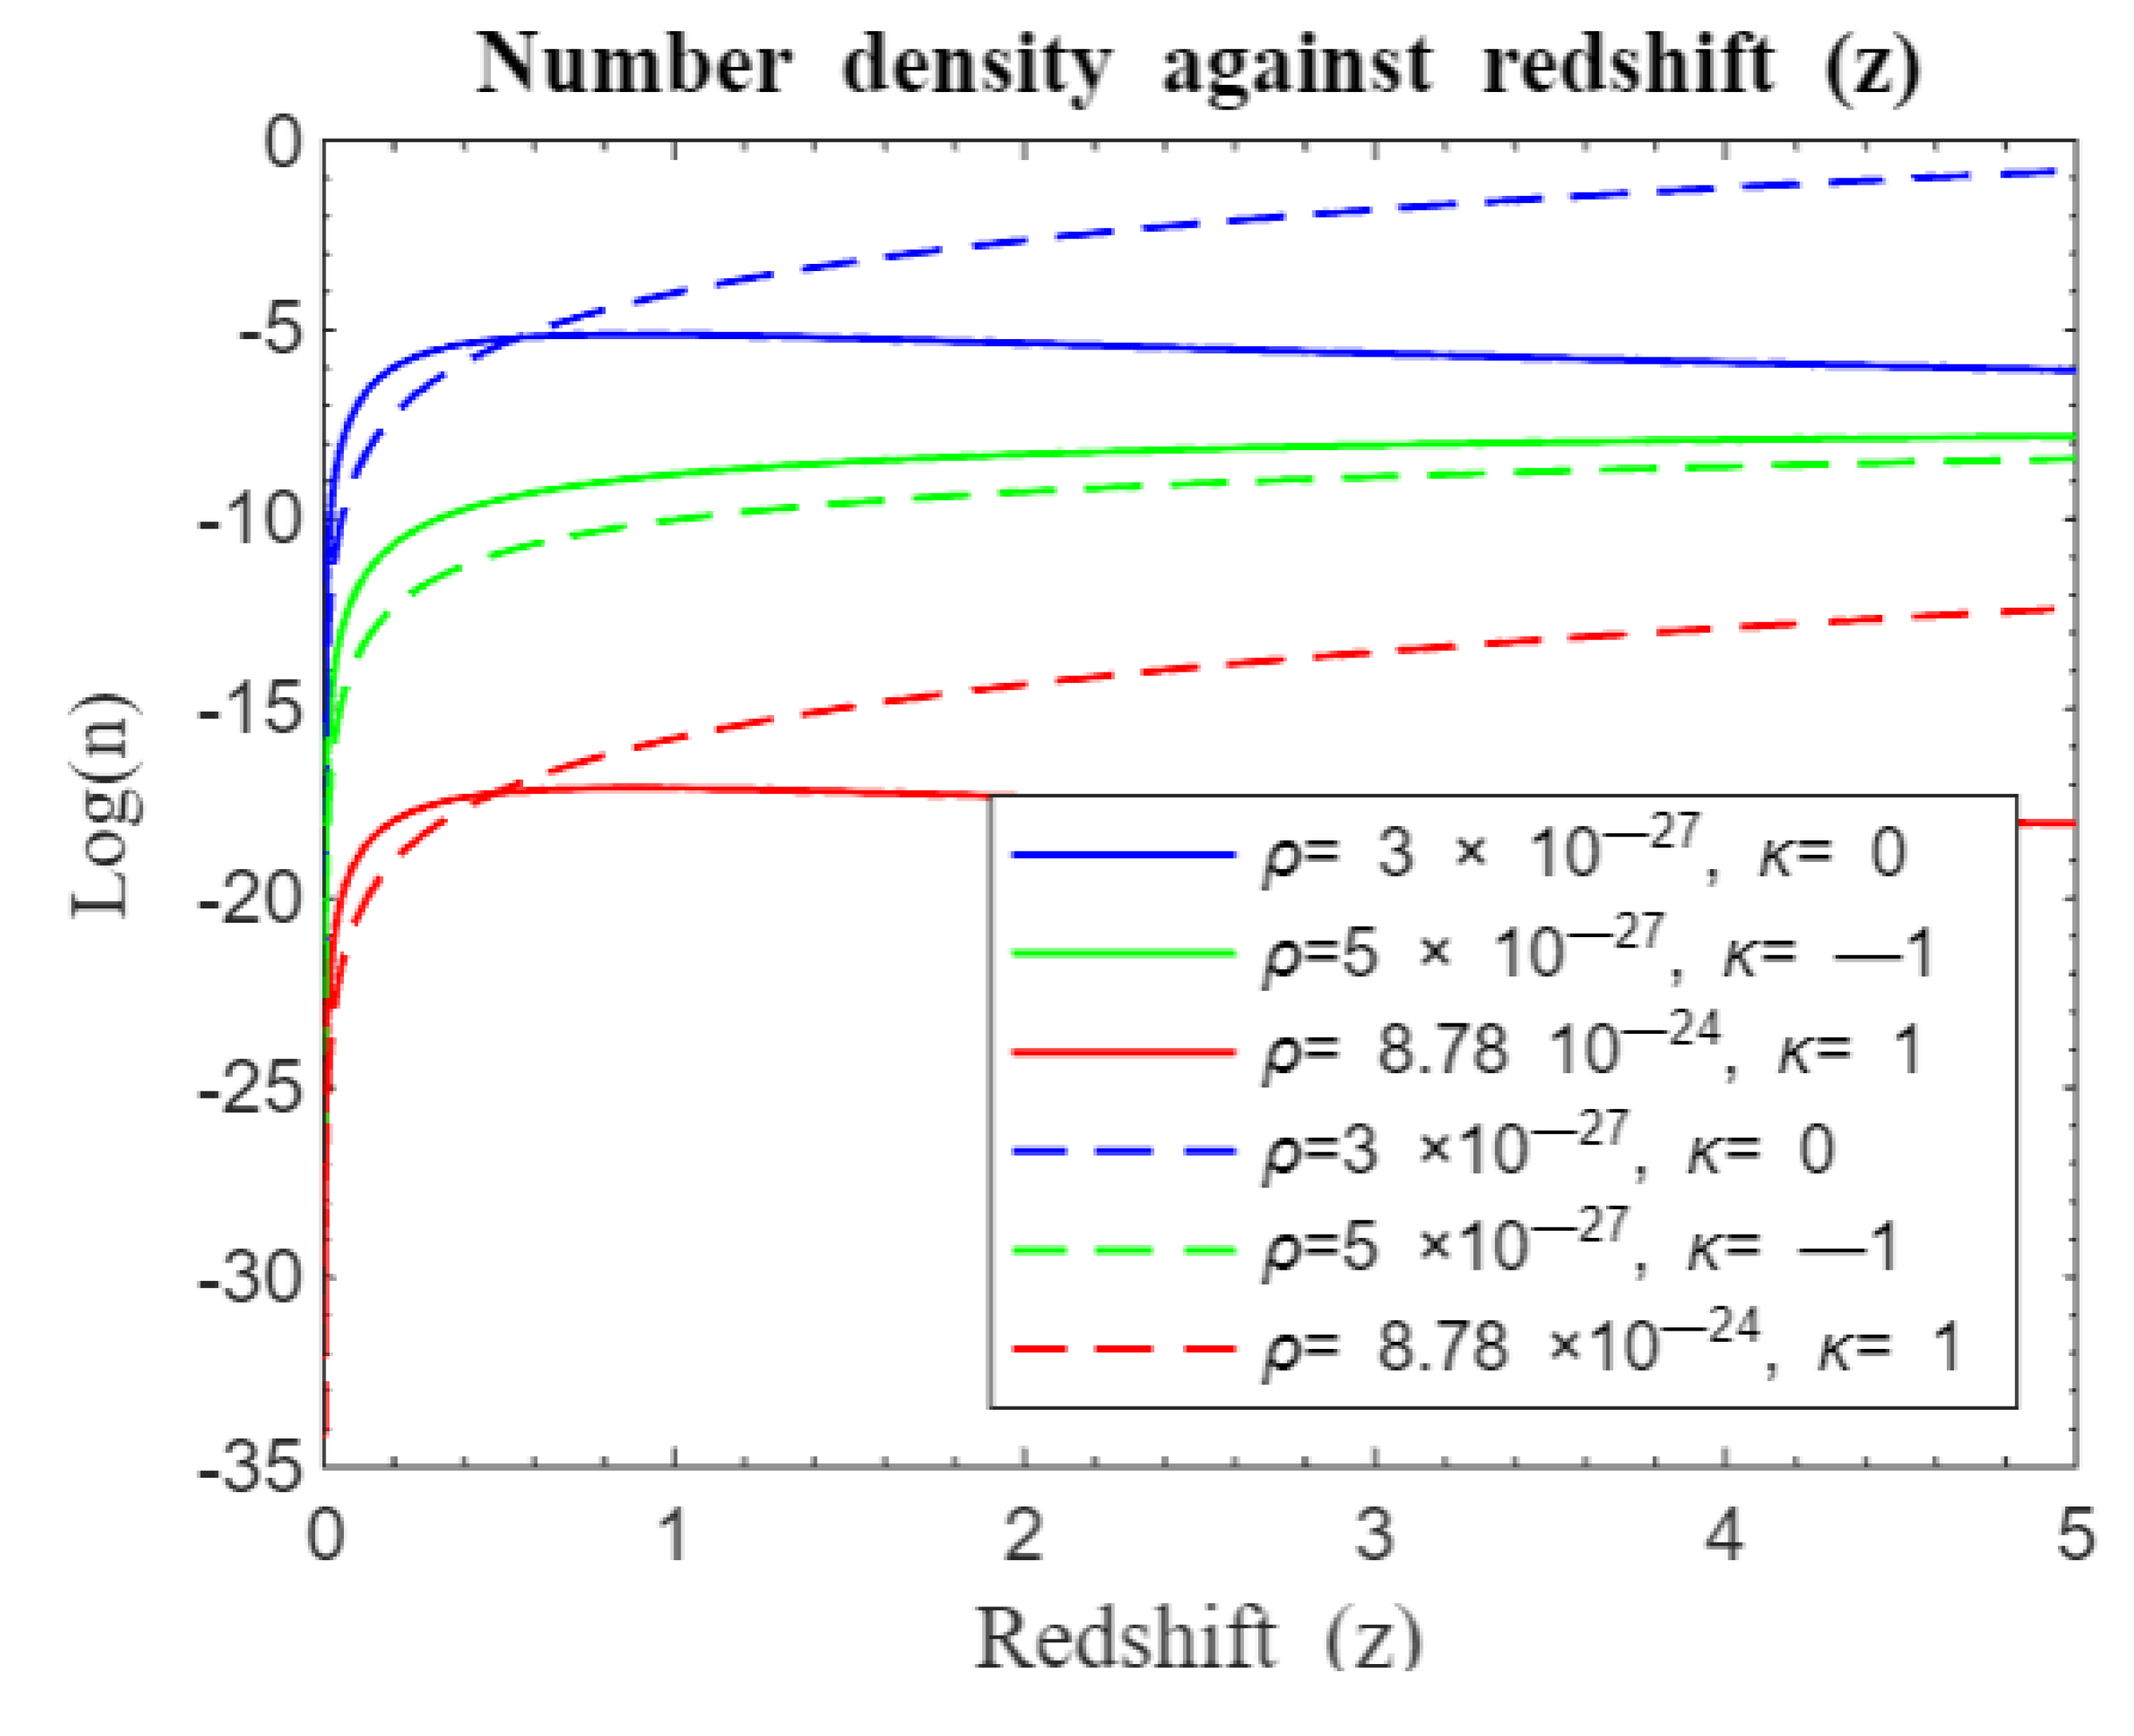
We compared our simulations on structure formation with earlier works of Langa et al. (2017) as depicted by
Figure 23 and
Figure 24. It is clear from these simulations that structure formation for both approximate standard Friedmann redshift model and standard Friedmann redshift model experienced similar rapid galaxy formation rate for both closed and flat universes at early times until
before our model (standard Friedmann redshift model) made a sharp departure from approximate standard Friedmann model [
20]. It is also noted that for both models, the open universe curves do not deviate from each other at early times and tend to follow similar structure formation trajectories with our model slightly having an edge over its counterpart in terms of galaxy formation rate at late times. After the point of departure, structure formation for both closed and flat universes in our model continued steadily but at reduced rate unlike its counterpart that reached a plateau around
then after this, they started to decline while open universe leveled off in growth. It is also clear that the effect of a cosmological constant associated with dark energy is less impactful as demonstrated by results of
Figure 23 and
Figure 24. This shows that structural growth of galaxies is influenced by dark Matter much more than dark energy. This emphasizes the fact that dark matter is associated with accelerated expansion of the universe and arises as an emergent phenomenon as posited by phenomenological models [
10,
11,
12,
23] .
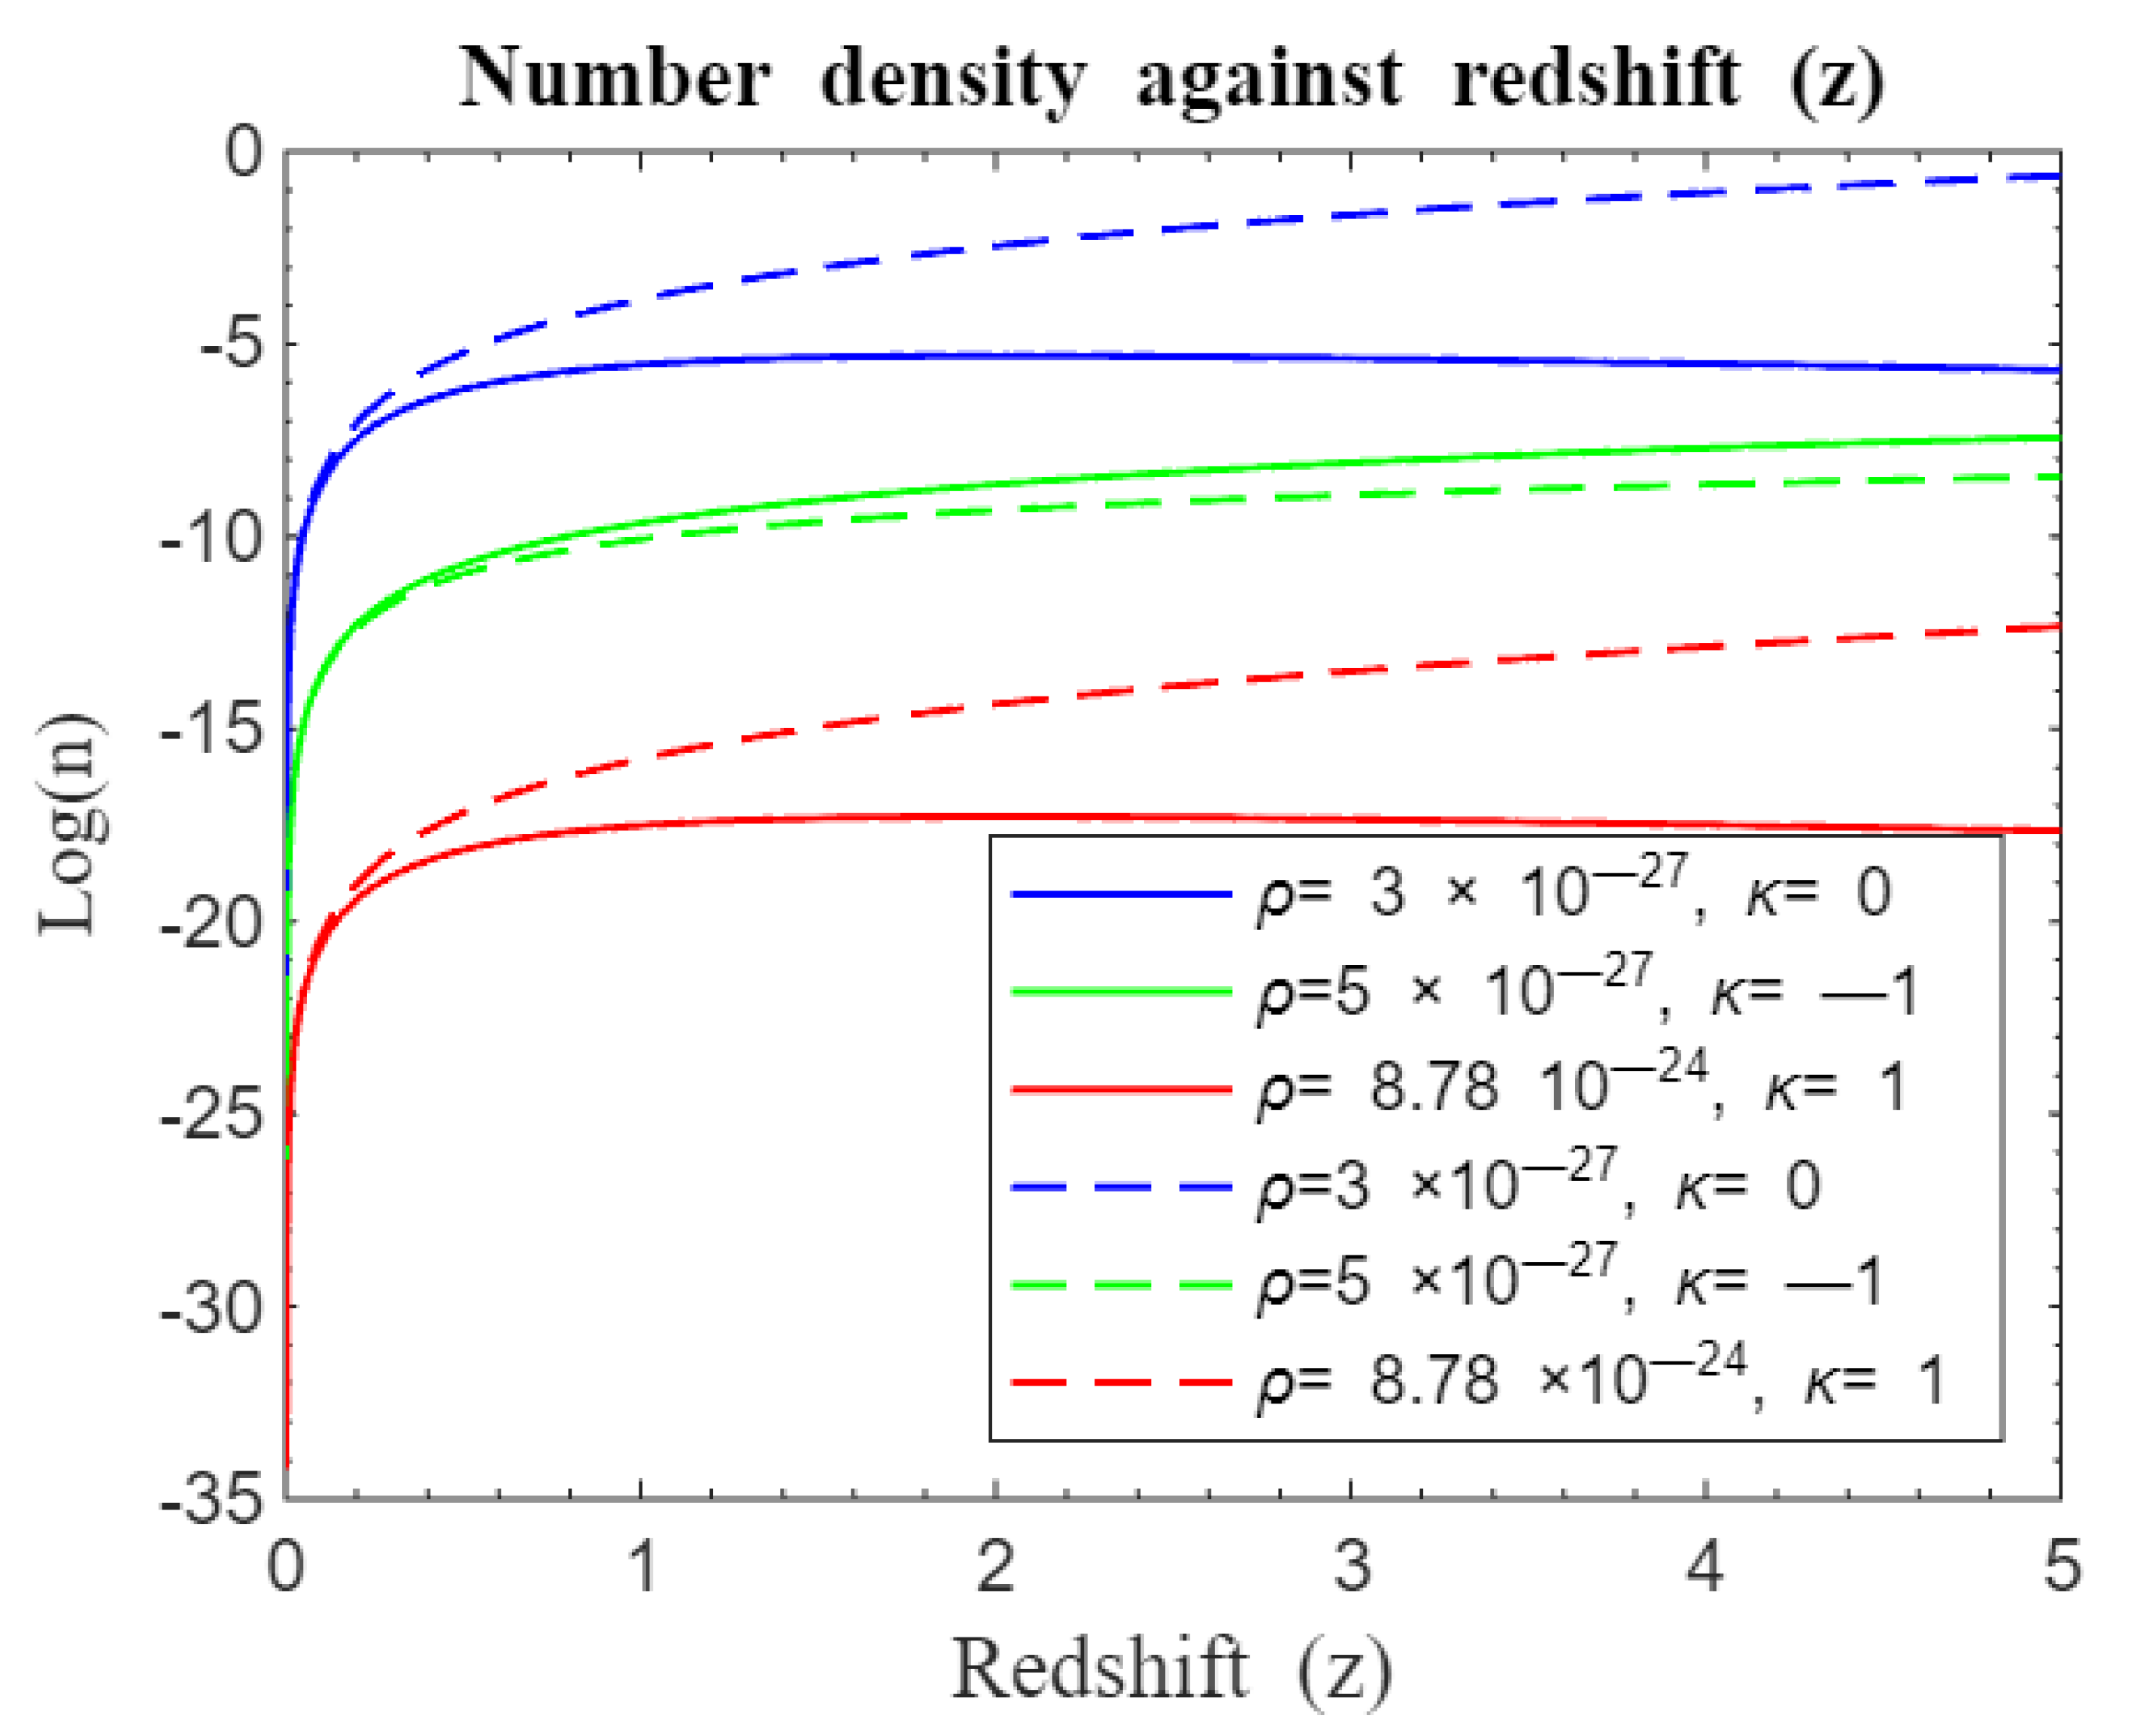
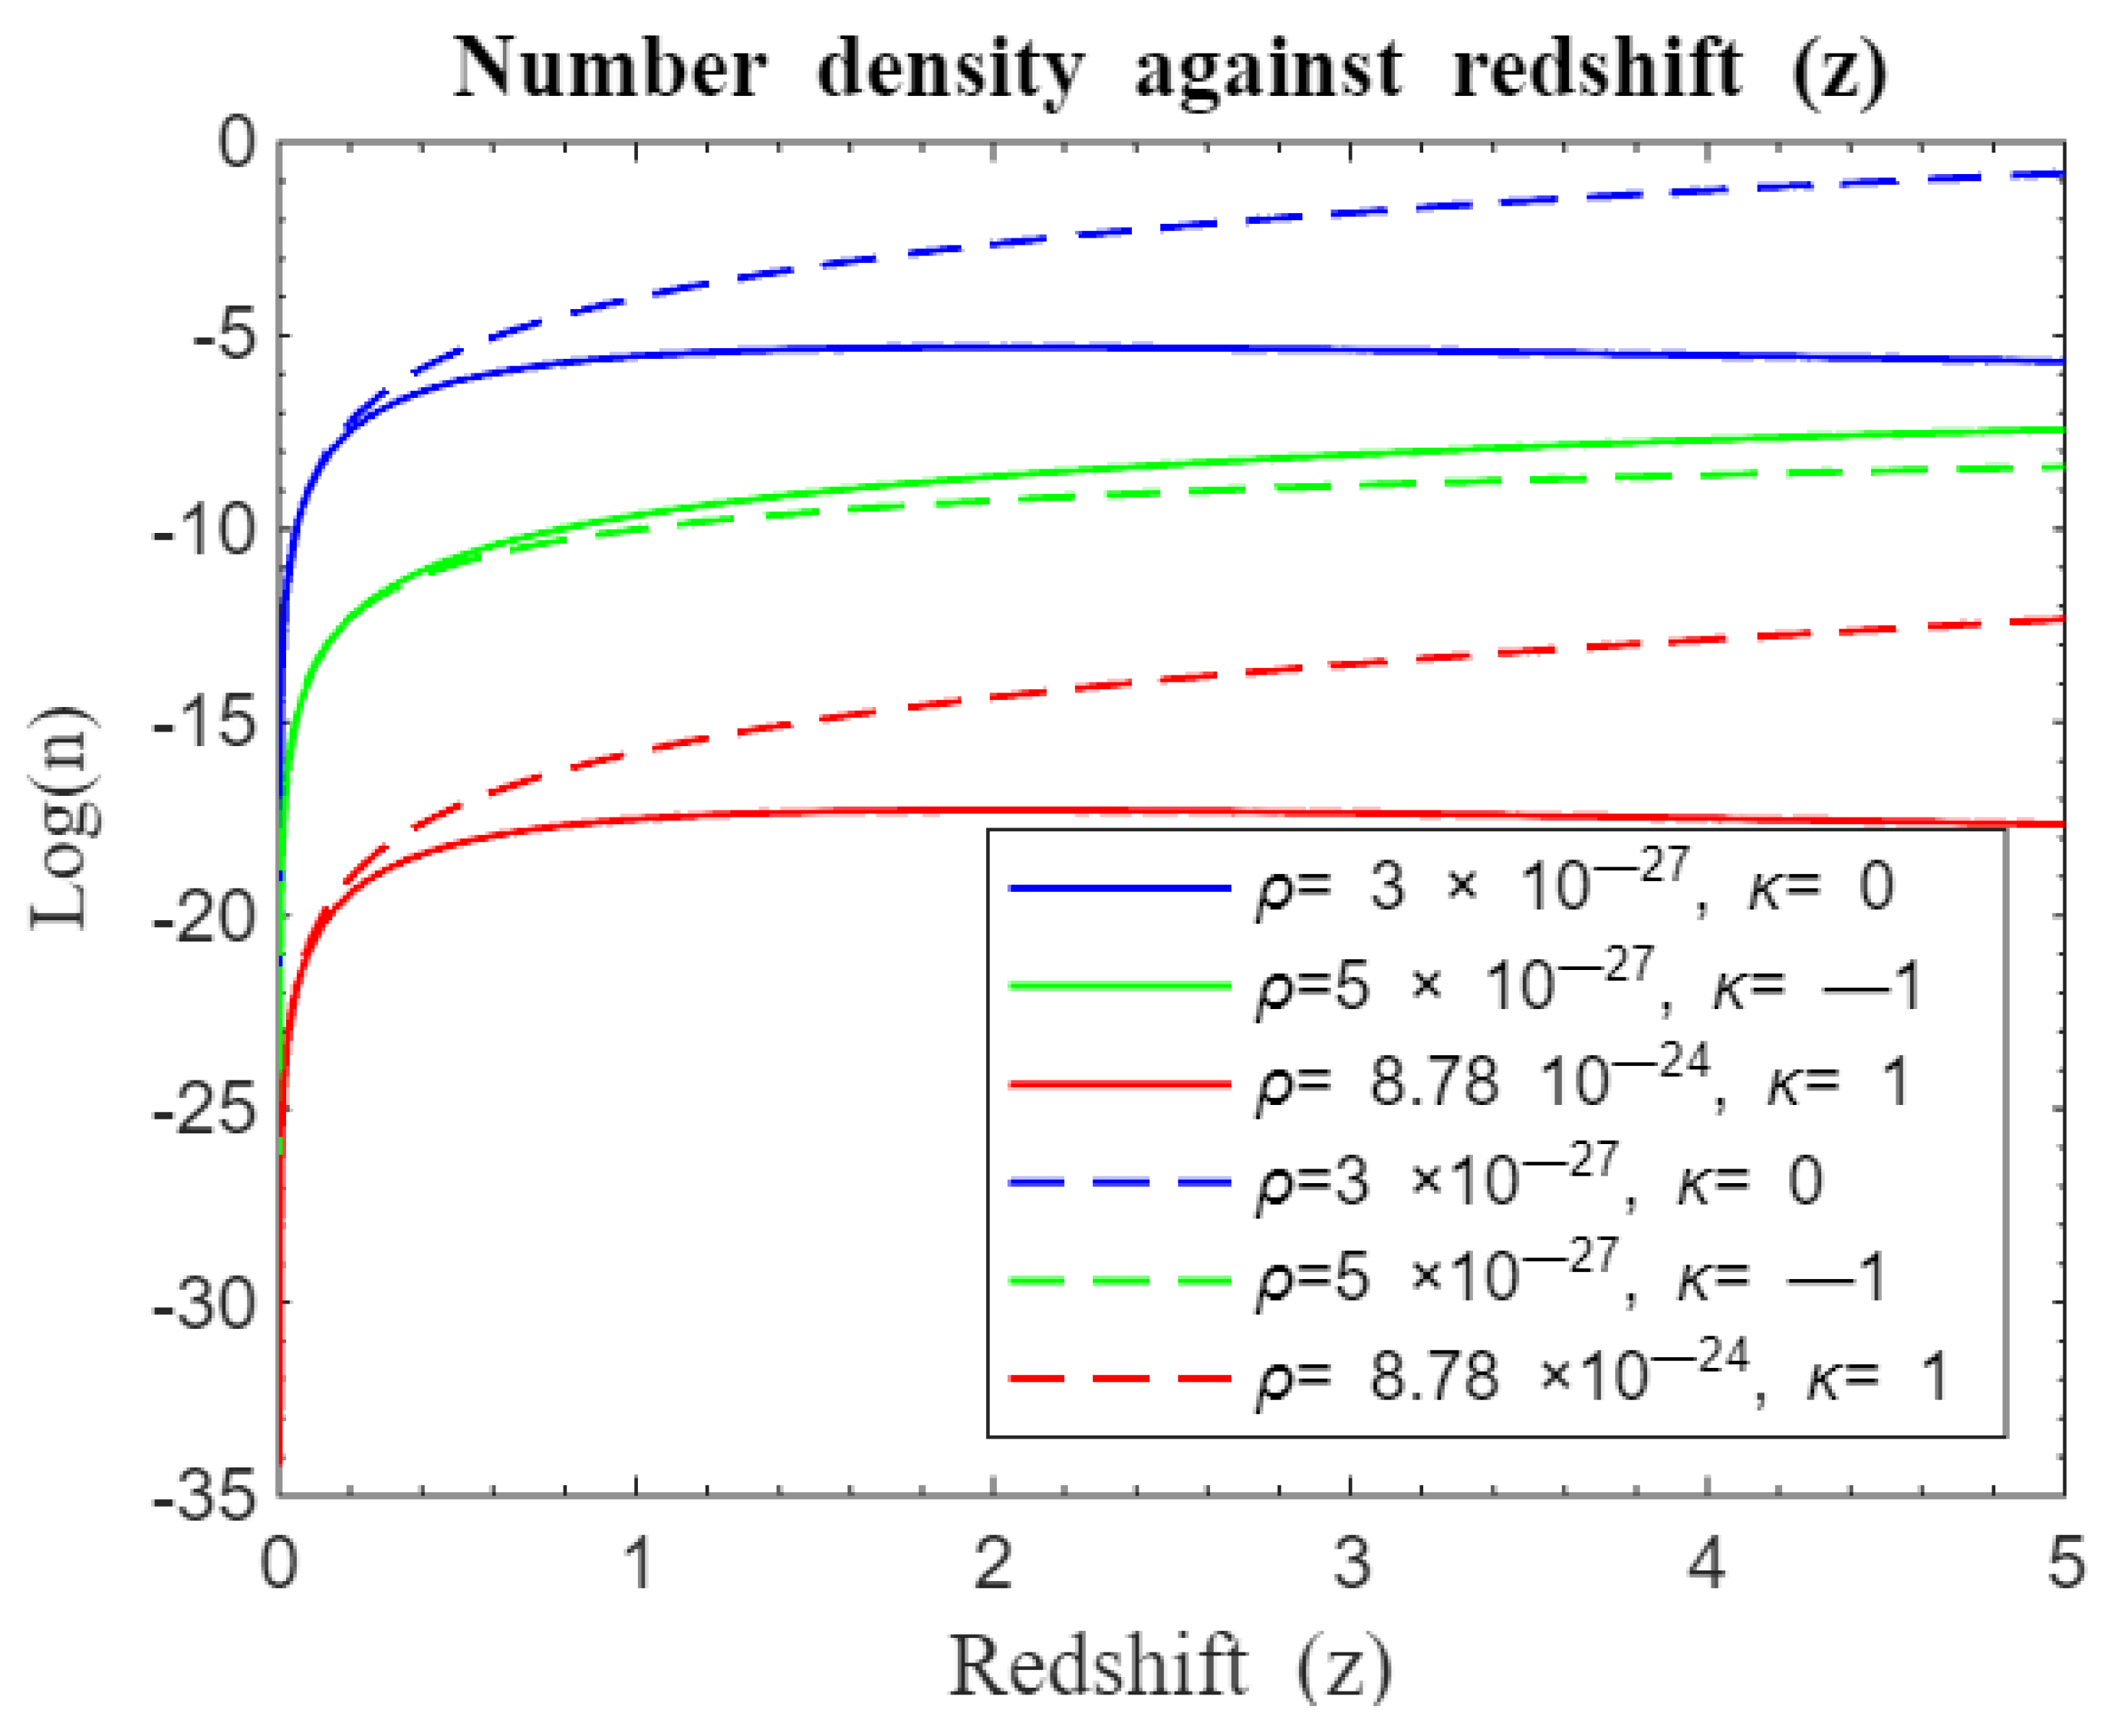
We again proceeded to compare our model with Nyagisera et al. (2024) as depicted by simulation results in
Figure 25,
Figure 26,
Figure 27 and
Figure 28. Our model was compared with the modified standard Friedmann redshift model for parametric and nonparametric functions as shown in
Figure 25 and
Figure 26 and 27-28 respectively. It is evident from
Figure 25 and
Figure 26 that there was rapid structure formation at the beginning of the universe for the modified standard Friedmann redshift parametric models than our standard Friedmann redshift model until redshift
when formation rate was now same and divergent of curves followed hereafter. Structure formation consequently changed with our model maintaining a stead but less rapid galaxy formation for both closed and flat universe after
. However, there is obvious departure for curves of open universe right from the onset of structure formation with our model trailing in number density at early epoch but trying to catch up at later times. On the other hand, modified standard Friedmann redshift nonparametric model in
Figure 27 and
Figure 28 compares with our standard Friedmann redshift model in such a way that structure formation rate is similar at the beginning of the universe for both closed and flat universe only diverging after
. Hereafter, curves from our model depict steady galaxy formation for both closed and flat universe. However, the green curves depicting an open universe follow a similar trajectory to the modified parametric curves, starting together and only differing infinitesimally at later times with ours slightly below the modified parametric green curve. The two universes reach a plateau at
before structure formation proceeds at a constant rate. From
Figure 15,
Figure 16,
Figure 17,
Figure 18,
Figure 19,
Figure 20,
Figure 21,
Figure 22,
Figure 23,
Figure 24,
Figure 25,
Figure 26,
Figure 27 and
Figure 28, we observe high activity in galaxy formation rate at the beginning of the universe than at later times. Formation of cosmic structures seem to have been faster at redshifts up to
after which it slowed down. Galaxy formation is influenced by a variety of factors including the density fluctuations in the early universe and the nature of dark matter. In the early universe, density fluctuations provided the seeds for the formation of structures like galaxies. These fluctuations were more pronounced at smaller redshifts, corresponding to earlier times in the universe's history. As the universe expanded, the density of matter decreased, leading to slower galaxy formation over time [
24]. Dark matter, which constitutes a significant portion of the universe's mass, plays a crucial role in galaxy formation by gravitationally attracting ordinary matter. Studies have shown that dark matter halos, which host galaxies, grow more rapidly at smaller redshifts due to the higher density of matter in the early universe [
13,
25]. This observation is in agreement with our results. Also, feedback processes, including supernova explosions and black hole activity, regulate the rate of star formation within galaxies. As the universe ages and galaxies evolve, these feedback mechanisms become more efficient, leading to a slowdown in the formation of new stars or galaxies. This observation well aligns with our findings where we observed that galaxy formation slowed time at later times when
. Observations and simulations, like those conducted by Péroux et al. [
26], highlight the importance of feedback in shaping galaxy properties over cosmic time. Recent observational studies, such as those analyzed by Huterer & Shafer [
27], indicate that as the universe expands, the gravitational pull between galaxies weakens, contributing to a slowdown in the formation of new galaxies at higher redshifts in tandem with our findings. These factors collectively contribute to the observed trend of faster galaxy formation at smaller redshifts and a gradual decrease in the rate of formation as redshifts increase or as the universe expands. This balanced expansion results in a relatively stable number density of objects over cosmic time [
28]. In an open universe with negative curvature, the spatial geometry is hyperbolic, and the expansion continues indefinitely without a collapse. Similarly, in the flat universe, the expansion may decelerate due to matter density, but the presence of dark matter again may lead to an accelerated expansion. This continuous expansion results in a gradual decrease in the growth rate of large-scale structure, leading to a flattening of the number density vs redshift curve [
6,
29]. In a universe with positive curvature, the spatial geometry resembles that of a hypersphere. As the universe evolves, the gravitational attraction due to the matter density eventually overcomes the expansion driven by dark energy, leading to a collapse of the universe. This collapse results in a rapid decrease in the observed number density of objects (such as galaxies) as redshift increases [
30]. In our case, we did not observe substantial impact of dark energy so that its effect may have been overshadowed by dark matter effects.
5.3. Comparison with Observational Data
The study of redshift in galaxies stands as a cornerstone in our quest to understand the processes of structure formation, and evolutionary in the universe.
Central to our task, we embarked on the utilization of vast and accurate astronomical datasets of our present time, teeming with measurements of redshift and number density. These datasets are curated to ensure accuracy and freedom from the effects of background geometry or cosmic distance measurement anomalies as much as possible. Leveraging on these datasets, we embarked on comparative analysis, extracting plots that mirrored the parameters of our analytical models. This alignment in scale facilitates a direct comparison between the theoretical constructs delineated by our model and the empirical realities captured by observational data.
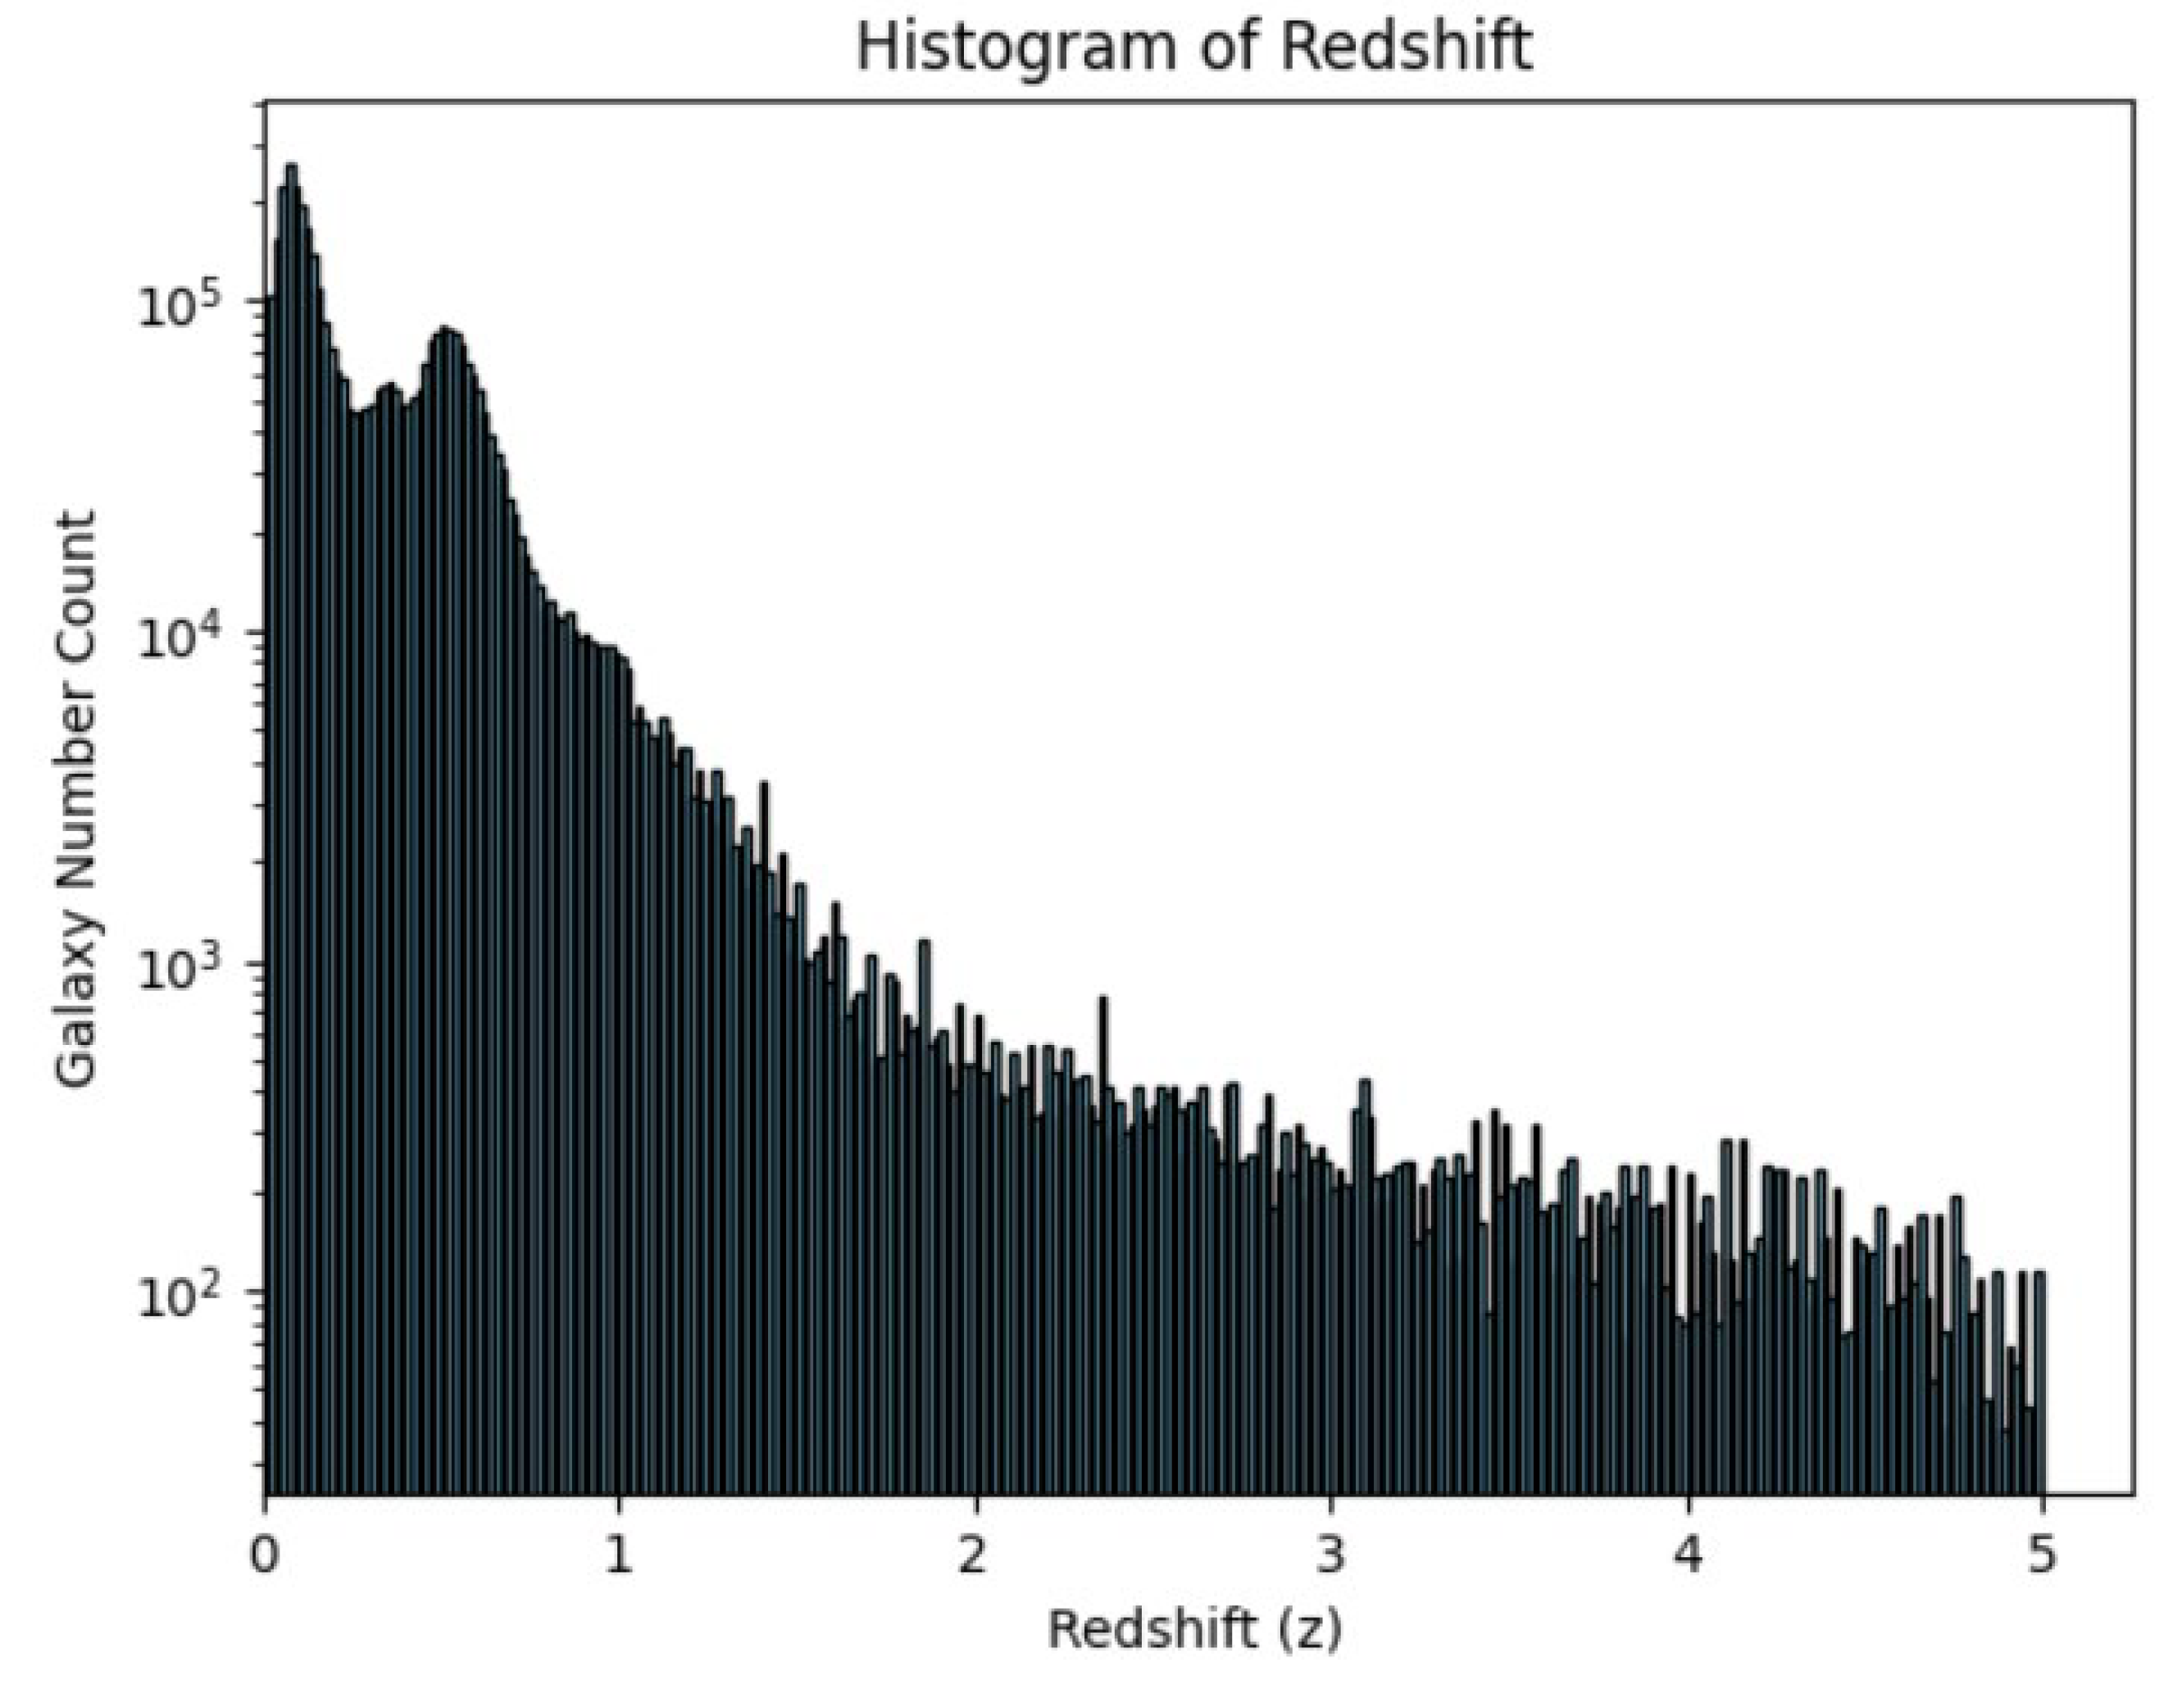
We collected observed redshifts between 0 and 5, specifically, for extragalactic galaxies in the infrared spectral region, using Planck 2015 cosmological parameters from the NASA/IPAC Extragalactic Database (NED) (
https://ned.ipac.caltech.edu/; [
31]. The distribution of these retrieved redshifts was plotted, with the bin heights indicating the number of galaxies observed at each redshift, as shown in
Figure 29.
In
Figure 29, an exponential decrease in the distribution of observed galaxies with increase in redshift was observed. Clearly, there was high activity of galaxy formation in the redshift range
with a burst of galaxies forming between
and presenting two characteristic peaks at
and
This indicated that galaxies were formed at a faster rate in the beginning of the universe
than at later time. It is interesting to note that this observational data exactly coincides with our theoretical model predictions of galaxy formation peaks at
and
as presented by
Figure 15,
Figure 16,
Figure 17,
Figure 18,
Figure 19,
Figure 20,
Figure 21 and
Figure 22 and
Figure 23 and
Figure 24 respectively. This alignment therefore, validates our Friedmann model adopted in this work as a correct cosmological framework for accounting of structure formation and evolution in the universe.
6. Summary and Conclusions
The cosmological principle, a fundamental assumption in the standard cosmological model, posits that the universe is homogeneous and isotropic at large scales, though this is not evident on smaller scales. The Friedmann-Lemaitre-Robertson-Walker metric serves as the foundation of modern cosmology, with deviations from the standard model addressing challenges such as the Hubble tension and cosmic coincidence problems. Redshift-distance and light intensity-distance relations are critical tools for testing the validity of cosmological models, especially with the rise of both parametric and nonparametric redshift models.
Dark matter and dark energy play significant roles in explaining galaxy formation and cosmic expansion, though their nature remains largely unknown. Observational methods, such as three-dimensional redshift surveys, present challenges in affirming large-scale homogeneity. Discrepancies between observations, such as quasar distribution studies, and the expected homogeneity, indicate that further analysis is needed.
This study aims to refine our understanding of the universe’s structure by focusing on three key astronomical parameters: number density, light intensity, and redshift. It examines the evolution of these quantities from the early universe to the present and compares findings with both the ‘approximate standard Friedmann redshift model’ by Langa et al. (2017) and the ‘modified standard Friedmann redshift model’ by Nyagisera et al. (2024). The study introduces the 'standard Friedmann redshift model,' which incorporates the effects of dark matter and dark energy.
The study establishes that light intensity decays exponentially with increasing redshift due to the universe's expansion. This relationship, confirmed by
Figure 1,
Figure 2,
Figure 3,
Figure 4,
Figure 5,
Figure 6,
Figure 7,
Figure 8,
Figure 9,
Figure 10,
Figure 11,
Figure 12,
Figure 13 and
Figure 14, is in agreement with our classical expectation that attribute the decrease in energy density to photon dilution as the universe expands.
The results highlight that the geometry of the universe significantly impacts light intensity. In a flat universe, light intensity decays more rapidly compared to an open or closed universe, as shown in
Figure 1 and
Figure 2. For example, a closed universe
displays higher initial intensity with a slower decline, while an open universe
shows a faster drop in light intensity. Comparative analysis of models reveals that high-density universes exhibit higher initial light intensities during early times.
Figure 15,
Figure 16,
Figure 17,
Figure 18,
Figure 19,
Figure 20,
Figure 21 and
Figure 22 indicate that dark energy has negligible effects on structure formation, contrasting with earlier works of Langa et al (2017) and Nyagisera et al (2024). This emphasizes the fact that dark matter, rather than dark energy, drives galaxy formation by influencing local gravitationally bound systems and even beyond.
Furthermore, the study shows that galaxy formation occurred more rapidly at early times, particularly within the redshift range
, as illustrated by
Figure 15,
Figure 16,
Figure 17,
Figure 18,
Figure 19,
Figure 20,
Figure 21,
Figure 22,
Figure 23,
Figure 24,
Figure 25,
Figure 26,
Figure 27 and
Figure 28. This aligns with the idea that density fluctuations in the early universe, amplified by dark matter, were key in facilitating early galaxy formation.
Observational data from the NASA/IPAC Extragalactic Database, presented in
Figure 29, reinforces these findings by showing that there was a galaxy burst between redshifts 0 and 1, which peaked around
and
These characteristic redshift peak values are consistent with our theoretical predictions of the standard Friedmann redshift model used in this work (see
Figure 15,
Figure 16,
Figure 17,
Figure 18,
Figure 19,
Figure 20,
Figure 21 and
Figure 22 and
Figure 23 and
Figure 24 respectively), validating its accuracy in explaining the formation and evolution of cosmic structures.
In conclusion, this work therefore, presents a formidable understanding of the relationship between light intensity, redshift, and structure formation in the universe, while emphasizing the pivotal role of dark matter and cosmic geometry in shaping the universe's evolution.
The implications of this work extend into several key areas for future research. First, a more subtle approach is needed to model the structure and evolution of the universe, one that better accounts for the complexities of dark energy’s and dark matter's influence on galaxy formation. Second, our results call for more detailed observational campaigns targeting the redshift ranges identified in this study to further investigate the underlying mechanisms driving these processes.
Furthermore, the growing challenges to the cosmological principle suggest that alternative models of the universe, potentially those that allow for more variation on large scales, should be considered.
Lastly, the evidence of rapid galaxy formation at specific redshifts and the crucial role of dark matter in shaping cosmic structures point to gaps in our current understanding that require further exploration.
Author Contributions
Conceptualization, Dismas Wamalwa; Data curation, Patrick Mwaniki; Formal analysis, Dickson Kinyua; Methodology, Dismas Wamalwa; Software, Daniel Maitethia; Supervision, Dismas Wamalwa, Dickson Kinyua and Daniel Maitethia; Visualization, Dismas Wamalwa; Writing – original draft, Kennedy Konga.
Funding
This research received no external funding.
Institutional Review Board Statement
Not applicable.
Informed Consent Statement
Not applicable.
Data Availability
Data underlying this article can be provided from the corresponding author upon request. Also, it can be retrieved from NED database (
https://ned.ipac.caltech.edu/) using the search by parameters described in this article.
Acknowledgement
This research has made use of the NASA/IPAC Extragalactic Database (NED), which is operated by the Jet Propulsion Laboratory, California Institute of Technology, under contract with the National Aeronautics and Space Administration.
Conflicts of Interest
The authors declare no conflict of interest.
References
- Einstein, A. On the special and general theory of relativity. CPAE Engl. Transl. 1917, 6, 247–420. [Google Scholar]
- Park, C.-G.; Hyun, H.; Noh, H.; Hwang, J. The cosmological principle is not in the sky. Mon. Not. R. Astron. Soc. 2017, 469, 1924–1931. [Google Scholar] [CrossRef]
- Melia, F. The Friedmann–Lemaître–Robertson–Walker metric. Mod. Phys. Lett. A 2022, 37, 2250016. [Google Scholar] [CrossRef]
- Melia, F. A candid assessment of standard cosmology. Publ. Astron. Soc. Pac. 2022, 134, 121001. [Google Scholar] [CrossRef]
- Wang, M.; Fu, X.; Xu, B.; Yang, Y.; Chen, Z. Testing the FLRW metric with the Hubble and transversal BAO measurements, 2023. http://arxiv.org/abs/2305.01268.
- Aluri, P.K.; Cea, P.; Chingangbam, P.; Chu, M.-C.; Clowes, R.G.; Hutsemékers, D.; Kochappan, J.P.; Lopez, A.M.; Liu, L.; Martens, N.C. Is the observable Universe consistent with the cosmological principle? Class. Quantum Gravity. 2023, 40, 094001. [Google Scholar] [CrossRef]
- Díaz-Pachón, D.A.; Hössjer, O.; Marks, R.J. Sometimes size does not matter. Found. Phys. 2023, 53, 1. [Google Scholar] [CrossRef]
- Krishnan, C.; Mohayaee, R.; Colgáin, E.Ó.; Sheikh-Jabbari, M.M.; Yin, L. Does Hubble tension signal a breakdown in FLRW cosmology? Class. Quantum Gravity 2021, 38, 184001. [Google Scholar] [CrossRef]
- Weinberg, S. The cosmological constant problem. Rev. Mod. Phys. 1989, 61, 1–23. [Google Scholar] [CrossRef]
- Bassett, B.A.; Fantaye, Y.; Hlozek, R.; Sabiu, C.; Smith, M. A tale of two redshifts. ArXiv Prepr. 2015. ArXiv13122593.
- Wojtak, R.; Prada, F. Redshift remapping and cosmic acceleration in dark-matter-dominated cosmological models. Mon. Not. R. Astron. Soc. 2017, 470, 4493–4511. [Google Scholar] [CrossRef]
- Nyagisera, R.N.; Wamalwa, D.; Rapando, B.; Awino, C.; Mageto, M. A Critical Examination of the Standard Cosmological Model: Toward a Modified Framework for Explaining Cosmic Structure Formation and Evolution. Astronomy 2024, 3, 43–67. [Google Scholar] [CrossRef]
- Jeakel, A.P.; da Silva, J.P.; Velten, H. Revisiting f (R, T) cosmologies. Phys. Dark Universe 2024, 43, 101401. [Google Scholar] [CrossRef]
- Farnes, J.S. A unifying theory of dark energy and dark matter: Negative masses and matter creation within a modified ΛCDM framework. Astron. Astrophys. 2018, 620, A92. [Google Scholar] [CrossRef]
- Blake, C.; Wall, J. Measurement of the angular correlation function of radio galaxies from the NRAO VLA Sky Survey. Mon. Not. R. Astron. Soc. 2002, 329, L37–L41. [Google Scholar] [CrossRef]
- Penzias, A.A.; Wilson, R.W. A measurement of the background temperature at 1415 MHz. Astron. J. 1967, 72, 315. [Google Scholar]
- Pandey, B.; Sarkar, S. An information theory based search for homogeneity on the largest accessible scale. (2016).
- Bernardo, R.C.; Grandón, D.; Said, J.L.; Cárdenas, V.H. Parametric and nonparametric methods hint dark energy evolution. Phys. Dark Universe 2022, 36, 101017. [Google Scholar] [CrossRef]
- Wamalwa, D.S. On the FriedmannCosmology. Int. J. Pure Apllied Math. 2016, 107. [Google Scholar] [CrossRef]
- Langa, M.; Wamalwa, D.S.; Mito, C. Relativistic Dynamics in a Matter-Dominated Friedmann Universe. J. Astrophys. Astron. 2017, 38, 71. [Google Scholar] [CrossRef]
- Ryden, B. Introduction to Cosmology; Addison Wesley: San Franc. USA, 2003. [Google Scholar]
- Weinberg, S. Cosmology. OUP Oxford (2008).
- Wojtak, R.; Prada, F. Testing the mapping between redshift and cosmic scale factor. Mon. Not. R. Astron. Soc. 2016, 458, 3331–3340. [Google Scholar] [CrossRef]
- Aghanim, N.; Akrami, Y.; Ashdown, M.; Aumont, J.; Baccigalupi, C.; Ballardini, M.; Banday, A.J.; Barreiro, R.B.; Bartolo, N.; Basak, S. Planck 2018 results-VI. Cosmological parameters. Astron. Astrophys. 2020, 641, A6. [Google Scholar]
- Wechsler, R.H.; Zentner, A.R.; Bullock, J.S.; Kravtsov, A.V.; Allgood, B. The dependence of halo clustering on halo formation history, concentration, and occupation. Astrophys. J. 2006, 652, 71. [Google Scholar] [CrossRef]
- Péroux, C.; Nelson, D.; van de Voort, F.; Pillepich, A.; Marinacci, F.; Vogelsberger, M.; Hernquist, L. Predictions for the angular dependence of gas mass flow rate and metallicity in the circumgalactic medium. Mon. Not. R. Astron. Soc. 2020, 499, 2462–2473. [Google Scholar] [CrossRef]
- Huterer, D.; Shafer, D.L. Dark energy two decades after: observables, probes, consistency tests. Rep. Prog. Phys. 2017, 81, 016901. [Google Scholar] [CrossRef]
- Weinberg, D.H.; Dave, R.; Katz, N.; Hernquist, L. Galaxy clustering and galaxy bias in a ΛCDM universe. Astrophys. J. 2004, 601, 1. [Google Scholar] [CrossRef]
- Bond, J.R. Large Scale Structure in Universes Dominated by Cold Dark Matter. In Galaxy Distances and Deviations from Universal Expansion; Madore, B.F., Tully, R.B., Eds.; Springer Netherlands: Dordrecht, 1986; pp. 255–263. [Google Scholar]
- Peebles, P.J.E. The large-scale structure of the universe. Princeton university press (2020).
- Ade, P.A.; Aghanim, N.; Arnaud, M.; Ashdown, M.; Aumont, J.; Baccigalupi, C.; Banday, A.J.; Barreiro, R.B.; Bartlett, J.G.; Bartolo, N. Planck 2015 results-xiii. cosmological parameters. Astron. Astrophys. 2016, 594, A13. [Google Scholar]
Figure 1.
Simulation result for log (n) against redshift z for to of the standard Friedmann redshift model without .
Figure 1.
Simulation result for log (n) against redshift z for to of the standard Friedmann redshift model without .
Figure 2.
Simulation result for log (n) against redshift z for to of the standard Friedmann redshift model with .
Figure 2.
Simulation result for log (n) against redshift z for to of the standard Friedmann redshift model with .
Figure 3.
Simulation result for log (n) against redshift z for to of the standard Friedmann redshift model for an open universe without .
Figure 3.
Simulation result for log (n) against redshift z for to of the standard Friedmann redshift model for an open universe without .
Figure 4.
Simulation result for log (n) against redshift z for to of the standard Friedmann redshift model for an open universe with .
Figure 4.
Simulation result for log (n) against redshift z for to of the standard Friedmann redshift model for an open universe with .
Figure 5.
Simulation result for log (n) against redshift z for to of the standard Friedmann redshift model for a flat universe without .
Figure 5.
Simulation result for log (n) against redshift z for to of the standard Friedmann redshift model for a flat universe without .
Figure 6.
Simulation result for log (n) against redshift z for z=0 to z=5 of the standard Friedmann redshift model for a flat universe with λ.
Figure 6.
Simulation result for log (n) against redshift z for z=0 to z=5 of the standard Friedmann redshift model for a flat universe with λ.
Figure 7.
Simulation result for log (n) against redshift z for z=0 to z=5 of the Standard Friedmann redshift model for a closed universe without λ.
Figure 7.
Simulation result for log (n) against redshift z for z=0 to z=5 of the Standard Friedmann redshift model for a closed universe without λ.
Figure 8.
Simulation result for log (n) against redshift z for z=0 to z=5 of the standard Friedmann redshift model for a closed universe with λ.
Figure 8.
Simulation result for log (n) against redshift z for z=0 to z=5 of the standard Friedmann redshift model for a closed universe with λ.
Figure 9.
Simulation result for log (I) against redshift z for to . The solid curves represent the approximate standard Friedmann redshift model while dotted curves represent the standard Friedmann redshift model. Both models without λ.
Figure 9.
Simulation result for log (I) against redshift z for to . The solid curves represent the approximate standard Friedmann redshift model while dotted curves represent the standard Friedmann redshift model. Both models without λ.
Figure 10.
Simulation result for log (I) against redshift z for to . The solid curves represent the approximate standard Friedmann redshift model without while dotted curves represent the standard Friedmann redshift model with .
Figure 10.
Simulation result for log (I) against redshift z for to . The solid curves represent the approximate standard Friedmann redshift model without while dotted curves represent the standard Friedmann redshift model with .
Figure 11.
Simulation result for log (I) against redshift z for to . The solid curves represent the modified standard Friedmann redshift model with while the dotted curves represent the Standard Friedmann Redshift Model. Both models without λ.
Figure 11.
Simulation result for log (I) against redshift z for to . The solid curves represent the modified standard Friedmann redshift model with while the dotted curves represent the Standard Friedmann Redshift Model. Both models without λ.
Figure 12.
Simulation result for log (I) against redshift z for to . The solid curves represent the modified standard Friedmann redshift model with without while dotted curves represent the standard Friedmann redshift model with .
Figure 12.
Simulation result for log (I) against redshift z for to . The solid curves represent the modified standard Friedmann redshift model with without while dotted curves represent the standard Friedmann redshift model with .
Figure 13.
Simulation result for log (I) against redshift z for to . The solid curves represent the modified standard Friedmann redshift model with and while dotted curves represent the standard Friedmann redshift model. Both models without λ.
Figure 13.
Simulation result for log (I) against redshift z for to . The solid curves represent the modified standard Friedmann redshift model with and while dotted curves represent the standard Friedmann redshift model. Both models without λ.
Figure 14.
Simulation result for log (I) against redshift z for to . The solid curves represent the modified standard Friedmann redshift model with and without while dotted curves represent the standard Friedmann redshift models with .
Figure 14.
Simulation result for log (I) against redshift z for to . The solid curves represent the modified standard Friedmann redshift model with and without while dotted curves represent the standard Friedmann redshift models with .
Figure 15.
Simulation result for log (n) against redshift z for to of the standard Friedmann redshift model without .
Figure 15.
Simulation result for log (n) against redshift z for to of the standard Friedmann redshift model without .
Figure 16.
Simulation result for log (n) against redshift z for to of the standard Friedmann redshift model with .
Figure 16.
Simulation result for log (n) against redshift z for to of the standard Friedmann redshift model with .
Figure 17.
Simulation result for log (n) against redshift z for to of the standard Friedmann redshift model for an open universe without .
Figure 17.
Simulation result for log (n) against redshift z for to of the standard Friedmann redshift model for an open universe without .
Figure 18.
Simulation result for log (n) against redshift z for to of the standard Friedmann redshift model for an open universe with .
Figure 18.
Simulation result for log (n) against redshift z for to of the standard Friedmann redshift model for an open universe with .
Figure 19.
Simulation result for log (n) against redshift z for to of the standard Friedmann redshift model for a flat universe without .
Figure 19.
Simulation result for log (n) against redshift z for to of the standard Friedmann redshift model for a flat universe without .
Figure 20.
Simulation result for log (n) against redshift z for to of the standard Friedmann redshift model for a flat universe with .
Figure 20.
Simulation result for log (n) against redshift z for to of the standard Friedmann redshift model for a flat universe with .
Figure 21.
Simulation result for log (n) against redshift z for to of the standard Friedmann redshift model for a closed universe without .
Figure 21.
Simulation result for log (n) against redshift z for to of the standard Friedmann redshift model for a closed universe without .
Figure 22.
Simulation result for log (n) against redshift z for to of the standard Friedmann redshift model for a closed universe with .
Figure 22.
Simulation result for log (n) against redshift z for to of the standard Friedmann redshift model for a closed universe with .
Figure 23.
Simulation result for log (n) against redshift z for to . The solid curves represent the approximate standard Friedmann redshift model while dotted curves represent the standard Friedmann redshift model. Both models without λ.
Figure 23.
Simulation result for log (n) against redshift z for to . The solid curves represent the approximate standard Friedmann redshift model while dotted curves represent the standard Friedmann redshift model. Both models without λ.
Figure 24.
Simulation result for log (n) against redshift z for to . The solid curves represent the approximate standard Friedmann redshift model without while dotted curves represent the standard Friedmann redshift model with λ.
Figure 24.
Simulation result for log (n) against redshift z for to . The solid curves represent the approximate standard Friedmann redshift model without while dotted curves represent the standard Friedmann redshift model with λ.
Figure 25.
Simulation result for log (n) against redshift z for to . The solid curves represent the modified standard Friedmann redshift with and of the approximate standard Friedmann model while dotted curves represent the standard Friedmann redshift model. Both models without λ.
Figure 25.
Simulation result for log (n) against redshift z for to . The solid curves represent the modified standard Friedmann redshift with and of the approximate standard Friedmann model while dotted curves represent the standard Friedmann redshift model. Both models without λ.
Figure 26.
Simulation result for log (n) against redshift z for to . The solid curves represent the modified standard Friedmann redshift with and of the approximate standard Friedmann redshift model without in a matter dominated universe while dotted curves represent the standard Friedmann redshift model with .
Figure 27.
Simulation result for log (n) against redshift z for to . The solid curves represent the modified standard Friedmann redshift with of the approximate standard Friedmann redshift model while dotted curves represent the standard Friedmann redshift model. Both models without λ.
Figure 27.
Simulation result for log (n) against redshift z for to . The solid curves represent the modified standard Friedmann redshift with of the approximate standard Friedmann redshift model while dotted curves represent the standard Friedmann redshift model. Both models without λ.
Figure 28.
Simulation result for log (n) against redshift z for to . The solid curves represent the modified standard Friedmann redshift with of the approximate standard Friedmann redshift model without while dotted curves represent the standard Friedmann redshift model with
Figure 28.
Simulation result for log (n) against redshift z for to . The solid curves represent the modified standard Friedmann redshift with of the approximate standard Friedmann redshift model without while dotted curves represent the standard Friedmann redshift model with
|
Disclaimer/Publisher’s Note: The statements, opinions and data contained in all publications are solely those of the individual author(s) and contributor(s) and not of MDPI and/or the editor(s). MDPI and/or the editor(s) disclaim responsibility for any injury to people or property resulting from any ideas, methods, instructions or products referred to in the content. |
© 2024 by the authors. Licensee MDPI, Basel, Switzerland. This article is an open access article distributed under the terms and conditions of the Creative Commons Attribution (CC BY) license (http://creativecommons.org/licenses/by/4.0/).
