1. Introduction
Diabetes is one of the most dangerous diseases currently, as the source of its spreads’ most likely due to the human genetic causes. And the number of diabetic patients increases quickly in everyday and lack of no type of the vaccination and treatment to prevent and treat this the disease, it is necessary ford ,lop the blood of sugar sensor. Currently, Glucose monitoring devices have a very large commercial market and it is expected that these non-invasive glucose sensors will lead the glucose sensor market in the coming future as most of the market depends on finger pricking blood samples. It provides patients with relatively easy but not continuous information about changes in blood glucose levels in people with diabetes. Since the 1950s, microwave instrum9s have be increasing use in the wide range of the microwave applications[I]. The ability to determine parameters in a non-destructive manner makes it an ideal measurement for locations where sample contact is not possible. The property of microwaves also makes it ideal for non-invasive measurement of physiological parameters of the human body. One of these factors and the goals of the research is to study the dielectric constant of an aqueous solution of different blood samples for glucose concentrations, which diabetics must constantly monitor. This research aims to study the dielectric properties of aqueous solutions (ionic liquid) of different samples of sugars as a function of frequency. In this paper the detailed measurement of an aqueous electrolyte of distilled water in the frequency range of (20 Hz to 110 MHz )at room temperature. We also gave a brief introduction to ionic liquid in this paper. The proposed method is not only useful for a fairly simple electrolysis solution, but also for cell suspensions and biological material, if additional processes especially at low frequencies are sufficiently taken into account. [
2].
2. Dielectric—Constant
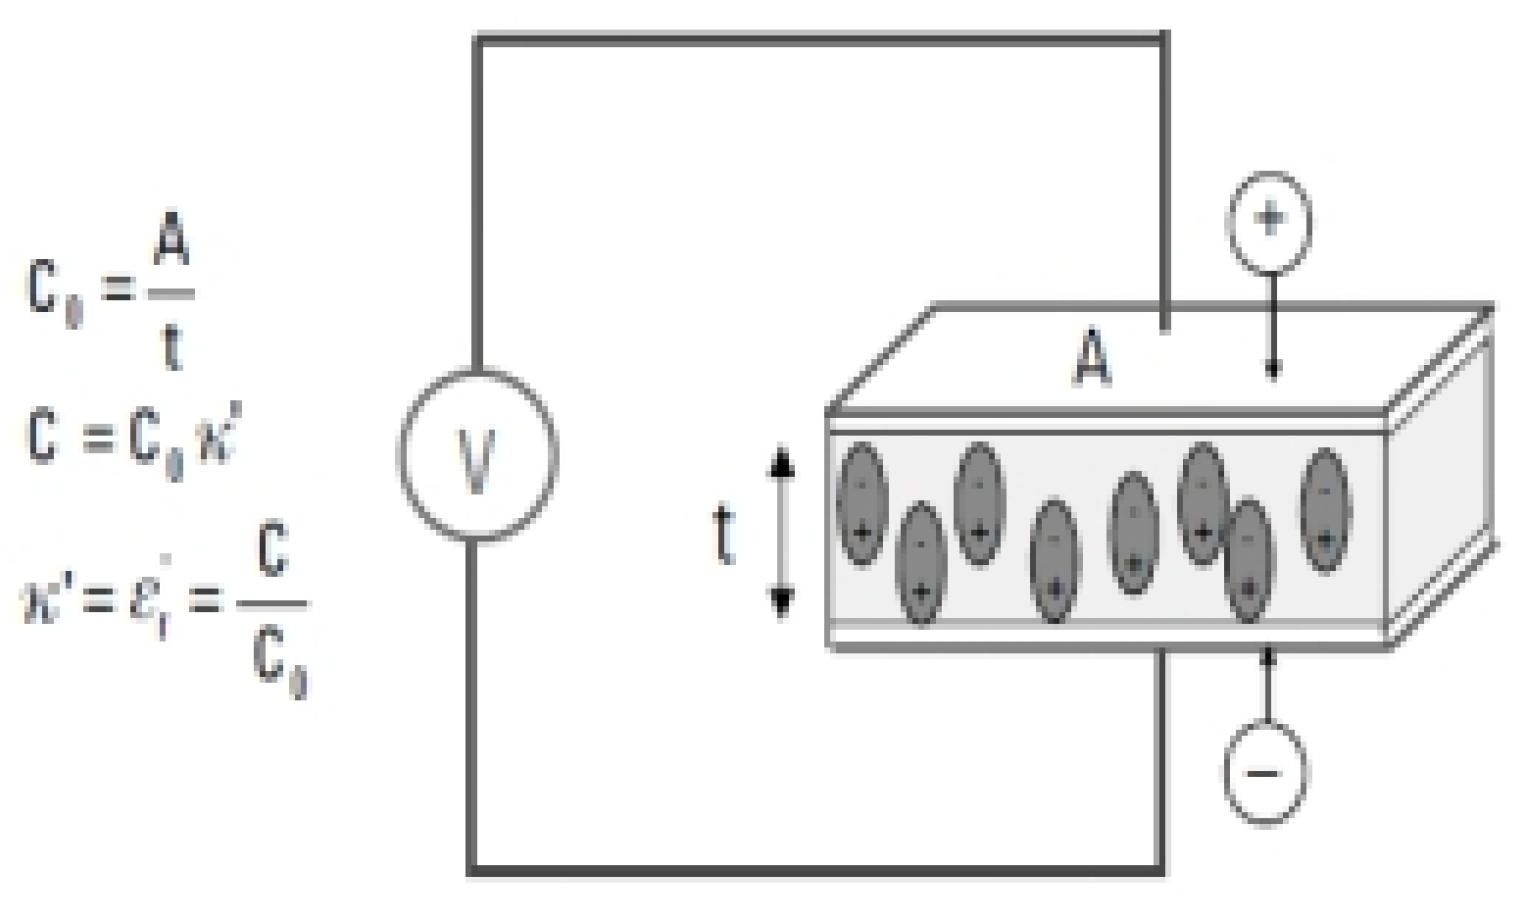
The insulating material has the ability to store electrical energy when it placed inside the plates of a capacitor in parallel, where a constant voltage source (V) is applied to the plates. This makes it store more charges compared to the absence of an insulating material, meaning a vacuum between the plates, and these charges are present between the plates. It reduces the electrical charges at the electrodes and thus increases the energy storage capacity of the capacitor. Also, the capacitance and the dielectric constant of the material are related to a relationship that is shown in the following
Figure 1, and it is noted from the figure that the capacitor of parallel plates connected to a constant voltage source (V) stores a greater charge when there is an insulating material between the parallel plates compared to when it is not there, meaning (vacuum) between the plates Parallel.
In the previous
Figure 1, both variables (C) and (CO) correspond to the capacitance of the capacitor in the presence of or without an insulating material. The true dielectric-constant or the permittivity is represented by(k’=ET’),As the variables (A) and (t) Which is represented by the area of the condenser and the distance between them. There is also an insulating material affects capacitance of the capacitor by balancing the charges on electrodes, which in turn affects the external electric field, as explained in the mathematical relationships mentioned previously. The following
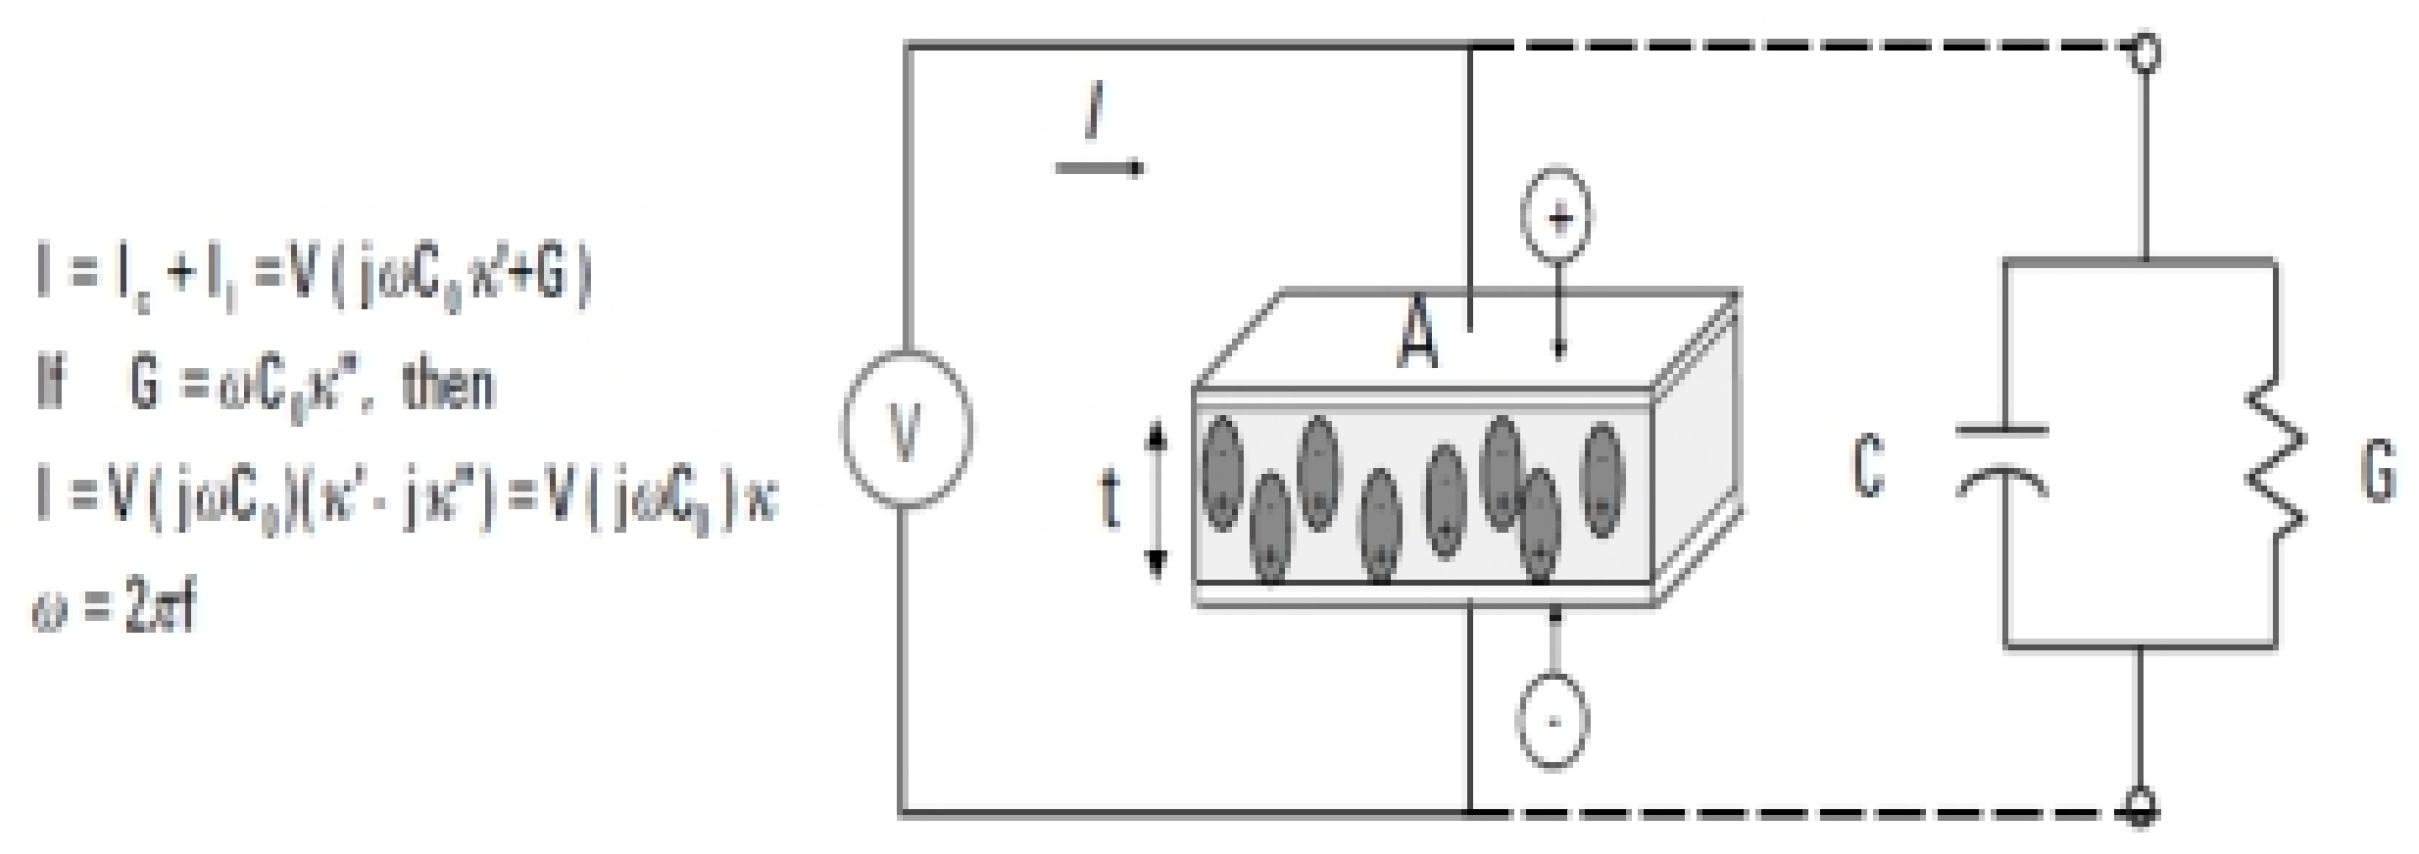
Figure 2 It shows the constant voltage source (V) directed to the capacitor in the circuit, as shown in
Figure 2, and the current resulting from the circuit can be divided into two branches: the charge current (LC) and the loss current (LL).,As insulation constant greatly affects this current. The material can also be represented by connecting both the conductivity (G) and the capacitor (C) in parallel.
The dielectric constant, which is symbolized by (k), has many different symbols such as (
k =
k ∗ =
εr =
εr). It also consists of two basic components: the imaginary—part, which is (k), which represents the loss, and the real—part, which is ( k’) which represents storage according to electromagnetic theory. Electrical displacement, which is the electric flux density, which is symbolized by (
Df), can also be defined as follows:
From the previous equation:
ε0 = 36 1 π × 10−9 F/m Which represents the permittivity of free space.
ET=denotes to relative permittivity.
E=denotes to electric field.
By using this equation (ε = ε ∗ = ε0 εr ) which represents to the absolute permittivity(or simply permittivity).
Permittivity is the complex property which used to describe how a substance responds to the electric field( E),This indicates interaction in this area.
When we compared between the permittivity of free space (ε0)and the dielectric—constant(k).We note that the value of relative permittivity(εr ) or absolute permittivity (ε) have them same value. The real part of the permittivity (εr ′ ) that indicates the amount of energy that be stored in the material when it applied to external electric field. On the other hand, the imaginary part of the permittivity (εr ″ )is represent the loss factor, Which measures the amount of loss of matter subjected to the external electric field. the imaginary part of permittivity (εr ″ )is being smaller than the real part (εr ′), but it is be always greater than zero. Also, conductive variables and dielectric constant have a significant impact on the total loss factor.
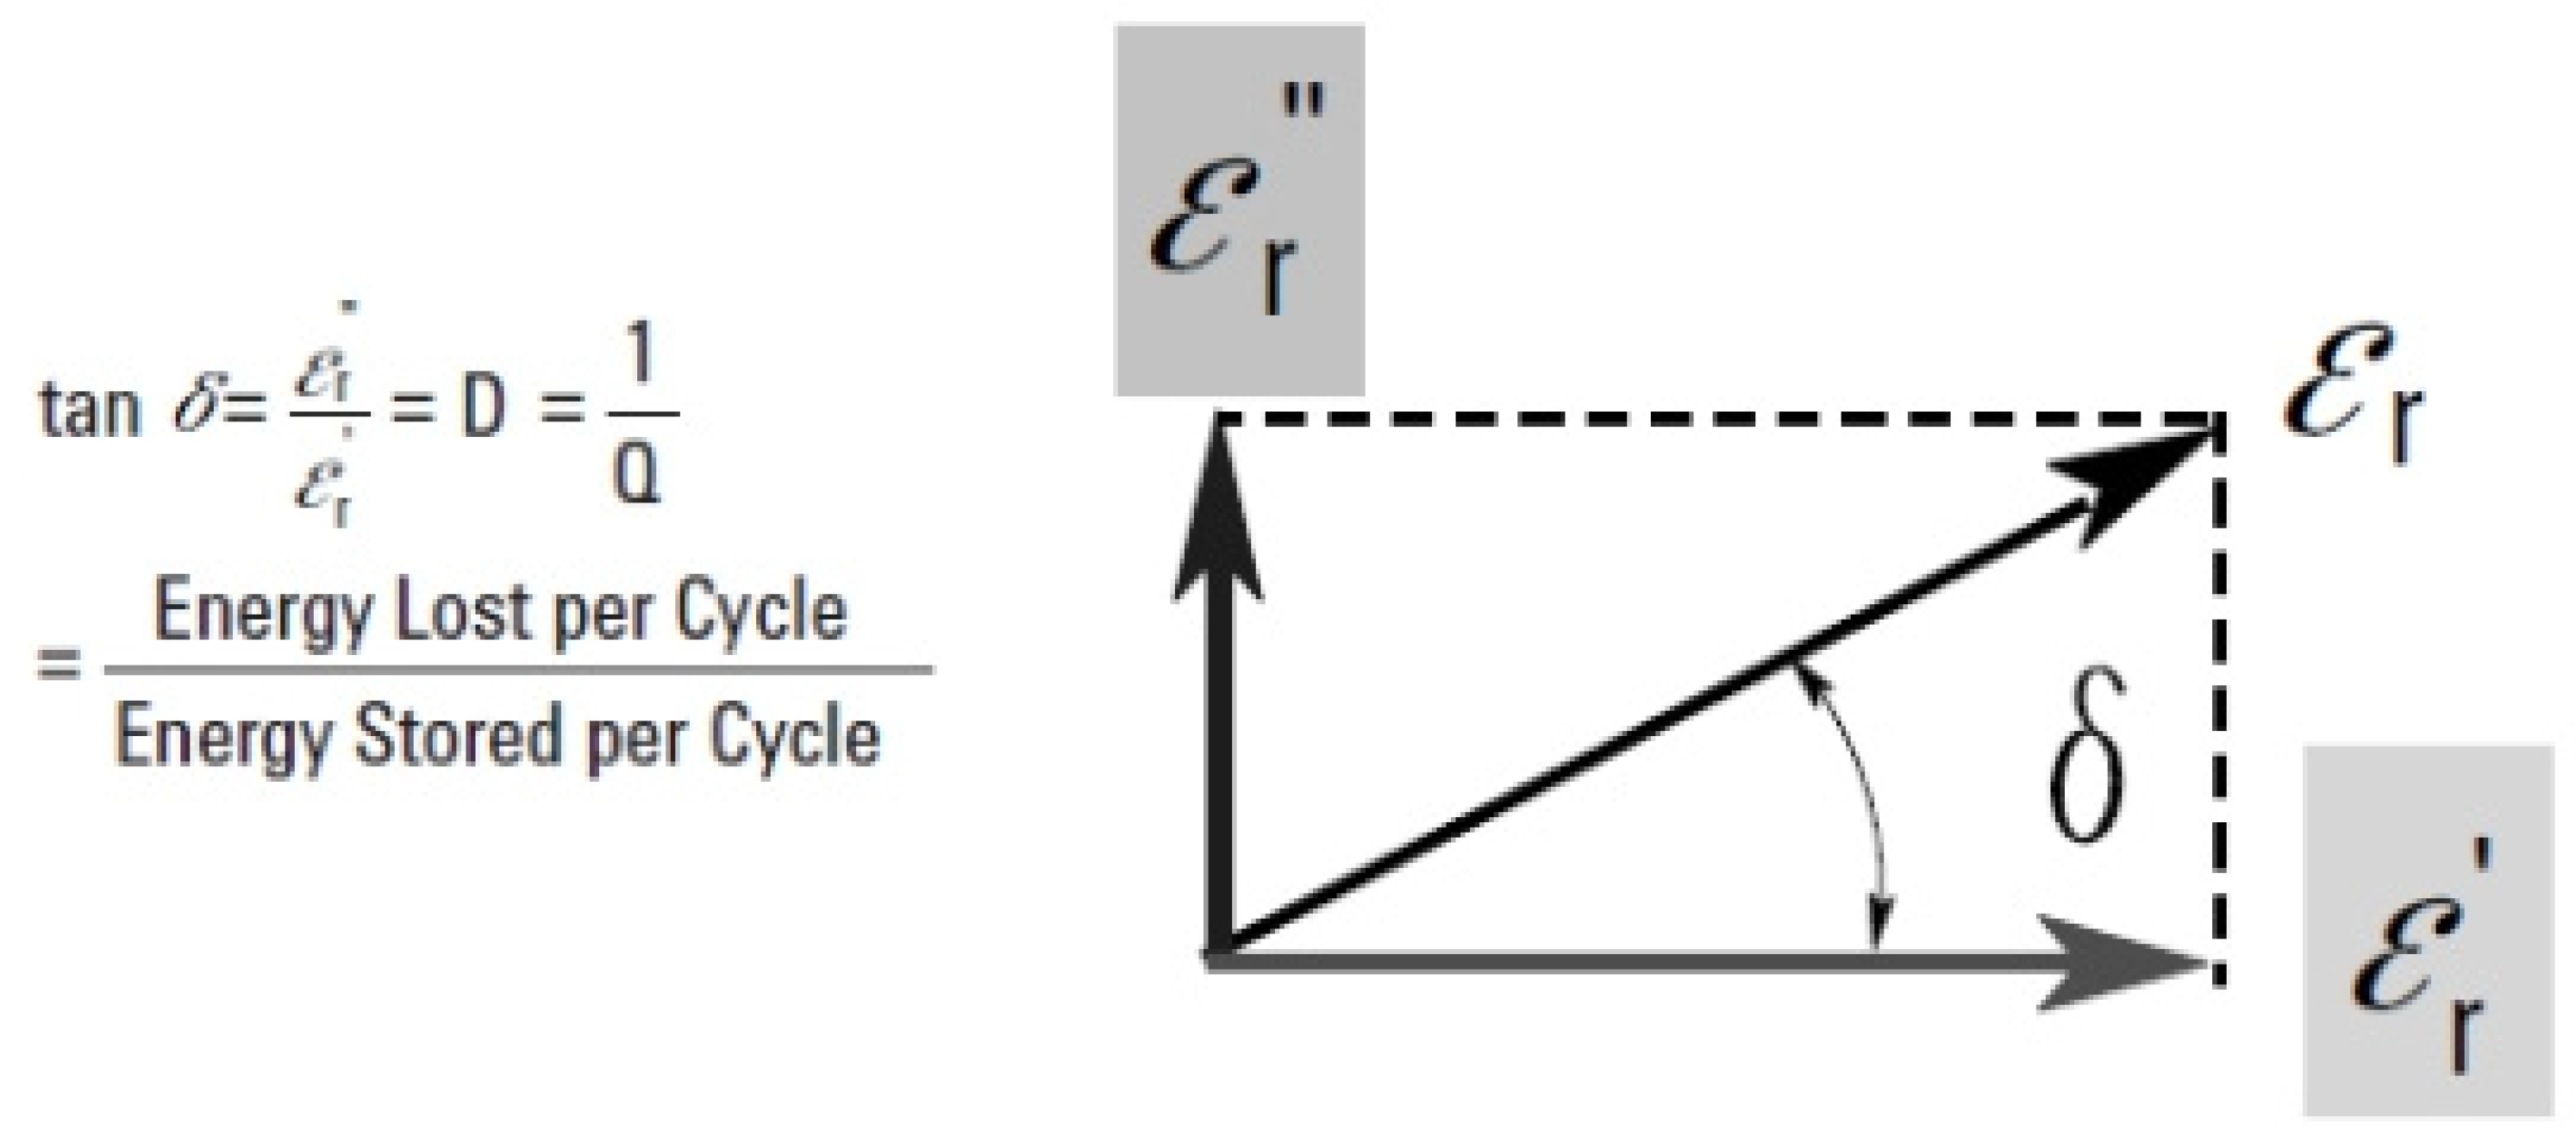
In a simple vector diagram representing that complex permittivity as shown in
Figure 3, the real and imaginary parts are depicted to as it being the angle (90°) out of the phase. When we can considering the real- axis (
εr ′), the combination of theme components forms an angle denoted by(
δ). The relative “loss” indicates the ratio of the material to the energy lost compared to the stored energy, and it can also be determined by the angle (δ).
The tangent loss, which is symbolized by (tan δ), is one of the most important elements in insulating materials. It represents the ratio between the imaginary and real components of the dielectric constant. It also determines the amount of energy loss in relation to energy storage in the material on which the external electric field is applied. The loss tangent also has a mutual relationship with the loss tangent, or tan delta. It is worth noting that it has different other names such as quality factor (Q) and loss factor (D). As for the electronic side, especially with regard to materials that contain microwave waves, we find that the inverse of the loss tangent is expressed through the quality factor or (x factor). The quality factor is defined as the efficiency of materials that store energy when an electromagnetic field is directed at them.
Expresses the loss tangent factor for materials with low losses in conventional units such as angles. For this reason, the loss tangent does not reach the mill radian or micro radian until it is proportional to the angle(δ), which is usually tan (δ). For this reason, the loss tangent was expressed in angles so that it can be compared with the dielectric properties of materials in which the energy loss is very small.
3. Permeability
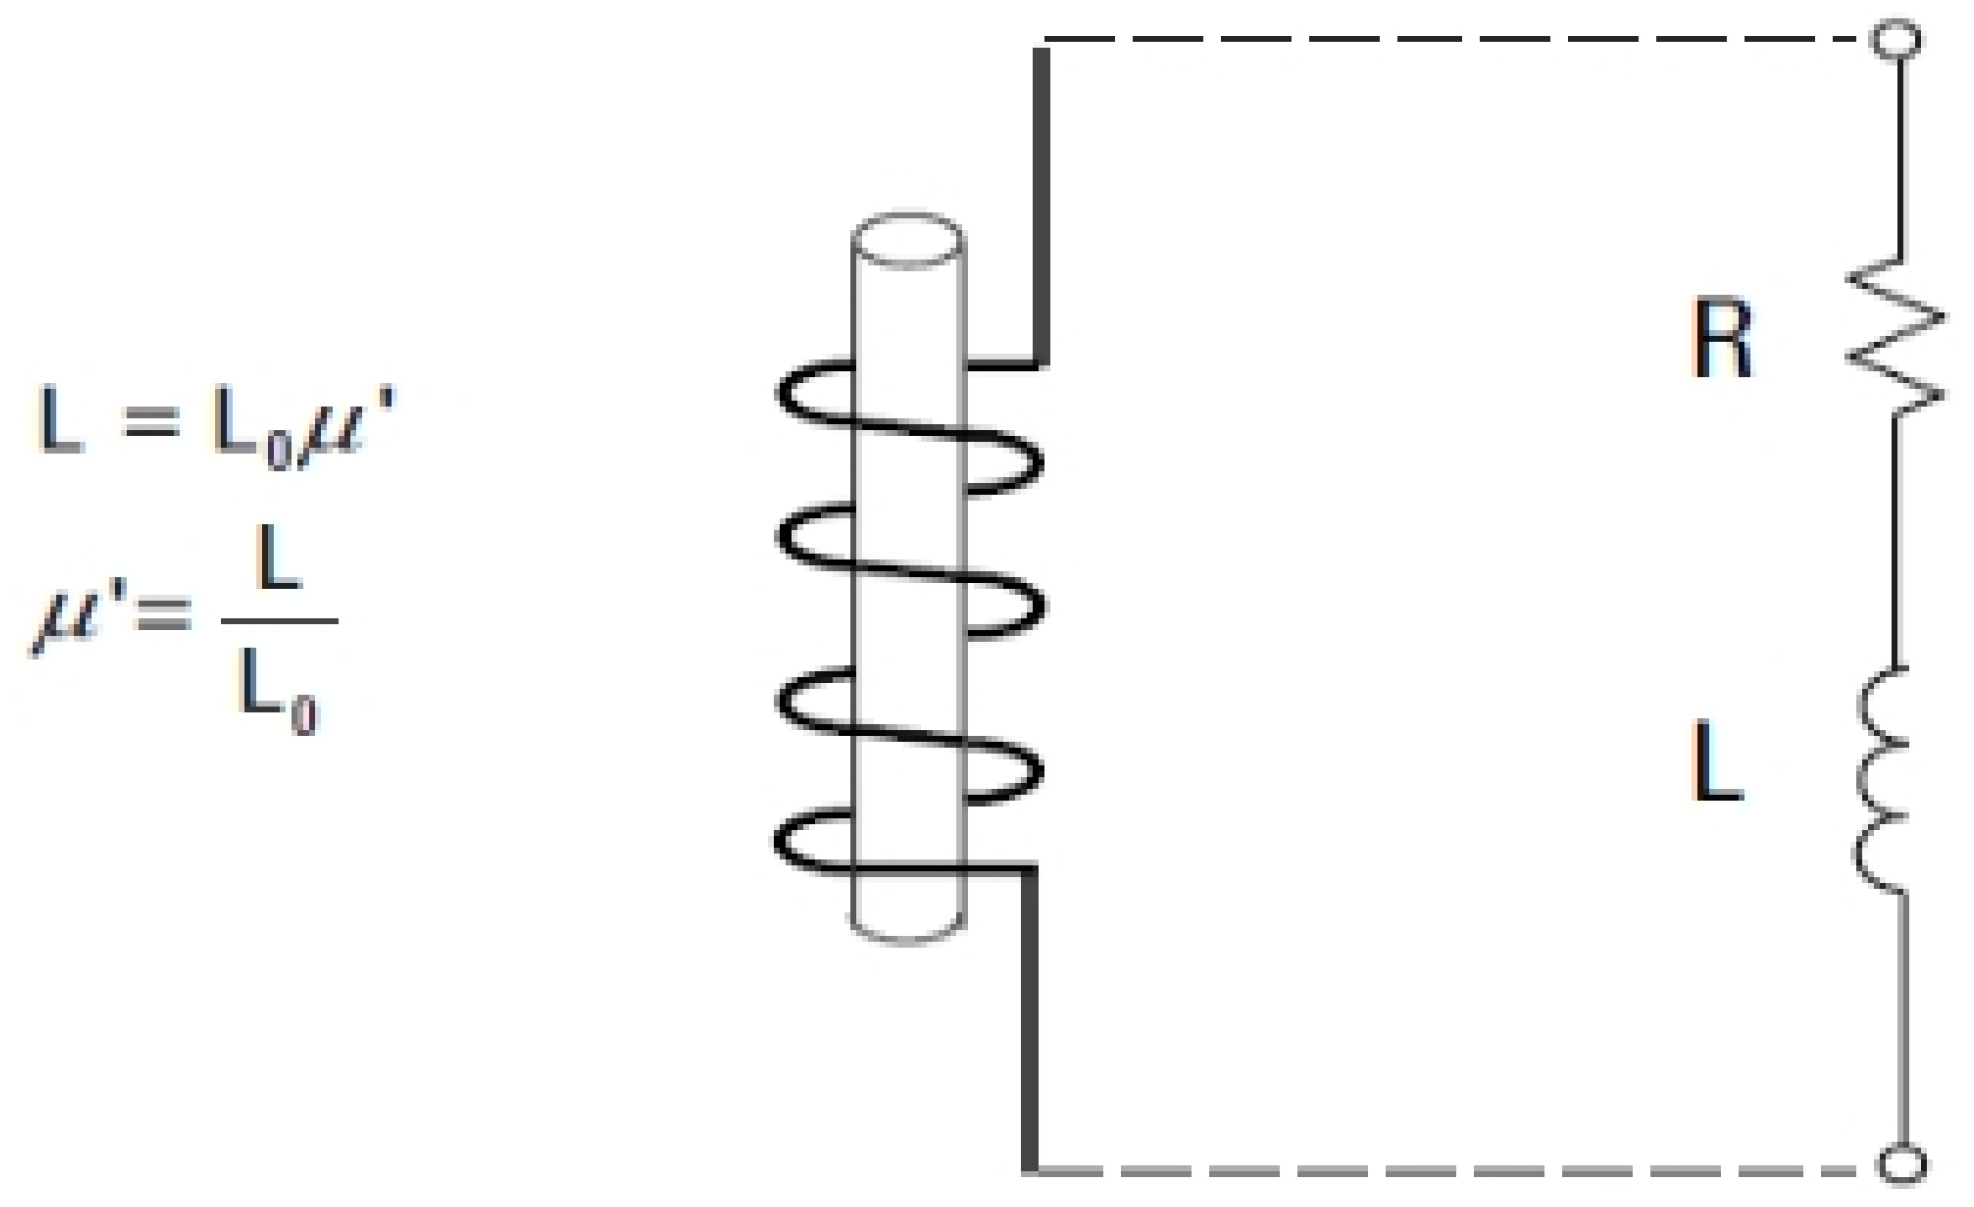
Permeability symbolized by (μ)), is the property that describes how a material interacts with a magnetic field. Therefore, it is necessary to use an inductor with resistance for calculate the core losses in the magnetic material, as shown in the following
Figure 4. A source of direct current was applied through inductor with its primary material, so that the inductance of the system was closely linked to permeability of the materials.
By use above equations when the variable (L) expresses for the inductance of coil in the presence of matters, while the variable(L0) expresses for the inductance of the coil itself but in free space. It also expresses the true permeability, which is symbolized by(μ’) which indicates the response of the material to the magnetic field if a sinusoidal alternating current source is applied to the inductor mentioned above.
The fore, the resulting voltage in the circuit will be analyzed into two components: the induced voltage and the loss voltage which are related to the opacity properties of the material’s permeability. The core loss in magnetic material can also be calculated by connecting the resistance (R) with the inductance (L) in series.
Complex permeability, symbolized by (μ* or μ)) It consists of two basic components: the real component (μ’), which expresses the energy storage property of the material, and the imaginary part (μ’’), which expresses the loss of energy. This is considered one of the general characteristics of complex permeability. During which it is possible to know how the material will interact with different magnetic fields. Also, the relative permittivity which is symbolized by the symbol (μ
r), which is a parameter that is used when we compare the permittivity of a material and the permittivity of free space, which is also considered one of the properties of electrical insulation.
μ0 = 4π x10−7 H/m Which represents the permeability of free space.
There are a lot of materials that do not have magnetic properties in them permeability is equal to the permeability of free space, which is equal to one (μr = 1)). There are also many materials that have magnetic properties. As iron (ferrite), cobalt, nickel and their alloys, which they have different permeability’s.
In this research we will focus on studying li1e dielectric properties for all materials and as result to calculate accurate The permittivity was measured comprehensively in order to know how these materials deal with electric fields.
4. Effect of the Dielectric-Constant on Blood Glucose Levels
When the dielectric is a constant for blood sugar, which is also called relative permittivity and is symbolized by (
εr), which represents an important electrical property through which the blood’s ability to store electrical energy is characterized when an electric field is applied to it. It is also defined as the ratio of the electrical capacity of blood sugar to its vacuum capacity, and it is an important indicator of the electrical insulation properties. The dielectric constant of blood sugar can vary greatly depending on some factors affecting it, such as its components, temperature, and molecular structure. In order to prove that the dielectric constant has a significant effect on the frequency response of an aqueous solution containing sugar, we used(CST Studio Suite) through numerical simulations, where the design is a corneal device with axial dimensions of (21.7 cm and 20 cm)respectively, and it mounted above a cylindrical model of the Aqueous solution with several sugar models. In miniature quantities it has (200cm) long and (30 cm) diameter. In the case of the dielectric constant, it is (2.3) and again for the dielectric constant, which is (3.5). In both cases, the specified frequency is used, ranging between (3.5–4 GHz), which is shown in
Figure 5 and
Figure 6.
We will notice in the above
Figure 7 and
Figure 8, There is a noticeable difference in the S11 signal in both cases when the dielectric constant is (2.3 or 3.5). This indicates that the dielectric constant has an effect on the reflection coefficient.
We will notice that there is repeating pattern in the waveform, and there as on for this repeating pattern is due to the interaction of the wave with the bottom of the solution and thus led to its reflection. When the solution contains sugar, two changes will appear in it: First: There is a shift in the periodicity of these frequencies, and second: Because of the losses, attenuation will become apparent at high frequencies.
5. Transmissionlinemethod
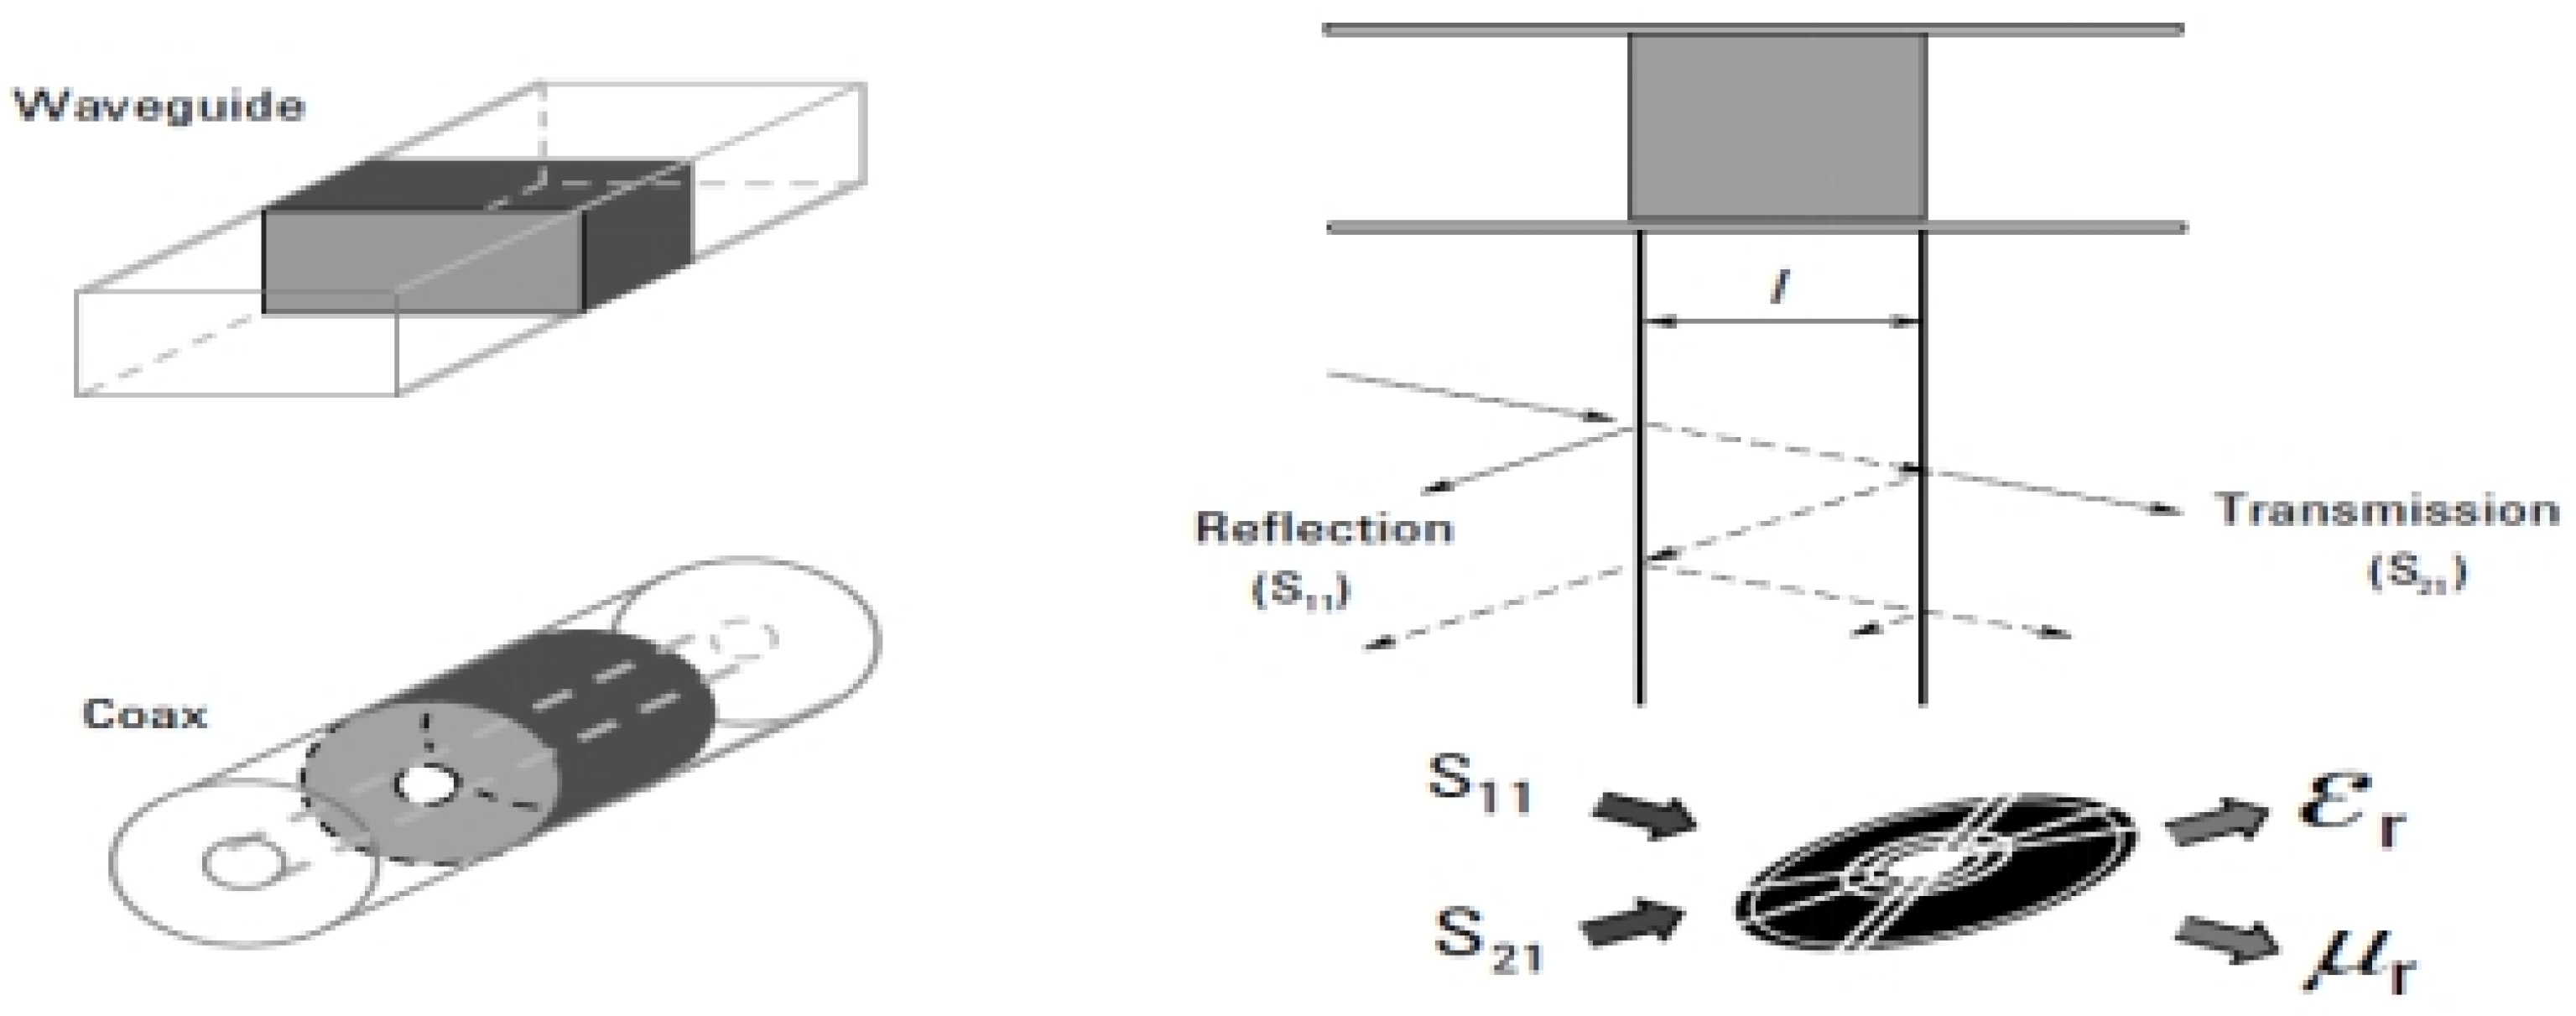
The transmission line method requires placing material within a limited portion of the conveyor line. This line that consists of apportion of a certain rectangular wavelength, as shown in
Figure 9. After that, the values of (ET*and µr* )are derived by analyzing there flecked signal, which is represented by(SI I)and the transmitted signal, which is represented by (S21).
5.1. State of Physical Assumptions
• The sample occupies a cross-sectional area of the facility.
• There are no voids or air gaps along the walls of the facility.
•The faces should be : smooth, flat, and perpendicular to long axis.
• The sample must be :uniform and homogeneous in all its parts.
5.2. Method Features
• This method gives us the minimum broadband capabilities that can be practically determined for this sample.
• Accuracy is low and depends on the length of the sample.
• This method is suitable for evaluating the magnetic properties of materials.
• Wavelength characteristics that allow measurement of materials with different properties.
The wavelength characteristics allow the use of frequencies up to the millimeter wave range with zonal frequency coverage. The ideal measurement method, which uses the transmission line method, depends on the vector network analyzer, which converts the measured data into permittivity (ET*and µr*). Specialized communication programs can also be used for the purpose of communicating with an external computer. It is also possible not to use an external computer if using the PNA family of network analyzers, as they can be installed directly.
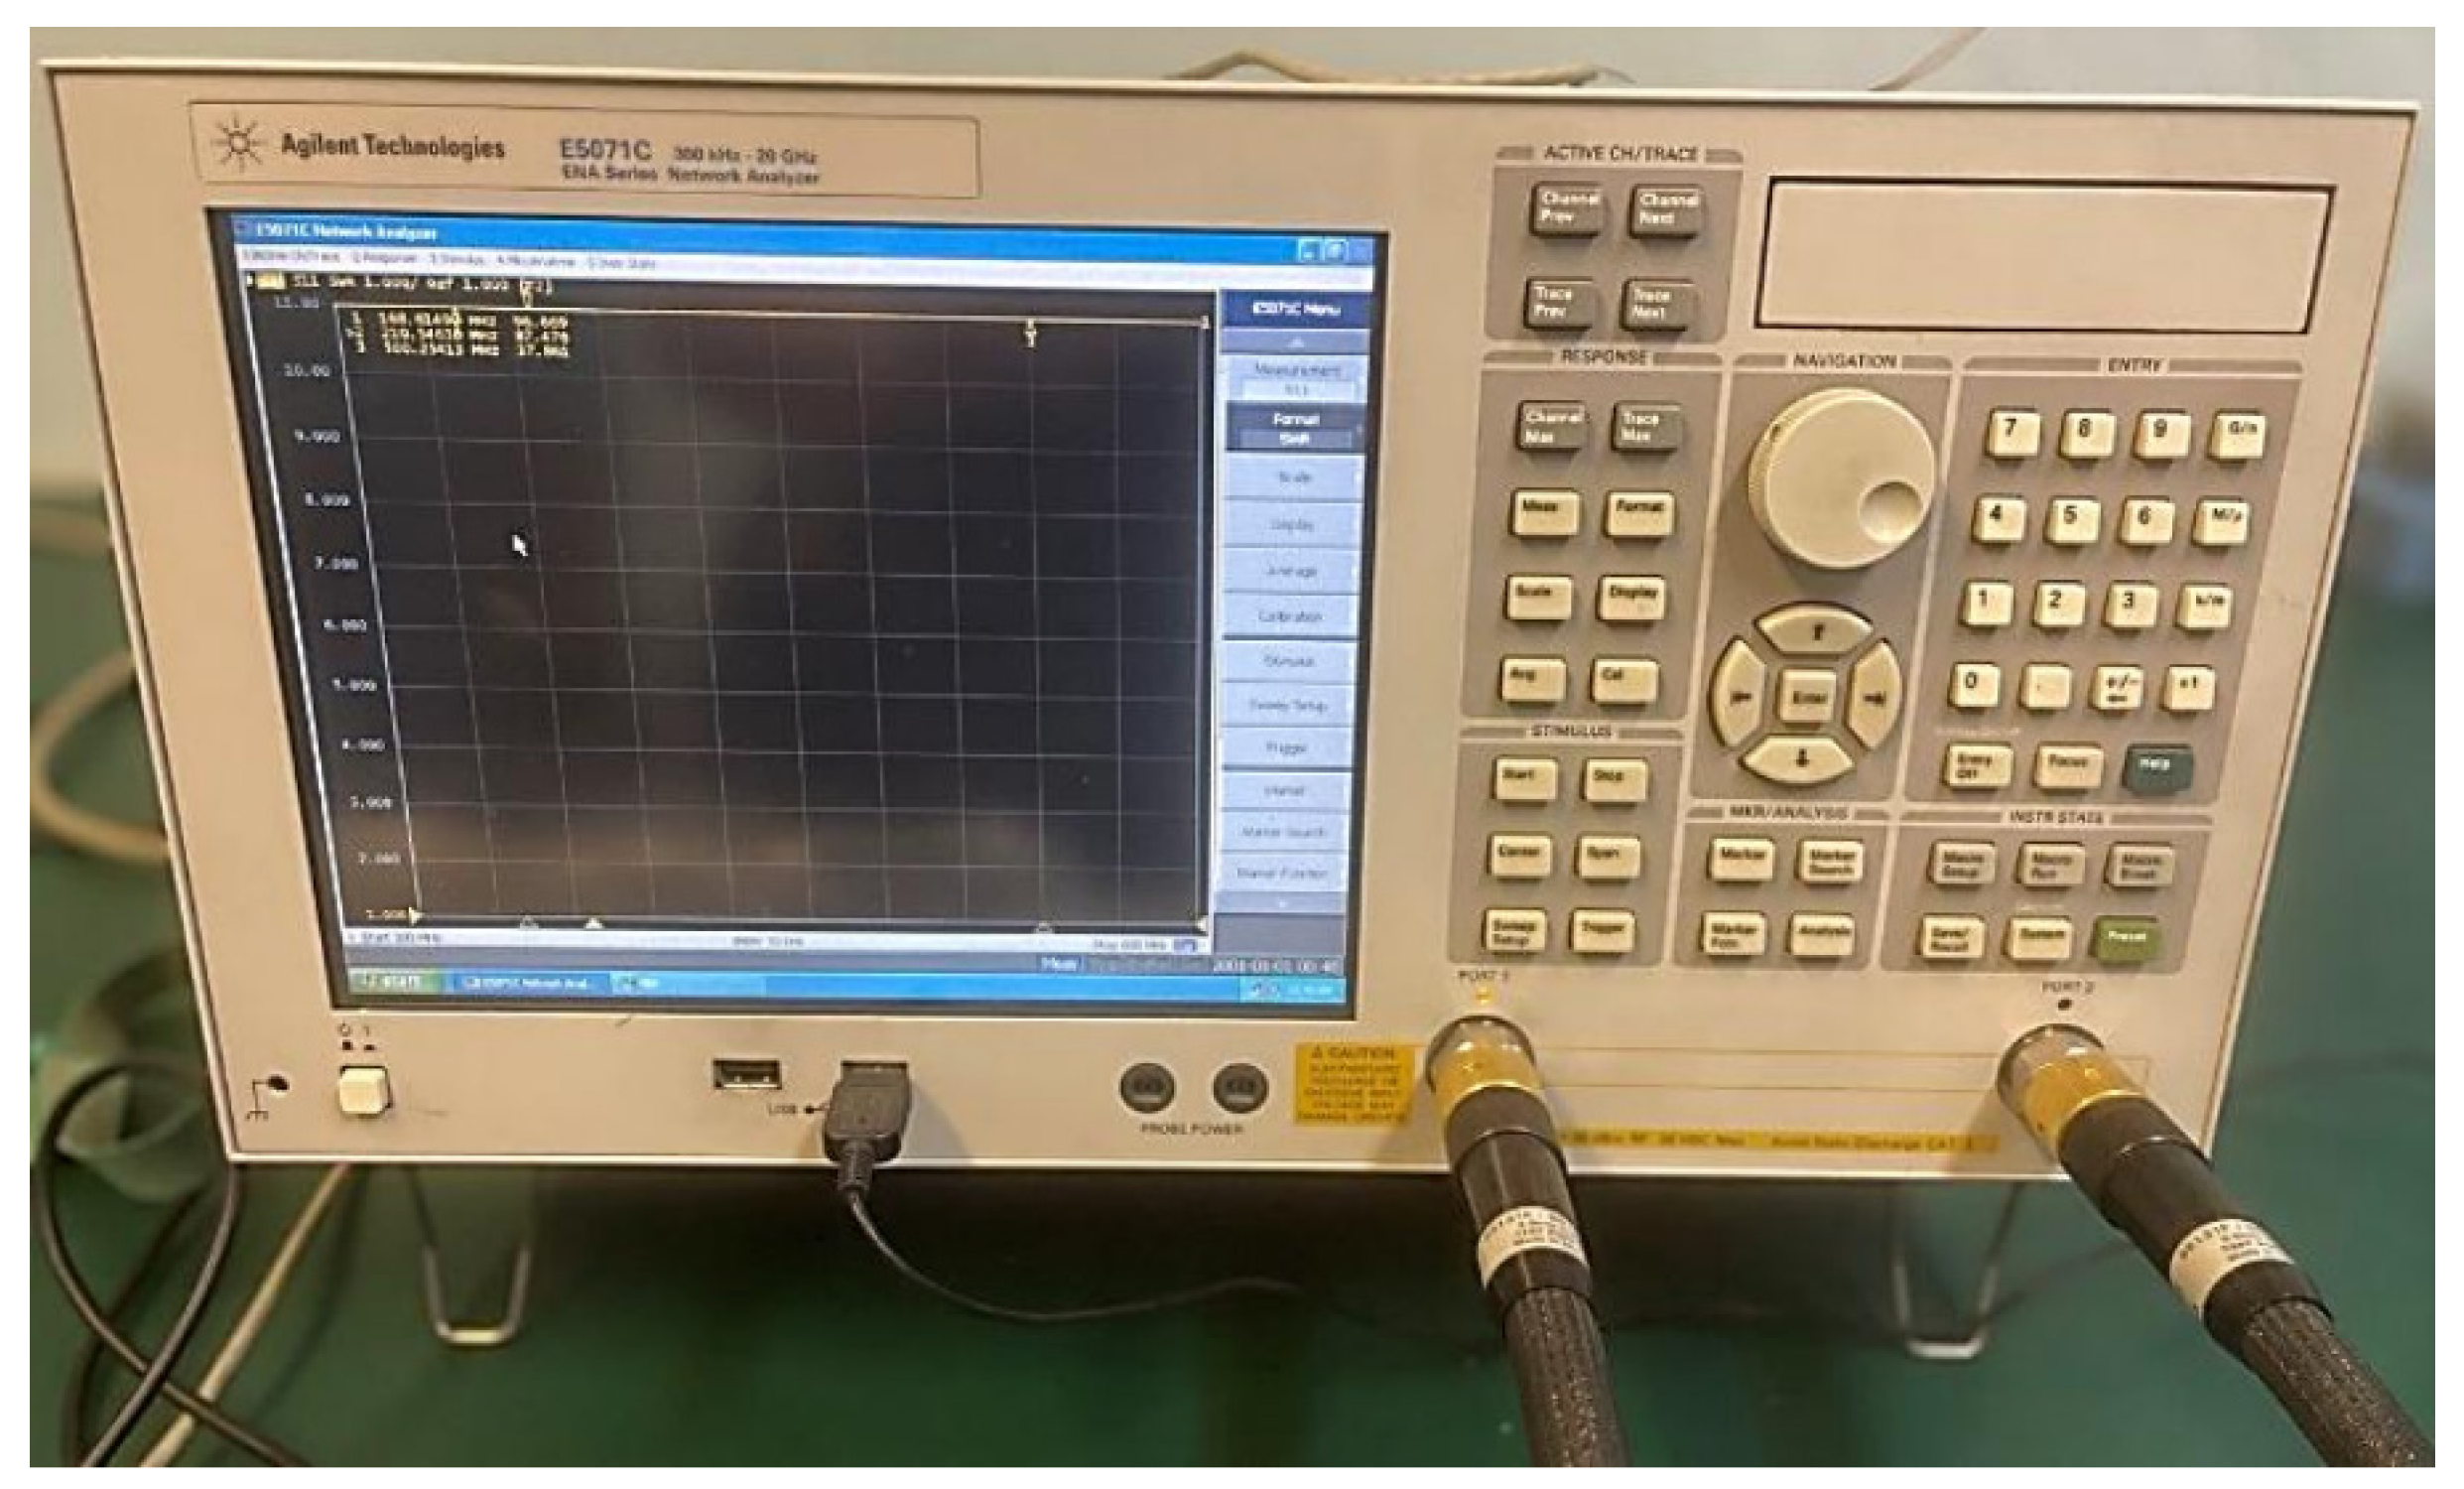
In this research, we used (ENA), i.e., a serial network analyzer of the type (E 5071 C), as shown in
Figure 10. In which a band of bandwidth ranging from (300 kHz to 20 GHz) is used.
In the following table, the results are known for the basic parameters, which are: the cut-off frequency, which is symbolized by (fc), the lowest frequency, which is symbolized by (flow), the highest frequency, which is symbolized by (upper), the real part of the dielectric constant, which is symbolized by (e part real). The imaginary frequency is the dielectric constant, symbolized by (e part imaginary), and the loss tangent. Through results we notice the values of the insulating properties of the materials that used, and they will also help us understand the behavior of these materials at a range of frequencies.
Table 1.
results for the dielectric-constant for different the samples of sugar.
Table 1.
results for the dielectric-constant for different the samples of sugar.
Temperature (Celsius degrees)
|
fc
|
flow |
upper |
e part real |
e part imaginary |
Loss Tangent
|
relative permittivity(εr) for (water) |
| 18 |
10.4614 |
10.4545 |
10.4681 |
4.1134 |
1.0188 |
0.2477 |
1–88 at 0 |
| 20 |
10.4671 |
10.4632 |
10.4715 |
3.7228 |
0.0644 |
0.0173 |
3–80 at 20 |
| 55 |
0.1296 |
1 |
0.1258 |
11.2367 |
11.2196 |
11.2273 |
5–55 at100 |
| 65 |
10.4673 |
10.4716 |
0.0163 |
0.0604 |
3.7068 |
10.4634 |
34 at 200 |
These values were prepared from the results in an investigation laboratory at the Amirkabir University of Technology in Tehran in the Iranian Republic, with all appreciation and thanks for their cooperation.
6. Network Analyzers
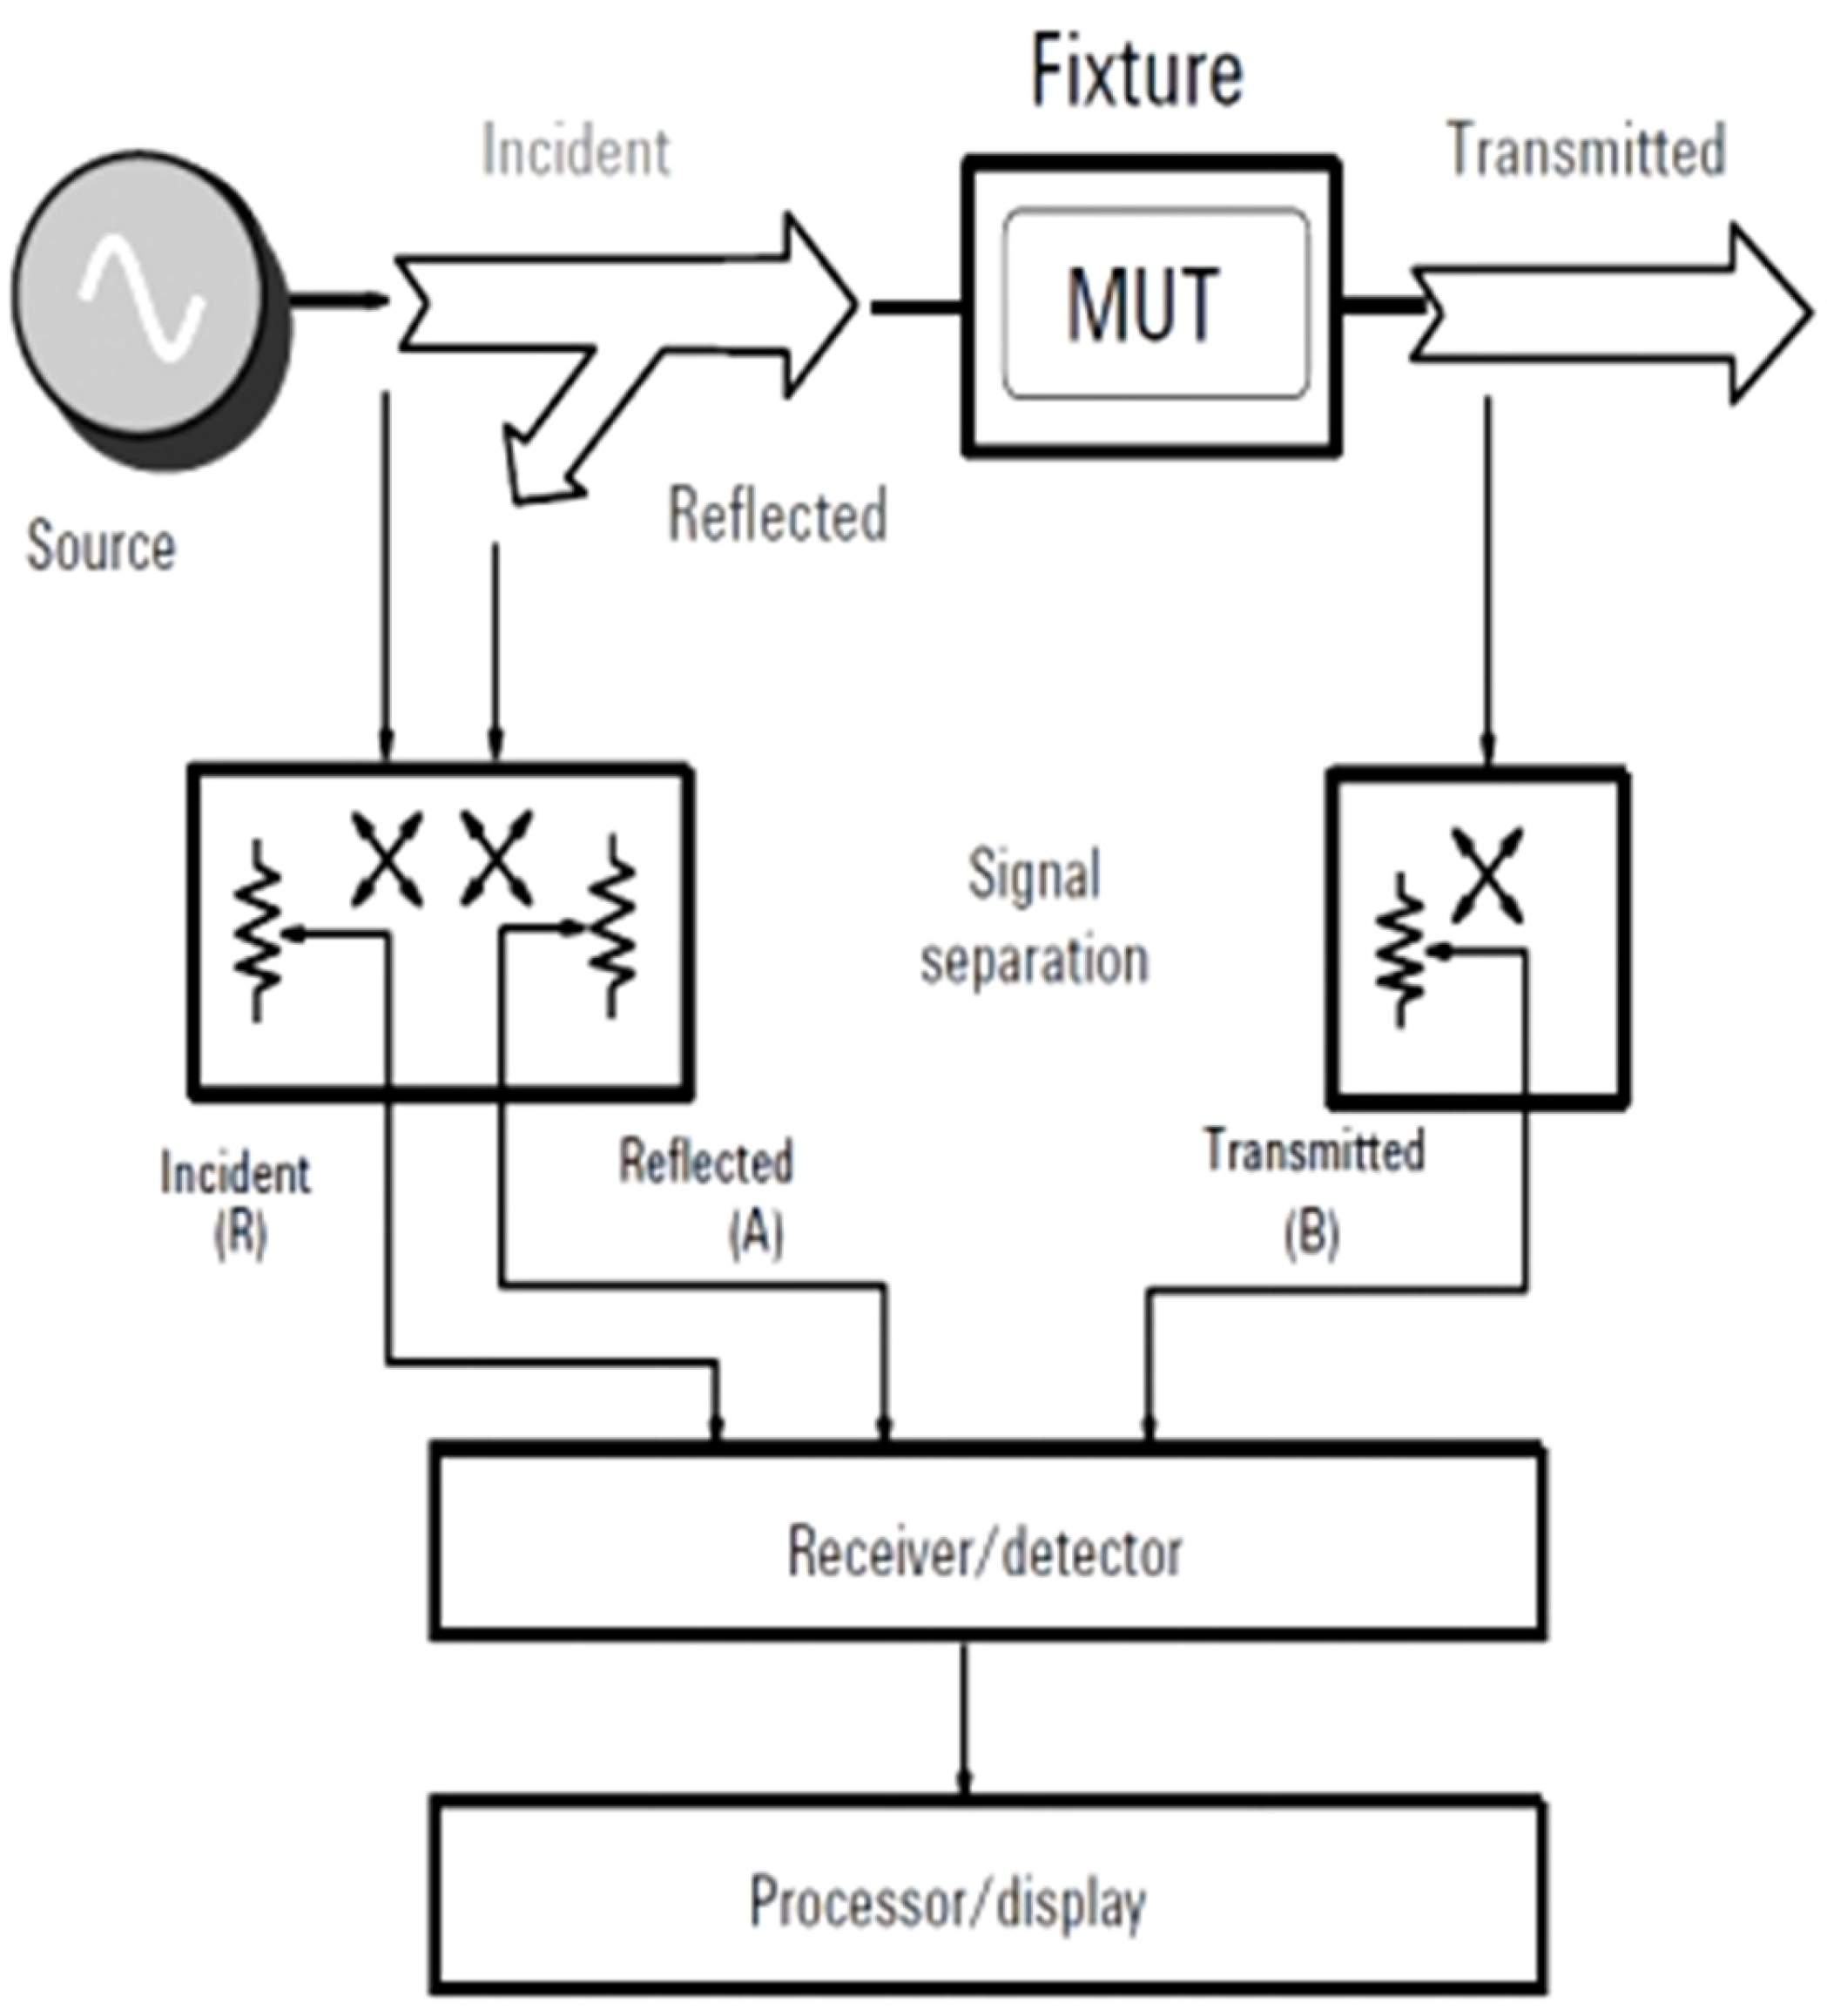
The permittivity and permeability of materials are calculated by measuring the reflection or transmission of high frequency signals, and can also be calculated by efficiency using vector network analyzers such as: Performance Network Analyzer (PNA), PNA-L, Economic Network Analysis (ENA) which are able to Conducting stimulus and response measurements through a group by using a band of different frequencies that range from (300 kHz to 110 GHz) and can also be (325 GHz) as shown in
Figure 11.
The analyzer also uses a vector network, as it consists of a signal source, a receiver, and a display screen. The signal source emits a single frequency signal, which is directed towards the substance (the sugar solution), while the receiver uses the frequency to be adjusted in order to capture the signals reflected and transmitted from the sugar solution. The measured data will also be prepared in terms of magnitude and phase information at that frequency used. The source will then begin to shift to subsequent frequencies, so the method is repeated to display the reflectometry and transmission responses as a function of frequency.
7. Conclusion
We note that the previous results contain in accuracy and a high probability of errors. We also note that some values in the results contain random fluctuations. We also note that some values in the results carry negative signs. These random fluctuations are due to many reasons, including:
- ■
The measurement process was in accurate for the electrical insulation properties due to the difficulty of reaching the aqueous solution containing sugar inside the tube due to the small hole in the waveguide. This led to in accurate measurement of the values we obtained.
- ■
The temperature range had a significant impact on the aqueous solution containing sugar. Distilled water was prepared, the a few grams of sugar were added, the nit was placed in the tube and then introduced in to the waveguide. This process took many steps that had a significant impact on our obtaining This measurement is not accurate in the results values.
- ■
It is common to believe that it should be noted that this method is not suitable for aqueous solutions in particular and for liquids in general, especially when used on solids because it usually results in an inaccurate measurement.
- ■
Through our observation of these results, scientists and some engineers specialized in this field discovered that this method is considered somewhat old in analyzing liquids. Therefore, another method must be used to analyze liquids, which is the use of the open-ended coaxial probe, which is the preferred method for studies that based on fluid analysis. It is likely that this The altemat.ive method leads us to obtain more accurate results. Consequently, values with accurate measurement and more reliability will be obtained than the previous method, through which the general properties of insulating materials are identified, whether for liquids or for various other materials.
References
- Dielectric properties of glucose in bulk aqueous solutions: Influence of electrode polarization and modeling. [CrossRef]
- Frequency Dependent Dielectric Study of Aqueous Electrolytes. [CrossRef]
- Enhancing quality of services using genetic quantum behaved particles warm optimization for location dependent services. [CrossRef]
- Low cost and compact wide band microwave notch filter based on miniaturized complementary metaresonato. [CrossRef]
|
Disclaimer/Publisher’s Note: The statements, opinions and data contained in all publications are solely those of the individual author(s) and contributor(s) and not of MDPI and/or the editor(s). MDPI and/or the editor(s) disclaim responsibility for any injury to people or property resulting from any ideas, methods, instructions or products referred to in the content. |
© 2024 by the authors. Licensee MDPI, Basel, Switzerland. This article is an open access article distributed under the terms and conditions of the Creative Commons Attribution (CC BY) license (https://creativecommons.org/licenses/by/4.0/).
