Introduction
Over the last two decades, the use of microbial metabolic processes for biocementation, Microbially Induced Calcium Carbonate Precipitation (MICP), to improve the durability of construction materials has sparked significant interest in an array of sectors, including wind-induced desertification [
1,
2,
3,
4], soil stabilization [
5,
6,
7,
8,
9,
10,
11,
12,
13,
14,
15], and most importantly, building construction [
16,
17,
18,
19,
20,
21,
22,
23,
24,
25,
26,
27]. Compared to conventional techniques that rely on Portland cement, biocementation offers several benefits: since the MICP occurs at room temperature, the embodied energy is reduced by 43–95% compared to ordinary cement [
28]; The MICP exhibits a carbon footprint that is around 18–49.6% lower than conventional cement [
28,
29]; comparatively low viscosity of the cementation solution and bacterial suspension in MICP permits migration through the pores of the concrete, resulting in improved permeability [
30]; The smaller size of bacteria (<10 μm) compared to cement particles (<40 μm) increases the effectiveness of MICP for holes as small as 6 mm [
31]. The literature extensively examines the process of biocementation across a wide range of microorganisms, including bacteria, cyanobacteria, fungi, microalgae, and even the enzymes derived from these microorganisms [
15,
17,
27,
32,
33]. Bio-cementation is a complex process that is influenced by a multitude of variables. The quality and quantity of calcium carbonate (
CaCO3) precipitation are influenced by the following parameters [
16,
34,
35]:
The type of microorganism (e.g., with high, medium, or low urease activity).
The condition of the microorganism (e.g., whether it is a live cell, cell fraction, or isolated enzyme).
The method of application (e.g., mixing, spraying, injection, or percolation).
The environmental conditions, including pH, temperature, and nutrition media, as well as the presence of nucleation sites for bacterial growth (grain size).
Although there have been notable advancements in the experimental characterization of bio-cementation at the laboratory scale, there remains a need for a comprehensive investigation into the viability of scaling up this technology to the construction site and field scale. Computational models capable of forecasting optimal environmental conditions and application processes for bio-cementation that consider how different factors that affect bio-cementation are connected can facilitate the optimization and scalability of this technology. Nevertheless, computational modeling of bio-cementation has not achieved significant advancements in comparison to experimental characterization [
20]. Only a limited body of research has been dedicated to the numerical modeling of bio-cementation, featuring a predominant emphasis on application process parameters rather than the simulation of environmental variables' impacts [
36,
37]. Qin et al. [
36] employed the PHREEQC program to conduct simulations on the progression of biofilm formation, the introduction of nutrition medium, and the generation of calcium carbonate. The simulations were conducted at different injection flow rates, which includes pore sizes ranging from 18 to 400 µm. A simple model created by Sharma et al. [
37] was designed to replicate the kinetics of bacterial ureolysis, the dynamic equilibrium between the liquid-gas interface and ion supersaturation, and the kinetics of calcite production. To a good level of accuracy, their model reproduced exponential growth for pH variation and sigmoidal growth for electrical conductivity for hourly monitored experiments for
S. pasteurii,
B. subtilis, and
B. sphaericus at an initial pH of about 6.7. Nevertheless, there are two aspects that remain ambiguous regarding the performance of this model. Firstly, the experimental data was collected at hourly intervals, thereby excluding the initial 30-minute period of kinetics during which the system exhibits the highest pH fluctuations. Secondly, the experiments were carried out at a pH of approximately 6.7, which falls within the optimal pH range for all bacterial species.
The main reason for the significant constraint in computational model development for this phenomenon is the intricate structure of the process, which takes place across several temporal and dimensional scales and encompasses interconnected biological, chemical, hydraulic, and mechanical processes.
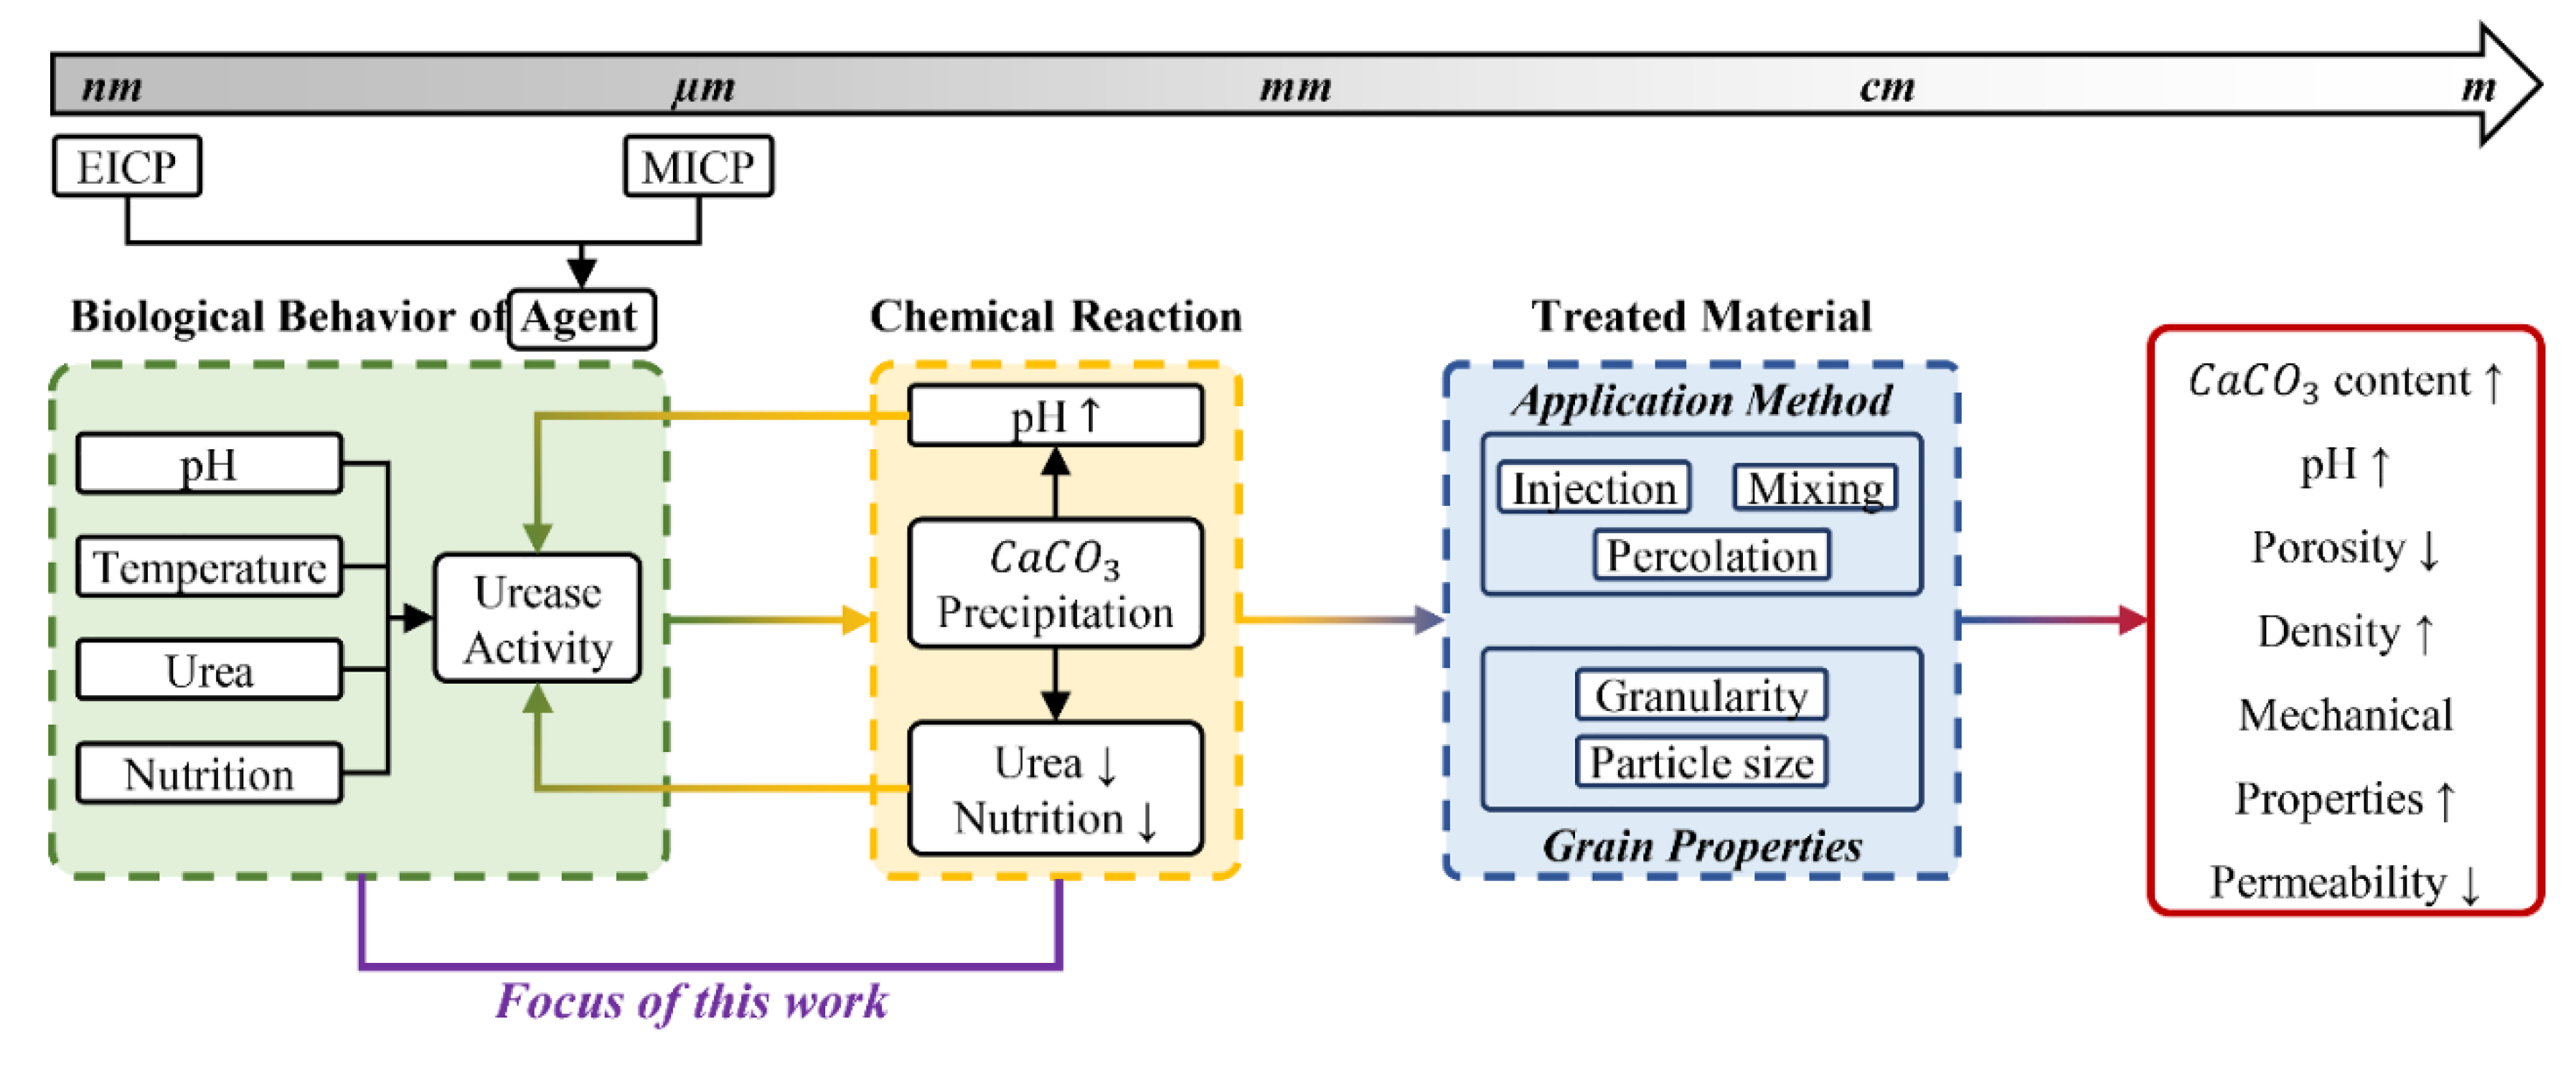
Figure 1 displays a more detailed schematic representation of the workflow proposed by S. Khoshtinat [
16] for a comprehensive computational model of interconnected elements in bio-cementation across disciplines and dimensional scales as inputs for numerical modeling of this phenomenon. To optimize bio-cementation, the initial step is to determine the ideal environmental conditions that stimulate the maximum urease activity in microorganisms. A computer model capable of predicting the result of bio-cementation, taking into account environmental factors, can provide insights into optimizing the efficiency of bio-cementation exploitation. pH is the most influential environmental factor on microorganisms' metabolic processes. This is because the precipitation of
CaCO3 leads to changes in the pH of the environment, which in turn continuously affects the activity of urease in microorganisms , resulting in a loop between the urease activity rate and pH variation [
35,
38,
39].
Sporosarcina pasteurii has been extensively researched, and Paassen [
38] has conducted a comprehensive experimental and analytical investigation that is notable in the current literature. This investigation has produced physical and chemical models that clarify the several crucial factors that influence the bio-cementation process. Hence, this study aims to investigate the development of a numerical model that predicts the impact of various environmental variables, such as pH, urea, and calcium concentrations, on the bio-cementation of
Sporosarcina pasteurii, with special emphasis on the temporal variations in pH levels within the environment (
Figure 1). The initial section of this paper provides an overview of the theoretical underpinnings of bio-cementation phenomenon, encompassing the examination of environmental factors that impact urease activity and govern biochemical processes. The subsequent section provides a comprehensive elucidation of the computational model structure in COMSOL Multiphysics
®. Following this, the reliability of the model is evaluated by comparing the simulation's predictions for
CaCO3 concentration, pH variation over time, and electrical conductivity under certain experimental conditions with the experimental results reported in the literature. Finally, this study presents a parametric analysis that examines the impact of the starting pH of the environment on the final pH.
Theoretical Background
Governing Parameters
The enzyme type and population, ambient conditions, storage, hydrolysis, and precipitation are the primary factors that impact the rate of urea hydrolysis [
34,
38,
40]. Environmental variables, such as the levels of urea and calcium in the system, pH, and temperature, have a significant influence on urease activity [
16,
38,
40]. The environmental parameters required for bio-cementation vary according on the specific microorganisms or enzyme type involved, since each microorganism or enzyme exhibits a unique optimum pH and temperature range for its enzymatic activity [
16]. Moreover, the optimal circumstances exhibit variability once again, contingent upon the microorganism or enzyme isolated from the same microorganism [
16]. This study focuses on investigating the influence of pH and especially investigates the hydrolysis of urea under constant temperature conditions (25 °C), without considering the potential effects of temperature fluctuations.
Effect of Urea and Calcium
The hydrolysis rate of urea (R) is known to be influenced by the concentration of urea following the Michaelis-Menten kinetics as described by Eq. (1) [
36,
37,
38], where
Rmax represents the maximal hydrolysis rate,
Km_ur denotes the urea concentration at which the reaction rate is half of
Rmax, and
Cur represents the urea concentration. It is crucial to emphasize that the values of parameters
Rmax and
Km_ur vary not only between different microorganisms but also between a microorganism and the enzyme extracted from it [
38,
41].
For what concerns the effect of calcium on urease activity, both calcium origin and its concentration have an effect. This implies that, when all other variables remain constant (such as microorganism type and urea concentration), the rate of ureolysis varies depending on the calcium source used as a nutritional medium (e.g., calcium chloride, calcium nitrate, or soluble calcium). These variations primarily arise from differences in calcium ions valence and size [
38,
40]. In general, the impact of calcium on urease activity may be described by the exponential equation given in Eq. (2). In this equation,
Cca is the concentration of calcium, and the coefficient
KiCa represents the concentration at which the urease activity decreases to 37% of its initial value, which depends on the calcium source.
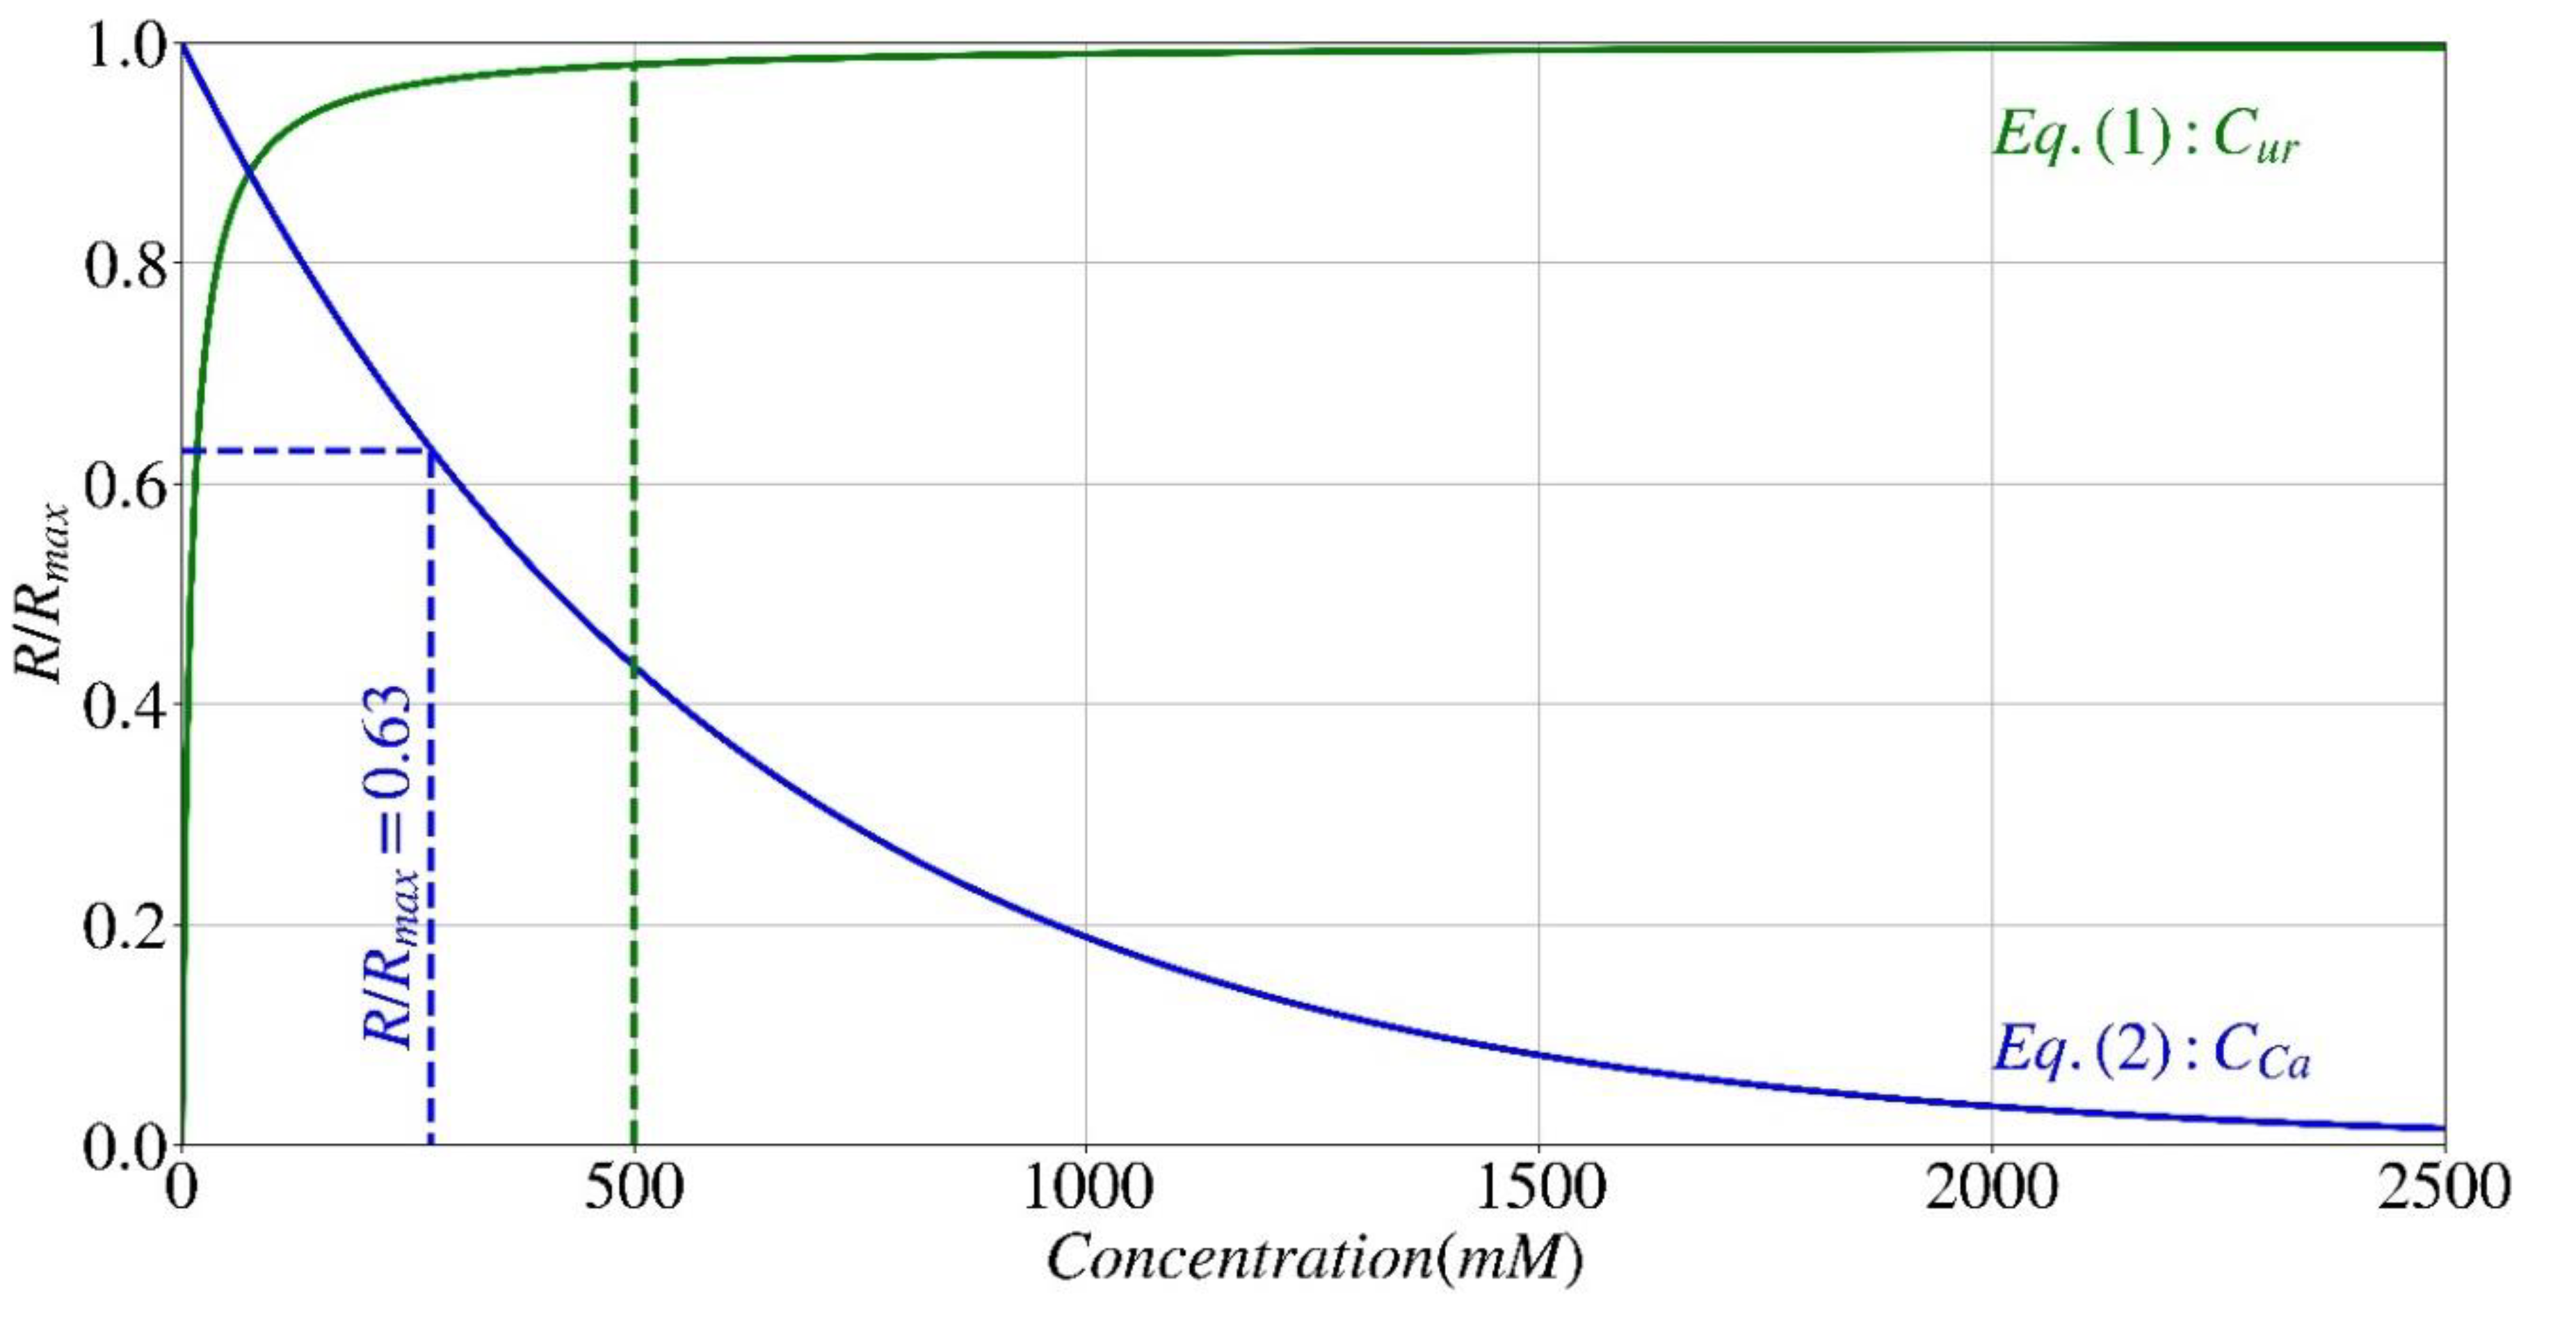
Figure 2 illustrates the normalized hydrolysis rate (
R/Rmax) of
S. pasteurii, as described in Eqs. (1) and (2), with respect to urea (
Cur) and calcium (
Cca) concentrations, in which the value of
Km_ur is set at 10 (mM) for
S. pasteurii, while the value of
KiCa is set at 0.6 mol/l for calcium derived from a calcium chloride source [
38,
40]. As seen in this diagram, the rate of hydrolysis demonstrates a significant increase as the concentration of urea (indicated by the green continuous line) in the solution rises until it reaches approximately 0.5 M (green dashed line). After reaching this concentration, the rate stabilizes at a virtually constant level. Conversely, an increase in calcium concentration (shown by a blue continuous line) leads to a decrease in the rate of hydrolysis. At a calcium concentration of 275 mM, the activity rate of urease decreases by 37% (blue dashed line) and continues to decrease progressively up to a concentration of 2M. However, at higher concentrations, no significant changes are seen.
Effect of pH
The influence of the environment pH, however, is quite intricate. As mentioned before, it is important to note that every microorganism or enzyme has unique optimal environmental requirements for its growth. Likewise, these organisms also encounter specific environmental circumstances that permanently impede their enzymatic functionality. This impediment, also known as denaturation, is the result of the enzyme undergoing structural modifications and losing its functionality. Hence, the activity of urease reduces within a distinct pH range, encompassing both lower and higher pH values. This results in the formation of a bell-shaped curve, which can be mathematically represented by the expression Eq. (3) introduced by Batstone [
41]. In this equation,
pHLL and
pHUL denote the minimum (Lower Limit) and maximum (Upper Limit) pH values, respectively, at which the rate of hydrolysis is reduced by 50%. Once again, the values of
pHLL and
pHUL vary not only between different microorganisms but also between a microorganism and the enzyme extracted from it [
38,
41]. The
pHLL and
pHUL values for the
S. pasteurii bacteria were determined to be 5 and 9.7, respectively, at a constant temperature of 25 °C [
38,
40]. The
pHLL value of the enzyme isolated from
S. pasteurii declines significantly and approaches
pHUL = 5, indicating that the urease activity of the cell-free extract is more susceptible to variations in pH, particularly under acidic conditions [
38,
40,
42].
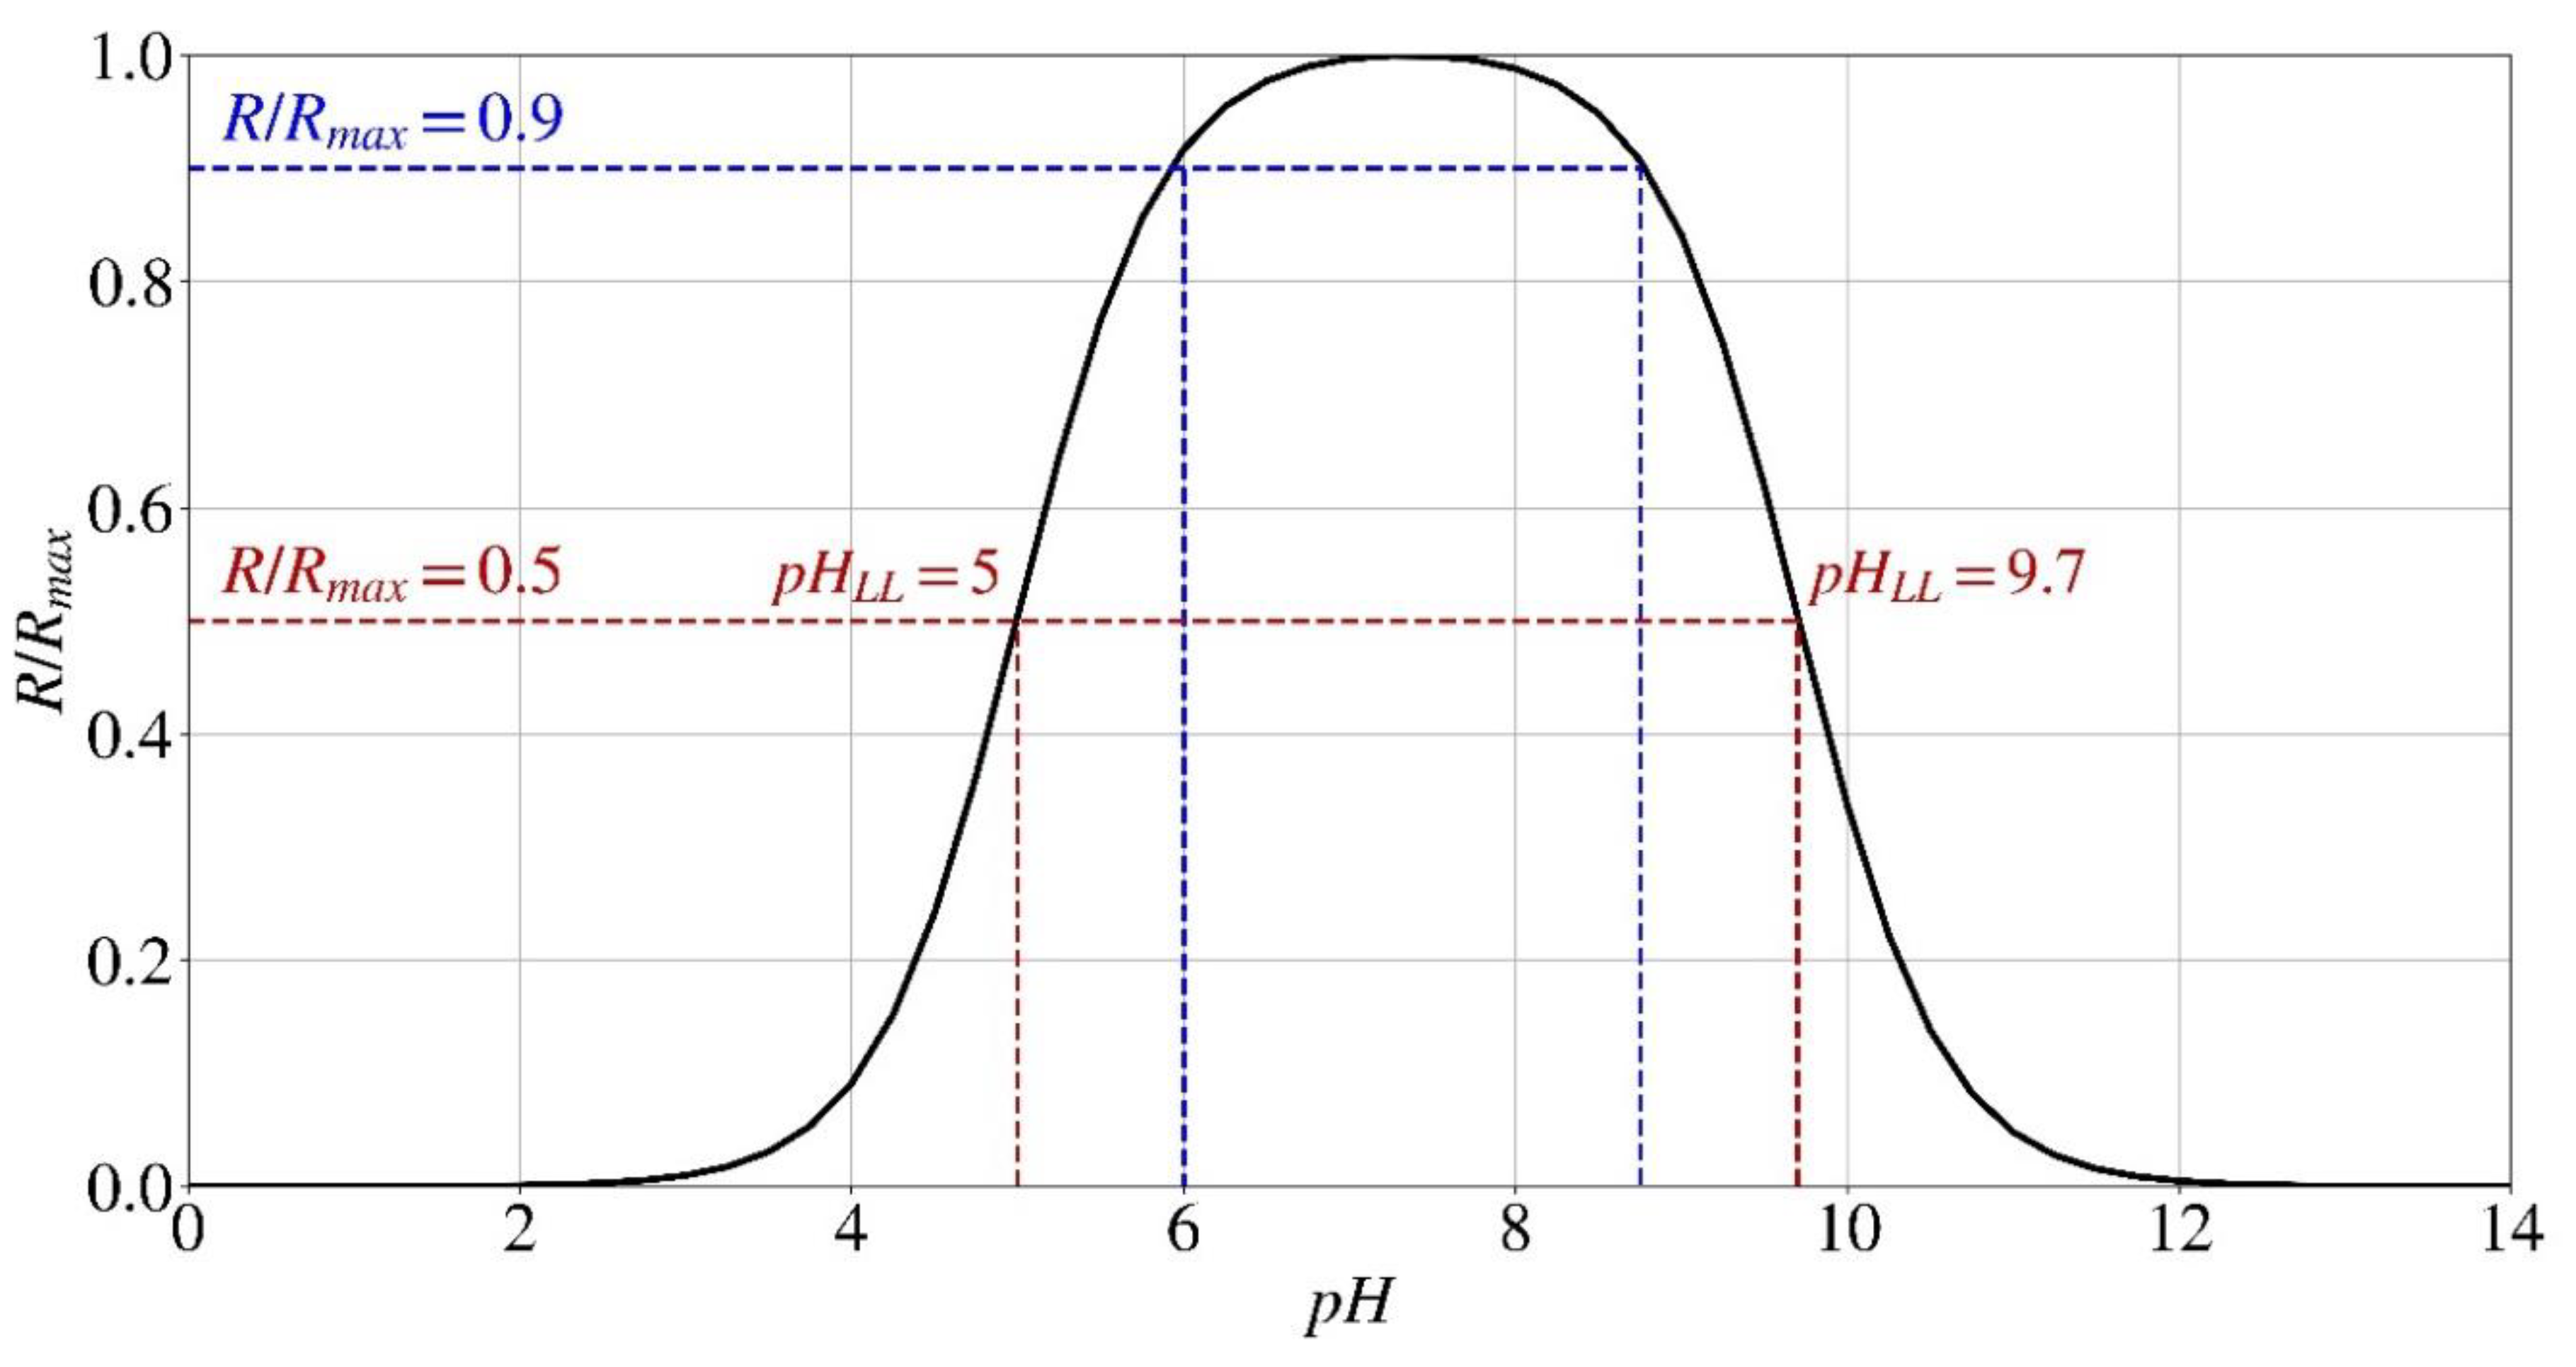
Figure 3 depicts the normalized hydrolysis rate (
R/Rmax) of
S. pasteurii as a function of the pH of the environment, as described in Eq. (3). In relation to the influence of pH, it has been shown that the enzyme accountable for bio-cementation in
S. pasteurii undergoes denaturation when exposed to pH levels below 3.5 and over 12 [
16]. As reported, the bacteria may survive until a pH of 13.6; however, the enzyme necessary for bio-cementation becomes denatured when the pH exceeds 12 [
16]. As a result, no precipitation takes place in these conditions. The bacteria demonstrate an ideal tendency to precipitate within a pH range of 6-8.75, where the rate of hydrolysis, which is affected by the pH of the environment, reaches 90% of its maximum rate (dashed lines).
Chemical Reactions
Bio-cementation is a complex process encompassing a multitude of biochemical reactions in which microorganisms catalyze the hydrolysis of urea via the enzyme urease, resulting in the precipitation of calcium carbonate.
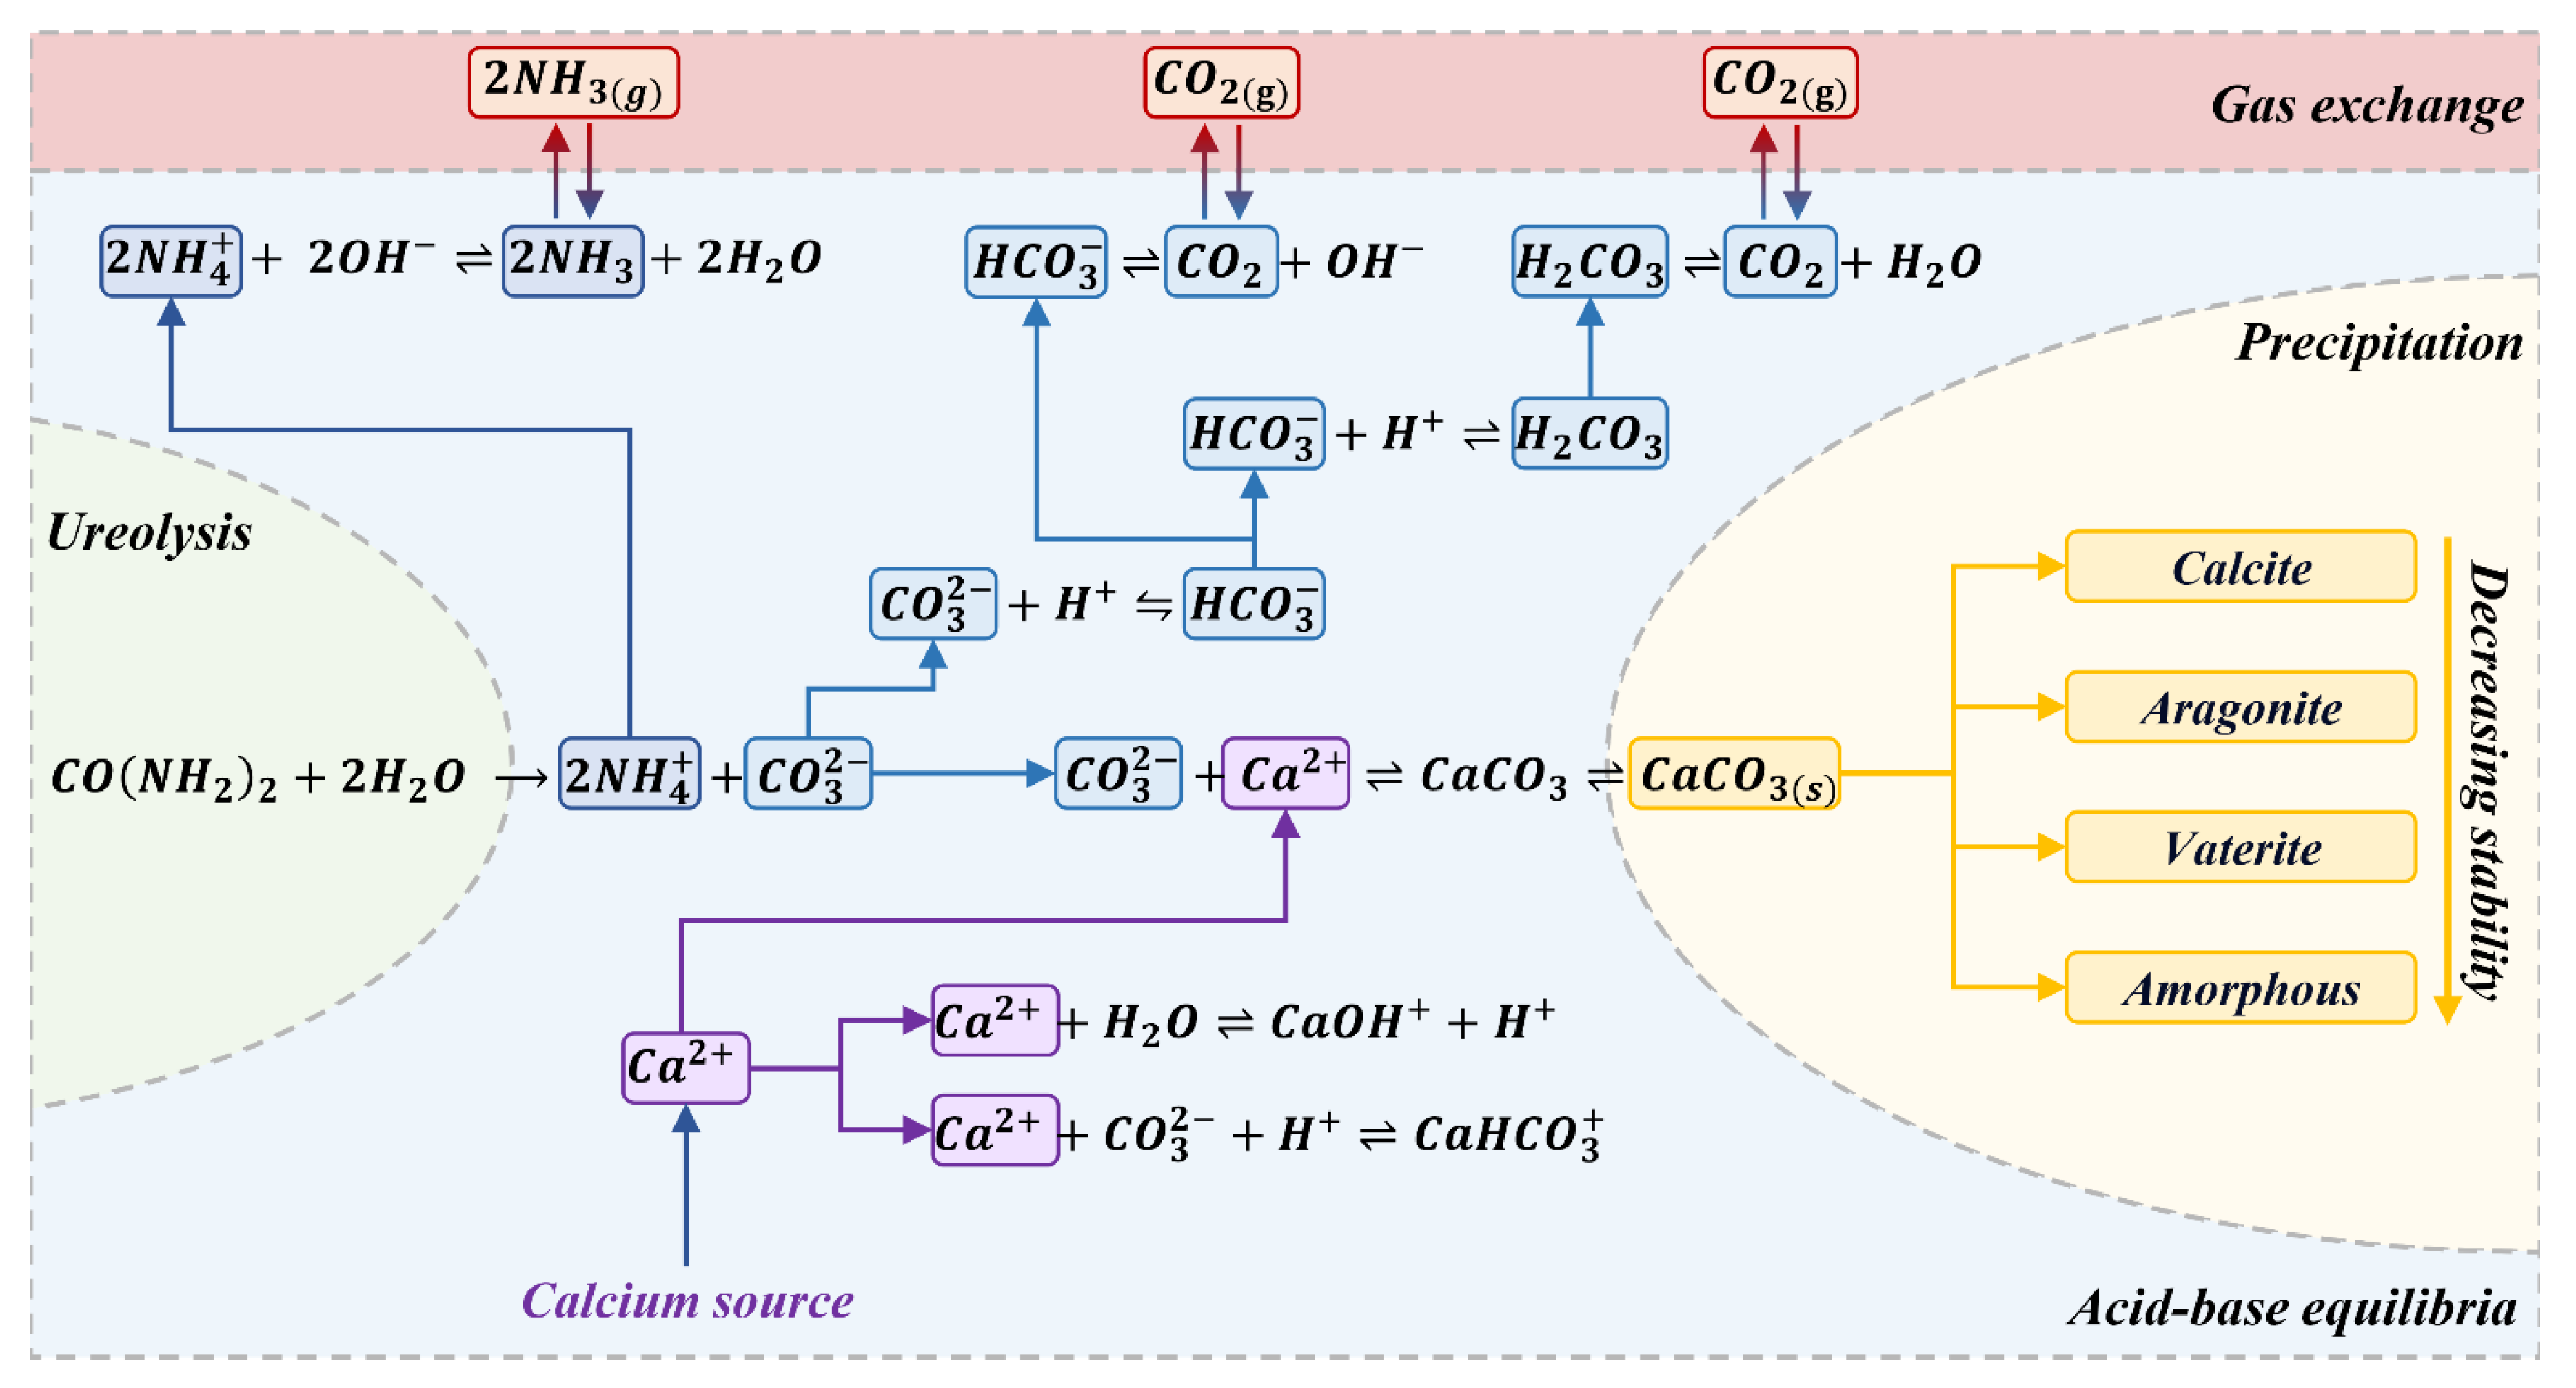
Figure 4 presents a schematic illustration of the chemical reactions that occur throughout the process of microbial-induced urea hydrolysis and calcium carbonate precipitation. The processes are categorized into four distinct groups, namely hydrolysis, acid-base equilibria, precipitation, and gas exchange.
Table 1 presents a summary of these reactions, with the exception of gas exchange, and their corresponding equilibrium constants as documented in the literature, where, the
pKa value, expressed on a logarithmic scale, represents the acid dissociation constant and signifies the equilibrium of each successive acid-base reaction in the forward direction, as presented in
Table 1 [
43]. The solubility product (
Ksp) represents the equilibrium between the solid and aqueous calcium carbonate and its ions in the system.
First, urease hydrolyzes urea to produce ammonium (
NH4+) and carbonate (
CO32-), which is an irreversible reaction (Eq.(4)). Subsequently, the presence of carbonate and ammonium in the aqueous solution initiates a sequence of reversible acid-base reactions inside the medium until equilibrium is achieved (
Table 1, Eqs. (5)-(13)). In greater detail, under neutral pH circumstances, bicarbonate (
HCO3-) is the dominant species in the system rather than carbonate ion (
CO32-). In order to maintain a balanced charge, a rise in pH occurs, resulting in the dissociation of ammonium ion into ammonia (
NH3) until a condition of equilibrium is reached between
NH4+/
NH3 and
HCO3-/
CO32- (
Table 1, Eqs. (5)-(10)). Simultaneously, calcium ions (
Ca2+) interac with other suitable species within the system, such as carbonate ions, resulting in the formation of calcium carbonate, which is soluble in water (
Table 1, Eqs. (11)- (13)). Eventually, the calcium carbonate crystals (Eq.(14)) precipitate in three polymorphs, namely calcite, aragonite, and vaterite, as well as amorphous monohydrocalcite and ikaite, in descending order of stability.
Computational Model's Structure
The numerical modeling of the system was conducted using COMSOL Multiphysics
® 6.1. The model under consideration was a one-space dimension with a time-dependent analysis.
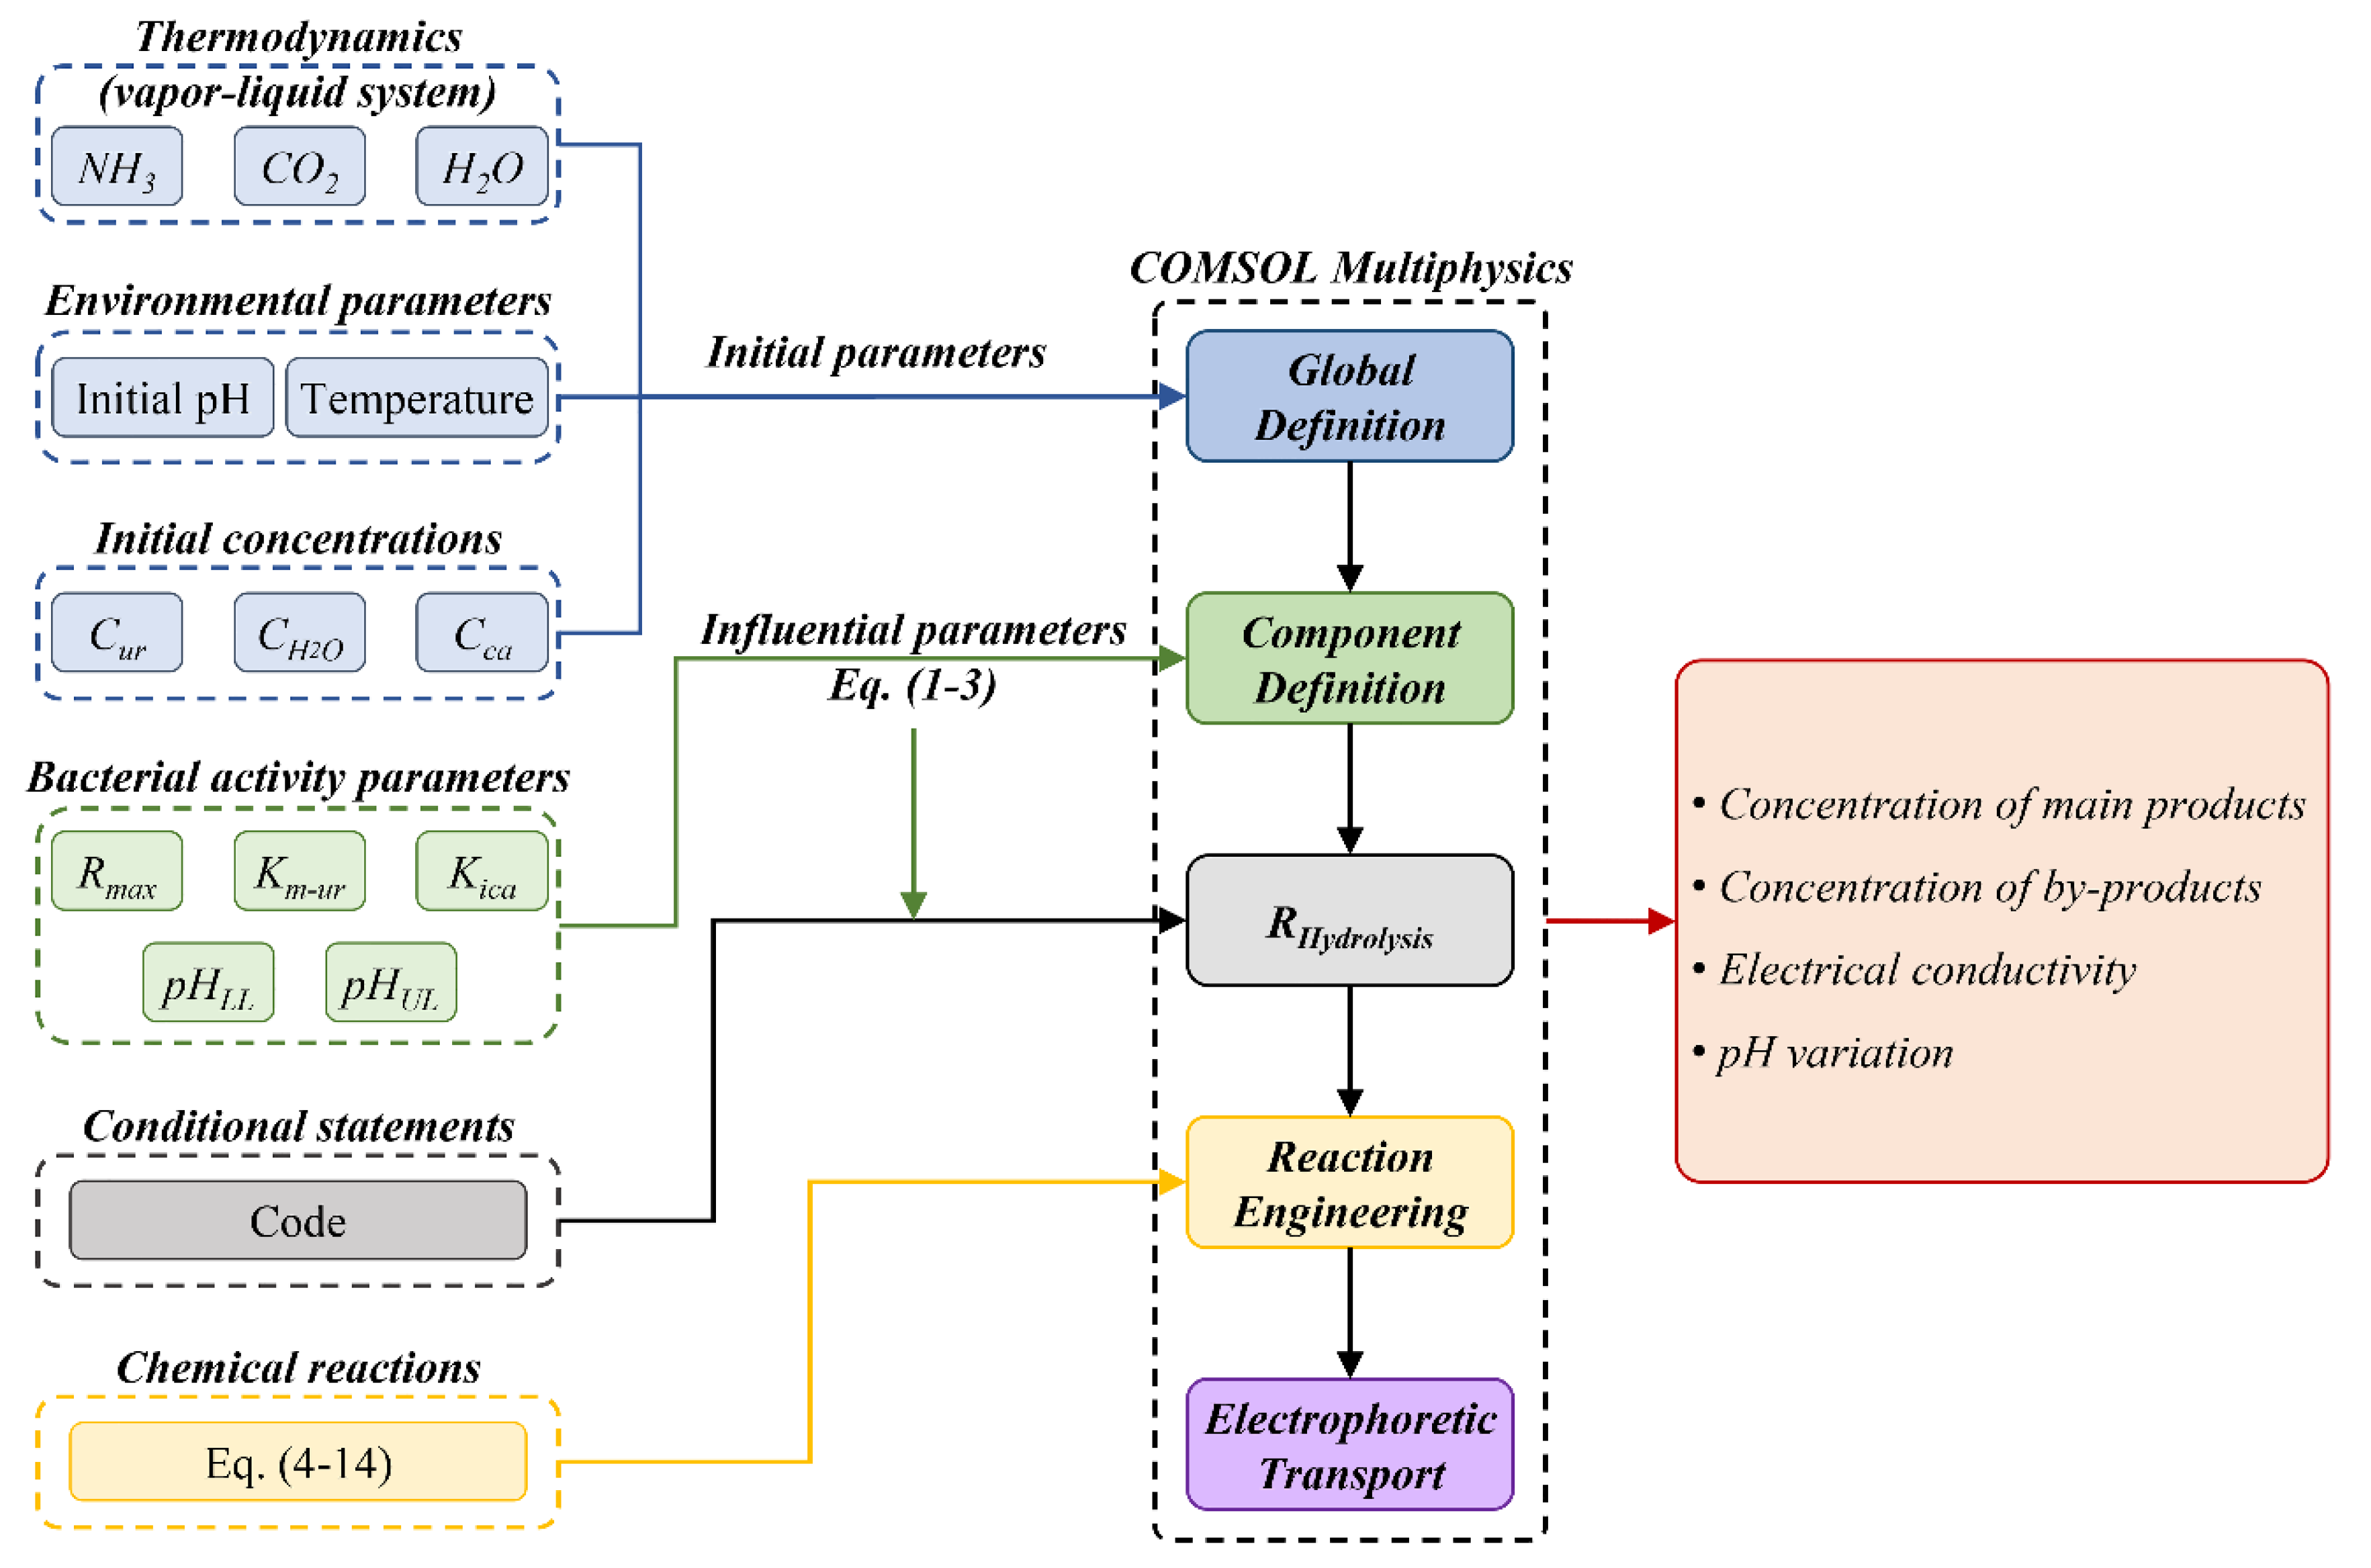
Figure 5 depicts a schematic representation that delineates the organization of inputs and workflow inside the numerical model, in accordance with the theory mentioned above. The model was established by incorporating two fundamental principles: "
reaction engineering," which encompasses the analysis of chemical reactions occurring within the system, and "
electrophoretic transport," which takes into consideration the electrical charge balance among the species in the medium during acid-base equilibria. The "thermodynamics" of a "vapor-liquid system" with an ideal solution and gas was added as a subnode to "Global Definition," recalling three species: ammonia (
NH3), carbon dioxide (
CO2), and water (
H2O) to include the gas exchange mentioned in
Figure 4.
Table 2 shows the constant values for the
S. pasteurii’s bacterial activity parameters that are used as input in COMSOL Multiphysics
®.
The influence of urea and calcium concentrations, as well as environmental pH, on urease enzyme activity was characterized as three independent variables, as given in Eqs. (1)–(3) under the "component definition" subnode. The urea concentration (Cur) in Eq. (1) was defined as the fluctuation of urea over reaction time. The pH value in Eq. (3) was calculated as the logarithmic function of hydrogen ion concentration over time. An original function, denoted as RHydrolysis, has been developed to account for the rate reliance on urea and calcium concentrations, as well as pH (Eqs. (1)–(3)). This function integrates conditional statements to derive a time-dependent reaction rate, which varies as the factors influencing urease activity undergo fluctuations in time. The hydrolysis rate is modified by RHydrolysis by the integration of values from all three functions, assuming that each function is independent of the other two factors in the following manner:
If the enzyme is denaturated by the environment's pH (pH < 3.5 or > 12), no precipitation occurs, and the hydrolysis rate is zero.
If the pH value is within the suitable range of 3.5 to 12 and the normalized hydrolysis rate (R/Rmax) from the effect of pH (Eq. (3)) is above 0.5 and the one from the effect of calcium concentration is above 0.67 (Eq. (2)), the hydrolysis rate is mainly affected by the urea concentration (Eq. (1)), which triggers the reactions.
If any of these requirements is not met, the average value of the normalized hydrolysis rate (R/Rmax) will be considered among the three functions.
The process concludes when the system achieves charge balance (Eq. (15)) for all species and the concentration of urea is too low to initiate ureolysis.
The reaction engineering node includes eleven chemical reactions (
Table 1): one irreversible reaction for urea hydrolysis (Eq. (4)), nine reversible reactions for acid-base equilibrium in the system, taking into account the acid dissociation constant (
pKa) for each relevant reaction (Eqs. (5)–(13)), and one reversible reaction for the solubility of calcium carbonate in an aqueous solution (Eq. (14)). The reaction rate for urea hydrolysis (Eq. (4)) has been redefined as
RHydrolysis. Initial concentrations of urea (
Cur), calcium (
CCa), water (
CH2O), hydrogen ions (
CH+), and hydroxide (
COH-) have been considered according to the experimental conditions presented in the literature in the "initial values" subnode.
Water was used as the predefined solvent in the electrophoretic transport module. The starting voltage was established at zero. A protein subnode with a neutral average charge (zero) was designated as urea. The species CO2, NH3, and CaCO3 were classified as uncharged. The NH4+ ion was designated as a weak acid with monoprotic donation, and its pKa value was determined using Eq. (10). H2CO3 was described as a weak acid exhibiting polyprotic donation and undergoing two dissociation phases. The first and second ionization constants were retrieved from Eqs. (7) and (8), respectively. The weak bases CaOH+ and CaHCO3+ were characterized as monoprotic donors, and their respective pKa values were determined using Eqs. (11) and (12). OH-, H+, Ca2+, and CO32- were defined as fully dissociated species with the relevant electrical charge. The concentration of all species in the electrophoretic node was determined by analyzing the variation in time of the relevant species resulting from reaction engineering. The process was simulated over a period of 20 hours with a time increment of 1 minute. The global outputs of the simulation included data on the development of species concentration in the system, as determined by the reaction engineering module, and the electrical conductivity generated from the electrophoretic module over a period of time.
Results and Discussion
The initial stage of verifying the numerical approach described in this study is doing a comparative analysis between the simulation outcomes and the observed experimental data documented in the existing literature. Nevertheless, it is important to note that while there is a substantial amount of literature focused on the experimental characterization of bio-cementation, only a limited number of studies have provided a comprehensive study of all the necessary parameters for the development of a numerical model. As previously stated, Paassen [
38] has conducted an extensive study that will serve as a point of reference for the computational model provided in this research.
Reactants, Main Products, and By-Products Concentration
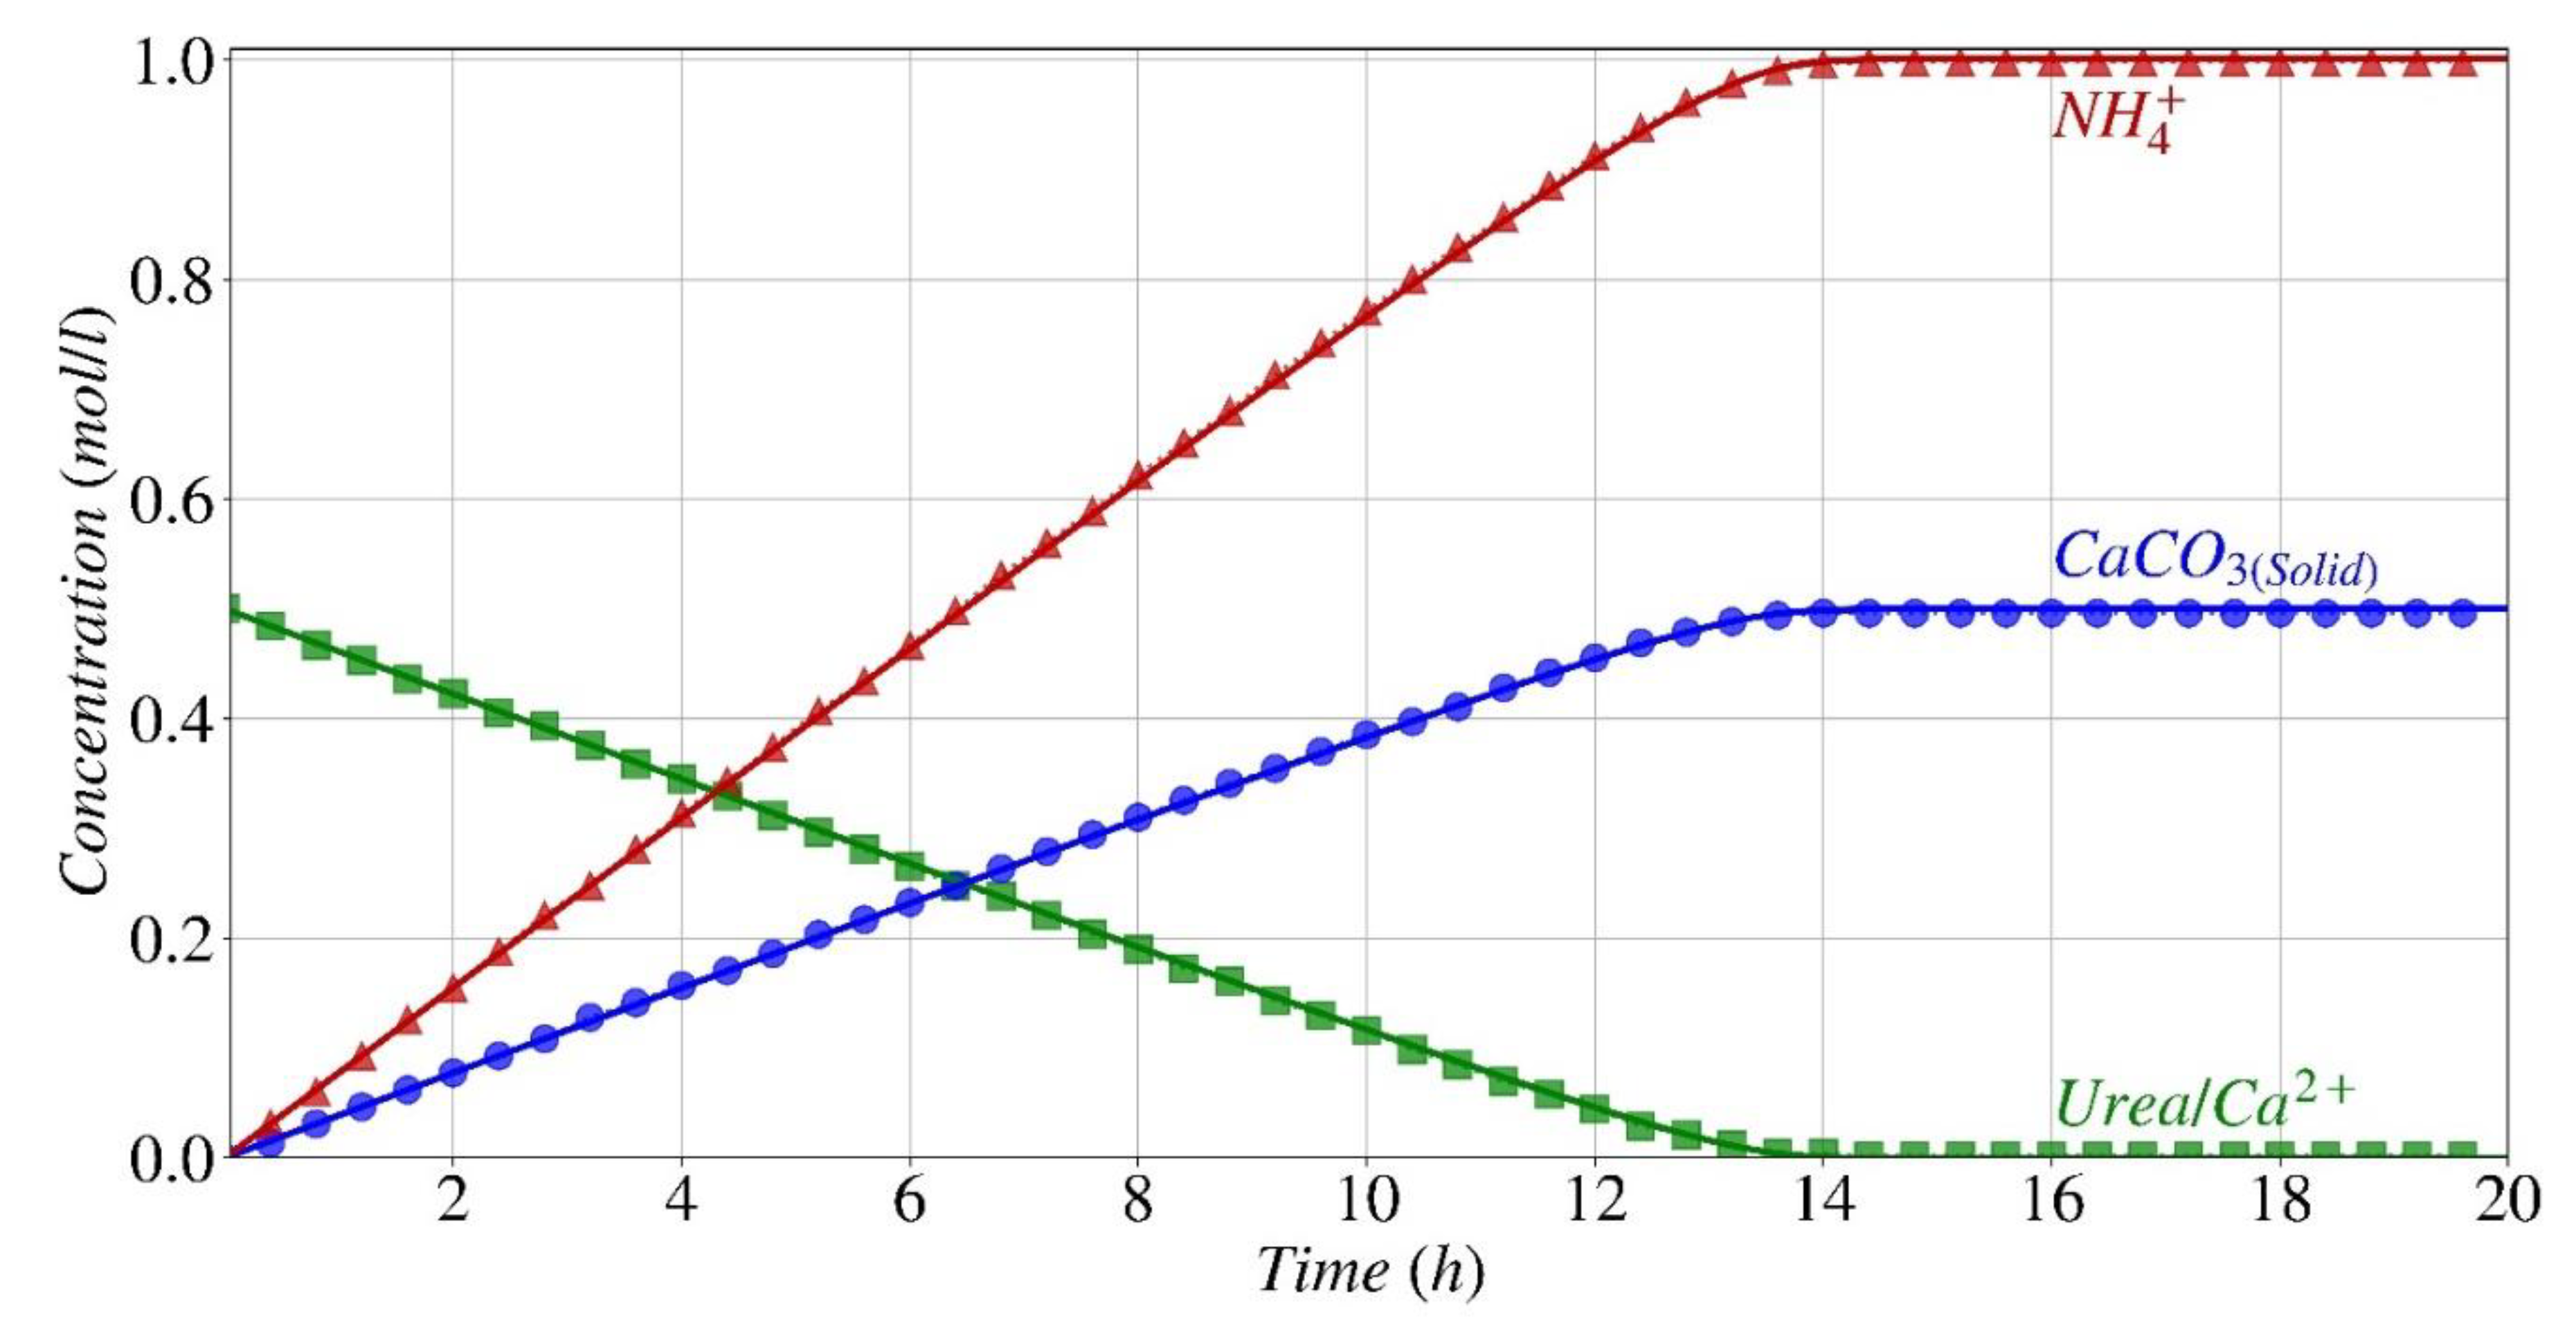
Figure 6 depicts the comparison between the simulated concentrations of the primary reactants, urea and calcium, and the resulting products, precipitated calcium carbonate, as well as the by-product, ammonium, with the experimental results provided by Paassen [
38]. For this experimental setting given by Paassen, the starting pH was 6.67 and the concentration of urea and calcium (derived from a calcium chloride source) was 0.5 mol/l [
38]. The predictive model effectively forecasts the ultimate concentrations of reactants and products, together with the dynamic progression of these species' concentrations. Given that the starting pH of 6.67 is within the optimal pH range for the urease enzyme of
S. pasteurii in the initial phase of the reaction, the hydrolysis rate is optimized, leading to a fast progression of the process. The concurrent consumption of equal amounts of urea and calcium leads to the formation of the same quantity (1:1) of calcium carbonate by precipitation. Consistent with expectations, the ratio of ammonium generation to reactant consumption is double that of calcium carbonate precipitation. During the course of roughly 13.5 hours, the reactions persist at a consistent rate, resulting in the complete consumption of nearly all urea and calcium present in the system. After 14 hours, the pace began to change and eventually levelled off.
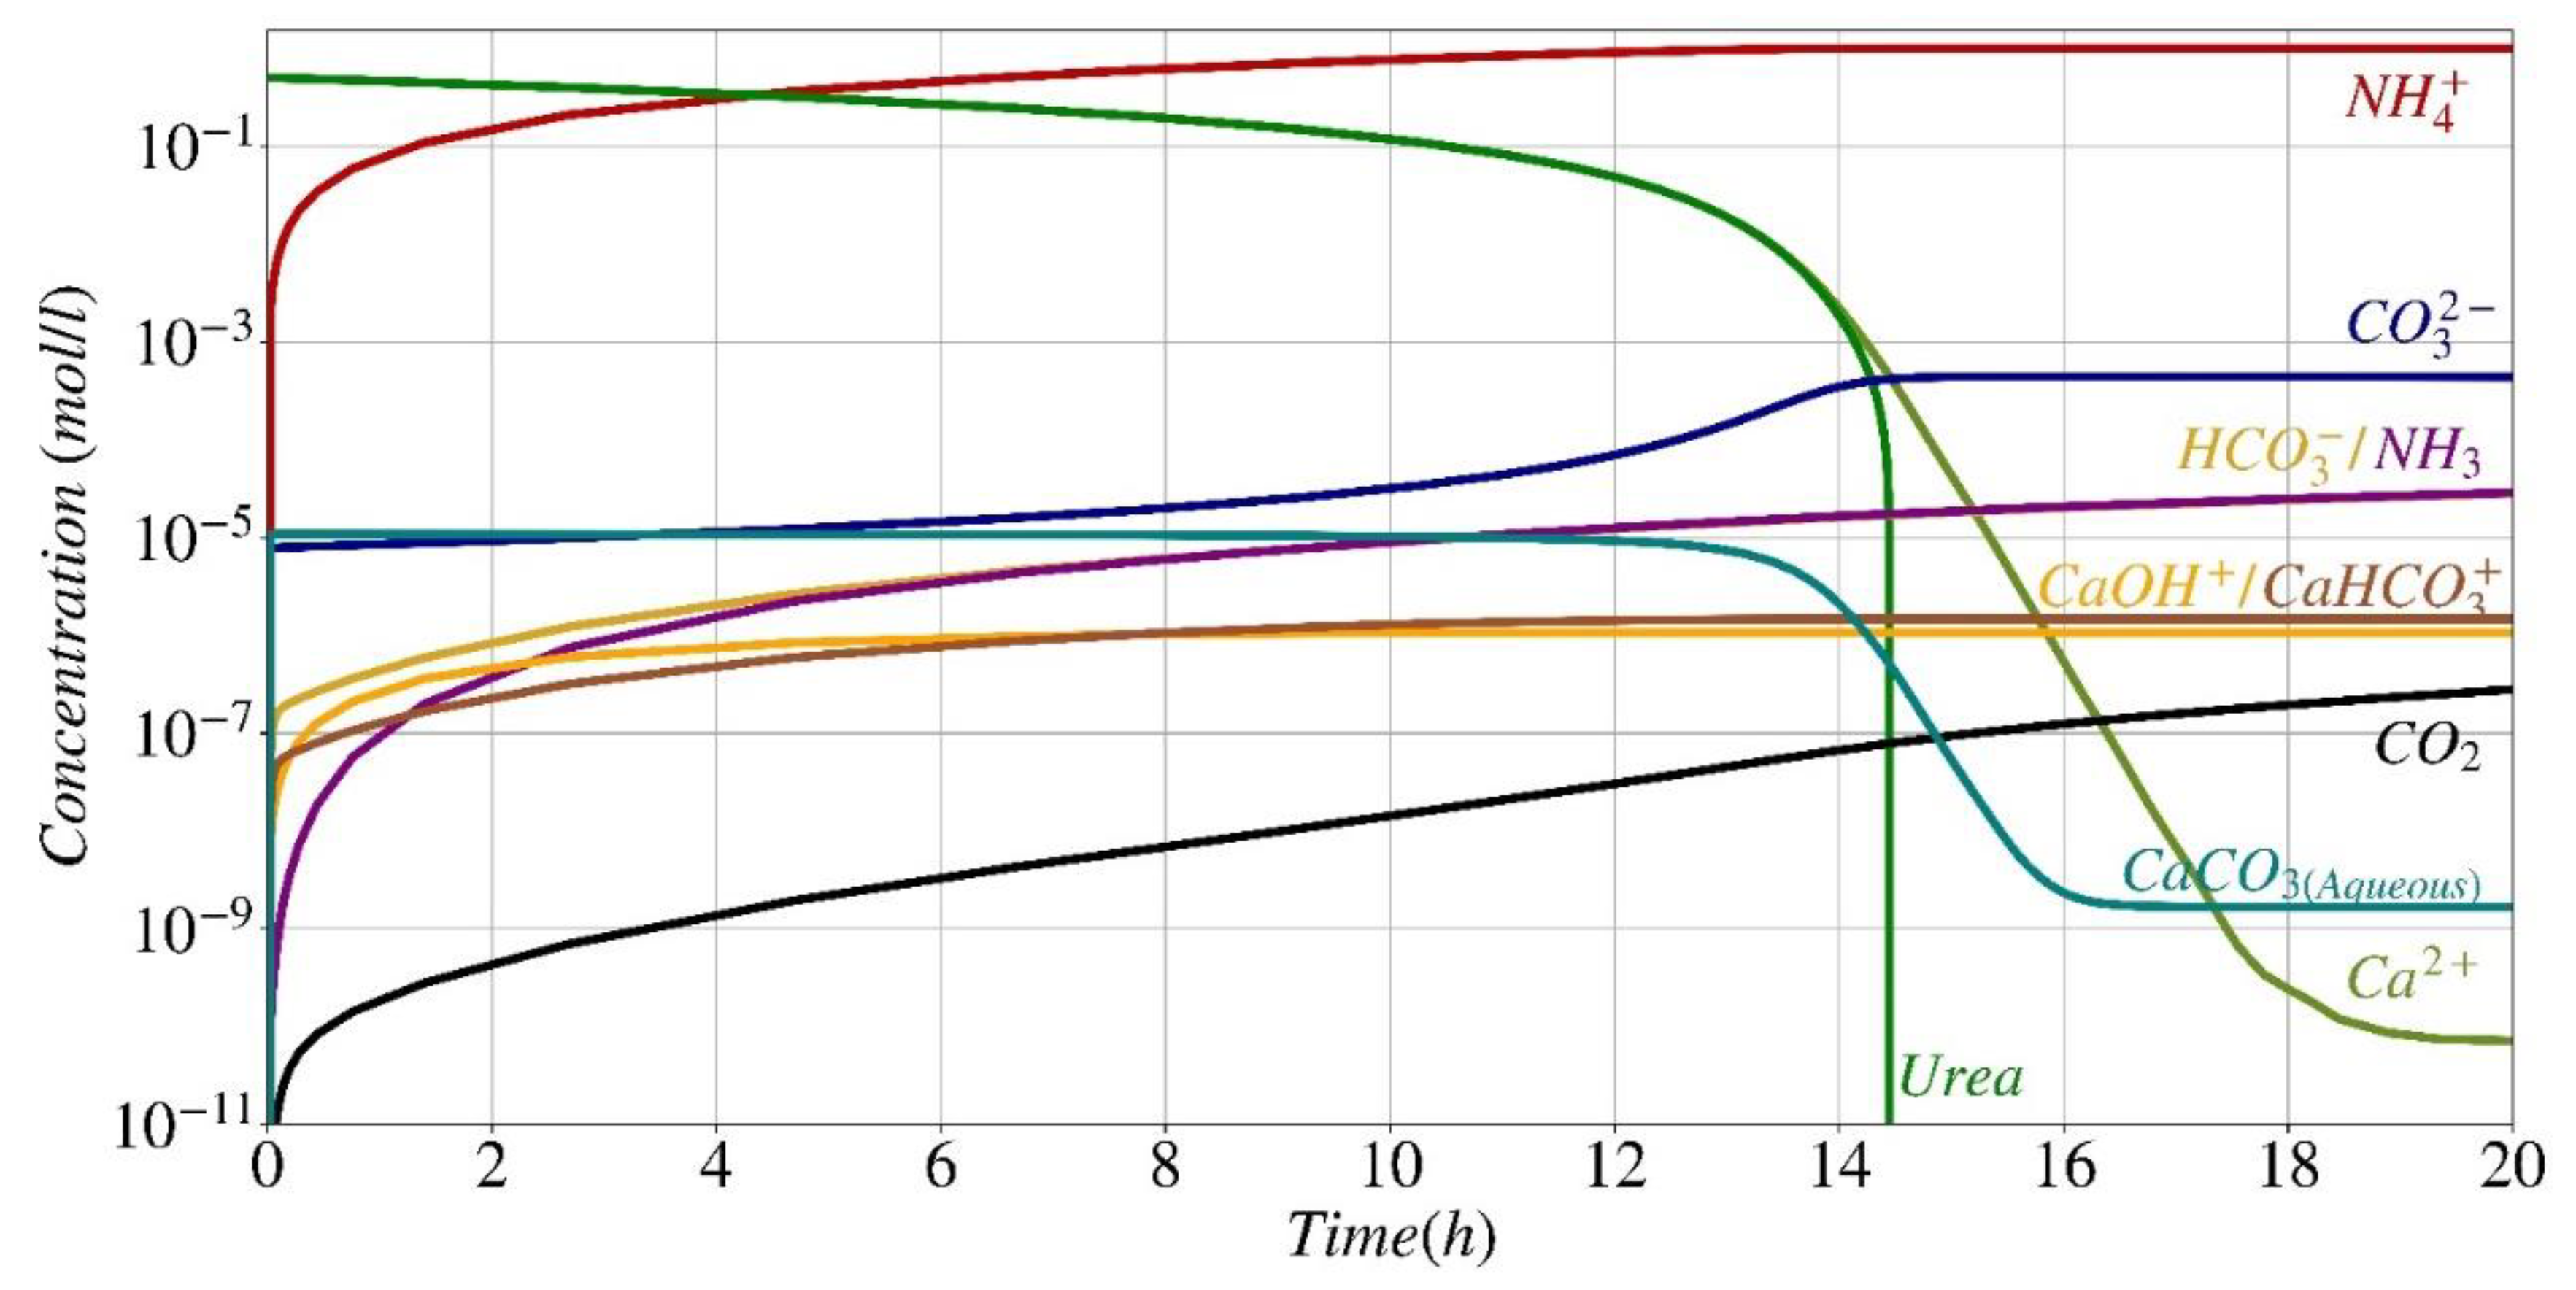
Figure 7 displays the evolution in time of the estimated concentrations of all dissolved species at acid-base equilibrium, as described by Eqs. (6)-(13). Data are reported on a semi-logarithmic scale for a better comparison with the experimental data from Paassen [
38]. Paassen did not offer experimental values for all species presented in Fig. 7; nonetheless, Paassen's model for predicting outcomes is in good agreement with the model presented in this work, with the exception of several final concentration values [
38]. The primary cause of this disparity is that in Paassen's work species exchange between the liquid and gas phases is not considered, whereas it was taken into account in this study. For instance, in the study conducted by Paassen [
38], it was seen that the concentration of
NH3 and
CO2 reached a plateau after around 15 hours, while the findings of this study indicate that these two substances continue to rise, although with a slight tendency, due to the exchange between the gas and liquid phases.
During the initial phase of ureolysis (first 10 minutes), the pH increases rapidly, and the amount of carbonate produced exceeds the solubility product, leading to the precipitation of calcium carbonate. Simultaneously, calcium primarily interacts with other compatible species in the system, resulting in a significant increase in the concentration of CaOH+ (Eq. (11)) and CaHCO3+(Eq.(12)). It is clear that there is a strong correlation between the concentration of urea and calcium, which remains consistent until 14 hours when the calcium carbonate is precipitating continuously, until the concentration of both substances reduces to 10-3 mol/l.
Following this moment, the concentration of urea decreases rapidly. This abrupt shift aligns with the impact of urea concentration on the rate of hydrolysis at an extremely low level of urea concentration, when the normalized variance in hydrolysis rate undergoes fast fluctuations as given in Eq. (1), see Fig. 2. However, calcium ion concentration decrease is slower than urea from this point until 19 hours, which is consistent with the trend expected as described by Eq. (2). This change in concentration is parallel to the variation in dissolved calcium carbonate (CaCO3 (aqueous) light blue line), which indicates a negligible precipitation of solid calcium carbonate.
Electrical Conductivity
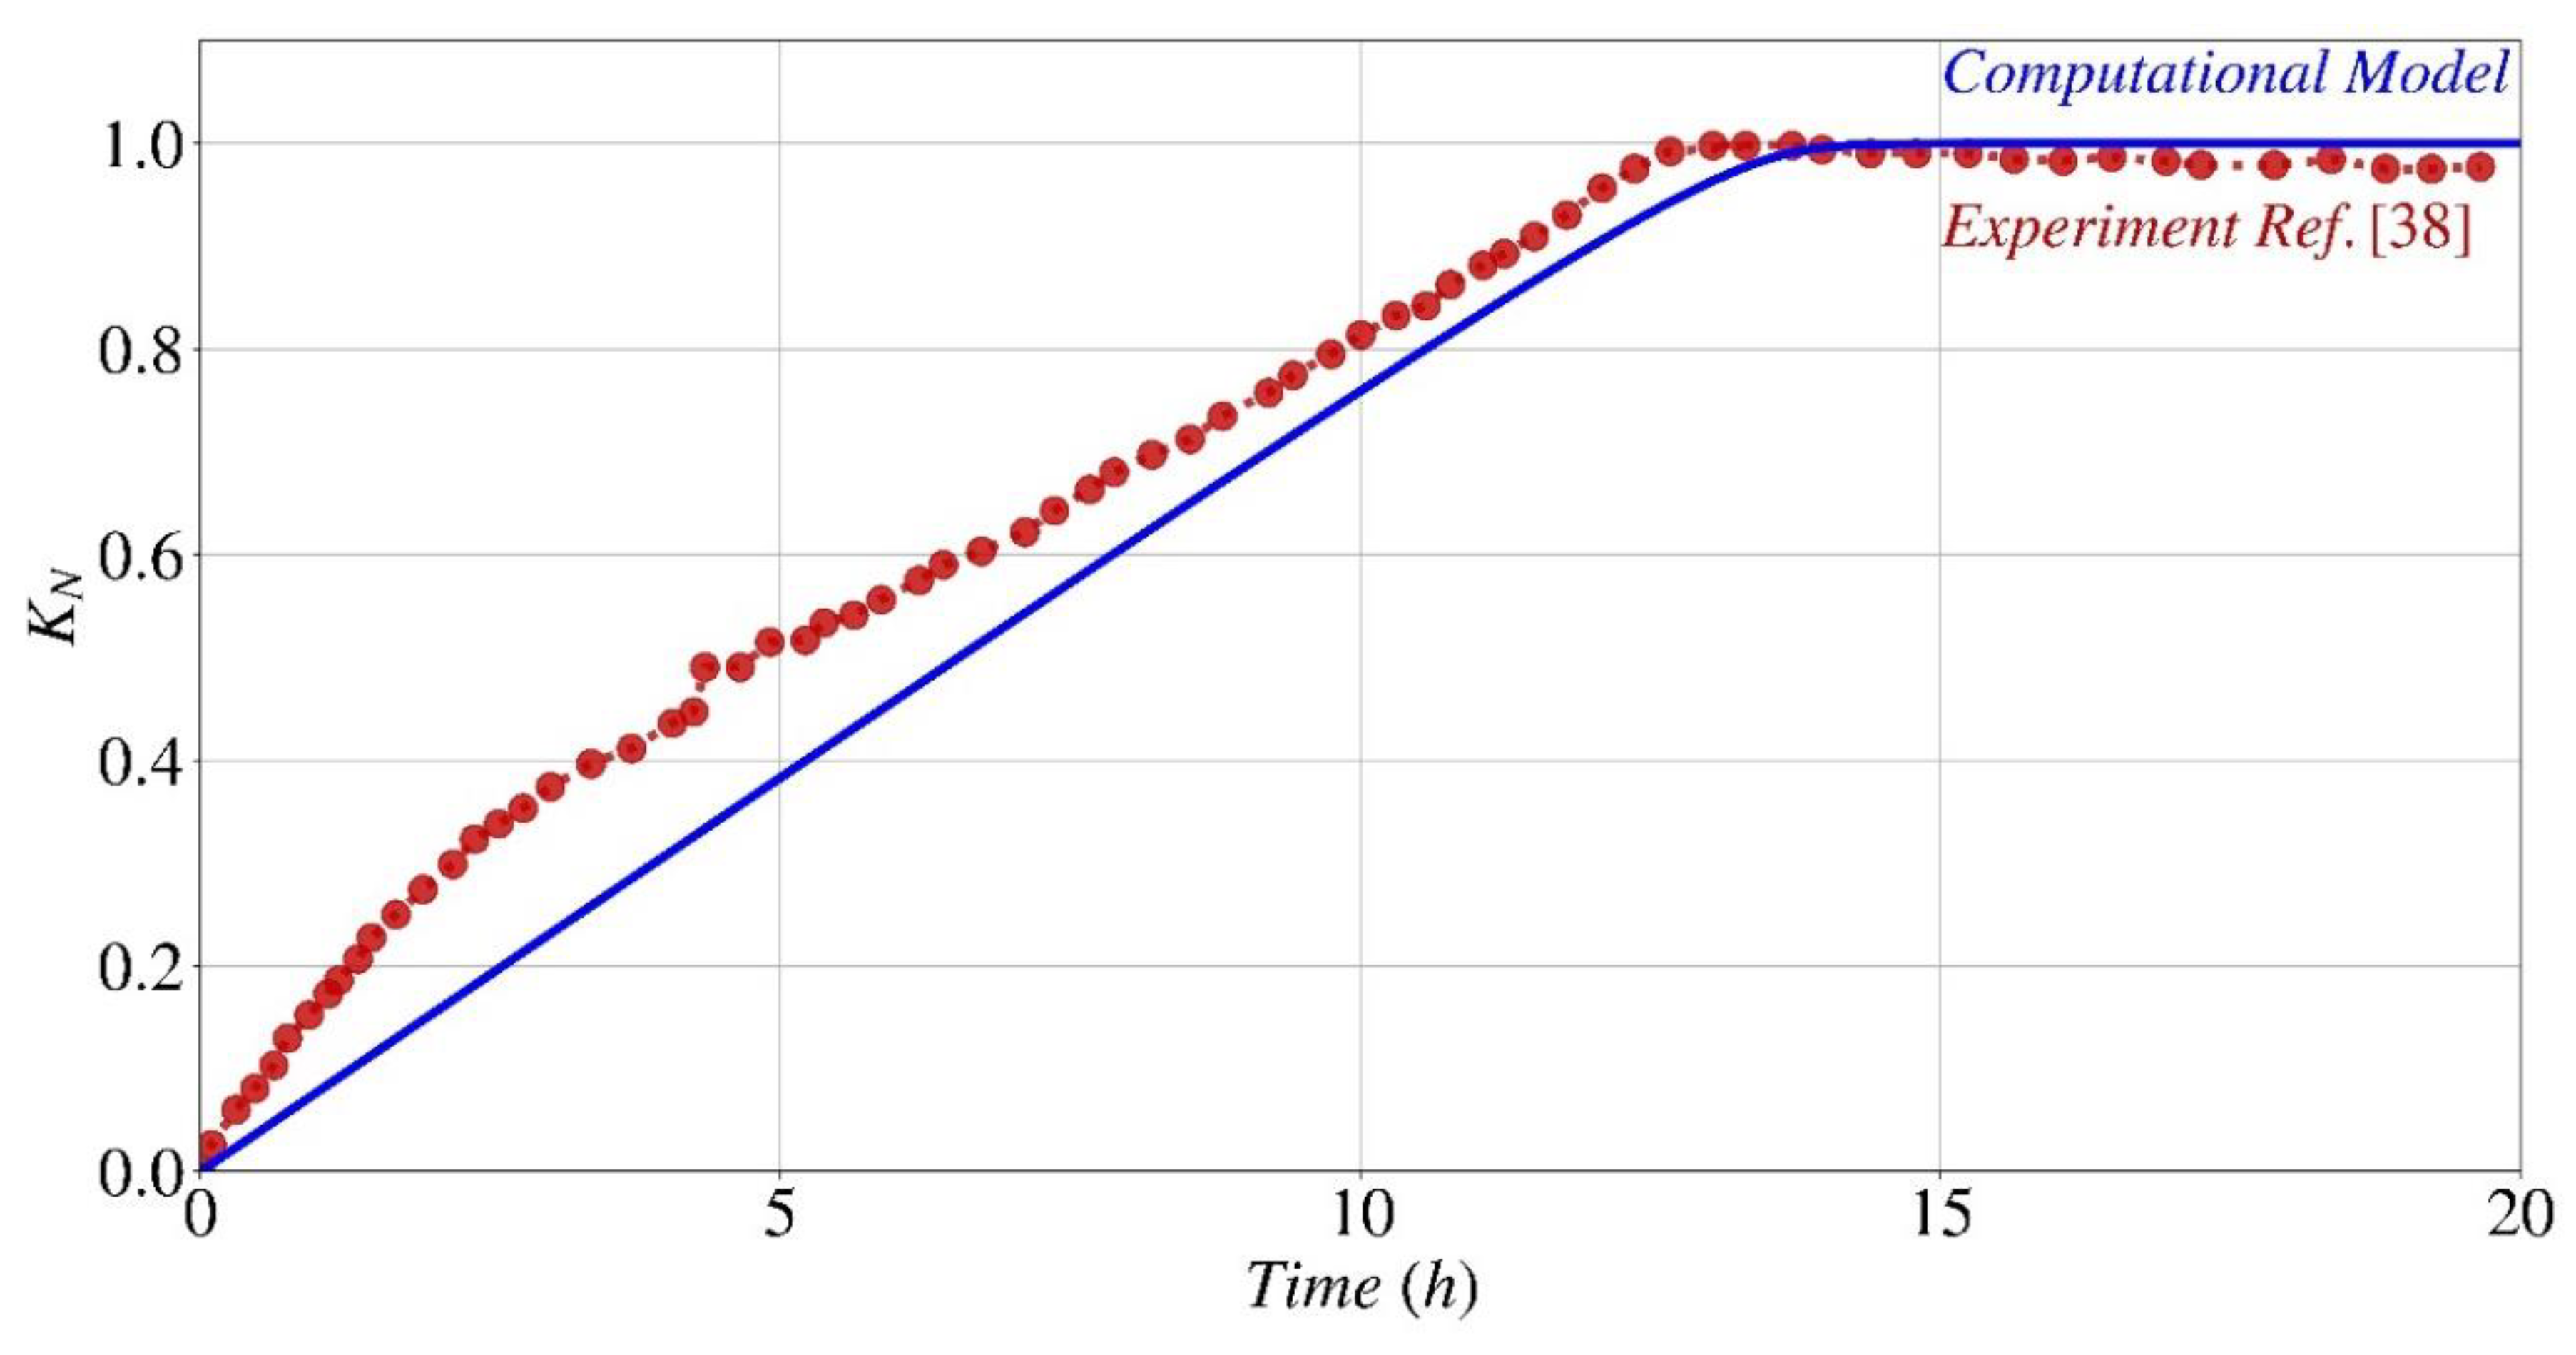
Figure 8 presents the predicted normalized electrical conductivity calculated by Eq. (16) of the species in the system, compared to the experimental results reported by Paassen [
38] for the same experimental setting described in
Figure 6 and
Figure 7. The computational model and experimental results demonstrate a substantial correlation for normalized electrical conductivity. It is noteworthy to mention that both the model and experimental data exhibit a projected upward trend over a period of time. Despite the presence of a discrepancy, particularly during the first stages of the process, the model demonstrates a satisfactory ability to accurately anticipate the overall trend. Considering that the electrical conductivity in this particular situation is influenced by multiple factors, including the presence of supplementary ions within the system, which can result in a distinct pattern, as documented in the existing literature [
37], any examination of this topic requires a more extensive experimental investigation.
pH Fluctuation
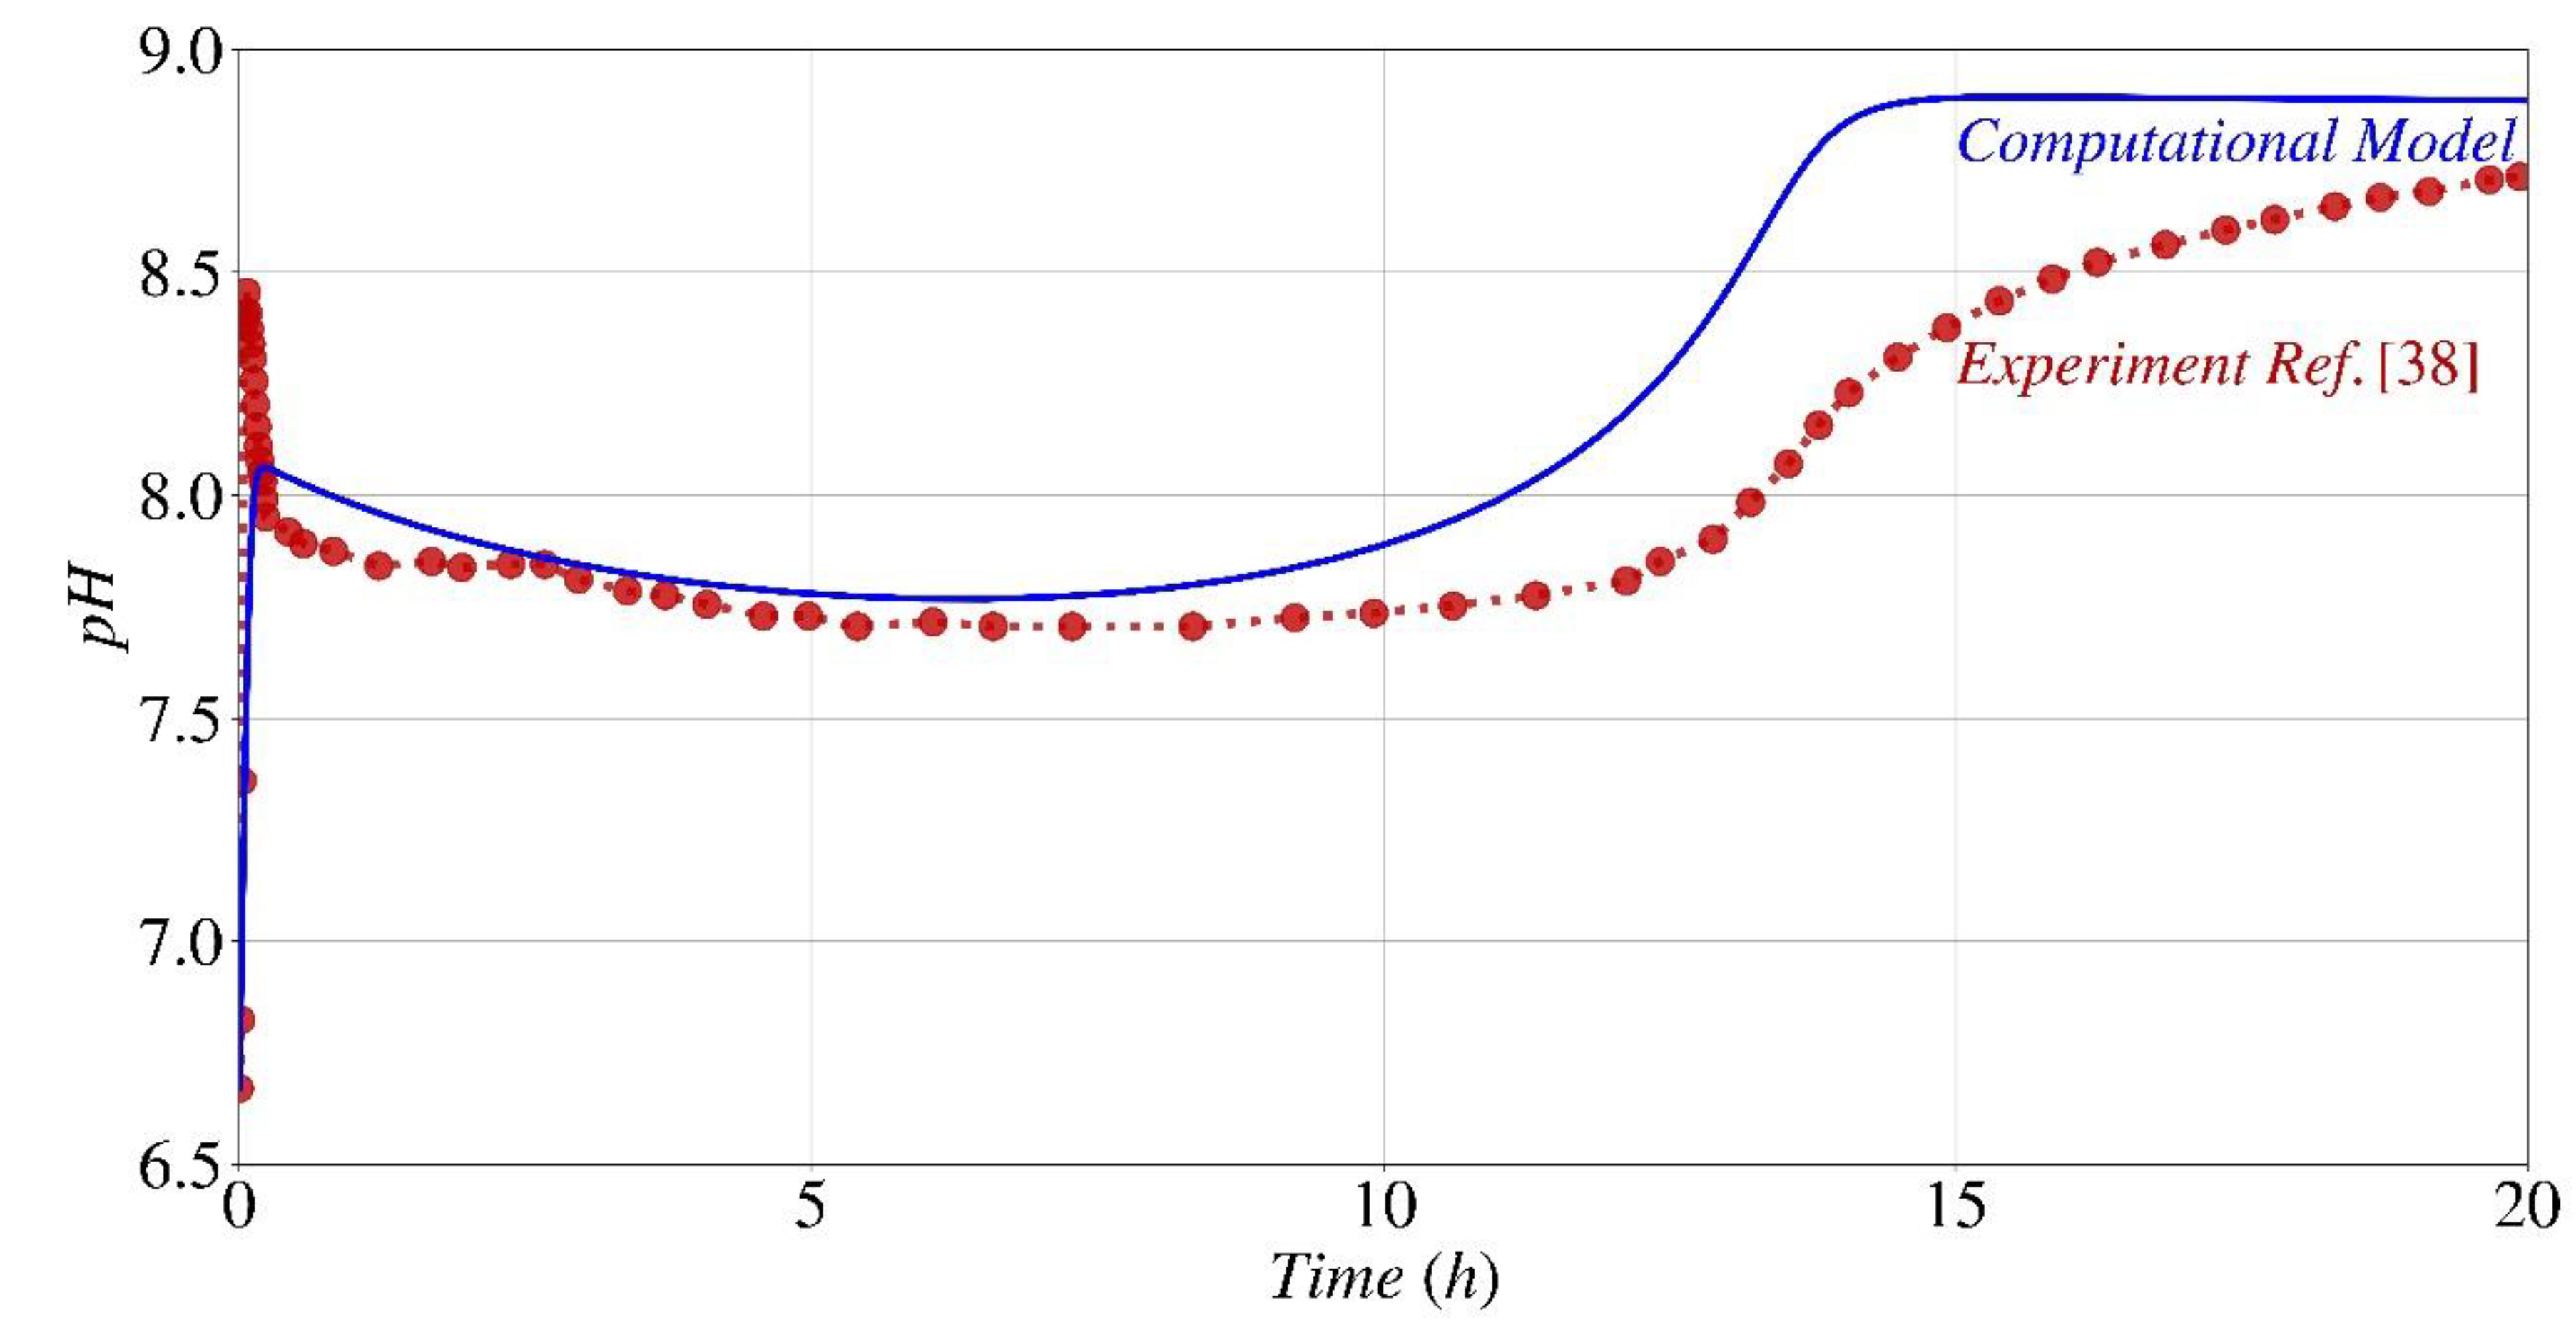
Figure 9 displays the anticipated pH fluctuation of the system, in contrast to the results from experiments documented by Paassen [
38] for the identical experimental configuration outlined in
Figure 6. There is a significant correlation between the numerical model and experimental data in relation to the pH fluctuation. Upon hydrolysis of only a small amount of urea, the pH undergoes an immediate rise (from 6.67 to 8.5). This increase occurs when the quantity of carbonate generated surpasses the solubility product, resulting in the precipitation of calcium carbonate. Subsequently, the pH displays a rapid decline, mostly as a result of the equilibrium between unbound calcium and the calcium bicarbonate complex, which is the predominant dissolved inorganic carbon compound in the initial phases of the process, when calcium levels are still elevated. When nearly 50% of the initial calcium and urea have been consumed (approximately 7 hours, as shown in
Figure 6) and the pH remains within the optimal range (
R/Rmax from Eq. (3) > 0.9), the pH begins to gradually rise. This increase can be attributed to the acceleration of the hydrolysis rate, which is influenced by the reduction in calcium concentration (Eq. (2) and Fig. 2). Eventually, after 14 hours, during which the majority of the calcium and urea have been utilized and a state of equilibrium has been achieved among the reactants, products, and by-products, the reaction concludes, and the pH remains constant. The observed disparity between the pH values obtained from the computational model and the actual results after the 10-hour hydrolysis period might be attributed to many overlooked variables that may have influenced the results, such as the reduction in urease activity resulting from the lysis of bacterial cells [
38].
Lai et al. [
39] performed an extensive investigation to evaluate the impact of initial pH (
pH0), in the range from 3.4 to 7.4, on the biocementation process of both
S. pasteurii (MICP) and the urease enzyme isolated from this bacterium (EICP).
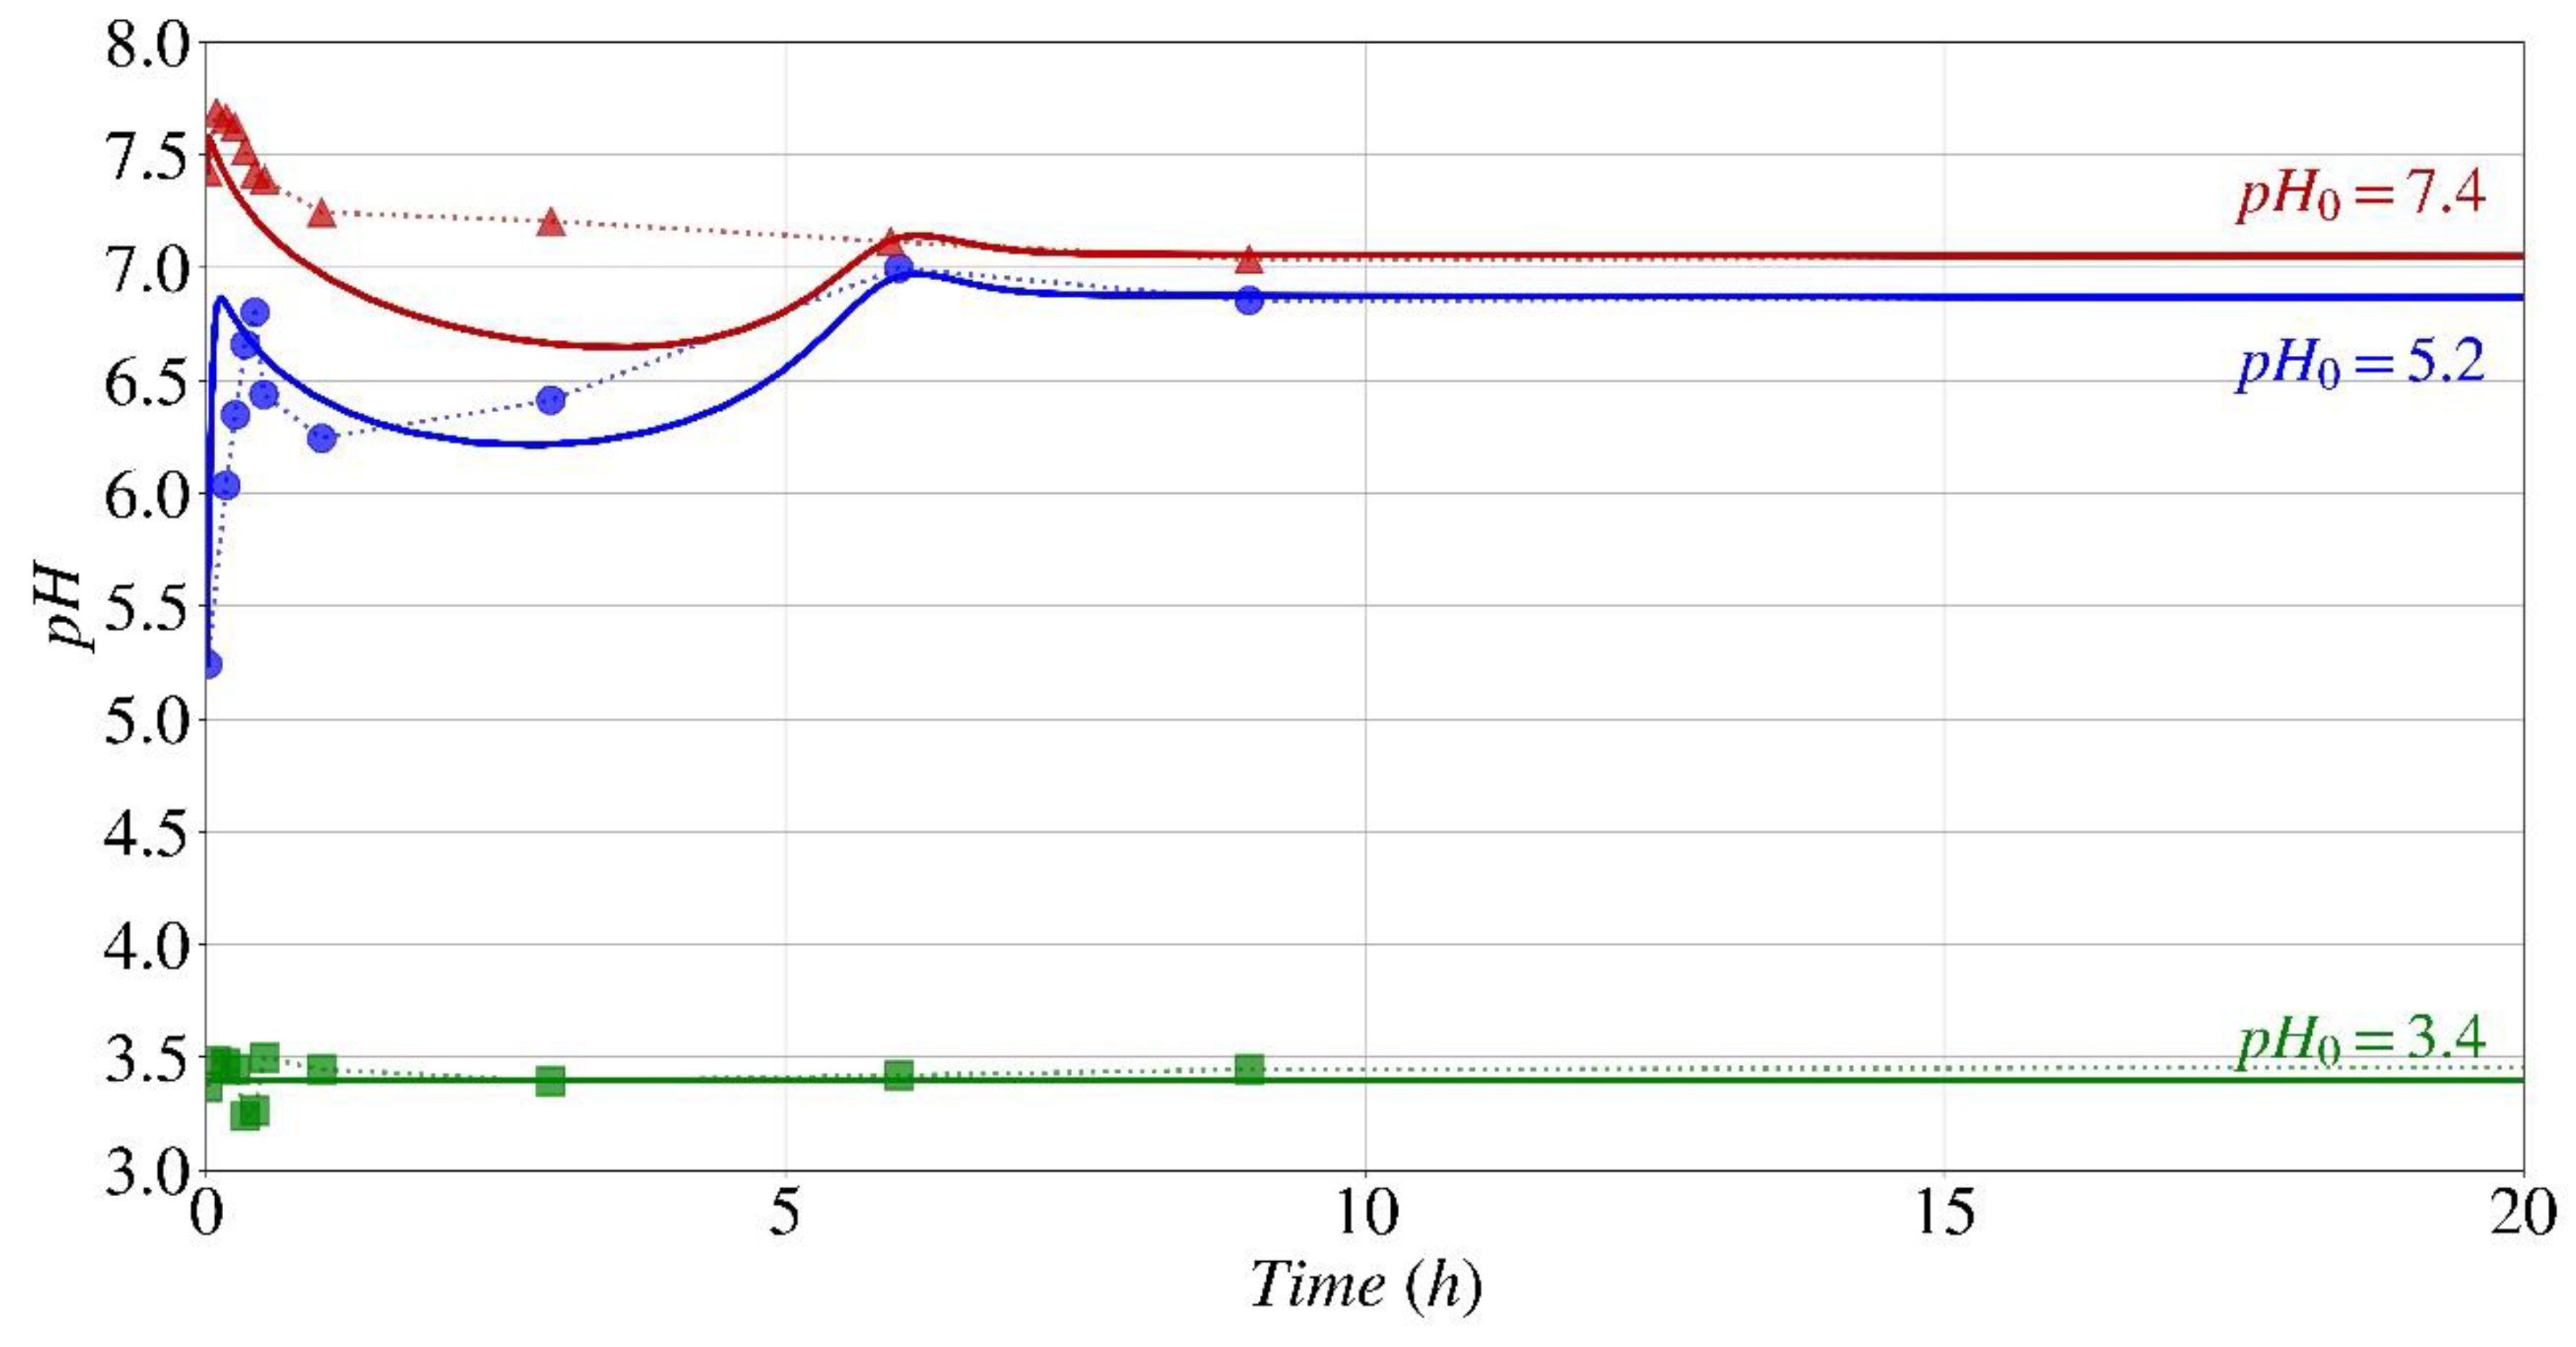
Figure 10 displays the outcome of pH fluctuations during biocementation by
S. pasteurii (MICP) obtained by the computational model proposed in this study (represented by continuous lines) and the experimental data Lai et al. [
39] (represented by symbols) both investigated at three different initial pH values (
pH0): 3.4, 5.2, and 7.4. There is a satisfactory correspondence between the numerical model and the experimental results. As anticipated, at a pH of 3.4 (green line), which is lower than the threshold at which the enzyme responsible for biocementation denatures, there is no apparent variation in pH, and hence no precipitation of
CaCO3 occurs. At pH levels of 5.2 and 7.4, which are within the suitable range for the urease enzyme of
S. pasteurii, the pH fluctuation pattern is similar to the one observed by Paassen [
38] (
Figure 9). There is a rapid increase in pH at the beginning of the process, followed by a decrease until the halfway point, and then a gradual increase until the process is complete, and the pH level reaches a plateau. The difference in the duration of the biocementation process, which also refers to the time it requires for the pH to stabilize, between these two references is attributed to the difference in the concentration of urea and calcium utilized in the media. In the investigation done by Lai et al. [
39], the concentrations of both urea and calcium were approximately half of those used by Paassen [
38]. At pH
0 levels of 5.2 and 7.4, it is evident that the process of biocementation is nearly complete after 6 hours, and the computational model accurately predicts this tendency.
After establishing the numerical model's capacity to accurately forecast the development of calcium carbonate concentration and pH over time, the model was used to determine the best environmental conditions for enhancing the calcium carbonate precipitation process. For instance,
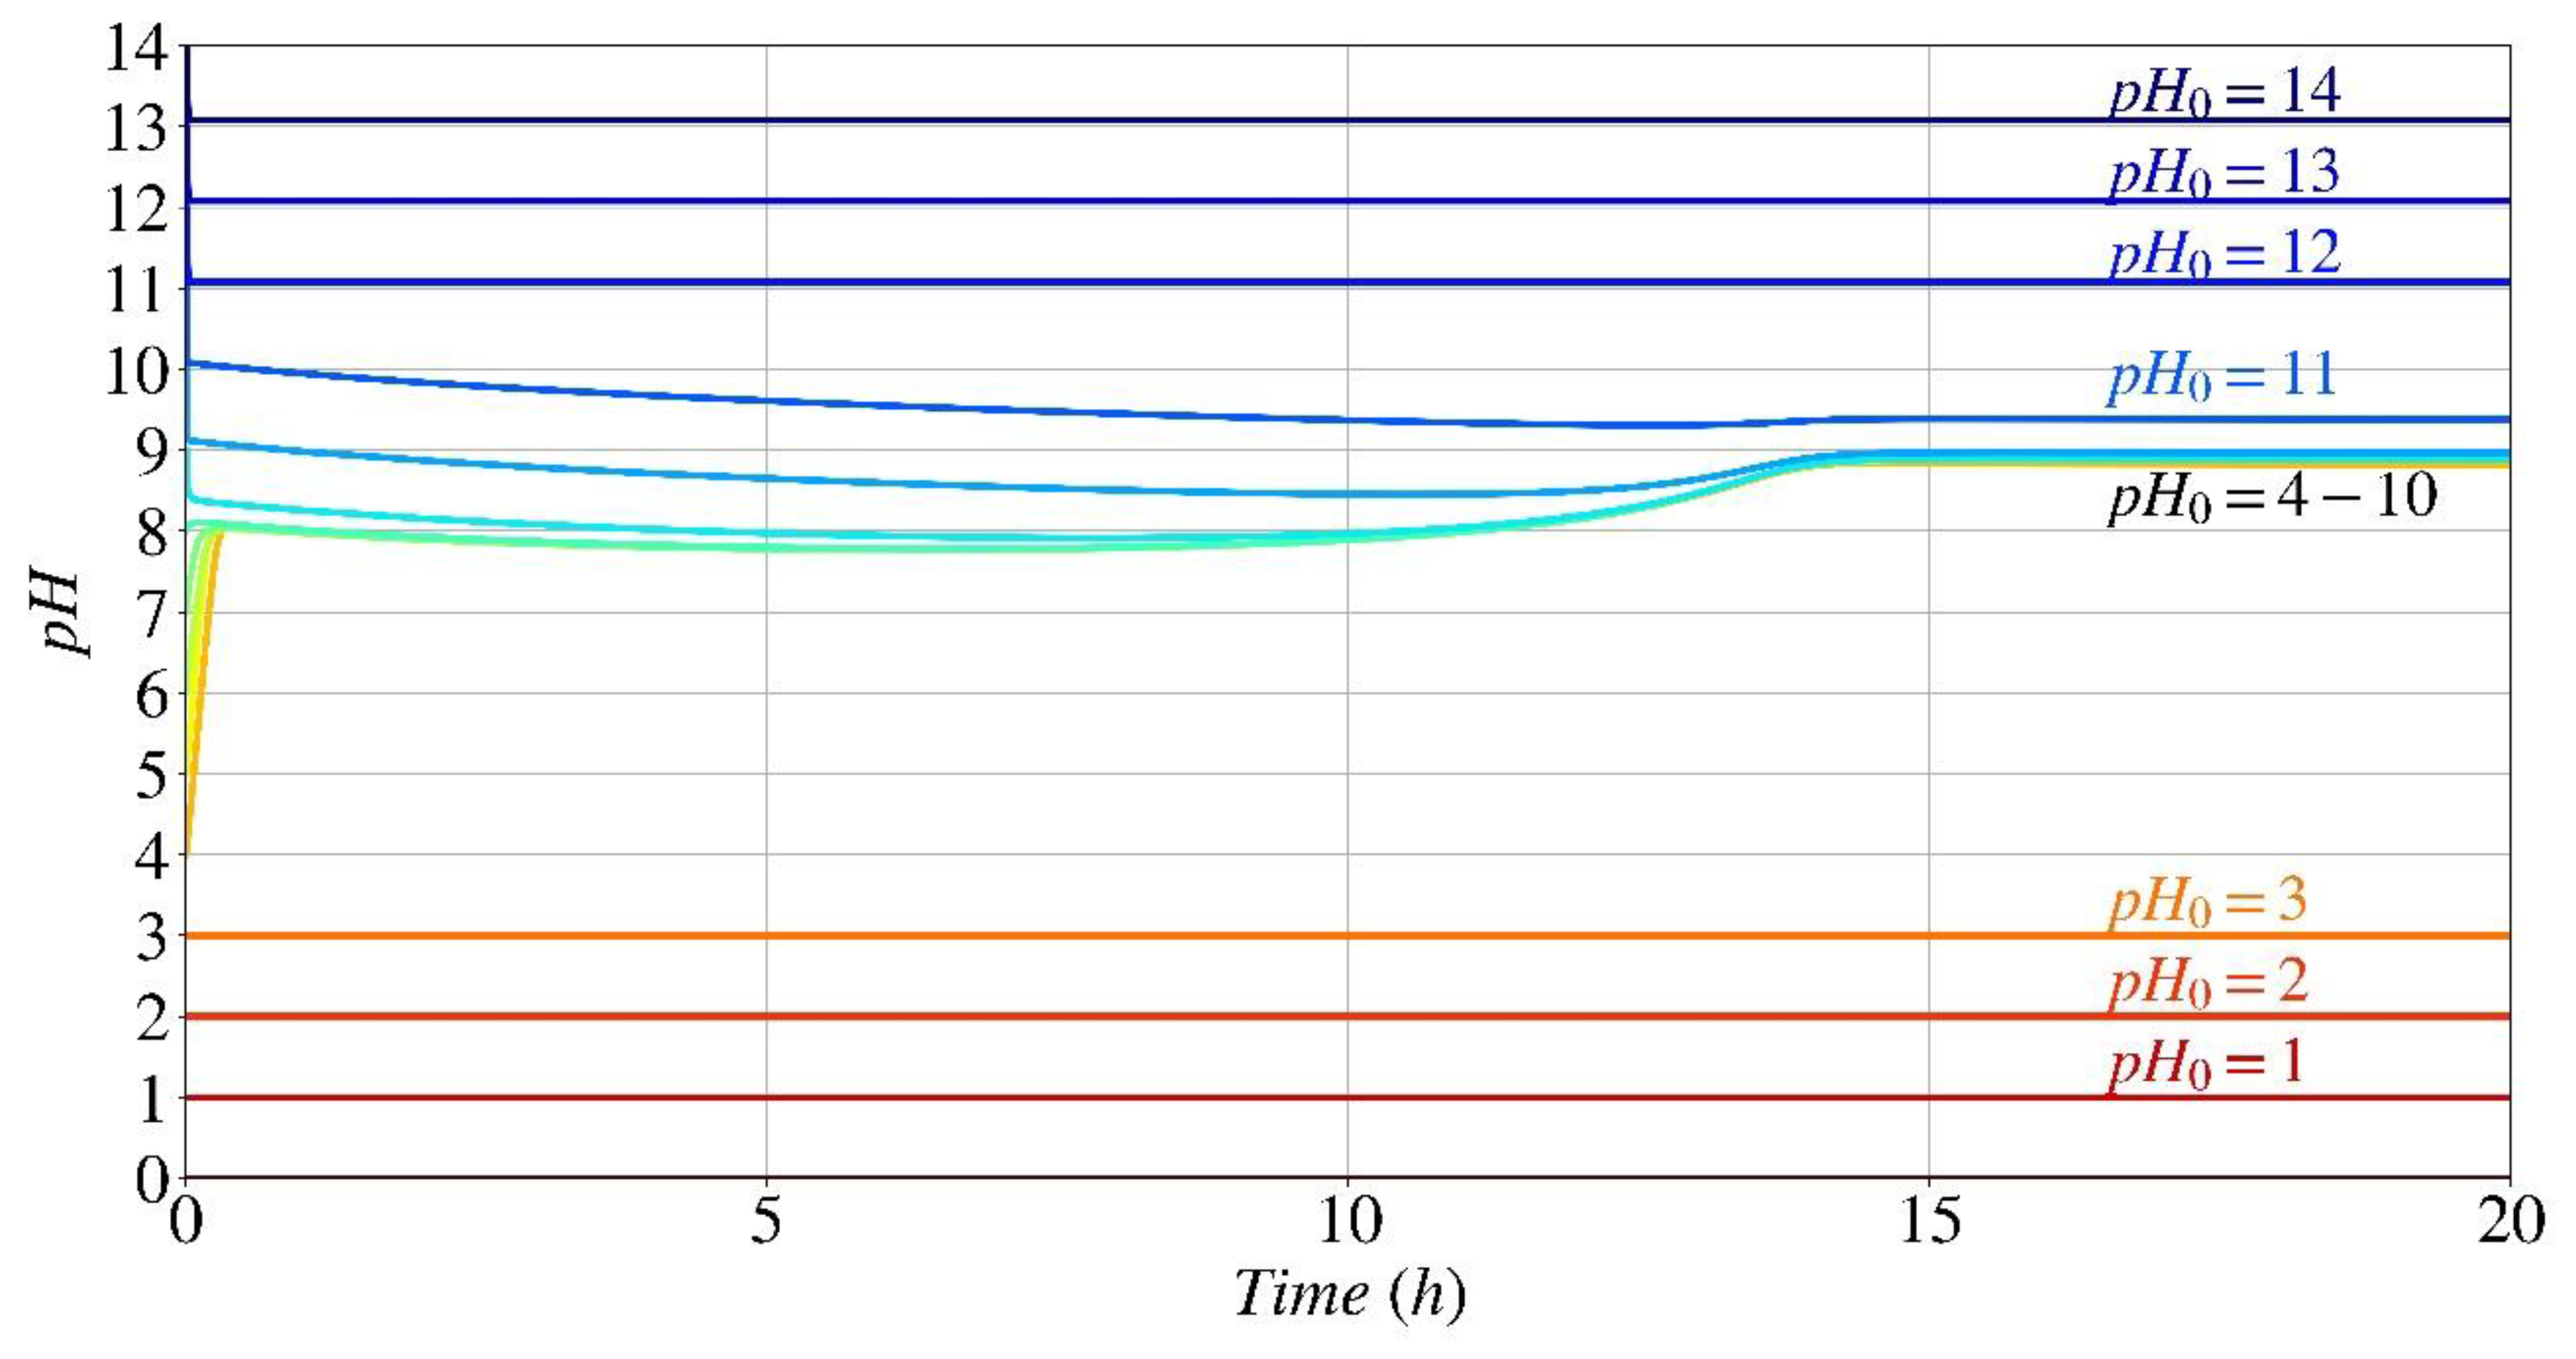
Figure 11 depicts a parametric analysis of pH evolution based on the starting pH value for the same amounts of urea and calcium considered in
Figure 6 and
Figure 9.
If the initial ambient pH values are lower than 3.5 or higher than 12 (the point at which the enzyme responsible for bio-cementation loses its structure), the hydrolysis rate is null; hence, a horizontal line with no change in pH is expected. At these specific pH levels, the enzyme does not start the hydrolysis process. As a result, all chemical reactions from Eq. (5) to Eq. (14), except for Eq. (11), are not activated. The only by-product that can be produced is
CaOH+ (Eq. (11)), which is formed owing to the charge balance between the various calcium species in the system, specifically calcium chloride in this case. Thus, in an acidic environment with a pH below 3.5, there is no alteration in pH. In contrast, in an alkaline environment with a pH greater than 12, the system rapidly seeks to attain equilibrium between different forms of calcium within the initial 1 or 2 minutes, resulting in an immediate decrease of around 0.9 in pH. When the initial pH is between 4 and 7, during the first 10–15 minutes of urea hydrolysis, there is a notable and immediate rise in pH, as previously mentioned (
Figure 9). This facilitates the pH transition from lower levels, which may not be optimal for bacterial enzymatic activity, to higher levels, where the normalized hydrolysis rate as a function of pH exceeds 0.9, which is consistent with the experimental investigation reported by Lai et al. [
39]. For initial pH levels ranging from 8.5 to 11, as the precipitation of
CaCO3 proceeds the pH increase causes a decrease of normalized hydrolysis rate (
Figure 3). The pH drop at the early stage is the result of superposition of decrease of pH by reactions’ by-products and increase of pH due to urea hydrolysis. Thus, the overall variation of pH for this range of initial pH is little.
Conclusions
The current study offered a concise overview of the theoretical foundation for parameters that influence biochemical processes associated with microbially induced calcium carbonate precipitation. A systematic methodology for developing a computational model utilizing COMSOL Multiphysics® to forecast calcium carbonate precipitation and environmental fluctuations throughout the bio-cementation process has been delineated. A function has been implemented to establish the bacterial urease activity by considering the real-time impact of three separate environmental factors: urea and calcium concentrations and the initial pH level of the environment, which regulates the rate of urease hydrolysis based on the existing circumstances. Conclusions from comparing this study's computational model prediction with previously published experimental data are as follows:
The established model precisely forecasts the pattern and quantity of consumption of the main reactants (urea and calcium), as well as the production of the resulting products (precipitated calcium carbonate) and by-products (ammonium).
Additionally, it has the capability to predict the amount of all other secondary by-products Eqs. (6)-(13).
The model has the capability to forecast the progression of electrical conductivity in the system during the biocementation process.
The parametric analysis conducted using the computational model and experimental findings shown that the provided model and generated code had the capability to accurately predict the kinetics of the biocementation process under various starting pH conditions.
The parametric study indicates that the optimal initial pH range for the formation of calcium carbonate and the subsequent pH changes over time, when utilizing Sporosarcina pasteurii for bio-cementation, is between 4 and 10.
It is crucial to acknowledge that the model has the ability to forecast the result and aid as a valuable tool for optimizing the ideal bio-cementation process. This optimization can be achieved by considering different factors such as varying concentrations of primary reactants, different sources of calcium, or changes in the type of bacterium or enzyme isolated from a bacterium or plant. However, it is necessary to have knowledge of the intrinsic parameters mentioned in Eqs. (1)–(3) for this process.
Regarding future advancements, it would be advantageous to employ systematic coding software, such as MATLAB, to concurrently combine the newly introduced hydrolysis rate function (RHydrolysis) with other significant factors. This will lead to a more advanced and thorough computational model. For instance, one could define a code that establishes a hydrolysis rate as a function of urea and calcium concentration, system pH, and temperature () while simultaneously correlating the evolution of the system's environmental conditions over time from the computational calculation in COMSOL Multiphysics®. Acquiring this code necessitates carrying out a thorough parametric experimental investigation, meticulously tracking all components while altering one element at a time. This is necessary in order to establish the relationship between the modification of one parameter and its impact on the other three parameters, and ultimately on RHydrolysis.
Author Contributions
S.K.: Conceptualization, Methodological investigation, Formal analysis, Computational modeling, Data curation, Visualization, Validation, Writing - Original draft, Writing – Review & editing. C.M.: Conceptualization, Methodological investigation, Formal analysis, Writing – Review & editing, Validation. M.K.: Conceptualization, Methodological investigation, Formal analysis, Writing – Review & editing, Validation. All authors have read and agreed to the published version of the manuscript.
Funding
This research received no external funding.
Data Availability Statement
The experimental data may be accessed online through the referenced literature. The code specifically designed for COMSOL Multiphysics® shown in this publication will be provided upon request.
Conflicts of Interest
The authors declare that they have no known competing financial interests or personal relationships that could have appeared to influence the work reported in this paper.
References
- R. Devrani, A.A. Dubey, K. Ravi, L. Sahoo. Applications of bio-cementation and bio-polymerization for aeolian erosion control. J. Arid Environ. 2021, 187, 104433. [Google Scholar] [CrossRef]
- S.M. Fattahi, A. Soroush, N. Huang. Biocementation Control of Sand against Wind Erosion. J. Geotech. Geoenvironmental Eng. 2020, 146, 04020045. [Google Scholar] [CrossRef]
- A.A. Dubey, R. Devrani, K. Ravi, N.K. Dhami, A. Mukherjee, L. Sahoo. Experimental investigation to mitigate aeolian erosion via biocementation employed with a novel ureolytic soil isolate. Aeolian Res. 2021, 52, 100727. [Google Scholar] [CrossRef]
- S.M.A. Zomorodian, H. Ghaffari, B.C. O’Kelly. Stabilisation of crustal sand layer using biocementation technique for wind erosion control. Aeolian Res. 2019, 40, 34–41. [Google Scholar] [CrossRef]
- A.I. Omoregie, E.A. Palombo, D.E.L. Ong, P.M. Nissom. A feasible scale-up production of Sporosarcina pasteurii using custom-built stirred tank reactor for in-situ soil biocementation. Biocatal. Agric. Biotechnol. 2020, 24, 101544. [Google Scholar] [CrossRef]
- K.M.N.S. Wani, B.A. Mir. An Experimental Study on the Bio-cementation and Bio-clogging Effect of Bacteria in Improving Weak Dredged Soils. Geotech. Geol. Eng. 2021, 39, 317–334. [Google Scholar] [CrossRef]
- A.M. Sharaky, N.S. Mohamed, M.E. Elmashad, N.M. Shredah. Application of microbial biocementation to improve the physico-mechanical properties of sandy soil. Constr. Build. Mater. 2018, 190, 861–869. [Google Scholar] [CrossRef]
- K. Xu, M. Huang, C. Xu, J. Zhen, G. Jin, H. Gong. Assessment of the bio-cementation effect on shale soil using ultrasound measurement. Soils Found. 2023, 63, 101249. [Google Scholar] [CrossRef]
- A.A. Dubey, K. Ravi, A. Mukherjee, L. Sahoo, M.A. Abiala, N.K. Dhami. Biocementation mediated by native microbes from Brahmaputra riverbank for mitigation of soil erodibility, Sci. Rep. 2021, 11, 15250. [Google Scholar] [CrossRef]
- L. Cheng, M.A. Shahin, R. Cord-Ruwisch. Bio-cementation of sandy soil using microbially induced carbonate precipitation for marine environments. Géotechnique 2014, 64, 1010–1013. [Google Scholar] [CrossRef]
- H. Abdel-Aleem, T. Dishisha, A. Saafan, A.A. AbouKhadra, Y. Gaber. Biocementation of soil by calcite/aragonite precipitation using Pseudomonas azotoformans and Citrobacter freundii derived enzymes. RSC Adv. 2019, 9, 17601–17611. [Google Scholar] [CrossRef] [PubMed]
- J. Yin, J.-X. Wu, K. Zhang, M.A. Shahin, L. Cheng. Comparison between MICP-Based Bio-Cementation Versus Traditional Portland Cementation for Oil-Contaminated Soil Stabilisation. Sustainability 2022, 15, 434. [Google Scholar] [CrossRef]
- P.J. Venda Oliveira, J.P.G. Neves. Effect of Organic Matter Content on Enzymatic Biocementation Process Applied to Coarse-Grained Soils. J. Mater. Civ. Eng. 2019, 31, 04019121. [Google Scholar] [CrossRef]
- V.S. Whiffin, L.A. van Paassen, M.P. Harkes. Microbial carbonate precipitation as a soil improvement technique. Geomicrobiol. J. 2007, 24, 417–423. [Google Scholar] [CrossRef]
- D. Mujah, M.A. Shahin, L. Cheng. State-of-the-Art Review of Biocementation by Microbially Induced Calcite Precipitation (MICP) for Soil Stabilization. Geomicrobiol. J. 2017, 34, 524–537. [Google Scholar] [CrossRef]
- S. Khoshtinat. Advancements in Exploiting Sporosarcina pasteurii as Sustainable Construction Material: A Review. Sustainability 2023, 15, 13869. [Google Scholar] [CrossRef]
- A. I. Omoregie, E.A. Palombo, P.M. Nissom. Bioprecipitation of calcium carbonate mediated by ureolysis: A review. Environ. Eng. Res. 2021, 26. [Google Scholar] [CrossRef]
- D. M. Iqbal, L.S. Wong, S.Y. Kong. Bio-Cementation in Construction Materials: A Review. Materials 2021, 14, 2175. [Google Scholar] [CrossRef]
- N.N.T. Huynh, K. Imamoto, C. Kiyohara. A Study on Biomineralization using Bacillus Subtilis Natto for Repeatability of Self-Healing Concrete and Strength Improvement. J. Adv. Concr. Technol. 2019, 17, 700–714. [Google Scholar] [CrossRef]
- M. Bagga, C. Hamley-Bennett, A. Alex, B.L. Freeman, I. Justo-Reinoso, I.C. Mihai, S. Gebhard, K. Paine, A.D. Jefferson, E. Masoero, I.D. Ofiţeru. Advancements in bacteria based self-healing concrete and the promise of modelling. Constr. Build. Mater. 2022, 358, 129412. [Google Scholar] [CrossRef]
- N.N.T. Huynh, N.M. Phuong, N.P.A. Toan, N.K. Son. Bacillus Subtilis HU58 Immobilized in Micropores of Diatomite for Using in Self-healing Concrete. Procedia Eng. 2017, 171, 598–605. [Google Scholar] [CrossRef]
- N.N.T. Huynh, K. Imamoto, C. Kiyohara. Biomineralization Analysis and Hydration Acceleration Effect in Self-healing Concrete using Bacillus subtilis natto, J. Adv. Concr. Technol. 2022, 20, 609–623. [Google Scholar] [CrossRef]
- N. Huynh, K. Imamoto, C. Kiyohara, Compressive Strength Improvement and Water Permeability of Self-Healing Concrete Using Bacillus Subtilis Natto, in: XV Int. Conf. Durab. Build. Mater. Compon. EBook Proc., CIMNE, 2020. [CrossRef]
- S. Joshi, S. Goyal, M.S. Reddy. Corn steep liquor as a nutritional source for biocementation and its impact on concrete structural properties. J. Ind. Microbiol. Biotechnol. 2018, 45, 657–667. [Google Scholar] [CrossRef] [PubMed]
- M. Wu, X. Hu, Q. Zhang, D. Xue, Y. Zhao. Growth environment optimization for inducing bacterial mineralization and its application in concrete healing, Constr. Build. Mater. 2019, 209, 631–643. [Google Scholar] [CrossRef]
- S. Krishnapriya, D.L. Venkatesh Babu, P.A. G. Isolation and identification of bacteria to improve the strength of concrete. Microbiol. Res. 2015, 174, 48–55. [Google Scholar] [CrossRef]
- M.J. Castro-Alonso, L.E. Montañez-Hernandez, M.A. Sanchez-Muñoz, M.R. Macias Franco, R. Narayanasamy, N. Balagurusamy. Microbially Induced Calcium Carbonate Precipitation (MICP) and Its Potential in Bioconcrete: Microbiological and Molecular Concepts, Front. Mater. 2019, 6, 126. [Google Scholar] [CrossRef]
- H. Porter, A. Mukherjee, R. Tuladhar, N.K. Dhami. Life Cycle Assessment of Biocement: An Emerging Sustainable Solution?, Sustainability 2021, 13, 13878. [Google Scholar] [CrossRef]
- A. Bandyopadhyay, A. Saha, D. Ghosh, B. Dam, A.K. Samanta, S. Dutta. Microbial repairing of concrete & its role in CO2 sequestration: a critical review. Beni-Suef Univ. J. Basic Appl. Sci. 2023, 12, 7. [Google Scholar] [CrossRef]
- C. Wu, J. Chu, S. Wu, Y. Hong. 3D characterization of microbially induced carbonate precipitation in rock fracture and the resulted permeability reduction. Eng. Geol. 2019, 249, 23–30. [Google Scholar] [CrossRef]
- Y. Wang, K. Soga, J.T. Dejong, A.J. Kabla. Microscale Visualization of Microbial-Induced Calcium Carbonate Precipitation Processes. J. Geotech. Geoenvironmental Eng. 2019, 145. [Google Scholar] [CrossRef]
- X. Xu, H. Guo, M. Li, X. Deng. Bio-cementation improvement via CaCO3 cementation pattern and crystal polymorph: A review. Constr. Build. Mater. 2021, 297, 123478. [Google Scholar] [CrossRef]
- K.D. Mutitu, M.O. Munyao, M.J. Wachira, R. Mwirichia, K.J. Thiong’o, M.J. Marangu. Effects of biocementation on some properties of cement-based materials incorporating Bacillus Species bacteria – a review. J. Sustain. Cem.-Based Mater. 2019, 8, 309–325. [Google Scholar] [CrossRef]
- N. Erdmann, D. Strieth. Influencing factors on ureolytic microbiologically induced calcium carbonate precipitation for biocementation. World J. Microbiol. Biotechnol. 2023, 39, 61. [Google Scholar] [CrossRef]
- F. Hammes, W. Verstraete*. Key roles of pH and calcium metabolism in microbial carbonate precipitation. Rev. Environ. Sci. Biotechnol. 2002, 1, 3–7. [Google Scholar] [CrossRef]
- C.-Z. Qin, S.M. Hassanizadeh, A. Ebigbo. Pore-scale network modeling of microbially induced calcium carbonate precipitation: Insight into scale dependence of biogeochemical reaction rates. Water Resour. Res. 2016, 52, 8794–8810. [Google Scholar] [CrossRef]
- M. Sharma, N. Satyam, N. Tiwari, S. Sahu, K.R. Reddy. Simplified biogeochemical numerical model to predict pore fluid chemistry and calcite precipitation during biocementation of soil, Arab. J. Geosci. 2021, 14, 807. [Google Scholar] [CrossRef]
- L.A. Van Paassen, Biogrout, ground improvement by microbial induced carbonate precipitation, (2009). http://resolver.tudelft.nl/uuid:5f3384c4-33bd-4f2a-8641-7c665433b57b (accessed August 13, 2023).
- H.-J. Lai, M.-J. Cui, J. Chu, Effect of pH on soil improvement using one-phase-low-pH MICP or EICP biocementation method, Acta Geotech. (2022). [CrossRef]
- V.S. Whiffin, Microbial CaCO3 precipitation for the production of biocement - Murdoch University, Murdoch University, 2004. https://researchportal.murdoch.edu.au/esploro/outputs/doctoral/Microbial-CaCO3-precipitation-for-the-production/991005540291407891 (accessed January 9, 2024).
- IWA Task Group for Mathematical Modelling of Anaerobic Digestion Processes, Anaerobic Digestion Model No.1 (ADM1), IWA Publishing, 2005. [CrossRef]
- S. Stocks-Fischer, J.K. Galinat, S.S. Bang. Microbiological precipitation of CaCO3, Soil Biol. Biochem. 1999, 31, 1563–1571. [Google Scholar] [CrossRef]
- Equilibrium Constants - Chemistry LibreTexts, Chem. Libr. (2014). https://chem.libretexts.org/Ancillary_Materials/Reference/Reference_Tables/Equilibrium_Constants (accessed February 10, 2024).
- W.M. Haynes, ed., CRC Handbook of Chemistry and Physics, 95th ed., CRC Press, Boca Raton, 2014. [CrossRef]
- 7.5.1: About Carbonic Anhydrase, Chem. Libr. (2021). https://chem.libretexts.org/Courses/Earlham_College/CHEM_361%3A_Inorganic_Chemistry_(Watson)/07%3A_Bioinorganic_Chemistry/7.05%3A_The_Reaction_Pathways_of_Zinc_Enzymes_and_Related_Biological_Catalysts/7.5.01%3A_About_Carbonic_Anhydrase (accessed March 24, 2024).
- E1: Acid Dissociation Constants at 25°C, Chem. Libr. (2014). https://chem.libretexts.org/Ancillary_Materials/Reference/Reference_Tables/Equilibrium_Constants/E1%3A_Acid_Dissociation_Constants_at_25C (accessed March 24, 2024).
- E5: Acid Dissociation Constants of Organics, Chem. Libr. (2013). https://chem.libretexts.org/Ancillary_Materials/Reference/Reference_Tables/Equilibrium_Constants/E5%3A_Acid_Dissociation_Constants_of_Organics (accessed March 24, 2024).
- E3: Solubility Constants for Compounds at 25°C, Chem. Libr. (2014). https://chem.libretexts.org/Ancillary_Materials/Reference/Reference_Tables/Equilibrium_Constants/E3._Solubility_Constants_for_Compounds_at_25C (accessed March 24, 2024).
|
Disclaimer/Publisher’s Note: The statements, opinions and data contained in all publications are solely those of the individual author(s) and contributor(s) and not of MDPI and/or the editor(s). MDPI and/or the editor(s) disclaim responsibility for any injury to people or property resulting from any ideas, methods, instructions or products referred to in the content. |
© 2024 by the authors. Licensee MDPI, Basel, Switzerland. This article is an open access article distributed under the terms and conditions of the Creative Commons Attribution (CC BY) license (http://creativecommons.org/licenses/by/4.0/).
