Submitted:
09 September 2024
Posted:
10 September 2024
You are already at the latest version
Abstract
Keywords:
Introduction
Materials and Methods
Materials
Synthesis of gold and silica nanoparticles (AuNPs and SNP) respectively:
Gold/Silica Janus nanoparticles with Chemical Synthesis:
Characterization techniques:
Experiment: Particle Tracking Velocimetry (PTV):
Data Treatment (PTV), Image processing (TrackMate):
Data Treatment (PTV), Data Processing (Python):
Result and Discussion:
Particle preparation:
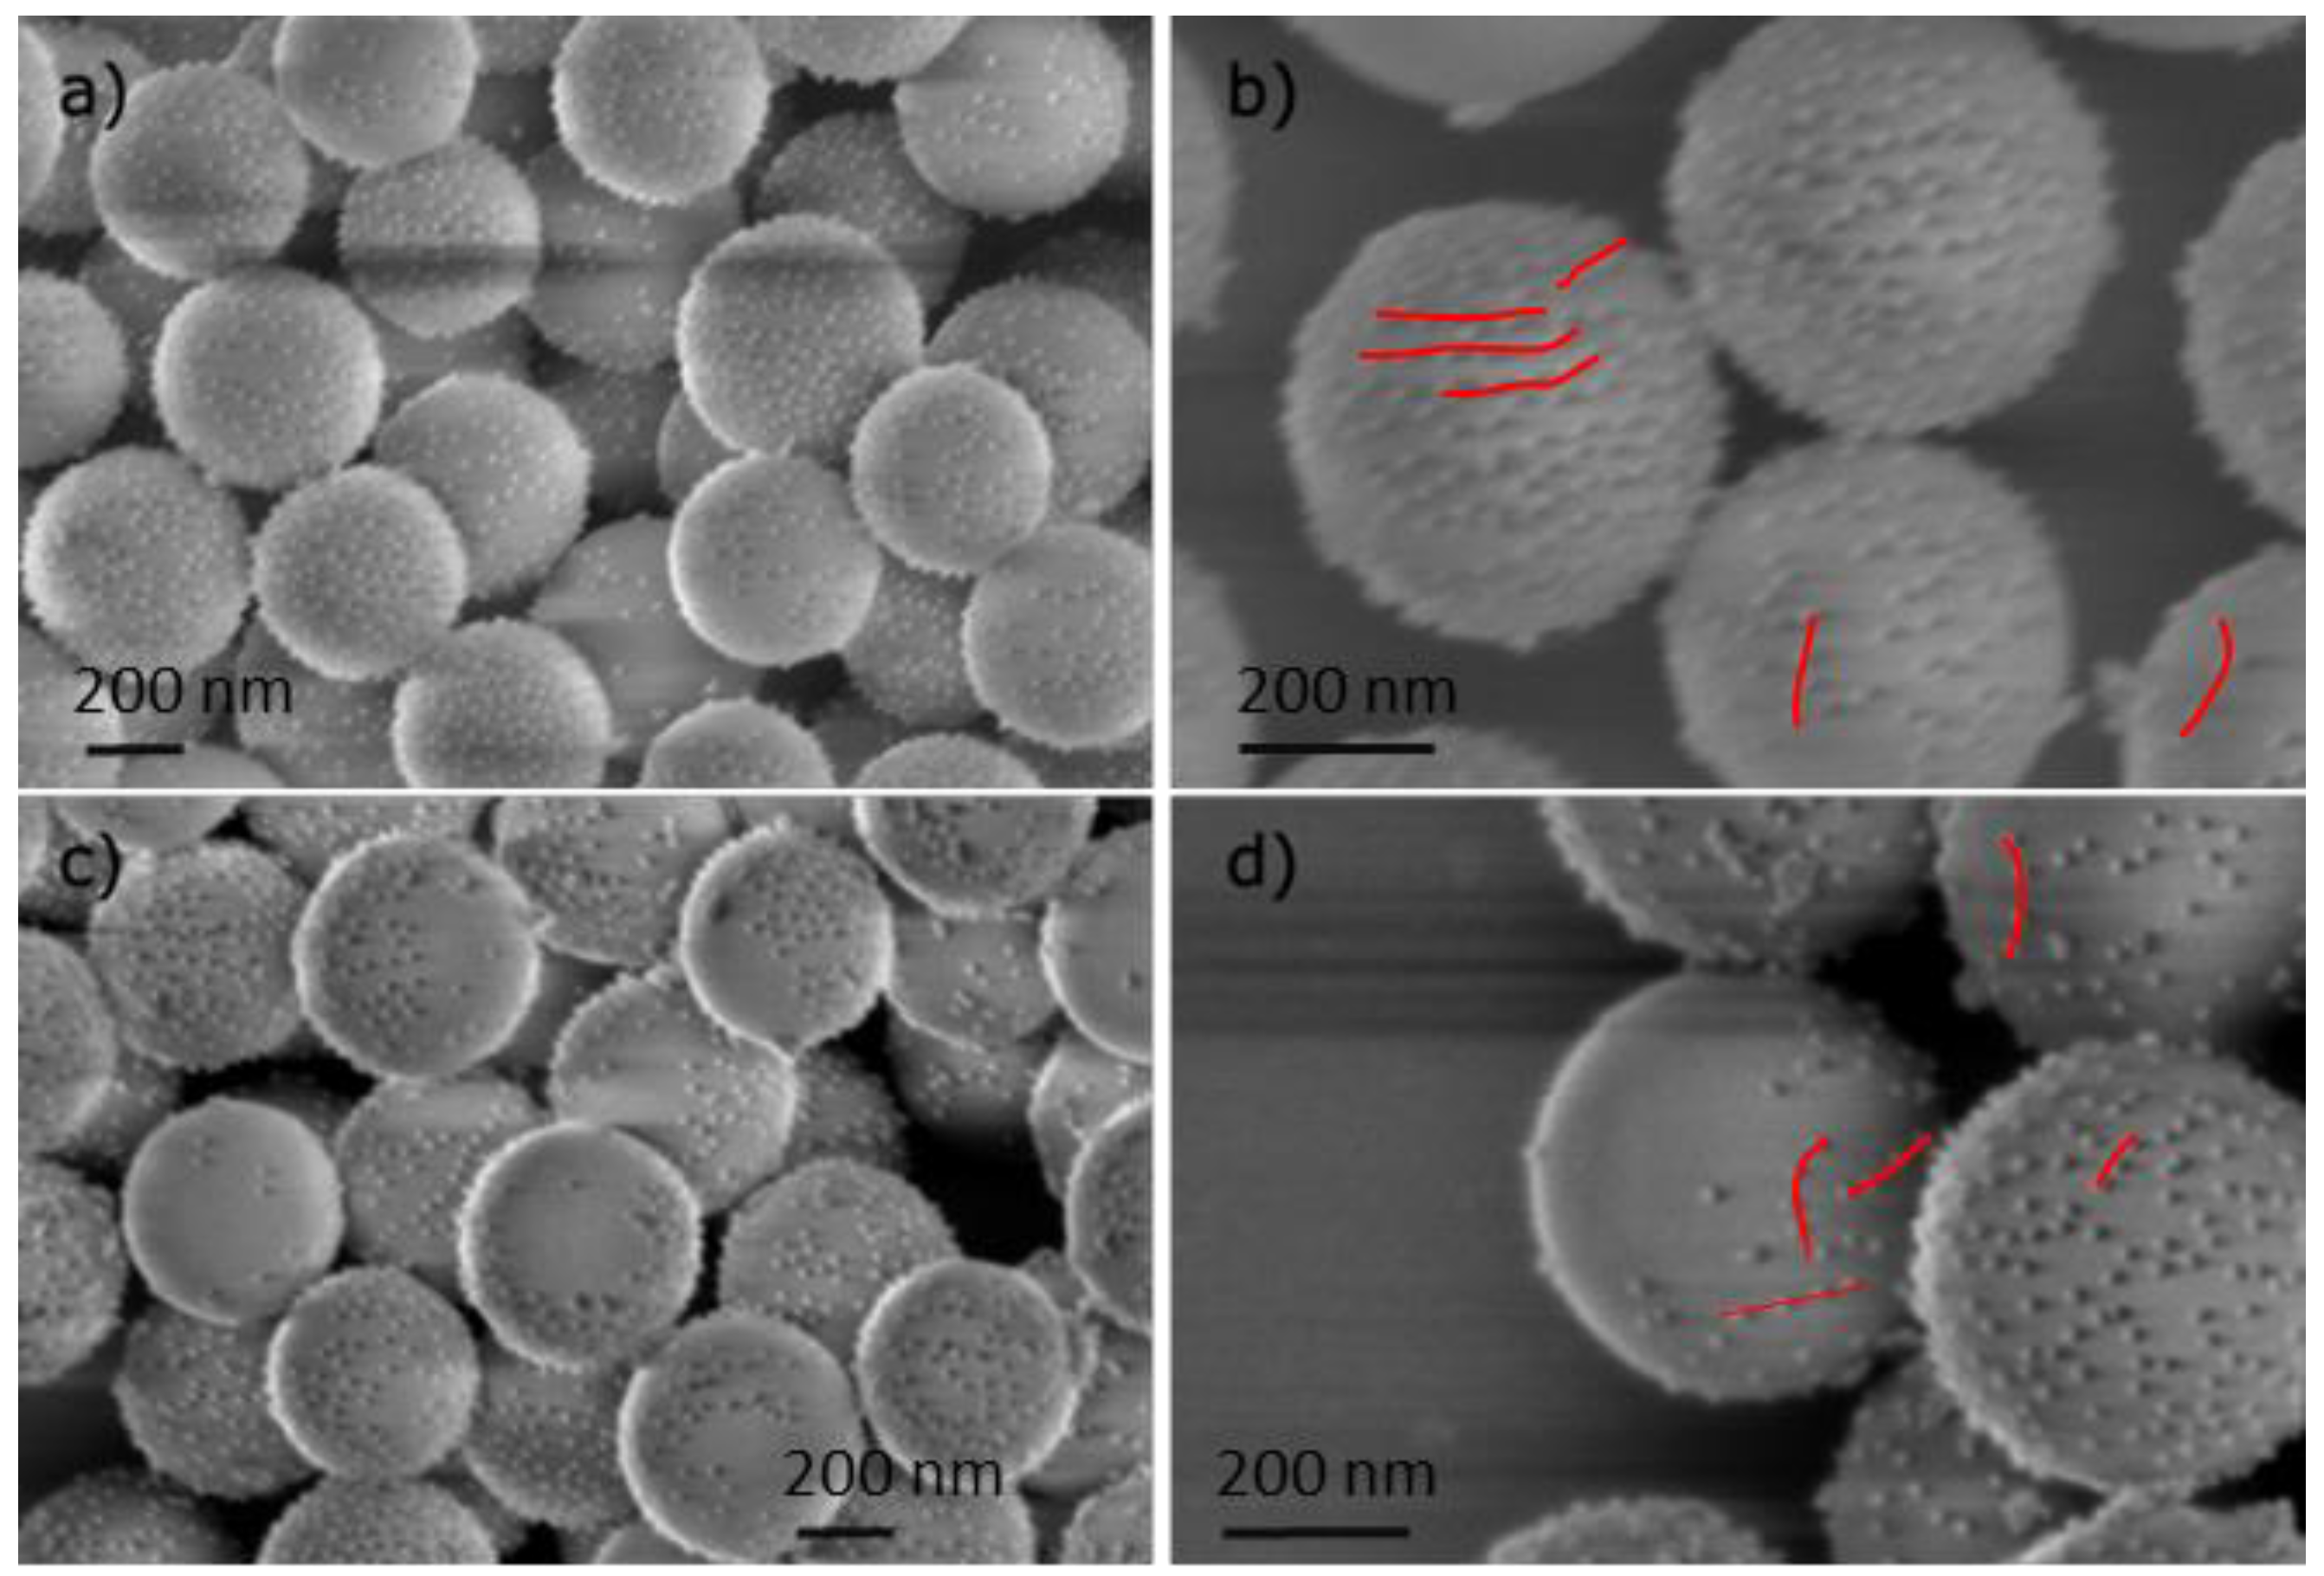
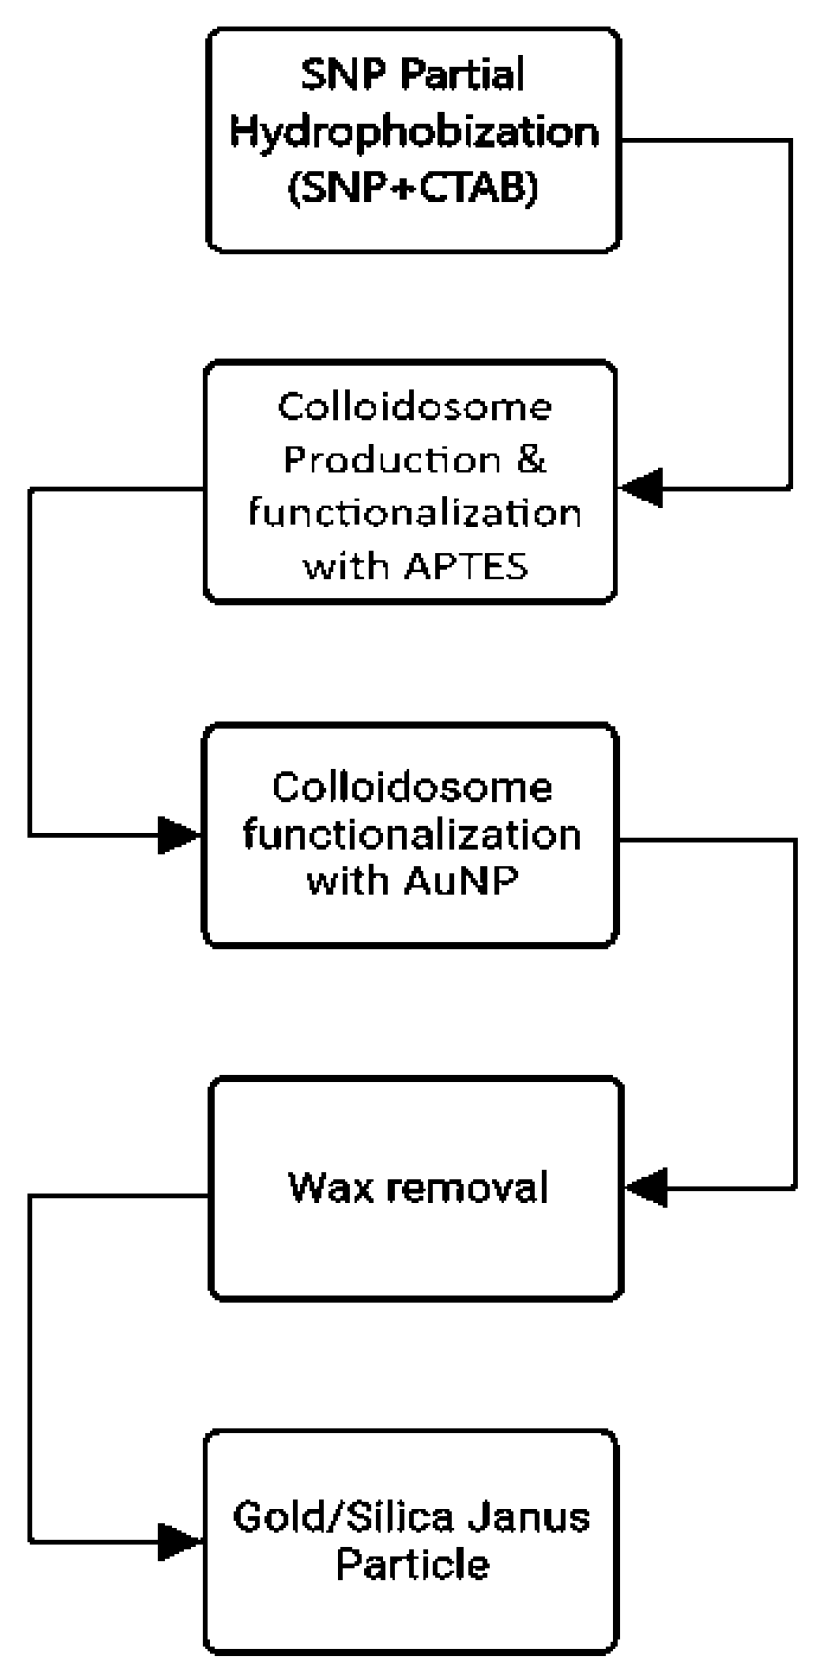
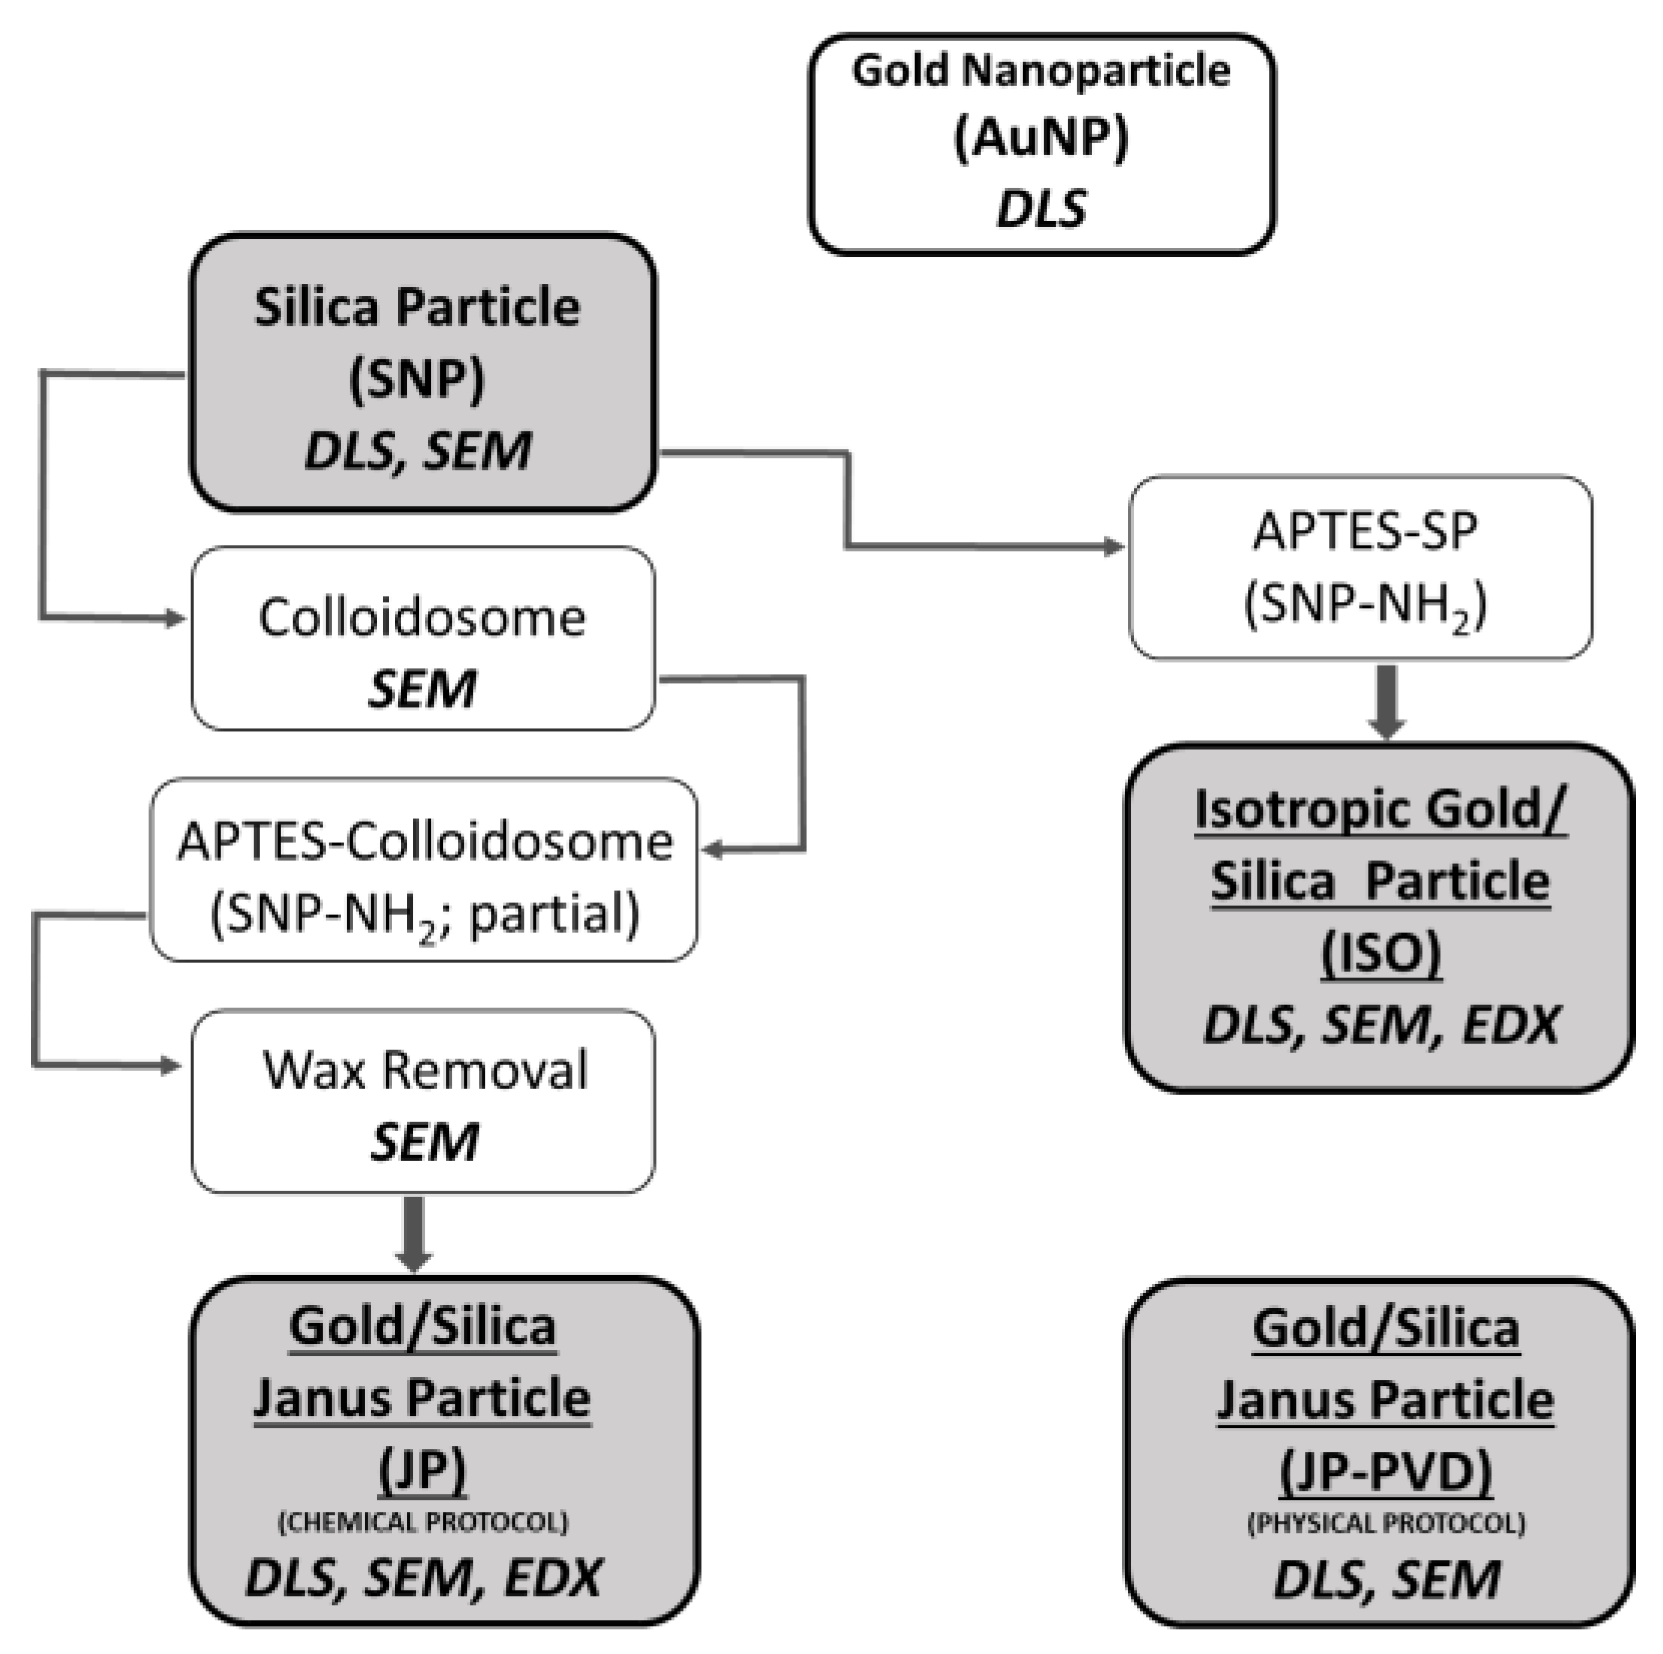
Summary of the different class of synthesized particles:
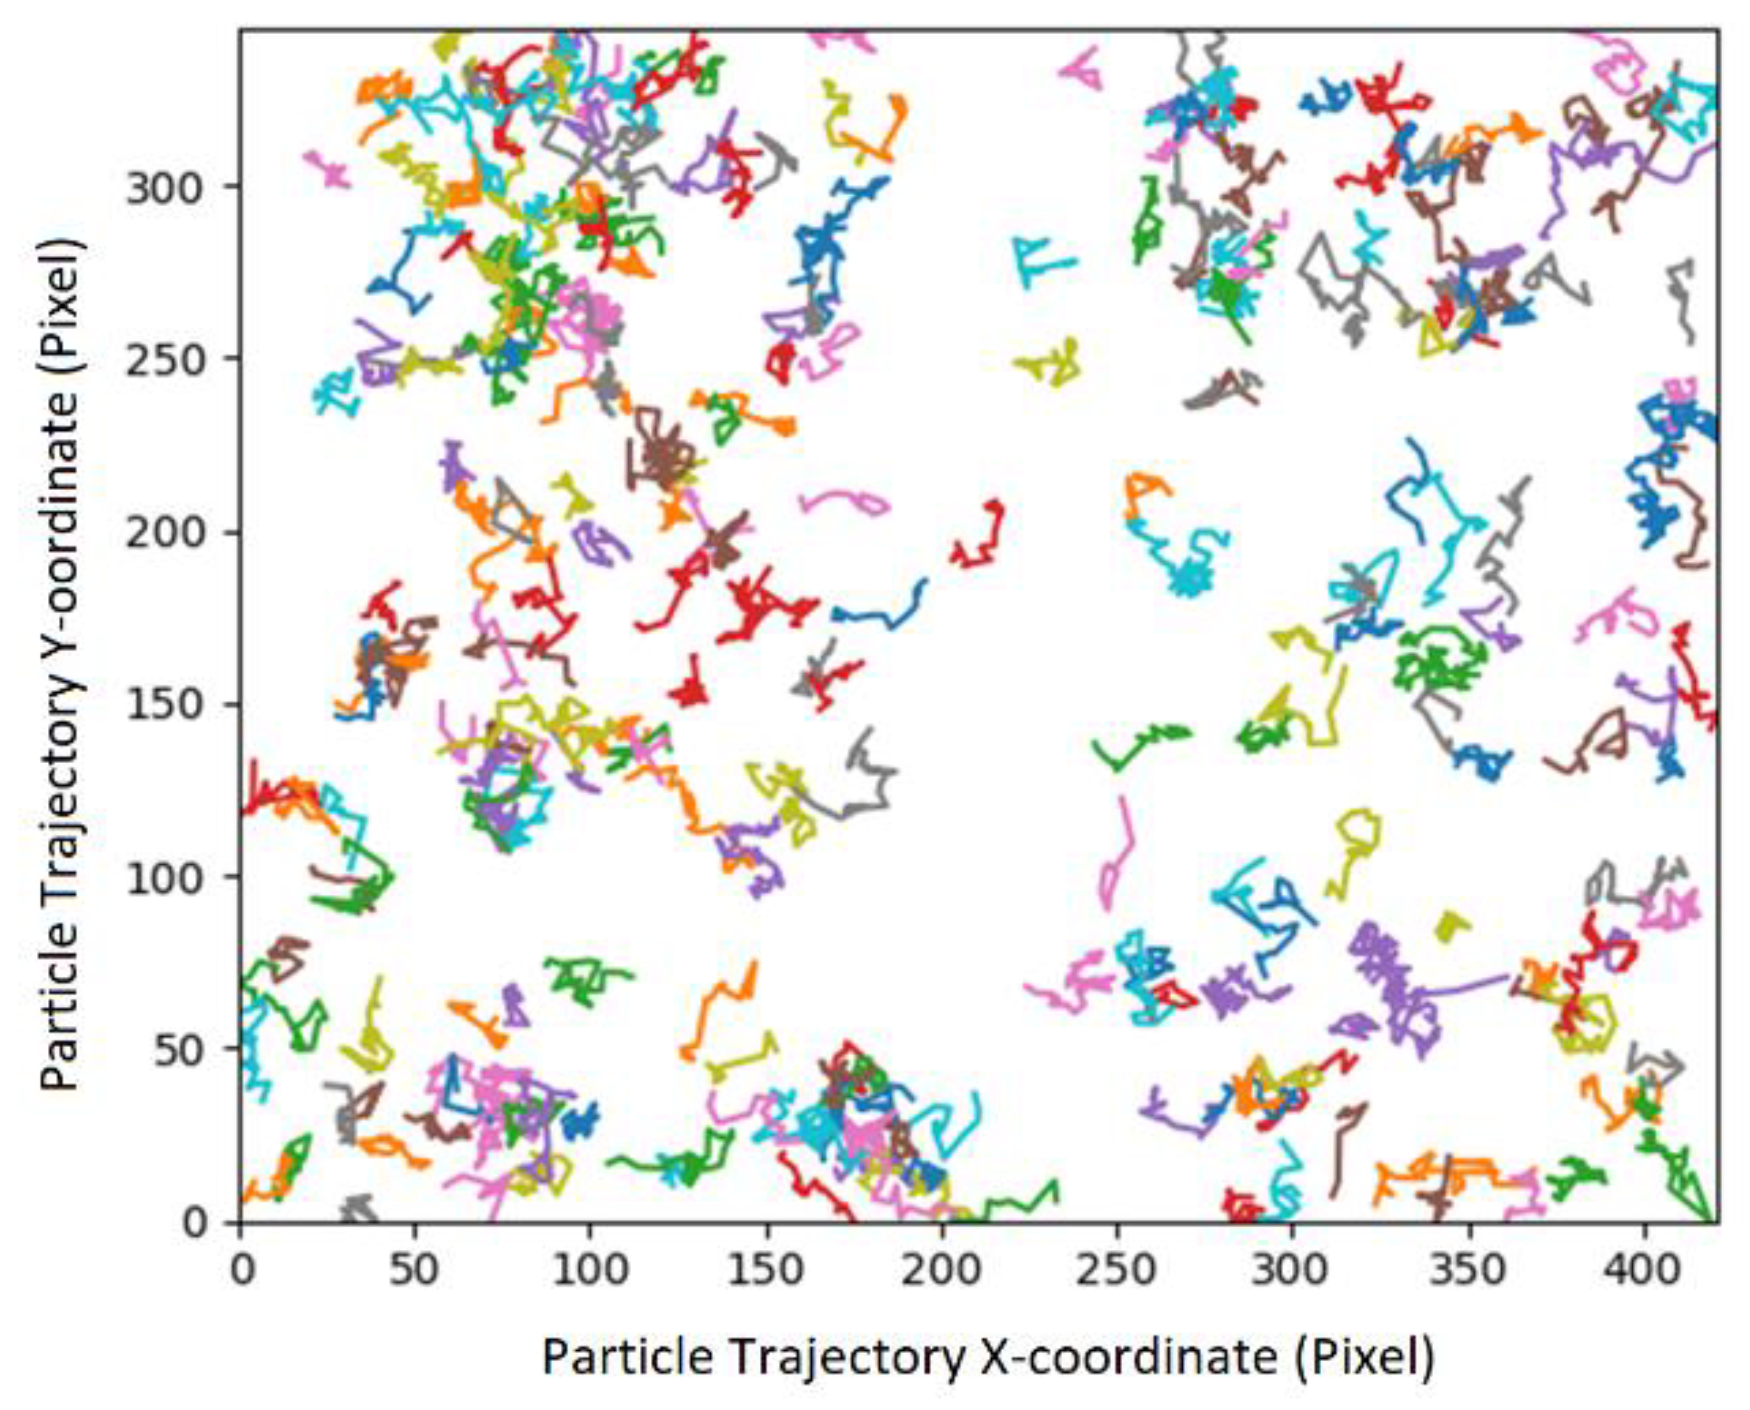
Mobility in bulk solution:
Mobility in microchannels:
Comparison:
Conclusions
Author Contributions
Acknowledgments
References
- Elgeti, J.; Winkler, R.G.; Gompper, G. Physics of Microswimmers—Single Particle Motion and Collective Behavior: A Review. Rep. Prog. Phys. 2015, 78, 056601. [Google Scholar] [CrossRef] [PubMed]
- Pourrahimi, A.M.; Pumera, M. Multifunctional and Self-Propelled Spherical Janus Nano/Micromotors: Recent Advances. Nanoscale 2018, 10, 16398–16415. [Google Scholar] [CrossRef]
- Lee, E.; Huang, D.; Luo, T. Ballistic Supercavitating Nanoparticles Driven by Single Gaussian Beam Optical Pushing and Pulling Forces. Nat. Commun. 2020, 11, 2404. [Google Scholar] [CrossRef]
- Yariv, E. Self-Diffusiophoresis of Slender Catalytic Colloids. Langmuir 2020, 36, 6903–6915. [Google Scholar] [CrossRef] [PubMed]
- Kuron, M.; Kreissl, P.; Holm, C. Toward Understanding of Self-Electrophoretic Propulsion under Realistic Conditions: From Bulk Reactions to Confinement Effects. Acc. Chem. Res. 2018, 51, 2998–3005. [Google Scholar] [CrossRef] [PubMed]
- Wang, W.; Mallouk, T.E. A Practical Guide to Analyzing and Reporting the Movement of Nanoscale Swimmers. ACS Nano 2021, 15, 15446–15460. [Google Scholar] [CrossRef]
- Popescu, M.N.; Uspal, W.E.; Bechinger, C.; Fischer, P. Chemotaxis of Active Janus Nanoparticles. Nano Lett. 2018, 18, 5345–5349. [Google Scholar] [CrossRef]
- Joseph, A.; Contini, C.; Cecchin, D.; Nyberg, S.; Ruiz-Perez, L.; Gaitzsch, J.; Fullstone, G.; Tian, X.; Azizi, J.; Preston, J.; et al. Chemotactic Synthetic Vesicles: Design and Applications in Blood-Brain Barrier Crossing. Sci. Adv. 2017, 3, e1700362. [Google Scholar] [CrossRef]
- Baraban, L.; Harazim, S.M.; Sanchez, S.; Schmidt, O.G. Chemotactic Behavior of Catalytic Motors in Microfluidic Channels. Angew. Chem. Int. Ed. 2013, 52, 5552–5556. [Google Scholar] [CrossRef]
- Hong, Y.; Blackman, N.M.K.; Kopp, N.D.; Sen, A.; Velegol, D. Chemotaxis of Nonbiological Colloidal Rods. Phys. Rev. Lett. 2007, 99, 178103. [Google Scholar] [CrossRef]
- Perro, A.; Reculusa, S.; Ravaine, S.; Bourgeat-Lami, E.; Duguet, E. Design and Synthesis of Janus Micro- and Nanoparticles. J. Mater. Chem. 2005, 15, 3745–3760. [Google Scholar] [CrossRef]
- Gao, C.; Feng, Y.; Wilson, D.A.; Tu, Y.; Peng, F. Micro-Nano Motors with Taxis Behavior: Principles, Designs, and Biomedical Applications. Small 2022, 18, 2106263. [Google Scholar] [CrossRef] [PubMed]
- Mandal, N.S.; Sen, A.; Astumian, R.D. Kinetic Asymmetry versus Dissipation in the Evolution of Chemical Systems as Exemplified by Single Enzyme Chemotaxis. J. Am. Chem. Soc. 2023, 145, 5730–5738. [Google Scholar] [CrossRef]
- Wang, J.; Toebes, B.J.; Plachokova, A.S.; Liu, Q.; Deng, D.; Jansen, J.A.; Yang, F.; Wilson, D.A. Self-Propelled PLGA Micromotor with Chemotactic Response to Inflammation. Adv. Healthc. Mater. 2020, 9, 1901710. [Google Scholar] [CrossRef]
- Jiang, H.; He, X.; Ma, Y.; Fu, B.; Xu, X.; Subramanian, B.; Hu, C. Isotropic Hedgehog-Shaped-TiO 2 /Functional-Multiwall-Carbon-Nanotube Micromotors with Phototactic Motility in Fuel-Free Environments. ACS Appl. Mater. Interfaces 2021, 13, 5406–5417. [Google Scholar] [CrossRef]
- Deprez, L.; De Buyl, P. Passive and Active Colloidal Chemotaxis in a Microfluidic Channel: Mesoscopic and Stochastic Models. Soft Matter 2017, 13, 3532–3543. [Google Scholar] [CrossRef]
- Lyu, X.; Liu, X.; Zhou, C.; Duan, S.; Xu, P.; Dai, J.; Chen, X.; Peng, Y.; Cui, D.; Tang, J.; et al. Active, Yet Little Mobility: Asymmetric Decomposition of H2O2 Is Not Sufficient in Propelling Catalytic Micromotors. J. Am. Chem. Soc. 2021, 143, 12154–12164. [Google Scholar] [CrossRef]
- Bianchi, G.; Mazza, F.; Mussini, T. Catalytic Decomposition of Acid Hydrogen Peroxide Solutions on Platinum, Iridium, Palladium and Gold Surfaces. Electrochimica Acta 1962, 7, 457–473. [Google Scholar] [CrossRef]
- Cuoq, F.; Masion, A.; Labille, J.; Rose, J.; Ziarelli, F.; Prelot, B.; Bottero, J.-Y. Preparation of Amino-Functionalized Silica in Aqueous Conditions. Appl. Surf. Sci. 2013, 266, 155–160. [Google Scholar] [CrossRef]
- Avossa, J.; Esteves, A.C.C. Influence of Experimental Parameters on the Formation and Stability of Silica-Wax Colloidosomes. J. Colloid Interface Sci. 2020, 561, 244–256. [Google Scholar] [CrossRef]
- Hong, L.; Jiang, S.; Granick, S. Simple Method to Produce Janus Colloidal Particles in Large Quantity. Langmuir 2006, 22, 9495–9499. [Google Scholar] [CrossRef] [PubMed]
- Perro, A.; Meunier, F.; Schmitt, V.; Ravaine, S. Production of Large Quantities of “Janus” Nanoparticles Using Wax-in-Water Emulsions. Colloids Surf. Physicochem. Eng. Asp. 2009, 332, 57–62. [Google Scholar] [CrossRef]
- Archer, R.J.; Parnell, A.J.; Campbell, A.I.; Howse, J.R.; Ebbens, S.J. A Pickering Emulsion Route to Swimming Active Janus Colloids. Adv. Sci. 2018, 5, 1700528. [Google Scholar] [CrossRef]
- George, M.A.; Glaunsinger, W.S.; Thundat, T.; Lindsay, S.M. Electrical, Spectroscopic, and Morphological Investigation of Chromium Diffusion through Gold Films. Thin Solid Films 1990, 189, 59–72. [Google Scholar] [CrossRef]
- Moody, N.R.; Adams, D.P.; Medlin, D.; Headley, T.; Yang, N.; Volinsky, A. Effects of Diffusion on Interfacial Fracture of Gold-Chromium Hybrid Microcircuit Films. Int. J. Fract. 2003, 120, 407–419. [Google Scholar] [CrossRef]
- Vikash; Kumar, V. Ultrasonic-Assisted de-Agglomeration and Power Draw Characterization of Silica Nanoparticles. Ultrason. Sonochem. 2020, 65, 105061. [Google Scholar] [CrossRef] [PubMed]
- Vig, J.; LeBus, J. UV/Ozone Cleaning of Surfaces. IEEE Trans. Parts Hybrids Packag. 1976, 12, 365–370. [Google Scholar] [CrossRef]
- Yu, Z.; Reid, J.C.; Yang, Y.-P. Utilizing Dynamic Light Scattering as a Process Analytical Technology for Protein Folding and Aggregation Monitoring in Vaccine Manufacturing. J. Pharm. Sci. 2013, 102, 4284–4290. [Google Scholar] [CrossRef]
- Farrell, E. Guide for DLS Sample Preparation.
- Koppel, D.E. Analysis of Macromolecular Polydispersity in Intensity Correlation Spectroscopy: The Method of Cumulants. J. Chem. Phys. 1972, 57, 4814–4820. [Google Scholar] [CrossRef]
- Misono, T. Dynamic Light Scattering (DLS). In Measurement Techniques and Practices of Colloid and Interface Phenomena; Abe, M., Ed.; Springer: Singapore, 2019; pp. 65–69 ISBN 9789811359316.
- Leong, S.S.; Ng, W.M.; Lim, J.; Yeap, S.P. Dynamic Light Scattering: Effective Sizing Technique for Characterization of Magnetic Nanoparticles. In Handbook of Materials Characterization; Sharma, S.K., Ed.; Springer International Publishing: Cham, 2018; pp. 77–111 ISBN 978-3-319-92955-2.
- Kholodenko, A.L.; Douglas, J.F. Generalized Stokes-Einstein Equation for Spherical Particle Suspensions. Phys. Rev. E 1995, 51, 1081–1090. [Google Scholar] [CrossRef]
- Huang, X.; Sheng, L.; Lu, Y.; Li, S. Atomization Characteristics of Hydrogen Peroxide Solutions in Electrostatic Field. Micromachines 2022, 13, 771. [Google Scholar] [CrossRef] [PubMed]
- McGlasson, A.; Bradley, L.C. Investigating Time-Dependent Active Motion of Janus Micromotors Using Dynamic Light Scattering. Small 2021, 17, 2104926. [Google Scholar] [CrossRef] [PubMed]
- Xia, Y.; Whitesides, G.M. Soft Lithography. Angew. Chem. Int. Ed. 1998, 37, 550–575. [Google Scholar] [CrossRef]
- Tinevez, J.-Y.; Perry, N.; Schindelin, J.; Hoopes, G.M.; Reynolds, G.D.; Laplantine, E.; Bednarek, S.Y.; Shorte, S.L.; Eliceiri, K.W. TrackMate: An Open and Extensible Platform for Single-Particle Tracking. Methods 2017, 115, 80–90. [Google Scholar] [CrossRef]
- Michalet, X. Erratum: Mean Square Displacement Analysis of Single-Particle Trajectories with Localization Error: Brownian Motion in an Isotropic Medium [Phys. Rev. E 82, 041914 (2010)]. Phys. Rev. E 2011, 83, 059904. [Google Scholar] [CrossRef]
- Nandi, A.; Heinrich, D.; Lindner, B. Distributions of Diffusion Measures from a Local Mean-Square Displacement Analysis. Phys. Rev. E 2012, 86, 021926. [Google Scholar] [CrossRef]
- Medved, A.; Davis, R.; Vasquez, P.A. Understanding Fluid Dynamics from Langevin and Fokker–Planck Equations. Fluids 2020, 5, 40. [Google Scholar] [CrossRef]
- Stöber, W.; Fink, A.; Bohn, E. Controlled Growth of Monodisperse Silica Spheres in the Micron Size Range. J. Colloid Interface Sci. 1968, 26, 62–69. [Google Scholar] [CrossRef]
- Muñoz, M.I. CRISTALES FOTÓNICOS BASADOS EN ÓPALOS. phD, Universidad Autónoma de Madrid, 2003.
- Sivaraman, S.K.; Kumar, S.; Santhanam, V. Monodisperse Sub-10 Nm Gold Nanoparticles by Reversing the Order of Addition in Turkevich Method–the Role of Chloroauric Acid. J. Colloid Interface Sci. 2011, 361, 543–547. [Google Scholar] [CrossRef]
- Perro, A.; Meunier, F.; Schmitt, V.; Ravaine, S. Production of Large Quantities of “Janus” Nanoparticles Using Wax-in-Water Emulsions. Colloids Surf. Physicochem. Eng. Asp. 2009, 332, 57–62. [Google Scholar] [CrossRef]
- Ohara, P.C.; Leff, D.V.; Heath, J.R.; Gelbart, W.M. Crystallization of Opals from Polydisperse Nanoparticles. Phys. Rev. Lett. 1995, 75, 3466–3469. [Google Scholar] [CrossRef] [PubMed]
- Derjaguin, B.V.; Rabinovich, Y.I.; Churaev, N.V. Direct Measurement of Molecular Forces. Nature 1978, 272, 313–318. [Google Scholar] [CrossRef]
- Trihan, R.; Bogucki, O.; Kozlowska, A.; Ihle, M.; Ziesche, S.; Fetliński, B.; Janaszek, B.; Kieliszczyk, M.; Kaczkan, M.; Rossignol, F.; et al. Hybrid Gold-Silica Nanoparticles for Plasmonic Applications: A Comparison Study of Synthesis Methods for Increasing Gold Coverage. Heliyon 2023, 9, e15977. [Google Scholar] [CrossRef]
- Hassan, N.; Stocco, A.; Abou-Hassan, A. Droplet Liquid/Liquid Interfaces Generated in a Microfluidic Device for Assembling Janus Inorganic Nanohybrids. J. Phys. Chem. C 2015, 119, 10758–10765. [Google Scholar] [CrossRef]
- Lee, T.-C.; Alarcón-Correa, M.; Miksch, C.; Hahn, K.; Gibbs, J.G.; Fischer, P. Self-Propelling Nanomotors in the Presence of Strong Brownian Forces. Nano Lett. 2014, 14, 2407–2412. [Google Scholar] [CrossRef] [PubMed]
- Feller, D.; Otten, M.; Hildebrandt, M.; Krüsmann, M.; Bryant, G.; Karg, M. Translational and Rotational Diffusion Coefficients of Gold Nanorods Functionalized with a High Molecular Weight, Thermoresponsive Ligand: A Depolarized Dynamic Light Scattering Study. Soft Matter 2021, 17, 4019–4026. [Google Scholar] [CrossRef]
- Kharazmi, A.; Priezjev, N.V. Diffusion of a Janus Nanoparticle in an Explicit Solvent: A Molecular Dynamics Simulation Study. J. Chem. Phys. 2015, 142, 234503. [Google Scholar] [CrossRef]
- Fadda, F.; Matoz-Fernandez, D.A.; Van Roij, R.; Jabbari-Farouji, S. The Interplay between Chemo-Phoretic Interactions and Crowding in Active Colloids. Soft Matter 2023, 19, 2297–2310. [Google Scholar] [CrossRef]
- Howse, J.R.; Jones, R.A.L.; Ryan, A.J.; Gough, T.; Vafabakhsh, R.; Golestanian, R. Self-Motile Colloidal Particles: From Directed Propulsion to Random Walk. Phys. Rev. Lett. 2007, 99, 048102. [Google Scholar] [CrossRef]
- Dunderdale, G.; Ebbens, S.; Fairclough, P.; Howse, J. Importance of Particle Tracking and Calculating the Mean-Squared Displacement in Distinguishing Nanopropulsion from Other Processes. Langmuir 2012, 28, 10997–11006. [Google Scholar] [CrossRef]
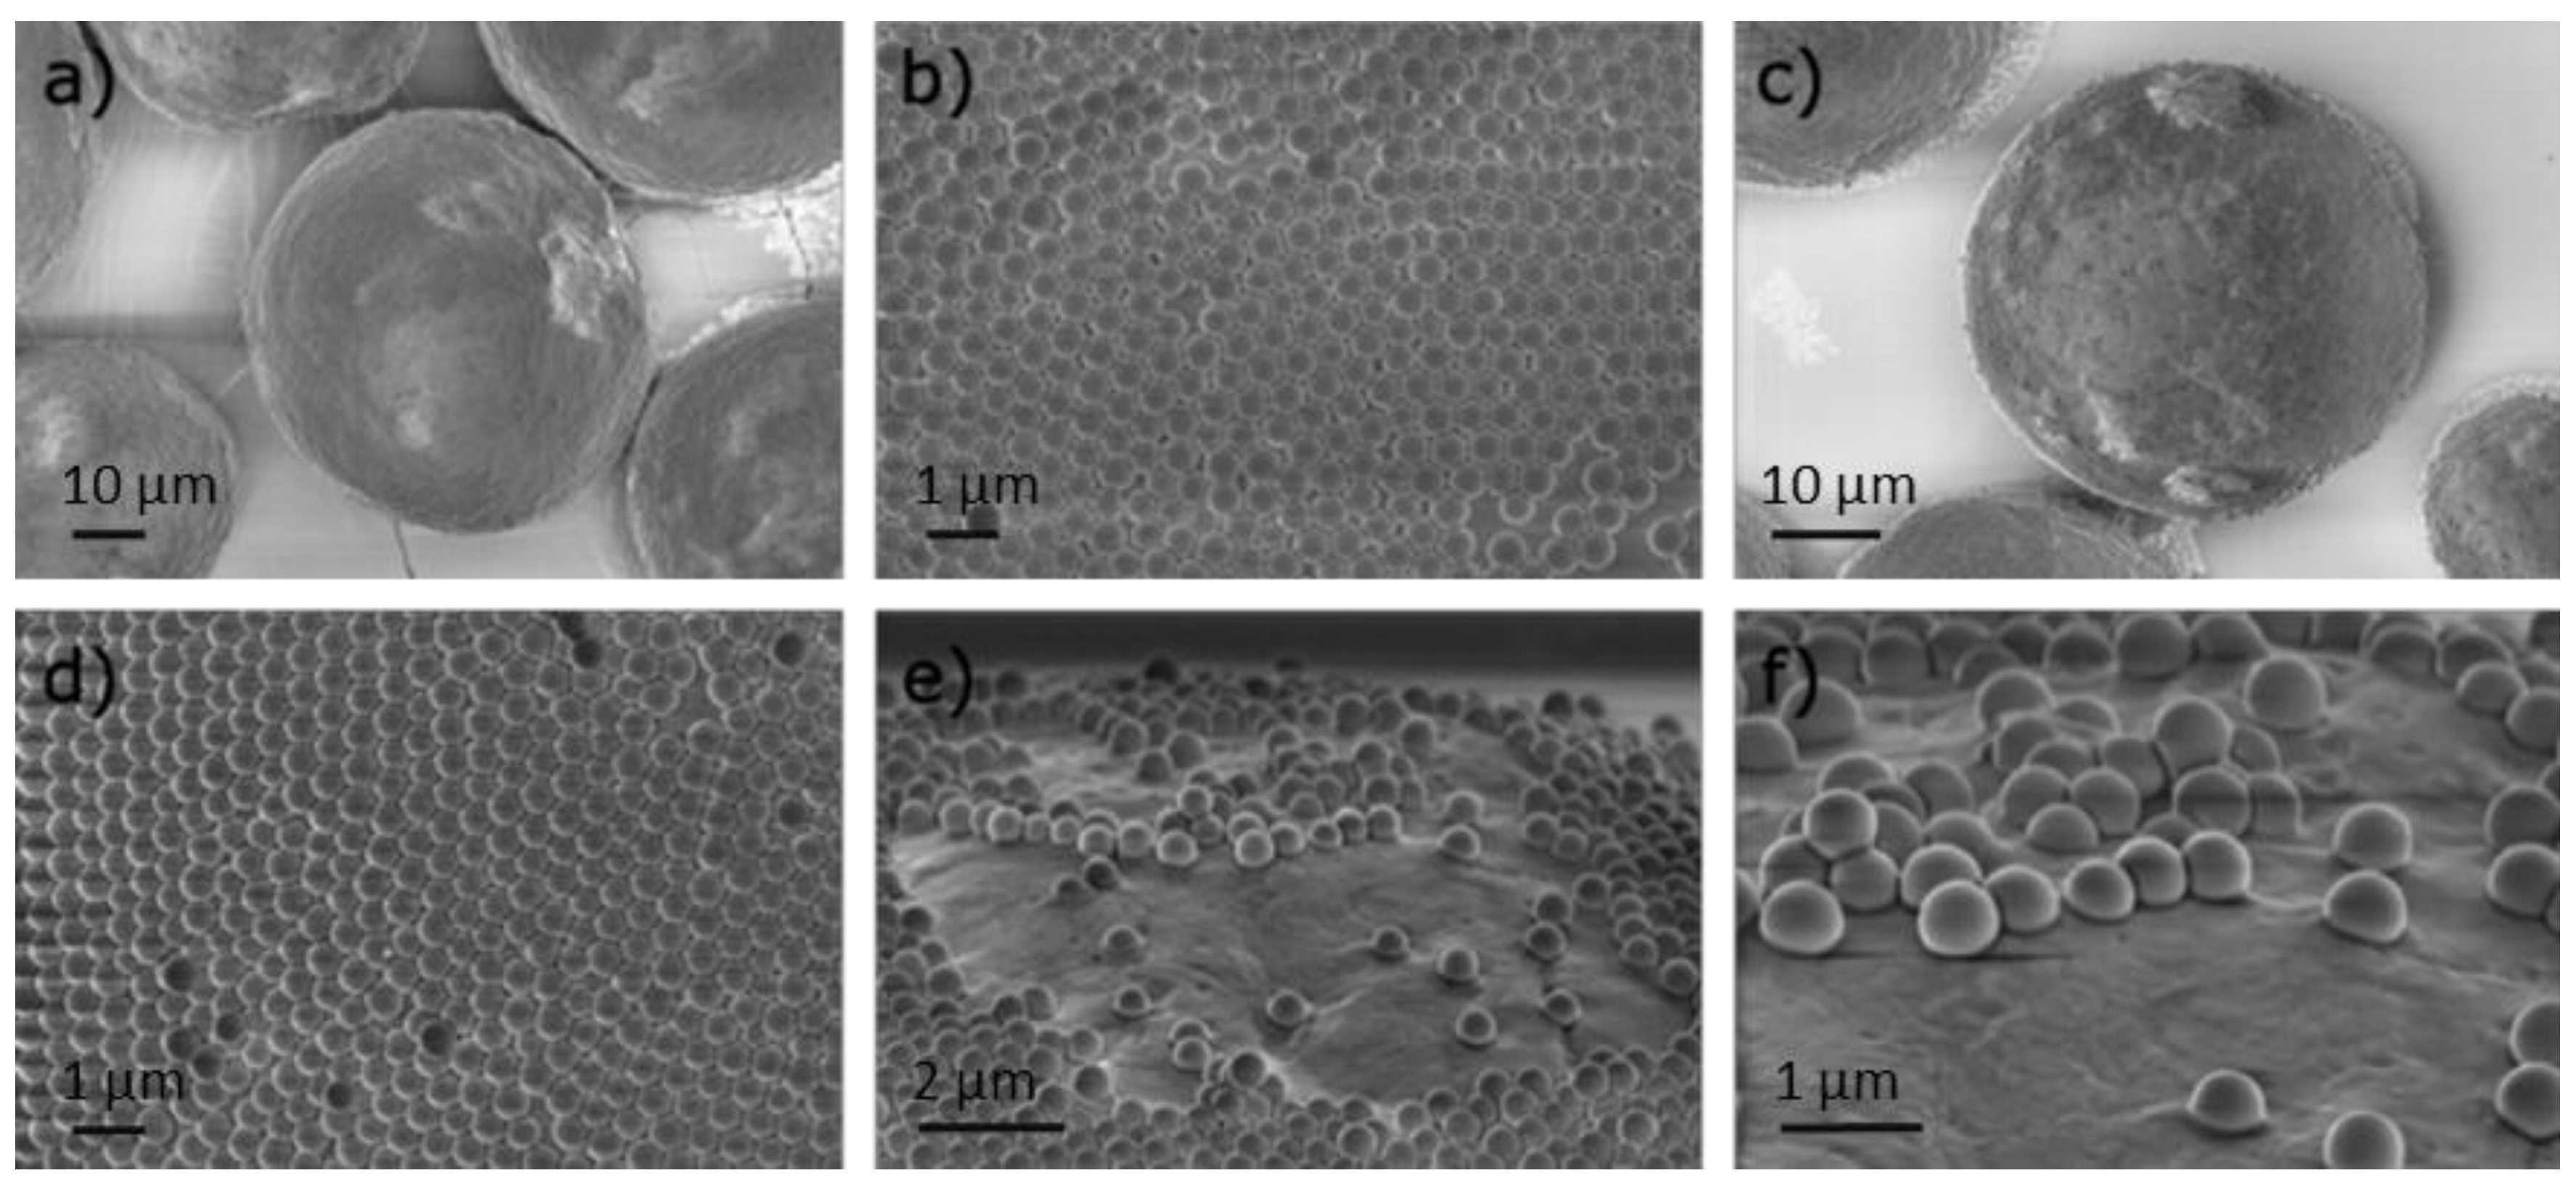
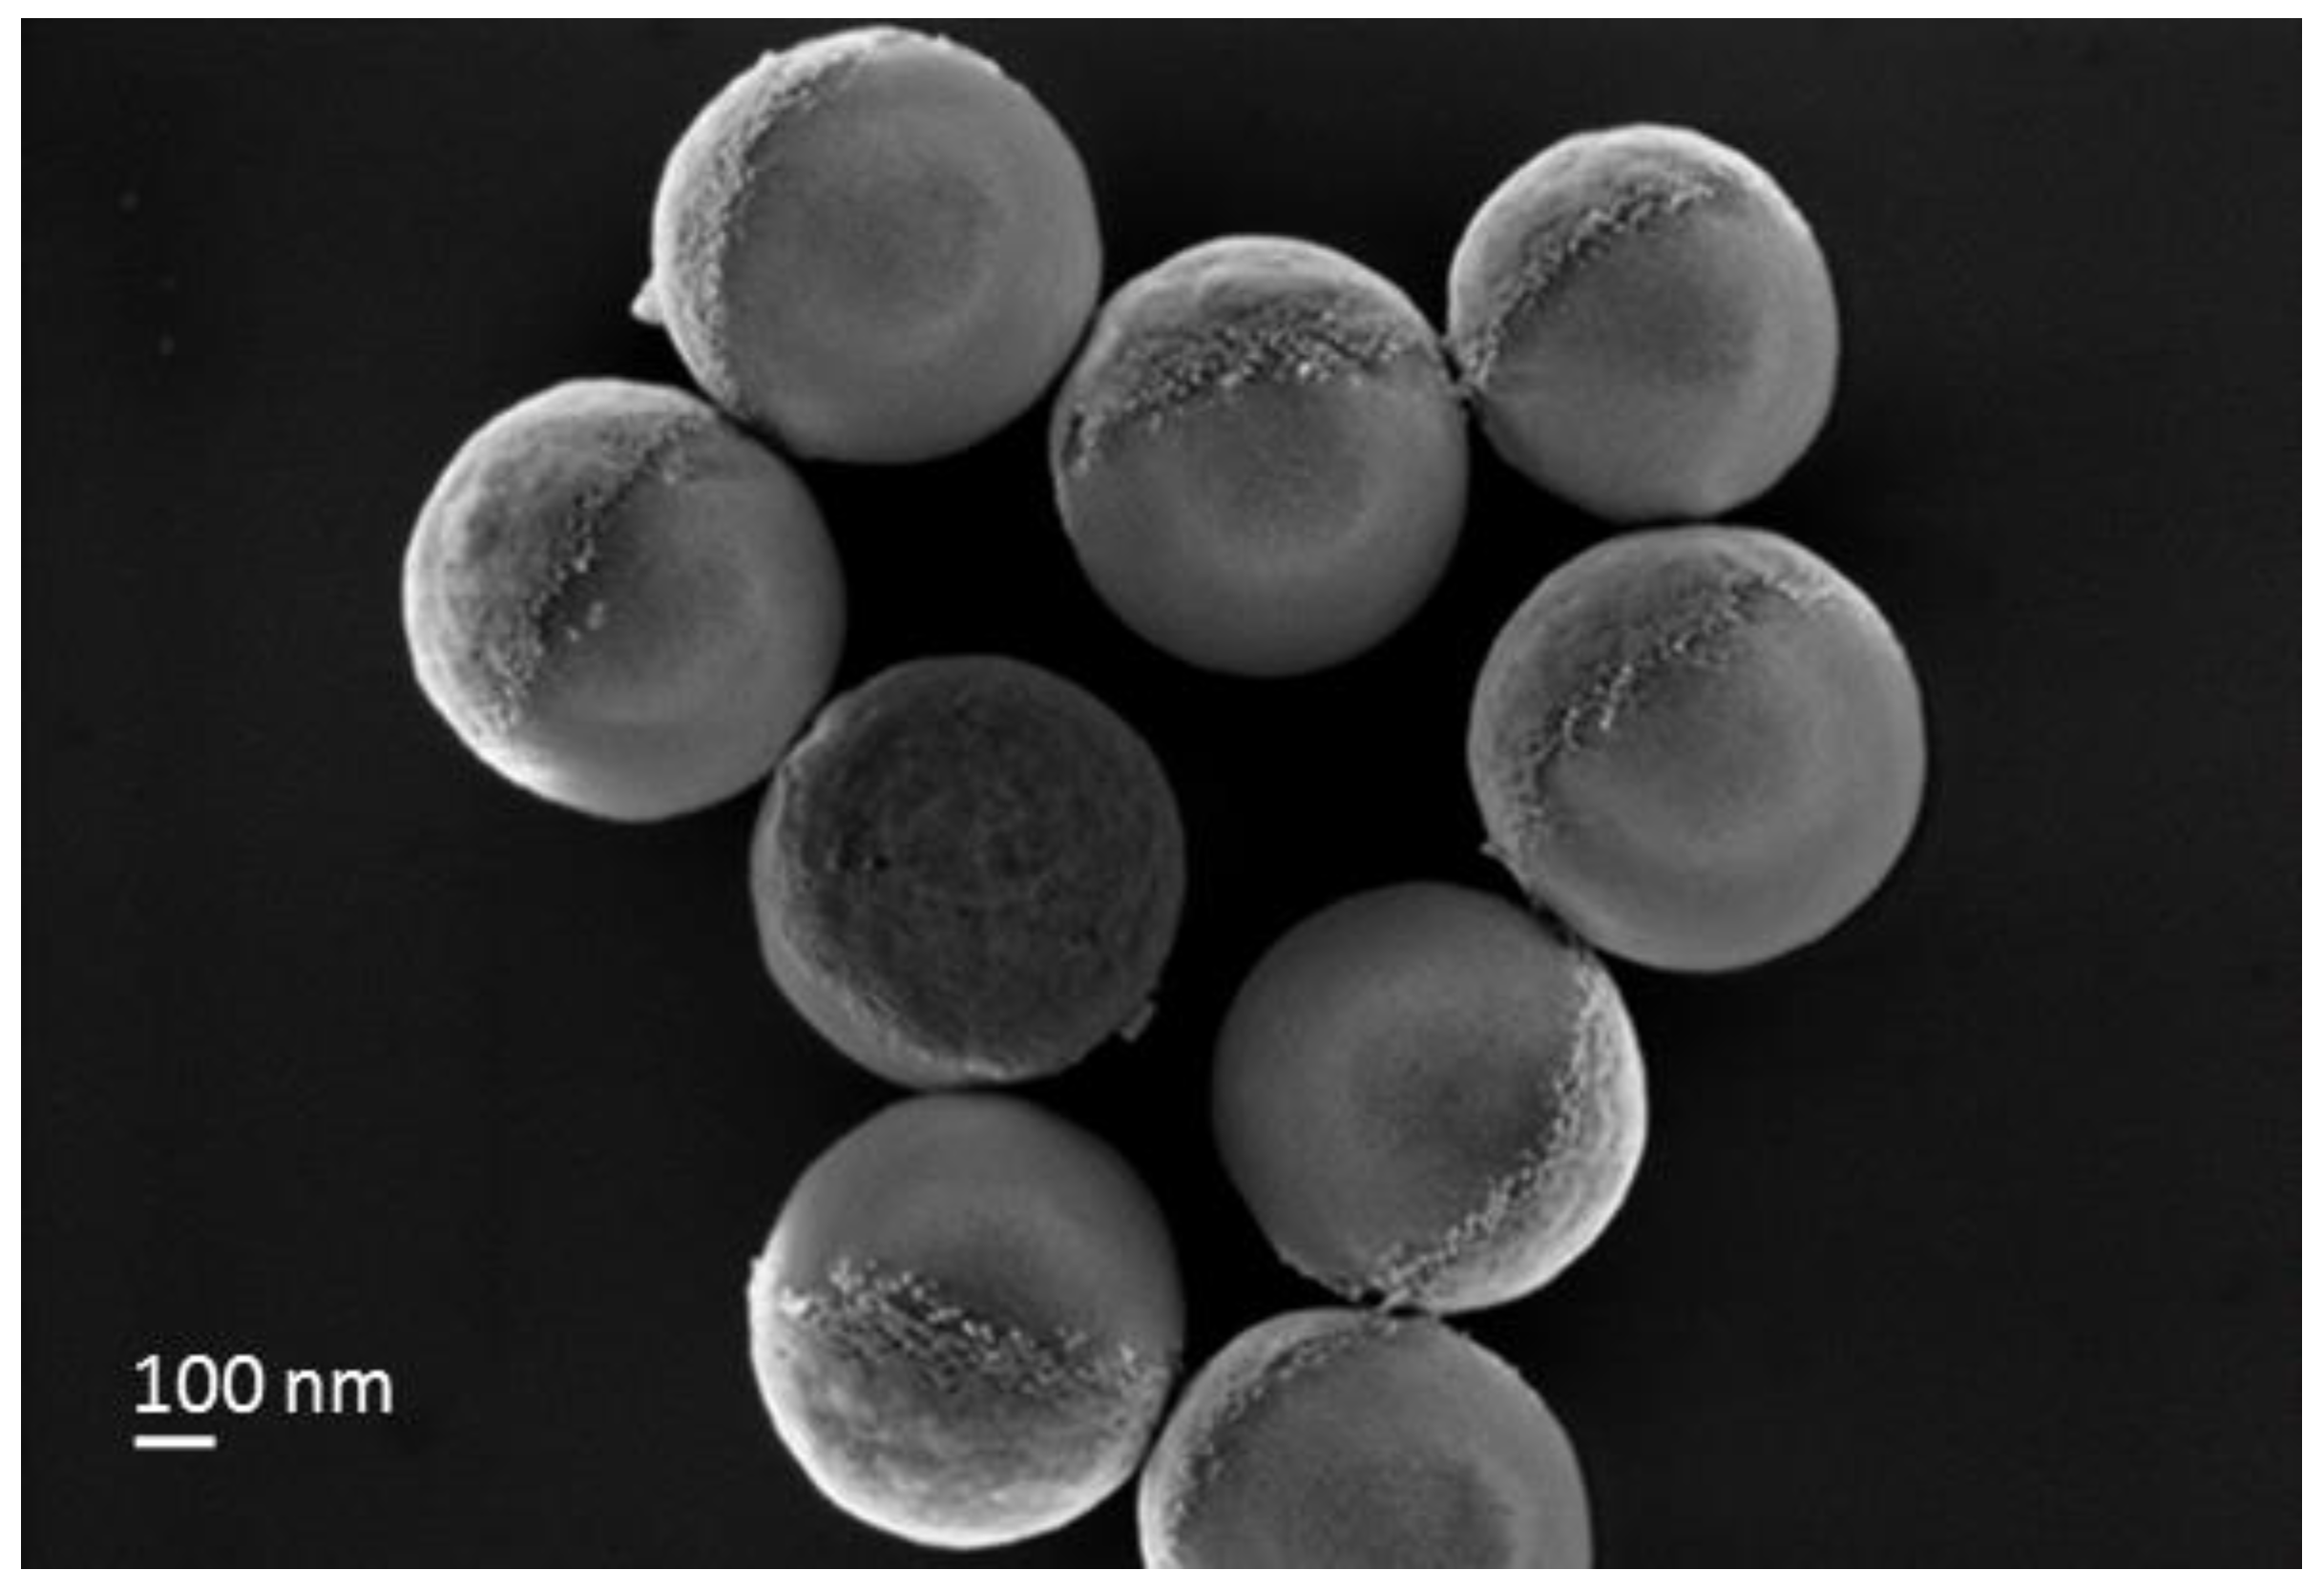

| Particles | AuNP/SiO2 NP | Au-Au center to center distance (dcc in nm) (-) |
| SiO2_AuNPS_iso (iso) | (*) 220 - 280 | ~ 35 to 40 nm |
| SiO2_AuNPS_Janus (JP_AuNP) | (+) 110 - 150 | ~ 35 to 40 nm |
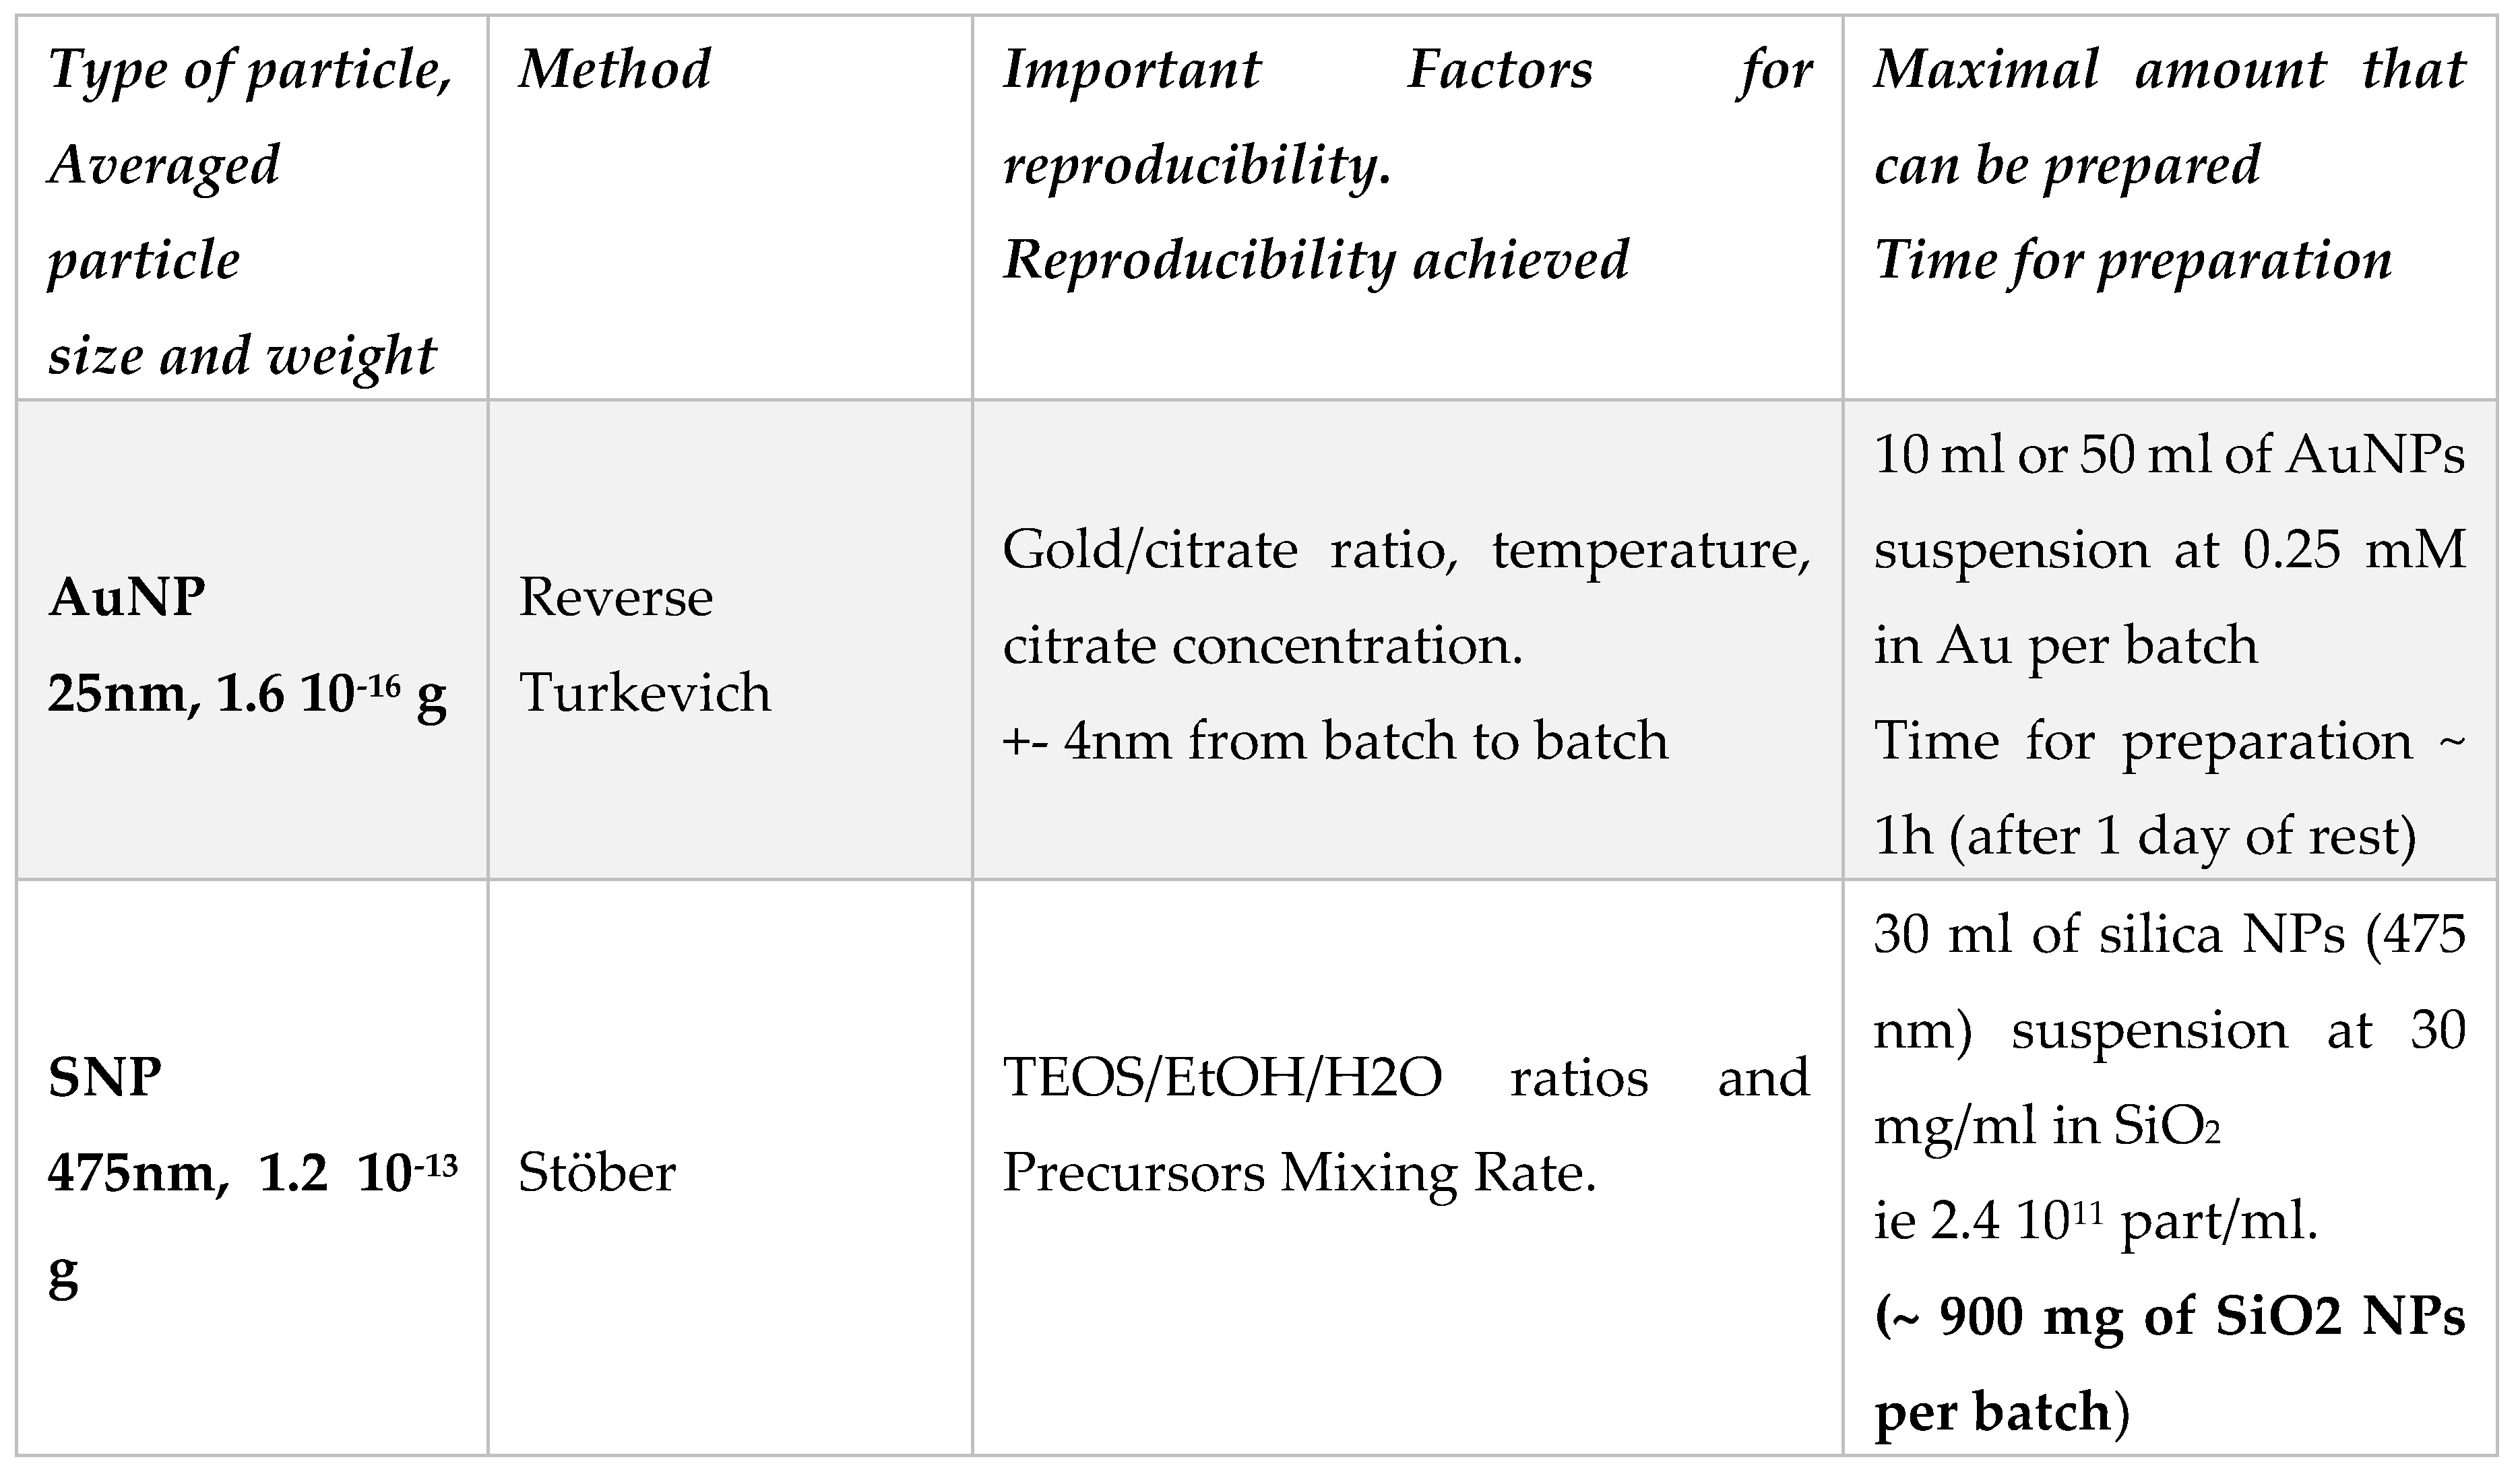 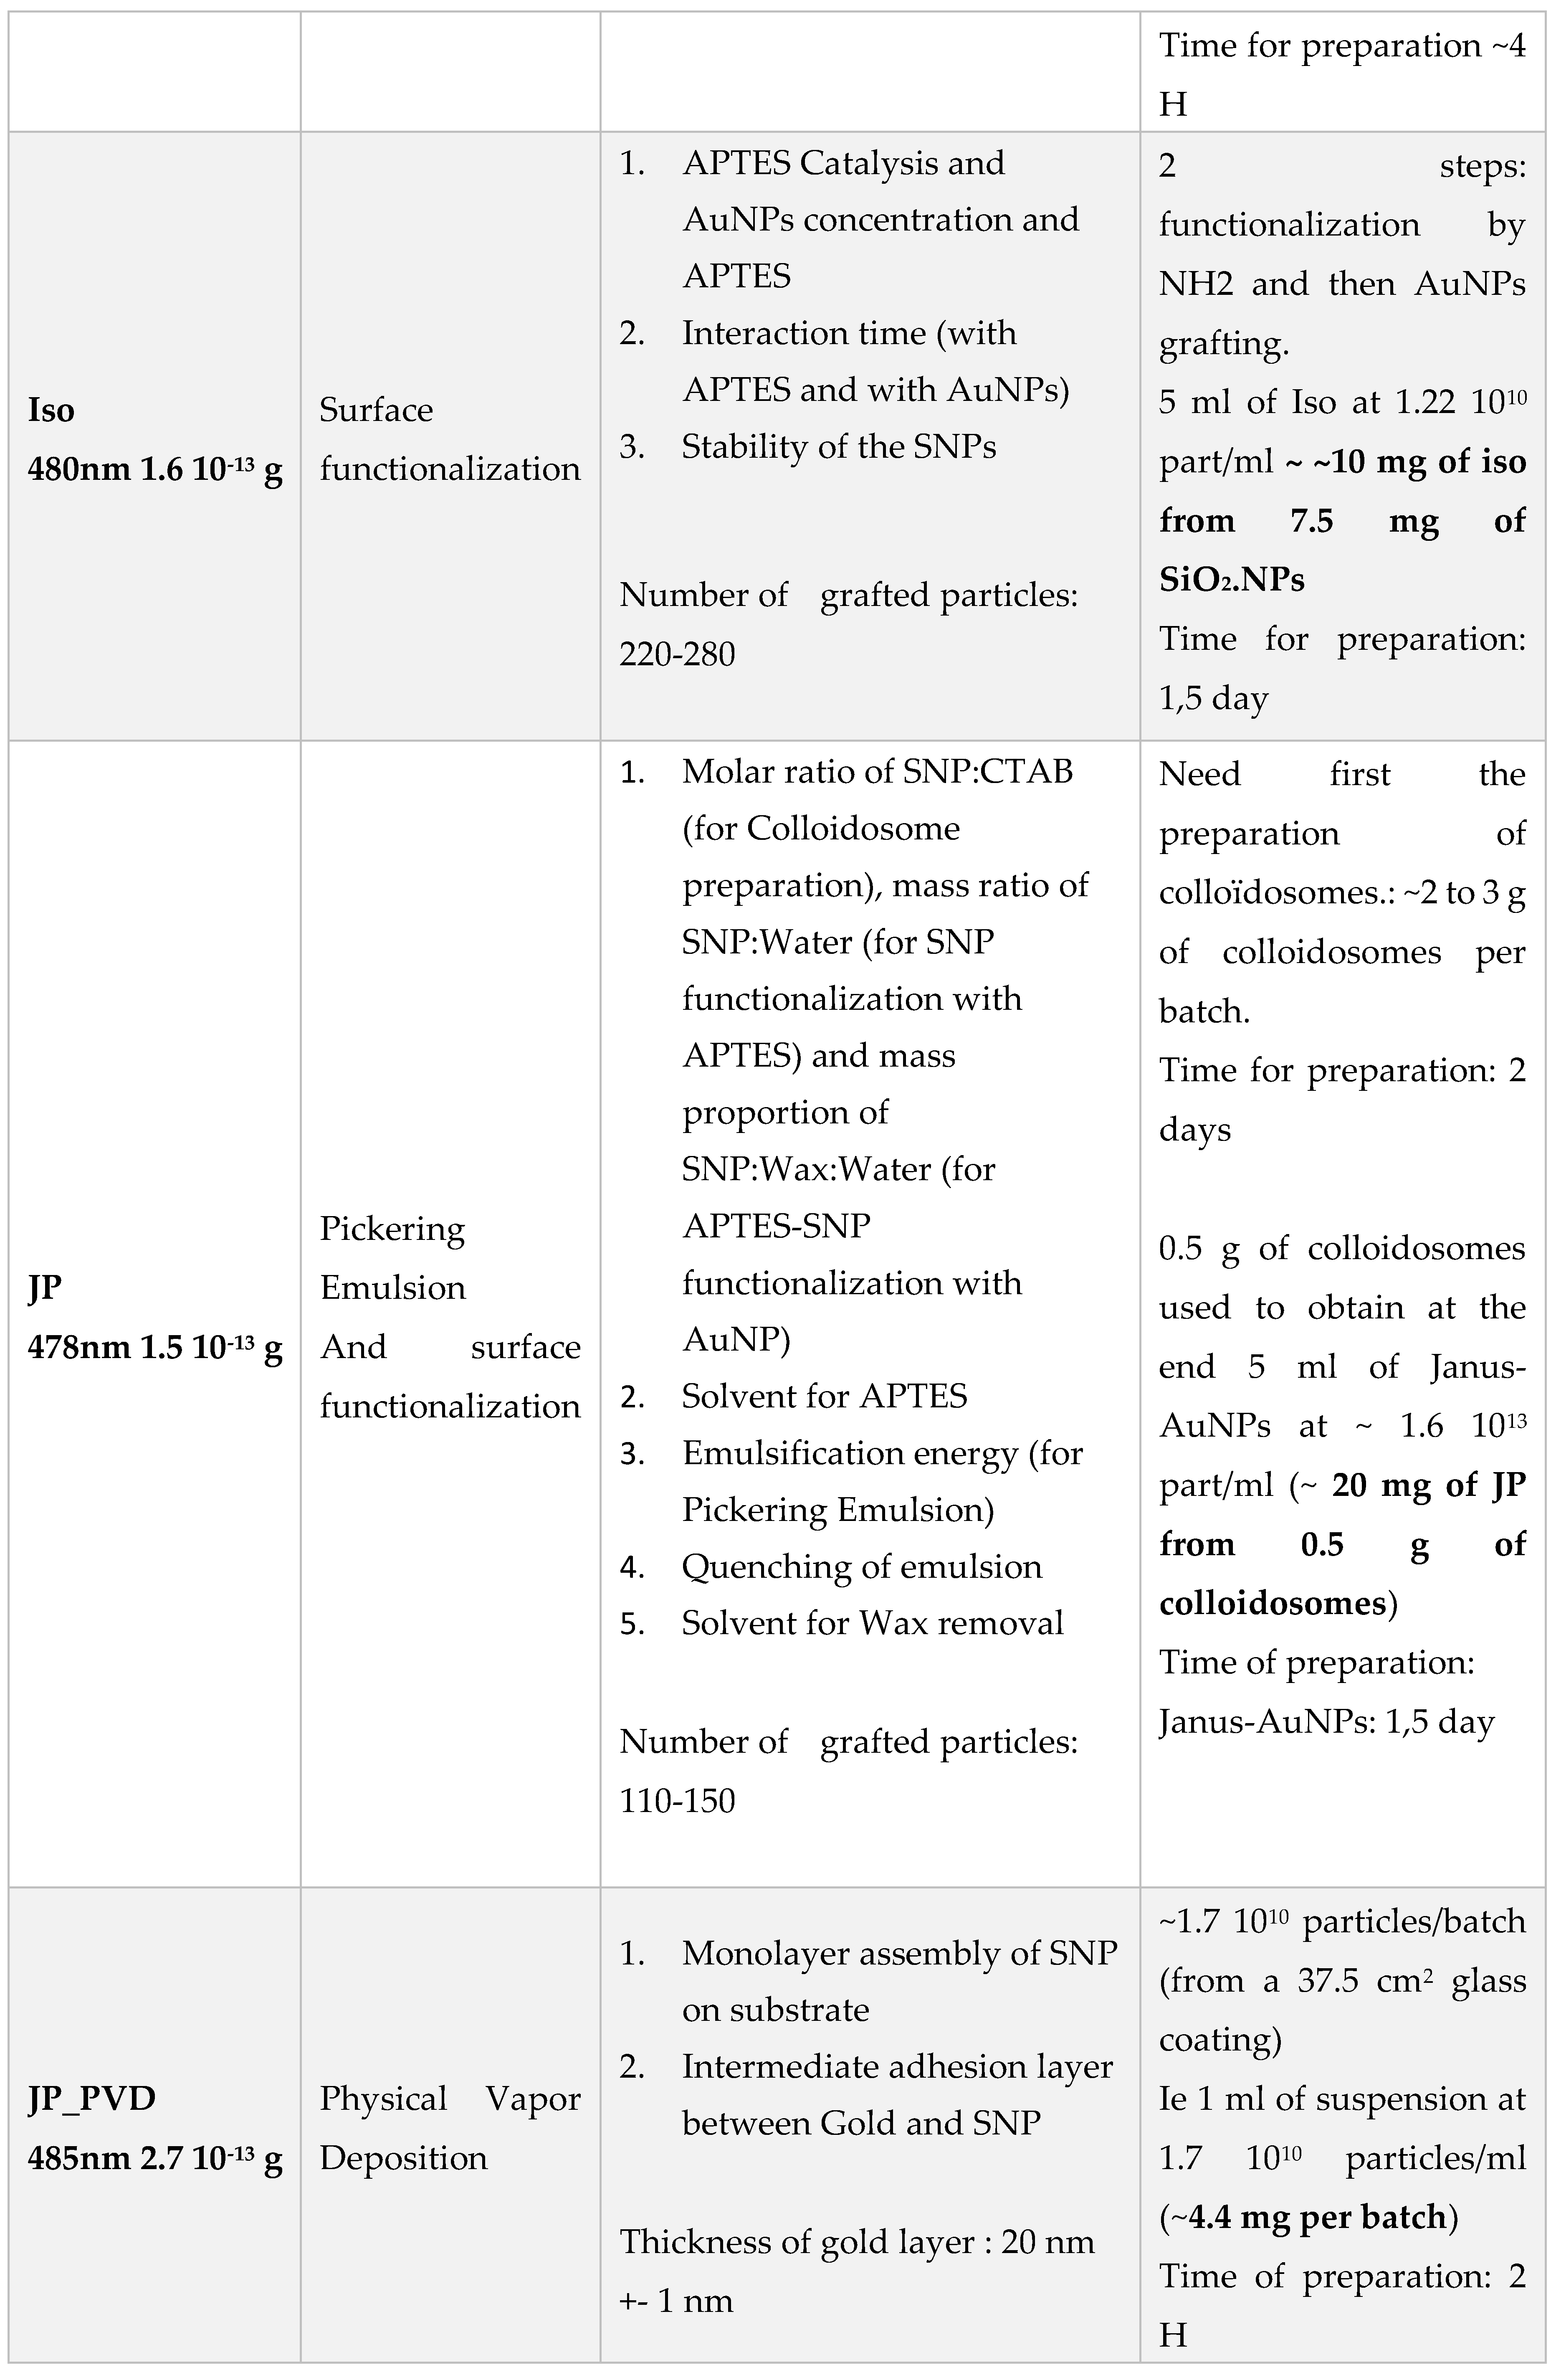
|
 |
 |
Disclaimer/Publisher’s Note: The statements, opinions and data contained in all publications are solely those of the individual author(s) and contributor(s) and not of MDPI and/or the editor(s). MDPI and/or the editor(s) disclaim responsibility for any injury to people or property resulting from any ideas, methods, instructions or products referred to in the content. |
© 2024 by the authors. Licensee MDPI, Basel, Switzerland. This article is an open access article distributed under the terms and conditions of the Creative Commons Attribution (CC BY) license (http://creativecommons.org/licenses/by/4.0/).


