Preprint
Article

ESG into Supply Chain Management in SMEs: Effect Factors and Implementation Path

Altmetrics

Downloads

162

Views

118

Comments

0

This version is not peer-reviewed

Submitted:

09 September 2024

Posted:

11 September 2024

You are already at the latest version

Alerts
Abstract
With the increased global attention to environmental protection, social responsibility and corporate governance (ESG) standards, integrating ESG into supply chain management (SCM) is becoming a strategic requirement for companies to achieve competitiveness and sustainable development. This study reviews the impact factors of ESG practices on supply chain competitiveness, and empirically examines the mechanism of ESG performance on supply chains through a questionnaire survey with a sample of Chinese SMEs. It was found that normative pressure, coercive pressure and imitative pressure in SMEs have a significant positive effect on cognition and attitude and perceived behavioral control; good corporate cognition and attitude, perceived behavioral control and corporate pressure also enhance the level of ESG practices. Further analysis shows that cognition and attitude and perceived behavioral control play a mediating role in the impact of ESG practices, and ESG performance promotes sustainable development of SMEs. The article puts forward the following suggestions: (1) close supply chain partnerships to enhance green innovation; (2) the government should give more resource support to ESG-invested enterprises and support the development of advantageous enterprises; (3) improve the corporate disclosure mechanism and strengthen the supervision; and (4) strengthen the training of professionals in supply chain ESG management.
Keywords: 
Subject: Business, Economics and Management  -   Business and Management

1. Introduction

1.1. Research Background

The world is currently facing challenges such as weak economic growth, serious environmental pollution and social problems. Solving these problems requires action at the national level, enhanced international cooperation, and the practice of environmental protection, social responsibility and corporate governance (ESG) by enterprises. Since the concept of ESG was proposed by the United Nations in 2004, it has rapidly gained widespread attention as it fits the needs of sustainable development and long-term value growth. According to UNPRI [1], the number of Principles for Responsible Investment (PRI) signatories and ESG funds have been growing. China has also been actively promoting ESG practices in enterprises under the guidance of policies, and the attention of regulators and stakeholders has brought corporate ESG practices to a new level. Sustainable operations depend more and more on the integration of ESG principles into supply chain management. Issues like "greenwashing" and the absence of disclosure regulations must be addressed, and a thorough grasp of the drivers, obstacles, and approaches for incorporating ESG into China's supply chains must be gained.

1.2. Research Questions and Objectives

Three key concerns are addressed in this study as it examines how Chinese businesses use ESG concepts into their supply chain management (SCM) procedures:
(1) Adoption Motivations: What pushes Chinese companies to integrate ESG principles into their suppliers?
(2) Difficulties Faced: What obstacles stand in the way of these companies' successful ESG integration?
(3) Support Strategies: What approaches can Chinese Small and Medium-sized Enterprises (SMEs) use to get past these obstacles?
The study aims to comprehend the factors that motivate the implementation of ESG practices in Chinese supply chains:
  • To determine and examine the obstacles to the incorporation of ESG;
  • To suggest workable methods for encouraging Chinese SMEs to embrace ESG;
  • The objective of this study is to offer guidance to scholars, industry executives, and legislators on how to encourage sustainable supply chain methods in China.

1.3. Research Gap

China's ESG development and business supply chain practices are still in their infancy, with significant study deficits:
First, the lack of standardised ESG disclosure guidelines has resulted in low-quality corporate disclosure.
Due to the lack of unified standards, the quality of ESG disclosure by Chinese companies is low in an environment of weak regulation. SMEs may find it difficult to initiate ESG business or integrate it into their daily operations, resulting in a low level of quantitative disclosure, inconsistent statistics, and unreliable information. Some enterprises consider ESG costly and do not recognise the value of ESG, leading to selective, unbalanced and inaccurate disclosure.
In terms of external regulation, ESG reporting in China is still at the voluntary disclosure stage, with no legislation to penalise the phenomenon of ‘greenwashing’ and low costs of non-compliance [2]. The standards of ESG reports issued by different organisations vary greatly, and companies tend to choose the most favourable standards, making it difficult to reflect corporate information truthfully and effectively. In order to establish a good image of environmental protection and social responsibility, gain the favour of green financial institutions and attract green investment, enterprises will take advantage of information asymmetry to ‘bleach’ their ESG reports and exaggerate or whitewash their environmental performance. Weak external constraints and strong subjective motives lead companies to "bleach green" ESG reports in an uncontrolled manner, and common methods include the use of ambiguous language, obscure terminology, unsupported or irrelevant statements, selective disclosure, and overly perfect promises and explanations [3].
Moreover, Micro, Small, and Medium Enterprises (MSMEs) are the backbone of global businesses, accounting for 90 per cent of the total number of enterprises and supporting more than half of the world's jobs. China's 52 million MSMEs face the challenge of integrating ESG to achieve sustainable transformation, including enhanced ESG disclosure, management and supply chain analysis. As competition intensifies, SMEs are turning to green innovation. SMEs must recognise that stakeholders such as shareholders, creditors and governments can provide resources for green innovation. Good ESG performance can enhance corporate image, increase shareholder confidence, reduce creditor risk, enhance investor preference, reduce government pressure, and satisfy employees and consumers, which in turn can lead to more innovation resources, increased Research and Development (R&D) investment, and higher ESG levels [4,5,6].
Existing studies have explored the relationship between digitisation and supply chain sustainability, but there is a lack of in-depth research on the enabling effects and mechanisms from the perspective of supply chain firm interactions. Given the importance of customer-supplier relationships in supply chain sustainability, it is crucial to study digitisation-enabled supply chain sustainability from the perspective of customer-supplier interactions.

2. Literature Review

2.1. Introduction

Supply chain sustainability is vital for long-term business success in a globalised economy. With the widespread adoption of ESG standards, integrating them into supply chain management is crucial for companies to improve competitiveness, reputation, and compliance. Focusing on ESG factors can enhance a company's risk resilience.
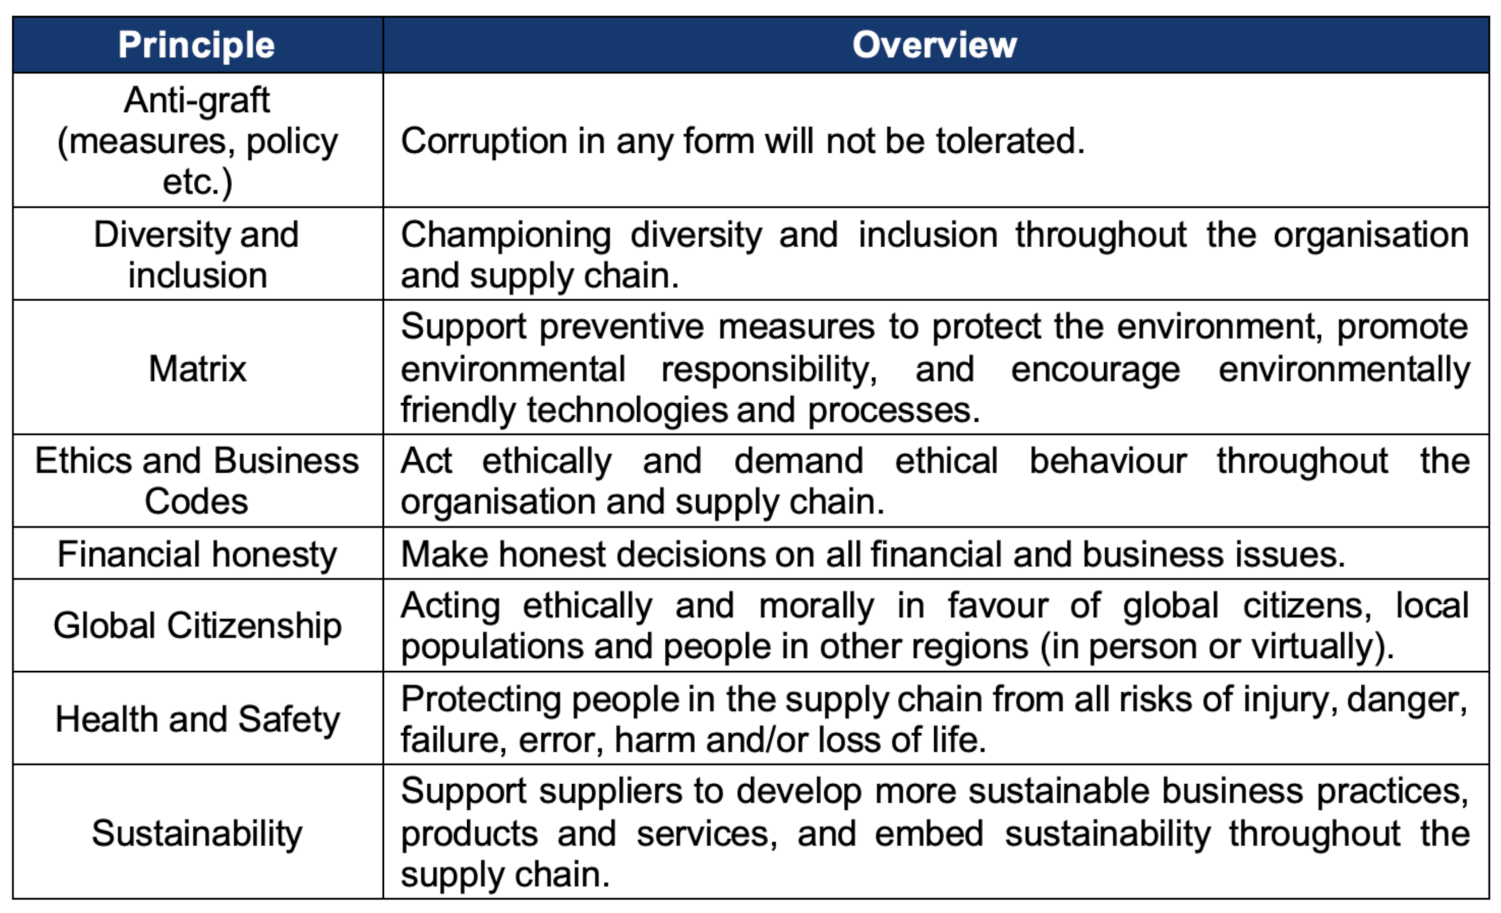
Sustainability ensures current needs met without harming future generations' economic, environmental, and social needs. Corporate Social Responsibility (CSR) involves supplier diversity, promoting local and SME suppliers. Other aspects include Occupational Health and Safety, Business Ethics, Organisational and Individual Responsibility, Information Protection, and Social Responsibility. International Supply Management Association (ISM) advocates supply management professionals contribute to sustainability and social responsibility, primarily to their own organisations and then to others in the supply chain.
Table 1. The institute for supply management's overview of ESG principles.
Preprints 117717 i001
* Source: International Supply Management Association(ISM).
In addition, due to the complex and far-reaching nature of supply chains, it is important to balance local and global issues when making decisions that affect sustainability and social responsibility.

2.2. ESG-Related Studies

In recent years, ESG has been a popular research topic in both the financial and corporate worlds, with a large body of literature focusing on ESG investment and corporate ESG. ESG investment is the practice of ESG concepts and consideration of ESG factors in investors' investment decisions and activities[7], and plays an important driving role in the ESG value chain. Corporate ESG is a constituent area of corporate sustainability strategy that defines and describes the non-financial outcomes that companies wish to achieve[8]. Current corporate ESG research involves corporate ESG disclosure, ESG measurement and ratings, and ESG forensics, key ESG issues, and ESG management, among which the antecedent influencers and impact effects of corporate ESG performance are the hotspots of corporate ESG research.
From the perspective of antecedent factors, a number of studies have focused on the impact of country-level, domestic-level and firm-level factors on corporate ESG performance [9]. ESG practices and performance of enterprises can be impacted at the national level by variations in the degree of economic growth, culture, institutional quality, and legal roots of various nations[10]. Political affiliation and social capital have been found to be significant domestic determinants impacting the ESG performance and conduct of corporations[11]. At the firm level, organisational resilience, firm digitisation, and mergers and acquisitions behaviours are among the operational and governance factors that have a major impact on firms' ESG performance [12]. The former factor focusses on the characteristics of the executive team and shareholding. Regarding the impact effect, a lot of research has looked at how a firm's ESG performance affects several aspects of its performance, such as its employment, financial, and firm value [13].
The early 1970s saw the beginning of research on the connection between corporate financial performance (CFP) and ESG norms. In their synthesis of the findings from over 2,000 previously published studies, Friede et al. [14]observed that most of the studies (almost 90%) revealed a favourable connection between ESG-CFP. These results imply that ESG disclosure raises information return, which enhances future performance projections and clarifies expectations regarding firms' inherent risks. As a result, information risk is reduced, lowering firms' cost of capital [15].
Disclosure can improve the effectiveness of monitoring, such as environmental performance assessment. In addition, it can lead firms to improve operational efficiency by reducing energy consumption, improving product quality or recruiting staff better [16]. The argument suggests that publishing a comprehensive report that integrates ESG and financial data can even increase the market valuation of a firm's combined ESG and corporate governance performance economically and statistically significantly at no additional cost [17]. Khan et al. [18] reported that any given industry of the vast majority of ESG data is irrelevant to the investment performance of U.S. equities. Furthermore, while some literature suggests that investors use ESG data for financial rather than ethical reasons [19], investors may be using ESG data for ethical rather than financial reasons. Although Edmans [20] and Dorfleitner et al. [21] cited that financial returns on ESG are positive in the case of long-term holdings of the respective shares, even if there are no additional returns, many investors consider social responsibility to be worthwhile.
There has been an ongoing debate about the relationship between ESG and CFP. Some scholars have attempted to explain the controversial results. For example, Drempetic et al. [22] found a significant positive correlation between firm size and ESG scores and argued that capital does not flow to firms with higher ESG scores but rather to larger firms. Another study conducted by Amel-Zadeh and Serafeim [19] showed that the importance of ESG information varies across countries , industry and even firm strategies differ systematically across firms, so the controversy may stem from differences in the samples. This observation inspires us to analyse the studies for heterogeneity.
H1: 
There is a significant positive effect of Enterprise Pressure on Cognition and attitudes.
H2: 
There is a significant positive effect of Enterprise Pressure on Perceived Behavioral Control.

2.3. Technological Innovation and Sustainable Supply Chains

Zhang et al. [23] found that open innovation has a positive effect on corporate ESG performance, and the higher the degree of innovation openness, the better the corporate ESG performance; the sub-dimensional test found that open innovation has the greatest effect on the promotion of environmental responsibility, followed by social responsibility, with corporate governance being the weakest; and compared with small and medium-sized enterprises, enterprises in regions with high degree of market openness, and non-state-owned enterprises, open innovation has a stronger effect on corporate ESG performance among large-sized enterprises, enterprises in regions with low degree of market openness, and state-owned enterprises. Ren and Isa [24] found that ESG performance is positively correlated with the innovation level of enterprises through unbalanced panel data analysis of A-share listed companies in Shanghai and Shenzhen, and the analysis of the mechanism of ESG influencing corporate innovation shows that good ESG performance can reduce the risk of corporate innovation by reducing financing constraints. The analysis of the mechanism of ESG influence on corporate innovation shows that good ESG performance can promote corporate innovation by reducing financing constraints and obtaining more government subsidies, and ESG performance improves competitiveness by promoting enterprises to increase R&D investment [25], and Zhang et al. [26] suggested that ESG performance is positively related to green technology innovation, and the better the ESG performance of enterprises, the more green technology innovation activities they carry out. The better the ESG performance of the enterprise, the more green technology innovation activities the enterprise carries out.
It can be seen that technological innovation has promoted the development of sustainable supply chain, and the concept of sustainable development has penetrated into the whole process of supply chain, expanding the traditional supply chain management objectives from a single economic dimension to the triple bottom line of economic efficiency, social responsibility and environmental protection from a strategic height, or emphasising the social and environmental dimensions of supply chain management.
From the perspective of the relationship between customer firms and supplier firms, existing research on sustainable supply chains consists of two main types: firstly, research on customer firms' selection preferences for supplier firms' sustainability performance when choosing new suppliers. It has been found that customer firms consider their environmental or green performance, environmental standards, etc. and prefer socially responsible suppliers when selecting suppliers [27]. The second category examines the impact of client firms on supplier sustainability. Early literature found that customer firms have a positive impact on supplier firms' sustainability, mainly through questionnaires. For example, Setyaningrum and Muafi [28] found through a survey study that customer firms encourage supplier firms to implement green supply chain management and improve environmental performance. Some recent studies using empirical methods have also found this relationship from the perspective of supply chain diffusion or spillover and supply chain synergy. For example, Tang et al. [29] found that the ESG performance of customer firms has spillover effects on the ESG performance of supplier firms.
H3: 
There is a significant positive effect of Cognition and attitudes on ESG Practice.
H4: 
There is a significant positive effect of Perceived Behavioral Control on ESG Practice.
H5: 
There is a significant positive effect of Enterprise Pressure on ESG Practice.

2.4. Digital Sustainable Supply Chains

The policy consensus and practical exploration of building digitally sustainable supply chains has triggered academic attention to the issue of digitisation contributing to supply chain sustainability, and there are two main categories of related research: the first is the impact of digitisation on the economic dimension of supply chain sustainability, which focuses on the changes brought about by the application of digital technologies to traditional supply chain activities and business processes, as well as on the new advantages generated by supply chain innovations [30]. This category focuses on the impact of digitisation on the commercial activities and economic consequences of supply chains [31] and does not address the impact of digitisation on the non-commercial activities and non-economic performance of supply chains, which is where most of the existing research falls. The second category, ‘The Impact of Digitisation on the Social and Environmental Aspects of Supply Chain Sustainability,’ examines how different digital technology applications have affected supply networks that are specifically characterised as sustainable [32]. This category focusses on the direct and indirect effects of digitalisation on non-commercial activities and supply chains' non-economic performance [33].
Regarding the relationship between digitisation and sustainable supply chains, existing research focuses on the impact of digitisation on sustainable supply chains, and the main ideas can be grouped into two categories: the first is that research has found that digitisation is a driver of sustainable supply chain practices. Xiao et al. [34](2024) indicated that digitisation of customer firms to promote ESG performance of supplier firms helps to enhance supply chain resilience. Digital technology applications can provide decision-making information support for sustainable supply chain practices and are a key driver towards sustainable supply chain integration, which is critical for sustainable supply chain implementation [35]. The second is that digitisation can directly or indirectly improve sustainable supply chain performance. In terms of direct impact effects, the adoption of digital technologies in supply chain management can positively affect environmental and social sustainability performance. The application of digital transformation, Industry 4.0 technologies has been found to significantly improve sustainable supply chain performance [36]. However, some scholars' studies have also found that digitalisation has no direct effect on sustainable supply chain performance [37]. In terms of indirect impact effects, the positive impacts of digitalisation on sustainable supply chain performance can be achieved by increasing efficiency, optimising operations, improving processes, enhancing agility, improving traceability and transparency, increasing accountability, and developing knowledge [38].
H6: 
Cognition and attitudes play a mediating role in the effect of SCM Cognition and attitudes on ESG Practice.
There are three gaps in current research on the impact of digitisation on sustainable supply chains: first, there is a lack of research on the interactions between supply chain firms. Unlike the sustainable development of a single enterprise, the sustainable development of a supply chain focuses on the sustainable performance of upstream and downstream enterprises, so achieving the sustainable development of a supply chain is highly dependent on the interactions between upstream and downstream enterprises, especially the impacts of customer enterprises on supplier enterprises, and the role of digitisation in building a sustainable supply chain is no exception. Existing studies have explored the impact of digitisation on sustainable supply chain performance from the perspective of customer firms, and have almost always implicitly placed the 'sustainable supply chain' as a whole in the context of the sustainability of customer firms. As a result, the metrics are all based on customer perspectives that fall under the so-called sustainable supply chain enterprise performance [39]. There is a lack of attention to the interaction between digitisation of the customer enterprise and the sustainability of upstream and downstream enterprises in the supply chain. Second, the ‘black box’ of the conditions and mechanisms by which digitalisation empowers supply chain sustainability has not yet been opened. While some studies have focused on the indirect effects of digitisation on supply chain sustainable performance and have begun to explore how digitisation can contribute to supply chain sustainability by increasing efficiency, optimising operations, improving processes, enhancing agility [38], and developing knowledge [37], these studies are are based on the perspective of customer firms and lack consideration of interactions between supply chain firms, as well as the interactions between customer firms and upstream and downstream supply chain firms. However, they are all based on the perspective of customer enterprises, lack of consideration of interactions between supply chain enterprises, and all imply the assumption of synchronous digitisation between customer enterprises and upstream and downstream supply chain, which actually turns into the role of digitisation of supply chain enterprises on their own sustainable development, rather than the role of empowerment of sustainable supply chain in the true sense, and the mechanism and conditions of digitisation of customer enterprises empowering upstream and downstream supply chain for sustainable development have not been effectively revealed. conditions have also not been effectively revealed. Third, there is a lack of large-sample empirical research. Current research on the impact of digitalisation on supply chain sustainability mainly adopts the qualitative method of case studies [32] and the empirical method of questionnaire surveys [39], which lacks large-sample empirical tests, while the latter can provide more accurate and reliable results.
H7: 
Perceived behavioural control mediates the effects of SCM cognition and attitudes on ESG practices.

2.5. ESG in Global Supply Chains

Since its introduction in a 2006 United Nations report, ESG has become the most widely accepted measure of corporate sustainability and governance. Similarly, supply chain operations have been impacted by ESG issues, with the majority of Fortune 250 companies in the United States setting various ESG targets through 2019. In addition, a publication of The European Parliament and the Council of the European Union [40] indicated that, from January 2024, large European companies must regularly disclose information on their social and environmental impacts, increasing transparency on ESG matters and combating 'greenwashing'. It applies to all large European companies, banks and insurance companies, with the exception of micro-listed companies. Tellier [41] noted that in 2021, Gartner introduced ESG-based inclusion criteria for the first time in the TOP SCM25, and in 2024, Gartner launched an assessment process that set a minimum S&P Global ESG score threshold for inclusion in the company list.
As the need for supply chain compliance has evolved, the standards for ESG due diligence have risen accordingly, with countries issuing important bills that address supply chain compliance for both domestic and extraterritorial companies. Legislation in this area can be analysed from three perspectives: (1) workers in the supply chain; (2) products in the supply chain; and (3) supplier behaviour. For workers in the supply chain, the main focus is on workers' rights and interests, such as the EU's Regulation on the Market for Products Prohibiting Forced Labour and the Law on Combating Forced and Child Labour in Supply Chains. For products in the supply chain, the focus is on the environmental impact throughout the life cycle, and representative laws include the EU Deforestation Regulation, the EU Batteries and Waste Batteries Act and the EU Carbon Boundary Adjustment Mechanism Act. In terms of supplier behaviour, whether suppliers comply with business ethics and whether there are violations is the focus, representative legislation includes the EU Proposal for a Corporate Sustainability Due Diligence Directive and the German Corporate Supply Chain Due Diligence Act. [40] China has also introduced some laws and regulations and recommended standards on supply chain, such as Supply Chain Risk Management Guidelines (GB/T 24420-2009), SCM (GB/T 26337), and Green Manufacturing - A Guide to Green Supply Chain Management for Manufacturing Enterprises (GB/T 33635-2017). Creating effective governance structures and legal systems that ensure the environmental, social and operational safety, transparency and accountability of global corporate supply chains is therefore key to development for governments worldwide.
In terms of modern ESG practices, modern ESG practices involved integrating sustainable development into core business strategies. This included setting clear sustainability goals, conducting life cycle assessments and adopting circular economy principles to reduce waste and resource consumption [42]. Consequently, firms were increasingly focusing on developing dynamic capabilities to adapt and innovate in response to environmental challenges to ensure long-term sustainability and competitiveness [43]. Murray et al. [42] proposed the implementation of green manufacturing processes and the adoption of circular economy principles to reduce waste and resource consumption, and they focussed on the application of environmental sustainability in supply chain management. The study also concluded that recycling, remanufacturing and the use of sustainable materials help to reduce waste and resource consumption and that this approach improves resource efficiency and minimises the ecological footprint of the supply chain. Initially, companies have gradually adopted ESG frameworks, driven by regulatory pressure and public awareness. Early adopters such as Unilever and Patagonia set the benchmark by incorporating comprehensive sustainability practices into their operations. It was evident that ESG standards play a pivotal role in attracting socially responsible investors, and companies with sound ESG practices tend to enjoy better financing conditions and enhanced market reputation [44].

2.6. Corporate ESG Practices

Investors are increasingly placing more weight on a company's CSR/ESG ratings due to the significant increase in socially conscious investors in CSR/ESG-oriented investment activities in recent decades. This has resulted in a sharp rise in demand for comprehensive CSR/ESG ratings and CSR/ESG performance scoring products from non-financial rating agencies.
The 2020 KPMG Sustainability Reporting Survey shows that 80 per cent of all large and medium-sized listed companies globally will have issued an ESG report by 2020, up from 12 per cent in 1993. ESG ratings play a key role in investors' assessment of company value and corporate sustainability [45]. However, due to differences in ESG measurement standards, the diversity of data collected by different Non-Financial Reporting (NFR) agencies, and the opacity and heterogeneity of NFR agencies' rating methodologies, it is unclear whether ESG ratings from different rating agencies accurately and unbiasedly capture firms' ESG efforts and risks [46]. In addition, policymakers around the world have expressed concerns that credit rating agencies may issue biased ratings for capital markets [47]. Significant variations exist between the environmental, social, and corporate governance ratings assigned to an identical company by distinct rating agencies [46].
Consider business procedures as an illustration. The well-known multinational corporation Apple has a strong track record in supply chain management. Apple used carbon offsets or renewable energy to reach zero emissions by 2020. More than 200 suppliers pledged to meet Apple's 2022 request for all of them to attain net zero emissions by 2030. The commitment letter has been signed by more than 200 vendors as of right now, including Foxconn, TSMC, and BYD.
In addition, IKEA has a sustainable procurement program. IKEA has a strict environmental policy that requires all wood used to come from sustainable forests certified by Forest Stewardship Council. By implementing this program, the company not only improves the environmental standards of its products, but also enhances customer trust.
Furthermore, Starbucks' supply chain sustainability program is also an example of how to use big data analysis and digital tools to optimize supply chain management, improve productivity, and track ESG performance in real time. This includes tracing the origin of raw materials through the use of blockchain technology and ensuring transparency and traceability of the supply chain. Starbucks guarantees ethical, social and environmental standards for coffee sourcing through the Coffee and Farmer Equity (C.A.F.E.) Practice Program. This strengthens the sustainability of the supply chain and enhances the company's reputation in the international market.

2.7. ESG Practices and Motivations for Chinese Companies in the Supply Chain

China's ESG standards are converging with international standards, and, ESG disclosure is progressing at a faster pace. The Corporate Sustainability Disclosure Guidelines 2024- Basic Guidelines issued by China's Ministry of National Finance further provides norms and guidance for corporate ESG disclosure. China worked closely with the European Union to launch the Common Classification Catalogue for Sustainable Finance, which will further promote China's corporate ESG to be globally aligned and facilitate international investors to participate in China's green bond market. As of 31 July 2023, a total of 347 of the 450 Chinese central state-owned enterprises (SOEs) that have been listed on the A-share market have disclosed their ESG social responsibility reports, a disclosure rate of 80.7%.
Chinese companies face challenges such as lack of unified ESG standards, the prevalence of greenwashing, and the need for enhanced ESG disclosure capabilities. However, motivations for adopting ESG practices include improving supply chain stability, gaining legitimacy, and accessing external resources.
According to this situation, Chinese companies are actively developing ESG practices and building a green logistics action system, focusing on key issues in three dimensions: environmental, social and governance, in order to achieve sustainable medium and long-term competitiveness. At the environmental level, logistics companies focus on indicators such as carbon emission reduction, park construction, waste disposal, and supply chain environmental costs to reduce negative environmental impacts. At the social level, ESG perspectives drive logistics companies to focus on employee safety, optimising supply chain operations, fulfilling social responsibilities and reducing negative incidents. At the corporate governance level, ESG pushes logistics companies to establish management systems, optimise compliance management, identify business risks, cultivate green talent, promote R&D and innovation, form sustainable long-term strategic goals, avoid short-term behaviours, and obtain better financing support.
Motivations for Chinese companies to adopt ESG in their supply chains include demand from international investors and national regulatory push. Supply chain relationship stability is an important factor in enhancing the level of resilience and security in industrial supply chains. Xin et al. [48] showed that corporate ESG performance significantly affects the stability of supply chain relationships, particularly enhancing the stability of customer relationships, but has a weaker effect on the stability of supplier relationships.
Secondly, based on the organisational legitimacy theory, firms can obtain legitimacy at the institutional level and strategic level by virtue of ESG investments, thus gaining access to more external resources. Hertzel et al. [49] argued that because of the cross-chain transmission of risk in the supply chain, firms will scrutinise the strategic decisions of their supply chain partners. When a firm fails to meet the social responsibility requirements of its supply chain partners, the supply chain partners are likely to terminate the co-operation. Aouadi and Marsat [50] argued that when a firm has a large ESG problem, negative ESG events will make the legitimacy of the firm as well as the supply chain seriously challenged. Zimmerman and Zeitz [51] cited that legitimacy is a resource that can help firms access resources. In practice, socially irresponsible behaviour of firms in the supply chain imposes significant costs on the entire supply chain. Social responsibility scandals of firms in the supply chain not only increase their own reputational risk, but also increase the reputational risk of other supply chain partners, thus creating a crisis of trust in the supply chain. Due to the interdependence of supply chain partners, there is a need for firms in the supply chain to work together on socially responsible activities [52], and relationship performance can only be obtained by maintaining the trust of supply chain partners and sustaining long-term and stable cooperation [53].
Thirdly, from the Resources-based view (RBV) theory, corporate ESG performance builds a positive information feedback system for upstream suppliers and downstream customers, i.e.; it increases the transparency of corporate ESG information; information transparency can bring about an improvement in the information governance effect, further enhancing the compliance of the system and the reliability of information disclosure [54]. In fact, in the process of enterprise production and operation, the information interaction of partners in the supply chain can promote the high-quality development of enterprises [55]. And enterprise ESG performance can convey signals to upstream suppliers and downstream customers about the enterprise's innovativeness and compliance in the production and operation process, reduce the information search cost of upstream suppliers and downstream customers [54], and alleviate the information asymmetry problem in the supply chain. Therefore, enterprise ESG performance builds an effective information communication channel for the main bodies in the supply chain, which is conducive to the identification of the real value of the enterprise by upstream suppliers and downstream customers, and enhances the degree of trust of upstream suppliers and downstream customers to the enterprise, which leads to more upstream suppliers and downstream customers being willing to carry out long-term and continuous cooperation with the enterprise, and forming a stable trading relationship. Especially when the company is geographically distant from its upstream suppliers and downstream customers, i.e.; when the company faces a high threshold of legitimacy, the advantage of the information conveyed by the company's ESG performance to its upstream suppliers and downstream customers will be more obvious. For capital providers, they can not only reduce default and reputational risks by integrating ESG information from firms, but also enhance their reputation by presenting their ESG stance to the outside world by incorporating ESG information into their lending policies [56]. This implies that better corporate ESG performance can help funders to be deeply involved in corporate governance activities, further curbing opportunistic behaviour, reducing agency problems and information asymmetry [54], and lowering operational and default risks [57]. Therefore, the better the ESG performance of an enterprise, the greater the possibility of financing given to the enterprise by the capital provider.
3. Methodology

3.1. Research Philosophy

This study adopts the philosophy of positivism, which emphasizes observing and measuring objective reality through empirical evidence. Positivism supports quantitative methods, which is consistent with the analytical approach of this study to analyze environmental, social and governance integration in supply chain management of Chinese companies. This philosophy ensures objectivity and repeatability, and improves the validity and reliability of the research results.
By using quantitative methods such as surveys and statistical analysis, this study aims to derive generalization results that are applicable to different environments and industries in China. This approach provides a solid foundation for understanding the reasons, difficulties, and strategies for implementing environmental, social, and corporate governance principles in supply chain management. It also helps to discover patterns and trends in ESG integration.
To determine the results of ESG integration relevant to China, this study adopts a quantitative approach. The purpose of this study is to discover patterns and trends and to establish a framework to understand the goals, difficulties and strategies of supply chain management. This study explores the reasons, difficulties and methods for Chinese companies to incorporate environmental, social and corporate governance concepts into supply chain management procedures.
This method will reveal the current situation and internal mechanism of Chinese companies adopting environmental, social and corporate governance concepts in supply chain management practices.

3.2. Research Approach

The purpose of this paper is to examine how Chinese enterprises practice ESG principles as part of the integration into their supply chain management. In particular, the research paper aims to investigate why and how firms incorporate ESG factors into their SCM strategies and perform better with respect to the sustainability impacts of supply chains. Quantitative approaches are more concrete as opposed to qualitative research that is subjective and, because of the larger sample size, better able to be broadly applied and repeated [58]. Quantitative research is one of the more comprehensive techniques for examining ESG-related topics on a large scale and exploring potential cause-and-effect links [59]. These include reliability and validity tests to assess the integrity of the data, correlation analysis to find out relationships among variables, regression analysis for understanding causal effects, structural equation modeling (SEM) when trying institutional significant complex interactions that cannot be directly observed, and mediation effect tests for cognitive or attitude factors. Using this comprehensive approach will not only reveal the current state of ESG integration, but also provide insight into the underlying mechanisms that drive the adoption of ESG in supply chain management practices in China.

3.3. Research Design

3.3.1. Causal Design: A Survey Experiment

Using survey experiments, this study will establish causal relationships between ESG principles and supply chain management practices. Observing the direct impact of independent variables on dependent variables, such as ESG practices, is easier when independent variables, like normative pressures, are controlled. It clarifies whether a causal relationship exists between independent and dependent variables, as well as how strong it is. This will help in better comprehension of these variables and why they are so critical to the business. This survey experiment format randomly assigns participants to conditions, meaning that any effect observed can be assumed causal (i.e.; due only to experimental manipulation). In the same vein, this will increase the internal validity as it is a way to introduce ESG within SCM [60].

3.3.2. Post-Test Only Design

Post-test-only designs are used because pre-testing can sensitize participants to the topic and bias their responses [61]. Explicitly, this design presents subjects with ESG-related stimulus without pre-experiment analysis. As a result, such an approach to surveys eliminates the influence that pre-existing knowledge or attitudes might have on participants' responses due to diminished subjective biases. This avoids the problems of treating measurements subject to unavoidable errors as data and allows causal inference from an experimental study. Post-test designs are purposeful in this study because their emphasis is on the immediate and real effect of ESG principles on SCM. By side-stepping pre-measurement, the study increases the internal validity and reliability of its findings in a laboratory environment. Such a design can be used to examine SCM participants' attitudes, perceptions, and behaviors efficiently.

3.4. Selection of Stimuli

3.4.1. Stimuli Description - Negative Product Placement Scene

Negative embedded advertising scenarios illustrate an explicit situational premise [62,63]. Against this backdrop, the authors of this paper show a dark case in which negative stealth advertising practices degraded nature and forced workers to work under harsh conditions. It is designed to be clear and direct so that subjects understand the consequences of not following ESG principles, with strong visuals and concise examples portraying how this could be viewed in real life. It is included because it produces the most impactful emotional and cognitive response from participants, demonstrating failed ESG practices. The stimulus highlights the need to integrate ESG practices in supply chain management. Negative embedded advertising is therefore executed with careful relevance, intent, and realism in the design itself to ensure that participants can understand its message and reflect it in their internal evaluation of their attitudes towards ESG adoption practices.

3.4.2. Stimuli Description - Positive Product Placement Scene

In this positive embedded advertising scenario, the company has seamlessly incorporated ESG values with its supply chain to ensure things like environmental sustainability or fair labor practices are adhered to. This use case is handpicked as it effectively illustrates the advantages of implementing ESG principles. Through happy pictures and stories of triumphs, the plot strives to remind us that ESG practices bring about loads of good. This trigger is selected as it can easily evidence the material benefits derived from ESG integration such as stronger brand recognition, greater consumer appeal or superior operational performance. The positive product placement allows an appealing and informative design that the participants can easily identify with to recognize the benefits of ESG practices. This contrasting but compelling illustration is expected to challenge and simultaneously shape the thought processes, attitudes and behaviors of participants towards ESG integration in SCM.

3.5. Target Group and Selection of Participants

The population that this study mainly serves is the supply chain manager, ESG officer in various industries of China. This application will employ a stratified random sampling approach (across industries, sizes and geographies) to create a representative sample. In the present study, stratified sampling is employed to see that all pertinent subgroups should be adequately represented in terms of control on some variables. By incorporating various viewpoints and practices on ESG integration in supply chains, the findings of this research could be more generalizable. Results of a poll will be based on what I hope is a demographically diverse sample of 350 employees from across 150 companies (and not too non-gender/religious uniform). This makes the research more generalizable, and hence applicable to many Chinese business contexts so increasing its relevance.

3.6. Questionnaire Design

The article follows an integrated conceptual framework validated by means of a survey questionnaire that measures ESG practices in SCM based on attitudes, recall and intentions to purchase. The report provides insight into demographics, ESG knowledge and understanding, past SCM practices as well as the perceptions of the stimulus. Data are generally collected through Likert scale, multiple choice questions and open-ended items. Qualitative analysis will come from open-ended questions to gain a broader understanding of participant's perspectives and experiences, while attitude toward ESG practices scale is developed through Likert scales. The data collected with this design will provide rich and deep insights on relationships between ESG knowledge, attitude formation, SCM practice. To make it be more formalized and easier to collect information, the questionnaire was designed based on research question and hypotheses.

3.7. Pilot Test

The method of pilot study will be implemented on 20% sample so that the questionnaire can further refined. During part of this process, the initial survey data is collected and feedback about clarity, length, relevance are reported on [64]. According to the outcomes from petit-test, modifications in questionnaire will be made so as it can measure the conceptualized constructs and it offers reliable & valid results for actual study. A pilot test is essential to pick up any problems or ambiguities in the survey, which can then we refined later on for a more precise and reliable data collection.

3.8. Data Collection

The surveys of online polls will serve as the chief data base. Most businesses choose online surveys because they are efficient, cost-effective and geographically accessible. The survey will be conducted via a secure online platform, and participants will receive an invitation by email that contains the link or QR code to access it. The online format provides participants offering high convenience (and therefore response rates). Moreover, the data collection procedure keeps privacy and anonymity of participants at high levels which in turn encourages them to provide answers accurately. This way makes this study more convenient to carry out a comprehensive analysis.

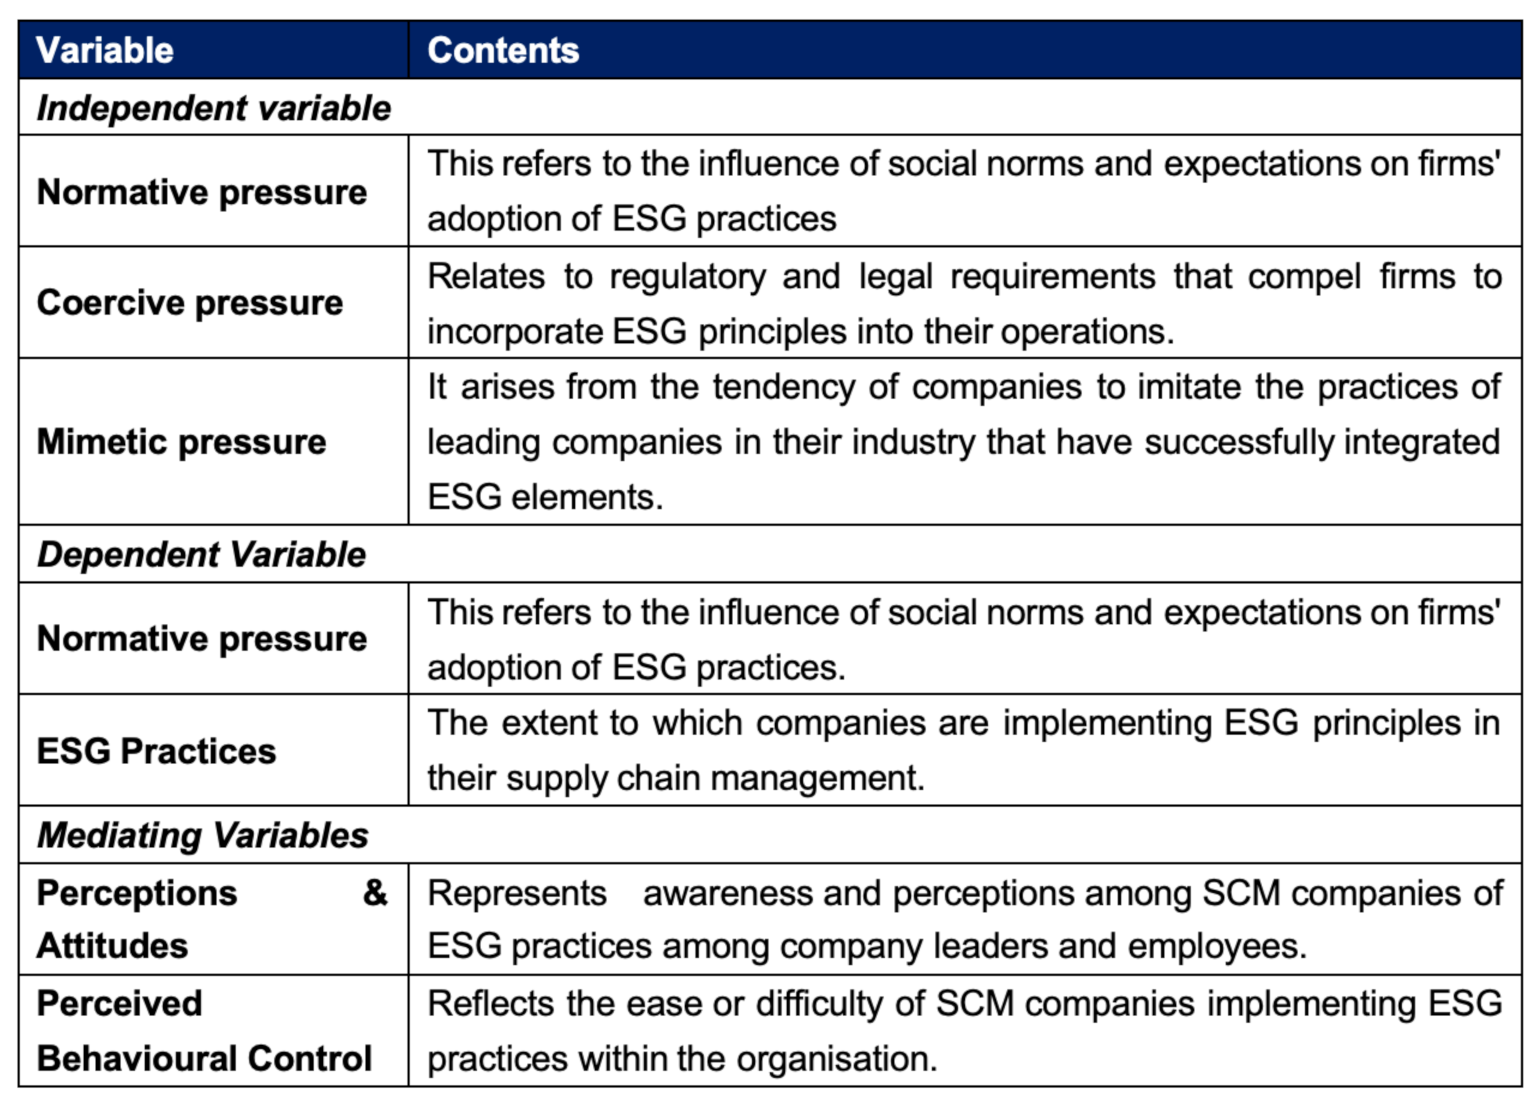
3.9. Variables

In order to comprehend how Chinese businesses integrate environmental, social, and corporate governance principles into their supply chain management procedures, this study looks into a number of important factors.
Analyzing the relationships between these variables through statistical techniques such as correlation analysis, regression analysis, and SEM allows studying direct and indirect effects as well as mediating effects, thereby gaining a comprehensive understanding of the factors influencing the adoption of ESG in supply chain management practices.
Table 2. Variables.
Table 2. Variables.
Preprints 117717 i002
*Source: by author collection.

3.10. Data Analysis Techniques

Statistical methods like t-test, analysis of variance (ANOVA), regression anlysis will be implemented to analyze the information collected. We used t-test to compare different groups, ANOVA for multiple group comparisons and regression analysis to explore the of cause-and-effect relationship between variables. This approach is conducted in analyzing SCM practices and ESG principles which can be used to understand the determinants of firm adoption or not adopting an ESG.The role of cognitive and attitudinal factors will be assessed using mediation effect tests and SEM. Data analysis will be comprehensive and detailed using these methods.

4. Findings And Discussion

4.1. Introduction

This study analyses the research findings on the motivations, challenges and coping strategies of Chinese companies in integrating ESG in their supply chains based on the data collected through a questionnaire survey. It includes response rate, data screening process, reliability and validity analysis, preliminary analysis, inferential analysis, and discussion of results. Three specific research questions are analysed: what motivates Chinese companies to adopt ESG in their supply chains, the ESG challenges that companies face, and the strategies that can effectively support Chinese SMEs to overcome these challenges. A total of 500 questionnaires were sent out to a sample of 321 Chinese manufacturing practitioners and managers, and the data collection achieved a response rate of 64.2 %, which is considered satisfactory and ensures the reliability and generalisability of the results. The study found that firms are driven by external pressures to adopt ESG, with the main firm type being manufacturing. The reliability and validity of the model was verified through factor analysis, which confirmed that factors such as policy pressure, imitation, and cognitive attitudes have a positive impact on ESG practices, and all the research hypotheses are valid. The study suggests the need to enhance corporate ESG understanding, develop incentive policies, and establish an ESG reporting framework to support SMEs in addressing challenges.

4.2. Descriptive Statistics

4.2.1. Sample descriptive statistics

The descriptive statistics of the collected data using SPSS26.0 data analysis software, which mainly involves the factors such as age, gender distribution, position, number of employees, and type of company, are shown in Table 3 below:
The descriptive analysis of the basic information (see Table 3.) shows that the 35-50 age group has the largest number of people in the sample, accounting for 38.006%, followed by the 20-35 and 50-65 age groups, which accounted for 29.595% and 28.349%, respectively, while those above 65 years old accounted for only 4.05%. In terms of position distribution, the most employees are at the basic level, accounting for 57.944%, while team leaders and managers account for 23.988% and 18.069% respectively. In terms of the number of employees, companies with 50-200 employees accounted for the highest share of 30.53%, while companies with less than 50 and more than 500 employees accounted for 22.43% and 23.676% respectively. Among the types of companies, the manufacturing sector accounted for the highest share of 28.037%, followed by services and retail with 27.414% and 24.611% respectively, and the IT or technology sector accounted for the lowest share of 19.938%.

4.2.2. Descriptive statistics and normality test for variables

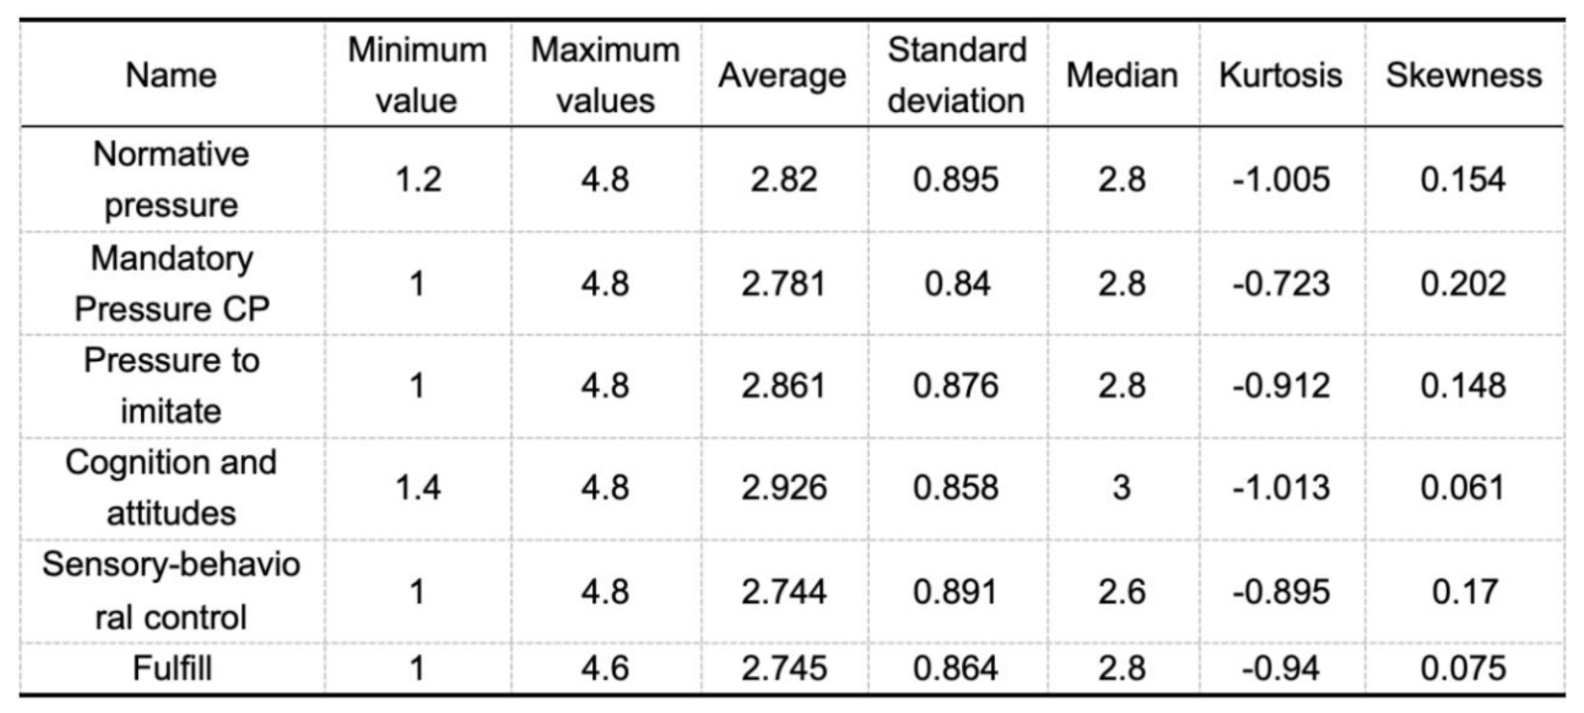
Descriptive statistics of a variable is a statistical method that summarizes and describes one or more variables. It provides information about the central tendency, degree of dispersion, shape of distribution and other relevant statistical indicators of the variable. This study includes the mean, standard deviation, median, kurtosis, skewness, and other indicators of the variables normative pressure, coercive pressure, imitative pressure, cognition and attitude, perceived behavioral control, and practice.
Table 4. Descriptive statistics of variables.
Preprints 117717 i003
From the above table, it can be seen that the mean values of the six variables are 2.82, 2.781, 2.861, 2.926, 2.744, and 2.745, which are in the lower middle range, and there are no outliers for each variable. The univariate normality test shows that the skewness of each variable is between [–2,2] and the kurtosis is within 7, so it can be considered that each variable is approximately normally distributed.

4.3. Reliability and Validity Tests

4.3.1. Reliability analysis

Cronbach's coefficient(Cronbach's alpha) is a commonly used internal consistency test to measure the correlation between a set of measurement items. It helps the researcher to determine the internal consistency of a set of measurement items, i.e.; these measurement items together measure the same concept. Specifically, the Cronbach coefficient is determined by calculating the correlation of each measurement item with the other measurement items. It takes values between 0 and 1, where 0 means that the measurement items are completely uncorrelated with each other and 1 means that the measurement items are completely correlated with each other. In general, a Cronbach's coefficient above 0.70 is considered acceptable, while above 0.90 is considered very good. If the coefficient is lower than 0.70, it may be necessary to redesign the measurement tool or remove some unreliable measurement items to improve the reliability and accuracy of the tool.
The data was imported into spss26 and reliability analysis was selected. Cronbach's alpha was calculated by dividing the data into a total of six dimensions: normative pressure, obligatory pressure, imitative pressure, cognition and attitude, perceived behavioral control and practice. The results of the specific tests are presented in the table below.
Table 5. Reliability checklist.
Name Encodings Number of projects Cronbach's alpha coefficient
Normative pressure NP1 5 0.869
NP2
NP3
NP4
NP5
Coercive pressure CP1 5 0.850
CP2
CP3
CP4
CP5
Pressure to imitate MP1 5 0.863
MP2
MP3
MP4
MP5
Cognition and attitudes CaT1 5 0.851
CaT2
CaT3
CaT4
CaT5
Sensory-behavioral control PB1 5 0.868
PB2
PB3
PB4
PB5
Fulfill PRAC1 5 0.853
PRAC2
PRAC3
PRAC4
PRAC5
Summary table NP1-PRAC5 30 0.895
*Source: by SPSS.
According to the Cronbach's Alpha results of the scale and each dimension, it was found that the Cronbach's Alpha values corresponding to each dimension of the scale ranged from 0.850 to 0.869, which were all greater than 0.8, and the reliability coefficient of the total scale was 0.895, which was greater than 0.8, which indicated that the internal consistency of the questionnaire was better, and so the results of the survey had an excellent level of reliability.
In summary, the data results of this paper passed the reliability test.

4.3.2. Exploratory factor analysis

Validity testing is a method of assessing the validity of a measurement tool. It focuses on whether the concepts measured by the measurement tool are realistic, i.e.; whether the measurement tool measures what it is intended to measure (see Table 6.).
In this paper, the significant coefficients of KMO value and Bartlett's spherical test are used to determine whether the variables are suitable for factor analysis. KMO measure and Bartlett's spherical test are statistical methods used to assess the suitability of the data for factor analysis.The KMO value ranges from 0 to 1, and the higher the value indicates that the data are more suitable for factor analysis, and usually more than 0.7 indicates that the data are suitable. Bartlett's Spherical Test tests whether the correlation between the variables is large enough, if the p-value is less than 0.05, it indicates that the correlation between the variables is large enough for factor analysis.
The use of factor analysis for information enrichment research, first analyze whether the research data is suitable for factor analysis, as can be seen from the above table: the KMO is 0.853, which is greater than 0.6 and meets the prerequisite requirements of factor analysis, meaning that the data can be used for factor analysis research. As well as the data passed the Bartlett sphericity test (p<0.05), which means that the research data is suitable for factor analysis.
The Table 7. analyzes the factor extraction situation and the amount of information extracted from the factors. From the above table, it can be seen that: the factor analysis extracted a total of 6 factors, the eigenroot values are all greater than 1. The variance explained rate of these 6 factors after rotation is 11.173%, 11.101%, 10.921%, 10.650%, 10.558%, 10.493%, and the cumulative variance explained rate of the rotated factor is 64.896%. explained was 64.896%.
Table 7. Explanation of variance.
No. Characteristic root Explanatory rate of variance before rotation Post-rotation variance explained
Characteristic root Variance explained % Cumulative % Characteristic root Variance explained % Cumulative % Characteristic root Variance explained % Cumulative %
1 7.49 24.968 24.968 7.49 24.968 24.968 3.352 11.173 11.173
2 2.932 9.772 34.74 2.932 9.772 34.74 3.33 11.101 22.274
3 2.713 9.043 43.783 2.713 9.043 43.783 3.276 10.921 33.195
4 2.423 8.078 51.861 2.423 8.078 51.861 3.195 10.65 43.845
5 2.09 6.967 58.828 2.09 6.967 58.828 3.167 10.558 54.403
6 1.82 6.067 64.896 1.82 6.067 64.896 3.148 10.493 64.896
7 0.758 2.527 67.422 - - - - - -
8 0.735 2.448 69.871 - - - - - -
9 0.683 2.275 72.146 - - - - - -
10 0.666 2.219 74.365 - - - - - -
11 0.648 2.16 76.525 - - - - - -
12 0.623 2.078 78.603 - - - - - -
13 0.578 1.928 80.531 - - - - - -
14 0.569 1.897 82.428 - - - - - -
15 0.546 1.821 84.249 - - - - - -
16 0.48 1.601 85.85 - - - - - -
17 0.473 1.576 87.426 - - - - - -
18 0.461 1.537 88.963 - - - - - -
19 0.444 1.48 90.443 - - - - - -
20 0.426 1.42 91.864 - - - - - -
21 0.396 1.32 93.184 - - - - - -
22 0.365 1.217 94.4 - - - - - -
23 0.319 1.062 95.462 - - - - - -
24 0.302 1.006 96.468 - - - - - -
25 0.23 0.768 97.236 - - - - - -
26 0.193 0.643 97.879 - - - - - -
27 0.174 0.579 98.458 - - - - - -
28 0.164 0.546 99.004 - - - - - -
29 0.152 0.508 99.513 - - - - - -
30 0.146 0.487 100 - - - - - -
*Source: by SPSS.
Table 8. Factor loading coefficients.
Name Factor loading factor Commonality (common factor variance)
Factor 1 Factor 2 Factor 3 Factor 4 Factor 5 Factor 6
NP2 0.737 0.574
NP3 0.783 0.663
NP4 0.726 0.56
NP5 0.763 0.632
CP1 0.879 0.825
CP2 0.786 0.668
CP3 0.719 0.568
CP4 0.696 0.569
CP5 0.738 0.58
MP1 0.889 0.839
MP2 0.765 0.631
MP3 0.716 0.56
MP4 0.775 0.637
MP5 0.745 0.597
CaT1 0.906 0.862
CaT2 0.719 0.566
CaT3 0.757 0.606
CaT4 0.736 0.582
CaT5 0.712 0.56
PB1 0.894 0.865
PB2 0.759 0.619
PB3 0.728 0.612
PB4 0.764 0.641
PB5 0.739 0.575
PRAC1 0.886 0.872
PRAC2 0.706 0.563
PRAC3 0.708 0.597
PRAC4 0.727 0.612
PRAC5 0.715 0.556
*Source: by SPSS.
The data of this study were rotated using the maximum variance rotation method (varimax) in order to find out the correspondence between the factors and the study items. The above table shows the information extraction of the factors for the study items and the correspondence between the factors and the study items. From the above table, it can be seen that: all the study items correspond to a common degree value higher than 0.4, which means that there is a strong correlation between the study items and the factors, and the factors can extract the information effectively.

4.3.3. Validation factor analysis

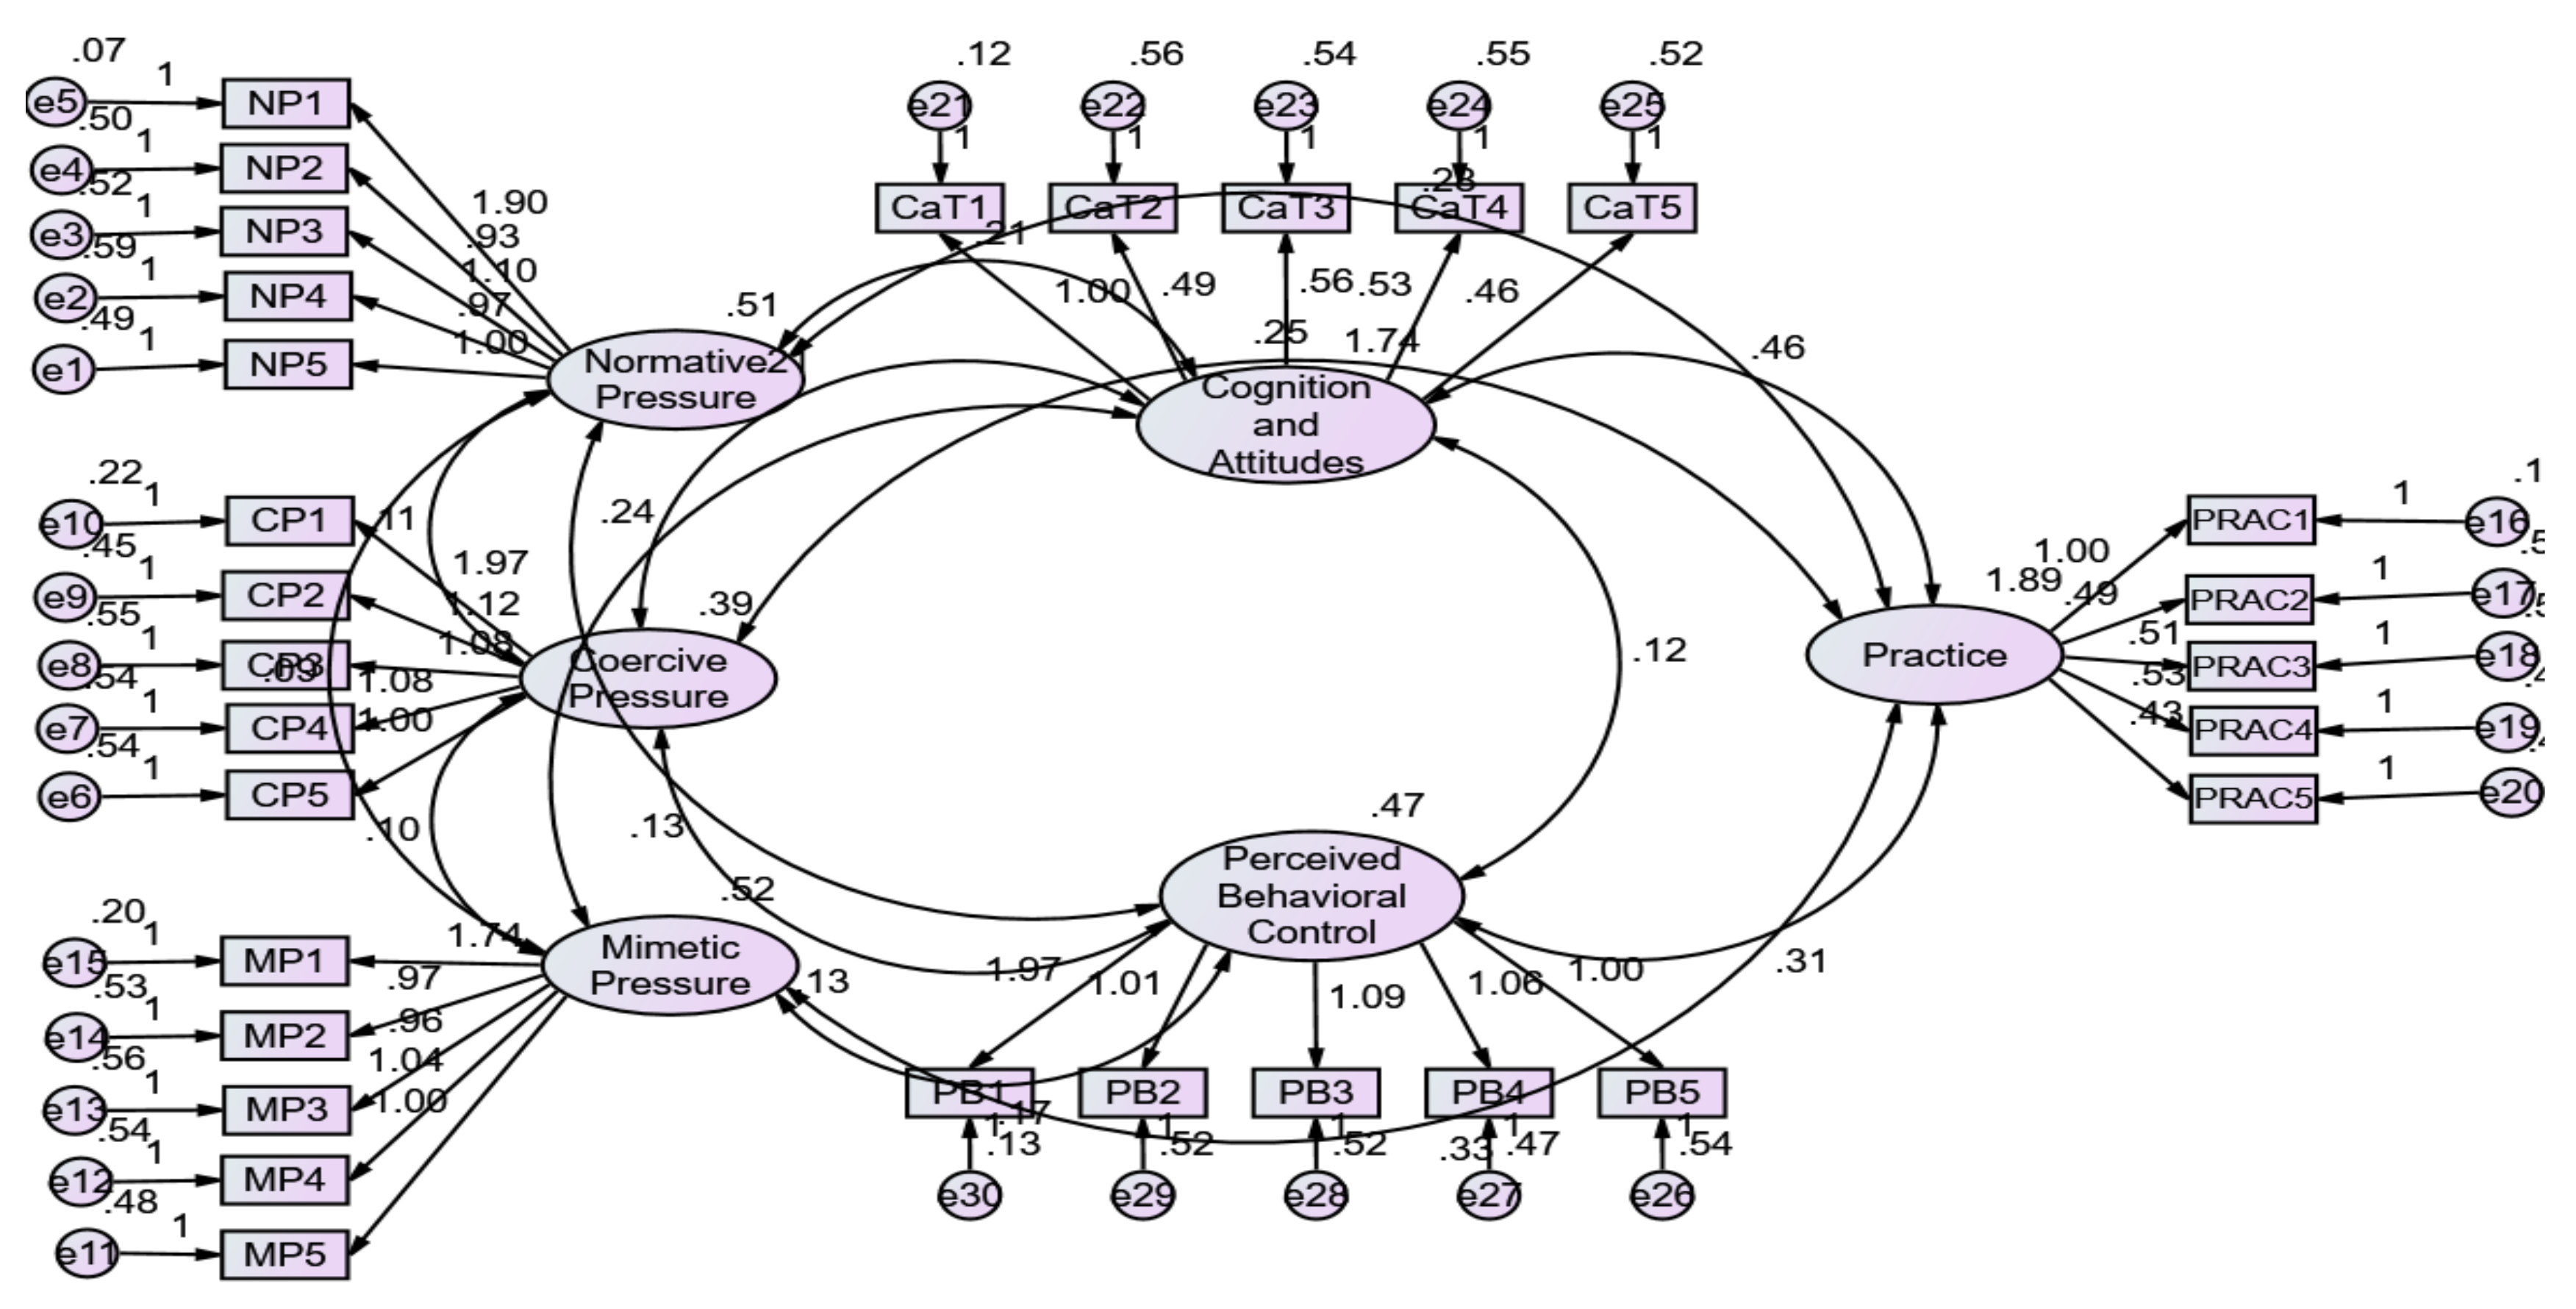
Confirmatory Factor Analysis (CFA) is used to test whether the factor structure that has been predetermined is consistent with the actual situation of data collection, which is very important to ensure that the theoretical assumptions of the model are compatible with the actual data. In this study, validation factor analysis was conducted by AMOS23 to examine the aggregation validity, discriminant validity, and structural validity of the research model, and the following are the specific test results.(see Figure 1)
(1) Construct Validity (CV) of a validated factor model refers to the degree to which a measurement instrument can accurately measure a theoretically defined concept or construct.
Table 9. Structural validity test.
Indicator category Indicator name Adaptation Standards Test results Acceptability
Absolute fitness parameter GFI >0.9 0.912 acceptance
AGFI >0.9 0.895 acceptable
RMSEA <0.06 0.027 acceptance
Value-added fitness parameters NFI >0.9 0.908 acceptance
IFI >0.9 0.981 acceptance
CFI >0.9 0.981 acceptance
RFI >0.9 0.897 acceptable
Simple fitness parameter CMIN/DF <3 1.236 acceptance
PGFI >0.5 0.765 acceptance
*Source: by SPSS.
From the above table, it can be seen that the fit validity of the model to the data (χ2/ df=1.236<3, RMSEA=0.027<0.08, CFI=0.981 NFI=0.908 IFI=0.981 are within the acceptable range, which indicates that normative stress, coercive stress, mimetic stress, ESG practices, cognitions and attitudes, perceived behavioral control represent the above six different constructs, and it also indicates that this study does not have serious common methodological bias and has good construct validity.
(2) To assess the measurement model, this paper tests the reliability and validity of all latent variables in the model. The reliability and consistency of the model were tested first. The CR value of the combined reliability is greater than 0.6 [65](Hair et al.; 2010), which indicates that the model has good consistency and reliability. Secondly, the validity of the model is judged by testing the convergent validity, usually using the Loading coefficient and AVE value to assess the convergent validity of the model, Loading represents the degree of explanation of the factors by each item, usually required to be greater than 0.5, and AVE is the ratio of the latent variables that can explain the variance of their items, and the general judgement index is >0.5 (Fornell & Larcker, 1981). Each Loading coefficient in the model is greater than 0.6, and the AVE value is greater than 0.5, which indicates that the research model has good convergence.
Table 10. Cluster validity test.
Latent variable Subject Standard load factor AVE CR
Normative pressure NP5 0.714 0.589 0.767
NP4 0.672
NP3 0.74
NP2 0.686
NP1 0.982
Coercive pressure CP5 0.651 0.546 0.739
CP4 0.679
CP3 0.674
CP2 0.721
CP1 0.934
Pressure to imitate MP5 0.719 0.570 0.755
MP4 0.713
MP3 0.677
MP2 0.695
MP1 0.941
ESG practices PRAC1 0.971 0.561 0.749
PRAC2 0.67
PRAC3 0.694
PRAC4 0.717
PRAC5 0.645
Cognition and attitudes CaT1 0.968 0.550 0.742
CaT2 0.658
CaT3 0.707
CaT4 0.684
CaT5 0.644
Sensory-behavioral control PB5 0.682 0.587 0.766
PB4 0.727
PB3 0.723
PB2 0.695
PB1 0.966
*Source: by SPSS.
Normative pressure, coercive pressure, imitative pressure, ESG practices, cognition and attitudes, and perceived behavioural control were included in the validated factor model, and the results showed that the standard factor loadings ranged between 0.644 and 0.982, which met the judgment threshold, and it can be assumed that the explanatory strength of each question item on the factor was good The AVE values were all greater than 0.6, and the CR>0.7, which indicated that the convergent validity was good.
(3) Distinguishing validity is used to measure the independence between different concepts or measures. The Fornell-Larcke method [66] was used in this study to evaluate the discriminant validity.
Table 11. Distinction validity test.
Normative pressure Coercive pressure Pressure to imitate ESG Practices Cognition and attitudes Sensory behavioral control
Normative pressure 0.767
Coercive pressure 0.240 0.739
Pressure to imitate 0.181 0.216 0.755
ESG Practices 0.284 0.289 0.336 0.749
Cognition and attitudes 0.219 0.257 0.253 0.254 0.742
Sensory behavioral control 0.255 0.305 0.335 0.333 0.132 0.766
*Source: by SPSS.
Distinguishing validity tests were conducted for normative stress, coercive stress, imitative stress, ESG practices, cognitions and attitudes, and perceived behavioral control. The AVE extracted square root of normative pressure was 0.767, which was greater than the correlation between the model and any other constructs, indicating that normative pressure had good discriminant validity; the AVE extracted square root of coercive pressure was 0.739, which was greater than the correlation between the model and any other constructs, indicating that coercive pressure had good discriminant validity; the AVE extracted square root of imitative pressure was 0.755, which was greater than the correlation between the model and any other constructs, indicating that imitative pressure had good discriminant validity. are greater than the correlation between the model and any other construct, indicating that imitative pressure has good discriminant validity; the AVE extracted square root of ESG practices is 0.749, which is greater than the correlation between the model and any other construct, indicating that ESG practices have good discriminant validity; and the AVE extracted square root of cognition and attitude is 0.742, which is greater than the correlation between the model and any other construct, indicating that The AVE extracted square root of 0.766 for Perceived Behavioral Control is greater than the correlation between the model and any other model, indicating that Perceived Behavioral Control has good discriminant validity.
In summary, the square root of AVE extraction for each construct was greater than the correlation between the model and any other construct, indicating that the model passed the discriminant validity test.

4.4. Correlation Analysis

Correlation analysis is used to determine the degree of association between two or more variables. It helps us understand how variables interact with each other and how they change in response to changes in other variables.
Correlation analysis typically uses the correlation coefficient to measure the relationship between variables. The most commonly used correlation coefficient is the Pearson correlation coefficient, which measures the linear correlation between two continuous variables. The Pearson correlation coefficient can take values from -1 to 1, where -1 indicates a perfect negative correlation, 1 indicates a perfect positive correlation, and 0 indicates no linear correlation. It helps us to understand how variables interact with each other and how they change in response to changes in other variables.
The Pearson's correlation analysis (see Table 12.) shows that there is a significant positive correlation between 'practice' and all the other variables. Specifically, the correlation coefficient of 'practice' with ‘normative pressure' is 0.300, with 'coercive pressure' is 0.292, with 'imitative pressure' is 0.320, with 'cognitive and physical pressure' is 0.320, and with 'cognitive and physical pressure' is 0.320. 'Imitative Pressure' with a correlation coefficient of 0.320, 'Cognition and Attitude' with a correlation coefficient of 0.339, and 'Perceived Behavioral Control' with a correlation coefficient of 0.342. 0.342, all of which are significant at the p<0.001 level. This suggests that normative pressure, coercive pressure, imitative pressure, cognition and attitude, and perceived behavioral control are all positively associated with practice, with perceived behavioral control having the highest correlation, suggesting that these factors can work together to some extent to influence the implementation and effectiveness of practice.

4.5. Regression Analysis

The results of the correlation analysis above showed that there is some degree of correlation between the above variables. However, it does not indicate the causal relationship. In order to study the causal relationship between them in more depth regression analysis is introduced and is used to study the relationship between the independent and dependent variables. It aims to develop a mathematical model that predicts or explains changes in the dependent variable by using known values of the independent variable. Stratified regression is used to study the model changes brought about by an increase in the independent variable (X) and is usually used in model stability tests, mediation or moderation studies. As can be seen from the table above, there are 2 models involved in this stratified regression analysis. The independent variables in model 1 are normative pressure, coercive pressure, and imitative pressure, while model 2 adds cognitive and attitudinal, and perceptual-behavioral control to model 1, and the dependent variable of the model is: practice.
As can be seen from Table 13.; a linear regression analysis was conducted using normative pressure,coercive pressure,imitative pressure as the independent variable and practice as the dependent variable, as can be seen from the table above, the model has an R-squared value of 0.194, which implies that normative pressure,coercive pressure,imitative pressure explains 19.4% of the reasons for the change in practice. The F-test of the model found that the model passes the F-test (F=25.360, p<0.05), which means that at least one of normative, coercive, and mimetic pressures will have an impact on the relationship of practice, as well as the formula of the model is: practice = 0.968 + 0.195*normative pressures + 0.196*coercive pressures + 0.238*mimetic pressures.
The regression coefficient value of normative pressure is 0.195 and presents significance (t=3.819, p=0.000<0.01), implying that normative pressure will have a significant positive impact relationship on practice. The regression coefficient value of coercive pressure is 0.196 and shows significance (t=3.609, p=0.000<0.01), implying that coercive pressure will have a significant positive influence relationship on practice. The value of regression coefficient of imitative pressure is 0.238 and shows significance (t=4.638, p=0.000<0.01), implying that imitative pressure will have a significant positive influence relationship on practice.
Summarizing the analysis, we can see that normative pressure, coercive pressure, and imitative pressure all have a significant positive impact on practice.
For Model 2: Its change in F-value after the addition of cognition and attitude, perceived behavioral control to Model 1 shows significance (p<0.05), implying that the addition of cognition and attitude, perceived behavioral control has explanatory significance to the model. In addition, the R-squared value increased from 0.194 to 0.266, implying that Cognition and Attitude, Perceived Behavioral Control could have an explanatory strength of 7.2% for the practice. Specifically, the regression coefficient value of cognition and attitude is 0.223 and shows significance (t=4.314, p=0.000<0.01), implying that cognition and attitude can have a significant positive influence relationship on practice.
The value of regression coefficient of perceived behavioral control is 0.192 and shows significance (t=3.700, p=0.000<0.01), which implies that perceived behavioral control will have a significant positive influence relationship on practice.

4.6. Structural Equation Modeling

4.6.1. Model fit and path coefficients

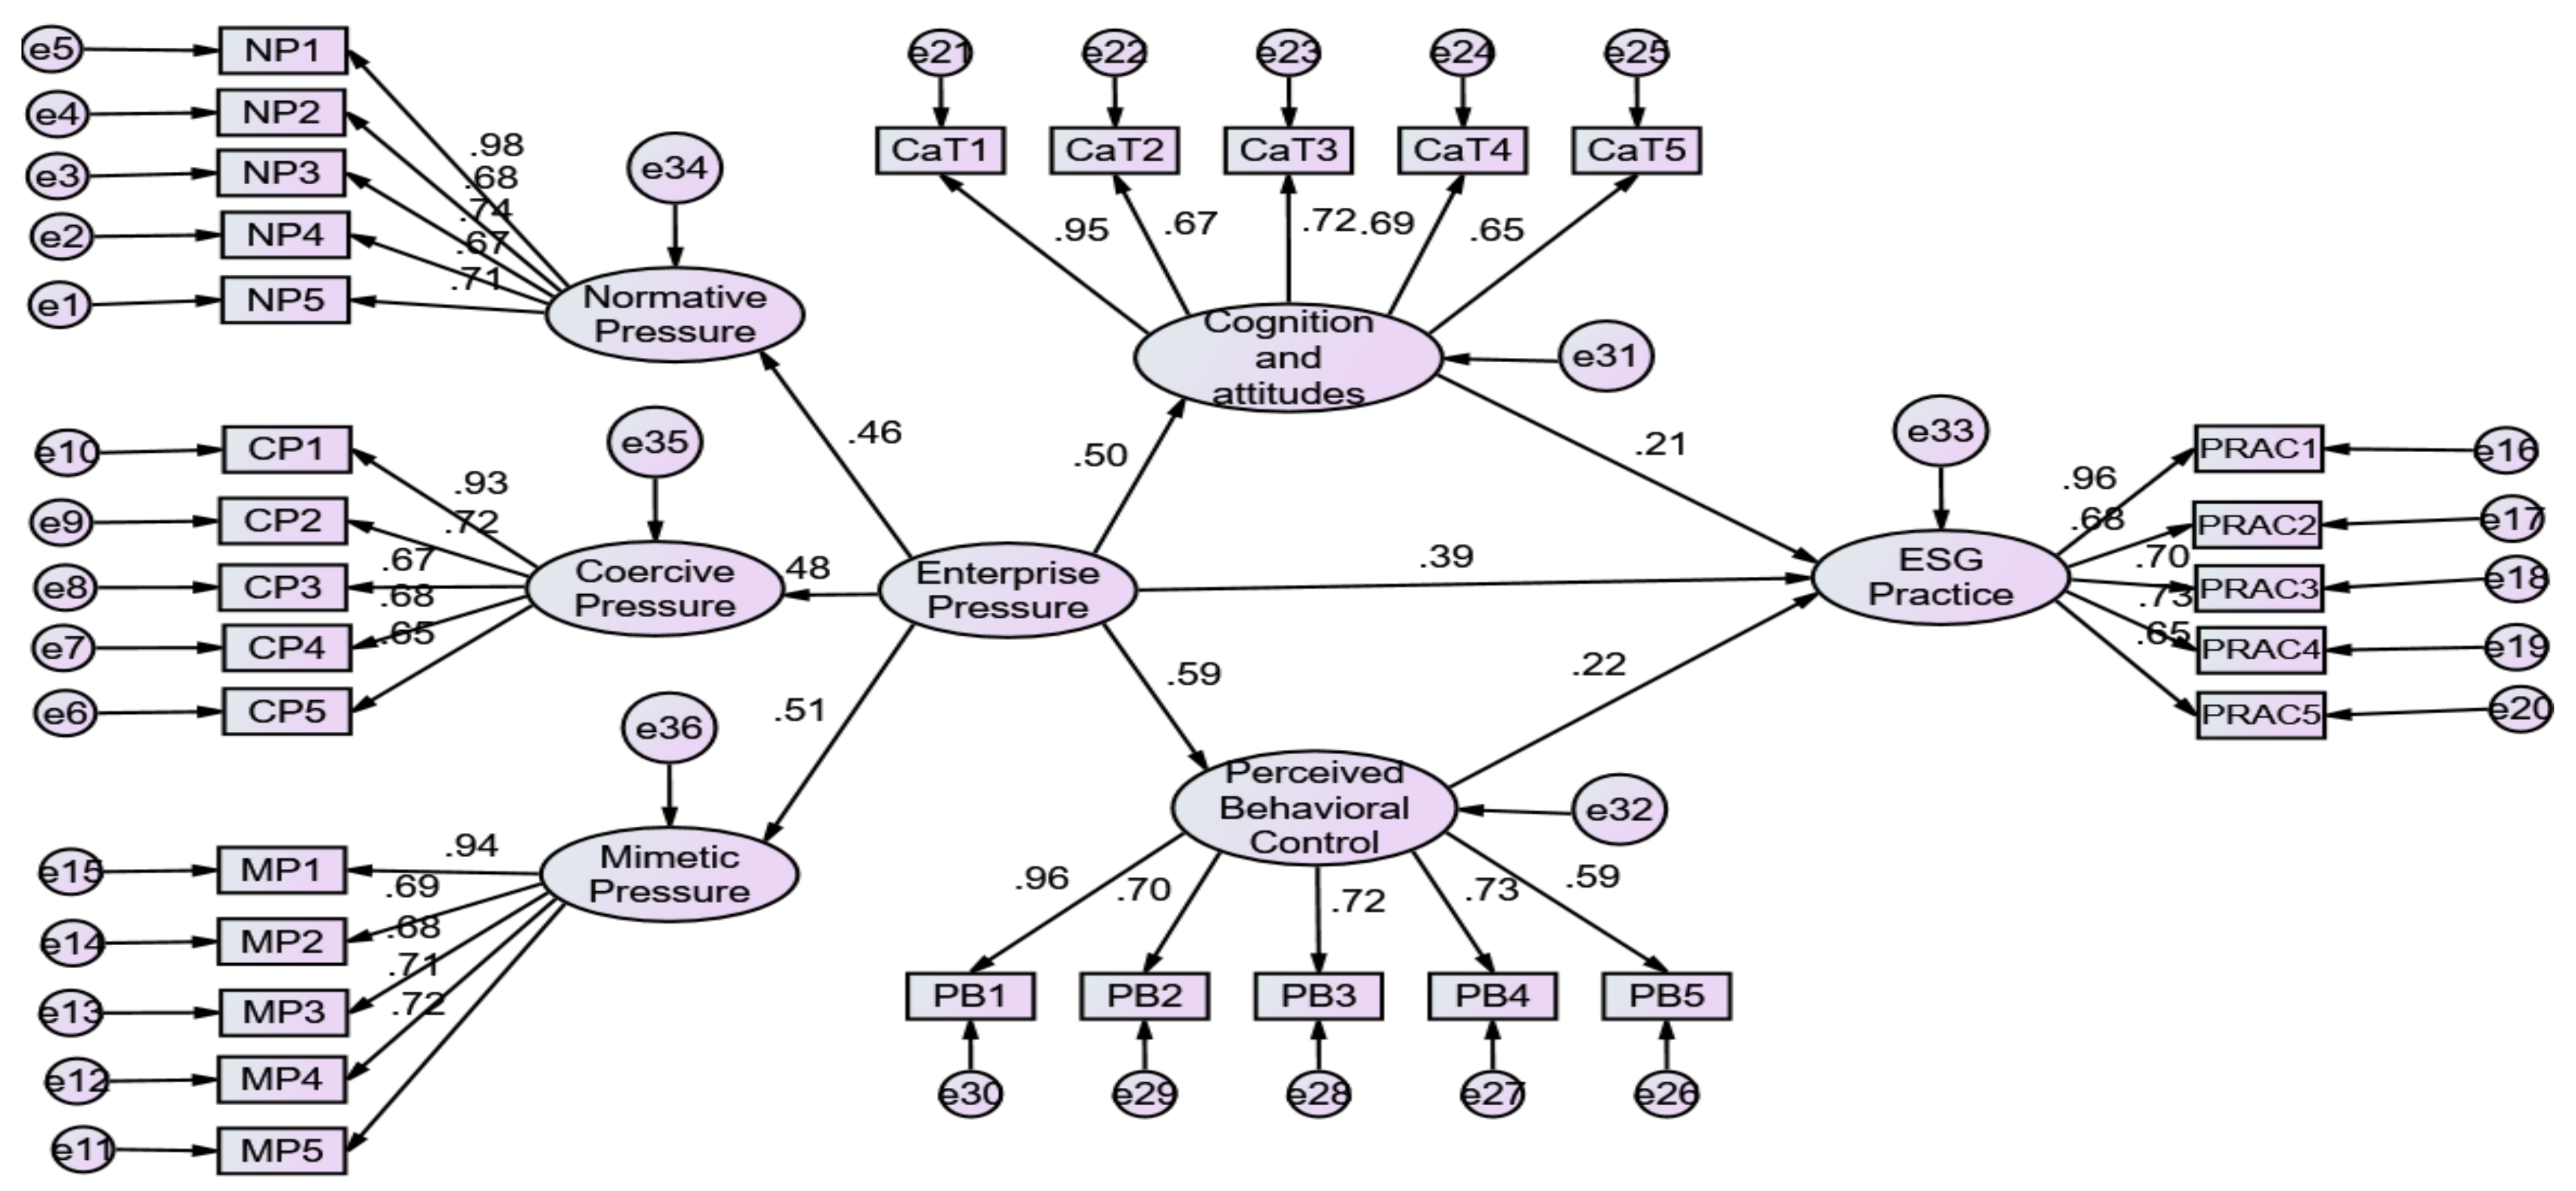
Structural equation modeling (see as Figure 2) of normative pressure, coercive pressure, and imitative pressure as independent variables, cognition and attitudes, and perceived behavioral control as mediating variables, and ESG practices as dependent variables was used to explore the direct relationships among the variables using AMOS23, and the following are the specific testing procedures and results:
Table 14. Criteria for evaluating the fit of structural equation models.
Indicator name Grading criteria
CMIN/DF <5 acceptable, <3 preferable
RMSEA <0.05
GFI ≥0.90
AGFI ≥0.90
NFI ≥0.90
IFI ≥0.90
CFI ≥0.90
* Source: by SPSS.
From the Table 15.; it can be seen that the displayed values of most of the fitted parameters meet the standard requirements, indicating that the model is fitted very well, so the structural equation model has a good fitting effect on the sample data obtained from the questionnaire.
Table 16. demonstrates the relationship between the paths, as can be seen:Enterprise_Pressure has a significant positive relationship on Cognition_and_attitudes(β=0.503,p<0.05), so H1 holds; Enterprise_Pressure has a significant positive relationship on Perceived_ Behavioral_Control there is a significant positive relationship (β=0.592,p<0.05), therefore H2 holds; Cognition_and_attitudes there is a significant positive relationship (β=0.207,p<0.05) on ESG Practice, therefore H3 holds; Perceived_ Behavioural_Control has a significant positive relationship on ESG Practice (β=0.218,p<0.05), therefore H4 holds; Enterprise_ Pressure has a significant positive relationship on ESG Practice (β=0.387,p<0.05), therefore H5 holds.

4.6.2. Mediated effects test

The self-help method (Bootstrapping) was used to test for mediating effects. Bootstrapping is a statistical resampling technique that can be used to estimate the distribution of a sample statistic. In mediation effect analysis, it obtains the precision and confidence interval of the estimate by repeatedly sampling and calculating the mediation effect. In this study, the number of sampling is set to 5000 times with upper and lower 95% confidence intervals, and the following are the specific test results (see Table 17.):
In the path relationship with Enterprise_Pressure as the independent variable, Cognition_and_attitudes as the mediator variable, and ESG Practice as the dependent variable, first, the indirect effect of Enterprise_Pressure on Coercive_Pressure (a×b) was significant (β = 0.026,p=0.03); secondly, the direct effect (c) of Enterprise_Pressure on ESG Practice was significant (β=0.551,p=0.001); and thirdly, the direction of action of the direct effect and the indirect effect were the same (a×b×c>0); therefore, it was judged to be a partial mediator of the complementary type, namely Enterprise_Pressure's effect on ESG Practice is partially mediated by Cognition_and_attitudes; therefore, H6 holds. In the path relationship with Enterprise_Pressure as the independent variable, Perceived_Behavioural_Control as the mediator variable, and ESG Practice as the dependent variable, first,the indirect effect of Enterprise_Pressure on ESG Practice (a×b) was significant (β= 0.027,p=0.032) Second, Enterprise_Pressure's direct effect (c) on ESG Practice is significant (β=0.371,p=0.001); Third, the direct and indirect effects work in the same direction (a×b×c>0) Therefore, it is judged to be a partial mediator of the complementary type, i.e. Enterprise_ Pressure's effect on ESG Practice is partially mediated by Perceived_Behavioral_Control.
Table 18. Hypothesis.
Hypothesis Acceptance
H1 There is a significant positive effect of Enterprise Pressure on Cognition and attitudes. YES
H2 There is a significant positive effect of Enterprise Pressure on Perceived Behavioral Control. YES
H3 There is a significant positive effect of Cognition and attitudes on ESG Practice. YES
H4 There is a significant positive effect of Perceived Behavioral Control on ESG Practice. YES
H5 There is a significant positive effect of Enterprise Pressure on ESG Practice. YES
H6 Cognition and attitudes play a mediating role in the effect of SCM Cognition and attitudes on ESG Practice. YES
H7 Perceived Behavioural Control mediates the effect of SCM Cognition and attitudes on ESG Practice. YES
* Source: by author.

4.6.3. Mediation effect test

The self-help method (Bootstrapping) was used to test for mediating effects. Bootstrapping is a statistical resampling technique that can be used to estimate the distribution of a sample statistic. In mediation effect analysis, it obtains the precision and confidence interval of the estimate by repeatedly sampling and calculating the mediation effect. In this study, the number of sampling is set to 5000 times with upper and lower 95% confidence intervals, and the following are the specific test results:
Table 19. Tests for mediating effects.
Intermediary path Efficiency value Effect size 95% lower confidence interval 95% upper confidence interval P
Normative pressures → Perceptions and attitudes → ESG practices Indirect effects1 0.031 0.001 0.091 0.044
Direct effect 1 0.283 0.085 0.516 0.006
Total effect 1 0.315 0.129 0.539 0.002
Intermediary effects1 0.9 0.527 1.001 0.011
Mandatory stress → Cognition and attitudes → ESG practices Indirect effect 2 0.091 0.021 0.236 0.009
Direct effect 2 0.281 0.041 0.546 0.028
Total effect 2 0.372 0.111 0.649 0.007
Intermediation effect 2 0.755 0.125 0.966 0.037
Imitative stress → Cognitions and attitudes → ESG practices Indirect effects3 0.046 0.001 0.122 0.044
Direct effect 3 0.369 0.142 0.601 0.004
Total effect 3 0.415 0.191 0.638 0.002
Intermediation effect 3 0.888 0.612 1.005 0.005
Normative pressure → perceived Behavioral control → ESG practices Indirect effects4 0.135 0.035 0.309 0.002
Direct effect 4 0.283 0.085 0.516 0.006
Total effect4 0.418 0.192 0.679 0.001
Indirect effects4 0.677 0.292 0.917 0.009
Coercive pressure → Perceived behavioral control → ESG practices Indirect effects5 0.042 0 0.116 0.051
Direct effects5 0.281 0.041 0.546 0.028
Total effect5 0.323 0.077 0.573 0.012
Intermediary effects5 0.871 0.394 1.022 0.023
Imitative Stress → Perceived behavioral control → ESG practices Indirect effects6 0.121 0.034 0.262 0.002
Direct effect 6 0.281 0.041 0.546 0.028
Total effect 6 0.402 0.144 0.667 0.005
Indirect effects6 0.699 0.167 0.929 0.03
* Source: by SPSS.
In the path relationship with normative pressure as the independent variable, cognition and attitude as the mediator variables, and ESG practice as the dependent variable, first, the indirect effect of normative pressure on ESG practice (a×b) was significant (β=0.031,p=0.044); second, the direct effect of normative pressure on ESG practice (c) was significant (β=0.283,p=0.006); and third, the direct effect and indirect effects were in the same direction (a×b×c>0); therefore, it was judged to be a complementary partial mediation, i.e.; the effect of normative pressure on ESG practice would be partially mediated by perceptions and attitudes. In the path relationship with coercive pressure as the independent variable, cognition and attitude as the mediator variables, and ESG practice as the dependent variable, first,the indirect effect of coercive pressure on ESG practice (a×b) was significant (β=0.091,p=0.009) second, the direct effect of coercive pressure on ESG practice (c) was significant (β=0.281,p=0.028); and third, the direct effect and the indirect effects were in the same direction (a×b×c>0) Therefore, it was judged to be a complementary type of partial mediation, i.e.; the effect of coercive pressure on ESG practices would be partially mediated by perceptions and attitudes. In the path relationship with imitative pressure as the independent variable, cognition and attitude as the mediator variables, and ESG practice as the dependent variable, first,the indirect effect of imitative pressure on ESG practice (a×b) was significant (β=0.046,p=0.044) second, the direct effect of imitative pressure on ESG practice (c) was significant (β=0.369,p=0.004); and third, the direct effect and the indirect effects were in the same direction (a×b×c>0) Therefore, it was judged to be a complementary type of partial mediation, i.e.; the effect of imitative pressure on ESG practice would be partially mediated by cognition and attitude. In the path relationship with normative pressure as the independent variable, perceived behavioral control as the mediator variable, and ESG practice as the dependent variable, first,the indirect effect of normative pressure on ESG practice (a×b) was significant (β=0.135,p=0.002) second, the direct effect of normative pressure on ESG practice (c) was significant (β=0.283,p=0.006); third, the direct effect and indirect effects were in the same direction (a×b×c>0) Therefore, it was judged to be a complementary type of partial mediation, i.e.; the effect of normative pressure on ESG practices would be partially mediated by perceived behavioral control. In the path relationship with coercive pressure as the independent variable, perceived behavioral control as the mediating variable, and ESG practice as the dependent variable, the indirect effect of coercive pressure on ESG practice (a×b) was not significant (β=0.042,P=0.051), i.e.; the perceived behavioral control variable would not mediate the effect of coercive pressure on ESG practice. In the path relationship with imitative pressure as the independent variable, perceived behavioral control as the mediator variable, and ESG practice as the dependent variable, first,the indirect effect of imitative pressure on ESG practice (a×b) is significant (β=0.121,p=0.002) Second, the direct effect of imitative pressure on ESG practice (c) is significant (β=0.281,p=0.028); third, the direct effect and indirect effects worked in the same direction (a×b×c>0) Therefore, it was judged to be a complementary partial mediation, i.e.; the effect of imitative pressure on ESG practices is partially mediated by perceived behavioral control.

4.7. Discussion

The analysis indicates that normative pressure, coercive pressure, and imitative pressure significantly influence Chinese firms' motivation to adopt ESG practices. Normative pressure (β=0.141, p<0.05) and coercive pressure (β=0.183, p<0.05) are particularly strong motivators. These pressures likely stem from regulatory requirements, industry standards, and the influence of leading firms that set benchmarks for ESG practices. The significant positive relationship between these pressures and ESG adoption highlights the role of external influences in driving sustainable practices.
Chinese firms face several challenges in integrating ESG into their supply chains, including cognitive and attitudinal barriers and perceived behavioral control. The regression analysis shows that perceived behavioral control (β=0.198, p<0.01) has a significant positive influence on practice, indicating that firms struggle with the practical aspects of implementing ESG initiatives. These challenges can include a lack of expertise, resources, and support from stakeholders, as well as difficulties in measuring and reporting ESG performance.
The findings suggest that enhancing cognitive and attitudinal factors (β=0.222, p<0.01) and perceived behavioral control (β=0.192, p<0.01) can effectively support SMEs in overcoming challenges related to ESG adoption. Strategies such as providing training and education on ESG practices, creating supportive policies and incentives, and developing robust frameworks for ESG reporting and accountability are crucial. Moreover, fostering a culture of sustainability within organizations and encouraging collaboration among industry players can also drive the successful integration of ESG.

4.8. Summary

In conclusion, this analysis provides valuable insights into the motivations, challenges, and strategies for integrating ESG into supply chains among Chinese firms. Normative, coercive, and imitative pressures are key motivators, while cognitive and attitudinal barriers and perceived behavioral control pose significant challenges.

5. Recommendations And Conclusion

5.1. Recommendations

Based on the above, the following policy recommendations are proposed:
Firstly, make full use of supply chain business partnerships to enhance the level of green innovation in enterprises. Sustainable innovation is an important source for enterprises to maintain long-term competitive advantage and sustainable development. The research in this paper shows that customer ESG performance has a significant impact on suppliers' sustainable innovation behaviours and decisions. As a result, supplier enterprises can make full use of their close partnership with customers, strengthen communication and collaboration, and make full use of external market resources by actively undertaking customers' knowledge spillovers, imitating and learning from customers' ESG development experiences, in order to drive the greening transformation of internal production and technological innovation of supplier enterprises, and effectively enhance their own sustainable development capabilities.
Secondly, the Chinese government should give more resource support to ESG investment enterprises, support the development of ESG-advantaged enterprises, and form an industry demonstration effect: enterprises with better ESG performance are conducive to building a responsible image and reputation, reinforcing the willingness of external enterprises in the supply chain to cooperate, and prompting the cooperative enterprises to optimise their own ESG development in order to converge with their cooperative customers. At the same time, enterprises with ESG advantages have significant knowledge spillover and contagion effects in the process of green development, which helps reduce the information search cost and green transformation cost of other enterprises in the industry, and enhance the overall green development of the industry. In this regard, the Chinese government can appropriately support the development of enterprises with ESG advantages, optimise tax reduction policies oriented to green innovation, encourage financial institutions to help develop green bonds, sustainable bonds and other green investment and financing projects, effectively alleviate the constraints on enterprise financing, broaden the source of talent, strengthen the enterprise risk-bearing capacity, form a long-term advantage in enterprise ESG development, and lead the industry in green innovation and green development.
Thirdly, the Chinese government should continue to improve the corporate information disclosure mechanism and strengthen the supervision of the production and operation behaviour of ESG disclosing enterprises, so as to prevent enterprises from disclosing information to important business targets or major shareholders while neglecting to disclose information to the public, and the resulting business risks. In particular, it is necessary to regulate the production and operation process of SMEs to avoid possible "greenwashing" behaviour, release ESG dividends through the external market, stimulate the enthusiasm of SMEs for green innovation, improve the efficiency of resource allocation in the capital market, and promote the high-quality and sustainable development of SMEs.
Enterprises should strengthen the training of supply chain ESG management professionals. It is recommended that enterprises set up a professional team for supply chain ESG management and establish an ESG talent training mechanism. For example, it is recommended to strengthen the professional capacity of Chinese enterprises in supply chain ESG management technology innovation and related database construction, improve the ESG risk management system, and promote the realisation of China's domestic ‘dual-carbon’ goal.

5.2. Conclusion

5.2.1. Theoretical and Managerial Implications

This study explores in depth the drivers, barriers and methods for Chinese SMEs to incorporate corporate governance, social responsibility and environmental principles into supply chain management. The findings highlight the important role of external factors (such as normative, mandatory and imitative pressures) in driving the implementation of environmental, social and corporate governance strategies. Nevertheless, SMEs encounter many barriers in the successful implementation of these strategies, such as perceived behavioral control, cognitive and attitudinal limitations, etc.
The research data clearly indicates that the enterprise pressure faced by SMEs has a significant positive effect on their cognition and attitudes as well as perceived behavioral control. At the same time, optimized corporate cognitive attitudes, enhanced feelings of behavioral control, and moderate operational pressures all contribute to improving the performance levels of SMEs in ESG practices. Further in-depth analysis reveals that the cognition and attitudes of enterprises and perceived behavioral control play a heterogeneous determinant role in promoting SCM Practice within the ESG cognitive attitude, further highlighting the significant role that ESG performance plays in the sustainable development of SMEs.
In light of this, the article proposes suggestions to overcome these barriers, arguing that industry collaboration, financial and technical support, and enhanced awareness and education on environmental, social, and corporate governance are needed. Strict ESG reporting guidelines and a solid legal foundation can help further guarantee the validity and reliability of ESG data. By adopting these strategies, SMEs can improve their environmental, social, and corporate governance performance, contribute to sustainable development, and gain competitive advantages in the market.

5.2.2. Academic Value and Contributions of the Study

Compared to developed countries, China's ESG standards and policy-making are lagging behind, and enterprises are facing severe challenges in the social responsibility mechanism. This study aims to explore the impact of ESG on the SCM of Chinese SMEs and to analyze and evaluate the impact effect of SMEs' ESG performance on the supply chain. In addition, it attempts to clarify the potential mechanisms driving this impact, addressing the current knowledge gap in this field. The specific academic contributions are summarized as follows:
Objective 1: To explore adoption motivations, this study divides them into normative pressure and coercive pressure, aiming to determine whether the overall impact of ESG on enterprise SCM is attributed to ESG standards and policy factors.
Objective 2: Through research on corporate cognition and attitudes towards ESG, perceived behavioral control, this study aims to improve the research on the impact effect of ESG on enterprise SCM practices, filling the gap in research related to corporate sustainable development strategies.
Objective 3: To address the insufficient exploration of the heterogeneous determinants of ESG performance in the field of international business academia, a comprehensive analysis has been conducted to bridge the existing research gap.

5.2.3. Limitations and Further Research

Although this study provides valuable insights into how ESG into SCM in China can improve companies' competitiveness and sustainable development, it is not without its limitations. First, the empirical results are based on limited data sources from Chinese SMEs. Although the analysis results are evident, further data from different supply chain enterprises should be used for verification. Even though the study has examined that normative pressure, coercive pressure, and imitative pressure in SMEs have a significant positive effect on cognition and attitude and perceived behavioral control, the examination could also be applied to SCM target variables. Such an examination would help determine the extent of the relationship between the optimization of SCM processes and the achievement of ESG indicators.
Future research can explore the long-term impact of ESG integration on corporate performance and broader social benefits, and further enrich the understanding of ESG practices in different contexts.
In the future development of ESG practices, enterprises will face a series of challenges and opportunities and ESG practices are expected to further deepen and mature. First, as global awareness of sustainable development deepens, Chinese companies will continue to deepen their understanding of ESG concepts and more effectively integrate ESG into their core businesses and strategies. This shift means that Chinese SMEs no longer view ESG as an insignificant compliance responsibility, but rather as a key driver of innovation, competitive advantage, and long-term growth.
In addition, Chinese corporate supply chains need to respond to new challenges and changing market conditions related to environmental, social, and corporate governance. As ESG standards and expectations continue to evolve, Chinese SME supply chains need to continuously update their knowledge and skills to cope with the rapidly changing external environment.
As global attention to environmental, social, and corporate governance continues to increase, the environmental, social, and corporate governance performance of Chinese SME supply chains in international markets will directly affect their brand image, market share, and investment attractiveness. This requires supply chains to not only pay attention to the ESG requirements of local markets, but also follow international standards and best practices to ensure their competitiveness on a global scale. In addition, Chinese SMEs will face diverse demands from stakeholders from different cultural and market backgrounds, requiring Chinese supply chains to consider these diverse factors when implementing ESG strategies. By effectively implementing environmental, social, and corporate governance practices on a global scale, Chinese SMEs can not only improve their own sustainable development capabilities, but also maintain their competitive advantage in the global market.

Author Contributions

Conceptualization, G.Y. and G.T.; methodology, G.T.; software, Z.Y.; validation, G.Y.; G.T.; formal analysis, G.T.; investigation, Z.Y.; resources, G.H.; data cu-ration, G.T.; writing—original draft preparation, G.T.; writing—review and editing, G.Y.; supervision, G.Y.; project administration, Z.Y.; funding acquisition, G.Y. All authors have read and agreed to the published version of the manuscript.

Funding

This research was funded by Zhejiang Province human resources and social security research project, grant number Z2024003 and The APC was funded by GUO Yue.

Institutional Review Board Statement

Not applicable.

Informed Consent Statement

Not applicable.

Data Availability Statement

The data presented in this study are available on request from the corresponding author.

Acknowledgments

First, we would like to thank Dr. Jihye Kim, Professor Margaret Fletcher and Professor Stephan Von Delft at the University of Glasgow for their valuable advice and support. Their insightful comments and constructive criticism at different stages of this research were thought-provoking and helped us focus on our thoughts. Thanks to all the authors of the literature cited and referenced in this article, their research results provide references and reference for this article. We greatly appreciate the reviewers and journal editors' recommendations.

Conflicts of Interest

The authors declare no conflicts of interest.

References

  1. United Nations Principles for Responsible Investment (UNPRI). Annual Report 2022-2023. Retrieved from UNPRI,2023.
  2. Wu, S. A literature review on corporate greenwashing behavior, Modern Management, 2023, 13, 1609-1615.
  3. Shi, J.; Yu, C.; Li, Y.; Wang, T. Does green financial policy affect debt-financing cost of heavy-polluting enterprises? an empirical evidence based on chinese pilot zones for green finance reform and innovations. Technological Forecasting & Social Change 2022, 179, 121678. [Google Scholar] [CrossRef]
  4. Sánchez-Sellero, P.; Bataineh, M.J. How R&D cooperation, R&D expenditures, public funds and R&D intensity affect green innovation? Technology Analysis & Strategic Management 2022, 34, 1095–1108. [Google Scholar] [CrossRef]
  5. Tan, Y.; Zhu, Z. The effect of ESG rating events on corporate green innovation in China: The mediating role of financial constraints and managers' environmental awareness, Technology in Society, 2022, 68(c), 101906. [CrossRef]
  6. Wang, F.; Sun, Z. Does the Environmental Regulation Intensity and ESG Performance Have a Substitution Effect on the Impact of Enterprise Green Innovation: Evidence from China, International Journal of Environmental Research and Public Health, 2022, 19, 8558. [CrossRef]
  7. Xu, J.; Liu, F.; Shang, Y. R&D investment, ESG performance and green innovation performance: evidence from China, Kybernetes, 2021, 50, 737-756. [CrossRef]
  8. Baid, V.; Jayaraman, V. Amplifying and Promoting the ‘S’ in ESG Investing: The Case for Social Responsibility in Supply Chain Financing, Managerial Finance, 2022, 48, 1279-1297. [CrossRef]
  9. Ren, M.; Zhou, J.; Si, J.; Wang, G.; Guo, C. The Impact of ESG Performance on Green Innovation among Traditional Energy Enterprises--Evidence from Listed Companies in China, Sustainability, 2024, 16, 3542. [CrossRef]
  10. Cai, Y.; Pan, C.H.; Statman, M. Why do countries matter so much in corporate social performance? Journal of Corporate Finance (Amsterdam, Netherlands), 2016, 41(Supplement C), 591-609. [CrossRef]
  11. Jha, A.; Cox, J. Corporate social responsibility and social capital, Journal of Banking & Finance, 2015, 60, 252-270. [CrossRef]
  12. Giese, G.; Lee, L.; Melas, D.; Nagy, Z.; Nishikawa, L. Foundations of ESG Investing: How ESG Affects Equity Valuation, Risk, and Performance, Journal of Portfolio Management, 2019, 45, 69-83. [CrossRef]
  13. Liang,L.; Li,Y. The double-edged sword effect of organizational resilience on ESG performance, Corporate Social-responsibility and Environmental Management, 2023, 30, 2852-2872. [CrossRef]
  14. Friede, G.; Busch, T.; Bassen, A. ESG and financial performance: aggregated evidence from more than 2000 empirical studies, Journal of Sustainable Finance & Investment, 2015, 5, 210-233. [CrossRef]
  15. Easley, D.; O'hara, M. Information and the cost of capital. The Journal of Finance 2004, 59, 1553–1583. [Google Scholar] [CrossRef]
  16. Grewal, J.; Riedl, E.J.; and Serafeim, G. Market reaction to mandatory nonfinancial disclosure, Management Science, 2019, 65 (7), 3061-3084. [CrossRef]
  17. Mervelskemper, L.; Streit, D. Enhancing Market Valuation of ESG Performance: Is Integrated Reporting Keeping its Promise? Business Strategy and the Environment, 2017, 26 (4), 536-549. [CrossRef]
  18. Khan, M.; Serafeim, G.; Yoon, A. Corporate sustainability: First evidence on materiality. The Accounting Review 2016, 91, 1697–1724. [Google Scholar] [CrossRef]
  19. Amel-Zadeh, A.; Serafeim, G. Why and How Investors Use ESG Information: Evidence from a Global Survey. Financial Analysts Journal 2018, 74, 87–103. [Google Scholar] [CrossRef]
  20. Edmans, A. Does the stock market fully value intangibles? Employee satisfaction and equity prices. Journal of Financial Economics 2011, 101, 621–640. [Google Scholar] [CrossRef]
  21. Dorfleitner G, Utz S, Wimmer M.Patience Pays Off - Financial Long-Term Benefits of Sustainable Management Decisions. Social Science Electronic Publishing[2024-09-09]. [CrossRef]
  22. Drempetic, S.; Klein, C.; Zwergel, B. The Infuence of Firm Size on the ESG Score: Corporate Sustainability Ratings Under Review. Journal of Business Ethics 2020, 167, 333–360. [Google Scholar] [CrossRef]
  23. Zhang, X.; Li, W.; Ji, T.; Xie, H. The impact of ESG performance on firms’ technological innovation: evidence from China, Frontiers in Environmental Science, 2024, 12. [CrossRef]
  24. Ren, S.; Isa, S.M. The Impact of Digital Transformation on Corporate ESG Performance: Empirical Evidence from Chinese Listed Companies, Journal of International Business, Economics and Entrepreneurship, 2023, 8, 1-10. [CrossRef]
  25. Gu, F.; Wang, Y.; Jiang, Y. ESG performance, R&D investment and corporate competitiveness, Friends of Accounting, 2024, 14, 90-97. DOI:14.1063.F.20240627.1159.032.html.
  26. Zhang, L.; Chen, H.; Li, Z. How ESG Performance Affects Firm Value - Based on the Mediating Effect of Green Technology Innovation, Friends of Accounting, 2024, 13,pp:31-38. Available online: http://kns.cnki.net/kcms/detail/14.1063.F.20240625.1527.008.html.
  27. Tao, R.; Wu, J.; Zhao, H. Do Corporate Customers Prefer Socially Responsible Suppliers? An Instrumental Stakeholder Theory Perspective. Journal of Business Ethics 2022, 185, 1–24. [Google Scholar] [CrossRef]
  28. Setyaningrum, R.; Muafi, M. Green human resource management, green supply chain management, green lifestyle: Their effect on business sustainability mediated by digital skills, Journal of Industrial Engineering and Management, 2023, 16, 1-26. [CrossRef]
  29. Tang, J.; Wang, X.; Liu, Q. The Spillover Effect of Customers’ ESG to Suppliers, Pacific-basin Finance Journal, 2023, 78(c), 101947. [CrossRef]
  30. Perano, M.; A. Cammarano, V. Varriale, C. Del Regno, Michelino, F.; Caputo, M. Embracing Supply Chain Digitalization and Unphysicalization to Enhance Supply Chain Performance: A Conceptual Framework, International Journal of Physical Distribution & Logistics Management, 2023, 53(4-5), 628-659. [CrossRef]
  31. Loske, D.; Klumpp, M. Verifying the Effects of Digitalisation in Retail Logistics: An Efficiency-Centred Approac, International Journal of Logistics Research and Applications, 2022, 25, 203-227. [CrossRef]
  32. Oguntegbe, K.F.; Di Paola, M.; Vona, R. Blockchain Technology, Social Capital and Sustainable Supply Chain Management, Sinergie Italian Journal of Management, 2021, 39, 163-188. [CrossRef]
  33. Munir, M.A.; Habib, M.S.; Hussain, A.; Shahbaz, M.A.; Qamar, A.; Masood, T.; Sultan, M.; Mujtaba, M.A.; Imran, S.; Hasan, M.; et al. Blockchain Adoption for Sustainable Supply Chain Management: Economic, Environmental, and Social Perspectives, Frontiers in Energy Research, 2022(vol.10), 899632. [CrossRef]
  34. Xiao, H.; Shen, H.; Zhou, Y. Customer enterprise digitalization, supplier enterprise ESG performance, and sustainable development of the supply chain, Economic Research Journal, 2024, 59, 54-73.
  35. Khan, S.A.; Mubarik, M.; Kusi-Sarpong, S.; Gupta, H.; and Zaman, S.I. Blockchain Technologies as Enablers of Supply Chain Mapping for Sustainable Supply Chains, Business Strategy and the Environment, 2022, 31, 3742-3756. [CrossRef]
  36. Karmaker, C. L.; Al Aziz, R.; Ahmed, T.; Misbauddin, S. M.; Moktadir,Md. A. Impact of Industry 4.0 Technologies on Sustainable Supply Chain performance: The Mediating Role of Green Supply Chain Management Practices and Circular Economy, Journal of Cleaner Production, 2023, 419, 138249. [CrossRef]
  37. Fantazy, K.; Tipu, S.A.A. Linking Big Data Analytics Capability and Sustainable Supply Chain Performance: Mediating Role of Knowledge Development, Management Research Review, 2024, 47, 512-536. [CrossRef]
  38. Thöni, A.; Tjoa, A.M. Information Technology for Sustainable Supply Chain Management: A Literature Survey, Enterprise Information Systems, 2017, 11, 1-31. [CrossRef]
  39. Oubrahim, I.; Sefiani, N.; Happonen, A. The Influence of Digital Transformation and Supply Chain Integration on Overall Sustainable Supply Chain Performance: An Empirical Analysis from Manufacturing Companies in Morocco, Energies, 2023, 16, 1004. [CrossRef]
  40. The European Parliament And Of The Council. Directive (EU) 2022/2464 of the European Parliament and of the Council of 14 December 2022 amending Regulation (EU) No 537/2014, Directive 2004/109/EC, Directive 2006/43/EC and Directive 2013/34/EU, as regards corporate sustainability reporting, Official Journal of the European Union, 2022/2464, 2022, 15–80.
  41. Tellier, N. Environmental, Social, and Governance Performance of Top-Rated Supply Chain Companies: A Quantitative Assessment Model, Bryant University.2021.
  42. Murray, A.; Skene, K.; Haynes, K. The circular economy: An interdisciplinary exploration of the concept and application in a global context. Journal of Business Ethics 2017, 140, 369–380. [Google Scholar] [CrossRef]
  43. Bogers, M.; Chesbrough, H.; Heaton, S.; Teece, D.J. Strategic Management of Open Innovation: A Dynamic Capabilities Perspective, California Management Review, 2019, 62, 77-94. [CrossRef]
  44. Clark, G.L.; Feiner, A.; Viehs, M. From the stockholder to the stakeholder: How sustainability can drive financial out performance. 2015. [CrossRef]
  45. Lins, K.V.; Servaes, H.; Tamayo, A. Social capital, trust, and firm performance: The value of corporate social responsibility during the financial crisis. Journal of Finance 2017, 72, 1785–1824. [Google Scholar] [CrossRef]
  46. Christensen, D.M.; Serafeim, G.; Sikochi, A. Why is corporate virtue in the eye of the beholder? The case of ESG ratings. The Accounting Review 2022, 97, 147–175. [Google Scholar] [CrossRef]
  47. Fuchs, A.; Gehring, K. The home bias in sovereign ratings. Journal of the European Economic Association 2017, 15, 1386–1423. [Google Scholar] [CrossRef]
  48. Xin, C.; Zhang, X.; Wang, X. Does corporate ESG performance help stabilize supply chain cooperation? Economic and Management Research 2024, 45, 35–54. [Google Scholar] [CrossRef]
  49. Hertzel, M.G.; Li, Z.; Officer, M.S.; Rodgers, K.J. Inter-Firm Linkages and the Wealth Effects of Financial Distress along the Supply Chain. Journal of Financial Economics 2008, 87, 374–387. [Google Scholar] [CrossRef]
  50. Aouadi, A.; Marsat, S. Do ESG controversies matter for firm value? Evidence from international data. Journal of Business Ethics 2018, 151, 1027–1047. [Google Scholar] [CrossRef]
  51. Zimmerman, M.; Zeitz, G.J. Beyond Survival: Achieving New Venture Growth by Building Legitimacy. Academy of Management Review 2002, 27, 414–431. [Google Scholar] [CrossRef]
  52. Stekelorum, R.; Courrent, J.M.; and Spence, M. Supply chain pressures and SMEs’ CSR practices: the moderation effect of supply chain position, International Journal of Logistics Research and Applications, 2023, 85, 1-26. [CrossRef]
  53. Liu, Y.; Jia, X.P.; Jia, X.Z.; Koufteros, X. CSR orientation incongruence and supply chain relationship performance — a network perspective, Journal of Operations Management, 2021, 67, 237-260. [CrossRef]
  54. Cheng, B.T.; Ioannou, I.; Serafeim, G. Corporate social responsibility and access to finance. Strategic Management Journal 2014, 35, 1–23. [Google Scholar] [CrossRef]
  55. Chu Y , Tian X.; Wang W. Corporate Innovation Along the Supply Chain, Management Science, 2019, 65, 2445-2466. [CrossRef]
  56. Eliwa, Y.; Ahmed, A.; Ahmed, S. ESG practices and the cost of debt: Evidence from EU countries, Critical Perspectives on Accounting, 2021, 79, 102097. [CrossRef]
  57. Gillan, S. L. , Koch, A. , and Starks, L. T. Firms and social responsibility: a review of esg and csr research in corporate finance. Journal of Corporate Finance 2021, 66, 101889. [CrossRef]
  58. Gelo, O.; Braakmann, D.; Benetka, G. Quantitative and qualitative research: Beyond the debate. Integrative Psychological and Behavioral Science 2008, 42, 266–290. [Google Scholar] [CrossRef]
  59. Liu, P.; Zhu, B.; Yang, M.; Chu, X. ESG and financial performance: A qualitative comparative analysis in China's new energy companies. Journal of Cleaner Production 2022, 379, 134721. [Google Scholar] [CrossRef]
  60. Dai, T.; Tang, C. Frontiers in Service Science: Integrating ESG Measures and Supply Chain Management: Research Opportunities in the Postpandemic Era, Service Science (Hanover, Md.), 2022, 14, 1-12. [CrossRef]
  61. Marsden, E.; Torgerson, C.J. Single group, pre- and posttest research designs: Some methodological concerns. Oxford Review of Education 2012, 38, 583–616. [Google Scholar] [CrossRef]
  62. Williams, K.; Petrosky, A.; Hernandez, E.; Page Jr, R. Product placement effectiveness: revisited and renewed. Journal of Management and Marketing Research 2011, 7, 132–155. [Google Scholar]
  63. Siva K. Balasubramanian, James A. Karrh and Patwardhan H. Audience Response to Product Placements: An Integrative Framework and Future Research Agenda, Journal of Advertising, 2006, 35, 115-141. [CrossRef]
  64. Eldridge, S.M.; Lancaster, G.A.; Campbell, M.J.; Thabane, L.; Hopewell, S.; Coleman, C.L. Defining feasibility and pilot studies in preparation for randomised controlled trials: Development of a conceptual framework. PLoS ONE 2016, 11, e0150205. [Google Scholar] [CrossRef]
  65. Hair, J.F.; Black, W.C.; Babin, B.J.; Anderson, R.E. Multivariate Data Analysis (7th ed.), Pearson, New York.2010.
  66. Fornell, C.; Larcker, D.F. Evaluating structural equation models with unobservable variables and measurement error, Journal of Marketing Research, 1981, 18, 39-50. [CrossRef]
Figure 1. Diagram of the CFA model. *Source: by author.
Preprints 117717 g001
Figure 2. SEM model diagram. * Source: by author.
Preprints 117717 g002
Table 3. Descriptive analysis of basic information.
Name Options Frequency Percentage (%) Cumulative (%)
Age 20-35 years 95 29.595 29.595
35-50 years 122 38.006 67.601
50-65 years 91 28.349 95.95
65 years and over 13 4.05 100
Office grassroots workers 186 57.944 57.944
Team Leader 77 23.988 81.931
managers 58 18.069 100
Number of employees Less than 50 72 22.43 22.43
50-200 persons 98 30.53 52.96
200-500 persons 75 23.364 76.324
Over 500 76 23.676 100
Company Type service industry 90 28.037 28.037
services sector 88 27.414 55.452
retail trade 79 24.611 80.062
IT or technology industry 64 19.938 100
*Source: by author.
Table 6. KMO values and Bartlett's test.
Preprints 117717 i004
*Source: by SPSS.
Table 12. Pearson Correlation.
Average value Standard deviation Fulfill Normative pressure Coercive pressure Pressure to imitate Cognition and attitudes Sensory-behavioral control
Fulfill 2.745 0.864 1
Normative pressure 2.82 0.895 0.300*** 1
Coercive pressure 2.781 0.84 0.292*** 0.260*** 1
Pressure to imitate 2.861 0.876 0.320*** 0.198*** 0.200*** 1
Cognition and attitudes 2.926 0.858 0.339*** 0.229*** 0.242*** 0.239*** 1
Sensory-behavioral control 2.744 0.891 0.342*** 0.264*** 0.294*** 0.322*** 0.113* 1
* p<0.05 ** p<0.01 *** p<0.001. * Source: by SPSS.
Table 13. Stratified regression.
Layering 1 Layering 2
B Standard error t p β B standard error t p β
A constant (math.) 0.968*** 0.209 4.64 0 - 0.436* 0.222 1.968 0.05 -
Normative pressure 0.195*** 0.051 3.819 0 0.202 0.132** 0.05 2.629 0.009 0.137
Coercive pressure 0.196*** 0.054 3.609 0 0.191 0.117* 0.054 2.166 0.031 0.114
Pressure to imitate 0.238*** 0.051 4.638 0 0.242 0.151** 0.052 2.924 0.004 0.153
Cognition and attitudes 0.223*** 0.052 4.314 0 0.222
Sensory-behavioral control 0.192*** 0.052 3.7 0 0.198
R 2 0.194 0.266
Adjustment R 2 0.186 0.254
F-value F = 25.360, p = 0.000 F =22.836, p=0.000
△R 2 -- 0.072
△F value -- F =15.558,p=0.000
* p<0.05 ** p<0.01 *** p<0.001. * Source: by SPSS.
Table 15. Model Fit Tests.
Indicator category Indicator name Adaptation Standards Test results Acceptability
Absolute fitness parameter GFI >0.8 0.912 acceptance
AGFI >0.8 0.896 acceptance
RMSEA <0.08 0.027 acceptance
Value-added fitness parameters NFI >0.8 0.908 acceptance
IFI >0.8 0.981 acceptance
CFI >0.8 0.981 acceptance
RFI >0.8 0.898 acceptance
Simple fitness parameter CMIN/DF <3 1.233 acceptance
PGFI >0.5 0.767 acceptance
* Source: by SPSS.
Table 16. Model regression path coefficients.
Pathes Estimate S.E. C.R. P Std.Estimate
Enterprise_Pressure Cognition_and_attitudes 1.98 0.419 4.722 *** 0.503
Enterprise_Pressure Perceived_Behavioral_Control 1.053 0.227 4.633 *** 0.592
Cognition_and_attitudes ESG Practice 0.216 0.073 2.939 0.003 0.207
Perceived_Behavioral_Control ESG Practice 0.503 0.196 2.573 0.01 0.218
Enterprise_Pressure ESG Practice 1.589 .579 2.744 0.006 0.387
* Source: by SPSS.
Table 17. Tests for mediating effects.
Paths Parameter Estimate Lower Upper P
Enterprise_Pressure→
Cognition_and_attitudes→ESG Practice
ind1 0.427 0.109 0.831 0.016
direct1 1.589 0.487 3.192 0.004
total1 2.016 1.037 3.527 0.001
r1 0.788 0.391 0.957 0.005
Enterprise_Pressure→
Perceived_Behavioral_Control→ESG Practice
ind2 0.227 0.035 0.486 0.023
direct2 1.589 0.487 3.192 0.004
total2 1.816 0.773 3.369 0.001
r2 0.875 0.567 0.985 0.004
* Source: by SPSS.
Disclaimer/Publisher’s Note: The statements, opinions and data contained in all publications are solely those of the individual author(s) and contributor(s) and not of MDPI and/or the editor(s). MDPI and/or the editor(s) disclaim responsibility for any injury to people or property resulting from any ideas, methods, instructions or products referred to in the content.
Copyright: This open access article is published under a Creative Commons CC BY 4.0 license, which permit the free download, distribution, and reuse, provided that the author and preprint are cited in any reuse.
Prerpints.org logo

Preprints.org is a free preprint server supported by MDPI in Basel, Switzerland.

Subscribe

© 2024 MDPI (Basel, Switzerland) unless otherwise stated