Submitted:
09 September 2024
Posted:
11 September 2024
You are already at the latest version
Abstract
Keywords:
1. Introduction
2. Results
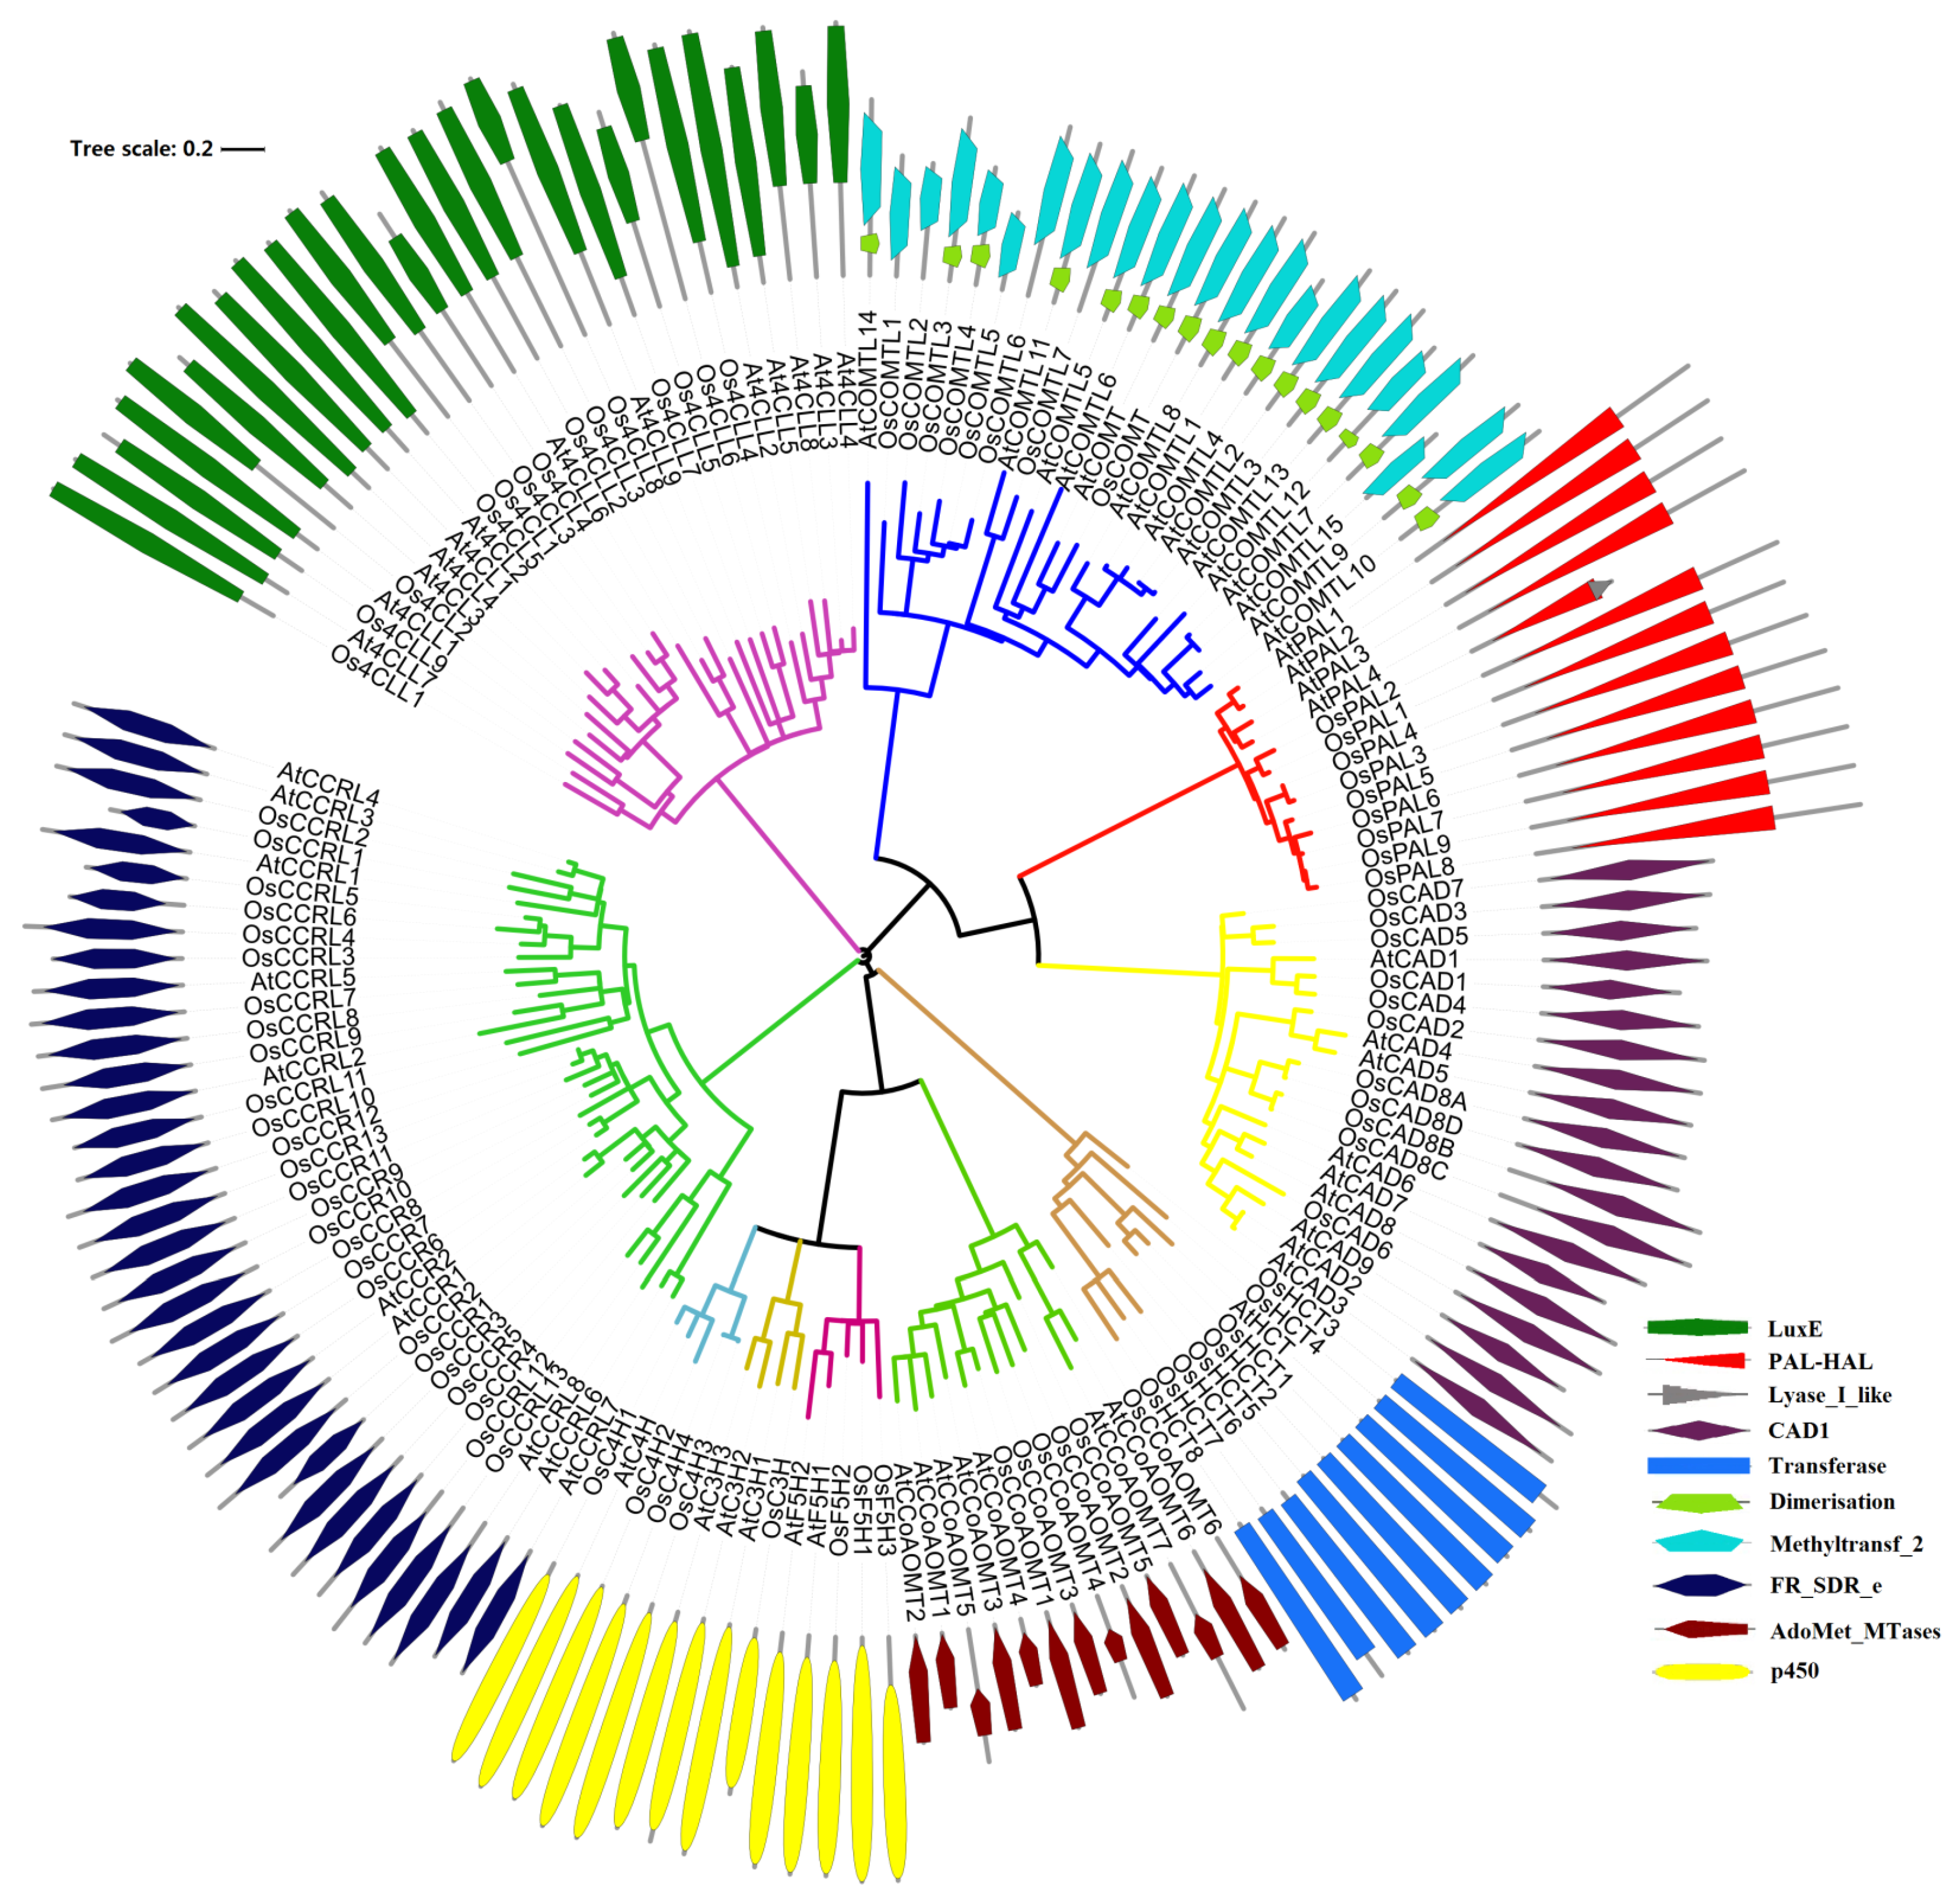
2.1. Identification and Evolutionary Relationships of Potential Lignin Biosynthesis Genes in the Rice Genome
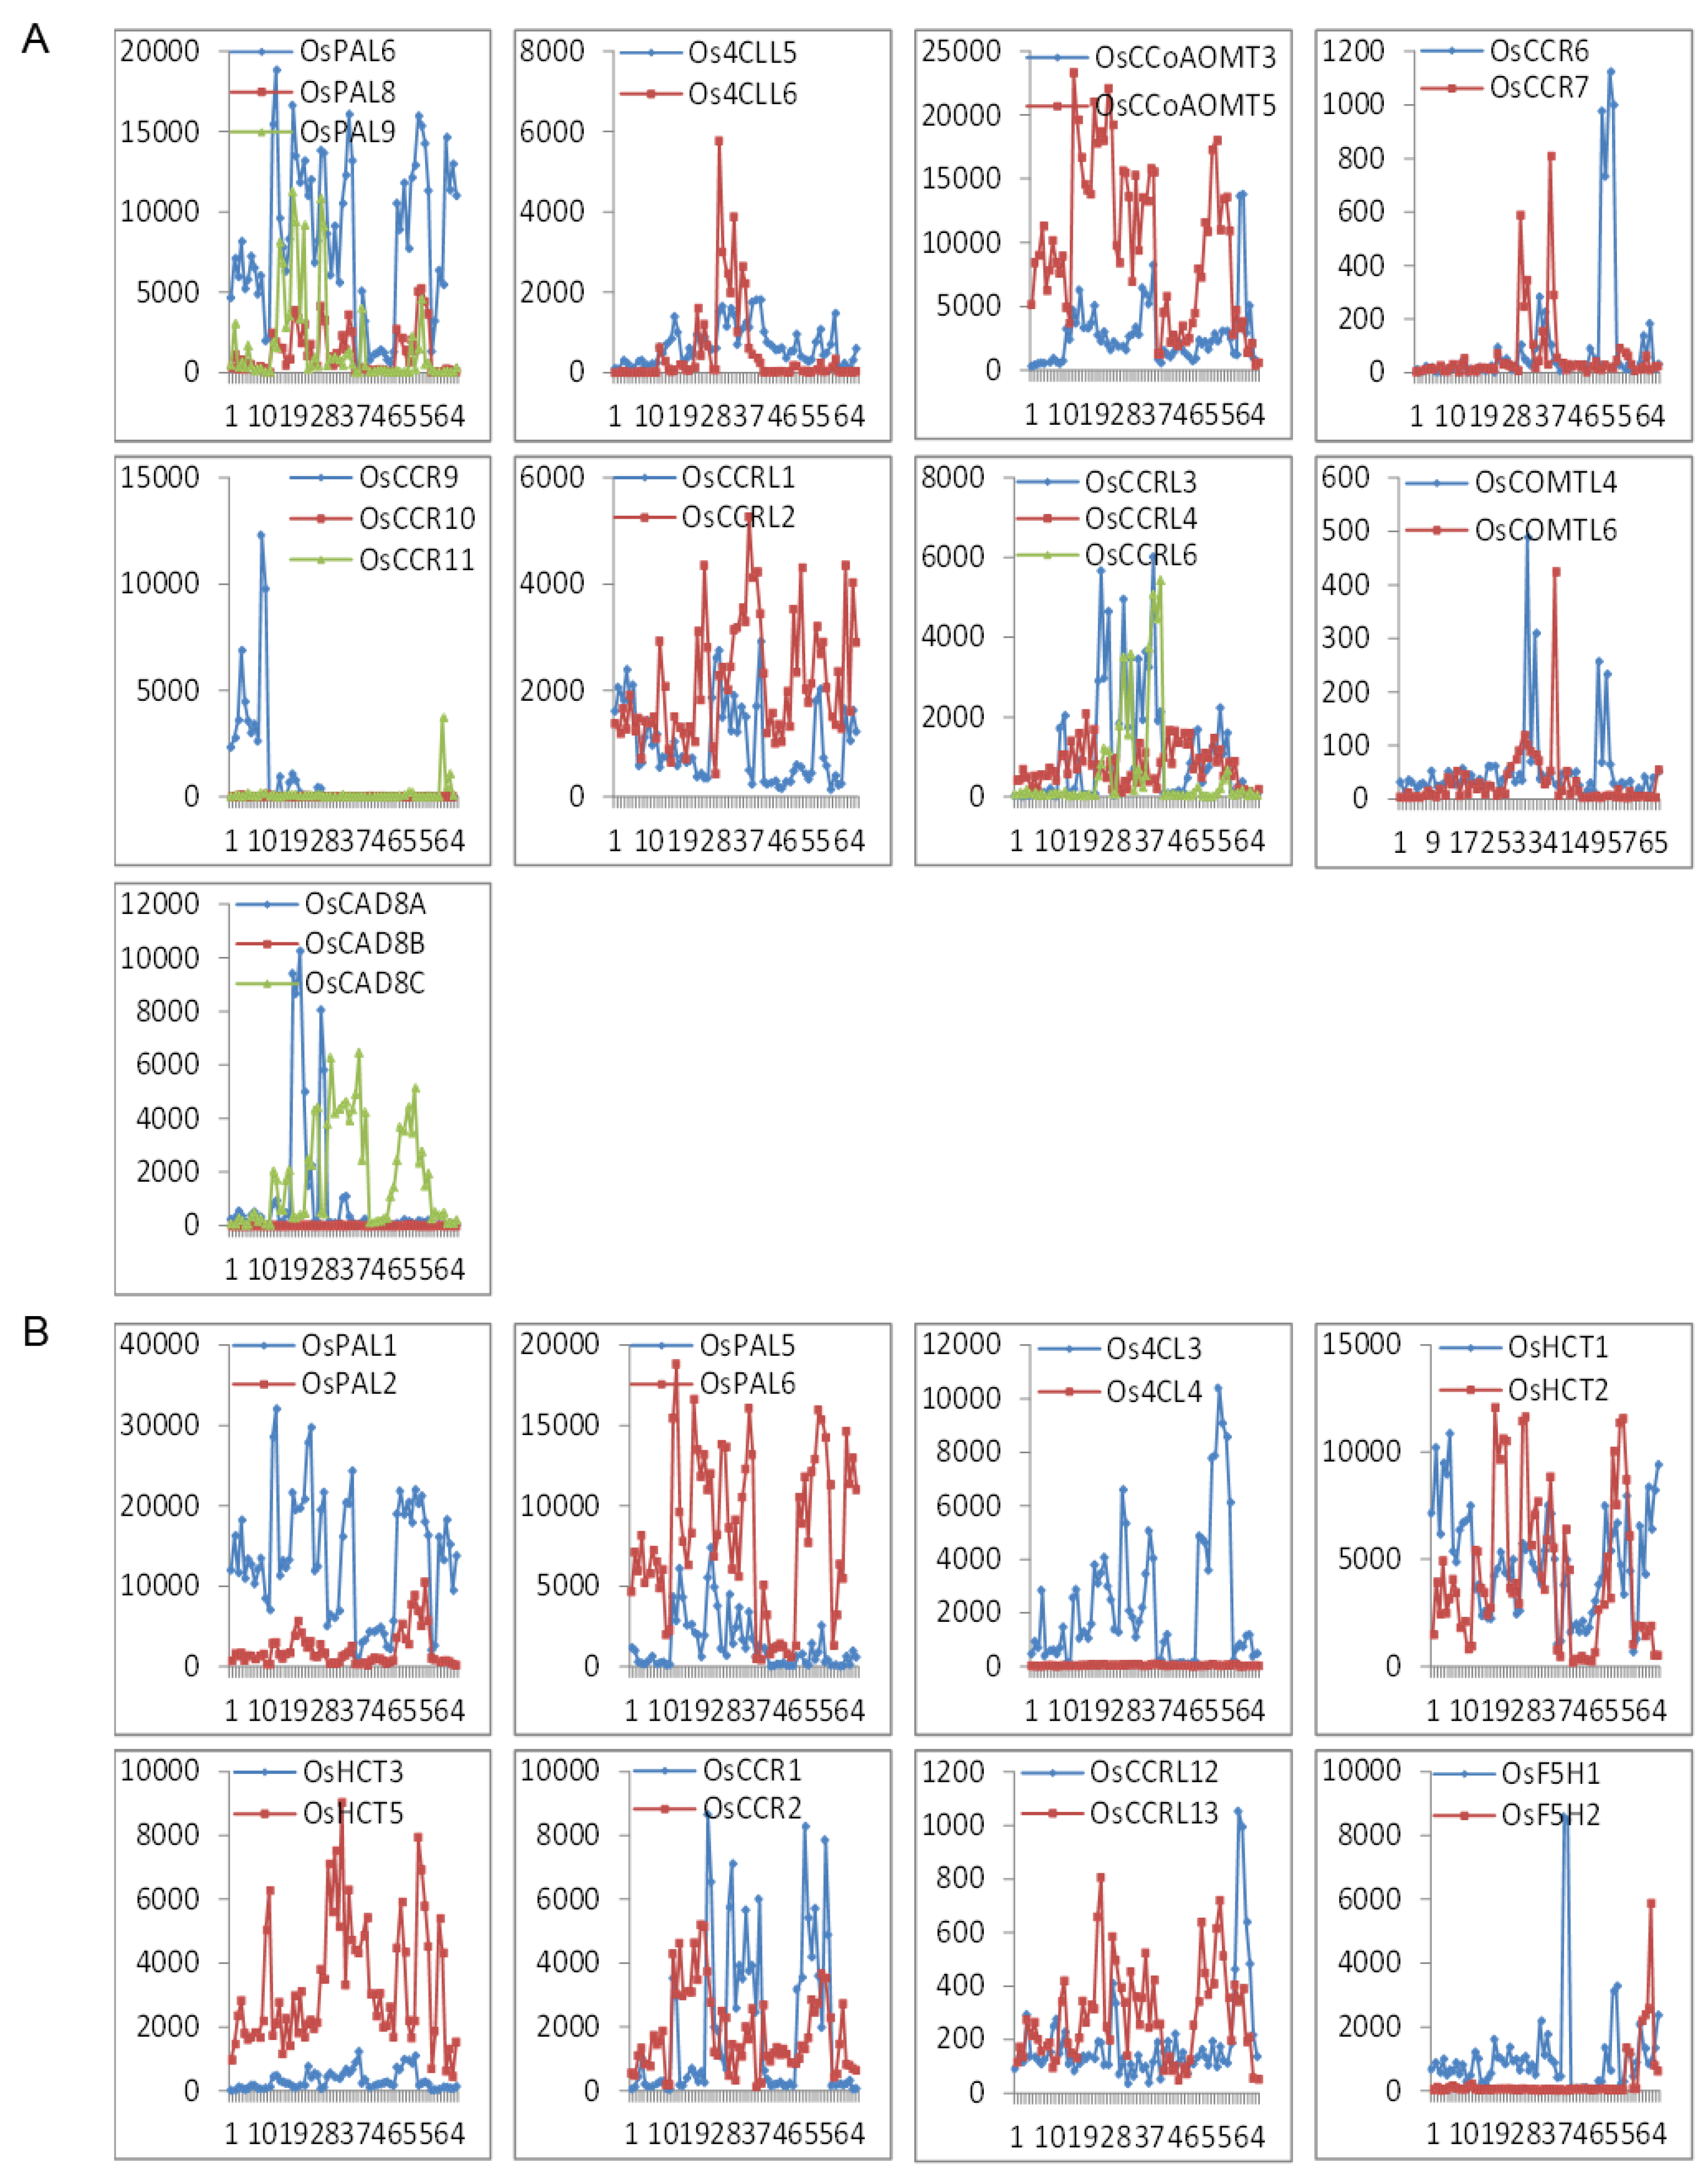
2.2. Co-expression profiling of lignin biosynthesis genes in rice
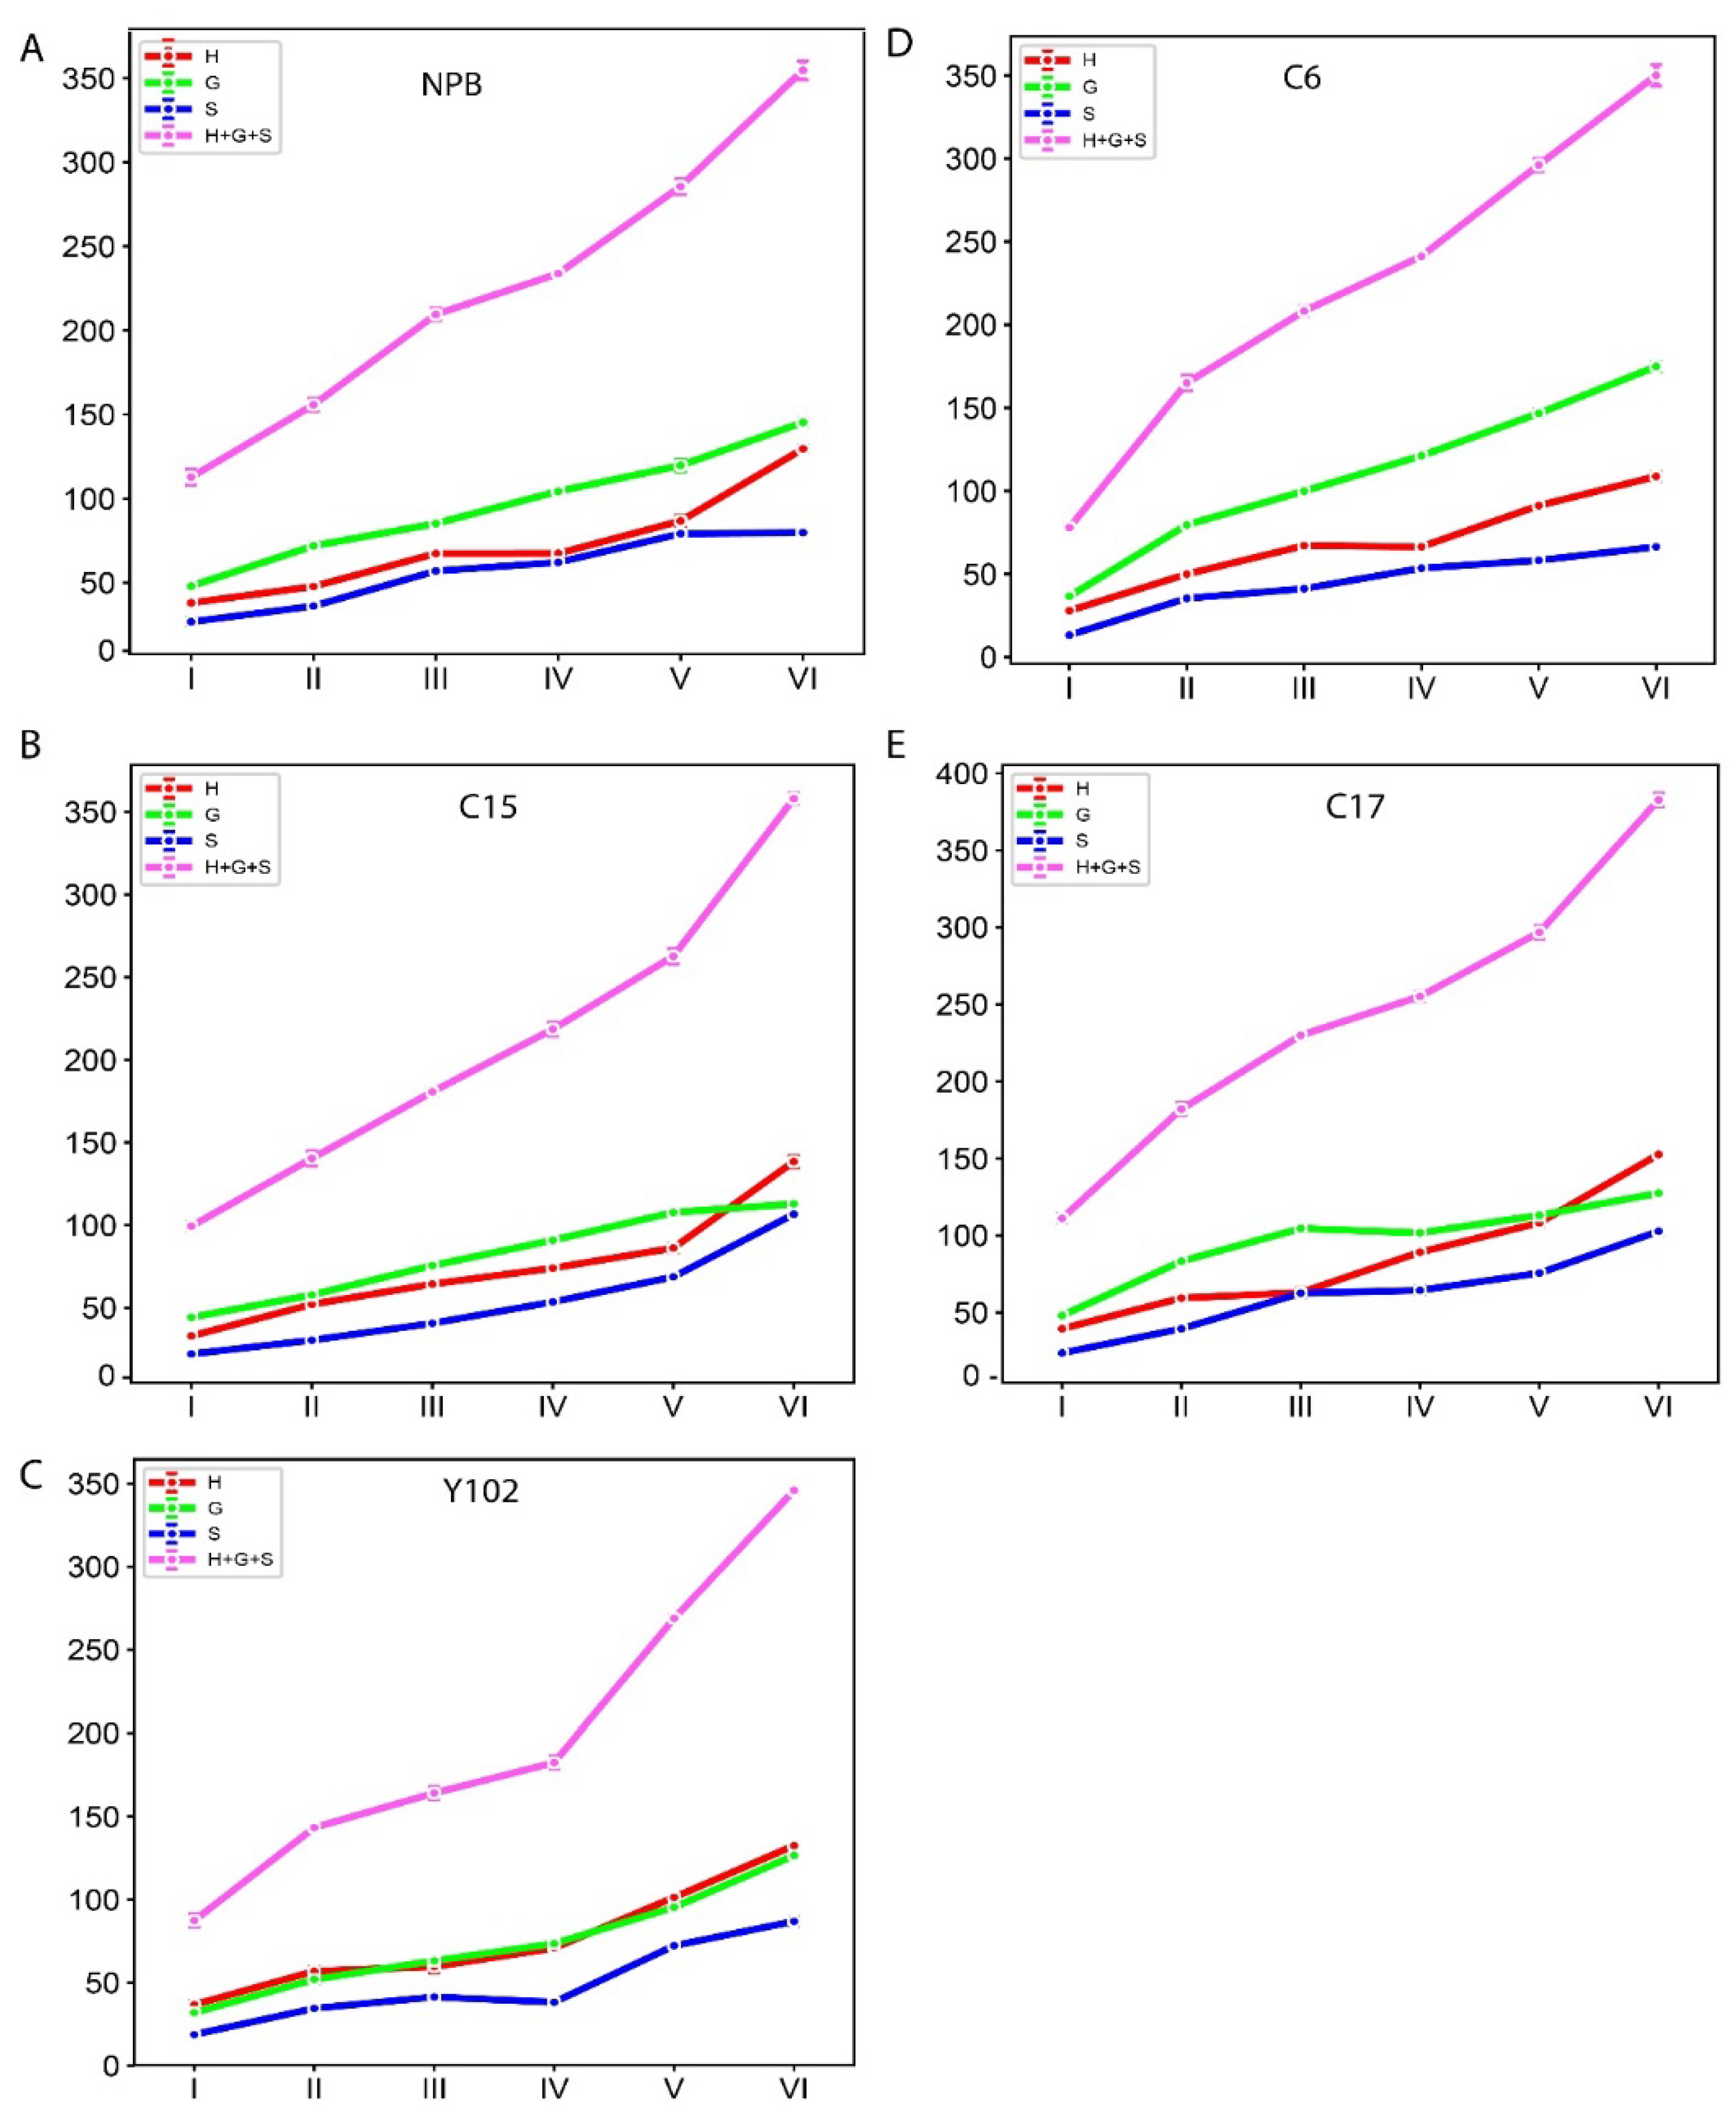
2.3. Biochemical Analysis of the lignin monomers in rice genotypes
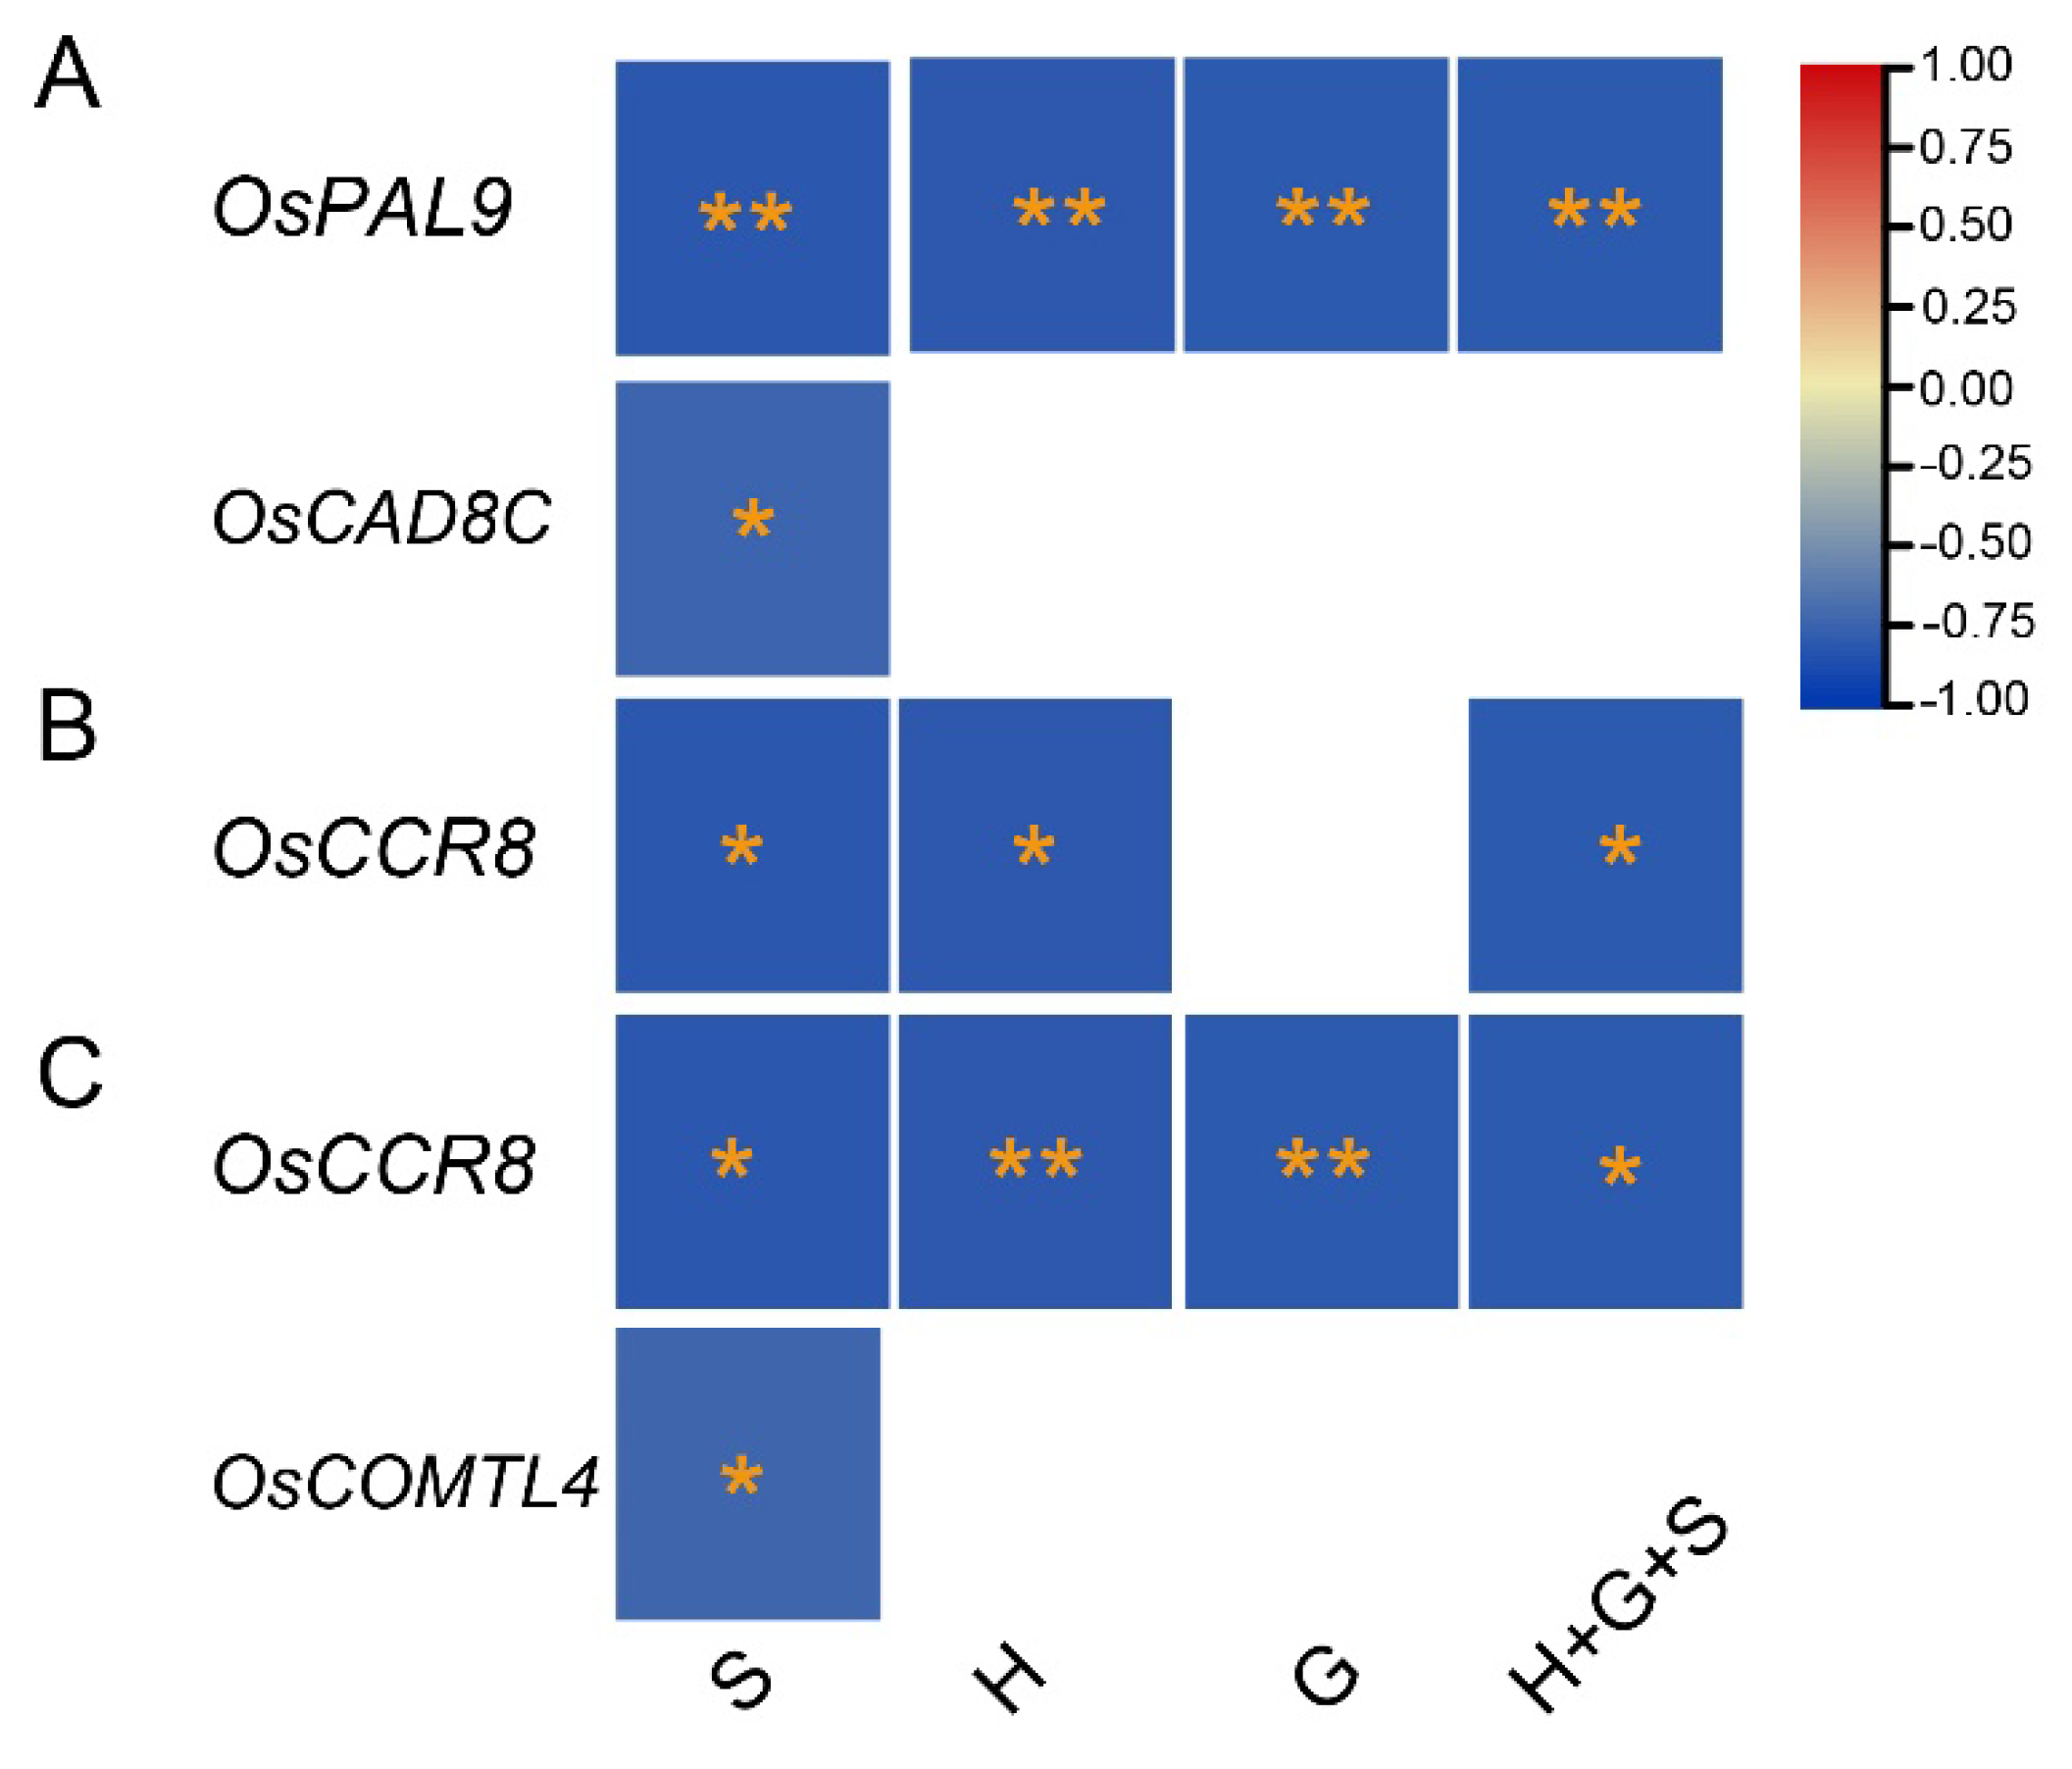
2.4. RT-qPCR assays of twenty-seven selected genes and their association with lignin monomer synthesis
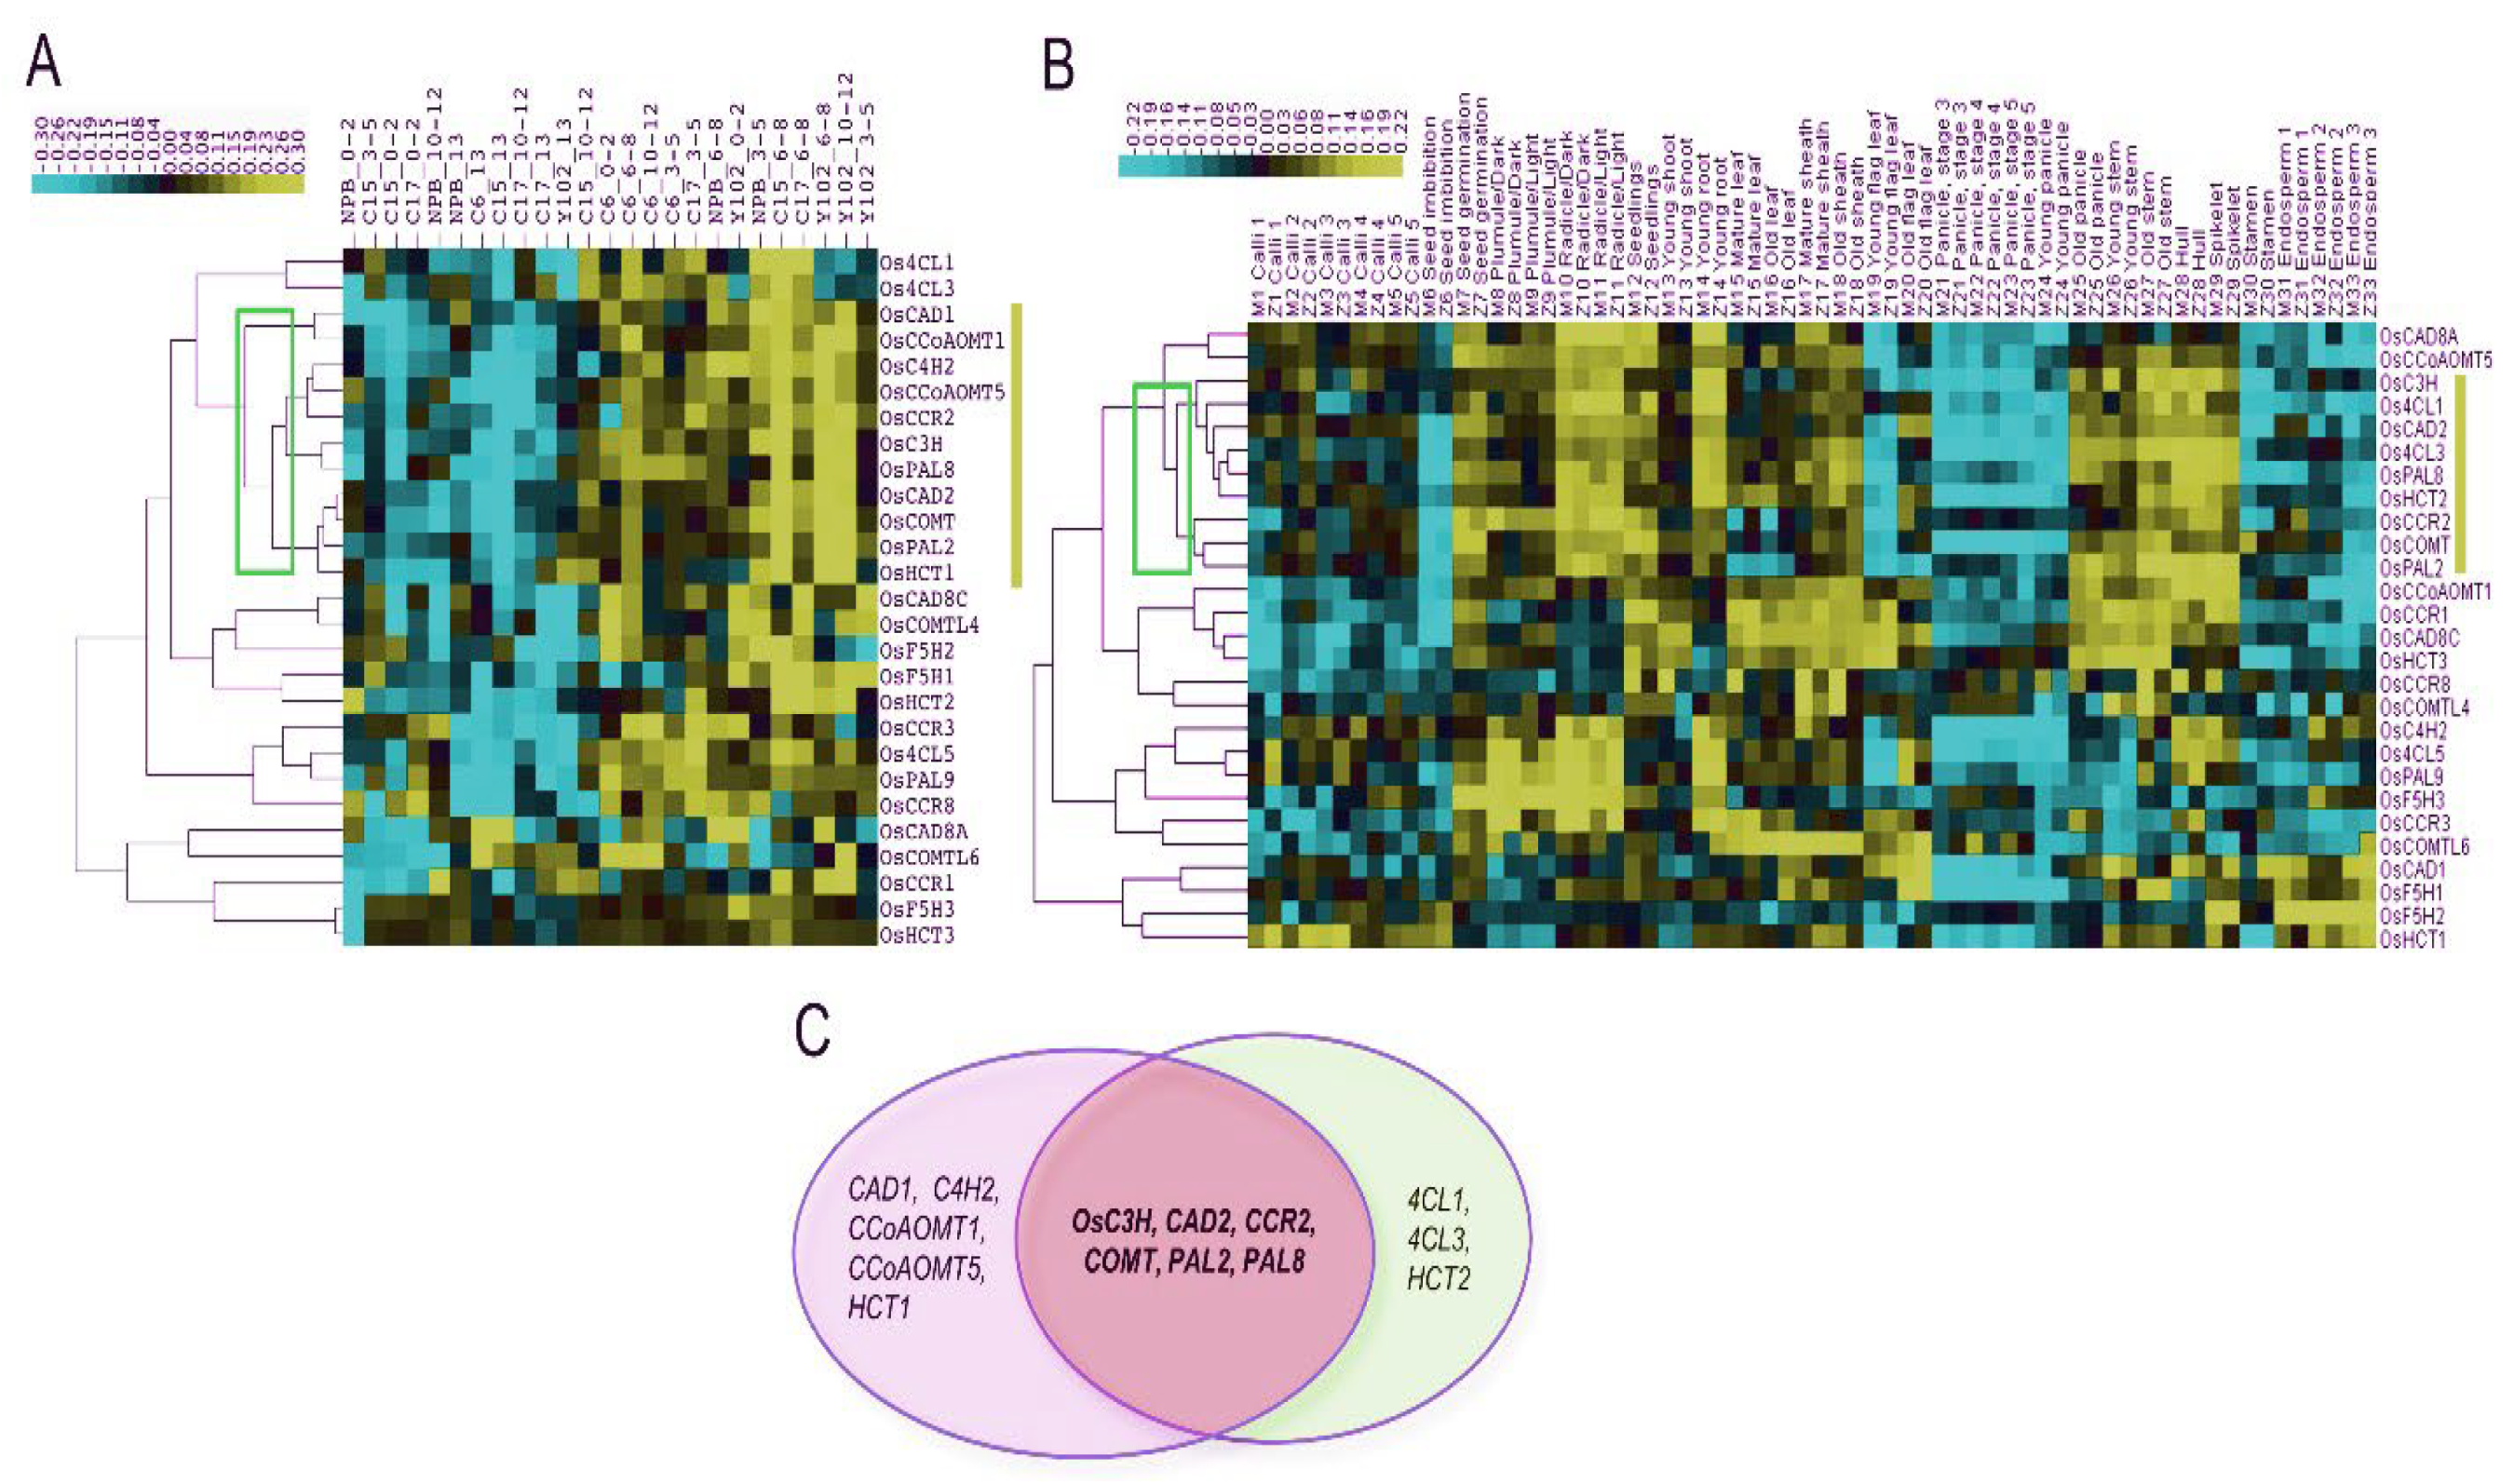
2.5. Identification of Common Promising Genes Among CREP Array and qpcr Expressions
3. Discussions
4. Materials and methods
4.1. Database Searching for Lignin Biosynthesis Genes in Rice
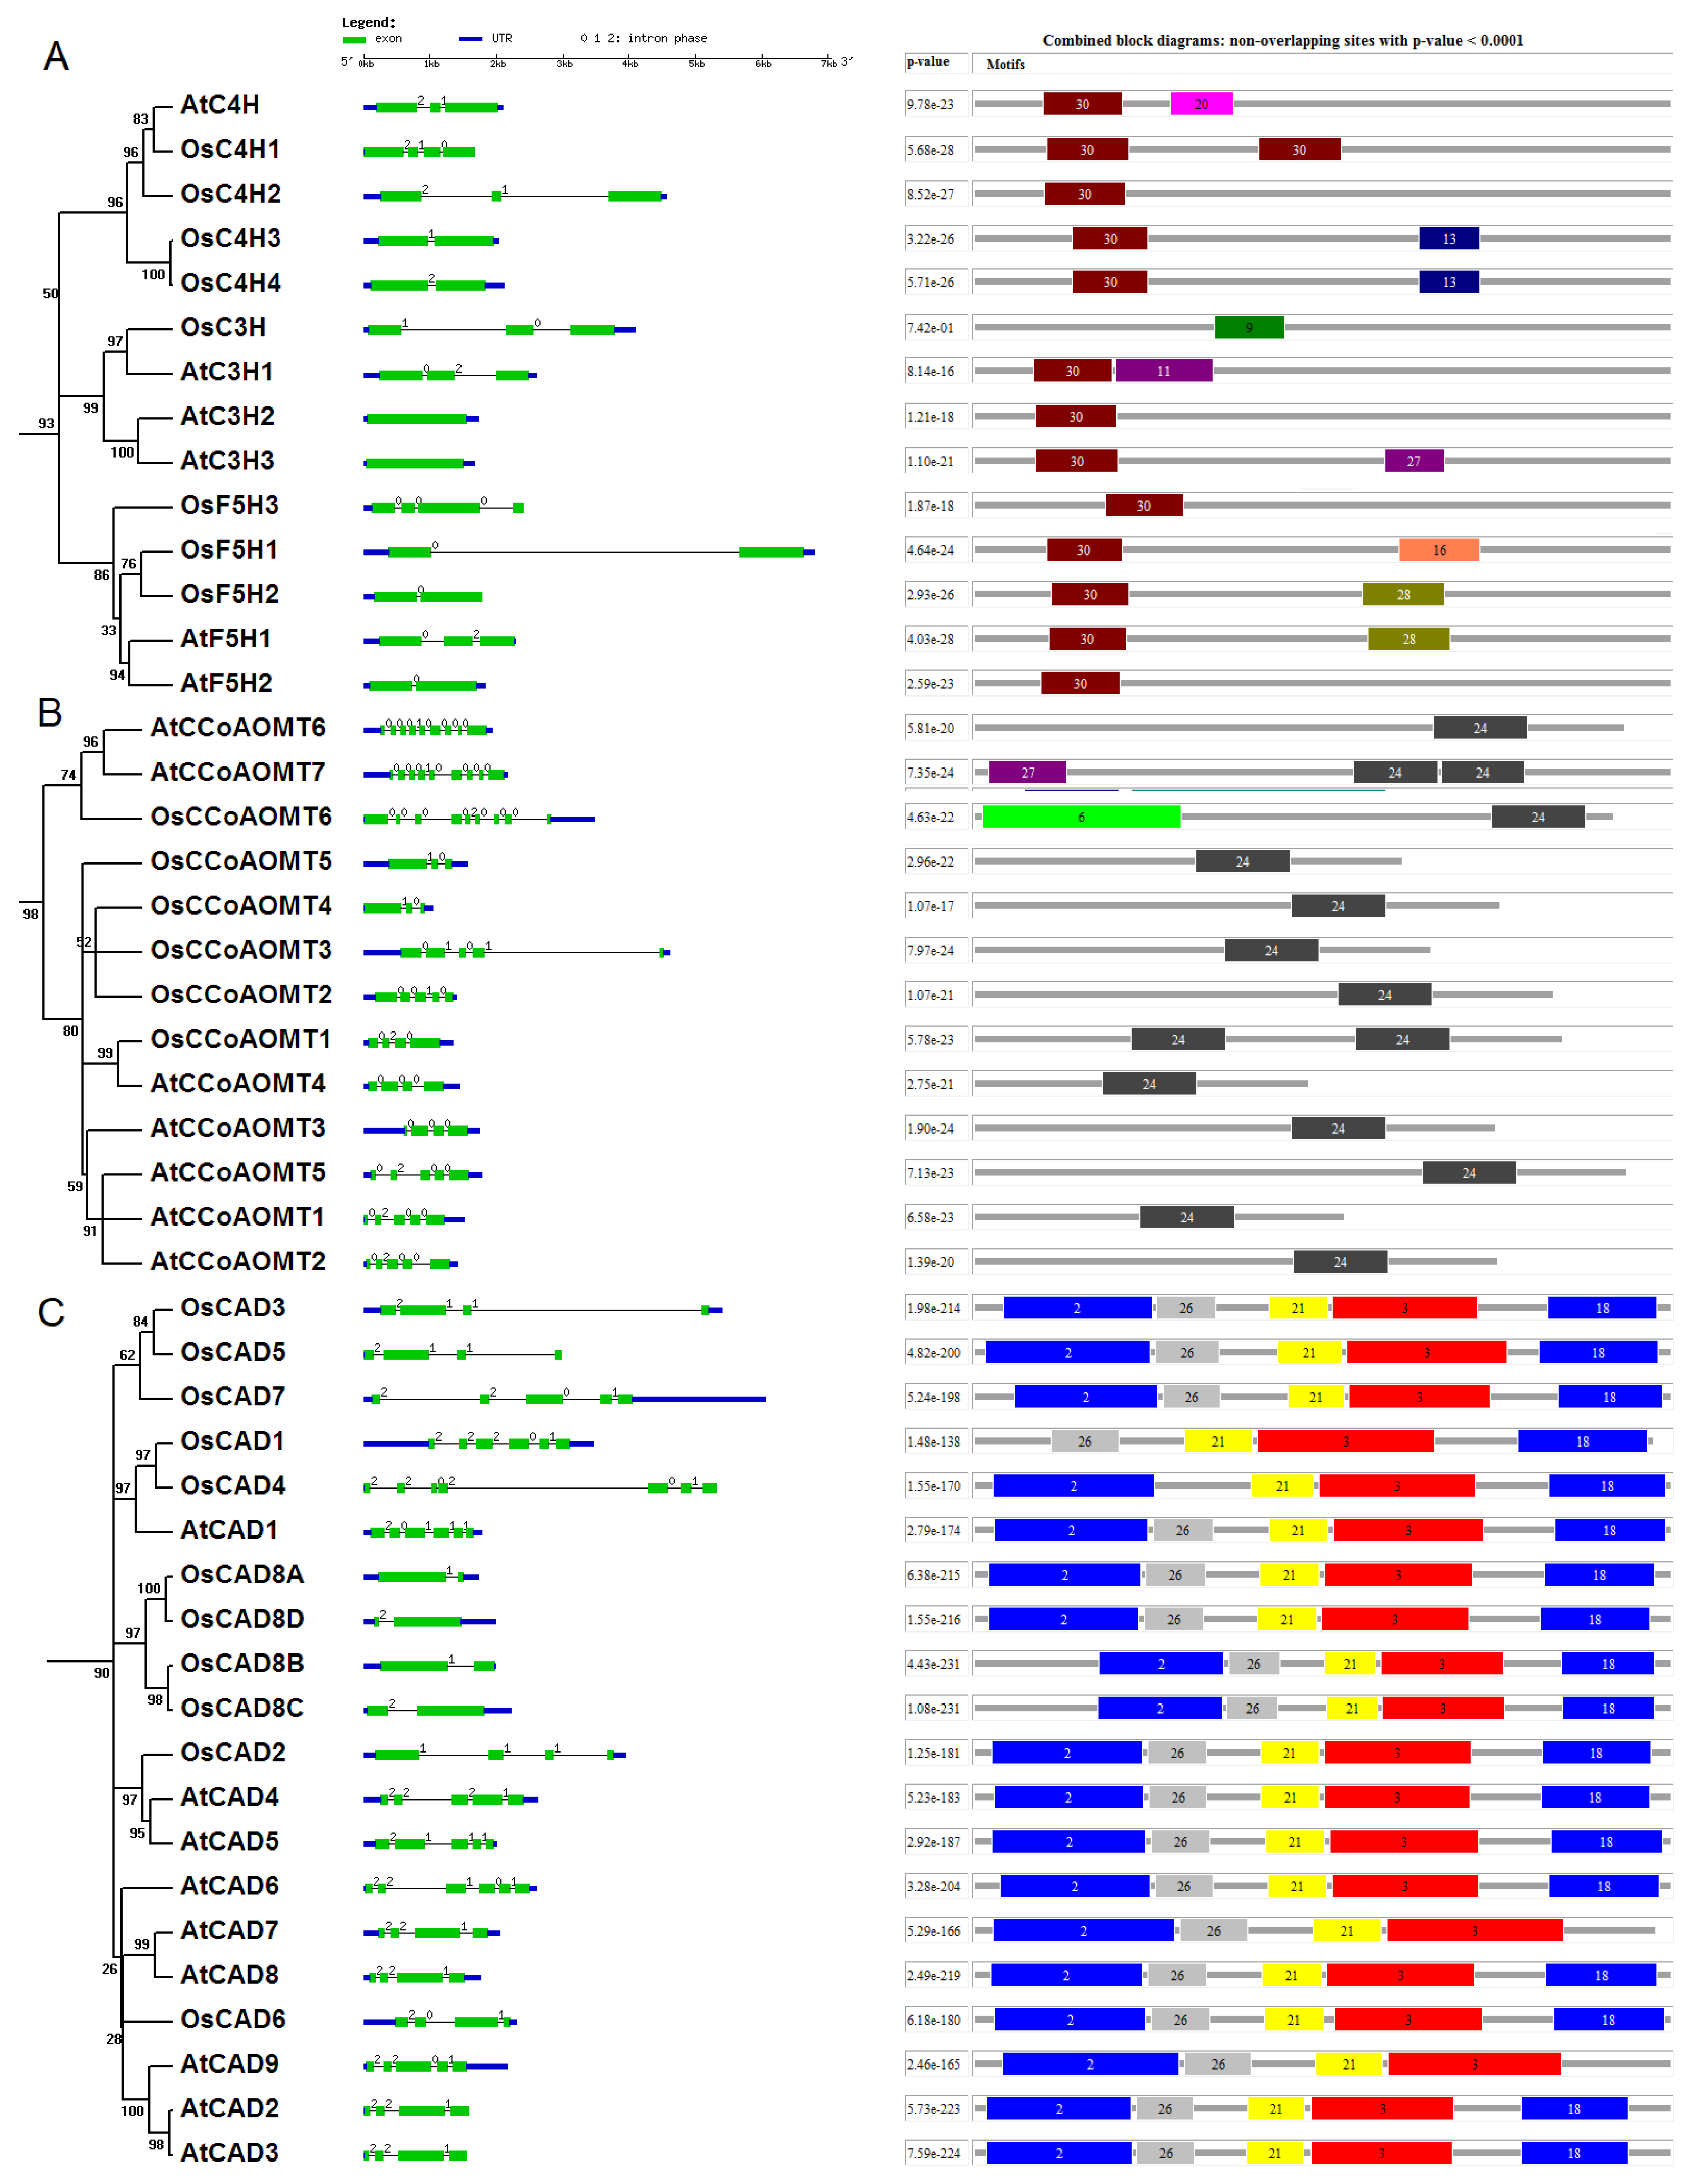
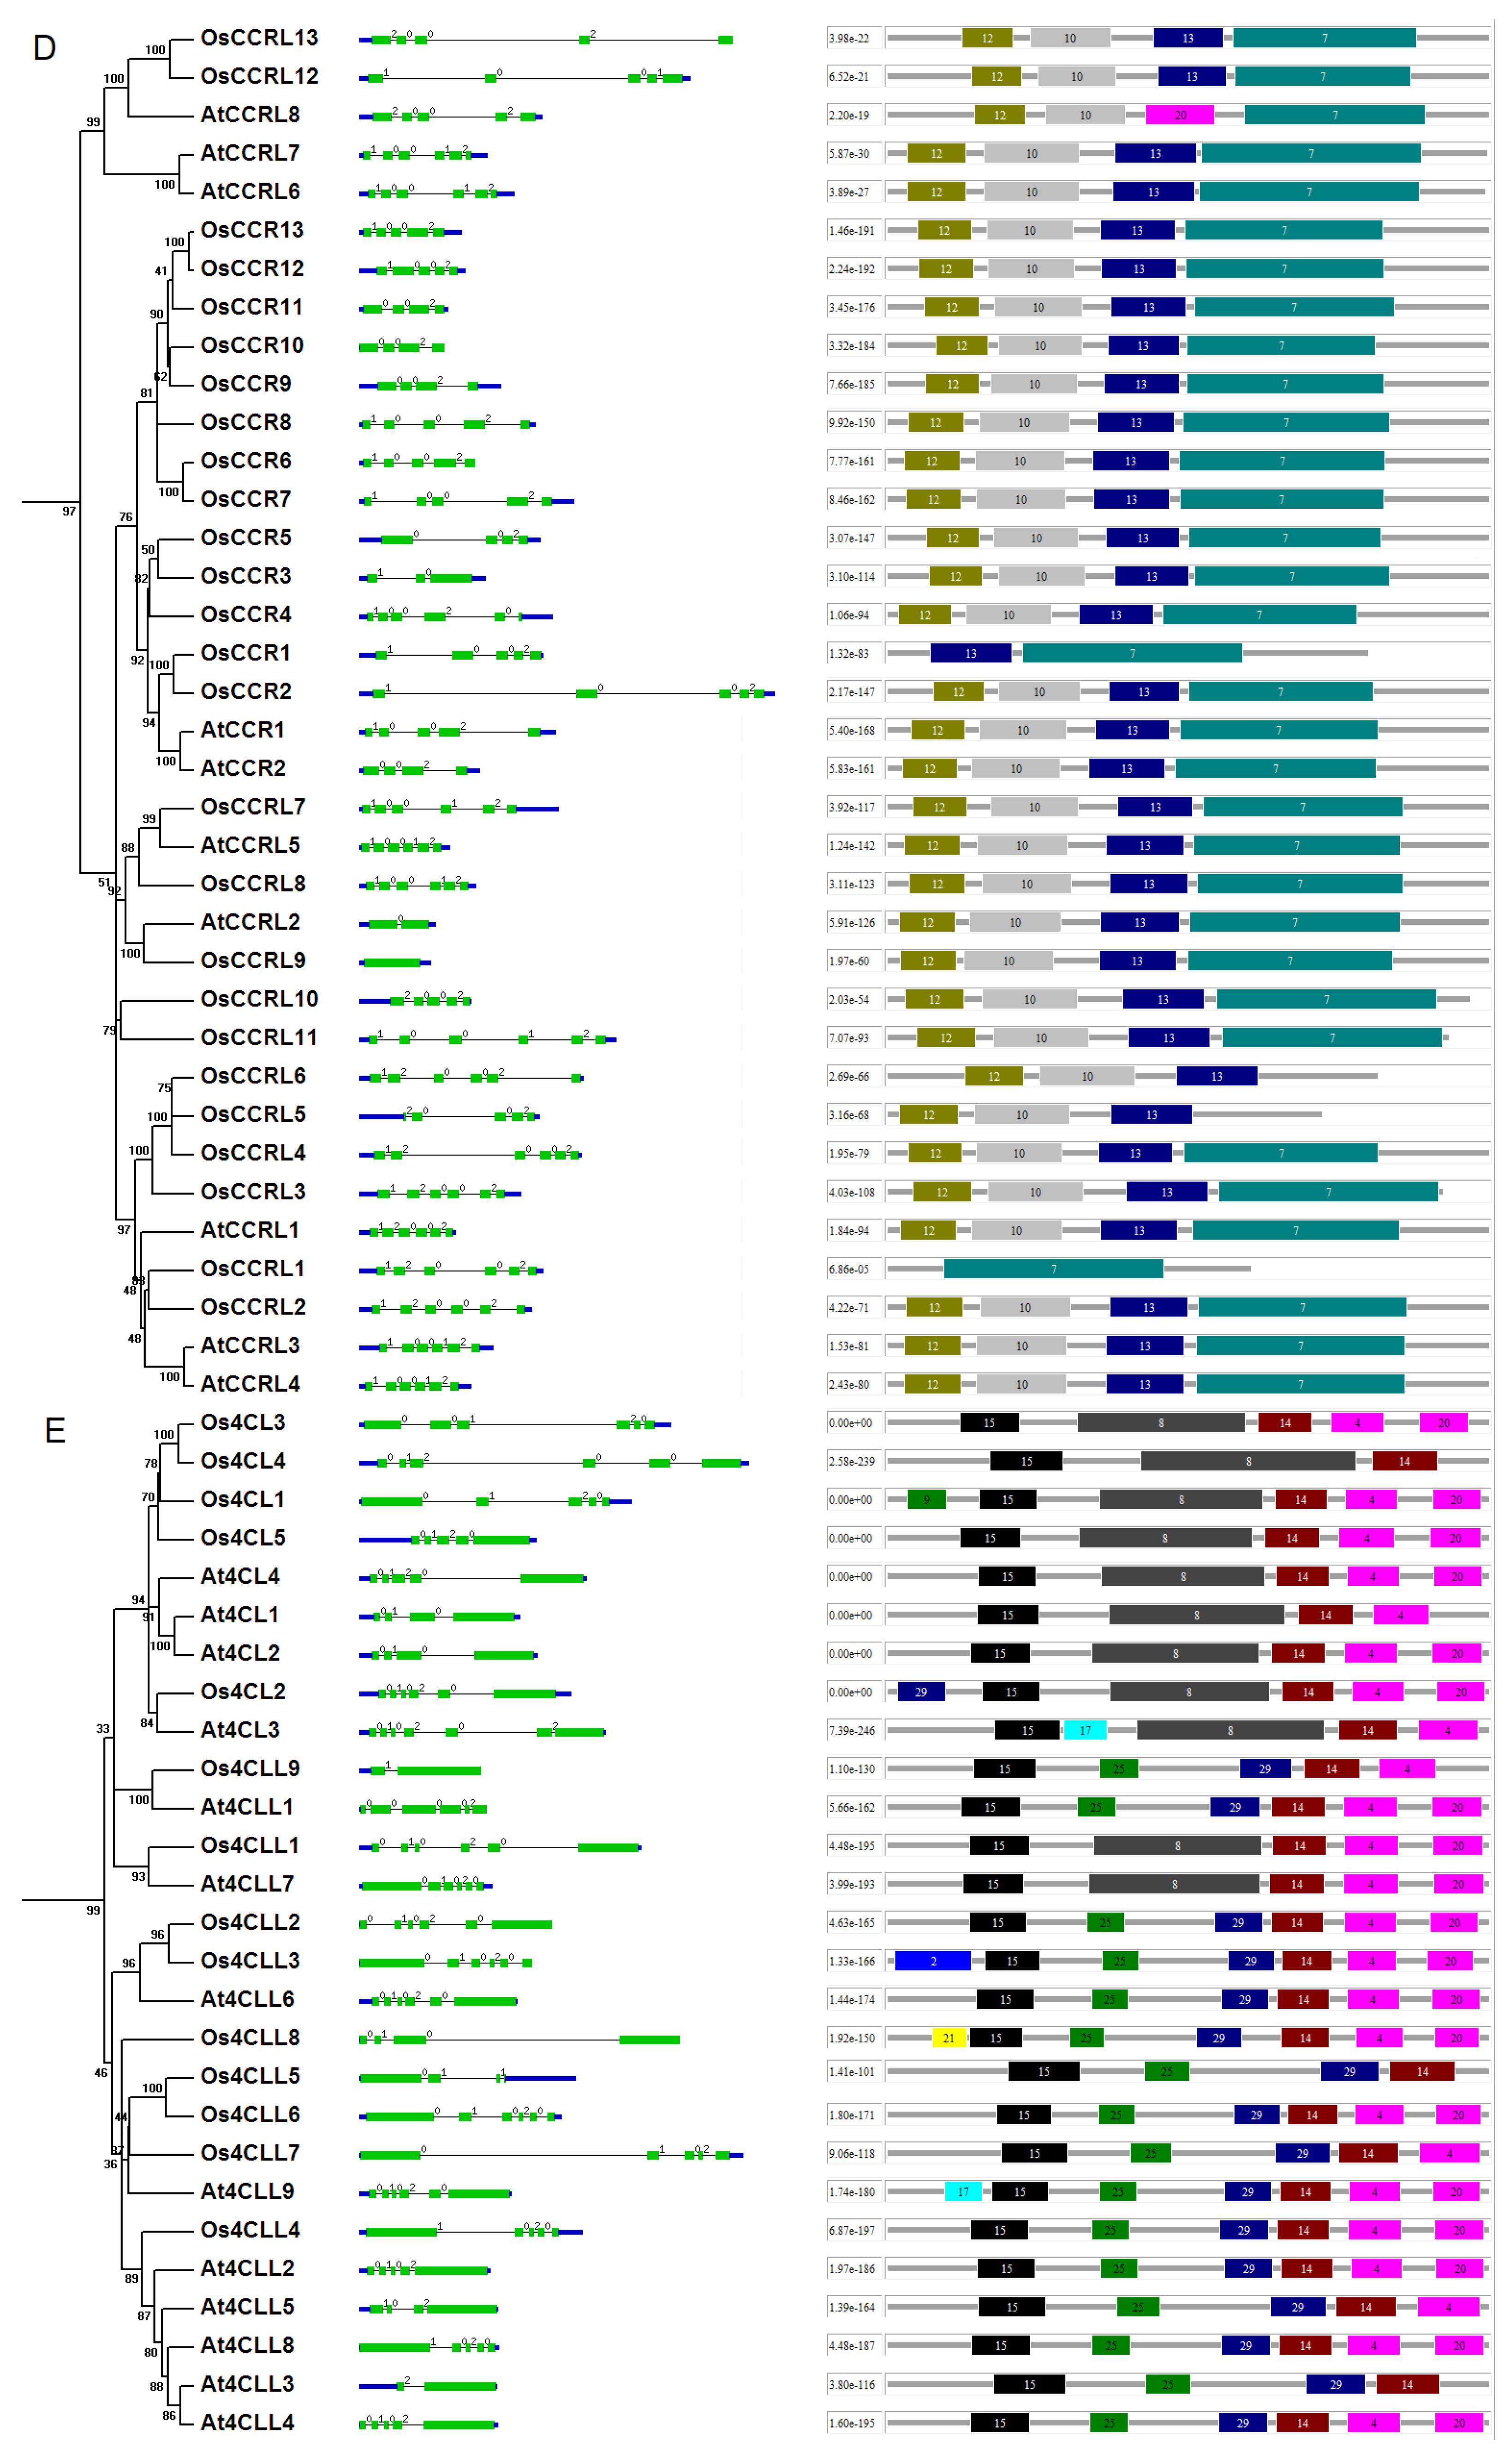
4.2. Phylogenetic Analyses and Motif Identification
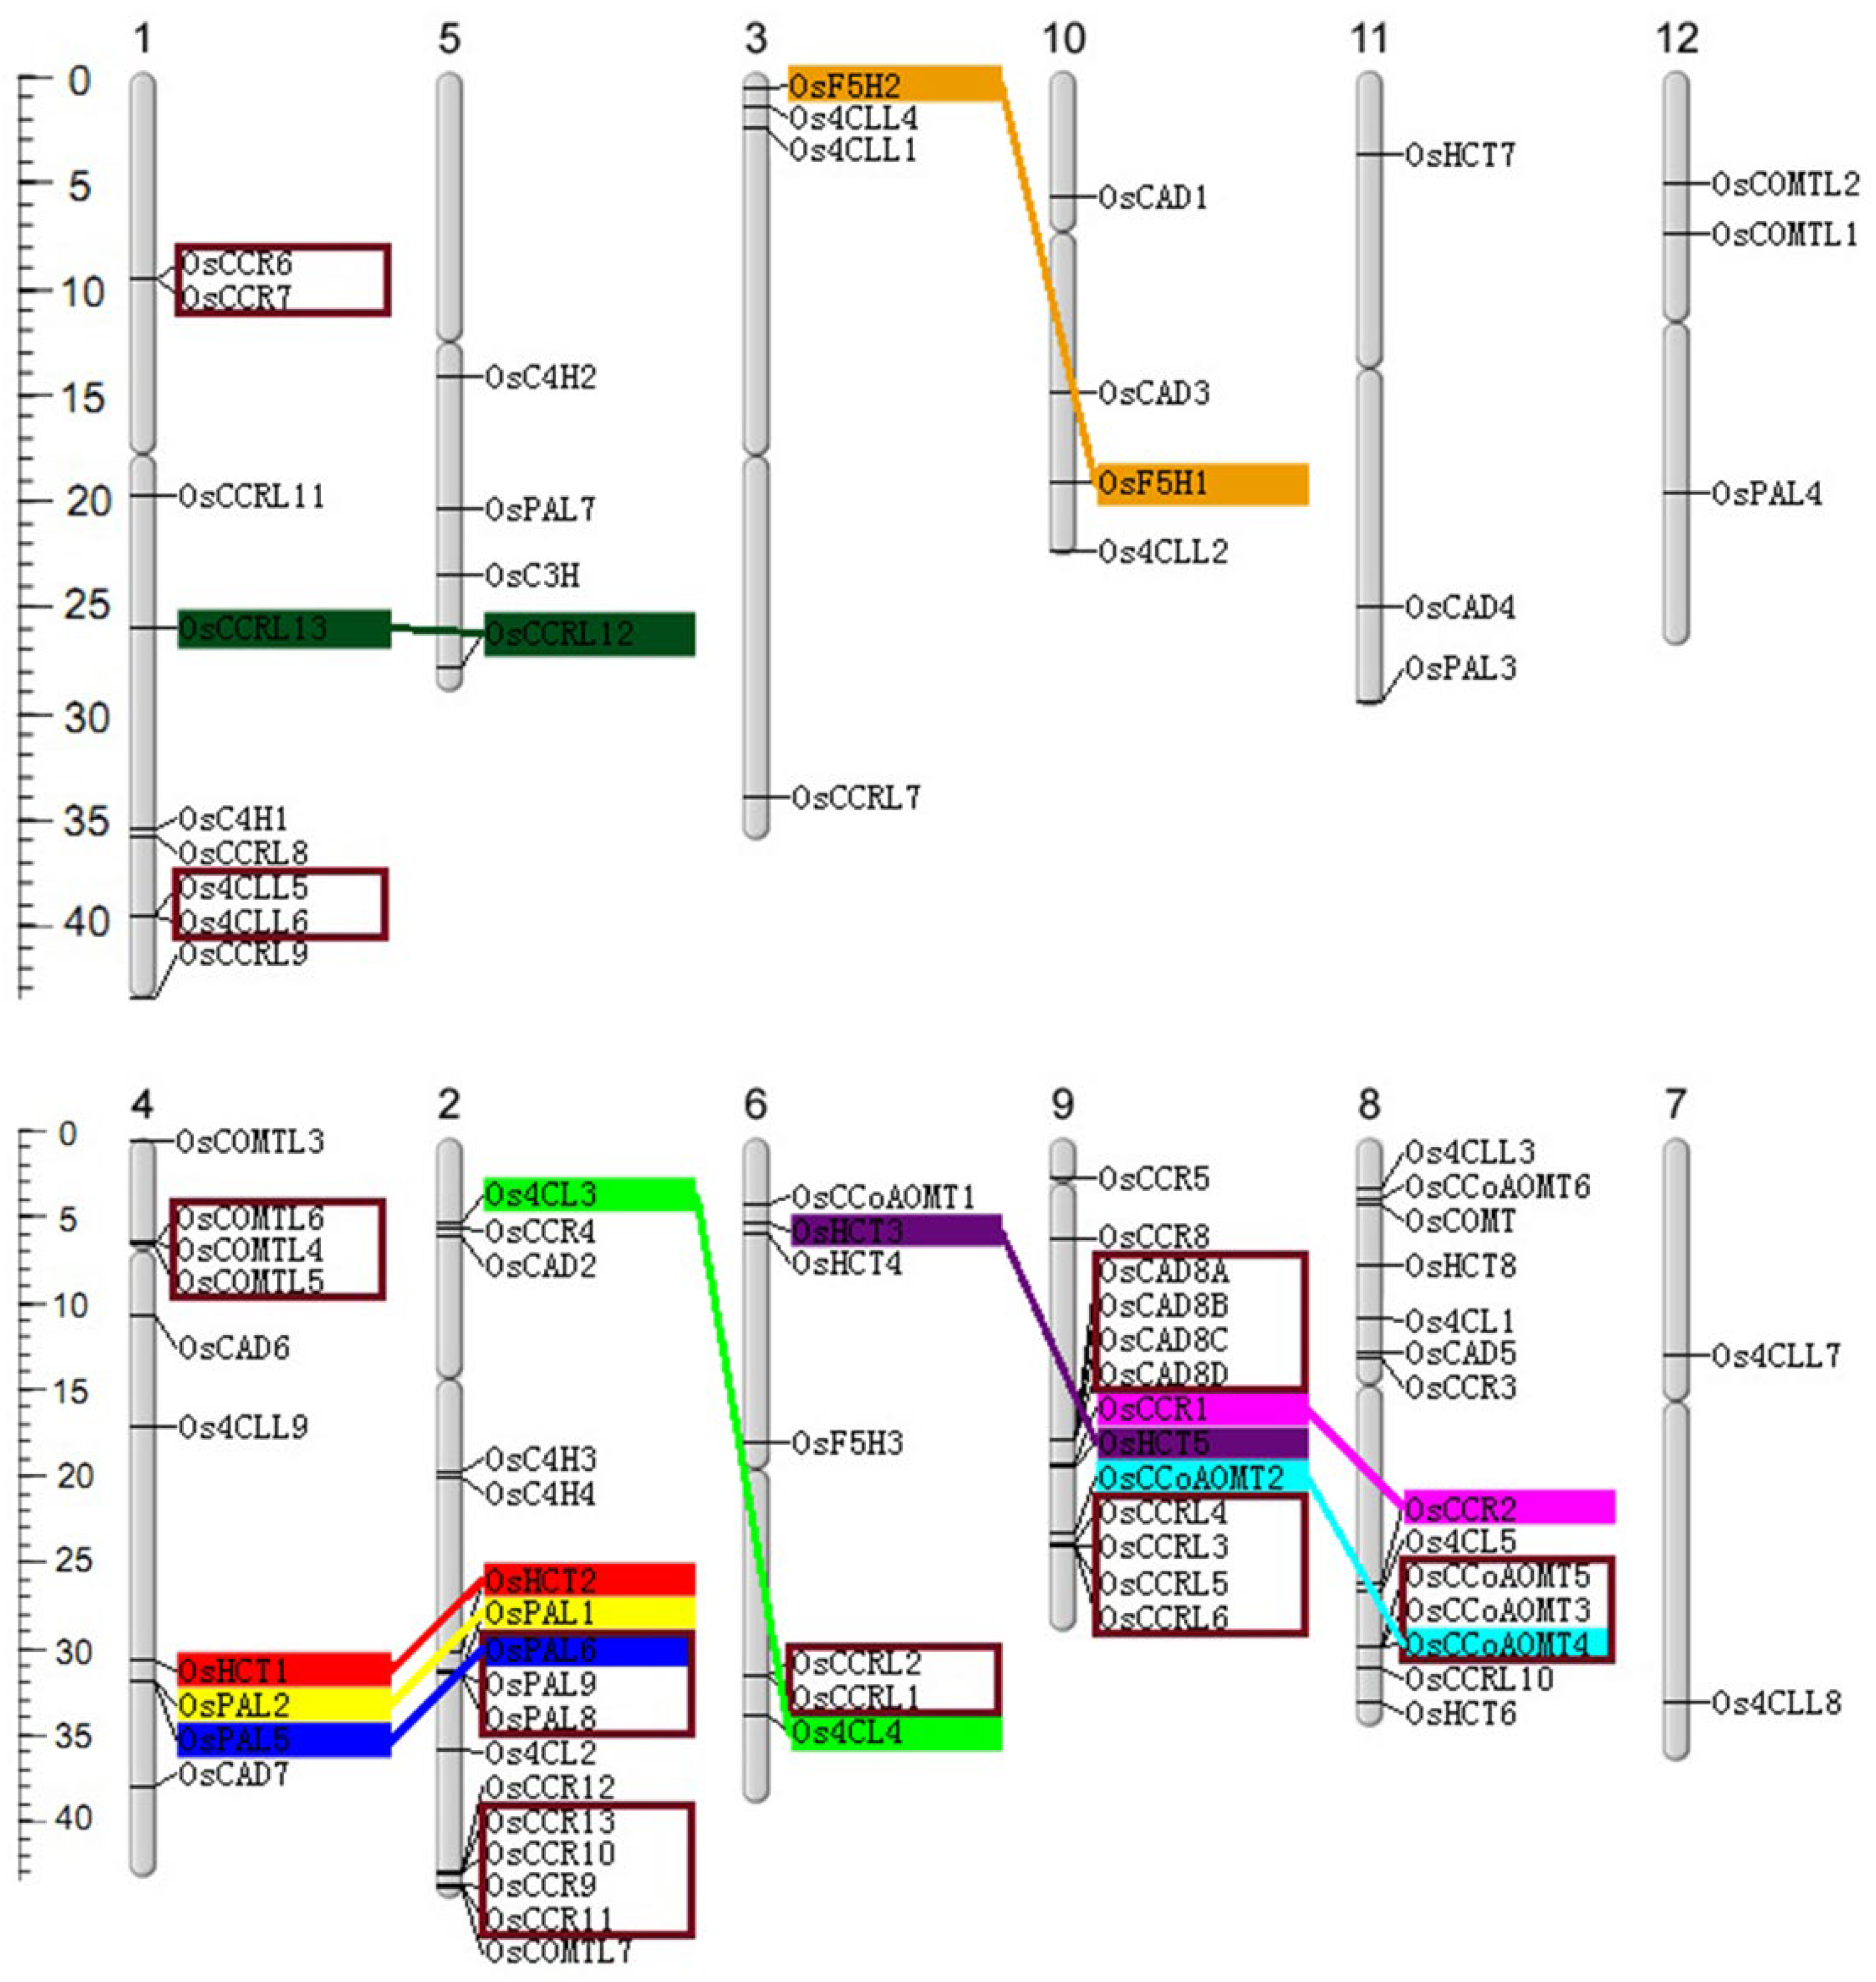
4.3. Chromosomal Localization and Gene Duplication Analysis
4.4. Genome-Wide Expression Analysis of Lignin-Related Genes in Rice and Arabidopsis
4.5. Cultivation of Plant Materials, Sample Collection and Pretreatments
4.6. Lignin Monomer Determination by HPLC and Statistical Analysis
4.7. Real-time PCR Assays of Twenty-Seven Lignin Biosynthesis Genes
4.7. Calculation of Significant Association between Qpcr Gene Expression and Lignin Monomer Contents
5. Conclusion
Conflicts of Interest
References
- Liu, Q.; Luo, L.; Zheng, L. Lignins: Biosynthesis and Biological Functions in Plants. Int. J. Mol. Sci. 2018, 19. [Google Scholar] [CrossRef]
- Xie, M.; Zhang, J.; Tschaplinski, T.J.; Tuskan, G.A.; Chen, J.-G.; Muchero, W. Regulation of Lignin Biosynthesis and Its Role in Growth-Defense Tradeoffs. Front. Plant Sci. 2018, 9. [Google Scholar] [CrossRef]
- Weng, J.-K.; Chapple, C. The origin and evolution of lignin biosynthesis. New Phytol. 2010, 187, 273–285. [Google Scholar] [CrossRef]
- Zhang, Q.; Wang, L.; Wang, Z.; Zhang, R.; Liu, P.; Liu, M.; Liu, Z.; Zhao, Z.; Wang, L.; Chen, X.; et al. The regulation of cell wall lignification and lignin biosynthesis during pigmentation of winter jujube. Hortic. Res. 2021, 8, 238. [Google Scholar] [CrossRef]
- Chebli, Y.; Bidhendi, A.J.; Kapoor, K.; Geitmann, A. Cytoskeletal regulation of primary plant cell wall assembly. Curr. Biol. 2021, 31, R681–R695. [Google Scholar] [CrossRef]
- Saberi Riseh, R.; Fathi, F.; Lagzian, A.; Vatankhah, M.; Kennedy, J.F. Modifying lignin: A promising strategy for plant disease control. Int. J. Biol. Macromol. 2024, 271, 132696. [Google Scholar] [CrossRef]
- Vanholme, R.; De Meester, B.; Ralph, J.; Boerjan, W. Lignin biosynthesis and its integration into metabolism. Curr. Opin. Biotechnol. 2019, 56, 230–239. [Google Scholar] [CrossRef]
- GUO, Y.; XU, H.; ZHAO, Y.; WU, H.; LIN, J. Plant lignification and its regulation. Sci. Sin. Vitae 2020, 50, 111–122. [Google Scholar] [CrossRef]
- Raes, J.; Rohde, A.; Christensen, J.H.; Van de Peer, Y.; Boerjan, W. Genome-wide characterization of the lignification toolbox in Arabidopsis. Plant Physiol. 2003, 133, 1051–1071. [Google Scholar] [CrossRef]
- Ferreira, S.S.; Simões, M.S.; Carvalho, G.G.; de Lima, L.G.A.; Svartman, R.M. de A.; Cesarino, I. The lignin toolbox of the model grass Setaria viridis. Plant Mol. Biol. 2019, 101, 235–255. [Google Scholar] [CrossRef]
- Cao, Y.; Li, X.; Jiang, L. Integrative Analysis of the Core Fruit Lignification Toolbox in Pear Reveals Targets for Fruit Quality Bioengineering. Biomolecules 2019, 9. [Google Scholar] [CrossRef]
- Wang, Z.; Yao, X.; Jia, C.; Xu, B.; Wang, J.; Liu, J.; Jin, Z. Identification and analysis of lignin biosynthesis genes related to fruit ripening and stress response in banana (Musa acuminata L. AAA group, cv. Cavendish). Front. Plant Sci. 2023, 14. [Google Scholar] [CrossRef]
- Wang, S.; Wang, X.; Yue, L.; Li, H.; Zhu, L.; Dong, Z.; Long, Y. Genome-Wide Identification and Characterization of Lignin Synthesis Genes in Maize. Int. J. Mol. Sci. 2024, 25. [Google Scholar] [CrossRef]
- Carocha, V.; Soler, M.; Hefer, C.; Cassan-Wang, H.; Fevereiro, P.; Myburg, A.A.; Paiva, J.A.P.; Grima-Pettenati, J. Genome-wide analysis of the lignin toolbox of Eucalyptus grandis. New Phytol. 2015, 206, 1297–1313. [Google Scholar] [CrossRef]
- Mohidem, N.A.; Hashim, N.; Shamsudin, R.; Che Man, H. Rice for Food Security: Revisiting Its Production, Diversity, Rice Milling Process and Nutrient Content. Agriculture 2022, 12. [Google Scholar] [CrossRef]
- Li, Y.; Xiao, J.; Chen, L.; Huang, X.; Cheng, Z.; Han, B.; Zhang, Q.; Wu, C. Rice Functional Genomics Research: Past Decade and Future. Mol. Plant 2018, 11, 359–380. [Google Scholar] [CrossRef]
- Xu, Z.; Zhang, D.; Hu, J.; Zhou, X.; Ye, X.; Reichel, K.L.; Stewart, N.R.; Syrenne, R.D.; Yang, X.; Gao, P.; et al. Comparative genome analysis of lignin biosynthesis gene families across the plant kingdom. BMC Bioinformatics 2009, 10, S3. [Google Scholar] [CrossRef]
- Haas, K.T.; Peaucelle, A. From monocots to dicots: the multifold aspect of cell wall expansion. J. Exp. Bot. 2021, 72, 1511–1513. [Google Scholar] [CrossRef]
- Zhao, K.; Lin, F.; Romero-Gamboa, S.P.; Saha, P.; Goh, H.-J.; An, G.; Jung, K.-H.; Hazen, S.P.; Bartley, L.E. Rice Genome-Scale Network Integration Reveals Transcriptional Regulators of Grass Cell Wall Synthesis. Front. Plant Sci. 2019, 10. [Google Scholar] [CrossRef] [PubMed]
- Wu, Z.; Wang, N.; Hisano, H.; Cao, Y.; Wu, F.; Liu, W.; Bao, Y.; Wang, Z.-Y.; Fu, C. Simultaneous regulation of F5H in COMT-RNAi transgenic switchgrass alters effects of suppression on syringyl lignin biosynthesis. Plant Biotechnol. J. 2019, 17, 836–845. [Google Scholar] [CrossRef]
- Tetreault, H.M.; Gries, T.; Palmer, N.A.; Funnell-Harris, D.L.; Sato, S.; Ge, Z.; Sarath, G.; Sattler, S.E. Overexpression of ferulate 5-hydroxylase increases syringyl units in Sorghum bicolor. Plant Mol. Biol. 2020, 103, 269–285. [Google Scholar] [CrossRef] [PubMed]
- Hirano, K.; Aya, K.; Kondo, M.; Okuno, A.; Morinaka, Y.; Matsuoka, M. OsCAD2 is the major CAD gene responsible for monolignol biosynthesis in rice culm. Plant Cell Rep. 2012, 31, 91–101. [Google Scholar] [CrossRef] [PubMed]
- Zhang, K.; Qian, Q.; Huang, Z.; Wang, Y.; Li, M.; Hong, L.; Zeng, D.; Gu, M.; Chu, C.; Cheng, Z. GOLD HULL AND INTERNODE2 Encodes a Primarily Multifunctional Cinnamyl-Alcohol Dehydrogenase in Rice. Plant Physiol. 2006, 140, 972–983. [Google Scholar] [CrossRef] [PubMed]
- Zhang, G.; Wang, L.; Li, X.; Bai, S.; Xue, Y.; Li, Z.; Tang, S.; Wang, Y.; Wang, Y.; Hu, Z.; et al. Distinctively altered lignin biosynthesis by site-modification of OsCAD2 for enhanced biomass saccharification in rice. GCB Bioenergy 2021, 13, 305–319. [Google Scholar] [CrossRef]
- Li, X.; Yang, Y.; Yao, J.; Chen, G.; Li, X.; Zhang, Q.; Wu, C. FLEXIBLE CULM 1 encoding a cinnamyl-alcohol dehydrogenase controls culm mechanical strength in rice. Plant Mol. Biol. 2009, 69, 685–697. [Google Scholar] [CrossRef]
- Li, W.; Wang, K.; Chern, M.; Liu, Y.; Zhu, Z.; Liu, J.; Zhu, X.; Yin, J.; Ran, L.; Xiong, J.; et al. Sclerenchyma cell thickening through enhanced lignification induced by OsMYB30 prevents fungal penetration of rice leaves. New Phytol. 2020, 226, 1850–1863. [Google Scholar] [CrossRef] [PubMed]
- Yang, C.; Shen, S.; Zhou, S.; Li, Y.; Mao, Y.; Zhou, J.; Shi, Y.; An, L.; Zhou, Q.; Peng, W.; et al. Rice metabolic regulatory network spanning the entire life cycle. Mol. Plant 2022, 15, 258–275. [Google Scholar] [CrossRef]
- Afifi, O.A.; Tobimatsu, Y.; Lam, P.Y.; Martin, A.F.; Miyamoto, T.; Osakabe, Y.; Osakabe, K.; Umezawa, T. Genome-edited rice deficient in two 4-COUMARATE:COENZYME A LIGASE genes displays diverse lignin alterations. Plant Physiol. 2022, 190, 2155–2172. [Google Scholar] [CrossRef]
- Stewart, J.J.; Akiyama, T.; Chapple, C.; Ralph, J.; Mansfield, S.D. The Effects on Lignin Structure of Overexpression of Ferulate 5-Hydroxylase in Hybrid Poplar1. Plant Physiol. 2009, 150, 621–635. [Google Scholar] [CrossRef]
- Zhao, H.; Sheng, Q.; Lü, S.; Wang, T.; Song, Y. Characterization of three riceCCoAOMT genes. Chinese Sci. Bull. 2004, 49, 1602–1606. [Google Scholar] [CrossRef]
- Ibrahim, R.K.; Bruneau, A.; Bantignies, B. Plant O-methyltransferases: molecular analysis, common signature and classification. Plant Mol. Biol. 1998, 36, 1–10. [Google Scholar] [CrossRef] [PubMed]
- Eudes, A.; Pollet, B.; Sibout, R.; Do, C.-T.; Séguin, A.; Lapierre, C.; Jouanin, L. Evidence for a role of AtCAD 1 in lignification of elongating stems of Arabidopsis thaliana. Planta 2006, 225, 23–39. [Google Scholar] [CrossRef]
- Sibout, R.; Baucher, M.; Gatineau, M.; Van Doorsselaere, J.; Mila, I.; Pollet, B.; Maba, B.; Pilate, G.; Lapierre, C.; Boerjan, W.; et al. Expression of a poplar cDNA encoding a ferulate-5-hydroxylase/coniferaldehyde 5-hydroxylase increases S lignin deposition in Arabidopsis thaliana. Plant Physiol. Biochem. 2002, 40, 1087–1096. [Google Scholar] [CrossRef]
- Hu, Z.; Zhang, G.; Muhammad, A.; Samad, R.A.; Wang, Y.; Walton, J.D.; He, Y.; Peng, L.; Wang, L. Genetic loci simultaneously controlling lignin monomers and biomass digestibility of rice straw. Sci. Rep. 2018, 8, 3636. [Google Scholar] [CrossRef]
- Harris, B.D.; Crow, M.; Fischer, S.; Gillis, J. Single-cell co-expression analysis reveals that transcriptional modules are shared across cell types in the brain. Cell Syst. 2021, 12, 748–756. [Google Scholar] [CrossRef]
- Zhao, Q.; Dixon, R.A. Transcriptional networks for lignin biosynthesis: more complex than we thought? Trends Plant Sci. 2011, 16, 227–233. [Google Scholar] [CrossRef]
- Shi, R.; Sun, Y.-H.; Li, Q.; Heber, S.; Sederoff, R.; Chiang, V.L. Towards a systems approach for lignin biosynthesis in Populus trichocarpa: transcript abundance and specificity of the monolignol biosynthetic genes. Plant Cell Physiol. 2010, 51, 144–163. [Google Scholar] [CrossRef]
- Li, Y.; Kim, J.I.; Pysh, L.; Chapple, C. Four Isoforms of Arabidopsis 4-Coumarate:CoA Ligase Have Overlapping yet Distinct Roles in Phenylpropanoid Metabolism. Plant Physiol. 2015, 169, 2409–2421. [Google Scholar] [CrossRef]
- Liu, X.; Luo, Y.; Wu, H.; Xi, W.; Yu, J.; Zhang, Q.; Zhou, Z. Systematic analysis of O-methyltransferase gene family and identification of potential members involved in the formation of O-methylated flavonoids in Citrus. Gene 2016, 575, 458–472. [Google Scholar] [CrossRef]
- Vanholme, R.; Morreel, K.; Darrah, C.; Oyarce, P.; Grabber, J.H.; Ralph, J.; Boerjan, W. Metabolic engineering of novel lignin in biomass crops. New Phytol. 2012, 196, 978–1000. [Google Scholar] [CrossRef]
- Dalmais, M.; Antelme, S.; Ho-Yue-Kuang, S.; Wang, Y.; Darracq, O.; d’Yvoire, M.B.; Cézard, L.; Légée, F.; Blondet, E.; Oria, N.; et al. A TILLING Platform for Functional Genomics in Brachypodium distachyon. PLoS One 2013, 8, e65503. [Google Scholar] [CrossRef] [PubMed]
- Koshiba, T.; Hirose, N.; Mukai, M.; Yamamura, M.; Hattori, T.; Suzuki, S.; Sakamoto, M.; Umezawa, T. Characterization of 5-Hydroxyconiferaldehyde O-Methyltransferase in Oryza sativa. Plant Biotechnol. 2013, 30, 157–167. [Google Scholar] [CrossRef]
- Barakat, A.; Bagniewska-Zadworna, A.; Choi, A.; Plakkat, U.; DiLoreto, D.S.; Yellanki, P.; Carlson, J.E. The cinnamyl alcohol dehydrogenase gene family in Populus: phylogeny, organization, and expression. BMC Plant Biol. 2009, 9, 26. [Google Scholar] [CrossRef]
- Goujon, T.; Ferret, V.; Mila, I.; Pollet, B.; Ruel, K.; Burlat, V.; Joseleau, J.-P.; Barrière, Y.; Lapierre, C.; Jouanin, L. Down-regulation of the AtCCR1 gene in Arabidopsis thaliana: effects on phenotype, lignins and cell wall degradability. Planta 2003, 217, 218–228. [Google Scholar] [CrossRef]
- Flagel, L.E.; Wendel, J.F. Gene duplication and evolutionary novelty in plants. New Phytol. 2009, 183, 557–564. [Google Scholar] [CrossRef]
- Jacquemin, J.; Laudié, M.; Cooke, R. A recent duplication revisited: phylogenetic analysis reveals an ancestral duplication highly-conserved throughout the Oryza genus and beyond. BMC Plant Biol. 2009, 9, 146. [Google Scholar] [CrossRef]
- Wang, L.; Guo, K.; Li, Y.; Tu, Y.; Hu, H.; Wang, B.; Cui, X.; Peng, L. Expression profiling and integrative analysis of the CESA/CSL superfamily in rice. BMC Plant Biol. 2010, 10, 282. [Google Scholar] [CrossRef]
- Liang, S.; Xu, S.; Qu, D.; Yang, L.; Wang, J.; Liu, H.; Xin, W.; Zou, D.; Zheng, H. Identification and Functional Analysis of the Caffeic Acid O-Methyltransferase (COMT) Gene Family in Rice (Oryza sativa L.). Int. J. Mol. Sci. 2022, 23. [Google Scholar] [CrossRef]
- Li, L.; Cheng, X.F.; Leshkevich, J.; Umezawa, T.; Harding, S.A.; Chiang, V.L. The Last Step of Syringyl Monolignol Biosynthesis in Angiosperms Is Regulated by a Novel Gene Encoding Sinapyl Alcohol Dehydrogenase. Plant Cell 2001, 13, 1567–1586. [Google Scholar] [CrossRef]
- Borah, P.; Khurana, J.P. The OsFBK1 E3 Ligase Subunit Affects Anther and Root Secondary Cell Wall Thickenings by Mediating Turnover of a Cinnamoyl-CoA Reductase. Plant Physiol. 2018, 176, 2148–2165. [Google Scholar] [CrossRef] [PubMed]
- Tamasloukht, B.; Wong Quai Lam, M.S.-J.; Martinez, Y.; Tozo, K.; Barbier, O.; Jourda, C.; Jauneau, A.; Borderies, G.; Balzergue, S.; Renou, J.-P.; et al. Characterization of a cinnamoyl-CoA reductase 1 (CCR1) mutant in maize: effects on lignification, fibre development, and global gene expression. J. Exp. Bot. 2011, 62, 3837–3848. [Google Scholar] [CrossRef]
- Tu, Y.; Rochfort, S.; Liu, Z.; Ran, Y.; Griffith, M.; Badenhorst, P.; Louie, G. V; Bowman, M.E.; Smith, K.F.; Noel, J.P.; et al. Functional Analyses of Caffeic Acid O-Methyltransferase and Cinnamoyl-CoA-Reductase Genes from Perennial Ryegrass (Lolium perenne). Plant Cell 2010, 22, 3357–3373. [Google Scholar] [CrossRef]
- Guo, D.; Chen, F.; Inoue, K.; Blount, J.W.; Dixon, R.A. Downregulation of Caffeic Acid 3-O-Methyltransferase and Caffeoyl CoA 3-O-Methyltransferase in Transgenic Alfalfa: Impacts on Lignin Structure and Implications for the Biosynthesis of G and S Lignin. Plant Cell 2001, 13, 73–88. [Google Scholar] [CrossRef]
- Tamura, K.; Stecher, G.; Kumar, S. MEGA11: Molecular Evolutionary Genetics Analysis Version 11. Mol. Biol. Evol. 2021, 38, 3022–3027. [Google Scholar] [CrossRef]
- Chen, C.; Chen, H.; Zhang, Y.; Thomas, H.R.; Frank, M.H.; He, Y.; Xia, R. TBtools: An integrative toolkit developed for interactive analyses of big biological data. Mol. Plant 2020, 13, 1194–1202. [Google Scholar] [CrossRef]
- Wu, L.; Zhang, M.; Zhang, R.; Yu, H.; Wang, H.; Li, J.; Wang, Y.; Hu, Z.; Wang, Y.; Luo, Z.; et al. Down-regulation of OsMYB103L distinctively alters beta-1,4-glucan polymerization and cellulose microfibers assembly for enhanced biomass enzymatic saccharification in rice. Biotechnol. Biofuels 2021, 14, 245. [Google Scholar] [CrossRef]
- Li, F.; Xie, G.; Huang, J.; Zhang, R.; Li, Y.; Zhang, M.; Wang, Y.; Li, A.; Li, X.; Xia, T.; et al. OsCESA9 conserved-site mutation leads to largely enhanced plant lodging resistance and biomass enzymatic saccharification by reducing cellulose DP and crystallinity in rice. Plant Biotechnol. J. 2017, 15, 1093–1104. [Google Scholar] [CrossRef]
- Hirano, K.; Kotake, T.; Kamihara, K.; Tsuna, K.; Aohara, T.; Kaneko, Y.; Takatsuji, H.; Tsumuraya, Y.; Kawasaki, S. Rice BRITTLE CULM 3 (BC3) encodes a classical dynamin OsDRP2B essential for proper secondary cell wall synthesis. Planta 2010, 232, 95–108. [Google Scholar] [CrossRef]
- Liu, S.; Zhao, L.; Liao, Y.; Luo, Z.; Wang, H.; Wang, P.; Zhao, H.; Xia, J.; Huang, C.-F. Dysfunction of the 4-coumarate:coenzyme A ligase 4CL4 impacts aluminum resistance and lignin accumulation in rice. Plant J. 2020, 104, 1233–1250. [Google Scholar] [CrossRef] [PubMed]
- Xu, N.; Zhang, W.; Ren, S.; Liu, F.; Zhao, C.; Liao, H.; Xu, Z.; Huang, J.; Li, Q.; Tu, Y.; et al. Hemicelluloses negatively affect lignocellulose crystallinity for high biomass digestibility under NaOH and H2SO4 pretreatments in Miscanthus. Biotechnol. Biofuels 2012, 5, 58. [Google Scholar] [CrossRef] [PubMed]
- Li, M.; Si, S.; Hao, B.; Zha, Y.; Wan, C.; Hong, S.; Kang, Y.; Jia, J.; Zhang, J.; Li, M.; et al. Mild alkali-pretreatment effectively extracts guaiacyl-rich lignin for high lignocellulose digestibility coupled with largely diminishing yeast fermentation inhibitors in Miscanthus. Bioresour. Technol. 2014, 169, 447–454. [Google Scholar] [CrossRef]
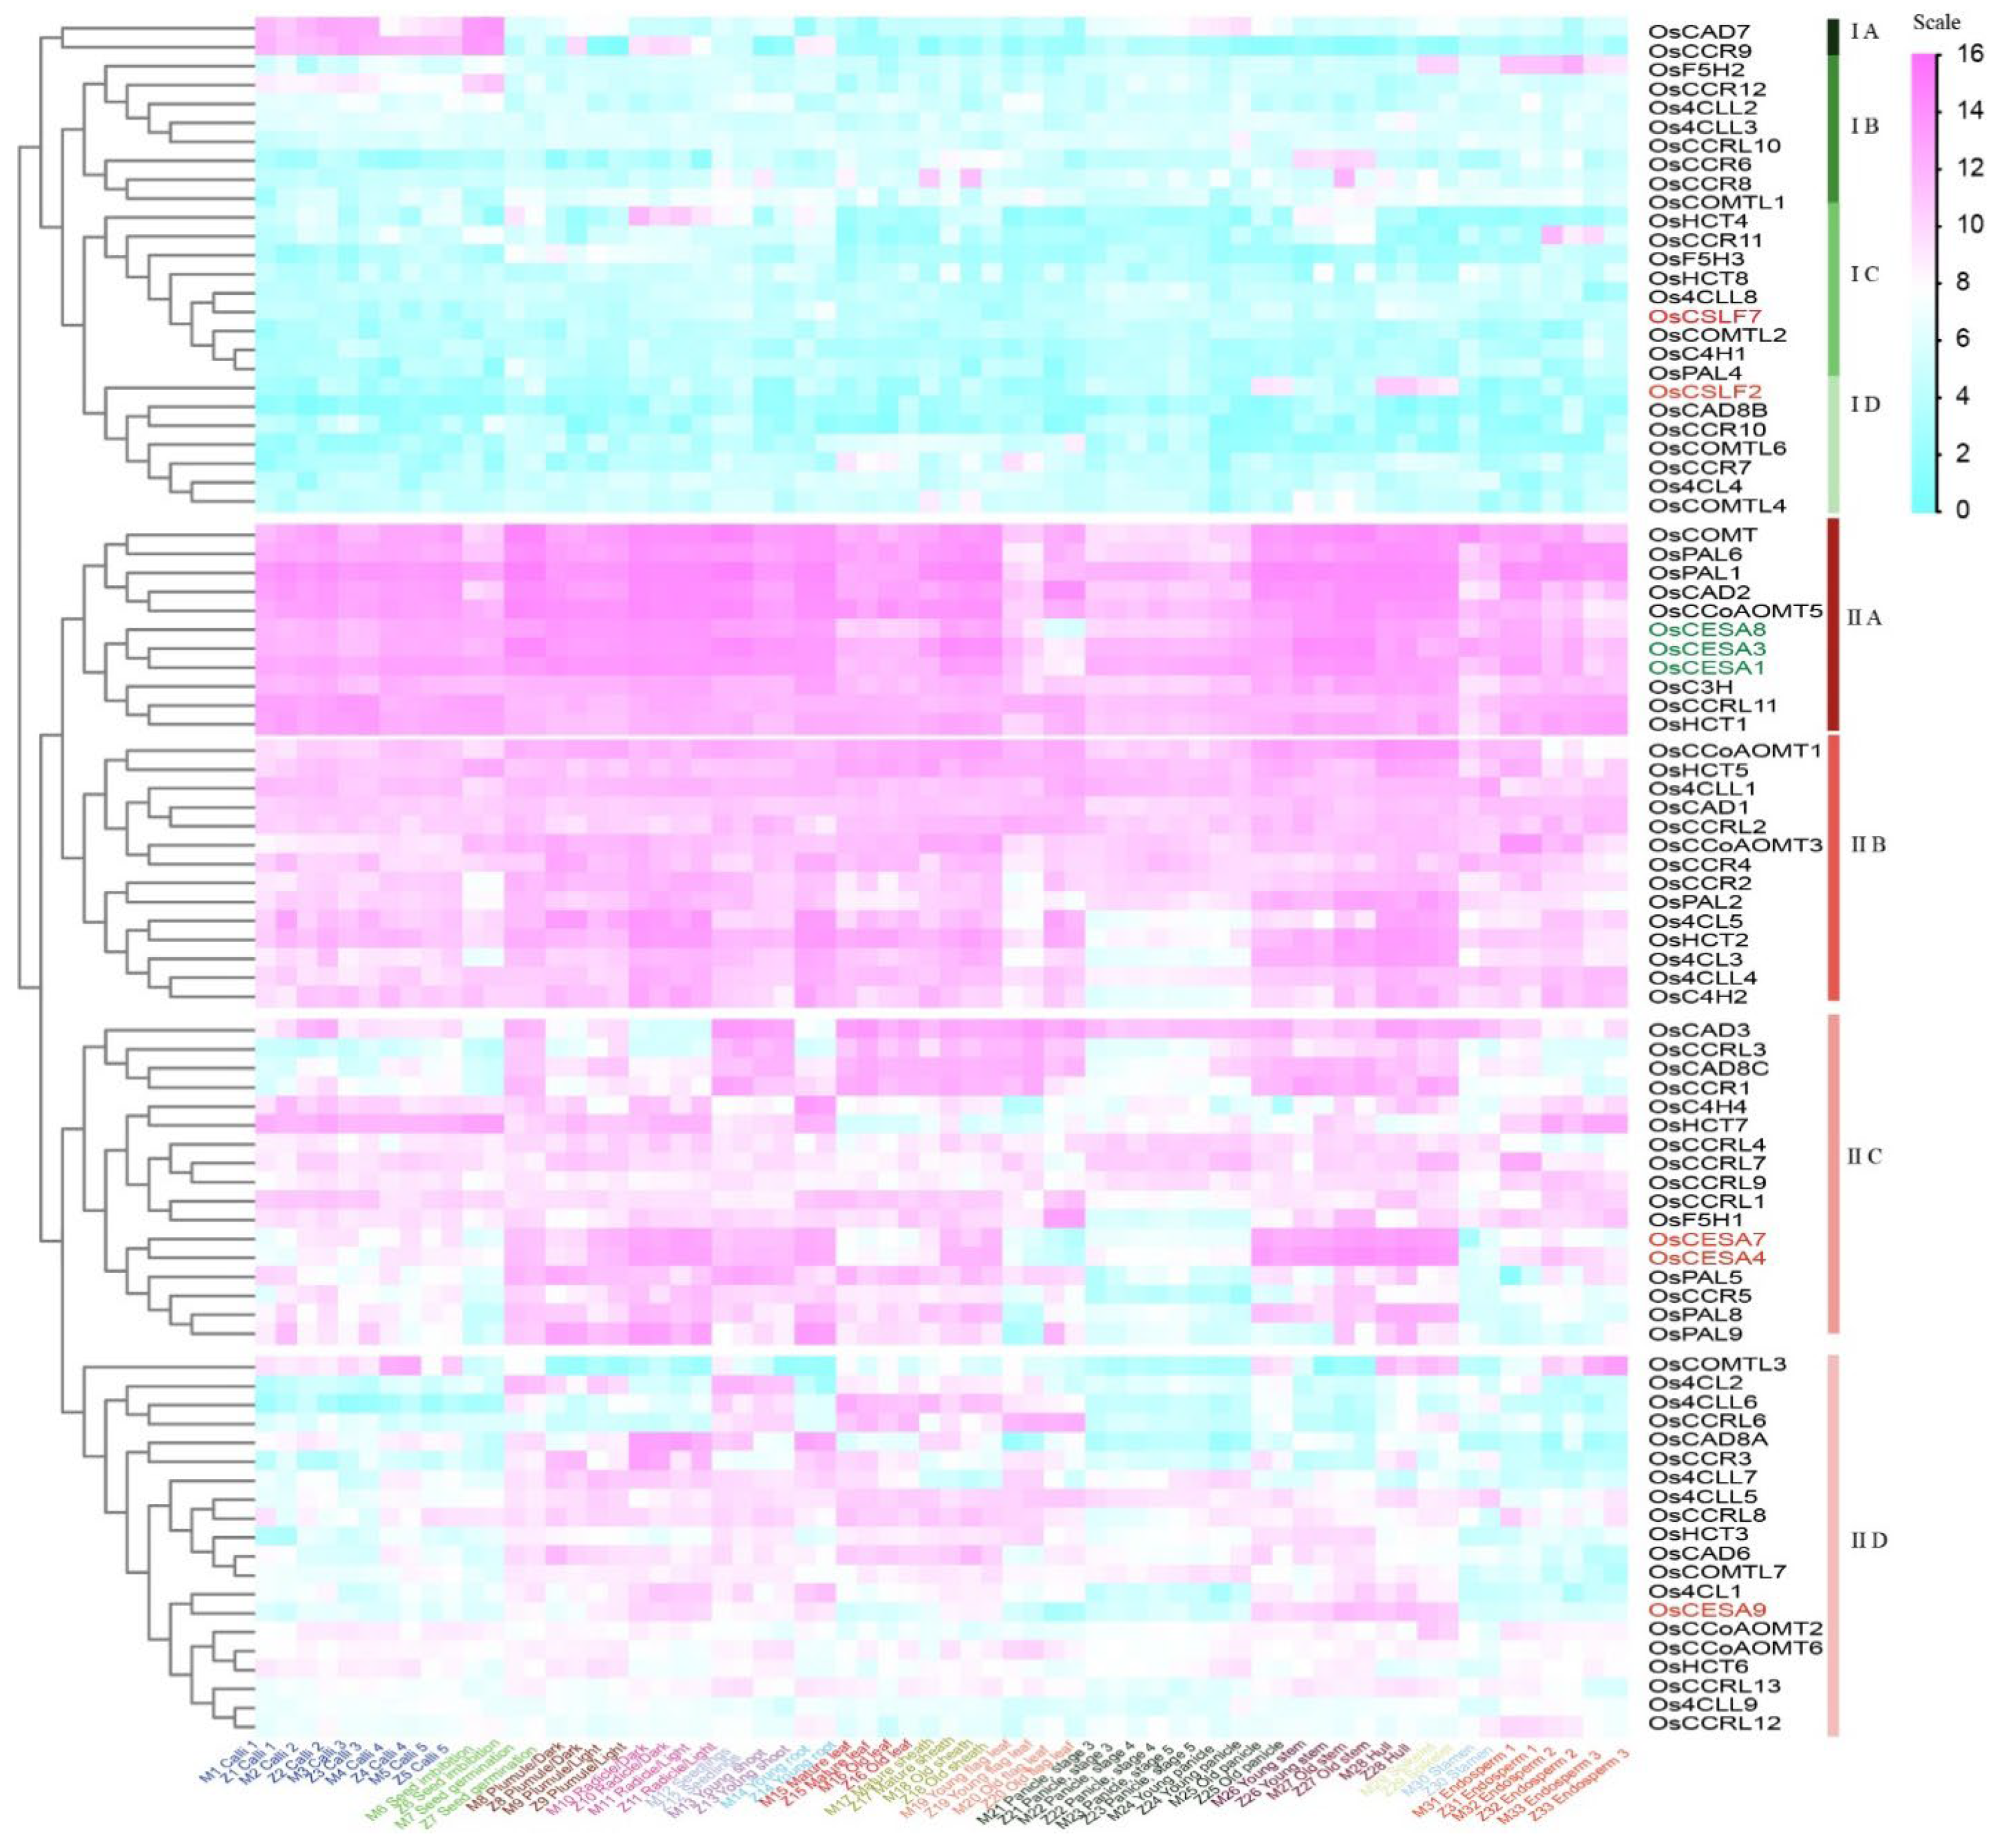
| Rice | Arabidopsis | ||||||||
| Groups | Tissues | Genes | Groups | Tissues | Genes | ||||
| Preferential expression in young vegetative tissues | |||||||||
| IA | Calli and Seed imbibition | Os4CLL2; OsCAD7; OsCCR9,10,12; OsHCT7 | / | / | / | ||||
| IB | Calli and Endosperm | Os4CLL3; OsCCRL1,11; OsHCT1 | / | / | / | ||||
| IIA | Radicle, Young root, Old stem, and Hull | Os4CL1,5; Os4CLL4,7; OsC4H2,4; OsCAD8A; OsCCR2,3,4,5; OsF5H3; OsHCT2,4; OsPAL9 | IIIC, IIID | Root | At4CL1,2; AtC3H1; AtC4H; AtCAD4,6; AtCCoAOMT3,4,6; AtCCR1,2; AtCOMT; AtCOMTL1,2,3,8; AtF5H2; AtHCT; AtPAL1,2,4 | ||||
| IIA, IIB | Seedlings, Young shoot, Old stem, and Leaf | Os4CL2,4; Os4CLL5,6; OsCAD3,6; OsCAD8B,8C; OsCCoAOMT6; OsCCR1,7; OsCCRL3,6,8; OsCOMTL1; OsHCT3; OsPAL5 | IID | Leaf and Whole plant | At4CLL9; AtCAD9; AtCCoAOMT7 | ||||
| IIB | Old flag leaf, 14 days after heading | Os4CLL1; OsCAD1; OsCCRL2; OsCOMTL6; OsF5H1; OsHCT5 | IIE, IIIC | Leaf | At4CL1,2,5; AtC3H1; AtC4H; AtCCoAOMT3,4; AtCCR1; AtCCRL4; AtCOMT; AtCOMTL4; AtF5H1; AtHCT; AtPAL1,2,3,4 | ||||
| IID | Endosperm | OsC4H1; OsCCR11; OsCCRL9; OsCOMTL3; OsF5H2 | / | / | / | ||||
| / | / | / | IIA | Seedlings and sepals | At4CLL6; AtCAD7,8; AtCCoAOMT1; AtCOMTL5 | ||||
| Preferential expression in reproductive stages | |||||||||
| IIA, IIB | Radicle, Young root, Old sheath, and Old panicle | Os4CL3; OsC3H; OsCAD2; OsCCoAOMT1,5; OsCCR6,8; OsCCRL13; OsCOMT; OsCOMTL4; OsHCT8; OsPAL1,2,6,8 | IIIA, IIIB, IIIC | Siliques and Seeds | At4CL1,2,4; At4CLL4,7; AtC3H1; AtC4H; AtCAD1,5; AtCCoAOMT3,4,5; AtCCR1; AtCCRL3,6; AtCOMT; AtCOMTL15; AtHCT; AtPAL1,2,4 | ||||
| IIC | Stamen, one day before flowering | Os4CLL8,9; OsCCoAOMT2,3; OsCCRL7,12; OsPAL4 | / | / | / | ||||
| IID | Young panicle, heading stage | OsCCRL4,10; OsCOMTL2,7; OsHCT6 | |||||||
| / | / | / | IB | Flowers stage9,10 | At4CLL1; AtCCoAOMT2; AtCCRL1 | ||||
| / | / | / | IC | Flowers and Siliques | At4CL3; AtCCRL5,7,8; AtCOMTL11 | ||||
| / | / | / | IIB | Flowers stage9,10,12 | AtC3H2,3; AtCAD3; AtCCRL2 | ||||
| / | / | / | IIC | Flowers stage15 and Stamen | At4CLL8; AtCOMTL6,12,13 | ||||
Disclaimer/Publisher’s Note: The statements, opinions and data contained in all publications are solely those of the individual author(s) and contributor(s) and not of MDPI and/or the editor(s). MDPI and/or the editor(s) disclaim responsibility for any injury to people or property resulting from any ideas, methods, instructions or products referred to in the content. |
© 2024 by the authors. Licensee MDPI, Basel, Switzerland. This article is an open access article distributed under the terms and conditions of the Creative Commons Attribution (CC BY) license (https://creativecommons.org/licenses/by/4.0/).


