
Submitted:
10 September 2024
Posted:
11 September 2024
You are already at the latest version
Abstract
This paper employs the Finite Element Method (FEM) to simulate and analyze the effects of corrosion defect parameters on the stress and failure pressure of pipelines. It investigates how the boundary conditions of the pipeline model influence stress and examines the sensitivity of failure pressure to corrosion defect parameters. A nonlinear regression equation has been developed from a dataset obtained through simulation experiments to predict the failure pressure of corroded pipelines. To validate the effects of corrosion defect parameters on failure pressure, a hydrostatic test platform for an API 5L X65 pipeline with corrosion defects was established to measure stress levels and failure pressures across varying corrosion defects. The study reveals that failure pressure is negatively correlated with corrosion length and depth, while positively correlated with corrosion width. Among these parameters, corrosion depth exerts a more significant influence on the pipeline's failure pressure than corrosion length and width. Within the range of corrosion defect parameters examined, the maximum deviation of the prediction equation's results from the simulation results is 8.71%, with an average deviation of 5.81%. The standard deviation of the fitted residuals is 0.01837. Additionally, the maximum deviation between the predicted results and experimental measurements is 8.39%, with an average deviation of 7.77%. The strong agreement between the predicted results from the equation and the actual measured data underscores the effectiveness of the nonlinear regression equation.
Keywords:
pipeline corrosion
; failure pressure prediction
; nonlinear regression equation
; hydraulic test
1. Introduction
With the continuous growth of global energy demand, oil and gas resources and their products are extensively utilized across various sectors of production and daily life, playing a vital role in the development of the national economy [1]. A significant number of steel pipelines serve as the primary means of transportation during the extraction and conveyance of oil and gas resources. According to incomplete statistics, pipelines account for 51% of global crude oil transportation, while water transport constitutes 45%, with the remaining 4% managed by rail and road transport [2,3]. As China develops its oil and gas resources, the construction of pipelines—often referred to as industrial arteries—has significantly increased. By the end of 2021, China had constructed approximately 150,000 kilometers of long-distance oil and gas pipelines, with around 5,414 kilometers newly built, reflecting a growth of 1,594 kilometers compared to 2020 [4]. Consequently, the reliability and safety of pipeline transportation for oil and gas have become increasingly important.
Due to the unique characteristics of oil and gas resources, incidents such as perforation leaks and explosions during pipeline transportation can result in economic losses and safety concerns [5,6]. Currently operational oil and gas pipelines, subjected to specific working environments, loads, and boundary conditions, are directly influenced by environmental factors such as seawater corrosion, nearshore debris impact, and geological stress. The damaging processes that threaten pipeline safety in these complex conditions exhibit significant randomness and interdependence [7,8]. Moreover, since the medium transported through oil and gas pipelines primarily consists of corrosive substances like natural gas, crude oil, and carbon dioxide, internal damage can also occur, further adding to the uncertainty of pipeline integrity [9,10]. A substantial body of research indicates that both the internal and external environments of pipelines make them vulnerable to corrosion, which is one of the most prevalent failure modes affecting oil and gas pipelines and directly impacts their failure pressure [11,12]. Statistics reveal that corrosion, following third-party activities, is a leading cause of pipeline failure, accounting for 30% of all failure factors, as illustrated in Figure 1 [13]. Therefore, it is essential to study the failure pressure of corroded pipelines to determine whether they should remain in service, be repaired, or replaced, which can help prevent premature decommissioning that leads to economic waste and safety incidents. This research also aids engineers in assessing the safety status of pipelines and informs maintenance planning and safety management [14,15], providing a scientific basis for pipeline maintenance and management.
Research indicates that the presence of corrosion defects results in a reduction of the wall thickness in pipelines, thereby diminishing their load-bearing capacity. The failure pressure of a pipeline is typically defined as the critical pressure at which a rupture or leak occurs under specific conditions. Factors such as the morphology, depth, and location of corrosion defects all affect the failure pressure of pipelines [16]. In examining the failure pressure of corroded pipelines, various assessment criteria have been established both domestically and internationally. In the 1970s, the Battelle Memorial Institute in the United States developed the semi-theoretical, semi-empirical formula NG-18 based on fracture mechanics and explosive test results, which was among the earliest formulas used for calculating pipeline failure stress [17]. This formula has since served as the theoretical foundation for many subsequent assessment criteria and standards. Representative evaluation standards include ASME-B31G, the modified ASME B31G (0.85dl), RSTRENG, API 579, and DNV-RP-F101, as shown in Table 1 [18,19,20,21,22,23,24,25]. However, these assessment methods for the failure pressure of corroded pipelines exhibit certain limitations when characterizing the failure pressure of different grades of steel pipelines. They tend to be overly conservative in guiding the maintenance and operation of pipelines in practical engineering, leading to premature repairs or replacements and increased operational costs [26,27,28,29,30].
In recent years, with the advancement of computer virtual simulation technology and finite element theory, researchers have employed finite element analysis software to investigate the failure pressure of corroded pipelines, yielding promising results [31,32,33]. Alongside developments in artificial intelligence and deep learning, significant strides have been made in the safety assessment of corroded pipelines. Researchers have utilized various deep learning models to improve prediction accuracy and efficiency. Li integrated kernel principal component analysis with a Bayesian regularization neural network to develop the KPCA-BRANN model for predicting corrosion degradation in offshore pipelines [34]. Su introduced a method for rapidly predicting the failure stress of corroded pipelines with high accuracy [35]. Chen applied a backpropagation neural network to forecast the reliability of pipelines under diverse loading conditions [36]. Adriano presented real images of corrosion defects as inputs to create a fast and accurate prediction model using deep learning [37]. However, despite extensive research on the effects of single corrosion defects, studies addressing multiple corrosion defects remain relatively limited. Liu compared various machine learning models and ultimately proposed a pipeline safety assessment prediction model based on extreme gradient boosting algorithms [38]. Nevertheless, the treatment of boundary conditions for corroded areas in virtual simulations and the assumptions regarding actual corrosion conditions can result in discrepancies in the simulation outcomes when characterizing the failure pressure of real corroded pipelines. Furthermore, the validation data for artificial neural network-based corrosion pipeline failure pressure prediction models is typically sourced from simulated experiments, leading to overfitting when representing the failure pressure of actual corroded pipelines.
To accurately evaluate the failure pressure of corroded pipelines, this study employs the finite element numerical simulation method (FEM), utilizing SolidWorks and ABAQUS software to create a three-dimensional model of an oil and gas pipeline with corrosion defects. Based on the type of corrosion, boundary conditions for the affected areas are established, and reasonable assumptions are made. By applying various internal pressure loads, this study examines the impact of the pipeline model length and the structural parameters of corrosion defects on pipeline stress. A nonlinear regression equation for predicting the failure pressure of corroded pipelines is formulated using MATLAB with the iterative least squares method. Subsequently, a hydraulic testing platform is constructed for the API 5L X65 pipeline with corrosion defects to experimentally assess the effects of corrosion defect parameters on pipeline stress and failure pressure, thereby evaluating and validating the failure pressure prediction equation.
2. Methodology
2.1. Failure Identification of Corroded Pipeline
This paper employs the Finite Element Method (FEM) to investigate the stress levels and failure pressure of corroded pipelines. Given the stochastic nature of corrosion defects in terms of both location and shape, this study specifically examines the impact of the structural characteristic parameters of a single corrosion defect on the stress distribution and failure pressure of pipelines. The investigation incorporates numerical simulations and experimental studies using a single corrosion defect as a case study. The proposed method can also be extended to analyze corrosion clusters comprising multiple defects. Determining the failure pressure of corroded pipelines is essential for establishing pipeline failure criteria. Both finite element simulations and experimental approaches require predefined criteria to assess pipeline failure accurately. Typically, the failure of oil and gas pipelines is predominantly due to plastic deformation in the corroded areas. According to the Von Mises yield criterion, the distortional energy is considered the primary cause of yielding failure. Irrespective of the stress state, as long as the distortional energy at a point within the component reaches the critical value under uniaxial stress conditions, the material will undergo yielding failure. Specifically, when the Von Mises equivalent stress in the corroded region reaches the yield strength of the pipeline material, plastic deformation occurs, posing a risk of perforation and leakage. The equation adhering to the Von Mises yield criterion is presented in Equation (1).
In the following expressions, τM represents the Von Mises equivalent shear stress, σy signifies the yield strength, and σ1, σ2, and σ3 denote the first, second, and third principal stresses respectively, where σ1> σ2 > σ3. The formula for the Von Mises equivalent stress is given in Equation (2). where σM refers to the Von Mises equivalent stress.
2.2. Corrosion Pipeline Model Simplification
Given the long-distance transportation characteristics of oil and gas pipelines and the complexity of their operating environments, pipelines must withstand not only the internal pressure from oil and gas but also possible transverse concentrated loads, axial tensile and compressive loads, bending loads, and various load couplings. These combined effects result in complex and difficult-to-predict stress states. Consequently, in the design and construction phases of oil and gas pipelines, it is generally recommended to avoid loads other than internal pressure. Therefore, in simulation models, only the internal pressure from oil and gas is considered. Since most oil and gas pipelines are buried deep underground, and considering the interactions between the pipeline, soil, and the surrounding environment, this study focuses solely on the effects of corrosion on the pipeline. Therefore, only sections with corrosion defects are analyzed. Corroded regions are the weakest parts of the pipeline, and accurately simulating these defects is crucial for the precision of stress level assessments. The parameters of corrosion defects significantly influence the stress levels and failure pressure of pipelines. These parameters, including corrosion length ( l ), corrosion width ( w ), and corrosion depth ( d ), are defined as shown in Figure 2.
Research has shown that localized and uniform corrosion are the primary failure modes of pipelines. During simulation modeling, the corroded region can be simplified as an axial rectangular groove with a common base, resembling a segment of a cylindrical ring intersecting with the pipeline. Pipeline corrosion results from prolonged exposure to the surrounding environment rather than from short-term localized damage. Consequently, the surface of corrosion defects does not exhibit a stepped distribution. To avoid stress concentration, rounded transitions are applied at the intersections of the groove structure in the pipeline model, enhancing the accuracy of simulation results for corroded pipelines.
2.3. Finite Element Simulation Modeling
Based on the Von Mises yield criterion and the aforementioned simplified model of the corroded pipeline, a full-scale 3D solid model of an API 5L X65 pipeline with localized uniform corrosion defects was constructed using SolidWorks. Conducting simulation experiments with proportionally scaled models enhances the authenticity of the calculated data. The mechanical properties of the material for the API 5L X65 pipeline are shown in Table 2. The geometric parameters of the pipeline model and the normalized corrosion defect parameters used in the simulation experiments are listed in Table 3. The true stress-strain curve for the API 5L X65 pipeline material is illustrated in Figure 3.
The 3D pipeline model constructed in SolidWorks was imported into ABAQUS. A second-order reduced-integration tetrahedral mesh type was employed, and the basic material properties and true stress-strain curve data of the API 5L X65 pipeline were assigned to the simulation model. A free meshing method was used for the pipeline areas without corrosion defects, with a mesh element size set to 6mm. For the areas with corrosion defects, the mesh was refined and encrypted, with the mesh element size set to 4mm to enhance the simulation accuracy of the stress levels in the corroded regions. The pipeline model and its mesh division are shown in Figure 4. As the simulation focused solely on the pipeline segments with corrosion defects, axial displacement constraints were applied to one end of the pipeline model, while the other five degrees of freedom were left unconstrained to avoid stress concentration at the constrained end. A continuous uniformly distributed pressure load was applied to the inner wall of the pipeline.
In this study, the primary objective was to investigate the influence of boundary conditions on the stress in the corroded regions of the pipeline to determine the optimal length of the 3D pipeline model for subsequent numerical simulations. Based on this model length, finite element simulation experiments were conducted to minimize the computational cost as much as possible. Therefore, simulation experiments were performed on four full-scale 3D pipeline models of varying lengths. These four models had identical corrosion defect parameters, with the defects located at the mid-length of each pipeline model, but the overall lengths differed. In the simulation experiments, an internal pressure load of 10MPa was applied to observe the stress levels in the corroded regions of the four models. The geometric parameters of the pipeline models and the applied internal pressure load are shown in Table 4.
2.4. Establishment of Data Sets for Simulation Experiments
Using ABAQUS, the failure pressure of an API 5L X65 pipeline with localized uniform corrosion defects was simulated, taking into account the nonlinear behavior of the API 5L X65 pipeline material, including plastic deformation and variations in the stress-strain relationship. The failure pressure of corroded pipelines is often influenced by multiple parameters. Through sensitivity analysis, the degree to which the failure pressure is affected by changes in defect parameters can be determined. Parameters with high sensitivity can be considered essential in calculating the failure pressure of corroded pipelines. Based on literature review and numerical simulation results, corrosion length, corrosion width, and corrosion depth are identified as the primary factors affecting failure pressure. Initially, we investigated the impact of defect parameters on stress distribution at the corrosion site. If a change in a particular parameter leads to increased stress concentration at the defect, it significantly affects the failure stress. Therefore, this study conducts a parametric sensitivity analysis of the pipeline’s stress, yield pressure, and failure pressure under corrosion defects with normalized corrosion length (0.1538≤l/D≤1.5385), normalized corrosion width(0.0118≤w/πD≤0.1195), and normalized corrosion depth values (0.0833≤d/t≤ 0.8333). The selected range of corrosion defect parameters adequately covers the defect scales that may appear during the safe service life of the pipeline.
In the simulation experiments, a continuous internal pressure load was applied to the corroded pipeline, and the stress variations in the corroded regions were observed. When the maximum stress in the corroded region reaches the yield strength of the pipeline material, the internal pressure load is defined as the yield pressure of the corroded pipeline, which provides crucial guidance for the design pressure during the pipeline's safe service period. When the maximum stress in the corroded region reaches the tensile strength of the pipeline material, the internal pressure load is defined as the failure pressure of the corroded pipeline. The simulated failure pressure data from the experiments were used as a dataset to develop a nonlinear regression equation capable of predicting the failure pressure of pipelines with localized uniform corrosion.
2.5. Experimental Setup
2.5.1. Design of Test Pipelines
To effectively evaluate and revise the predictive equation for pipeline failure pressure, this study conducted full-scale hydrostatic tests on corroded pipelines. API 5L X65 pipelines were used to design and manufacture the test pipelines for these hydrostatic experiments. Through mechanical processing methods, square grooves were machined onto the outer wall of the API 5L X65 pipelines to simulate localized uniform corrosion. A flat-bottom pipe end cap was welded to one end of the test pipeline, while a flange was welded to the other end to serve as a connecting device with a flange cover. The flange and flange cover were secured with eight bolts and sealed with an O-ring. Two through holes were set on the flange cover’s end surface for pressurized water injection and air venting. A schematic diagram of the pipeline structure used in the hydrostatic test is shown in Figure 5.
In total, four test pipelines were manufactured, and four hydrostatic failure tests were conducted on these corroded pipelines to obtain data on the stress, failure pressure, and burst pressure of the corroded regions. The structural dimensions of the pipelines used in the hydrostatic tests and the parameters of the corrosion defects are shown in Table 5, with the defect parameters representing the actual measured values after machining the corroded pipelines.
2.5.1. Construction of Test Platform
In this study, a hydrostatic test platform was established to investigate the stress and failure pressure of corroded pipelines. The platform primarily consists of a test pipeline with corrosion, a workstation, a hydrostatic loading system, strain gauges, a strain measurement system, a control and data acquisition system, pressure gauges, pressure sensors, and a pipeline burst protection device, as shown in the schematic diagram in Figure 6. The hydrostatic loading and control system, manufactured by MAXIMATOR Fluid Engineering Co., Ltd., has a maximum loading capacity of 60MPa, with a control accuracy of 0.01MPa and a continuously adjustable loading rate ranging from 0.1 to 0.6MPa/min. The strain measurement system, model UCAM-60B produced by KYOWA, is capable of measuring large-range and high-precision strain data. The test pipeline, loading system, and strain measurement system are depicted in Figure 7, where Figure 7(a) illustrates the attachment of three triaxial strain gauges at the corrosion defect site on the test pipeline. The strain measurement system can record strain data from nine channels to obtain the multi-directional strain values at different positions within the corroded area, with the maximum measured stress being crucial for evaluating the failure pressure.
During the four hydrostatic tests, the internal pressure of the pipeline and the strain data at the corrosion defects were measured in real-time to monitor the pressure conditions and stress levels within the test pipeline. This helped assess whether the pipeline's strain indicated elastic or plastic deformation and to determine the stress and yield pressure at the corrosion defects, as well as the failure pressure when the corroded pipeline experienced perforation and leakage. The main steps of the experiment included assembling the test pipeline, connecting the pipelines while ensuring airtightness, setting up the hydrostatic test conditions, and initiating the hydrostatic loading and strain measurement systems for real-time monitoring of pressure and strain. The pressurization rate was controlled at 0.5MPa/min, gradually increasing the internal water pressure from 0MPa until the pipeline perforated and leaked.
3. Results
3.1. Influence of Boundary Conditions on Stress
In the simulation experiments, an internal pressure load of 10 MPa was applied to four three-dimensional pipeline models of different lengths. The equivalent stress simulation results for Model 1 are shown in Figure 8. As depicted in the figure, the maximum equivalent stress occurs at the central position of the corrosion area in Model 1, with a value of 491.6 MPa at node 1019. The minimum equivalent stress is 6.655 MPa, located at node 122669.
Using the same method, loads were applied to the remaining three models to solve for stress. The maximum and minimum stresses for all four pipeline models are summarized in Table 6. From Table 6, it is evident that when the ratio of pipeline length to corrosion length (L/l) is greater than or equal to 2, the effect of pipeline length on equivalent stress is minimal. The maximum deviation of the maximum equivalent stress is only 1.7%, whereas the maximum deviation of the minimum equivalent stress is 27%. This large deviation in minimum stress is due to its small value and its location far from the corrosion area, which has a negligible impact on the failure pressure of the pipeline. Hence, when L/l is greater than or equal to 2, the influence of boundary conditions on the stress in the corrosion region can be disregarded. In both simulation and actual experiments, the length of the studied pipe section can be minimized to reduce the complexity of the simulation and the cost of experiments.
3.2. Sensitivity Analysis of Defect Parameters on Failure Pressure
3.2.1. Relationship between Stress and Corrosion Length
Based on the Finite Element Method (FEM), we examined a 1.2m long three-dimensional solid model of a corroded pipeline. The normalized corrosion length ranged from 0.1538 to 1.5385, the normalized corrosion width was 0.031, and the normalized corrosion depth was 0.75. The effect of corrosion length on pipeline stress under a normalized internal pressure load (p/p0) of 0.0102 to 0.1020 is shown in Figure 9.
As observed in Figure 9, there is a linear positive correlation between the maximum equivalent stress in the corrosion region and the internal pressure load. Regardless of the load, the effect of corrosion length on pipeline stress follows a consistent pattern. Initially, the stress significantly increases with the increase in corrosion length; however, when the corrosion length exceeds 0.6, the increase in stress becomes minimal. This is due to a more uniform stress distribution in the corrosion area as the corrosion length reaches a certain value. Therefore, when the corrosion width and depth remain constant, an increase in corrosion length results in a significant decrease in pipeline failure pressure, which eventually stabilizes.
3.2.2. Relationship between Stress and Corrosion Width
We investigated a 1.2m long three-dimensional model of a corroded pipeline with a normalized corrosion length of 0.9231, a normalized corrosion width ranging from 0.0118 to 0.1195, and a normalized corrosion depth of 0.75. The effect of corrosion width on stress under a normalized internal pressure load of 0.0102 to 0.1020 is presented in Figure 10.
Figure 10 indicates that the effect of corrosion width on pipeline stress is consistent across different loads. As the corrosion width increases, the stress initially decreases significantly. However, beyond a normalized corrosion width of 0.0608, the decrease in stress becomes minimal, eventually stabilizing. This is because the smaller the corrosion width, the more concentrated the stress in the corrosion area. Conversely, a wider corrosion area distributes the stress more evenly. Therefore, when the corrosion length and depth remain constant, an increase in corrosion width leads to a significant increase in pipeline failure pressure, which eventually stabilizes.
3.2.3. Relationship between Stress and Corrosion Depth
We examined a 1.2m long three-dimensional model of a corroded pipeline with a normalized corrosion length of 0.9231, a normalized corrosion width of 0.0608, and a normalized corrosion depth ranging from 0.0833 to 0.8333. The effect of corrosion depth on stress under a normalized internal pressure load of 0.0102 to 0.1020 is shown in Figure 11.
Figure 11 shows that, across different loads, the effect of corrosion depth on pipeline stress follows a consistent pattern. As the corrosion depth increases, the stress escalates significantly, with the rate of increase growing as well. This is because an increased corrosion depth reduces the wall thickness of the pipeline in the corrosion area, leading to a complete concentration of stress in the thin-walled region. Therefore, when the corrosion length and width remain constant, an increase in corrosion depth results in a steep decline in pipeline failure pressure. Among the three corrosion defect parameters, corrosion depth has the most significant impact on pipeline failure pressure and should be considered the most critical parameter in the failure pressure calculation formula.
3.3 Establishment of Nonlinear Regression Equation for Failure Pressure
In this study, the dataset from the simulation results of the failure pressure of corroded pipelines was utilized as the raw data. A nonlinear regression model was employed to establish a predictive equation for the influence of corrosion length, corrosion width, and corrosion depth on failure pressure. To facilitate the calculations, a dimensionless failure pressure influence factor, pi, was introduced to represent the magnitude of the failure pressure for corroded pipelines. The relationship between pi and the normalized failure pressure can be expressed by Equation (3), where α、β and γ are constants to be determined.
This method expresses the failure pressure influence factor as a function of normalized corrosion length, corrosion width, and corrosion depth parameters. Since corrosion depth has the greatest impact on failure pressure, the calculation formula containing the corrosion depth parameter was used as the basic formula for the nonlinear regression equation and is represented by an exponential function. Thus, the failure pressure influence factor can be represented by Equation (4), where is the function of corrosion length and depth on pipeline failure pressure, and A and B are constants to be determined. Based on empirical formulas, can often be directly expressed in the reciprocal form of exponential functions, as shown in Equation (5), where E and F are constants to be determined.
Substituting Equation (5) into Equation (4) and using nonlinear regression methods to fit the initially determined formula forms, the specific form of the failure pressure influence factor was continuously adjusted according to the correlation of the formula fitting. The specific form can be represented by Equation (6), where M and N are constants to be determined.
On the basis of Equation (6), the least squares method was used to fit the finite element numerical simulation results with Equation (6) to determine the undetermined constants, ensuring the best correlation among all data. Finally, the calculation of the failure pressure influence factor for corroded pipelines is given by Equation (7).
Combining Equation (7) with Equation (3), the dataset from the failure pressure simulation results of corroded pipelines was further fitted and amended using the iterative least squares method in MATLAB R2024a. After 347 iterations and 1562 function evaluations, the fitting results approximated optimality with a standard deviation of residuals being 0.01837. The fitting results are shown in Figure 12.
Based on the fitting results, the values of α、β and γ in Equation (3) can be determined, thus establishing the normalized failure pressure prediction equation. This can also yield the predictive equation for the failure pressure of corroded pipelines, as shown in Equation (8).
3.4 Comparative Analysis and Discussion of Experimental Results
In this study, we measured the stress-strain at the corrosion defect locations, the yield pressure, and the failure pressure of four test pipelines. The comparison between the measured stress of Tests 1 and 4 and the simulation results is shown in Figure 13. As illustrated in the figure, the simulated stress results at the defect locations align well with the experimental results. The stress increases linearly with the increase in internal pipeline pressure, confirming the influence of corrosion defect parameters on stress observed in the simulation.
When the stress at the pipeline defect reaches the yield strength of the material, which is when the internal pressure of the test pipeline reaches the yield pressure, a comparison of the measured yield pressure results from the four tests with the simulation results is presented in Table 7. As shown in the table, the maximum deviation between the measured and simulated yield pressures is 8.4%, which verifies that the influence of defect parameters on yield pressure in the finite element simulation results is within an acceptable error range.
When the stress at the defect reaches the tensile strength of the pipeline material, the internal pressure of the test pipeline reaches the failure pressure. At this point, the pipeline bursts due to the internal pressure exceeding the maximum pressure it can withstand. The failure pressures of the four test pipelines were measured, with the internal pressure variation curve of Pipeline 1 shown in Figure 14. In the figure, the red curve represents the set pressure, while the blue curve represents the actual internal pressure of the pipeline. The failure pressure of Test Pipeline 1 is 11.4 MPa, and rupture occurred in the corrosion area of the pipeline.
Similarly, the failure pressures of Pipelines 2, 3, and 4 can be measured and compared with the simulation results and those calculated from the predictive equation, as shown in Table 8. By analyzing the defect parameters and experimental results of Tests 1 and 2, it is found that Pipeline 1 with a longer corrosion length has a lower failure pressure. From the defect parameters and results of Tests 2 and 3, it is observed that Pipeline 2 with greater corrosion depth has a lower failure pressure. From the defect parameters and results of Tests 3 and 4, it is evident that Pipeline 4 with a larger corrosion width has a higher failure pressure. This is consistent with the sensitivity analysis results of the corrosion defect parameters on failure pressure observed in the simulation tests.
Table 8 also reveals that the maximum deviation between the finite element simulation results and the predictive equation calculations is 8.71%, the minimum deviation is 2.27%, and the average deviation is 5.81%. The maximum deviation between the predictive equation calculations and the experimental measurements is 8.39%, the minimum deviation is 6.96%, and the average deviation is 7.77%. This indicates that within an allowable error range, the model simplification and boundary condition handling in the simulation are reasonable. Furthermore, the nonlinear regression predictive equation for failure pressure, developed using the dataset from the finite element simulation results, can effectively predict the failure pressure of corroded pipelines.
4. Conclusions
The study utilized finite element numerical simulation to investigate the influence of defect parameters in API 5L X65 corroded pipelines on stress and failure pressure. The simulation results were used to generate a dataset of failure pressures, from which a multivariate nonlinear regression equation was developed to predict failure pressure. This equation, which is a function of the ultimate bearing pressure of an intact pipeline, as well as normalized corrosion length, width, and depth, was validated through experimental testing. Within the range of defect parameters considered in this study, the maximum deviation between the predictions from the regression equation and the simulation results was 8.71%, with a minimum deviation of 2.27%. Similarly, the maximum deviation between the equation's predictions and the experimental results was 8.39%, and the minimum deviation was 6.96%.
This study also analyzed the sensitivity of pipeline failure pressure to defect parameters and integrated this sensitivity into the nonlinear regression equation. The analysis results were further validated through experiments. The research revealed that an increase in corrosion length and depth leads to a decrease in pipeline failure pressure, while an increase in corrosive width results in an increase in pipeline failure pressure. Corrosion depth has the most significant impact on failure pressure; as corrosion depth increases, the reduction in failure pressure becomes more pronounced. Corrosion length has the second-largest effect on failure pressure, with its influence stabilizing once corrosion length reaches a certain threshold. Corrosion width has the least effect on failure pressure, and its influence also stabilizes once corrosive width reaches a specific level.
Author Contributions
Conceptualization, H.Z. and Z.Y.; methodology, H.Z.; software, H.Z.; validation, B.Z., H.Z. and Z.Y.; formal analysis, H.Z.; investigation, H.Z.; resources, X.L.; data curation, H.Z.; writing—original draft preparation, H.Z.; writing—review and editing, P.H.; visualization, P.H.; supervision, P.H.; project administration, H.Z.; funding acquisition, X.L. All authors have read and agreed to the published version of the manuscript.
Funding
This research was funded by National Natural Science Foundation of China, grant number 51679214, Experimental Technology Research Project of Zhejiang University, grant number SJS201909 and General Scientific Research Project of Zhejiang Provincial Department of Education, grant number Y202146448.
Institutional Review Board Statement
Not applicable.
Informed Consent Statement
Not applicable.
Data Availability Statement
Not applicable.
Conflicts of Interest
The authors declare no conflicts of interest.
References
- Hua, C. Research on the Residual Strength of Pressure Pipelines with Corrosion Defects. Beijing: China University of Petroleum (Beijing), 2017.
- Wang, Z.B.; Pang, L.; Zheng, Y.G. A review on under-deposit corrosion of pipelines in oil and gas fields: Testing methods, corrosion mechanisms and mitigation strategies. Corrosion Communications 2022, 7, 70-81. [CrossRef]
- Wang, Q.; Song, Y.; Zhang, X.; et al. Evolution of corrosion prediction models for oil and gas pipelines: From empirical-driven to data-driven. Engineering Failure Analysis 2023, 146, 107097.
- Wasim, M.; Djukic, M.B. External corrosion of oil and gas pipelines: A review of failure mechanisms and predictive preventions. Journal of Natural Gas Science and Engineering 2022, 100, 104467.
- Colombo, A.; Oldani, L.; Trasatti, S. Corrosion failure analysis of galvanized steel pipes in a closed water cooling system. Eng Fail Anal 2018, 84(2), 46-58.
- Rajabipour, A.; Robert, E. Service life of corrosion pitted pipes subject to fatigue loading and hydrogen embrittlement. Int J Hydrogen Energ 2018, 43(17), 8440-8450.
- Dao, U.; Sajid, Z.; Khan, F.; et al. Modeling and analysis of internal corrosion induced failure of oil and gas pipelines. Reliability Engineering & System Safety 2023, 234, 109170.
- De-León-Escobedo, D. Risk-based maintenance time for oil and gas steel pipelines under corrosion including uncertainty on the corrosion rate and consequence-based target reliability. International Journal of Pressure Vessels and Piping 2023, 203, 104927.
- Jiang, F.; Zhao, E. An integrated risk analysis model for corroded pipelines subjected to internal pressures: Considering the interacting effects. Ocean Engineering 2022, 247, 110683. [CrossRef]
- Amaya-Gómez, R.; Sánchez-Silva, M.; Bastidas-Arteaga, E.; et al. Reliability assessments of corroded pipelines based on internal pressure – A review. Engineering Failure Analysis 2019, 98, 190-214. [CrossRef]
- Ferreira, D.; Torres, C.; Lins, F.; et al. Computational fluid dynamics investigation for austenitic AISI 904L stainless steel.
- Sun, L.; Zhu, M.; Ou, G.; et al. Corrosion investigation of the inlet section of REAC pipes in the refinery. Eng Fail Anal 2016, 66(8), 468-478.
- Soomro, A.A.; Mokhtar, A.A.; Kurnia, J.C.; et al. Integrity assessment of corroded oil and gas pipelines using machine learning: A systematic review. Engineering Failure Analysis 2022, 131, 105810.
- Mahmoodian, M.; Li, C.Q. Failure assessment and safe life prediction of corroded oil and gas pipelines. Journal of Petroleum Science and Engineering 2017, 151, 434-438. [CrossRef]
- Zheng, H.W.; Yang, G.X.; Wang, D.Z. Numerical analysis of residual strength of corroded pipes and secondary development of ANSYS. Functional Materials 2018, 49(11), 11075-11079+11084.
- Adib, H.; Jallouf, S.; Schmitt, C.; et al. Evaluation of the effect of corrosion defects on the structural integrity of X52 gas pipelines using the SINTAP procedure and notch theory. International Journal of Pressure Vessels and Piping 2006, 84(3), 123-131. [CrossRef]
- Kinfer, J.F. Corroded pipe: strength and repair methods. Fifth Symposium Line Pipe Research Paper L1, USA, 1971.
- Kinfer, J.F.; Vieth, P.H. New method corrects criterion for evaluation corroded pipe. Oil and Gas Journal 1992, 90(42), 84-89.
- ASME (American Society of Mechanical Engineering). ASME B31G-1991, Manual for Determining the Remaining Strength of Corroded Pipelines. New York, USA, 1991.
- Kiefner, J.F.; Vieth, P.H. Evaluating PIPE-1 new method corrects criterion for evaluating corroded pipe. Oil Gas J 1990, 88(32), 56-59.
- O'Grady, T.J.; Hisey, D.T.; Kiefner, J.F. Pressure calculation for corroded pipe developed. Oil and Gas Journal 1992, 90(42), 84-89.
- API RP579-2010. Fitness for Service. American Petroleum Institute, 2010, First edition, January.
- DNV-RP-F101. Recommended practice for corroded pipelines. Det Norske Veritas, Norway, 2004.
- Femando, D.; Claudio, R. Structural integrity assessments of high-pressure pipelines with axial flaws using a micromechanics model. International Journal of Pressure Vessels and Piping 2004, 81, 761-770.
- Cicero, S.; Lacalle, R.; Cicero, R.; Ferreno, D. Assessment of local thin areas in a marine pipeline by using the FITNET FFS corrosion module. Int. J. Pres. Ves. Pip. 2009, 86(5), 329-334.
- API 579-1 Ed. 2(2007). Fitness-for-service. American Petroleum Institute.
- DNV-RP-F101. Corroded pipelines. Det Norske Veritas.
- ANSI/ASME B31G-1991. Manual for determining the remaining strength of corroded pipelines a supplement to ASME B31 code for pressure piping.
- Choi, K.H.; Lee, C.S.; Ryu, D.M.; et al. Comparison of computational and analytical methods for evaluation of failure pressure of subsea pipelines containing internal and external corrosion. Journal of Marine Science and Technology 2016, 21(3), 369-384. [CrossRef]
- Hoang, V.T.; Long, W.; Liu, H.G.; et al. Remaining strength of oil and gas pipelines containing uniform corrosion defects based on finite element analysis. Oil and Gas Storage and Transportation 2018, 37(2), 157-161.
- Chen, Y.; Hou, F.; Lang, Y.; et al. A method for calculating collapse pressure of submarine pipelines with corrosion defects. China Offshore Oil and Gas 2021, 33(05), 182-188.
- Kou, H.; Chu, J.; Guo, W.; et al. Field study of residual forces developed in pre-stressed high-strength concrete (PHC) pipe piles. Can Geotech J 2016, 53(4), 696-707.
- Chang, K.; Jang, G. Comparative study on residual stress distribution of 600 MPa grade high tensile strength steel pipe weldment. Materials & Processing Report 2014, 27(1), 76-78.
- Li, X.; Jia, R.; Zhang, R.; et al. A KPCA-BRANN based data-driven approach to model corrosion degradation of subsea oil pipelines. Reliability Engineering & System Safety 2022, 219, 108231.
- Su, Y.; Li, J.; Yu, B.; et al. Fast and accurate prediction of failure pressure of oil and gas defective pipelines using the deep learning model. Reliability Engineering & System Safety 2021, 216, 108016.
- Chen, Y.; Hou, F.; Dong, S.; et al. Reliability evaluation of corroded pipeline under combined loadings based on back propagation neural network method. Ocean Engineering 2022, 262, 111910. [CrossRef]
- Ferreira, A.D.M.; Afonso, S.M.B.; Willmersdorf, R.B.; et al. Multiresolution analysis and deep learning for corroded pipeline failure assessment. Advances in Engineering Software 2021, 162-163, 103066.
- Liu, W.; Chen, Z.; Hu, Y. XGBoost algorithm-based prediction of safety assessment for pipelines. International Journal of Pressure Vessels and Piping 2022, 197, 104655.
- Li, M.D. Testing of true stress-strain curves and mechanical performance analysis of high-strength pipeline steel [Doctoral Dissertation]. China University of Petroleum (Beijing), 2018. [CrossRef]
Figure 1.
Causes for oil and gas pipelines failure
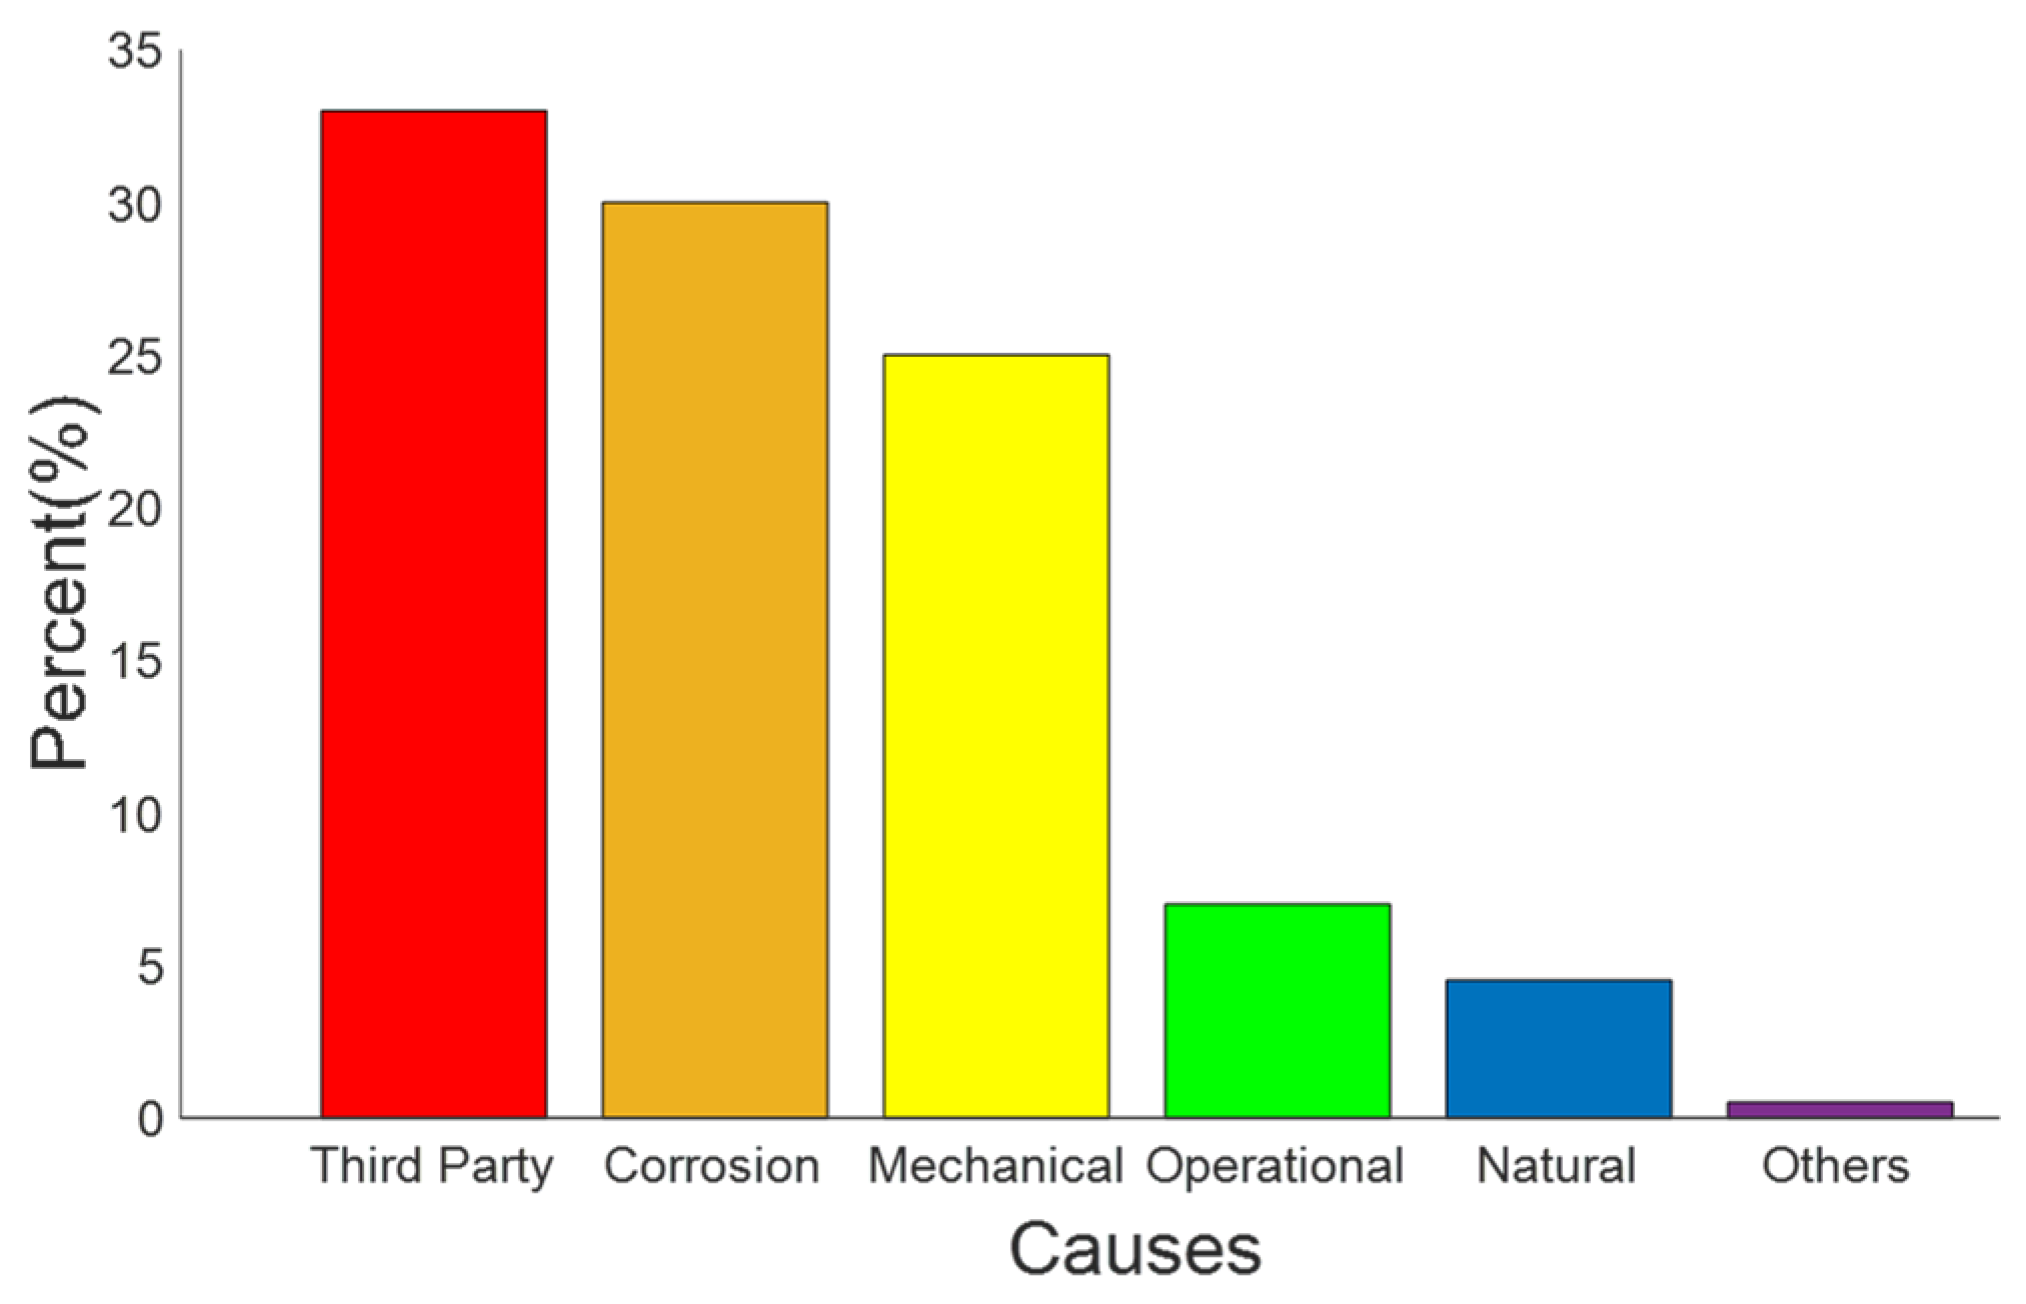
Figure 2.
Structural illustration of the corrosion depth of pipe
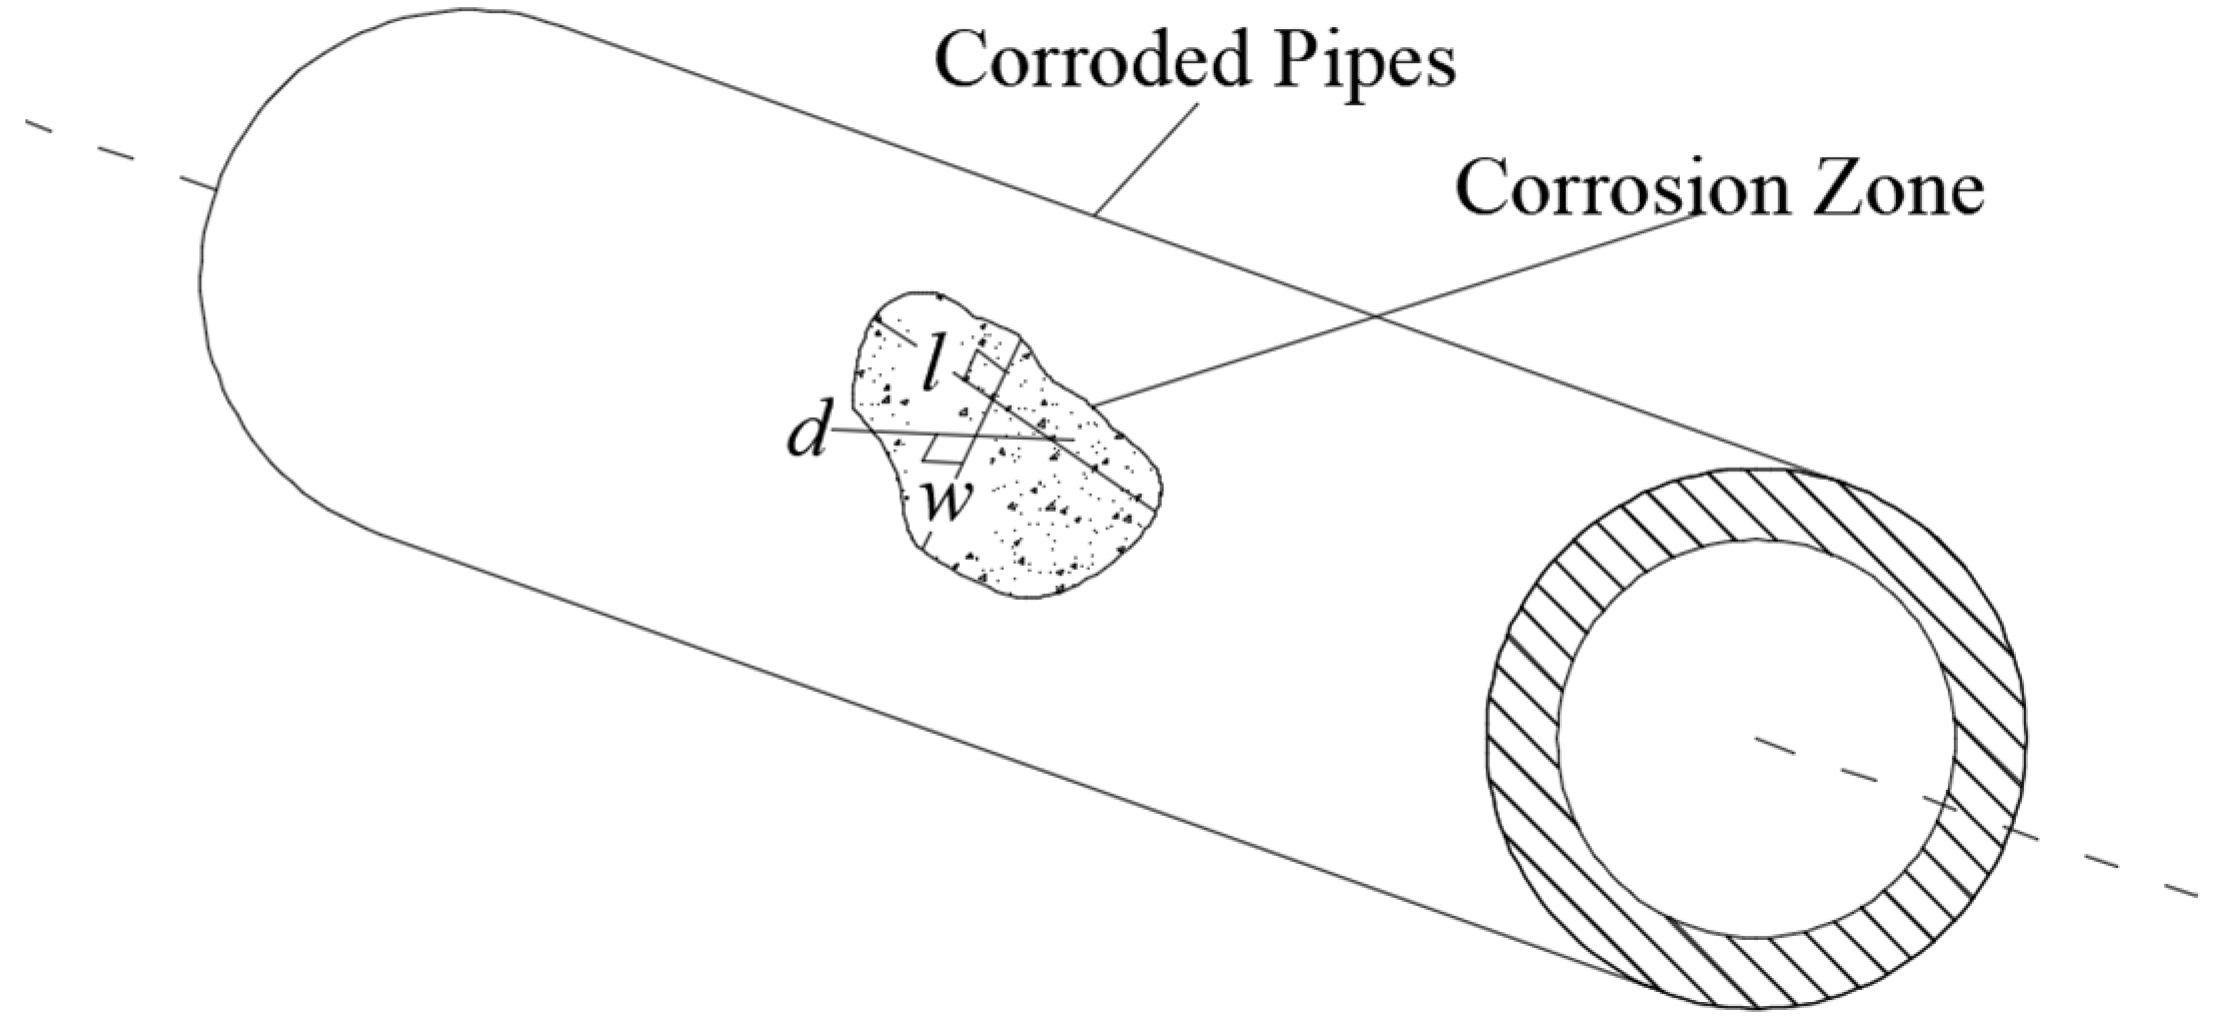
Figure 3.
True stress–strain curve for API 5L X65 steel pipe [39]
Figure 3.
True stress–strain curve for API 5L X65 steel pipe [39]
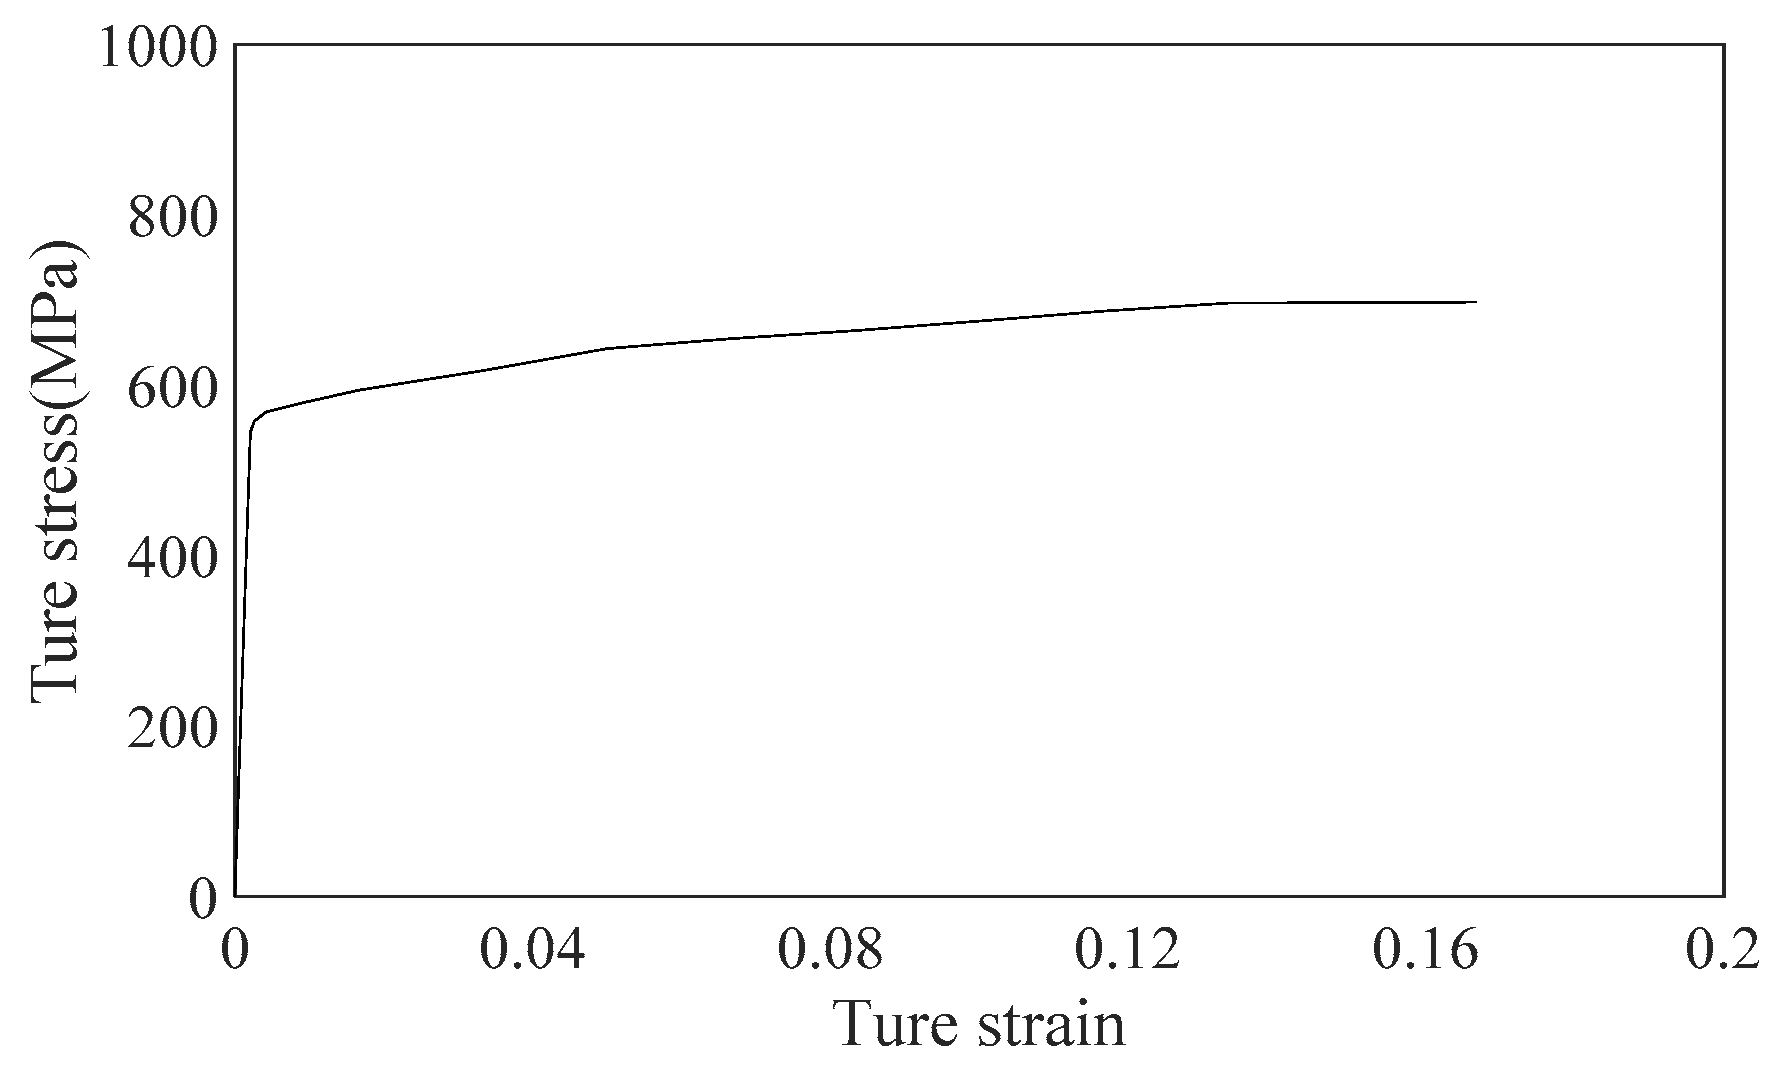
Figure 4.
Simulation model of corroded pipeline
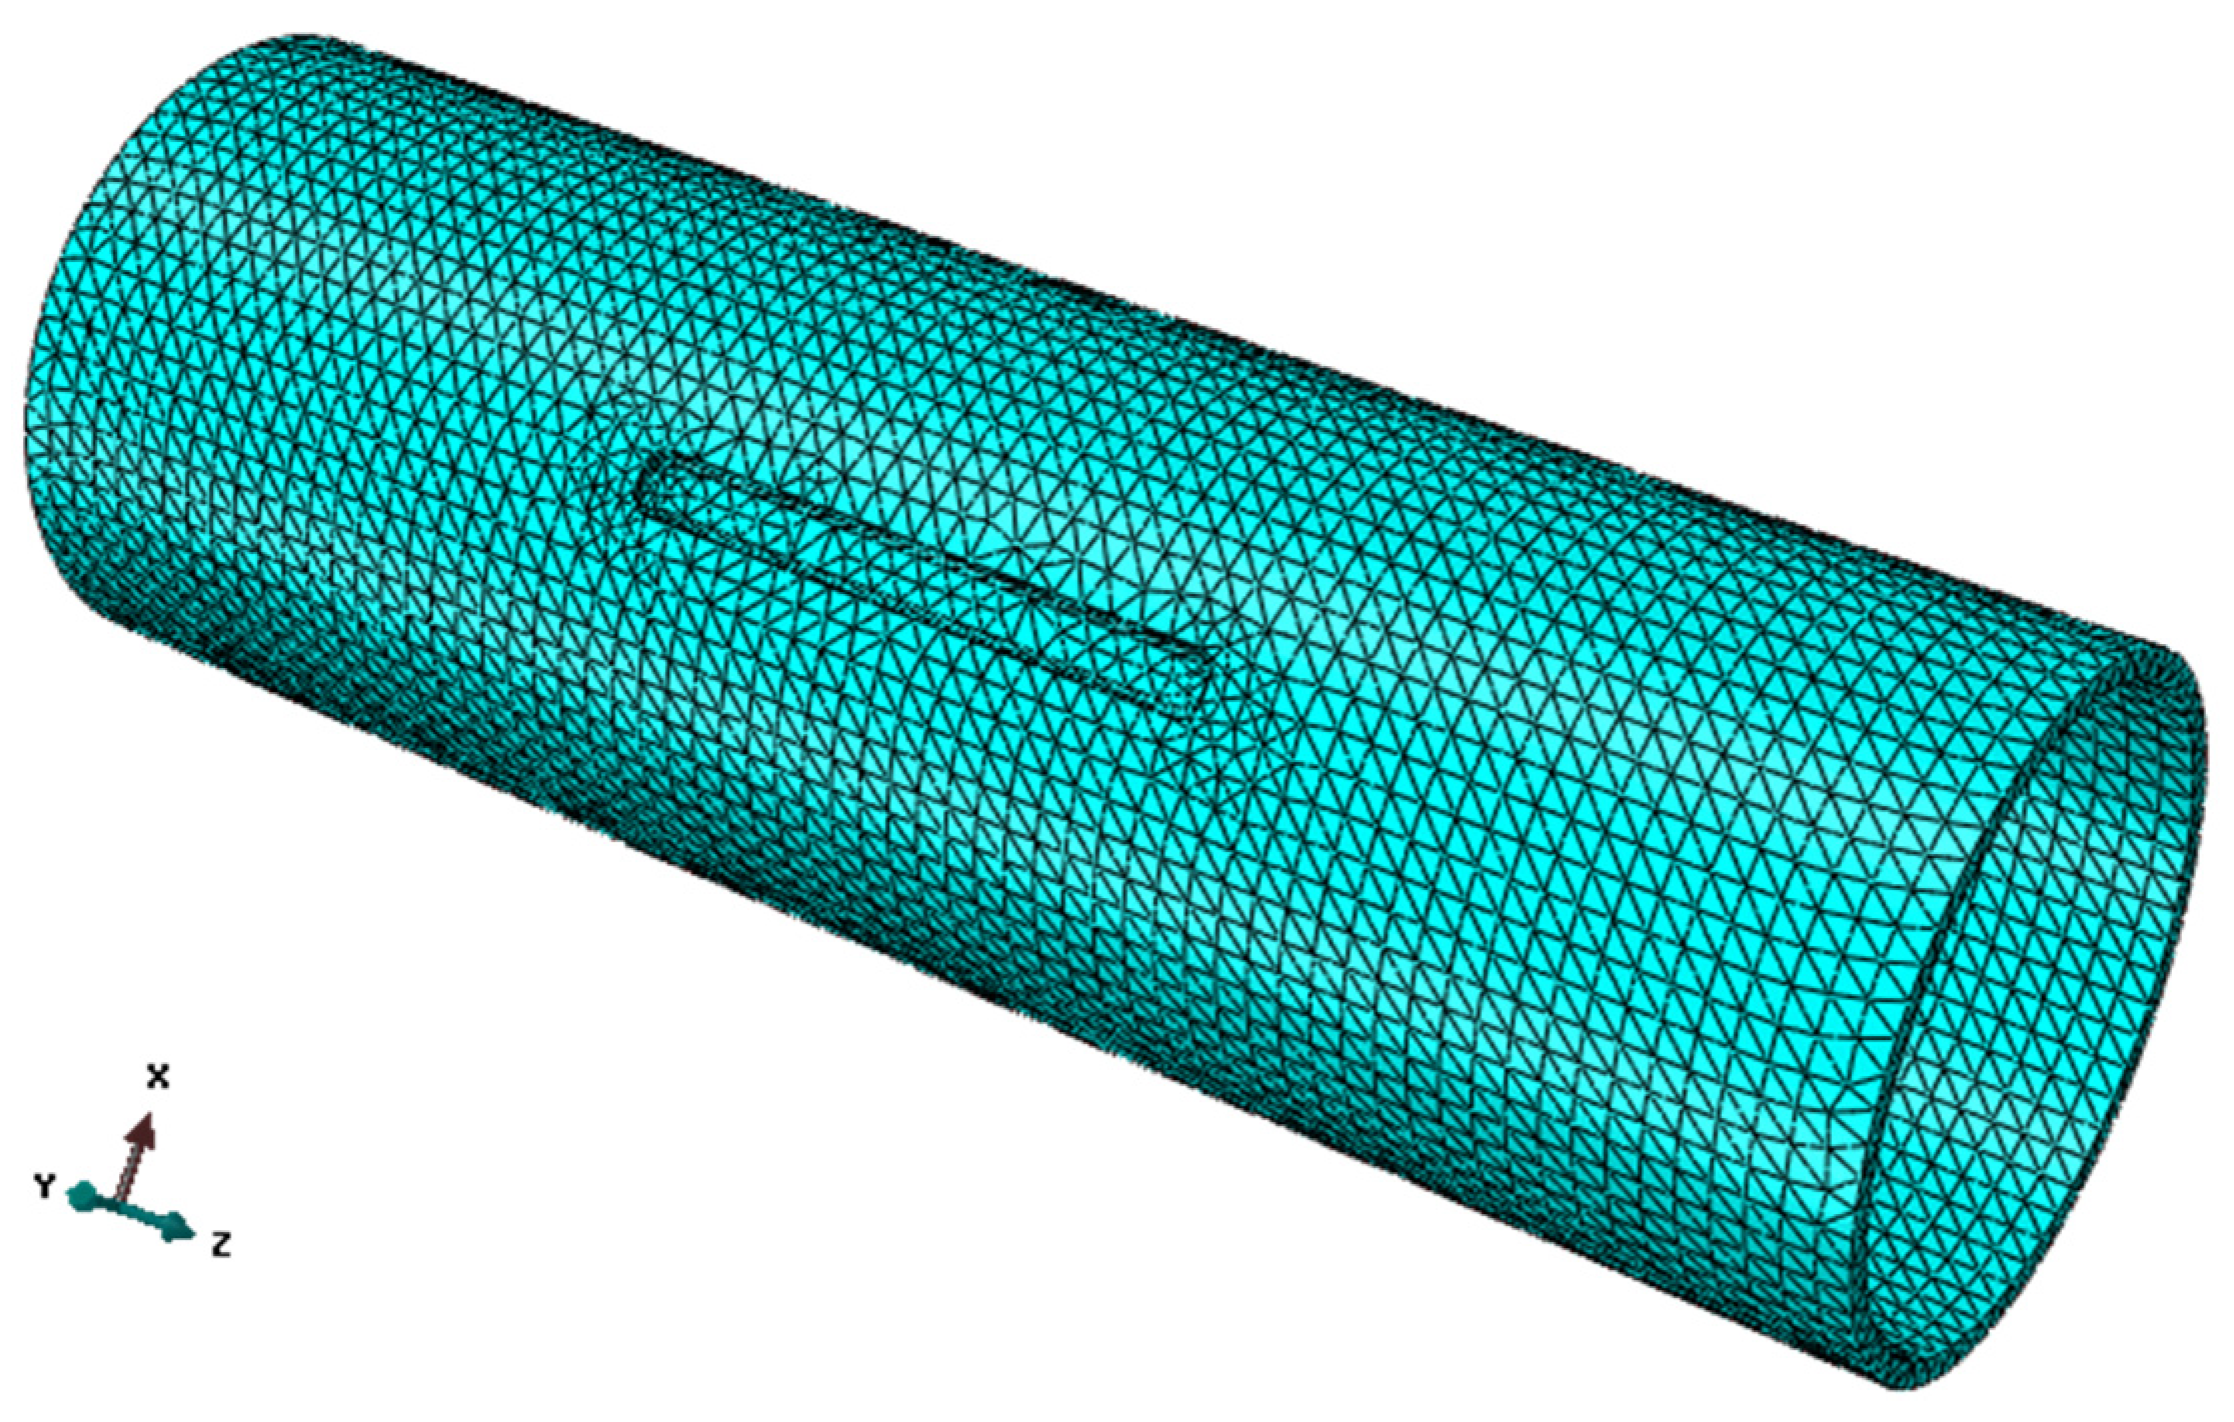
Figure 5.
Structural illustration of pipe for hydraulic test
Figure 6.
Architecture illustration of hydraulic test platform
Figure 7.
The main equipment of hydraulic test platform
Figure 8.
Stress distribution of Model 1
Figure 9.
Relation between maximum equivalent stress and corrosion length.
Figure 10.
Relation between maximum equivalent stress and corrosion width
Figure 11.
Relation between maximum equivalent stress and corrosion depth
Figure 12.
The fitting of normalized failure pressure and influence factor
Figure 13.
Comparison of test and simulation results for stress at corrosion defects
Figure 14.
Pressure curve of test 1

| Calculation Rules Methodology | Unit or Author | Date of Submission |
|---|---|---|
| ASME-B31G | American Society of Mechanical Engineering | 1984 |
| Amended B31G(0.85dL) | Kiefer, Vieth | 1989 |
| RSTRENG | Kiefer, Vieth | 1989 |
| CAS-Z184-M86 | Canadian Standards Association | 1999 |
| BS-7910 | British Standards Institution | 1999 |
| API-579 | American Petroleum Institute | 2000 |
| DNV-RP-F101 | Det Norske Veritas | 2000 |
| PCORRC | Stephens, Leis | 2000 |
| CPS | Waterloo, Canada | 2000 |
| FITNET FFS | Cicero | 2009 |
Table 2.
Material properties of the pipe grades used in this study
| Properties | Values |
|---|---|
| Pipe name | API 5L X65 pipe |
| Densities, ρ(kg/m3) | 7850 |
| Modulus of elasticity, E(MPa) | 2.06×10⁵ |
| Poisson’s ratio, v | 0.3 |
| Yield strength,σy (MPa) | 545 |
| Tensile strength,σb (MPa) | 665 |
| Yield ratio, σy/σb | 0. 82 |
Table 3.
Geometric parameters of the corroded pipe models
| Input Parameters | Values |
|---|---|
| Outer diameter of pipe, D (mm) | 325 |
| Wall thickness, t (mm) | 12 |
| Length of pipe, L (mm) | 600~2400 |
| Ultimate pressure of intact pipe, p0 (MPa) | 49.1 |
| Normalized effective defect length, (l/D) | 0.15~1.54 |
| Normalized defect width, (w/πD) | 0.012~0.12 |
| Normalized effective defect depth, (d/t) | 0.08~0.92 |
| Normalized failure press,(pf/p0) | 0~1 |
Table 4.
Geometric parameters and internal pressure of corroded pipe models
| Input Parameters | Values | ||||
|---|---|---|---|---|---|
| Model 1 | Model 2 | Model 3 | Model 4 | ||
| Outer diameter of pipe, D (mm) | 325 | 325 | 325 | 325 | |
| Wall thickness, t (mm) | 12 | 12 | 12 | 12 | |
| Length of pipe, L (mm) | 600 | 1200 | 1800 | 2400 | |
| Defect length, l (mm) | 300 | 300 | 300 | 300 | |
| Defect width, w (mm) | 32 | 32 | 32 | 32 | |
| Defect depth, d (mm) | 9 | 9 | 9 | 9 | |
| Pipe internal pressure, p(MPa) | 10 | 10 | 10 | 10 | |
Table 5.
Geometric parameters of four test pipes
| Input Parameters | Values | ||||
|---|---|---|---|---|---|
| Test 1 | Test 2 | Test 3 | Test 4 | ||
| Outer diameter of pipe, D (mm) | 325 | 325 | 325 | 325 | |
| Wall thickness, t (mm) | 12 | 12 | 12 | 12 | |
| Length of pipe, L (mm) | 1200 | 1200 | 1200 | 1200 | |
| Normalized effective defect length, (l/D) | 1.215 | 0.938 | 0.938 | 0.938 | |
| Normalized defect width, (w/πD) | 0.031 | 0.031 | 0.031 | 0.041 | |
| Normalized effective defect depth, (d/t) | 0.775 | 0.775 | 0.758 | 0.758 | |
| Normalized failure press,(pf/p0) | 0~1 | 0~1 | 0~1 | 0~1 | |
Table 6.
Comparison of stress simulation results of 4 pipe models
| Pipe models | Maximum stress(MPa) | Maximum deviation |
Minimum stress(MPa) | Maximum deviation |
|---|---|---|---|---|
| Model 1 | 491.6 | 1.7 % | 6.655 | 27% |
| Model 2 | 484.1 | 9.121 | ||
| Model 3 | 483.4 | 8.175 | ||
| Model 4 | 483.1 | 7.285 |
Table 7.
Comparison of yield pressure simulations and test results for corroded pipelines
| (l/D) | (w/πD) | (d/t) | (py/p0) | Percentage Difference | |
|---|---|---|---|---|---|
| FEM | Test | ||||
| 1.215 | 0.031 | 0.775 | 0.1975 | 0.1824 | 8.27 |
| 0.938 | 0.031 | 0.775 | 0.2058 | 0.1925 | 6.91 |
| 0.938 | 0.031 | 0.758 | 0.2410 | 0.2243 | 7.45 |
| 0.938 | 0.041 | 0.758 | 0.2594 | 0.2393 | 8.4 |
Table 8.
Comparison of the failure pressure obtained using FEM, the empirical equation and hydraulic test
Table 8.
Comparison of the failure pressure obtained using FEM, the empirical equation and hydraulic test
| (l/D) | (w/πD) | (d/t) | (pf/ p0) | Percentage Difference | ||
|---|---|---|---|---|---|---|
| FEM | Equation | Test | ||||
| 1.215 | 0.031 | 0.775 | — | 0.2408 | 0.2224 | 8.26 |
| 0.938 | 0.031 | 0.775 | — | 0.2510 | 0.2347 | 6.96 |
| 0.938 | 0.031 | 0.758 | — | 0.2939 | 0.2735 | 7.46 |
| 0.938 | 0.041 | 0.758 | — | 0.3163 | 0.2918 | 8.39 |
| 0.9231 | 0.0314 | 0.75 | 0.3245 | 0.3105 | — | 4.31 |
| 0.9231 | 0.0608 | 0.75 | 0.3804 | 0.3194 | — | 5.52 |
| 0.9231 | 0.0608 | 0.5833 | 0.4936 | 0.4506 | — | 8.71 |
| 0.9231 | 0.0608 | 0.6667 | 0.4507 | 0.4115 | — | 8.69 |
| 0.6154 | 0.0314 | 0.75 | 0.3765 | 0.3564 | — | 5.34 |
| 0.7692 | 0.0314 | 0.75 | 0.3574 | 0.3493 | — | 2.27 |
Disclaimer/Publisher’s Note: The statements, opinions and data contained in all publications are solely those of the individual author(s) and contributor(s) and not of MDPI and/or the editor(s). MDPI and/or the editor(s) disclaim responsibility for any injury to people or property resulting from any ideas, methods, instructions or products referred to in the content. |
© 2024 by the authors. Licensee MDPI, Basel, Switzerland. This article is an open access article distributed under the terms and conditions of the Creative Commons Attribution (CC BY) license (http://creativecommons.org/licenses/by/4.0/).
Copyright: This open access article is published under a Creative Commons CC BY 4.0 license, which permit the free download, distribution, and reuse, provided that the author and preprint are cited in any reuse.


