1. Introduction
Modern energy storage is mainly based on lithium batteries [
1,
2,
3]. Despite this element's multiple advantages, such as low weight and wide range of cathode and anode materials suitable for various applications (i.e., small batteries for cell phones or large grid-level batteries) it has two main drawbacks: its limited availability and environmental impact of its excavation and processing. This is why more sustainable alternative is required. Sodium is the first logical replacement for lithium due to its electro-chemical similarity and much higher abundance than lithium [
4,
5,
6,
7,
8]. While poorer electrical and electrochemical properties limit the application of sodium batteries, they are still worth considering [
9,
10,
11]. Selected material (NaFePO
4 based glass and nanocomposite) is sodium analog of LiFePO
4 proposed by J. Goodenough in 1997 [
7]. It contains only abundant, environmentally-neutral elements (sodium, oxygen, iron, phosphorus) and presents a high theoretical gravimetric capacity (154 mAh/g) [
8].
Glass materials have short-range ordered structures that can adapt to significant lattice distortion, while notable specific surface areas may provide more storage sites than crystalline analog. Furthermore, the capacity of glass material can be controlled by modifying its composition. Those properties make amorphous solids (glasses) a viable replacement for crystalline materials when used as a cathode in new-generation batteries [
12,
13,
14,
15]. The main disadvantage of glass-based materials is their limited conductivity. The lab of the authors introduced an innovative way for the formation of a nanocomposite (crystallites with average grain size below 100 nm surrounded by glass matrix) using simultaneous high pressures and high temperature in the close vicinity of the glass temperature [
15,
16,
17,
18,
19], 1-2 orders of magnitude conductivity improvement was observed in a glass containing lithium [
16] and sodium [
18].
The impact of high pressure on the physical and electrical properties of sodium-based nanomaterials is a subject of significant scientific inquiry, driven by its potential for various technological applications. Under high-pressure conditions, these nanomaterials undergo profound changes that affect their behavior at the atomic and electronic levels. A notable effect of high-pressure & high-temperature (HPHT) treatment is its ability to induce structural transformations in sodium-based nanomaterials. This pressure-induced structural change can lead to the formation of new crystal structures or alterations in existing ones. These structural modifications often result in changes in the material's density (and thus volumetric capacity), lattice parameters, and atomic arrangements, which remain stable at ambient conditions [
16,
17,
18,
19,
20,
21] and often differ from other treatments [
16,
19,
20,
21].
Cathode materials should exhibit mixed electronic–ionic electric conduction (electric charge is simultaneously transferred by ions and electrons moving in opposite directions, contributing to total electric current) with the predominant electronic one. In amorphous and disordered materials, electrons are transported by a hopping mechanism between transition metal centers (e.g., Fe
2+/Fe
3+ or V
4+/V
5+). It is expected that the temperature dependence of such hopping is described by Mott’s theory [
21]. At low-temperature range (below 1/4 of Debye temperature
), variable range hopping (VRH) dominates. It means that “electrons are seeking” energetically close sites, but not necessarily neighboring ones. Electric conductivity in this temperature range is expressed by the formula [
18,
19,
22,
23]:
Where
and
are defined in [
19,
22]. When temperature rises above circa 1/2 of Debye temperature
, optical phonons of crystal lattice vibrations appear. Optical phonons have higher energy than acoustic phonons, enough to cause negative energy level differences between atoms, allowing electron jumps (phonon-assisted hopping PAH) between neighboring centers. Phonon-assisted DC conductivity is thermally activated and follows the Arrhenius-like relation of Mott’s polaron hopping [
16,
17,
18,
19,
22,
23]:
where
– activation energy,
,
is for the average distance between hopping centers. A smooth transition from VRH to PAH is described by Debye temperature
, known from specific heat theory. Well below that temperature, phonons are frozen to an extent, and the assistance of phonons in electron hopping is limited.
On the other hand, random or electric field-driven hopping of ions in solids (Na
+ in this case) requires empty sites in a close arrangement of atoms, such as vacancies or interstitial positions. Such conditions occur in many crystalline and amorphous structures. Cathode materials must be additionally electrochemically active, which means their ability to intercalate and deintercalate ions (e.g., Na
+), ensuring discharging and charging a battery, respectively. Because of its much larger size and smaller mobility, the conductivity of ions in most systems is
usually much lower than the conductivity of electrons (exceptions are superionic conductors and ionic crystals). One of the most studied cathode materials is polycrystalline olivines [
7,
9], alluaudites [
24], and NASICONs [
25].
The main experimental method used in this work was Broadband Dielectric Spectroscopy (BDS), which allowed for the measurement of complex electric permittivity [
26,
27,
28,
29]:
In this formula is the high-frequency electric permittivity, is the static electric permittivity, and is the empirical power exponent. This equation illustrates how the electric permittivity varies with frequency, incorporating high and low-frequency limits and various relaxation phenomena.
Electric permittivity Eq.(3) can be transformed into electric conductivity, considering
[
26]:
where
is the high-frequency conductivity (infinite frequency limit),
is the DC conductivity (zero frequency limit),
is the relaxation time.
Our last paper [
18] was devoted to DC conductivity studies for NaFePO
4 glasses and resulted in nanomaterials obtained after high-pressure and high-temperature treatment (HPHT). It was found that after HPHT treatment, the glassy sample transformed into a composite consisting of two nanocrystalline electrochemically active phases: 55% alluaudite Na
2Fe
3(PO
4)
3 and 45% NASICON Na
3Fe
2(PO
4)
3. Average grain sizes were 42 nm and
nm, respectively [
18]. Studies using the broadband dielectric spectroscopy (BDS) method showed that DC conductivity increased by 1-2 orders of magnitude after HPHT treatment compared with NaFePO
4 glasses.
While DC conductivity is a valid phenomenological parameter describing battery operation, AC conductivity analysis may give a more in-depth picture of transport processes occurring in the studied material. For empirical describing electric conductivity changes Jonscher's scaling law is most often used [
27]:
This power law (also called universal dielectric response) shows that the real part of complex conductivity consists of two components: a constant term
representing the conductivity at very low frequencies (DC limit) and a frequency-dependent term
that accounts for the increase in conductivity with increasing angular frequency
. In the above formula,
and
are fitting parameters. The power exponent
determines the rate at which the conductivity increases with frequency. It is assumed that both parts of
are thermally activated and may be expressed via [
30,
31,
32,
33,
34]:
where
and
are activation energies of DC and AC conductivity, respectively. There are several models postulating the following empirical relationship between both activation energies [
30,
31,
32,
33,
34,
35,
36,
37,
38]:
The authors' previous report [
18] focused on the effect of high-pressure & high-temperature treatment (HPHT) on the structure properties and DC conductivity of NaFePO
4 glasses. DC conductivity increased by 2 orders of magnitude, and activation energy of electric conductivity decreased from
to
after HPHT treatment. Study in AC domain should allow for analysis of the relation between long-range (DC) and short-range (AC) transport of charge and HPHT treatment impact on this relation.
2. Materials and Methods
At the beginning of the study, a glassy analog of sodium olivine with a nominal composition of NaFePO
4 was fabricated. As detailed earlier, the glasses were prepared using a melt-quenching technique [
18]. Stoichiometric quantities of Na
2CO
3, FeC
2O
4·2H
2O, and NH
4H
2PO
4 were carefully mixed and finely ground in a mortar. Subsequently, the mixture was placed into a ceramic crucible and heated in an electric furnace to 1523 K, keeping this temperature to ensure the completion of the calcination reaction and volatilization of components. Finally, the melts were quenched onto copper plates. The amorphous state of the samples was confirmed by XRD and DTA methods. Results of material measurements (XRD, DTA) and dielectric (BDS) measurements (including DC conductivity and related analysis of relaxation processes) of both studied samples are available in previous work [
18].
Electrical conductivity was measured using broadband dielectric spectroscopy (BDS) employing Novocontrol hardware. Samples were placed between capacitor plates at a distance and the voltage of 1V was applied with frequencies ranging from to . Measurements were performed at temperatures from 123 to 473 K. BDS experimental data was collected and analyzed using Novocontrol software. Further data analysis was performed using Origin software.
As detailed in previous work [
18], after electrical measurements at atmospheric pressure, the amorphous material underwent high-pressure–high-temperature treatment (HPHT), a crucial procedure in this study. The HPHT method [
17,
18,
19] was developed in IHHP PAS and successfully applied for the densification of crack-resistant glass [
21]. HPHT method is unique to IHPP PAS, as it is a simultaneous application of isostatic high pressure (HP) and high temperature (HT) to high volumes of up to 1 liter. Each glass sample was placed in a graphite crucible inside a high-pressure chamber [
16,
17,
18,
19]. Using a graphite heater, this chamber facilitated precise regulation of inert gas (N
2) pressure and temperature. The sample was subjected to a pressure of 1 GPa and heated up to 973 K (above the crystallization temperature of 901 K) to induce the nano-nucleation. The sample was then held in such an environment for 15 minutes. Next, the sample was rapidly cooled down to 873 K (between crystallization and glass transition temperatures of 873 K). Maintaining these conditions for over 30 minutes led to stabilizing the sample properties and their permanent preservation after returning to normal conditions. Finally, the material was cooled to room temperature, and the gas (i.e., nitrogen, pressurized medium) was decompressed to ambient pressure level (a more in-depth explanation is available in [
18]). Long-term monitoring confirmed that the effect of HPHT treatment on the sample's conductivity was stable for months. Values of temperatures and pressure were chosen based on thermal analysis under pressure [
17] and previous experiments with lithium based material [
15,
16].
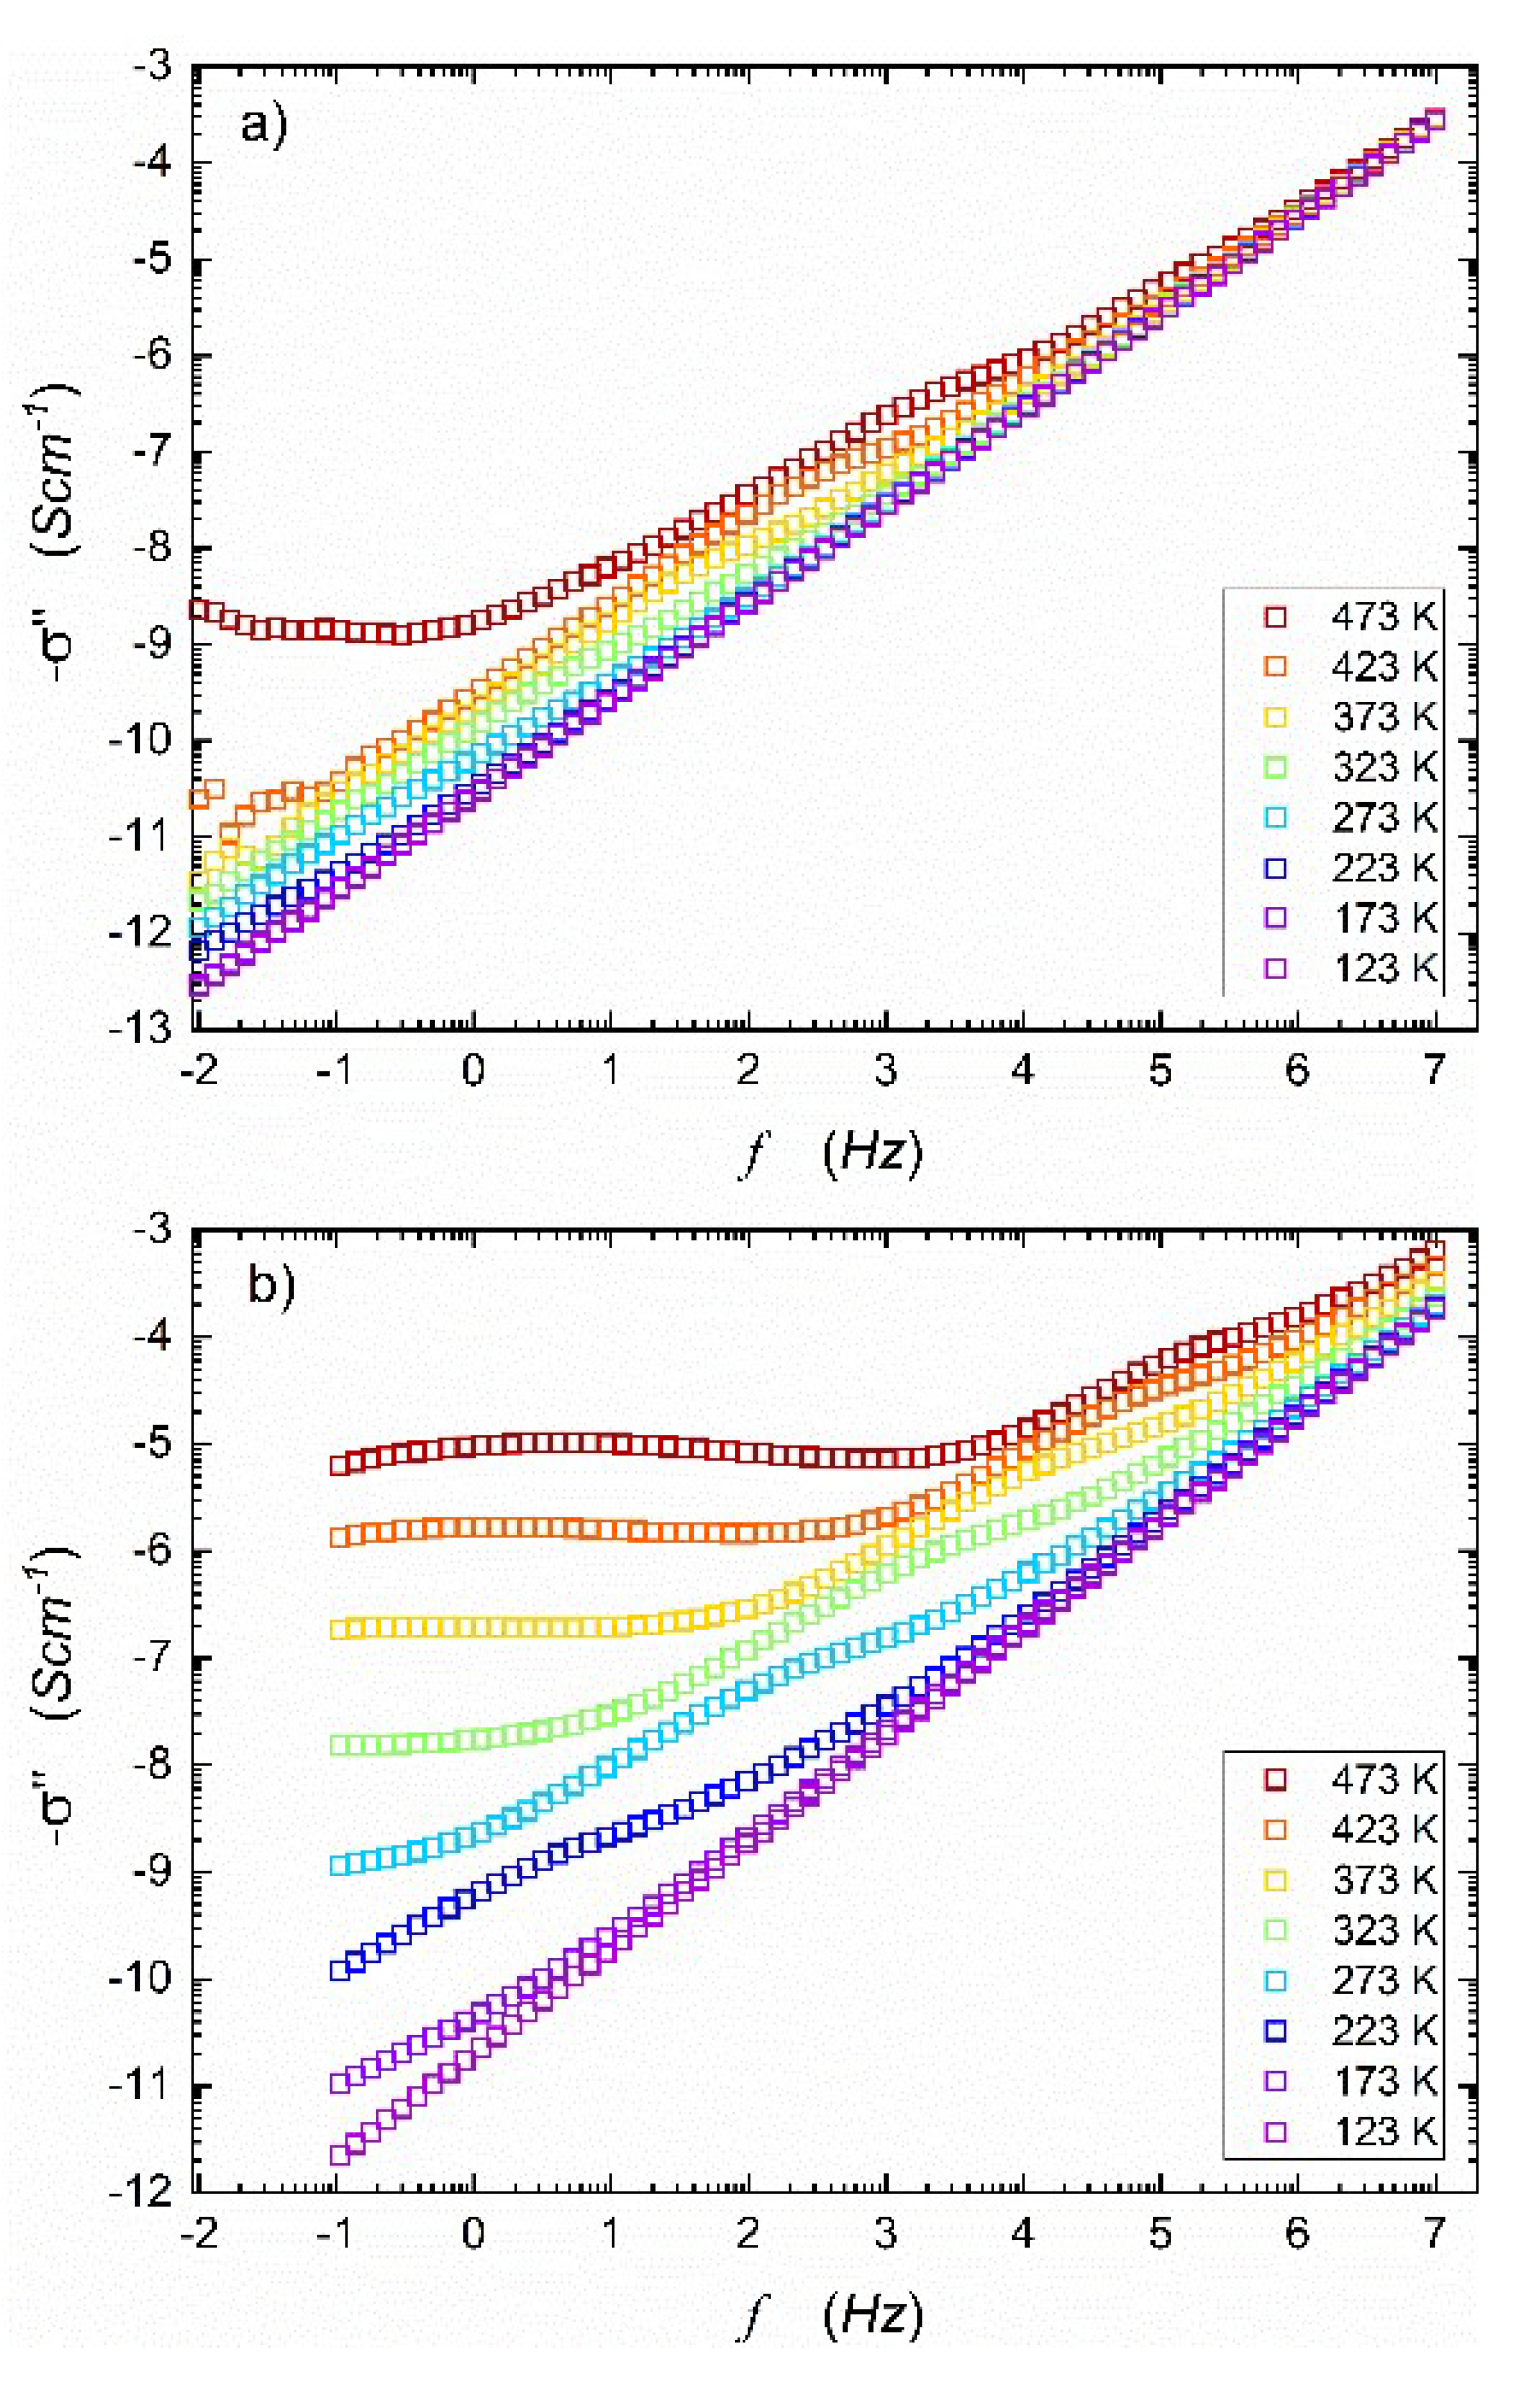
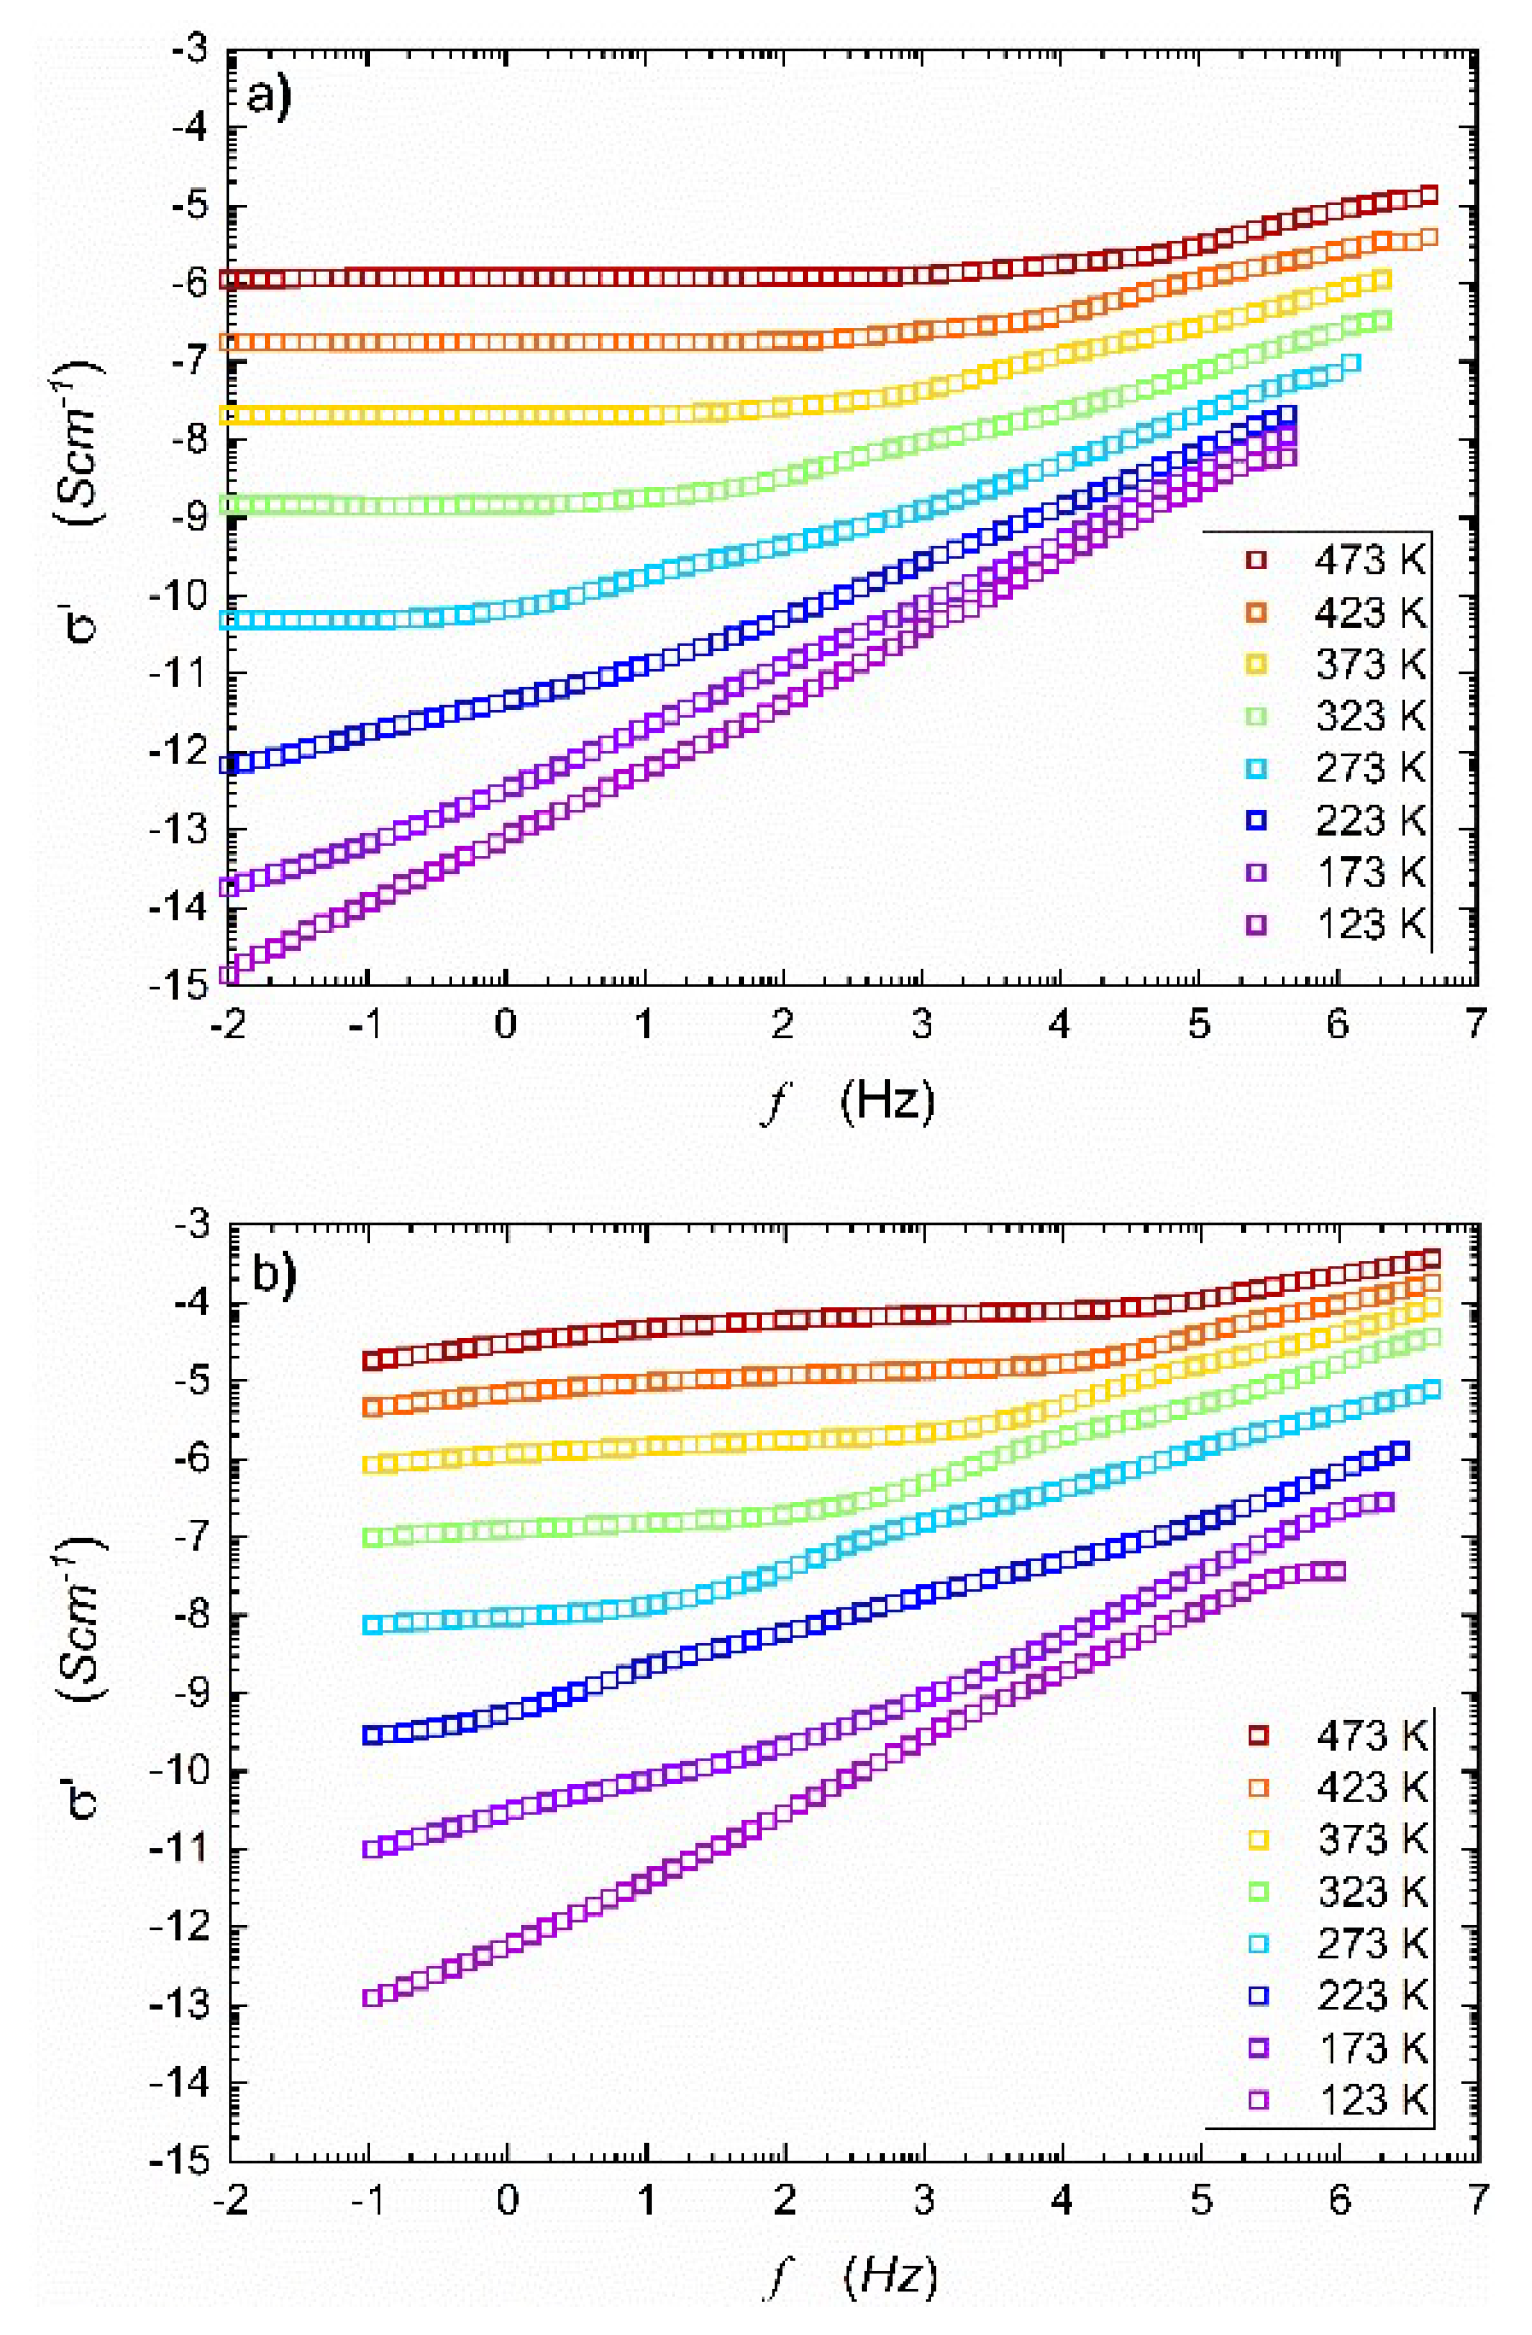
Figure 1 presents the real part of complex conductivity spectra taken for temperatures within (123 K – 473 K) range, before and after HPHT treatment. The imaginary component of electric conductivity is shown in
Figure A1, and the results for aged samples are presented in
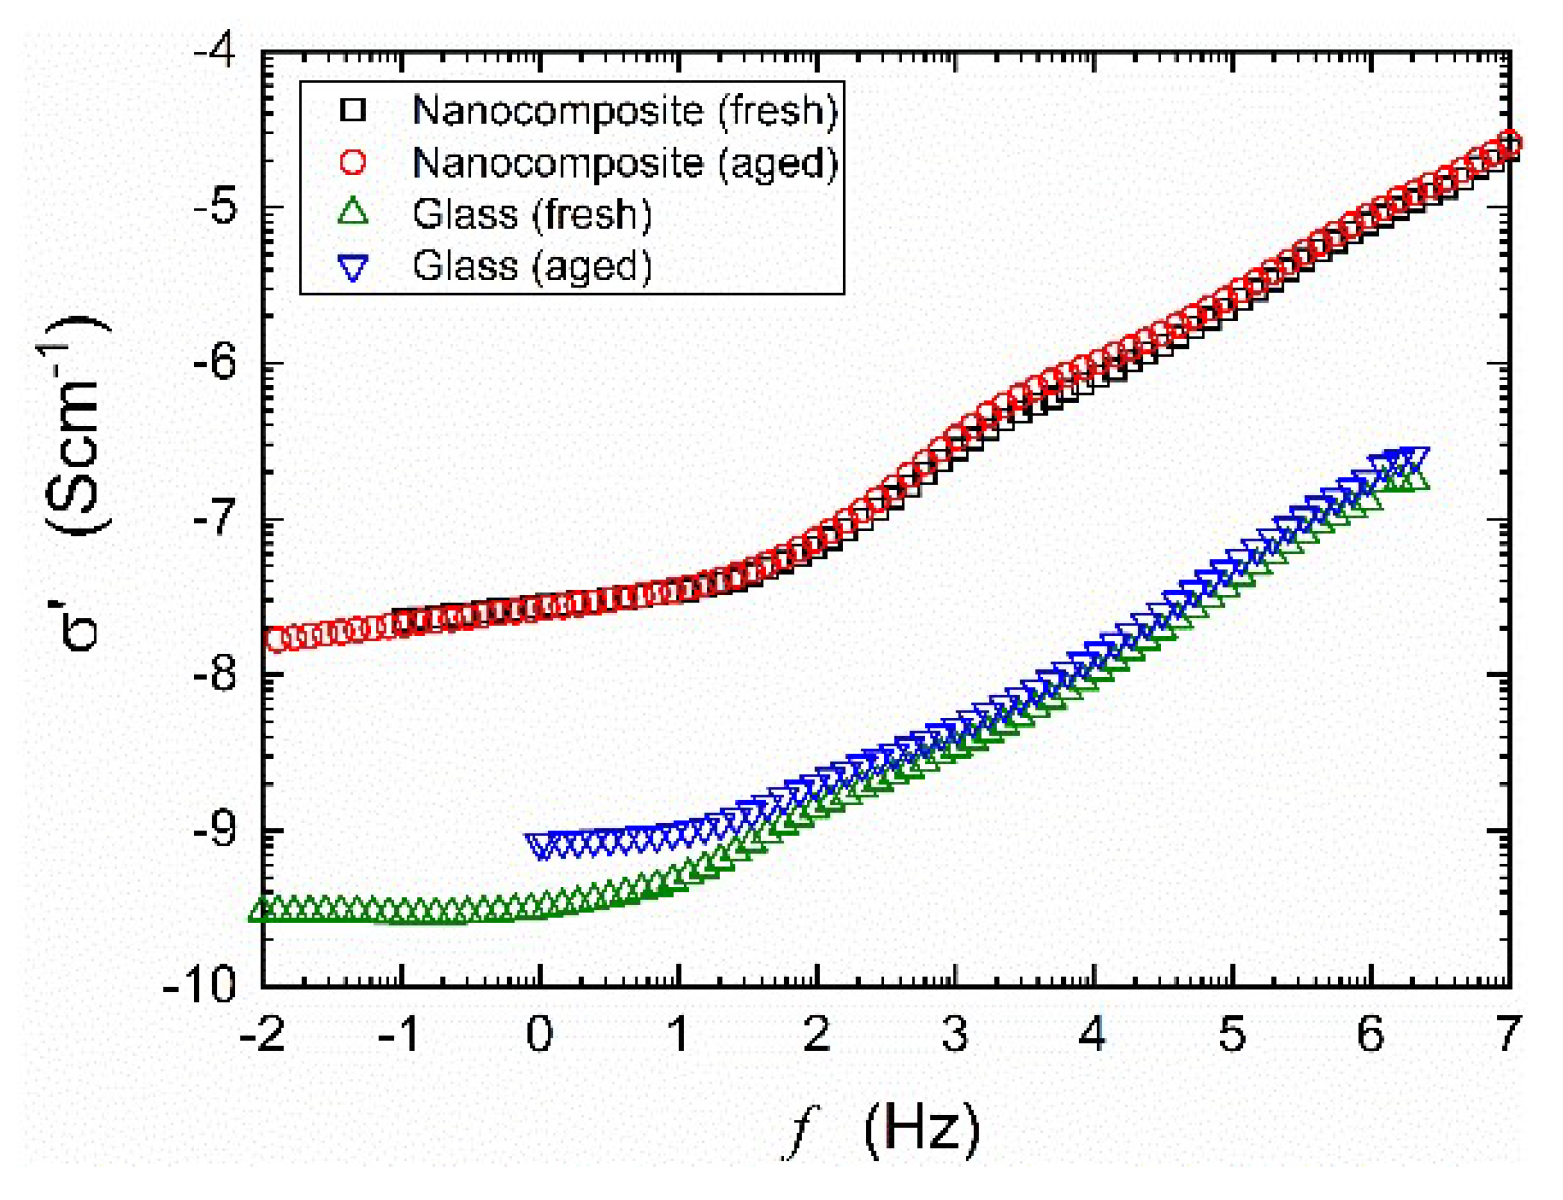
Figure A2. Generally, the single spectrum at a given temperature consists of two parts. The first one is a low-frequency plateau, corresponding to
and the second one - corresponds to AC conductivity. The onset frequency (border frequency between two parts) shifts into lower frequencies while temperature decreases. One must remember that the total electric conductivity resulting from electronic and ionic components is measured. In cathode materials like olivine-like LiFePO
4 or NaFePO
4, electronic components strongly predominate. As shown in
Figure 1a, at lower temperatures, the AC parts of the spectra start to dominate, and their slopes increase. Below 200 K, the AC conductivity component covers the whole frequency range, and no DC component is observed. At
an empirical relationship between conductivity and frequency may be expressed by
(see below). One may also observe some perturbation in the mid-frequency range of the spectra, especially noticeable for temperatures from 273 K to 323 K. It is apparently due to different responses of mobile electrons and ions to stimulating AC signal. It is consistent with the electric modulus studies described in ref. [
18].
Figure 1b shows a significant increase in the real part of AC conductivity after HTHP treatment. In this case, the middle-frequency parts of the spectra are even more pronounced, and onset frequencies shift to higher values when compared to
Figure 1a. Previous work [
18] showed that after HPHT treatment, the material consisted of two nanocrystalline, electrochemically active phases: NASICON (55%) and alluaudite (45%). Under such conditions, the discrepancy between ionic and electronic conductivity components is more visible, apparently due to the heterogeneity of the final nanocomposite. One may observe that true DC conductivity can only be measured in a limited temperature range (visible plateau ranging wide frequency range). However, the use of computer software fitting programs allowed for the estimation of apparent DC conductivity for frequency tending to zero. In this paper, it will be marked with
.
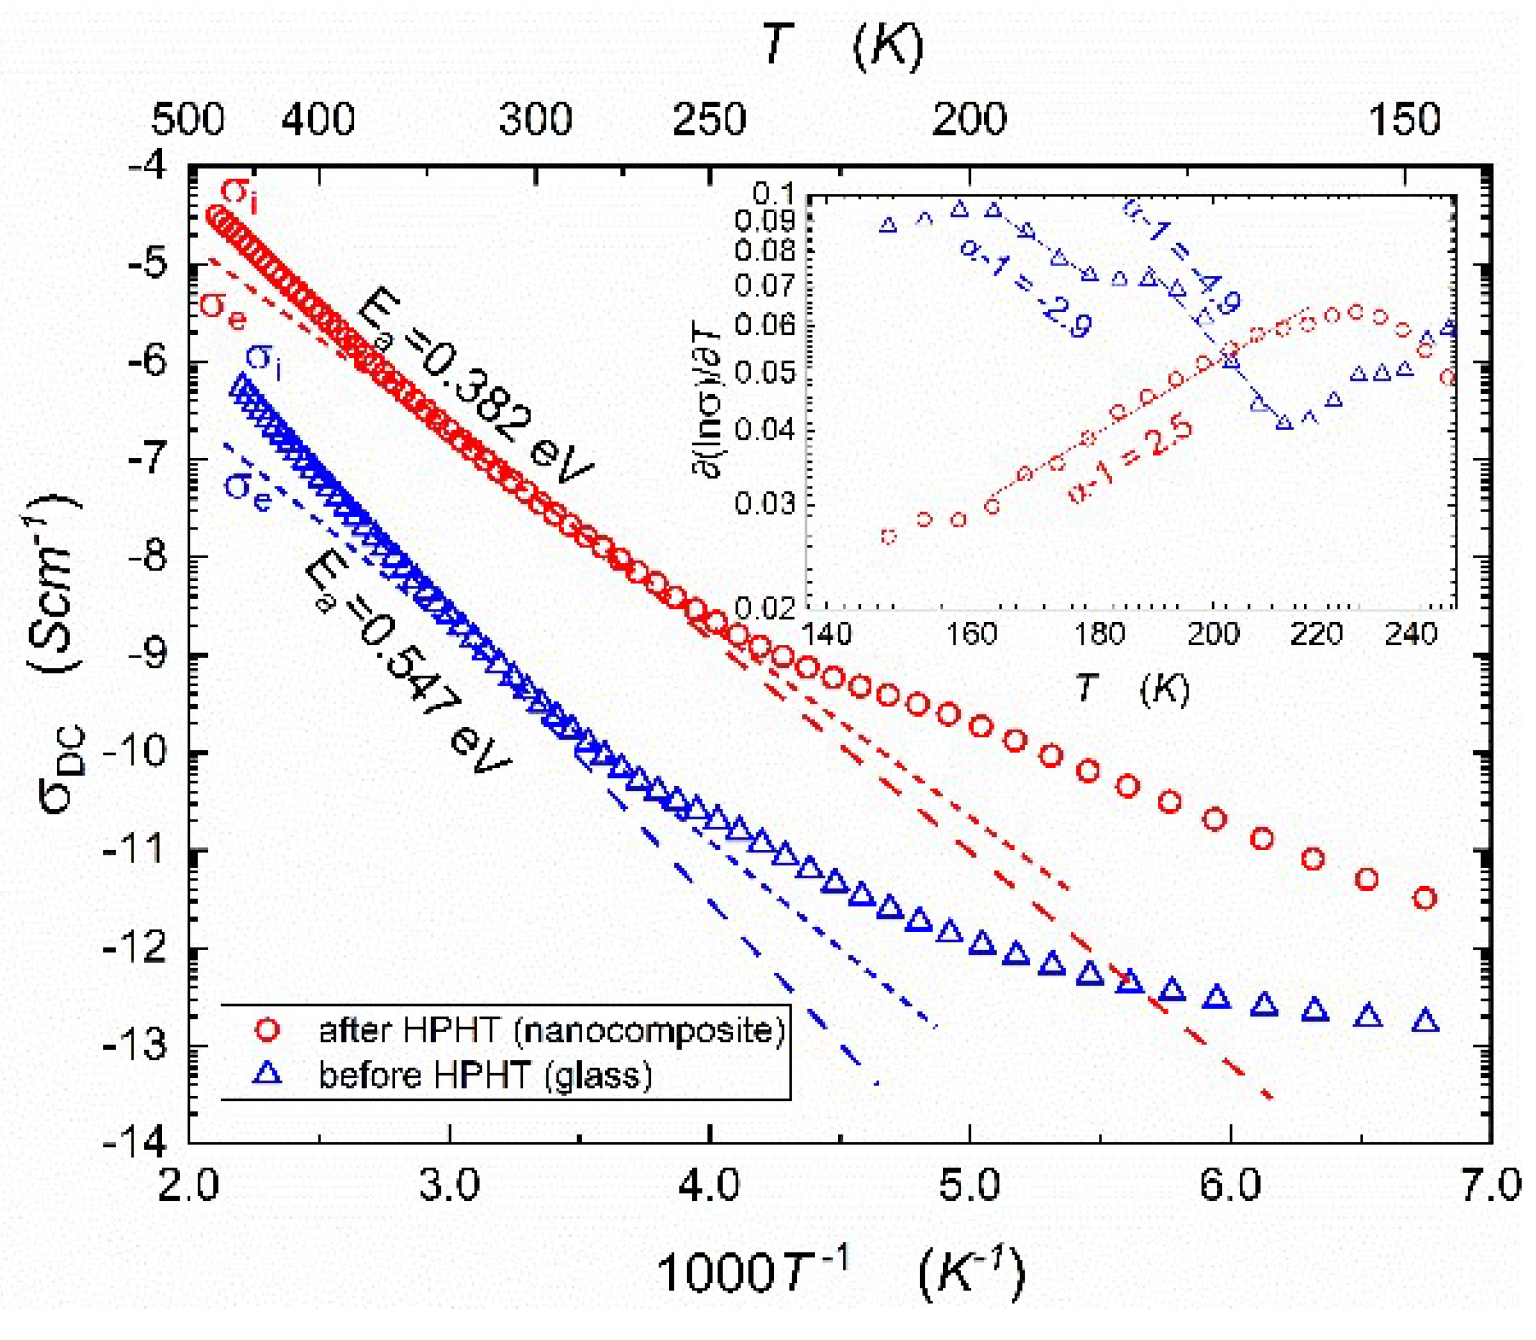
Temperature dependencies of apparent DC-conductivity for samples before and after HPHT treatment are shown in
Figure 2. The pressure-induced increase in
is significant and reaches 2 or even 3 orders of magnitude, depending on temperatures. According to Mott's theory [
22,
23] of electron hopping in disordered systems two, mentioned in the Introduction, temperature regimes can be distinguished. The low temperature one corresponds to variable range hopping, and the higher temperature regime is related to thermally activated phonon-assisted hopping [
18]. The activation energy of phonon-assisted hopping determined by us in [
18], for a narrower temperature range and from
plot, decreased from 0.57 eV (before HPHT) to 0.41 eV (after HPHT). Corresponding activation energies determined in this study from
empirical plots are equal: 0.55 eV and 0.38 eV, respectively.
Notable that total electric conductivity with a strong predominance of electronic components is measured. We postulate that mobile ions cause some irregularities, visible in
Figure 2, in the domain 200-300 K.
Ionic transference numbers
could be estimated from the Arrhenius plot, shown in Fig. 2, supplemented by the normalized formula:
Where and are estimated ionic and electronic conductivity, respectively. Arrhenius plot of ionic conductivity exhibits greater slope, because the activation energy of ionic conduction is higher than the activation energy for electronic conduction, and ionic conduction contributes to total conductivity mainly in the high-temperature range. In temperature 473K, the ionic contribution allows to estimate the transference numbers of glass and nanocomposite are equal 0.66 and 0.80, respectively. The crossover is linked to the value 0.5, estimating the crossover between discussed mechanisms.
3. Results and Discussion
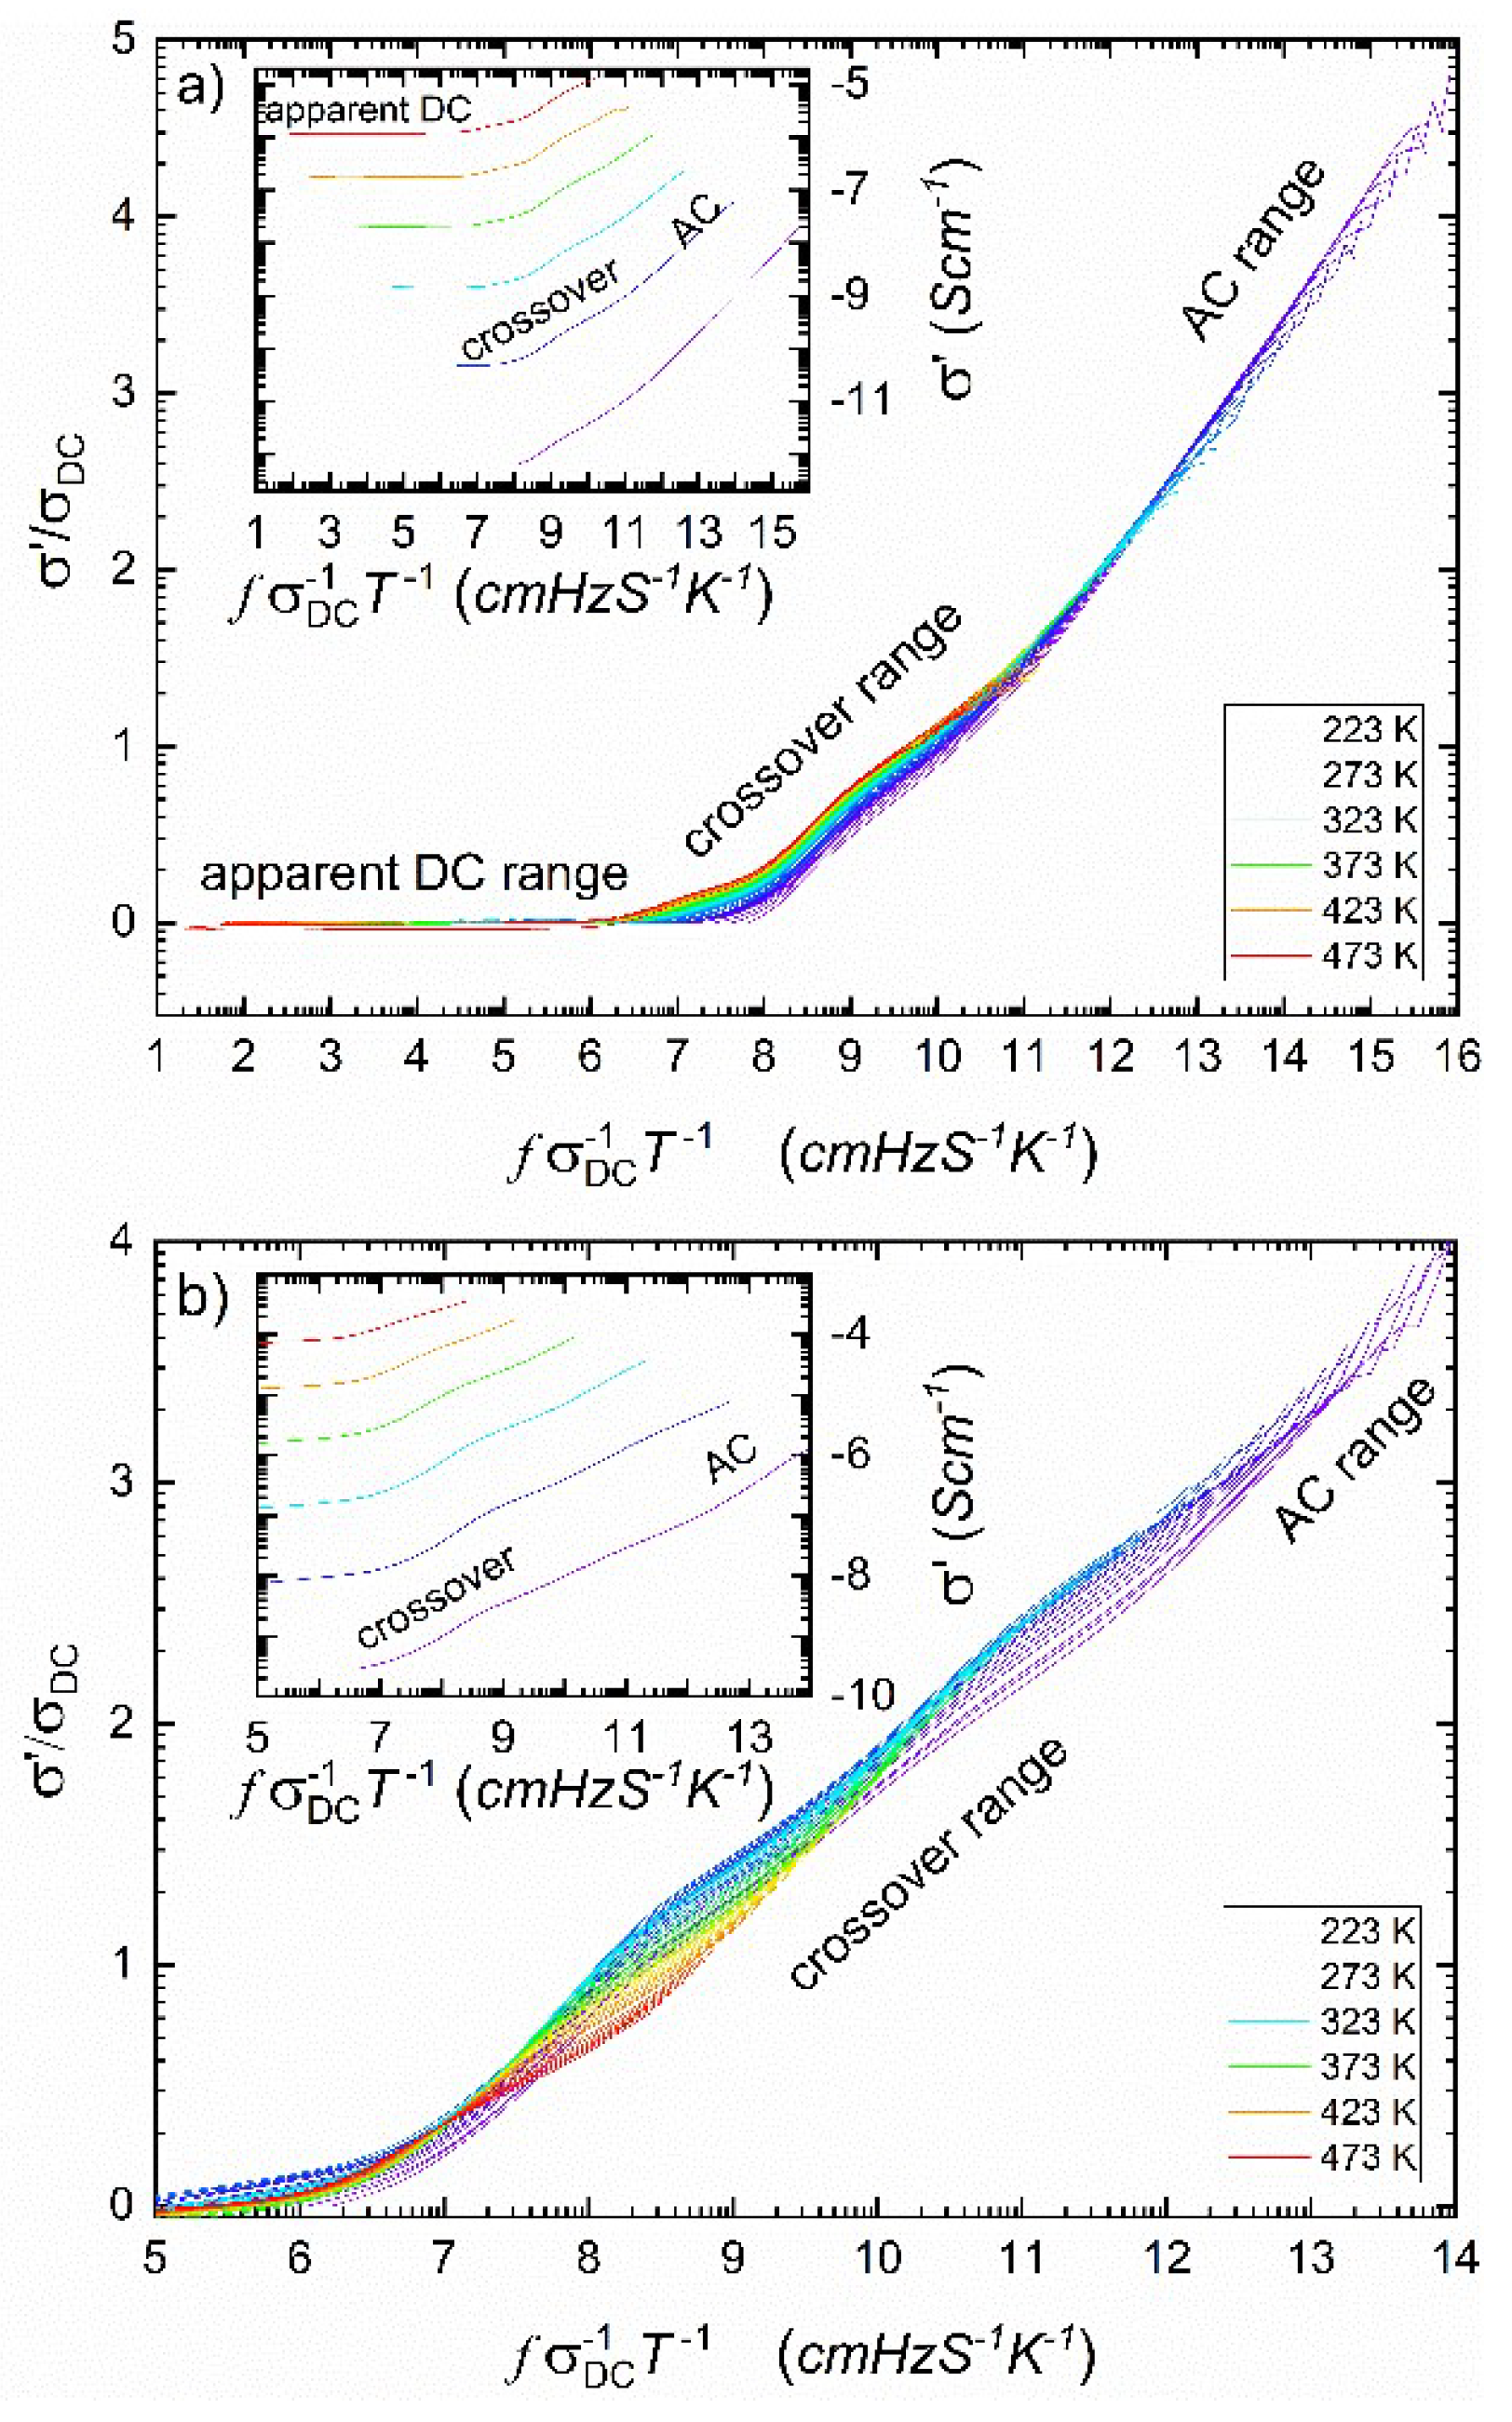
One of the methods showing the universality of Jonscher's scaling law Eq.(5) is a representation of
spectra in the form of a so-called
master curve [
39,
40]. Empirical crossover frequency
between DC conductivity and AC conductivity is thermally activated with the same activation energy as
and defined as [
39]:
Considering this, one can plot normalized conductivity values of
against normalized frequency
[
39]:
In the model case, all spectra should converge to a single curve with a high-frequency slope equal to one. The idea of master curves was more or less successfully applied to ionic conductive glasses [
31,
39,
40]. Numerous reports also deal with electronic or mixed electronic-ionic conductors, where electric charge transport occurs by a hopping mechanism [
41,
42,
43,
44,
45]. The results are depicted in
Figure 3.
As one can see, the plot shown in
Figure 3a is close to the proper master curve except for the middle-frequency range, in which we postulate overlapping of electronic and ionic hopping effects. This overlapping is even more pronounced in
Figure 3b, which relates to AC conductivity after HPHT treatment. Interestingly, after HPHT treatment, the ordering of single resolved curves in this range is inverted compared to the situation before treatment. (conf. Figs 3a and 3b).
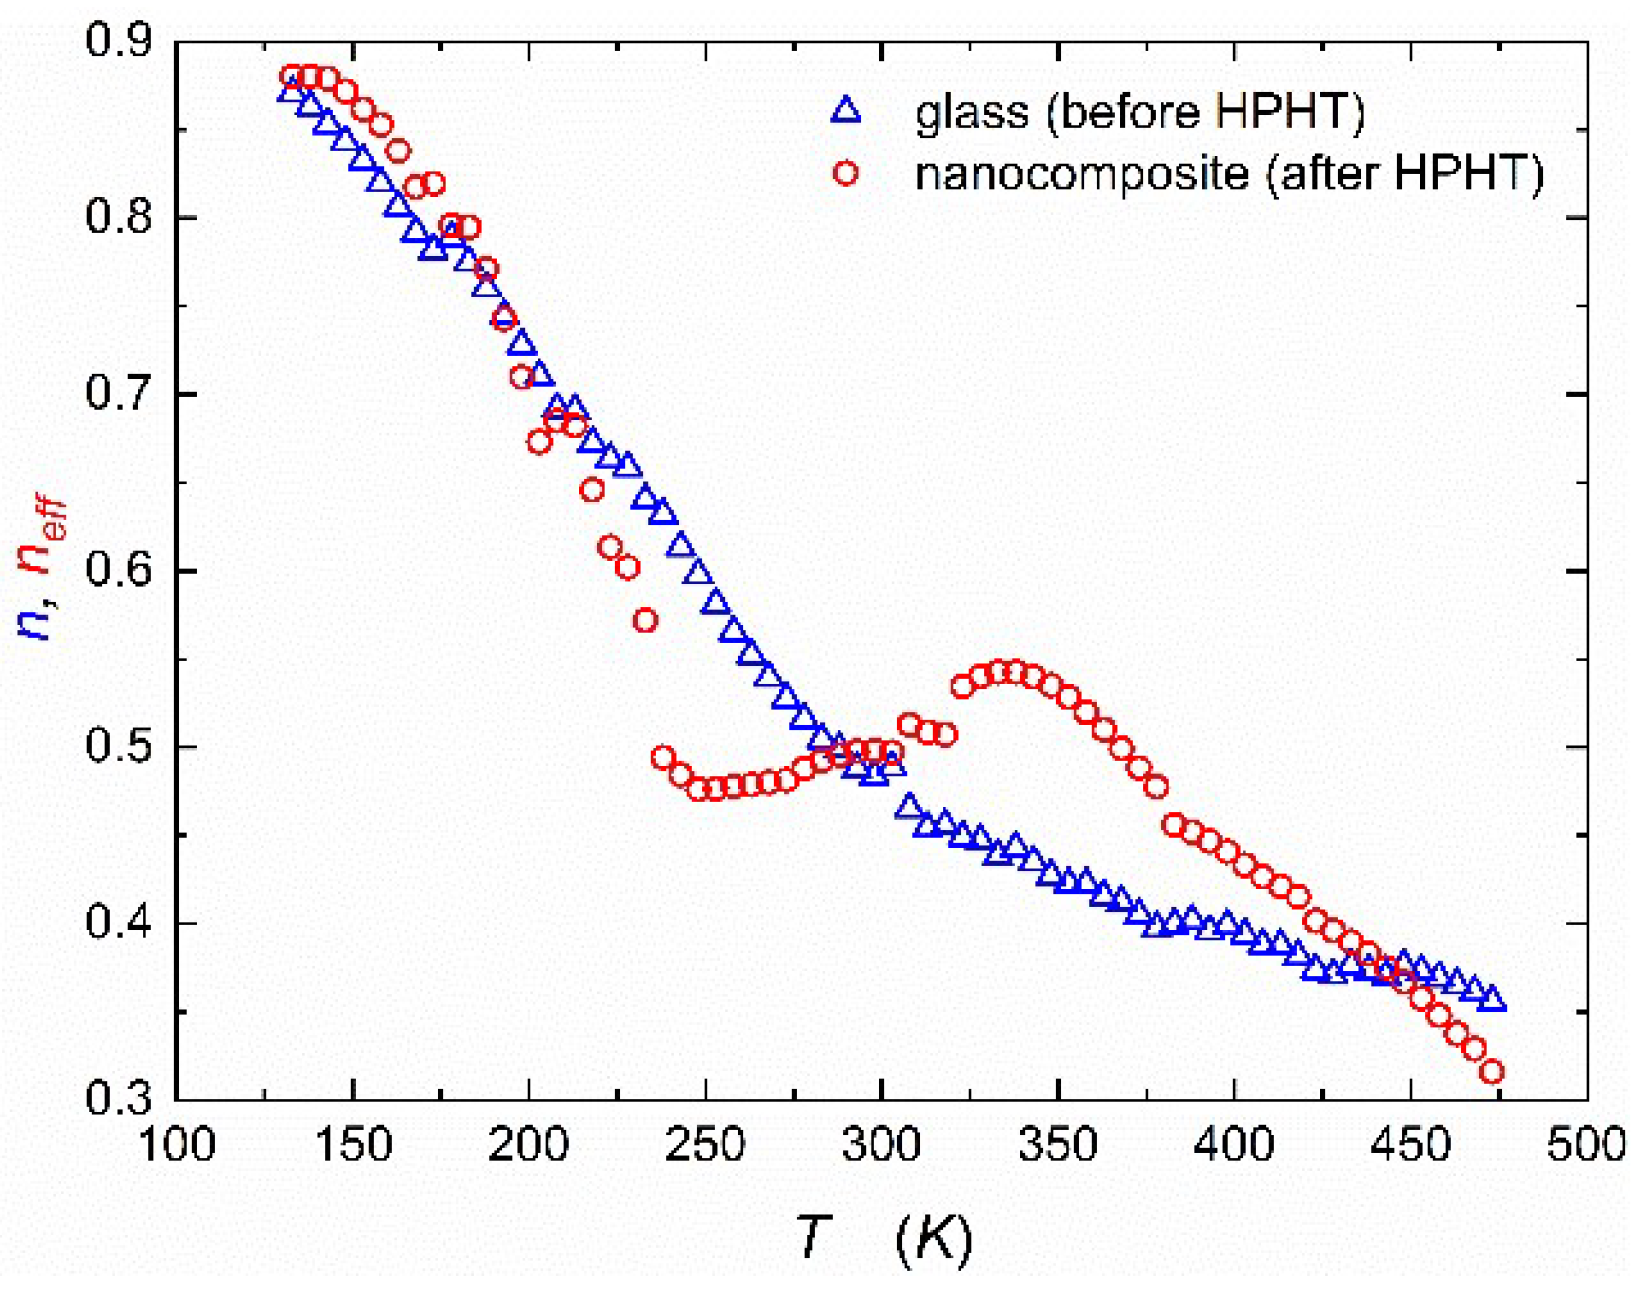
Figure 4 presents the temperature behavior of the exponent
from Jonscher’s scaling law Eq.(5) for samples before and after HPHT (high-pressure & high-temperature treatment). The values of exponent
change with temperature from 0.3 to 0.9. This change signifies a gradual transition of the frequency-dependence of electric conductivity. A value of
(or lower) typically indicates a case where the conductivity increases with frequency at a slower rate, known as sublinear behavior. On the other hand, when
, the conductivity exhibits a linear relationship with frequency, implying that the log of conductivity increases proportionally with the frequency logarithm. Therefore, the change observed in
Figure 4 reflects a variation from linear to sublinear frequency dependence in the conductivity behavior on the log-log scale. Two temperature ranges of
variations for the glassy state correlate well with two different transport regimes described earlier (variable-range hopping and phonon-assisted hopping). It is worth noting that values of
almost linearly decrease in the first range and stabilize around
in the second one.
An equivalent 3D network of resistors (
) and capacitors (
) often describes the response of solids subjected to AC field. It is assumed that power exponent
in Jonscher’s scaling law Eq.(5) is related to the fraction of resistors and capacitors in that network [
46,
47]. It is postulated that for values of
lower than 0.5, predominance of resistors takes place, and consequently, transport of charge carriers occurs mainly through percolation paths consisting of resistors (for
, there is only DC conduction). On the other hand, for
higher than 0.5, capacitors predominate, and percolation paths consist mainly of those elements (for
, there is pure AC conduction and
). The value of
is, therefore, a border between long-range migration and local movements of charge carriers.
The empirical run of exponent
after HPHT treatment is more complicated (
Figure 4). Because DC conductivity could only be estimated, only effective, averaged value of exponent could be estimated (
). Up to 200 K behavior is almost the same as in glassy state. When phonon-assisted hopping begins, the value of
decreases more rapidly than the glass case. The most intriguing observation relates to the temperature range between 270 to 320 K, when the value of
does not decrease but increases from around 0.45 to 0.55 (around the border value). That might mean a transient return to capacitor predominance in transport phenomena because of grain boundary effects in the nanocomposite. Furthermore, this evolution may relate to the shift from variable range hopping (VRH) to phonon-assisted hopping and the impact of interactions between sodium ions (Na
+) and polarons.
Figure 5a presents temperature dependencies of parameter
describing this part of conductivity, which corresponds to AC component (Eq.4). The lower curve in
Figure 5 relates to NaFePO
4 glass and the upper one to nanocomposite (after HPHT treatment). Depending on the temperature, a considerable increase in
is observed after pressure treatment (1-3 orders of magnitude). In the case of the native glass, one can also observe two distinct regions - corresponding to thermally activated phonon-assisted hopping (higher temperatures) and variable range hopping (VRH, lower temperatures). The activation energy of
determined from the high-temperature range is equal to
. This value is in reasonable agreement with the value of 0.37 eV obtained from an empirical relationship (Eq.8) [
33,
34,
35,
36,
37,
38], where the value of
(
Figure 4) and
[
18]. As one might expect
is lower than
. After HPHT treatment, the temperature dependence of A becomes much more complicated because of the presence of two nanocrystalline phases - alluaudite and NASICON [
18]. At temperatures above VRH regime (250 K) one may observe phonon-assisted hopping regime with
, which is in good agreement with the calculated value 0.20 eV, assuming values
(
Figure 4a) and
[
18]. As one can see, the dependence of
does not exhibit smooth regularity in the (330-500) K temperature range. This may be due to the heterogeneity of the composite (two nanophases) and different responses of electrons and ions to AC signal. It seems that at higher temperatures, the transport of Na
+ ions begins to dominate. The effective activation energy of that process is high because of a ramified network of grain boundaries and the small mobility of ions. In the low-temperature range, below 200 K, for both cases (before and after HTHP) the model of variable range hopping (VRH) may be fitted (Eq.1). In
Figure 5b, parameter
is plotted against
where one may observe linear dependence that confirms VRH mechanism [
48]. A brief analysis of the effect observed in this figure indicates an increase in the density of electron states (DOS) on the Fermi level after HPHT treatment [
49].
The hopping of Na
+ ions accompanies the hopping of electrons, but as our recent paper [
18] showed, the frequency of ion jumps is at least 1 order of magnitude lower than electron jumps. Perturbation of electron transport by mobile Na
+ ions is more pronounced after high-pressure treatment. Generally, high pressure destroys smooth temperature dependencies of
and
due to the build-up of sample heterogeneity (glass → nanocomposite). This is especially visible in the transition range from the first to the second mechanism of the electron hopping model.
5. Conclusions
Despite measurements performed to frequencies as low as 10 mHz DC conductivity could not be determined. Fitting allowed for the estimation of apparent DC conductivity. While low temperature (apparent) DC conductivity should conform to Mott’s law if governed by VRH, neither the reference glass nor nanocomposite samples follow this relation.
Frequency dependencies of AC conductivity in studied samples fulfill Jonscher’s scaling law (universal dispersion response) Eq.(5). Depending on the temperature, the values of power exponent (or ) vary in (0.3 -0.9) range, and parameter describing AC component of conductivity is thermally activated. The temperature dependence of for NaFePO4 glass resembles the temperature behavior of DC conductivity with two temperature regimes: variable range hopping (for lower temperatures) and thermally activated phonon-assisted hopping (for higher temperatures). The activation energy of AC conduction determined for glass and nanocomposite are equal to and respectively. They are is lower than the corresponding DC values and , fulfilling the empirical rule . (The natural consequence of AC and DC conduction corresponding to local and long-range charge transport, respectively, is Eq.7),
After high-pressure treatment, DC conductivity cannot be directly determined even at those low frequencies. However, the fitting allows for the estimation of apparent DC conductivity. AC and apparent DC conductivity values increase by 2 – 3 orders of magnitude, depending on temperature, due to decreased distance between Fe2+/Fe3+ hopping centers. The observed at c.a. 270 K change of effective power exponent from higher values (0.9-0.5 range) to lower ones (stabilized at about 0.4) is related to a smooth transition from variable range hopping (VRH) to phonon-assisted hopping (PAH).
To summarize, electron (polaron) conductivity governs glass material's conductivity. However, the increase in the nanocomposite’s pressure-induced electron conductivity is partially limited by ion-transport reduction due to introduced heterogeneity and grain boundaries limiting long-range ion transport.
Author Contributions
Conceptualization, Aleksander Szpakiewicz-Szatan, Szymon Starzonek, Jerzy Garbarczyk, Tomasz Pietrzak, Michał Boćkowski and Sylwester Rzoska; Formal analysis, Aleksander Szpakiewicz-Szatan, Szymon Starzonek, and Jerzy Garbarczyk; Funding acquisition, Sylwester Rzoska; Investigation, Aleksander Szpakiewicz-Szatan; Project administration, Sylwester Rzoska; Resources, Jerzy Garbarczyk, Tomasz Pietrzak, Michał Boćkowski and Sylwester Rzoska; Supervision, Jerzy Garbarczyk and Sylwester Rzoska; Visualization, Aleksander Szpakiewicz-Szatan; Writing – original draft, Aleksander Szpakiewicz-Szatan, Szymon Starzonek, Jerzy Garbarczyk and Sylwester Rzoska; Writing – review & editing, Aleksander Szpakiewicz-Szatan and Sylwester Rzoska.
Funding
The research carried out by ASS, SJR, TKP, JEG were supported by the Polish National Science Centre (Poland) through the grant no. 2022/45/B/ST5/04005, supporting the cooperation of IHPP PAS and Warsaw Technical University (Poland), guided by S.J. Rzoska and J.E. Garbarczyk. SS was supported by grants: P2-0232, J2-4447, J3-3066, J3-2533, and J3-3074 (Slovenia).
Data Availability Statement
Data is available upon personal request.
Acknowledgments
HPHT formation was possible due to the courtesy of Institute of High Pressure Physics of the Polish Academy of Sciences NL-3 Laboratory. BDS studies were carried out in NL10 (X-PresMatter) lab of IHPP PAS.
Conflicts of Interest
The authors declare no conflicts of interest.
Appendix A
Figure A1.
Series of spectra of imaginary parts of the complex conductivity of NaFePO4 measured at various temperatures before a) and after b) HPHT treatment (, ). After HPHT treatment increase in value (imperfect capacitive behavior) may be observed and linked with increase of short-range transport in relation to long-range transport.
Figure A2.
Series of spectra of real parts of the complex conductivity of NaFePO4 measured at room temperature before a) and after b) HPHT treatment (, ) of fresh and aged (for 2 weeks) samples. Nanocomposite (glass after HPHT treatment) remains stable over time, while untreated glass changes it’s conductivity when aging.
References
- Świętosławski, M.; Bakierska, M; Pacek, J.; Chudzik, K.; Lis, M., Marszałowicz; W., Knura R.; Molenda, M. Integrated and sustainable solutions for Li-ion energy storage systems. Adv. Inorg. Chem. 2018, 72, 287–321.
- Booth, S.G.; Nedoma A.J.; Anthonisamy, N.A.; Baker, P.J.; Boston, R.; Bronstein, H.; Clarke, S.J.; Cussen, E.J.; Daramalla, V.; De Volder, M. Perspectives for next generation lithium-ion battery cathode materials. APL Mater. 2021, 9, 109201. [CrossRef]
- Shi, C.; Hamann, T.; Takeuchi, S.; Alexander, G.V.; Nolan, M.N.; Limpert, M.; Fu, Z.; O’Neill, J.; Godbey,G.; Dura, J.A.; Wachsman, E.D. 3D Asymmetric bilayer garnet-hybridized high-energy-density lithium−sulfur batteries. ACS Appl. Mater. Interfaces 2023, 15, 751−760.
- Kim, J.; Seo, D.H.; Kim, H.; Park, I.; Yoo, J.K.; Jung, S.K.; Park, Y.U.; Goddard, W.; Kang, K. Unexpected discovery of low-cost maricite NaFePO4 as a high-performance electrode for Na-ion batteries. Energy Environ. Sci. 2015, 8, 540–545. [CrossRef]
- Bong, J.H.; Adams, S. Molecular dynamics simulations of amorphous NaFePO4 as an Na-ion battery cathode material. Funct. Mater. Lett. 2021, 14, 2141006. [CrossRef]
- Trad, K.; Carlier, D.; Croguennec, L.; Wattiaux, A.; Amara, M.B.; Delmas, C. NaMnFe2(PO4)3 Alluaudite phase: synthesis, structure, and electrochemical properties as positive electrode in lithium and sodium batteries. Chem. Mater. 2010, 22, 5554–5562. [CrossRef]
- Padhi, A.K.; Nanjundaswamy, K.S.; Goodenough, J.B. Phospho-olivines as positive-electrode materials for rechargeable lithium batteries. J. Electrochem. Soc. 1997, 144, 1188–1194. [CrossRef]
- Fang, Y.; Zhang, J.; Xiao, L.; Ai, X.; Cao, Y.; Yang, H. Phosphate framework electrode materials for sodium ion batteries. Adv. Sci. 2017, 4, 1600392. [CrossRef]
- Zaghib, K.; Trottier, J.; Hovington, P.; Brochu, F.; Guerfi, A.; Mauger, A.; Julien, C. Characterization of Na-based phosphate as electrode materials for electrochemical cells. J. Power Sources 2011, 196, 9612–9617. [CrossRef]
- Nowak, M.; Walczak, K.; Milewska, A.; Płotek, J.; Budziak, A.; Molenda, J. Electrochemical performance of different high-entropy cathode materials for Na-ion batteries. J. Alloys Compd. 2023, 968, 172316. [CrossRef]
- Nowak, M.; Zając, W.; Molenda, J. Environmentally friendly, inexpensive iron-titanium tunneled oxide anodes for Na-ion batteries, Energy 2022, 239, 122388.
- Zhao, E.L.; Zhao, S.X.; Wu, X.; Li, J.W.; Yu, L.Q.; Nan, C.W.; Cao,G. Electrochemical performance of Li2O-V2O5-SiO2-B2O3 glass as cathode material for lithium ion batteries. J. Mater. 2019, 5, 663-669. [CrossRef]
- Matthew, V.; Kim, S.; Kang, J.; Gim, J.; Song, J.; Baboo, J.P.; Park, W.; Ahn, D.; Han, J.; Gu, L.; Wang, Y.; Hu, Y.S.; Sun, Y.K.; Kim, J. Amorphous iron phosphate: potential host for various charge carrier ions. NPG Asia Mater. 2014, 6, 138–138. [CrossRef]
- Delmer, O.; Balaya, P.; Kienle, L.; Maier, J. Enhanced potential of amorphous electrode materials: case study of RuO2. Adv. Mater. 2008, 20, 501–505. [CrossRef]
- Prosini, P.P.; Lisi, M.; Scaccia, S.; Carewska, M.; Cardellini, F.; Pasquali, M. Synthesis and characterization of amorphous hydrated FePO4 and its electrode performance in lithium batteries. J. Electrochem. Soc. 2002, 149, 297–301. [CrossRef]
- Baranowski, P.; Starzonek, S.; Drozd-Rzoska, A.; Rzoska, S. J.; Bockowski, M.; Keblinski, P.; Pietrzak, T. K.; Garbarczyk, J. E. Multifold pressure-induced increase of electric conductivity in LiFe0.75V0.10PO4 glass. Sci. Rep. 2019, 9, 16607. [CrossRef]
- Starzonek, S.; Szpakiewicz-Szatan, A.; Rzoska, S. J.; Drozd-Rzoska, A.; Boćkowski, M.; Pietrzak, T. K.; Garbarczyk, J. E. Pressure-driven relaxation processes in nanocomposite ionic glass LiFe0.75V0.10PO4. J. Non Cryst. Solids 2023, 605, 122163. [CrossRef]
- Szpakiewicz-Szatan, A.; Starzonek, S.; Pietrzak, T. K.; Garbarczyk, J. E.; Rzoska,. S. J.; Boćkowski, M. Novel high-pressure nanocomposites for cathode materials in sodium batteries. Nanomaterials 2022, 13, 164. [CrossRef]
- Szpakiewicz-Szatan, A.; Pietrzak, T. K.; Sierakowski, K.; Boćkowski, M.; Rzoska, S. J.; Garbarczyk, J. E.; Starzonek, S. Nanocrystallization of Bi2O3 based system from the glassy state under high compression. Materialia 2024, 33, 101975. [CrossRef]
- Kapoor, S.; Guo, X.; Youngman, R.E.; Hogue, C.L.; Mauro, J.C.; Rzoska, S.J.; Boćkowski, M.; Jensen, L.R.; Smedskjaer, M.M. Network glasses under pressure: permanent densification in modifier-free Al2O3−B2O3−P2O5−SiO2 systems. Phys. Rev. Applied 2017, 7, 054011. [CrossRef]
- Xu, M.; Li, Y.; Ma, Y. (2022). Materials by design at high pressures. Chem. Sci. 2010, 13, 329–344. [CrossRef]
- Mott, N. Electrons in disordered structures. Adv. Phys. 1967, 16, 49–144. [CrossRef]
- Austin, I.; Mott, N. Polarons in crystalline and non-crystalline materials. Adv. Phys. 1969, 18, 41–102. [CrossRef]
- Dwibedi, D.; Barpanda, P.; Yamada, A. Alluaudite battery cathodes. Small Methods 2020, 4, 2000051. [CrossRef]
- Meins, J.L.; Crosnier-Lopez, M.; Hemon-Ribaud, A.; Courbion, G. Phase Transitions in the Na3M2(PO4)2F3 family (M =Al3+, V3+, Cr3+, Fe3+, Ga3+): synthesis, thermal, structural, and magnetic studies. J. Solid State Chem. 1999, 148, 260 – 277. [CrossRef]
- Jonscher, A. K. Dielectric relaxation in solids. J. Phys. D Appl. Phys. 1999, 32, 57–70. [CrossRef]
- Jonscher, A. The ‘universal’ dielectric response. Nature 1977, 267, 673–679. [CrossRef]
- Chełkowski, A. Fizyka Dielektryków; Wyd. 3 zm.; Wydawnictwo Naukowe PWN, Warszawa, Poland, 1993; ISBN 830111245X.
- Jonscher, A.K. Dielectric Relaxation in Solids; Chelsea Dielectrics Press Limited, London, UK, 1983; ISBN 0950871109.
- Belin, R.; Taillades, G.; Pradel, A.; Ribes, M. Ion dynamics in superionic chalcogenide glasses: complete conductivity spectra. Solid State Ion. 2000, 136-137, 1025-1029. [CrossRef]
- Cramer, C.; Buscher, M. Complete conductivity spectra of fast ion conducting silver iodide/silver selenate glasses. Solid State Ion. 1998, 105, 109-120. [CrossRef]
- Kumar, M. M.; Ye, Z. G. Scaling of conductivity spectra in the acceptor-doped ferroelectric SrBi2Ta2O9. Phys. Rev. B Condens. Matter Mater. Phys. 2005, 72, 024104. [CrossRef]
- Pradel, A.; Taillades, G.; Cramer, C.; Ribes, M. Ion dynamics in superionic chalcogenide glasses studied in large frequency and temperature ranges. Solid State Ion. 1998, 105, 139–148. [CrossRef]
- Elliott, S. R.; Owens, A. P. The diffusion-controlled relaxation model for ionic transport in glasses. Philos. Mag. B 1989, 60, 777–792. [CrossRef]
- Petersen, J.; Dieterich. W. Effects of Coulomb interaction and disorder in a stochastic lattice gas. Philos. Mag. B 1992, 65, 231–241. [CrossRef]
- Maass, P.; Petersen, J.; Bunde, A.; Dieterich, W.; Roman, H. E. Non-Debye relaxation in structurally disordered ionic conductors: effect of Coulomb interaction. Phys. Rev. Lett. 1991, 66, 52–55. [CrossRef] [PubMed]
- Funke, K. Jump relaxation in solid electrolytes. Prog. Solid State Chem. 1993, 22, 111–195. [CrossRef]
- Ngai, K. L.; Rendell, R. W.; León, C. The crossover from the near constant loss to ion hopping AC conductivity in ionic conductors: the crossover times. J. Non Cryst. Solids 2002, 307–310, 1039–1049.
- Roling, B.; Happe, A.; Funke, K.; Ingram M. D. Carrier concentrations and relaxation spectroscopy: new information from scaling properties of conductivity spectra in ionically conducting glasses. Phys. Rev. Lett. 1997, 78, 2160. [CrossRef]
- Roling B. Scaling properties of the conductivity spectra of glasses and supercooled melts. Solid State Ion. 1998, 105, 185-193. [CrossRef]
- Raddaoui, Z.; El Kossi, Z.; Brahem, R.; Bajahzar, A.; Trukhanov, A.V.; Kozlovskiy, A.L.; Zdorovets, M.V.; Dhahri, J.; Belmabrouk, H. Hopping conduction mechanism and impedance spectroscopy analyses of La0.70Sr0.25Na0.05Mn0.70Ti0.30O3 ceramic. J. Mater Sci: Mater Electron. 2021, 32, 16113–16125. [CrossRef]
- Almond, D.; Duncan, G.; West, A. The determination of hopping rates and carrier concentrations in ionic conductors by a new analysis of AC conductivity. Solid State Ion. 1983, 8, 159–164. [CrossRef]
- Almond, D.; Hunter, C.; West, A. The extraction of ionic conductivities and hopping rates from AC conductivity data. J. Mater. Sci. 1984, 19, 3236–3248. [CrossRef]
- Dyre, J.C.; Schrøder, T.B. Hopping models for ion conduction in noncrystals. In Superionic Conductor Physics, Proceedings of the 1st International Discussion Meeting, Kyoto, Japan, 10 - 14 September 2003; Kawamura, J., Yoshikado, S., Sakuma, T., Michihiro, Y., Aniya, M., Ito Y., Eds.; World Scientific Publishing: Singapore, Singapore, 2007; pp. 97–102.
- Morgan, B.J. Understanding fast-ion conduction in solid electrolytes. Philos. Trans. A Math. Phys. Eng. Sci. 2021, 379, 20190451. [CrossRef]
- Zhai. C.; Hanaor. D.; Gan, Y. Universality of the emergent scaling in finite random binary percolation networks. PLoS ONE 2017, 12, 0172298.
- Murphy, K. D.; Hunt, G. W.; Almond, D. P. Evidence of emergent scaling in mechanical systems. Philos. Mag. 2006, 86, 3325–3338,. [CrossRef]
- Pietrzak, T. K.; Maciaszek, M.; Nowiński, J. L.; Ślubowska, W.; Ferrari, S.; Mustarelli, P.; Wasiucionek M.; Wzorek M.; Garbarczyk, J. E. Electrical properties of V2O5 nanomaterials prepared by twin rollers technique. Solid State Ion. 2012, 225, 658–662. [CrossRef]
- Pietrzak T.K.; Wasiucionek M.; Garbarczyk J.E. Towards higher electric conductivity and wider phase stability range via nanostructured glass-ceramics processing. Nanomaterials 2021, 11, 1321. [CrossRef] [PubMed]
|
Disclaimer/Publisher’s Note: The statements, opinions and data contained in all publications are solely those of the individual author(s) and contributor(s) and not of MDPI and/or the editor(s). MDPI and/or the editor(s) disclaim responsibility for any injury to people or property resulting from any ideas, methods, instructions or products referred to in the content. |
© 2024 by the authors. Licensee MDPI, Basel, Switzerland. This article is an open access article distributed under the terms and conditions of the Creative Commons Attribution (CC BY) license (http://creativecommons.org/licenses/by/4.0/).

