2. Materials and Methods
The present study was approved by the Ethics Committee of the University of Medicine and Pharmacy of Craiova, Romania (approval reference no. 127/09.04.2024), in accordance with the ethical guidelines for research with human participants of the University of Medicine and Pharmacy of Craiova, Romania. Written informed consent was obtained from the patient involved in the study.
In order to carry out this experimental study, we examined the case of a female subject, who presented herself in the Orthodontic Clinic of the Faculty of Dental Medicine of the University of Medicine and Pharmacy in Craiova, Romania.
After the orthodontic examination, the patient was diagnosed with Angle class I malocclusion, dento-alveolar disharmony with crowding. It was decided to apply a fixed metallic orthodontic appliance, using the straight-wire technique.
At the same time, for this research, the patient underwent a bimaxillary CBCT imaging investigation. A set of 586 tomographic images was used.
A Lenovo laptop computing system with the following technical characteristics was used: INTEL Core I5 processor with a frequency of 2.9 GHz; classic hard disk of 930 GB; RAM memory of 16 Gb; SSD hard disk of 476 GB; Windows 10 64-bit operating system.
The thermal simulations applied to the models, using the finite element method, the processing and organization of the obtained data, but also for the generation of virtual models, were obtained with a Hewlett Packard graphics station with the following main technical characteristics: processor-Intel® Core™ i9-13900K (up to 5.8 GHz with Intel® Turbo Boost Technology, 36 MB L3 cache, 24 cores); processor cache-L3 of 36 MB; family-13th generation Intel® Core™ i9 processor; memoryRAM MHz DDR5-4800 of 64 GB (4 x 16 GB); graphics-NVIDIA RTX™ A4500 (20 GB dedicated GDDR6 memory); graphics-Intel® UHD Graphics; memory and storage-64 GB memory/ TB SSD storage; memory Slots-4 DIMMs; internal Storage-SSD HP Z Turbo Drive PCIe® NVMe™ TLC of 1 TB; operating system-Windows 11 Pro.
InVesalius (CTI, Campinas, Brazil) is a free download program for the generation of three-dimensional geometric structures starting from sets of images obtained by computed tomography (CT or CBCT) or by magnetic resonance. The program is dedicated to research in the medical field which, based on the different shades of gray of the human body tissues, allows the obtaining of a primary geometry. This primary geometry consists of "clouds of points" and it is contained in stereolithography type files (obj, stl), similar to those obtained by three-dimensional scanning.
Geomagic (3D Systems, Rock Hill, SC, USA) is a program dedicated to Reverse Engineering that allows the processing of files that contain "clouds of points". It is known that the primary geometry of tissues contains so-called artifacts, i.e. virtual objects that do not exist in the human body, but which appear on tomographic images, due to the effects generated by the phenomena of refraction and reflection of X-rays. Also, this software allows the elimination of non-conforming surfaces, self-intersections surfaces, etc.
SolidWorks (Dassault Systèmes, Velizy-Villacoublay, France) is a computer-aided design (CAD) program that uses techniques and methods specific to Direct Engineering. This software allows the chaining of shapes to generate a virtual solid, but also the operation in environments specific to Multi Body models. For example, a perfectly closed surface generated in Geomagic is automatically transformed into a virtual solid in SolidWorks.
Ansys Workbench (Ansys, Inc., Canonsburg, PA, USA) is a software that allows the simulation of a multitude of physical phenomena applied to some virtual solid models and allows obtaining their physical behavior based on the result maps. This program operates with algorithms specific to the finite element method.
This program package (Microsoft Corporation, Redmond, Washington, USA) was used to organize and interpret the data obtained from the result maps given by the simulations in Ansys, but also to obtain some figures, graphs or diagrams.
For the development of thermal simulations, the following methods were used:
- Direct Engineering methods, included, in particular, in the SolidWorks program, which allow the generation of virtual objects similar to reality models, such as orthodontic arches or bracket-type elements;
- Reverse Engineering methods, which are the basis of the Geomagic program, used for editing and preparing models that, initially, were composed of the so-called "clouds of points";
- Thermodynamics methods that were used to define the simulations made in Ansys Workbench;
- Techniques specific to the finite element method that are the basis of the algorithms contained in the thermal modules of the Ansys program.
2.1. Elaboration of the Three-Dimensional Model of a Stomatognathic System Quasi-Identical to the Patient's
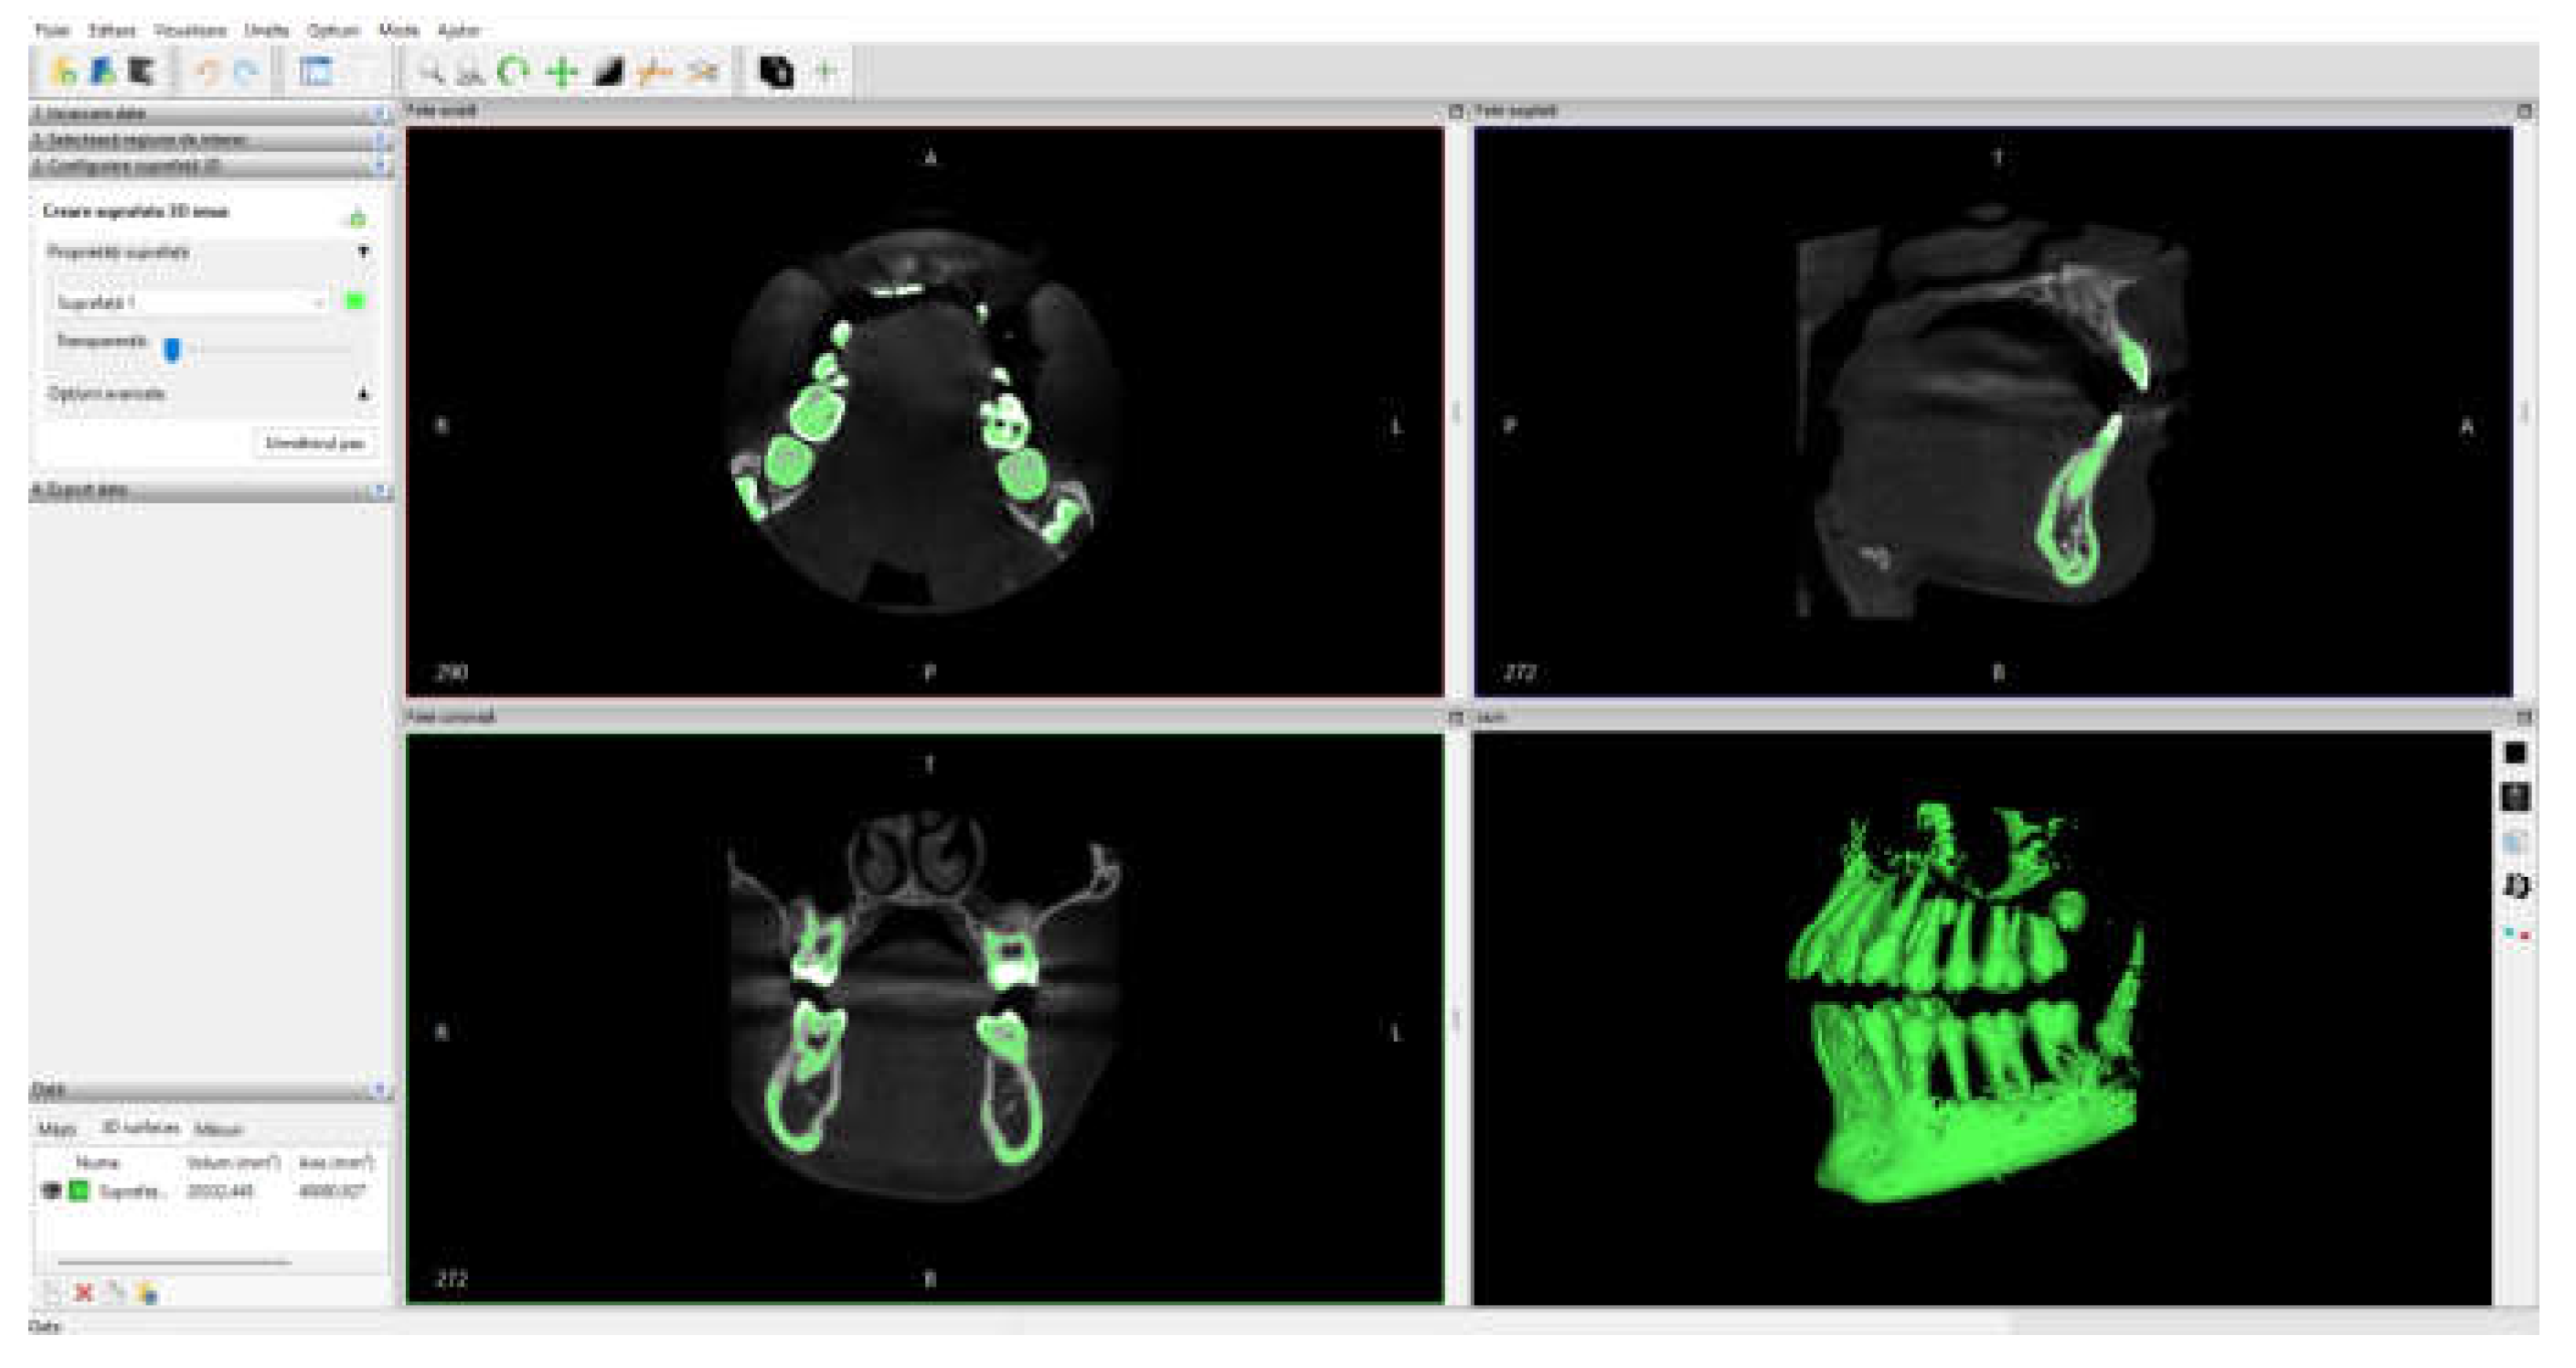
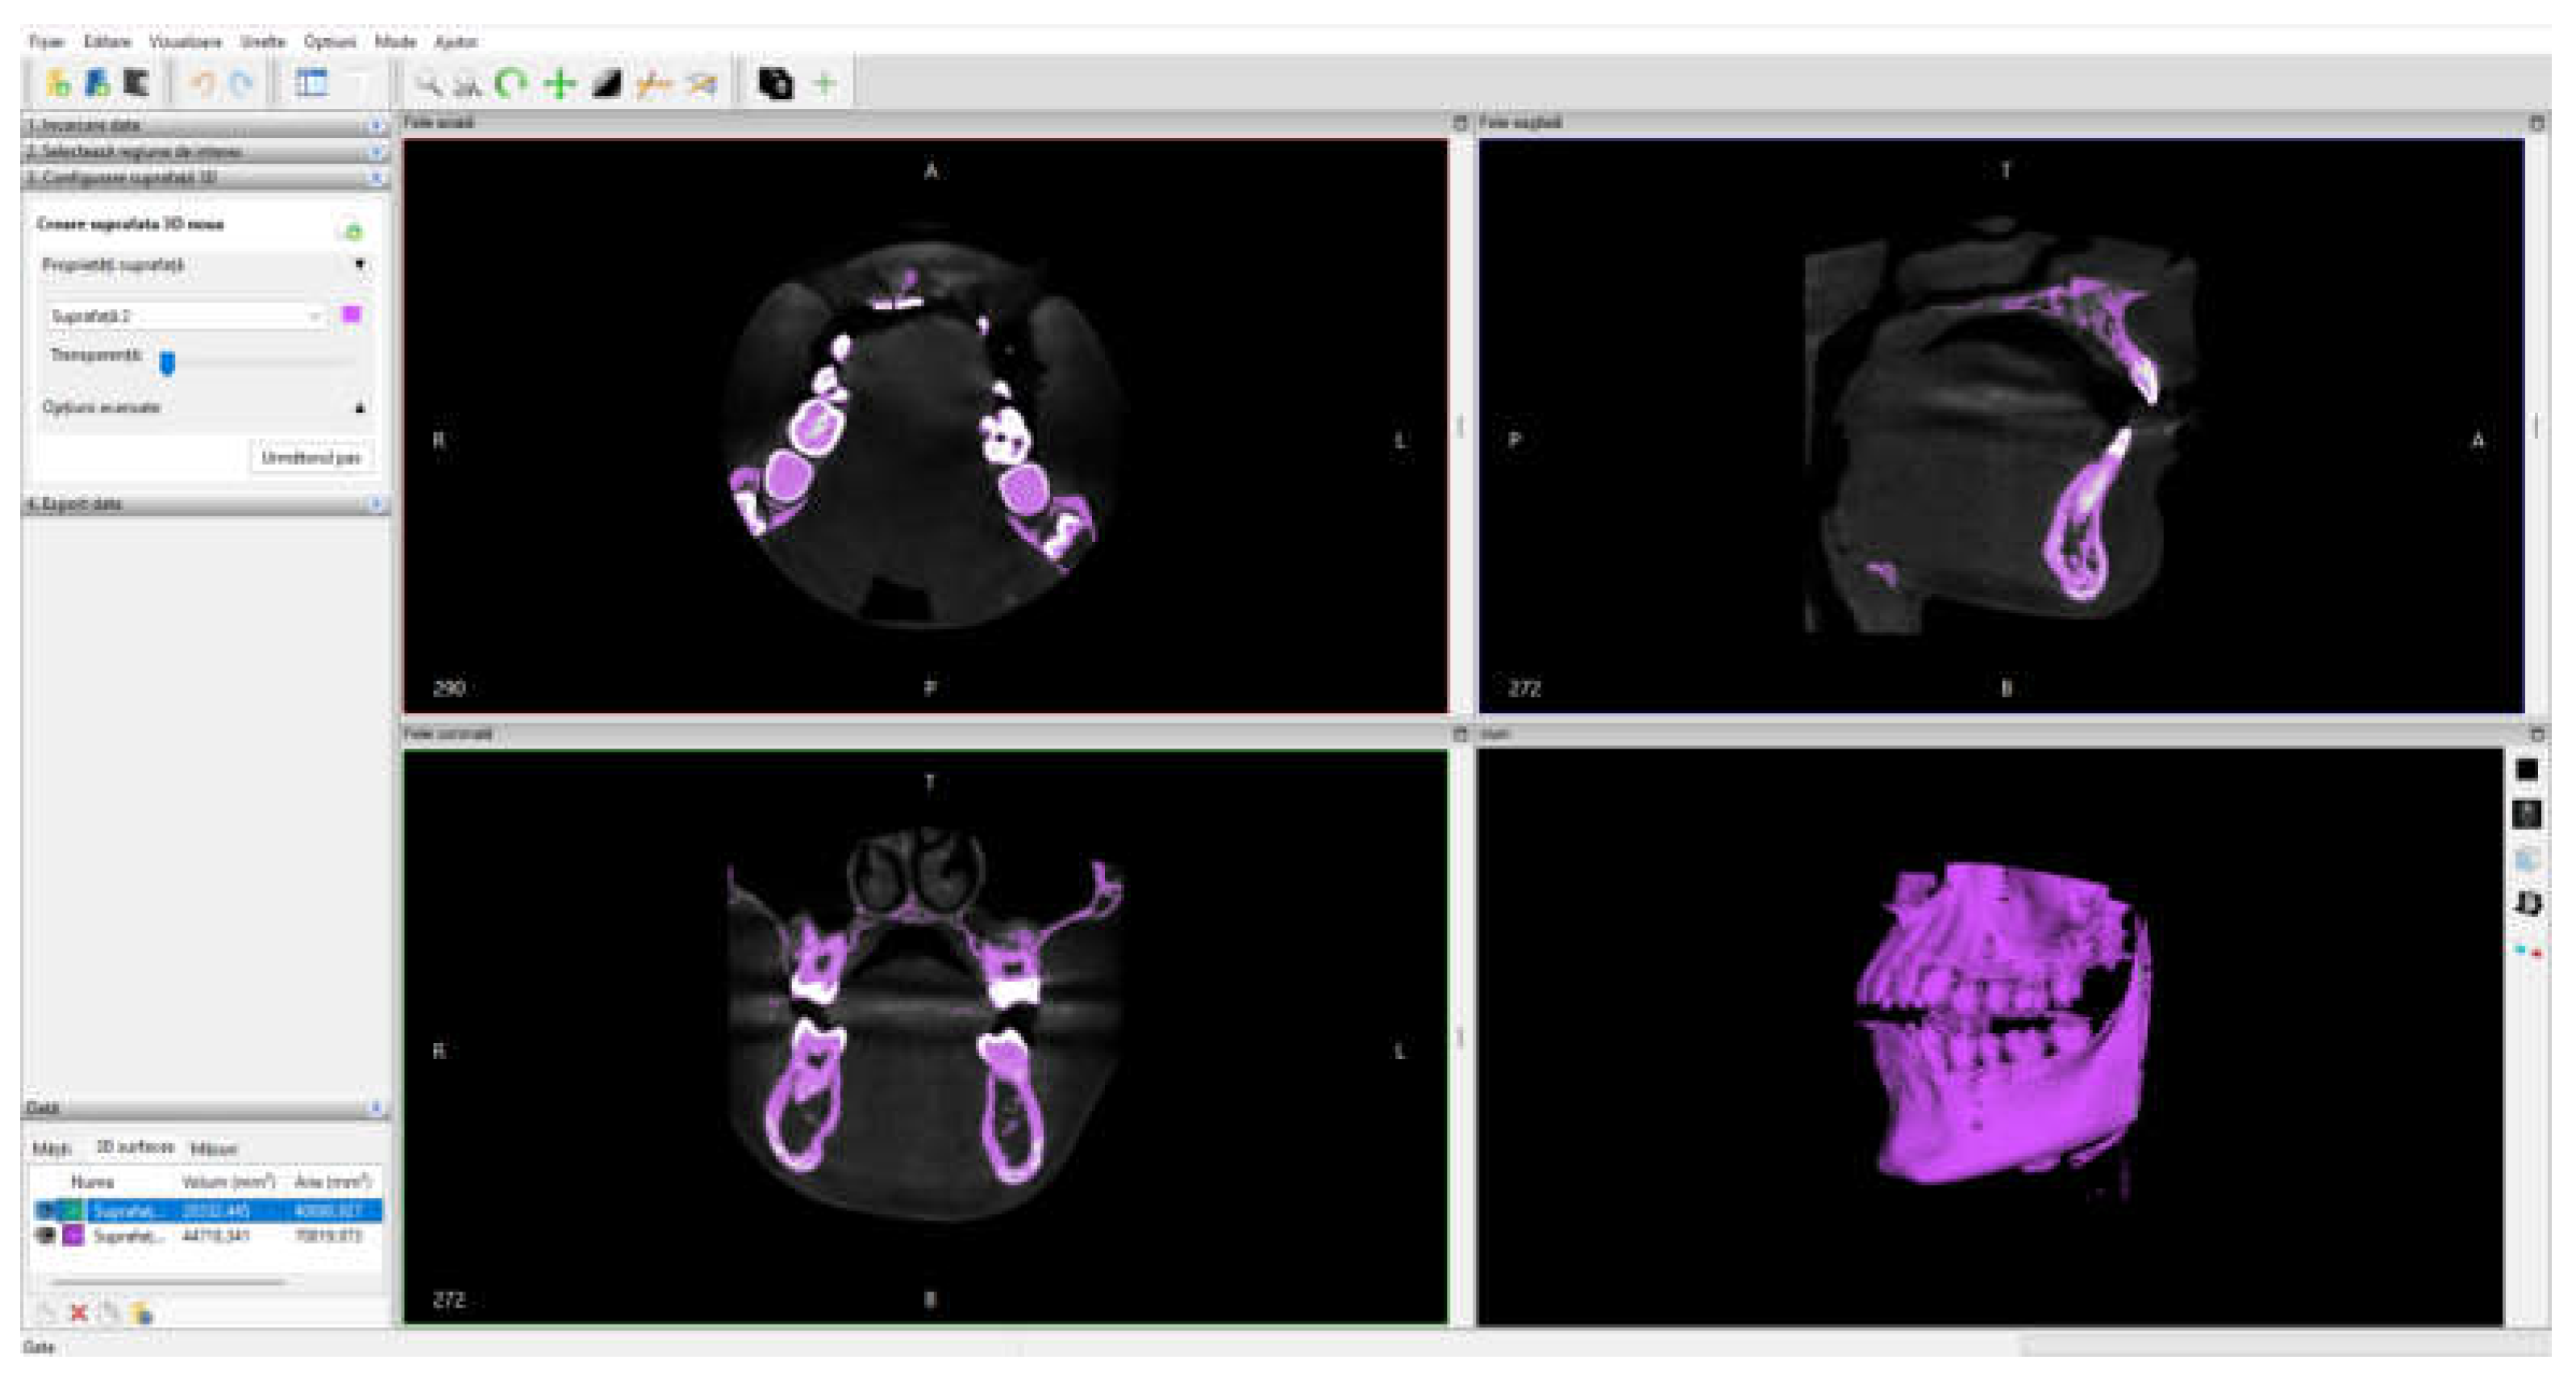
Initially, the set of CBCT tomographic images was loaded into the InVesalius program and the Enamel filter was used for the dental enamel.
Figure 1 shows the interface of this program.
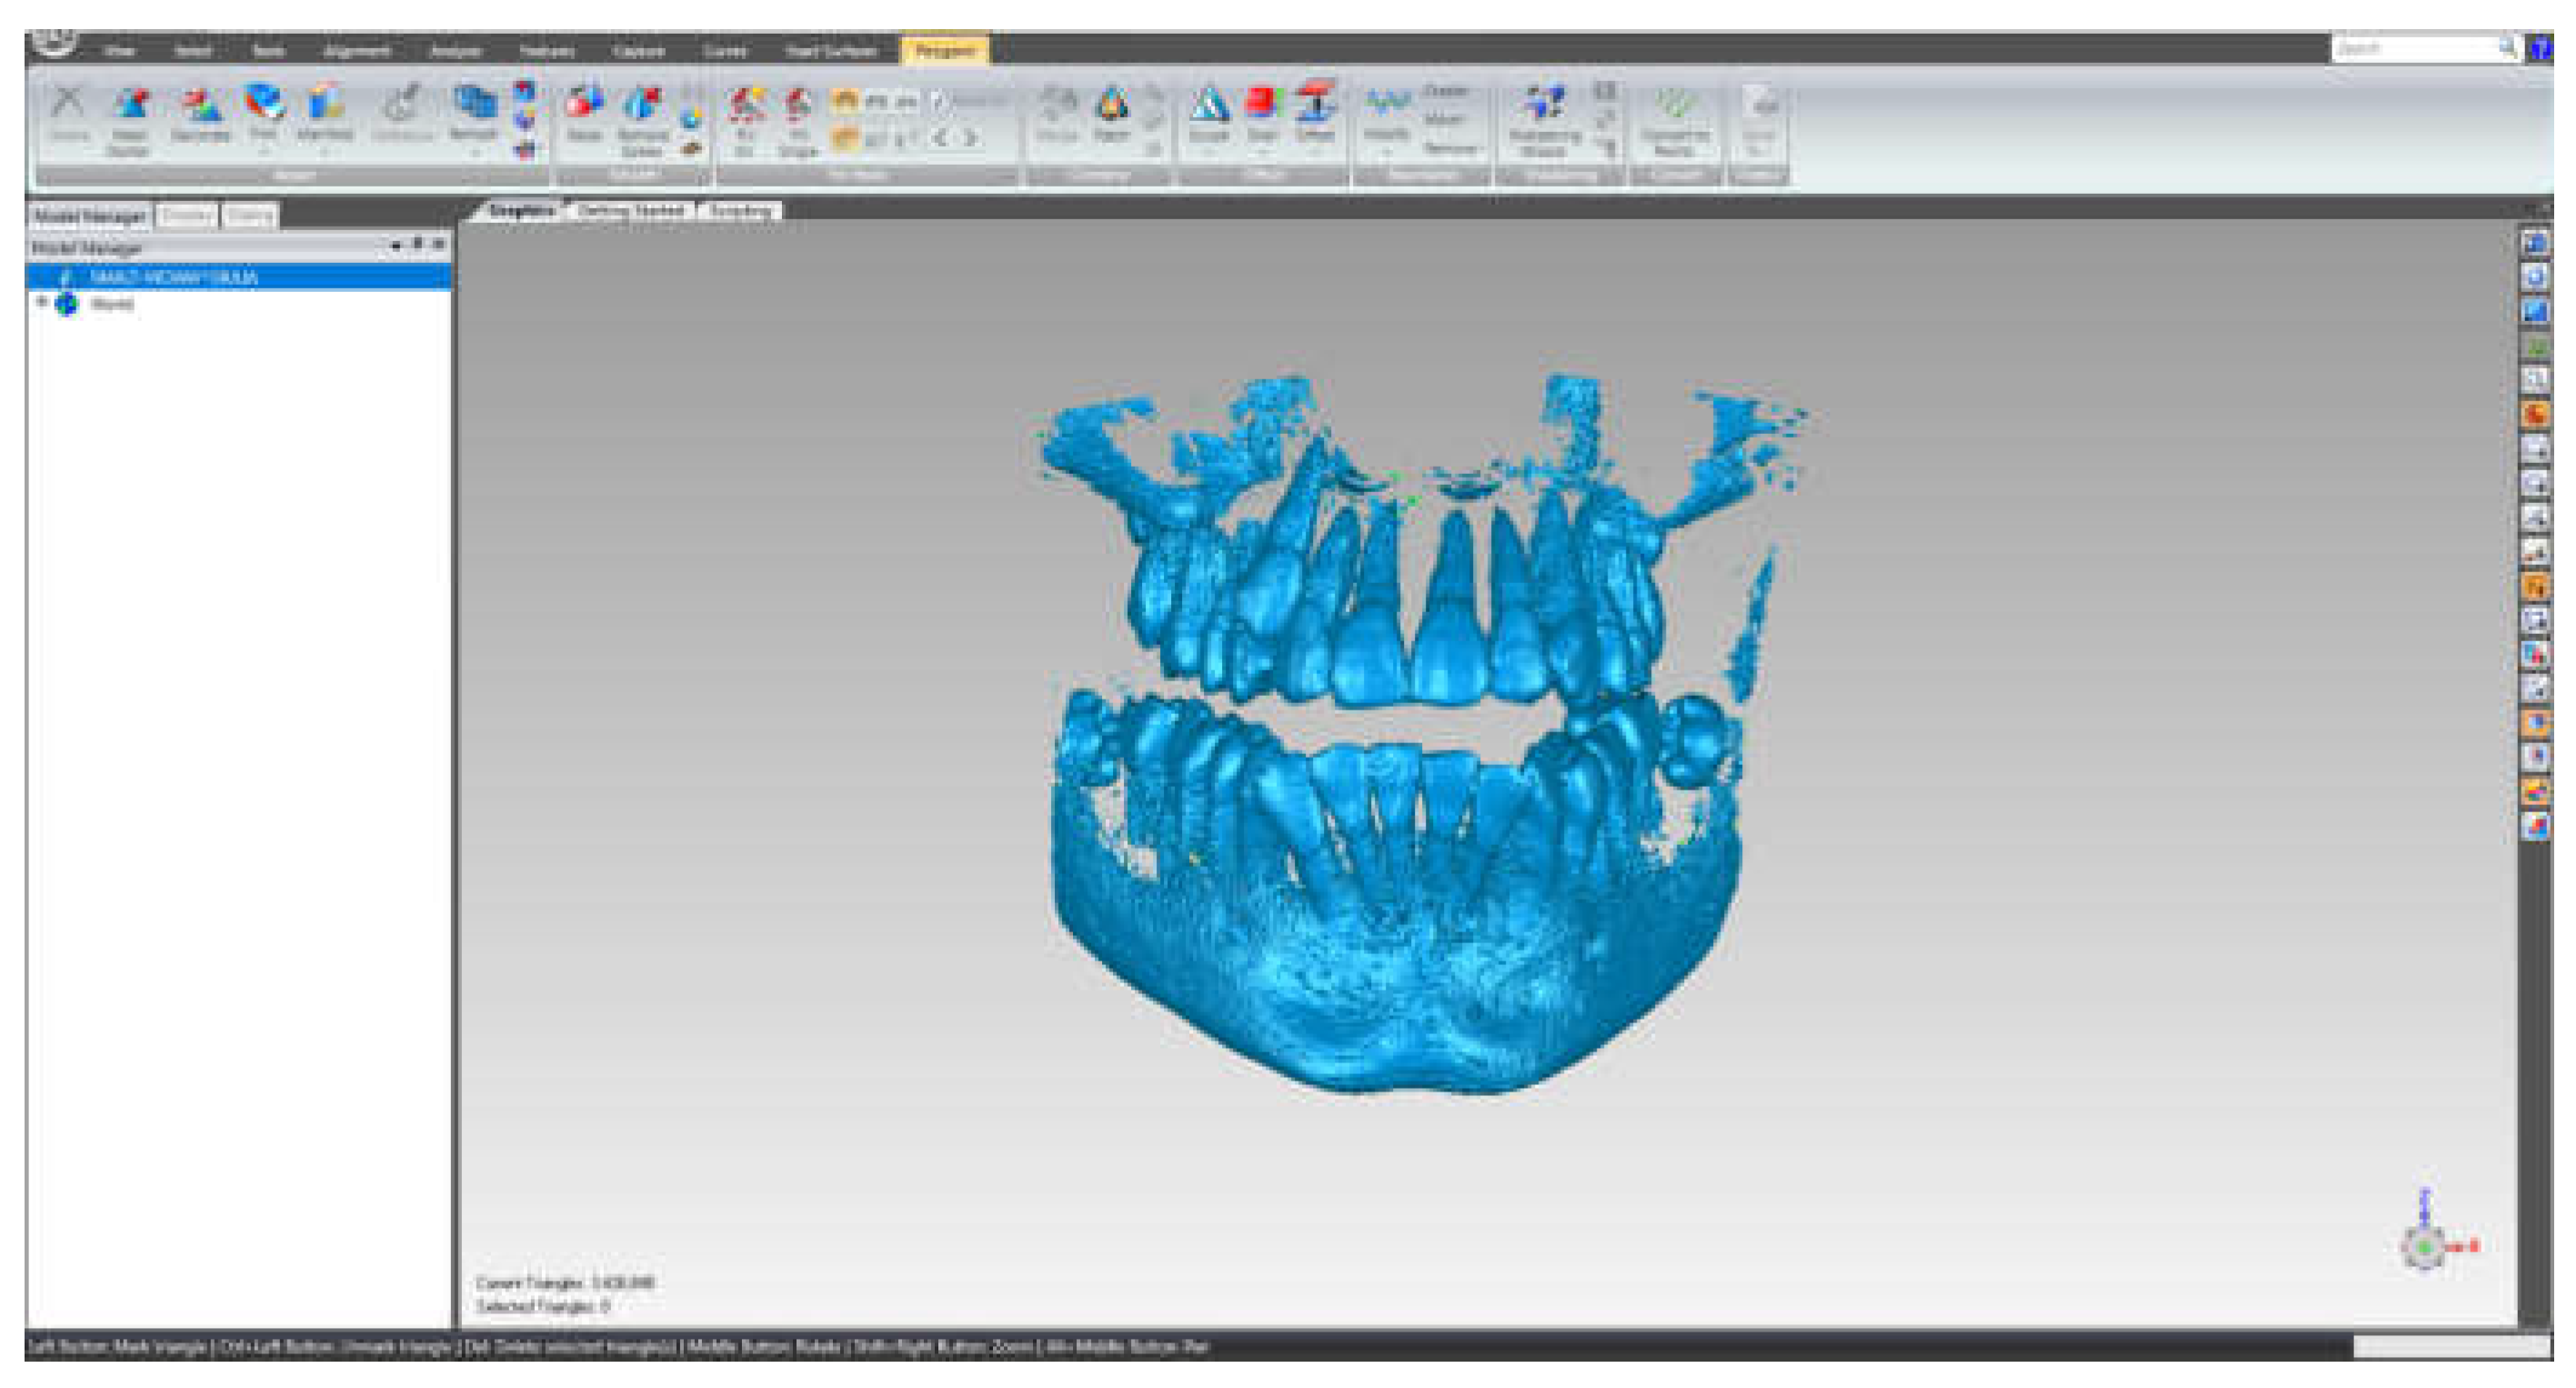
This primary "cloud of points" geometry was loaded into the Geomagic program for editing and processing, as it can be seen in
Figure 2.
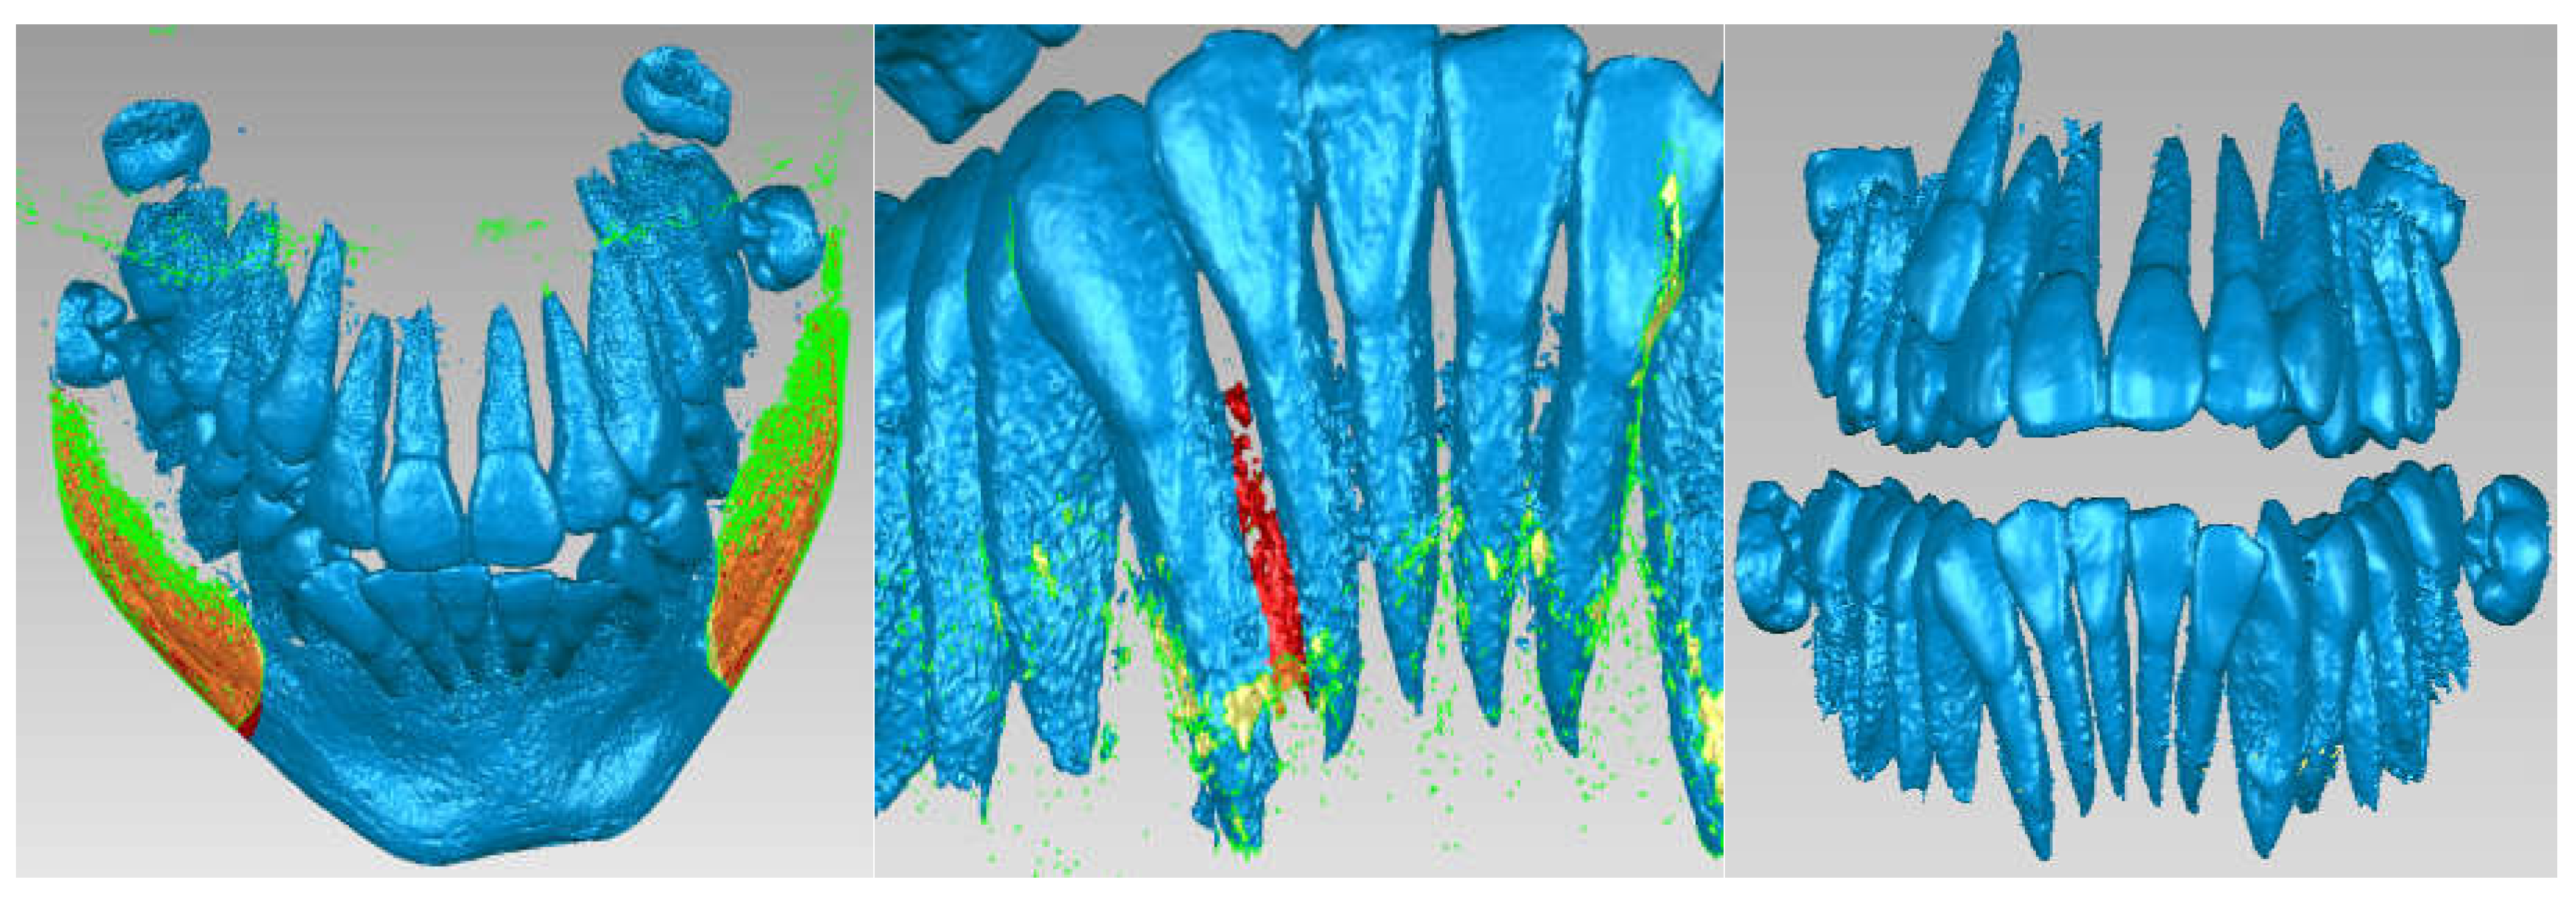
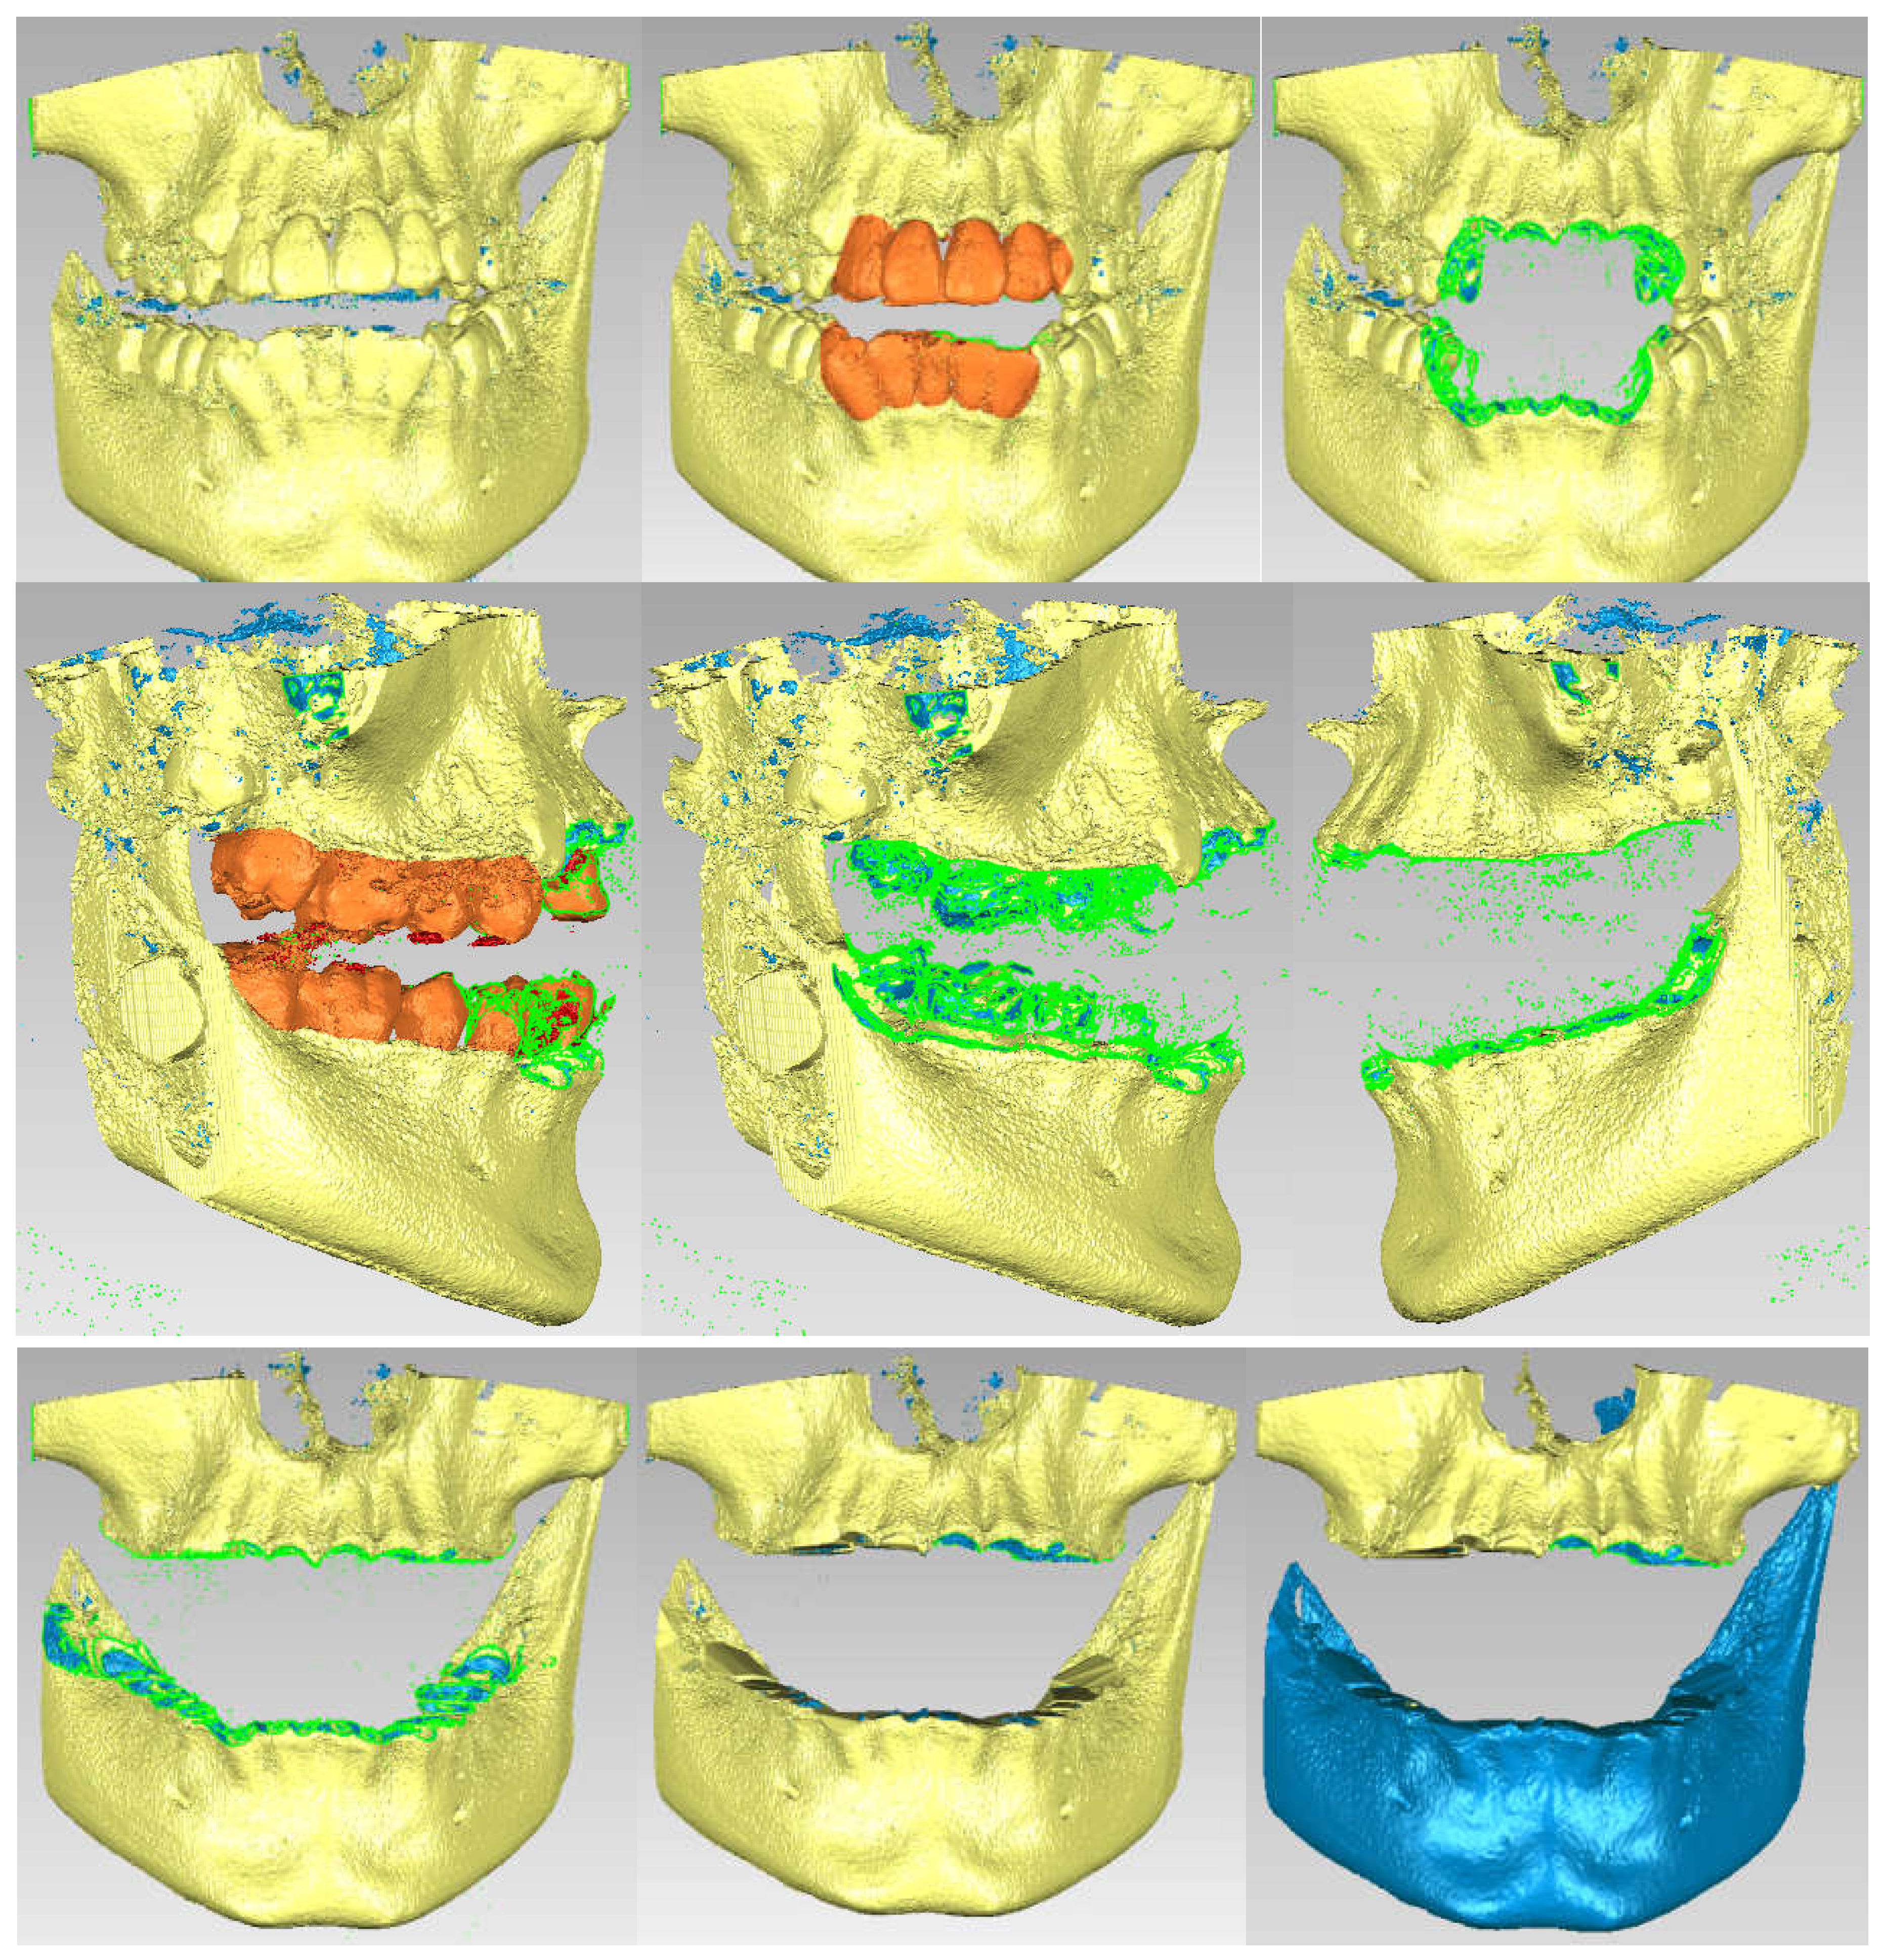
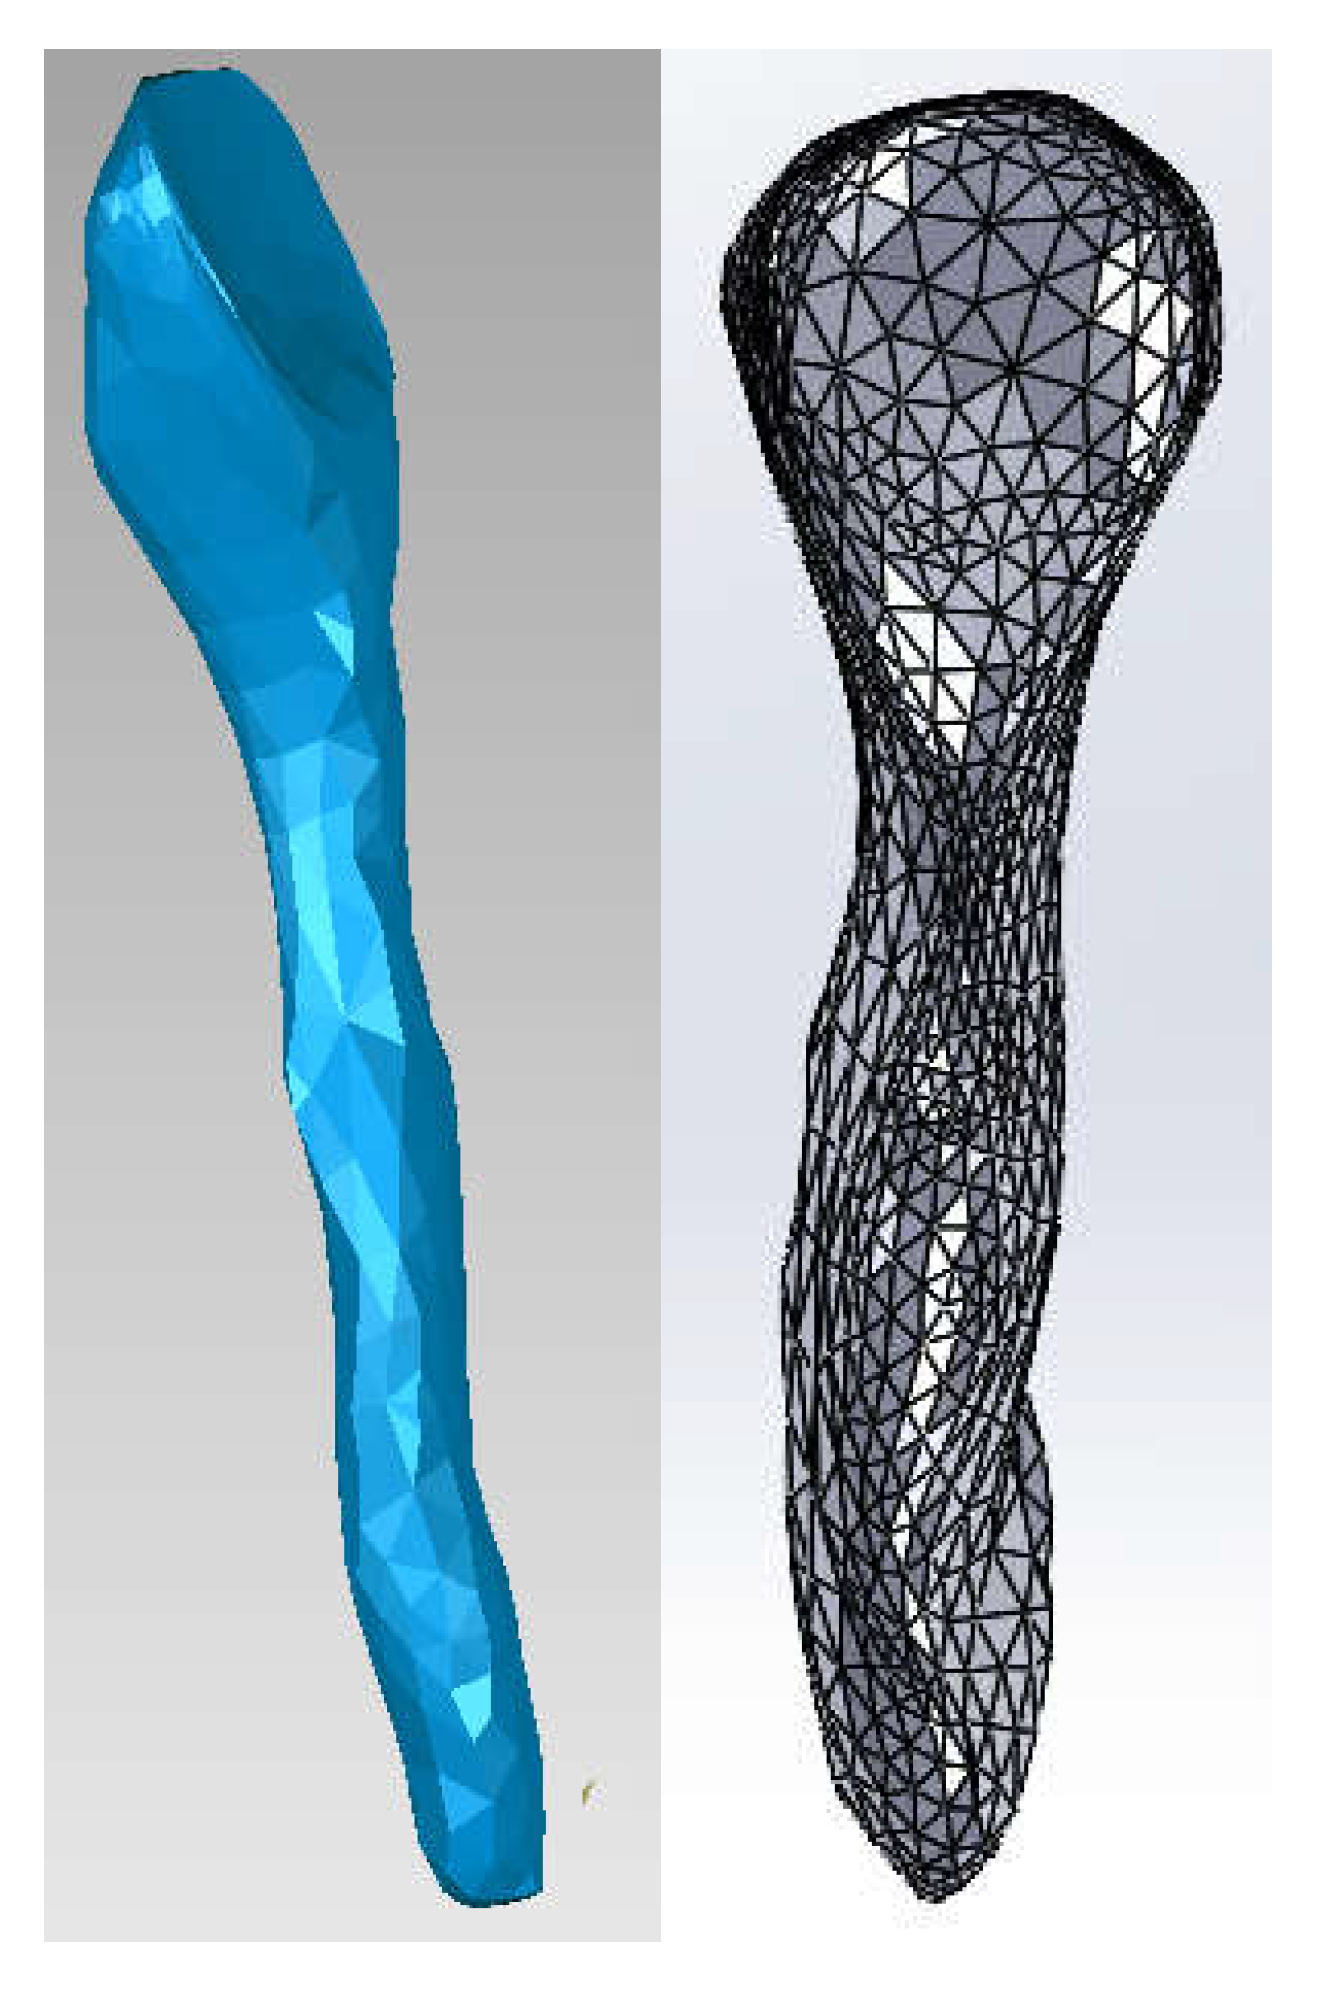
Due to the similar density of the mandible and maxilla bones to the density of dental enamel, areas of these bones are found in this initial model. For this reason, these areas will be removed manually. Stages of these removal operations are shown in
Figure 3.
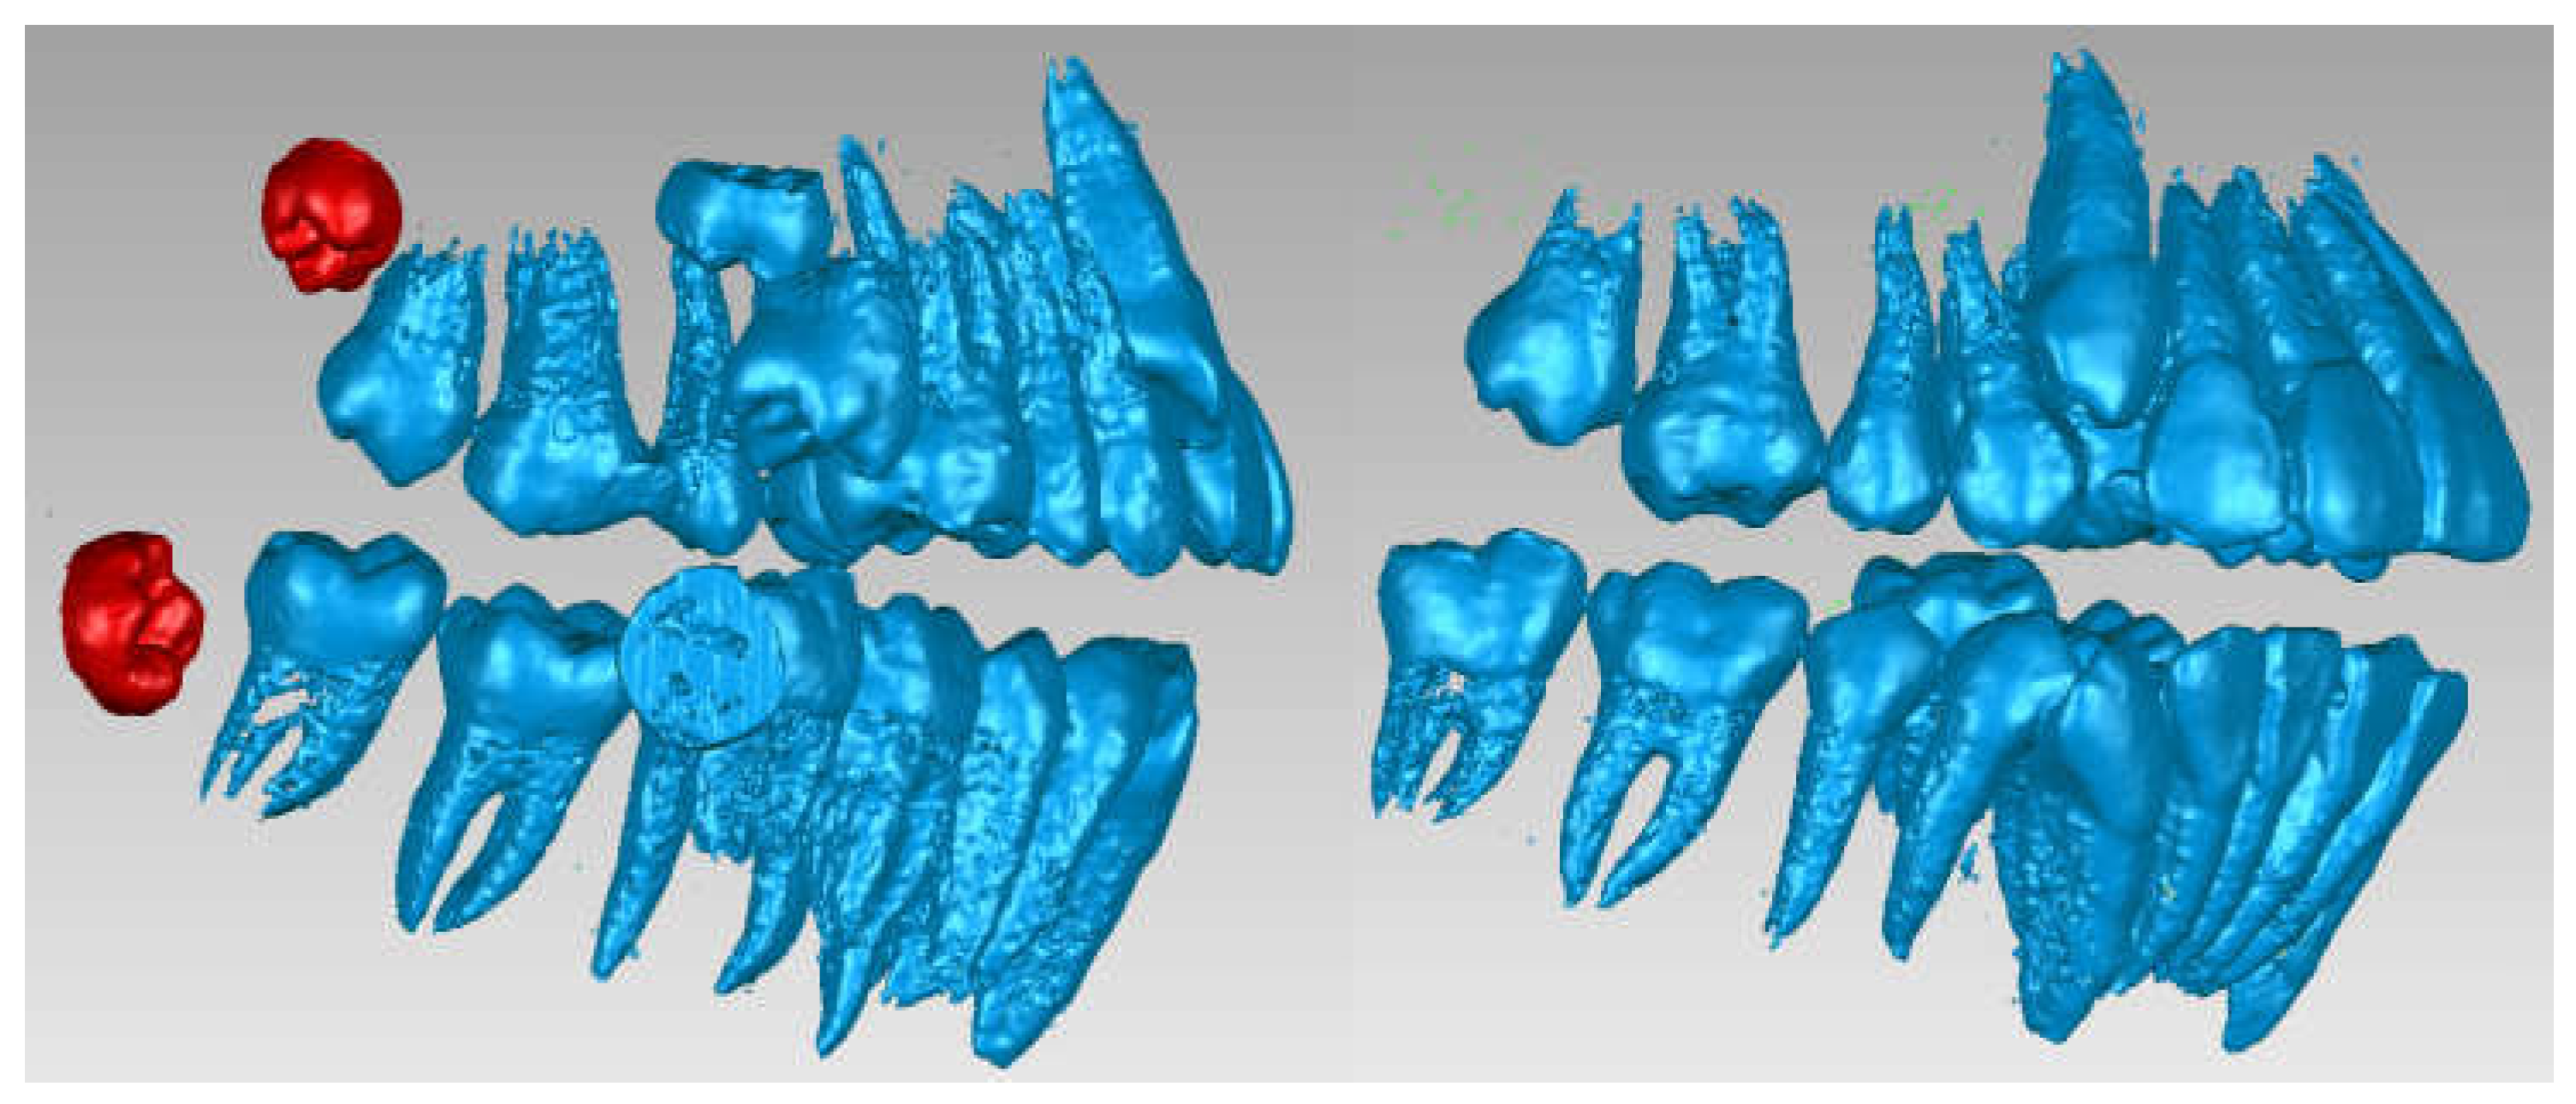
Next, the wisdom teeth were removed, as it can be seen in
Figure 4.
Next, the model was subjected to operations to eliminate non-conforming surfaces, but also to other techniques to reduce the number of surfaces, etc.
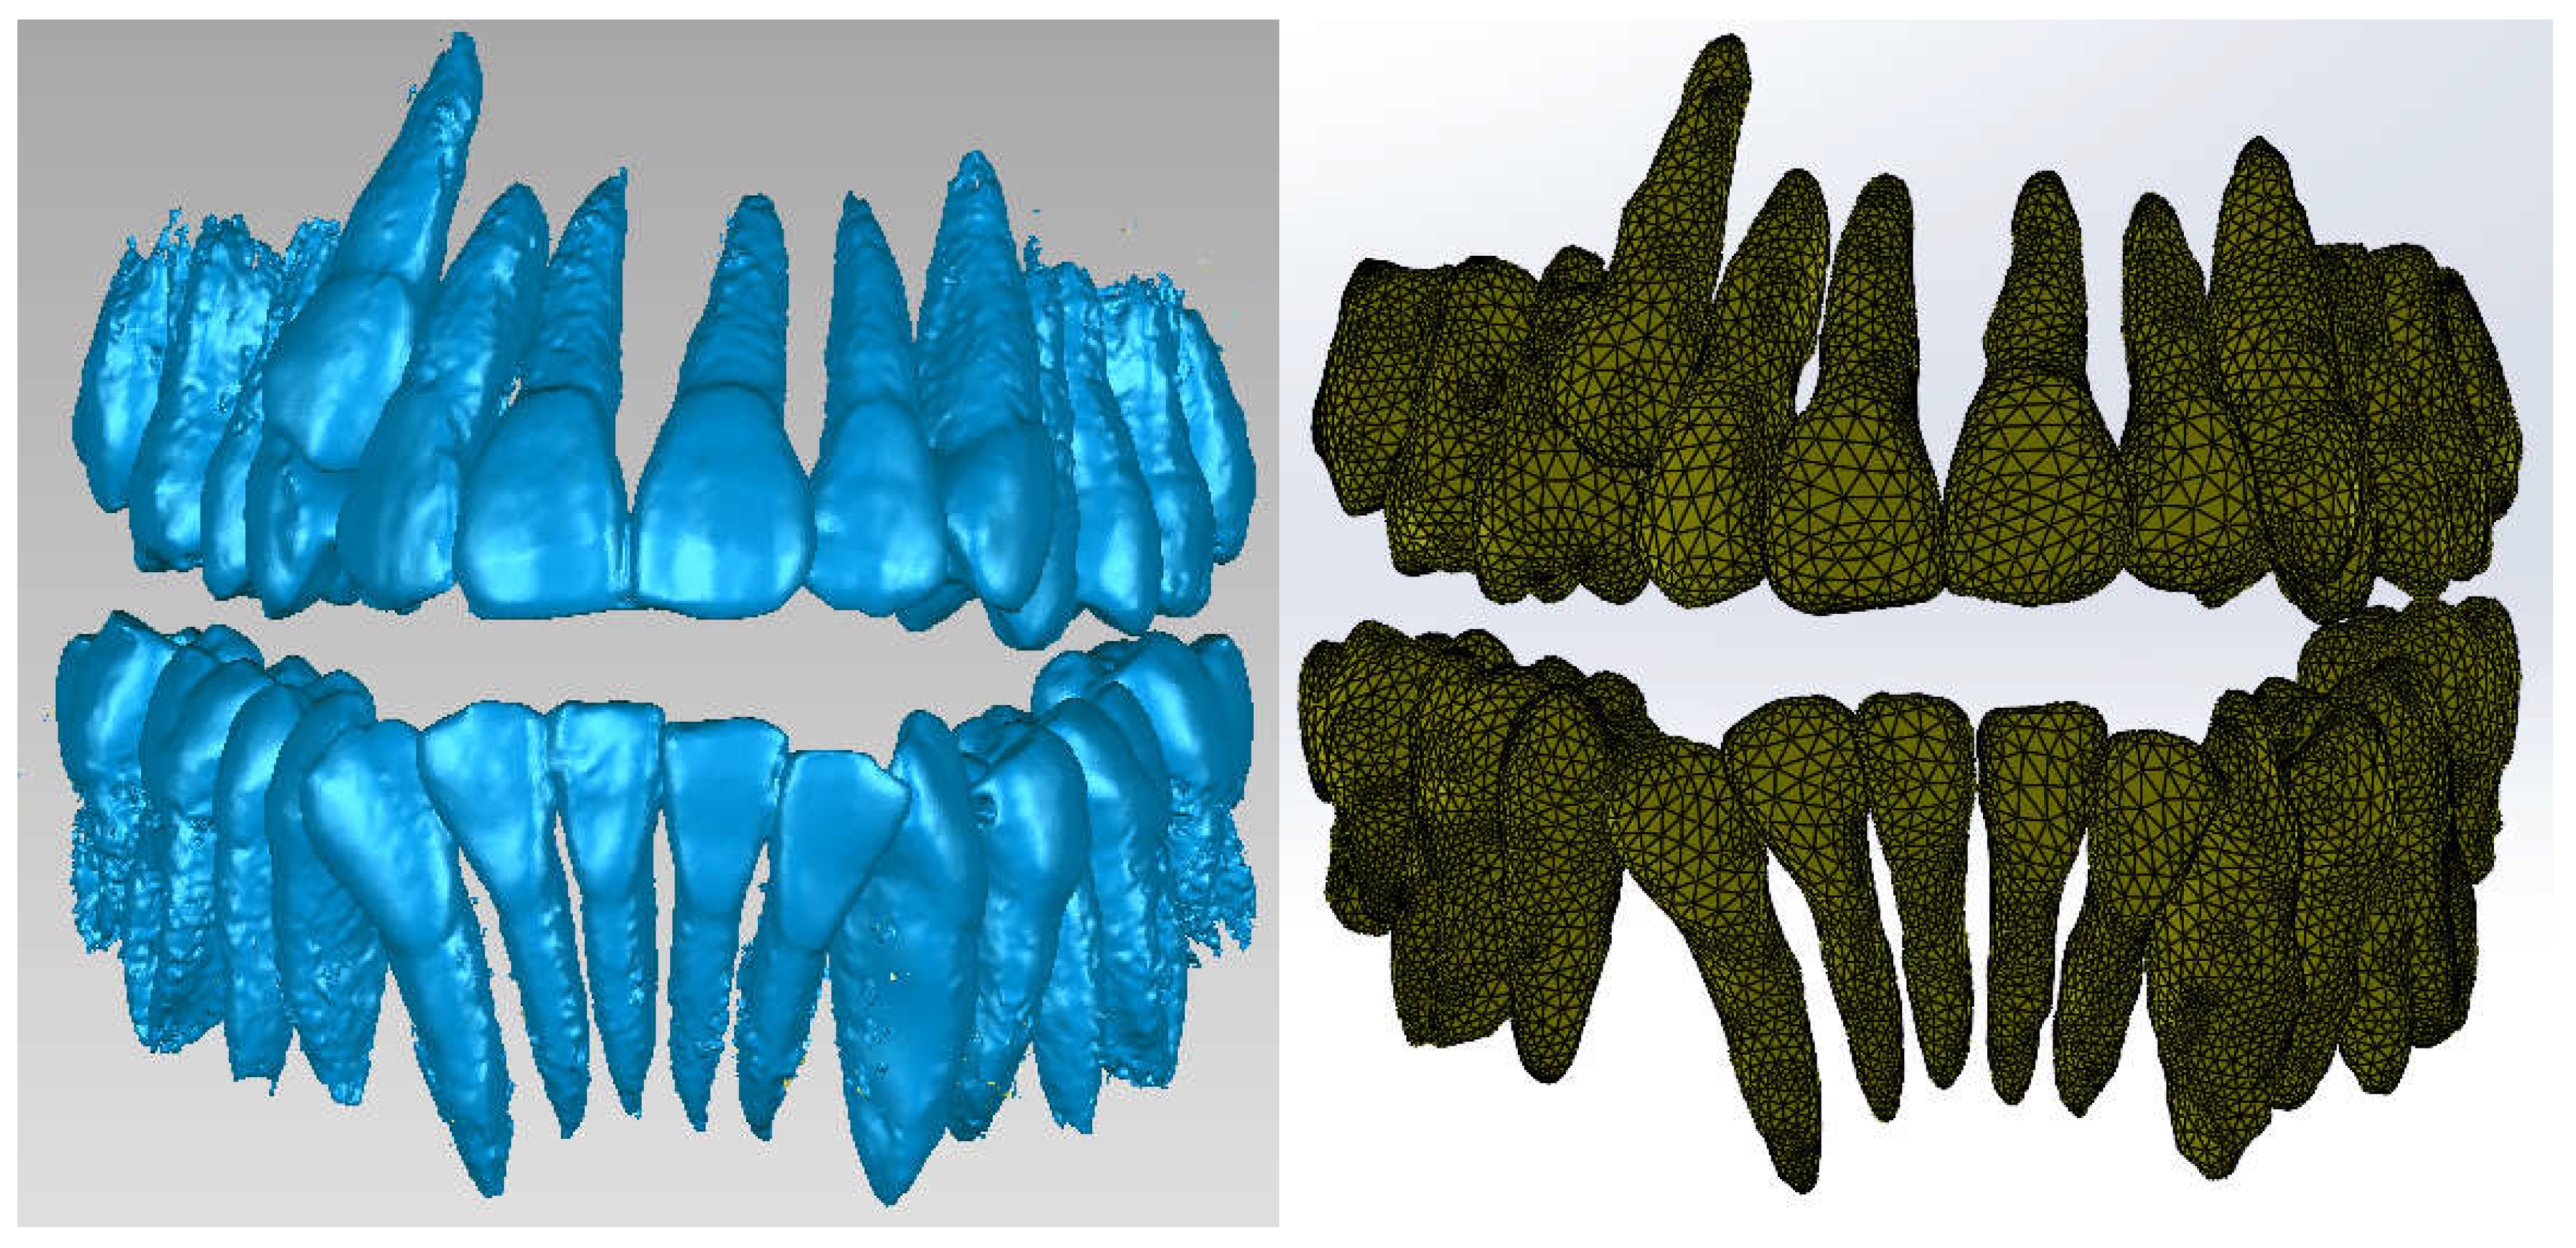
Figure 5 shows the final model of the dentition in Geomagic, then in SolidWorks.
To obtain the three-dimensional model of the bone components, the CBCT tomographic image set was loaded into the InVesalius program and the Compact Bone filter was activated, as it can be seen in
Figure 6.
Due to the fact that the bone density is relatively similar to tooth enamel density, it is necessary to remove these dental structures.
Figure 7 shows these removal operations.
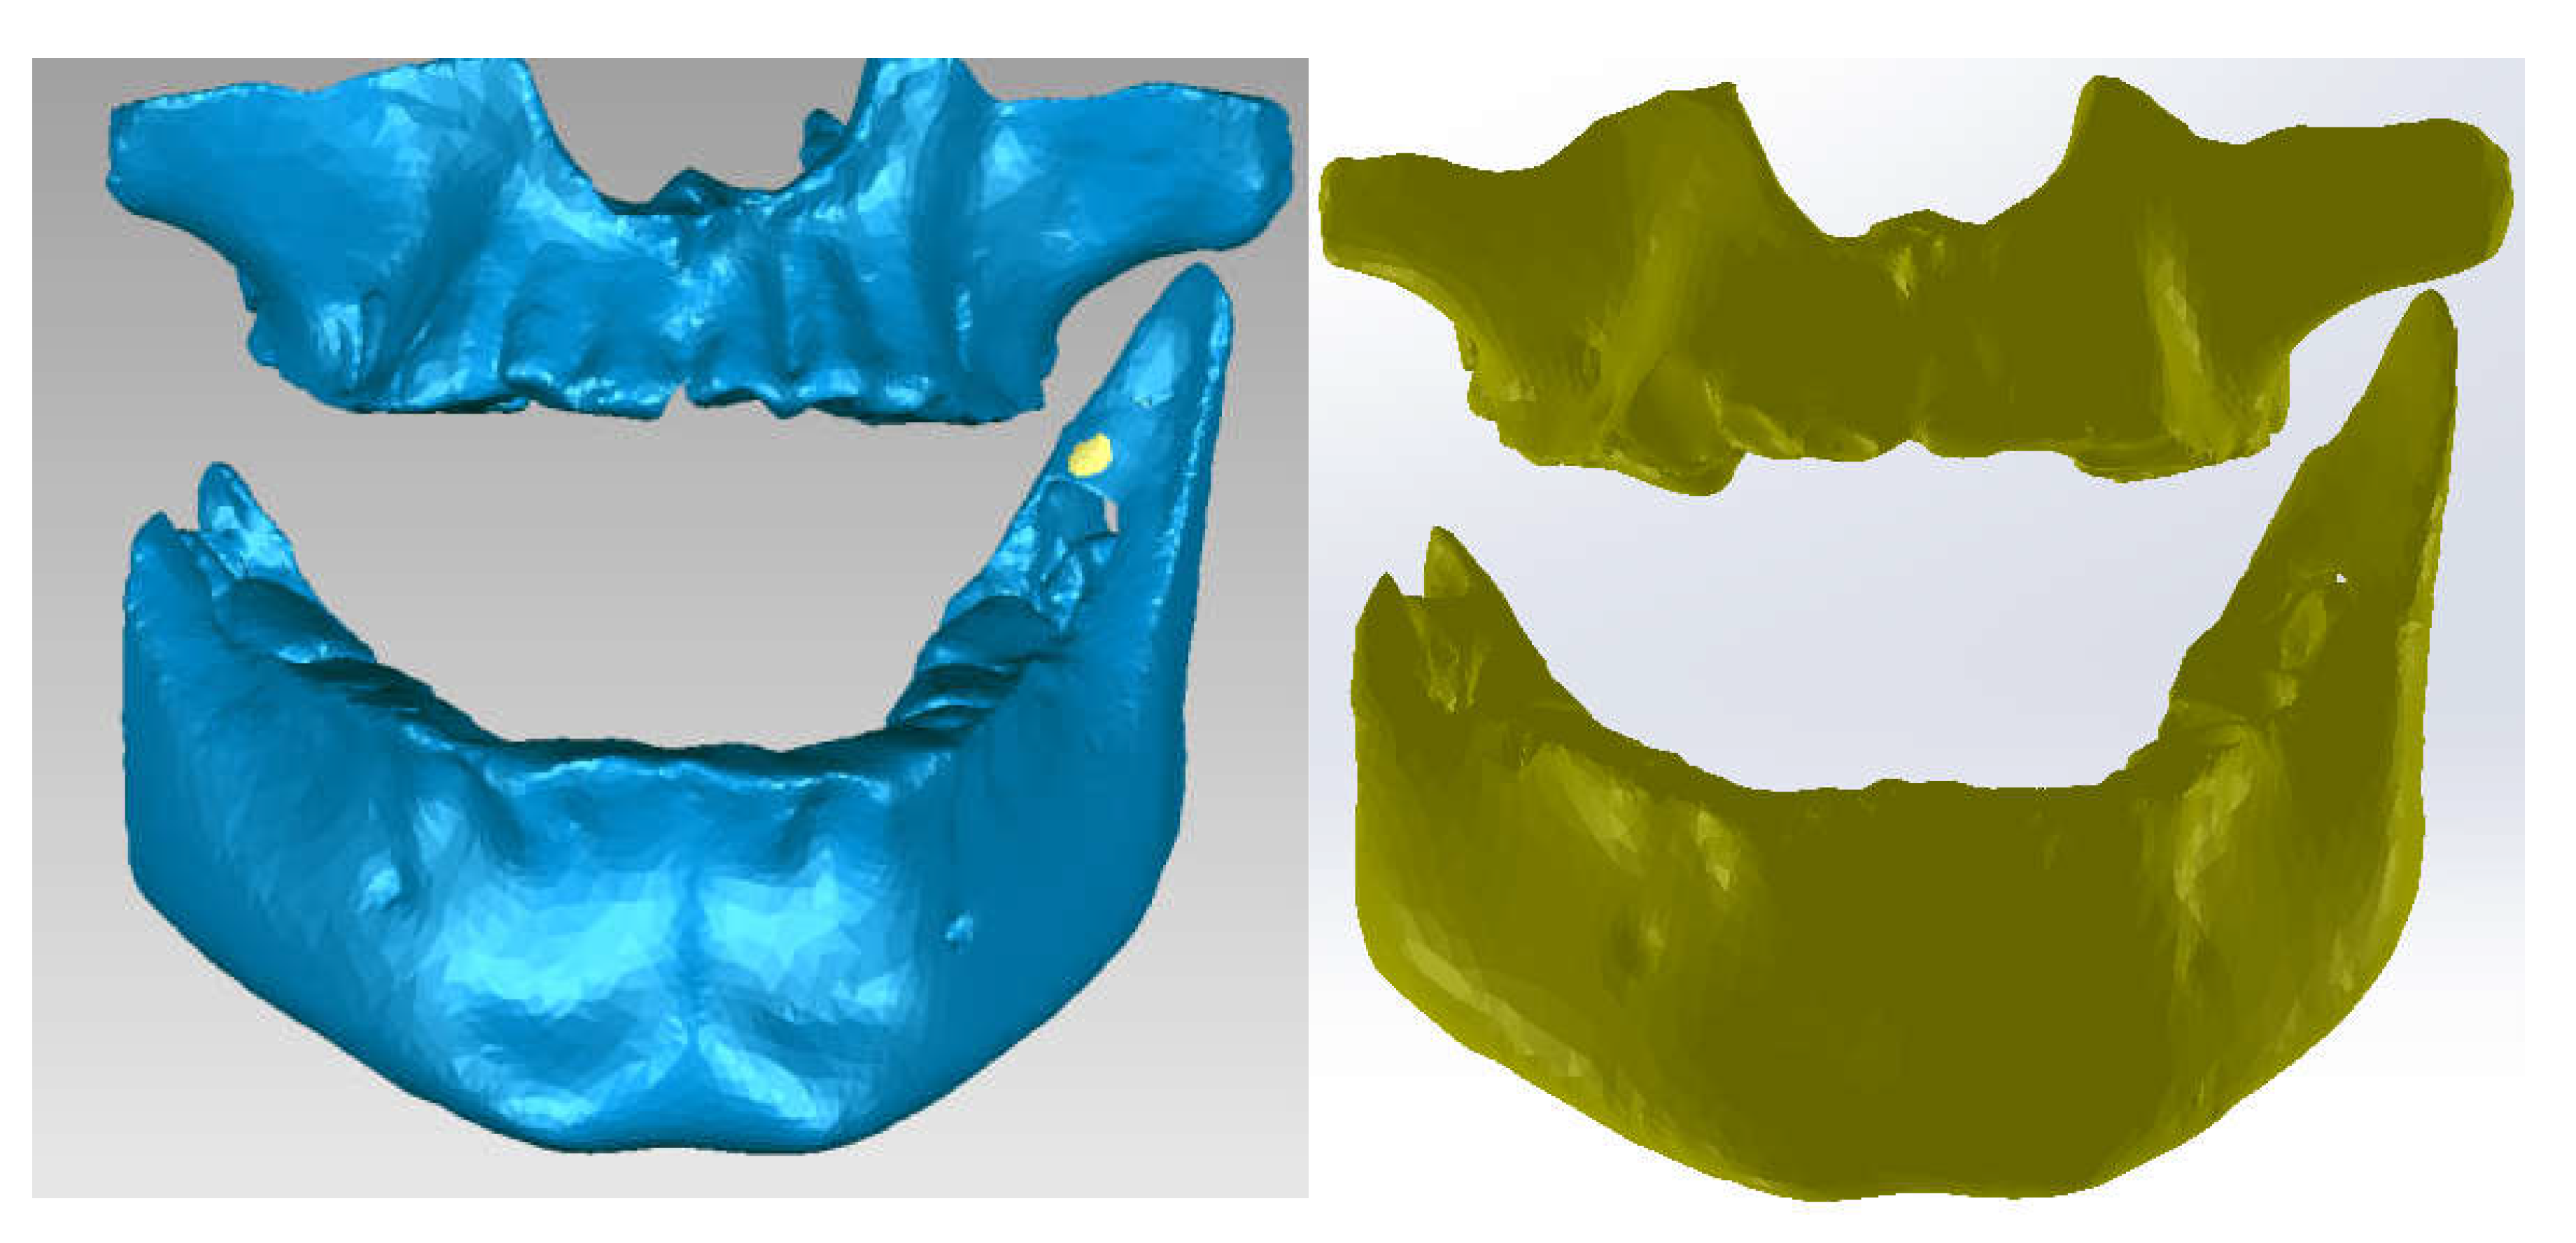
Next, specific Reverse Engineering techniques were applied and the final model of the bone components was obtained.
Figure 8 shows the final model in Geomagic and SolidWorks.
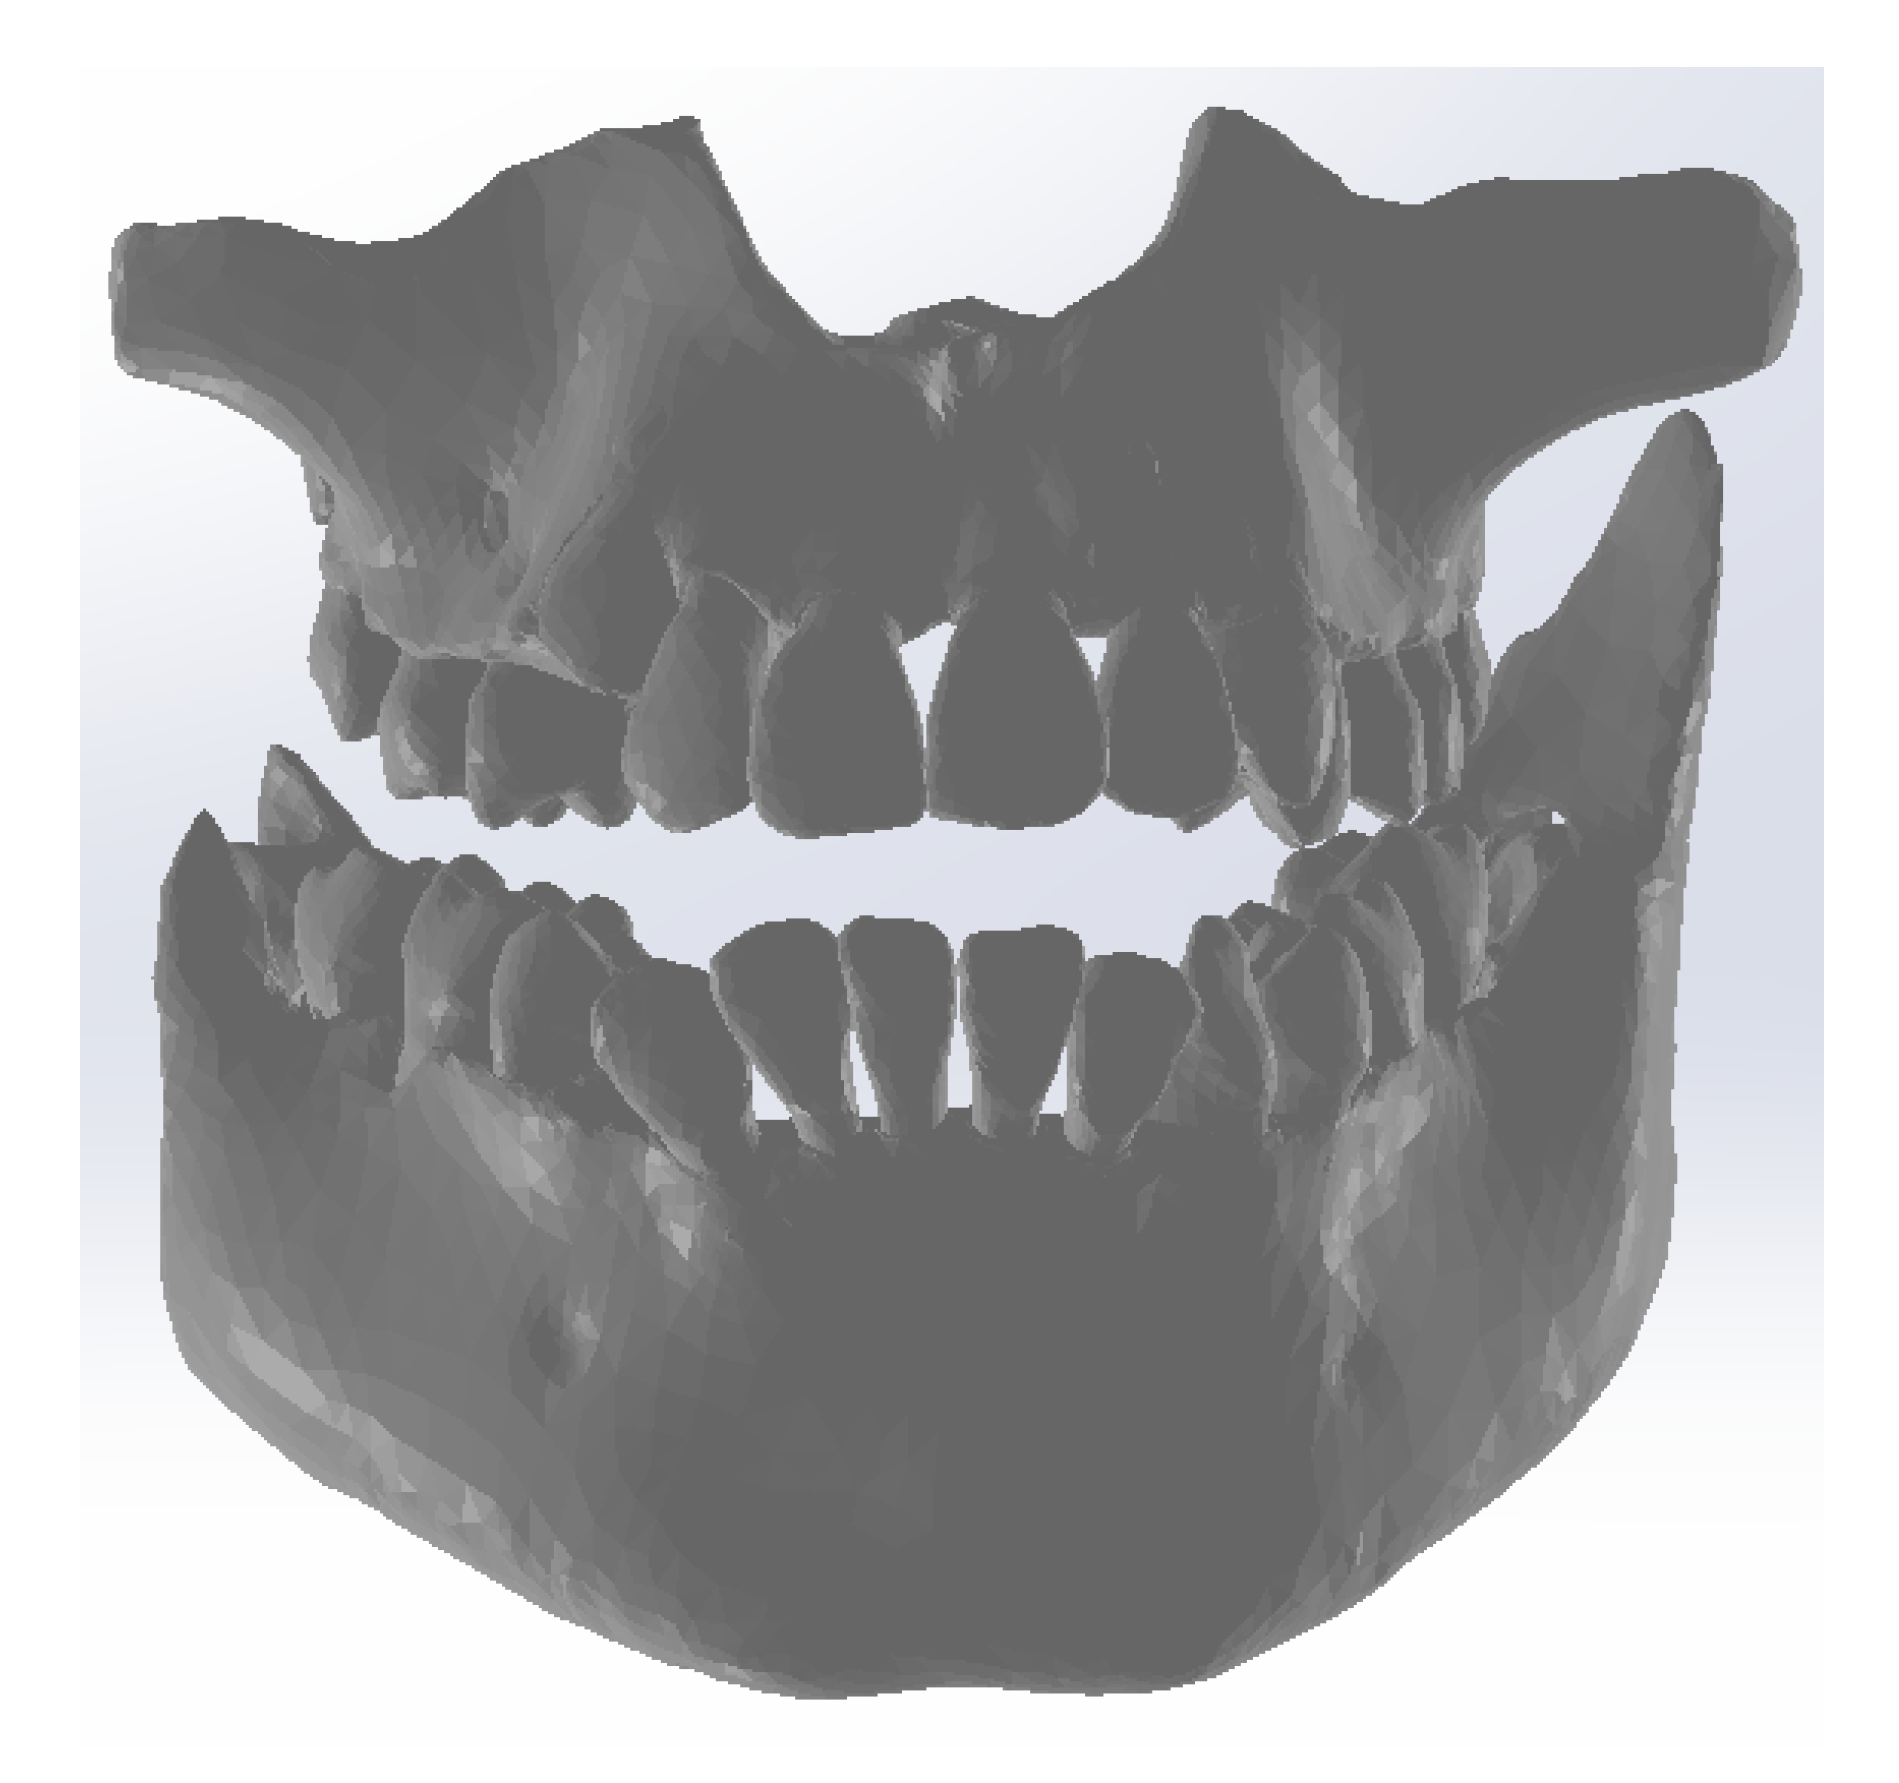
Using Direct Engineering known techniques and methods, the model of the patient's stomatognathic apparatus was obtained, as it can be seen in
Figure 9. When aligning the models, the unique coordinate system was used, which is the same, because the models come from the same CBCT set.
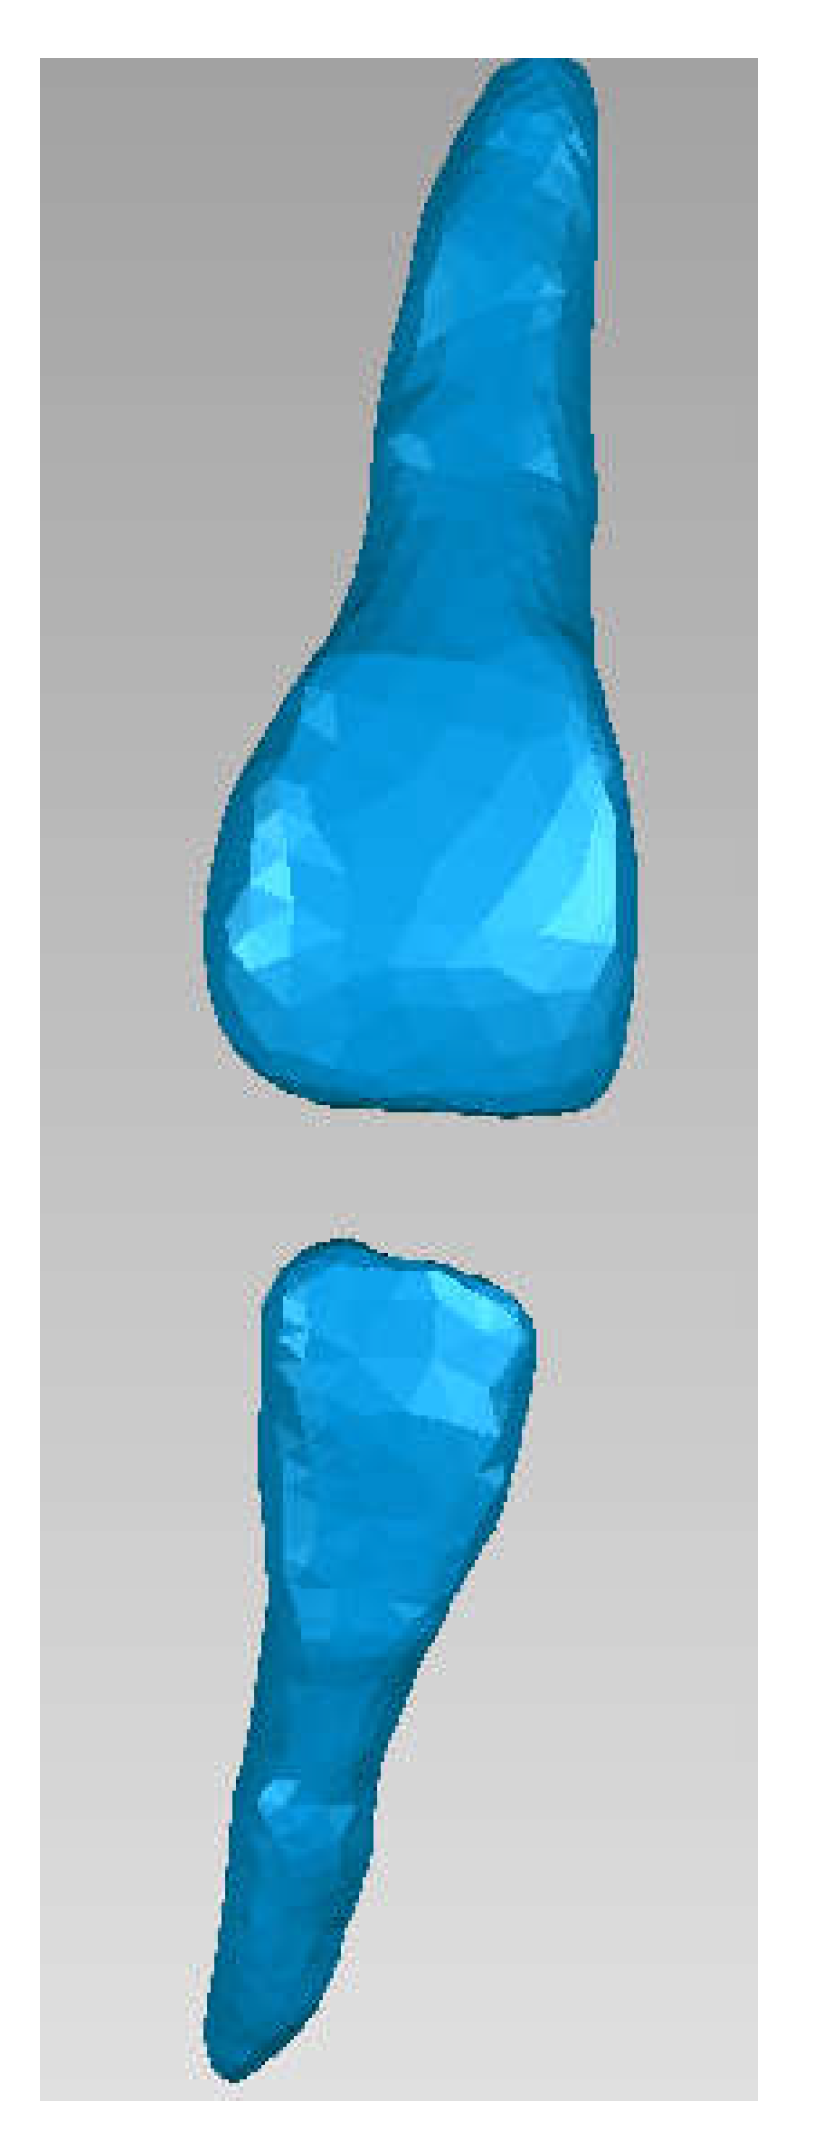
To obtain the internal structures of teeth 1.1 and 4.1, initially, the dental enamel models for the two teeth were isolated in Geomagic, as it can be seen in
Figure 10.
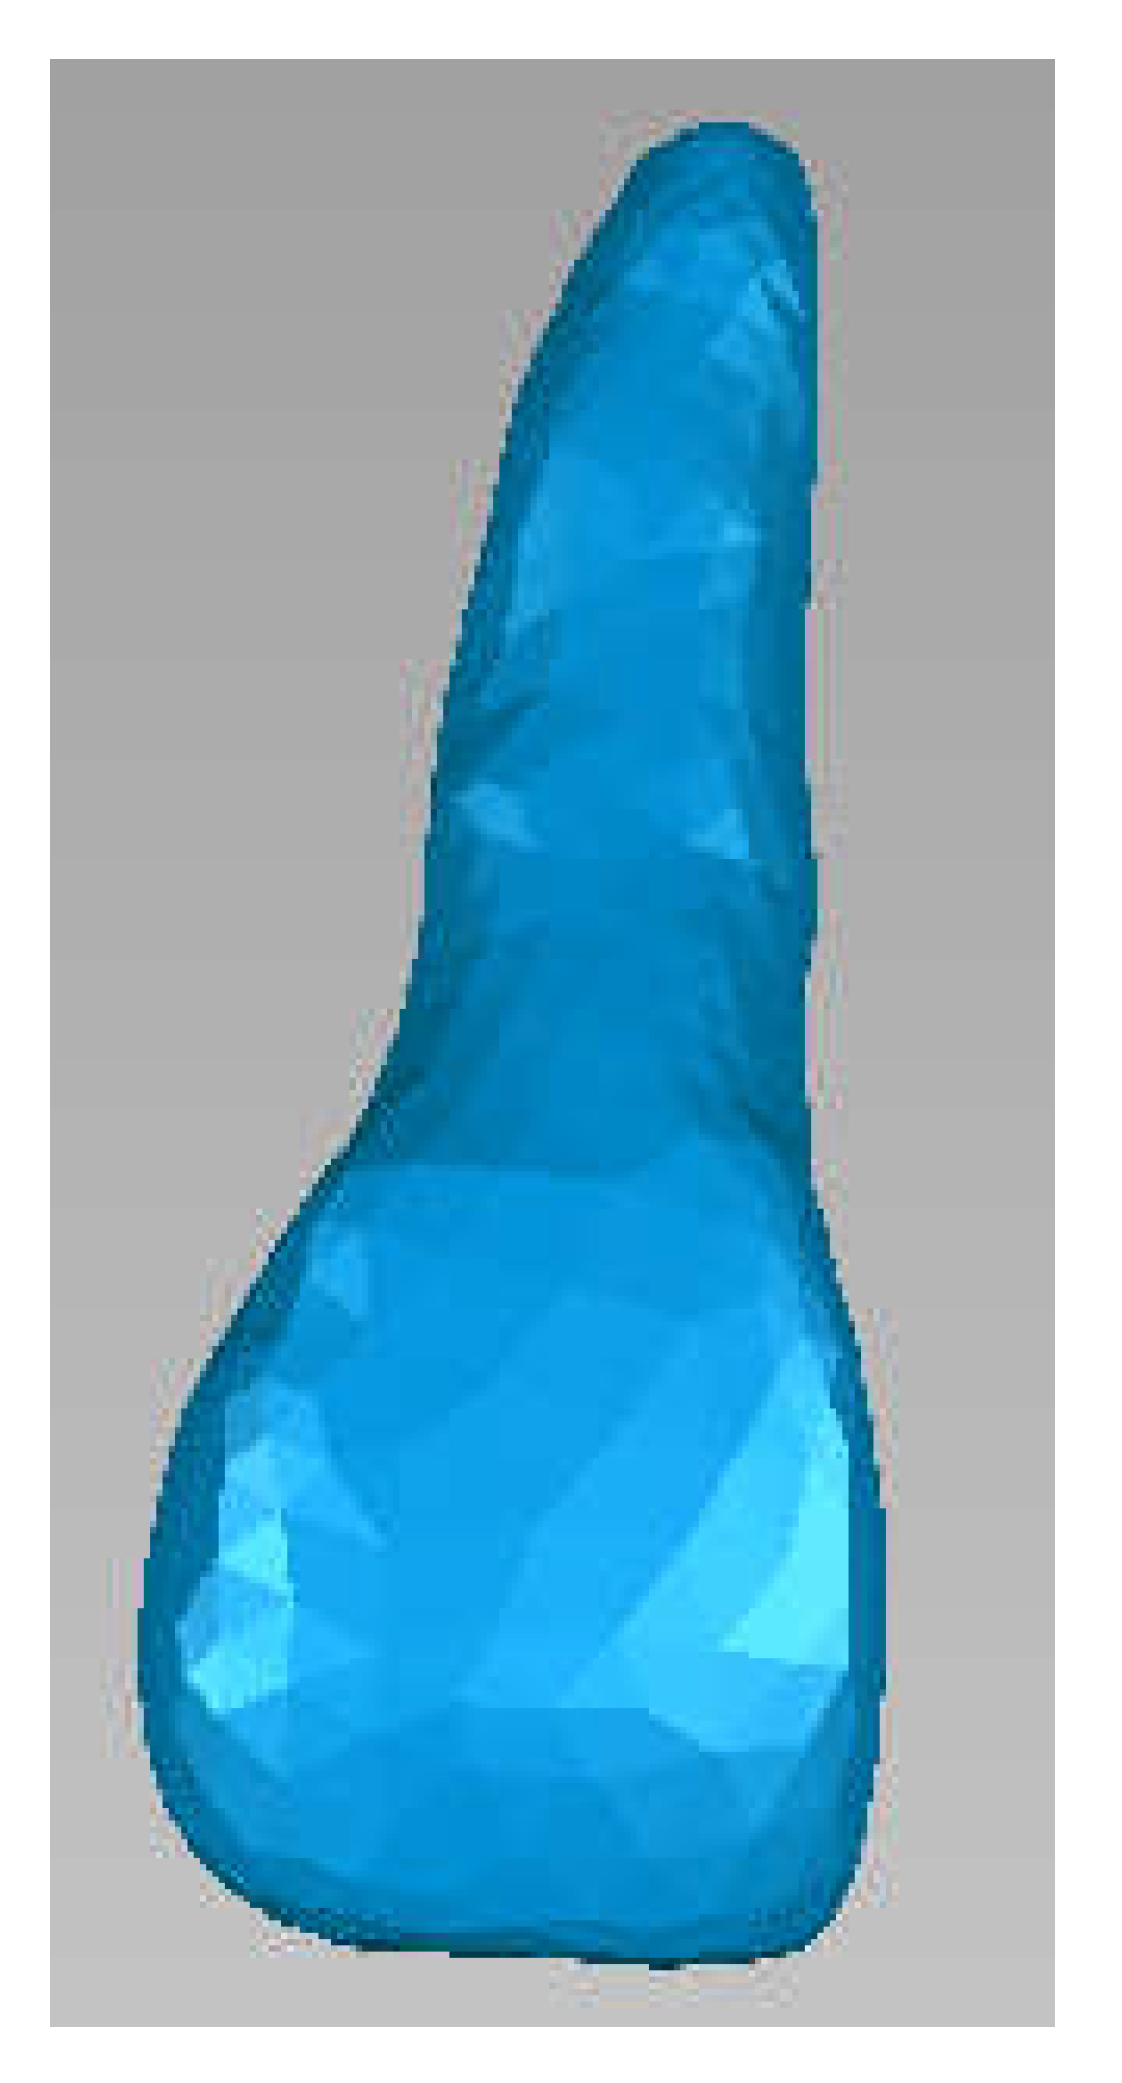
Next, tooth 1.1 was isolated, as it can be seen in
Figure 11.
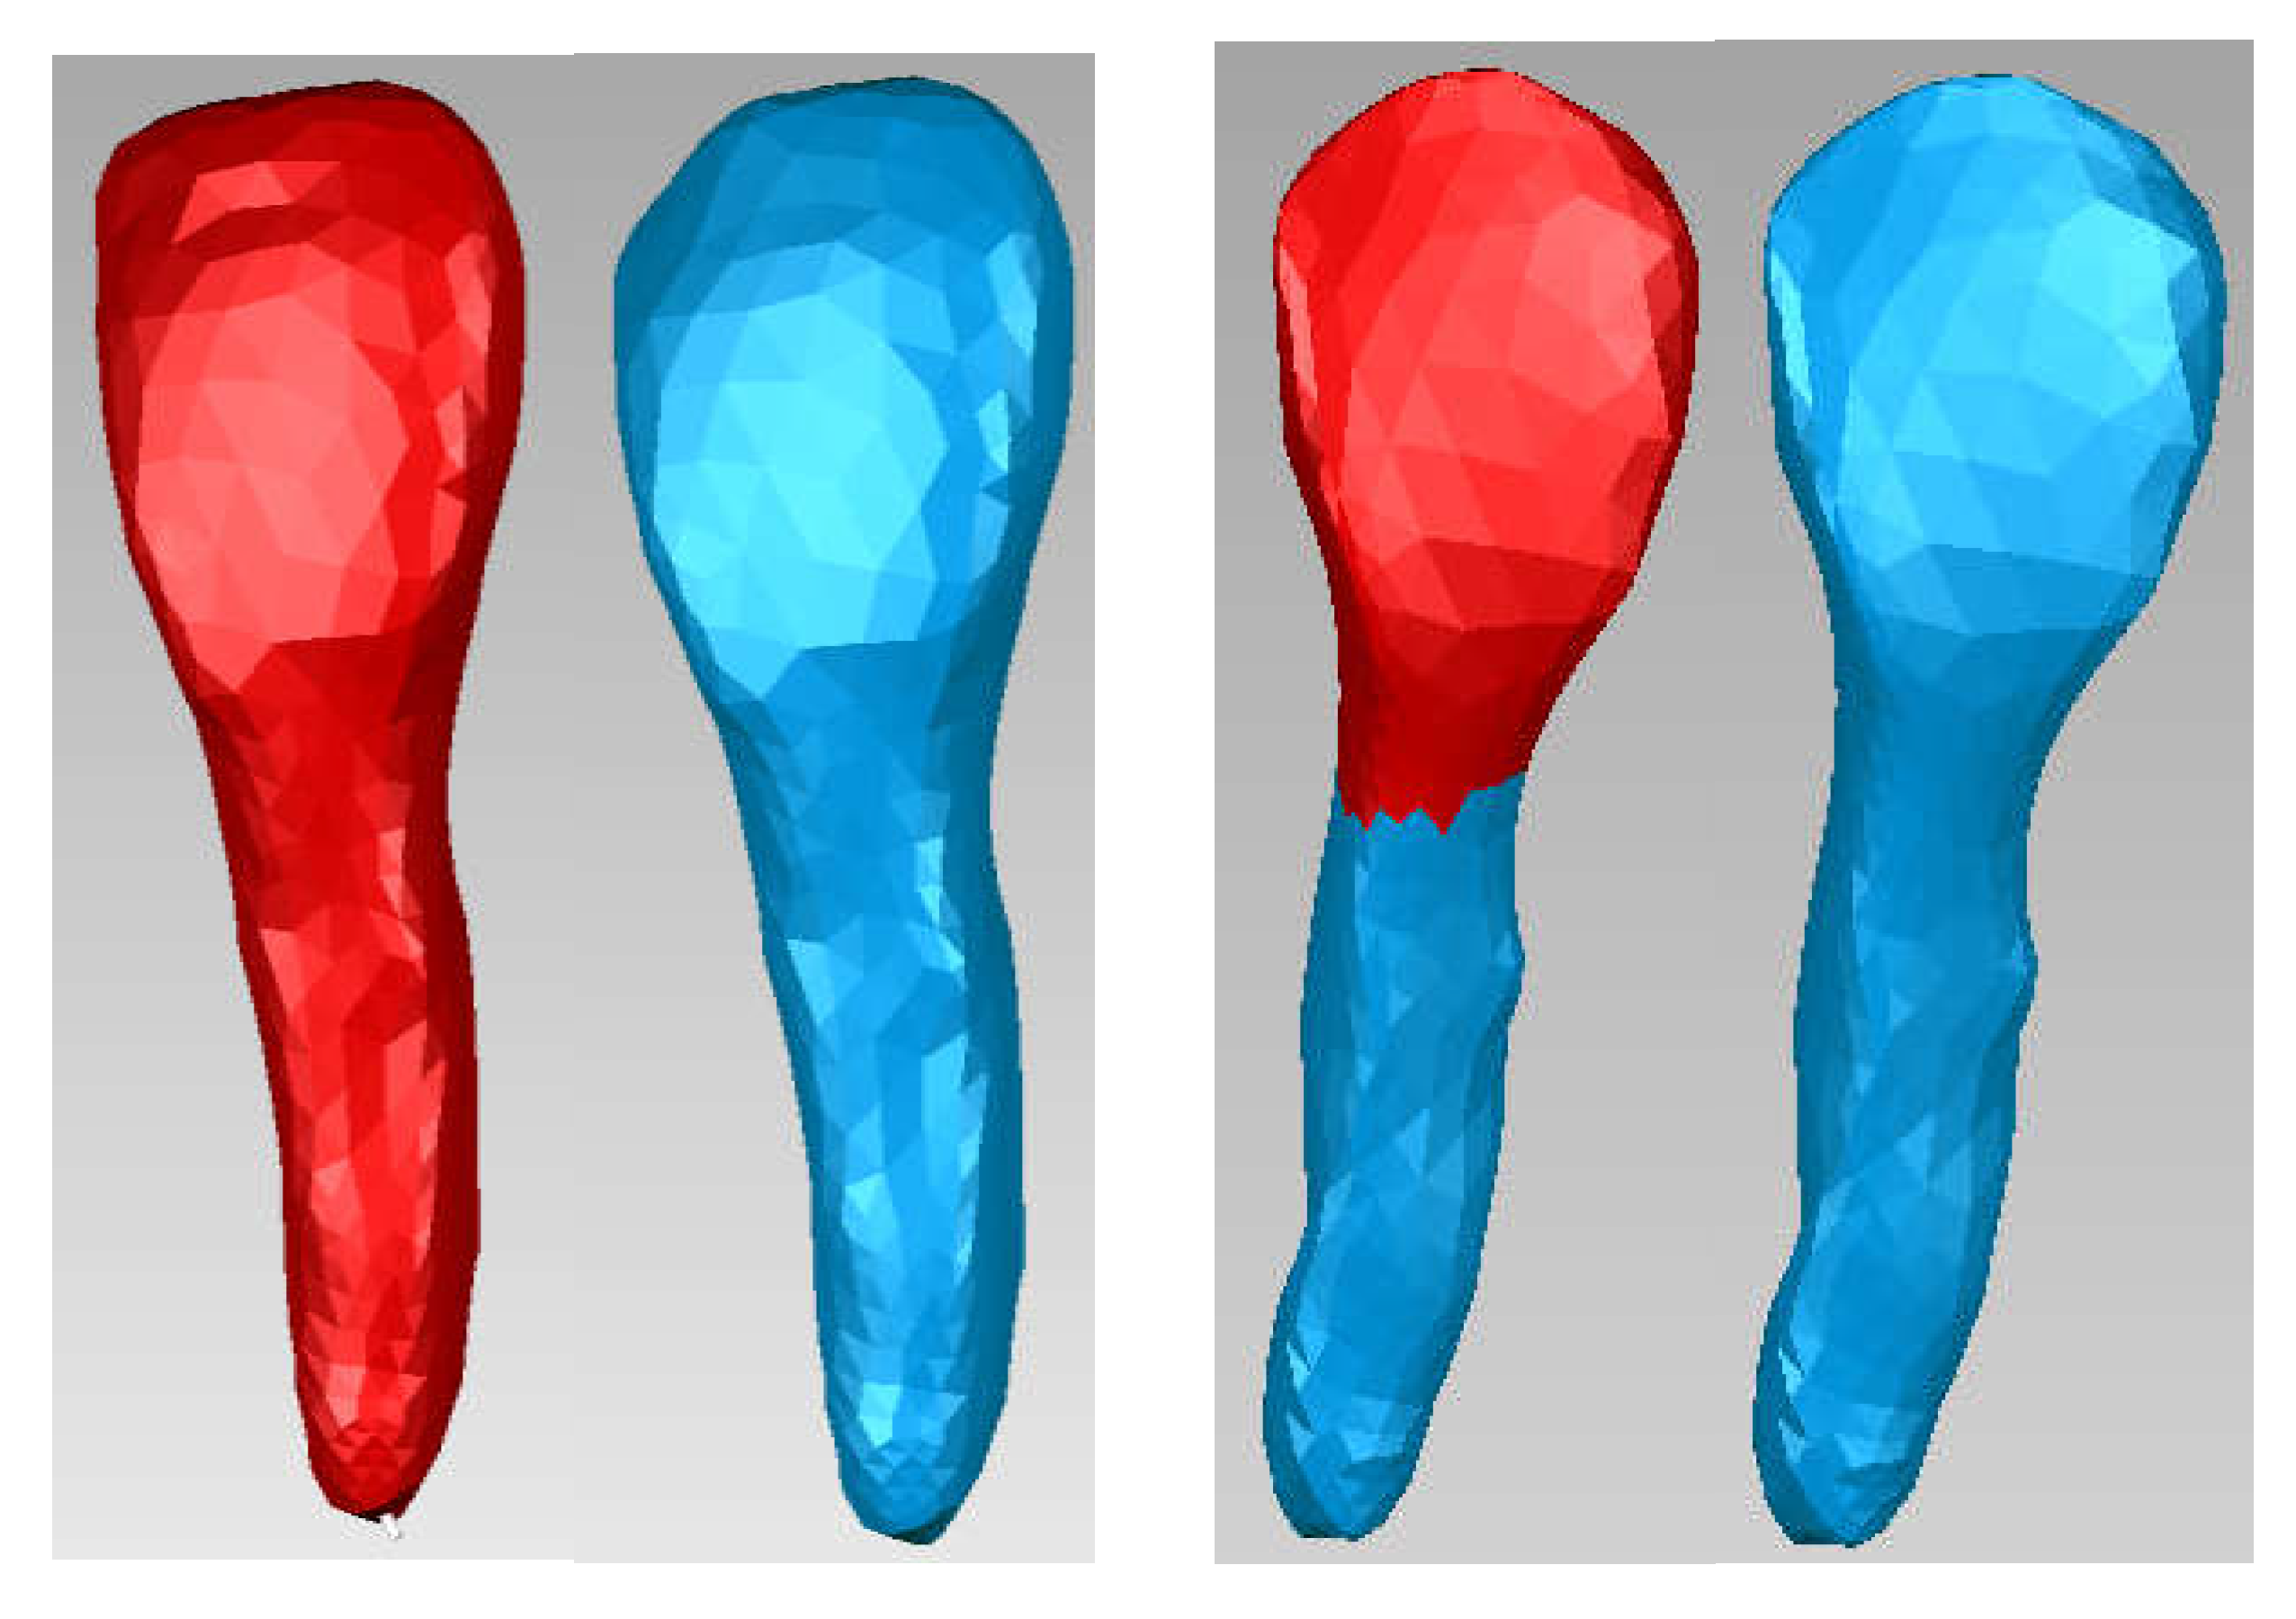
Then, Offset techniques were applied on the entire model or on some areas of the model to obtain the outer model of the dentin. These operations are shown in
Figure 12.
Starting from the dentine model, applying similar Offset techniques, the model of tooth 1.1 pulp was finally obtained.
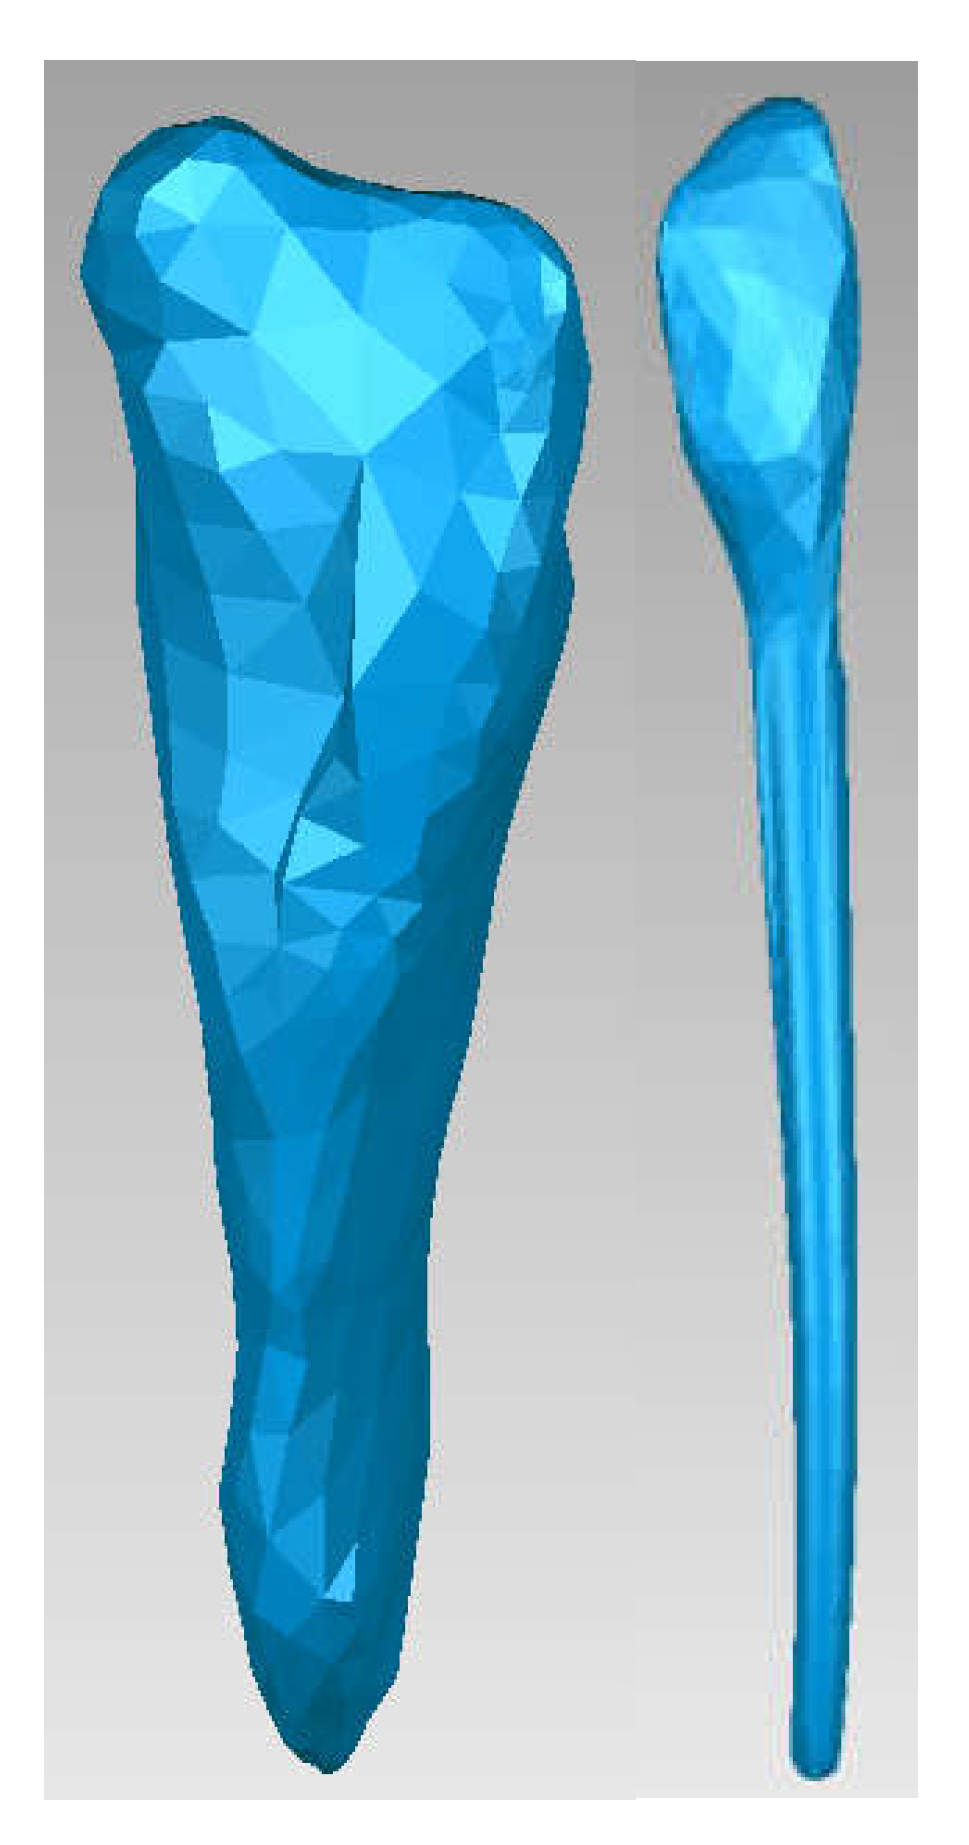
Figure 13 shows the final model of tooth 1.1 pulp in Geomagic and SolidWorks.
The same procedure was used to obtain the dentine and pulp models for tooth 4.1.
Figure 14 shows these models.
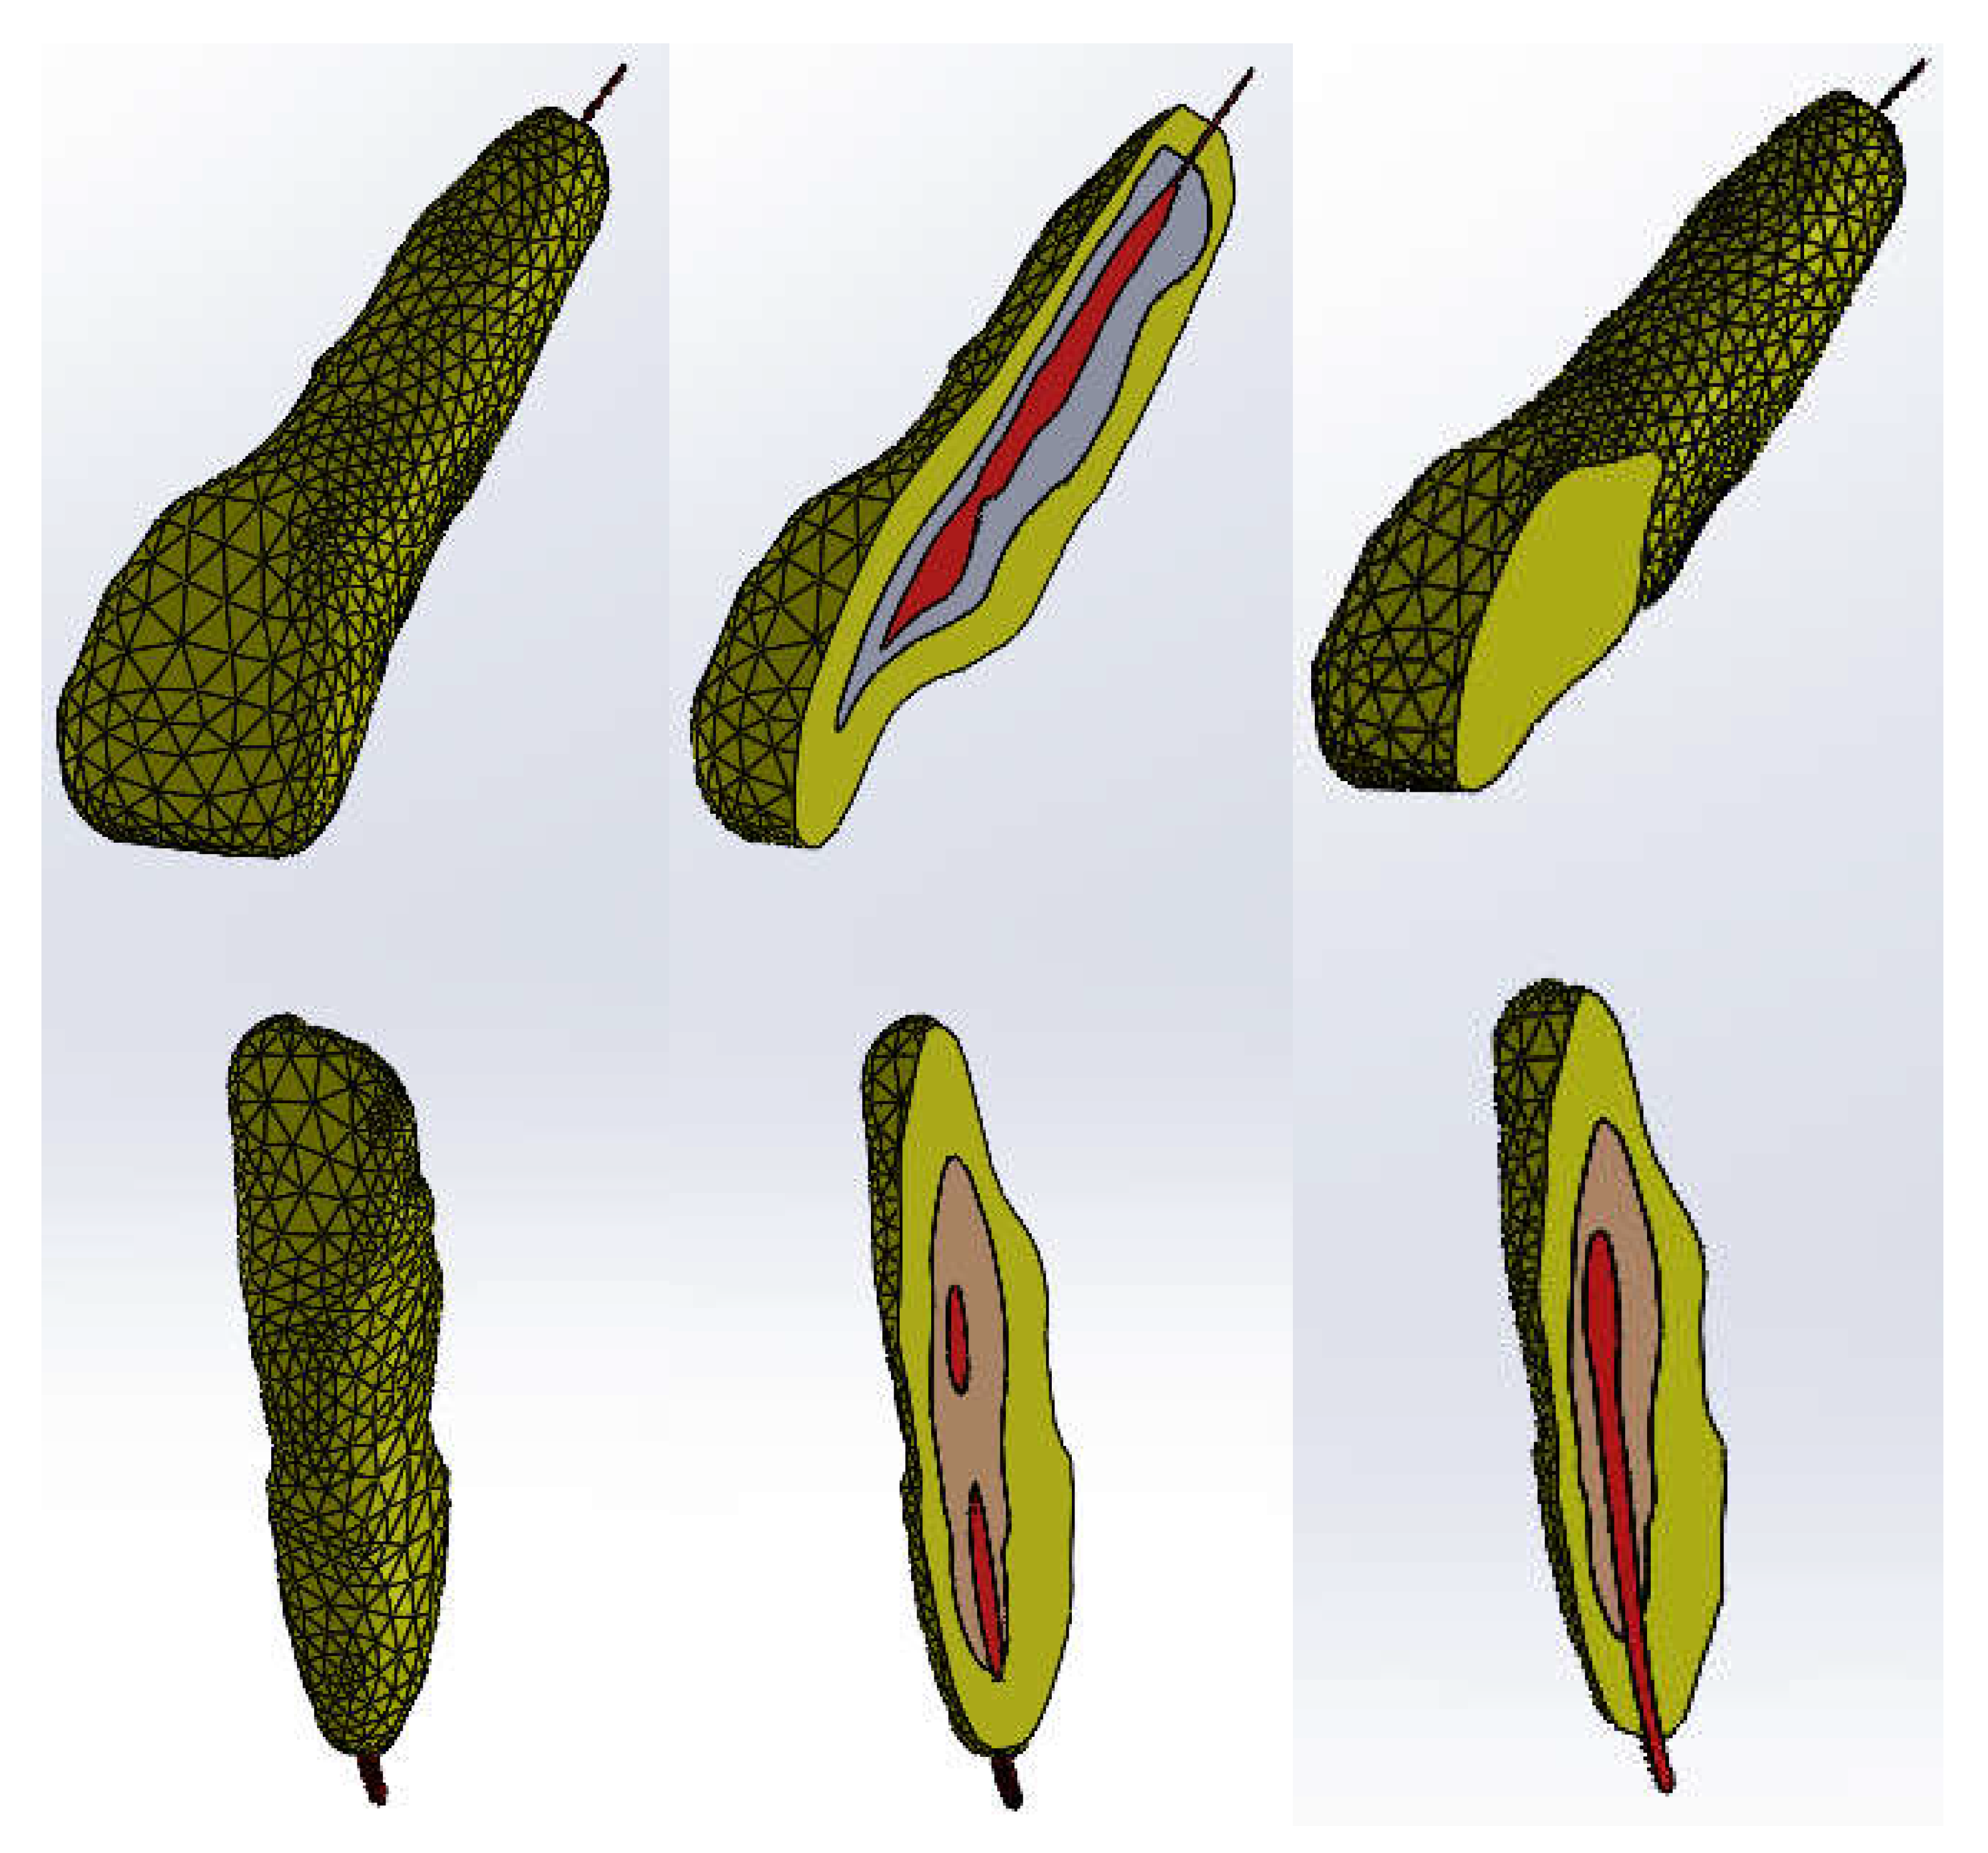
These models representing the enamel, dentin and pulp of teeth 1.1 and 4.1 were loaded into the Assembly module of SolidWorks, and based on the coordinate systems, the models were aligned. Using volumetric reduction techniques, the final models of teeth 1.1 and 4.1 were obtained, as shown in
Figure 15.
Using Direct Engineering techniques and methods, the bracket and tube-type elements were modeled.
Figure 16 shows four of these components.
These components were placed on the teeth according to orthodontic protocols. On each of these components, four points have been defined that will be found on the curves that define the orthodontic arches. Initially, two curves were drawn that "connected" these points that were placed above the bracket and tube-type elements, in close proximity. Later, using circular sections placed perpendicular to the curves, Sweep type shapes were defined that defined the orthodontic arches.
Figure 17 shows these orthodontic arches placed on the dentition.
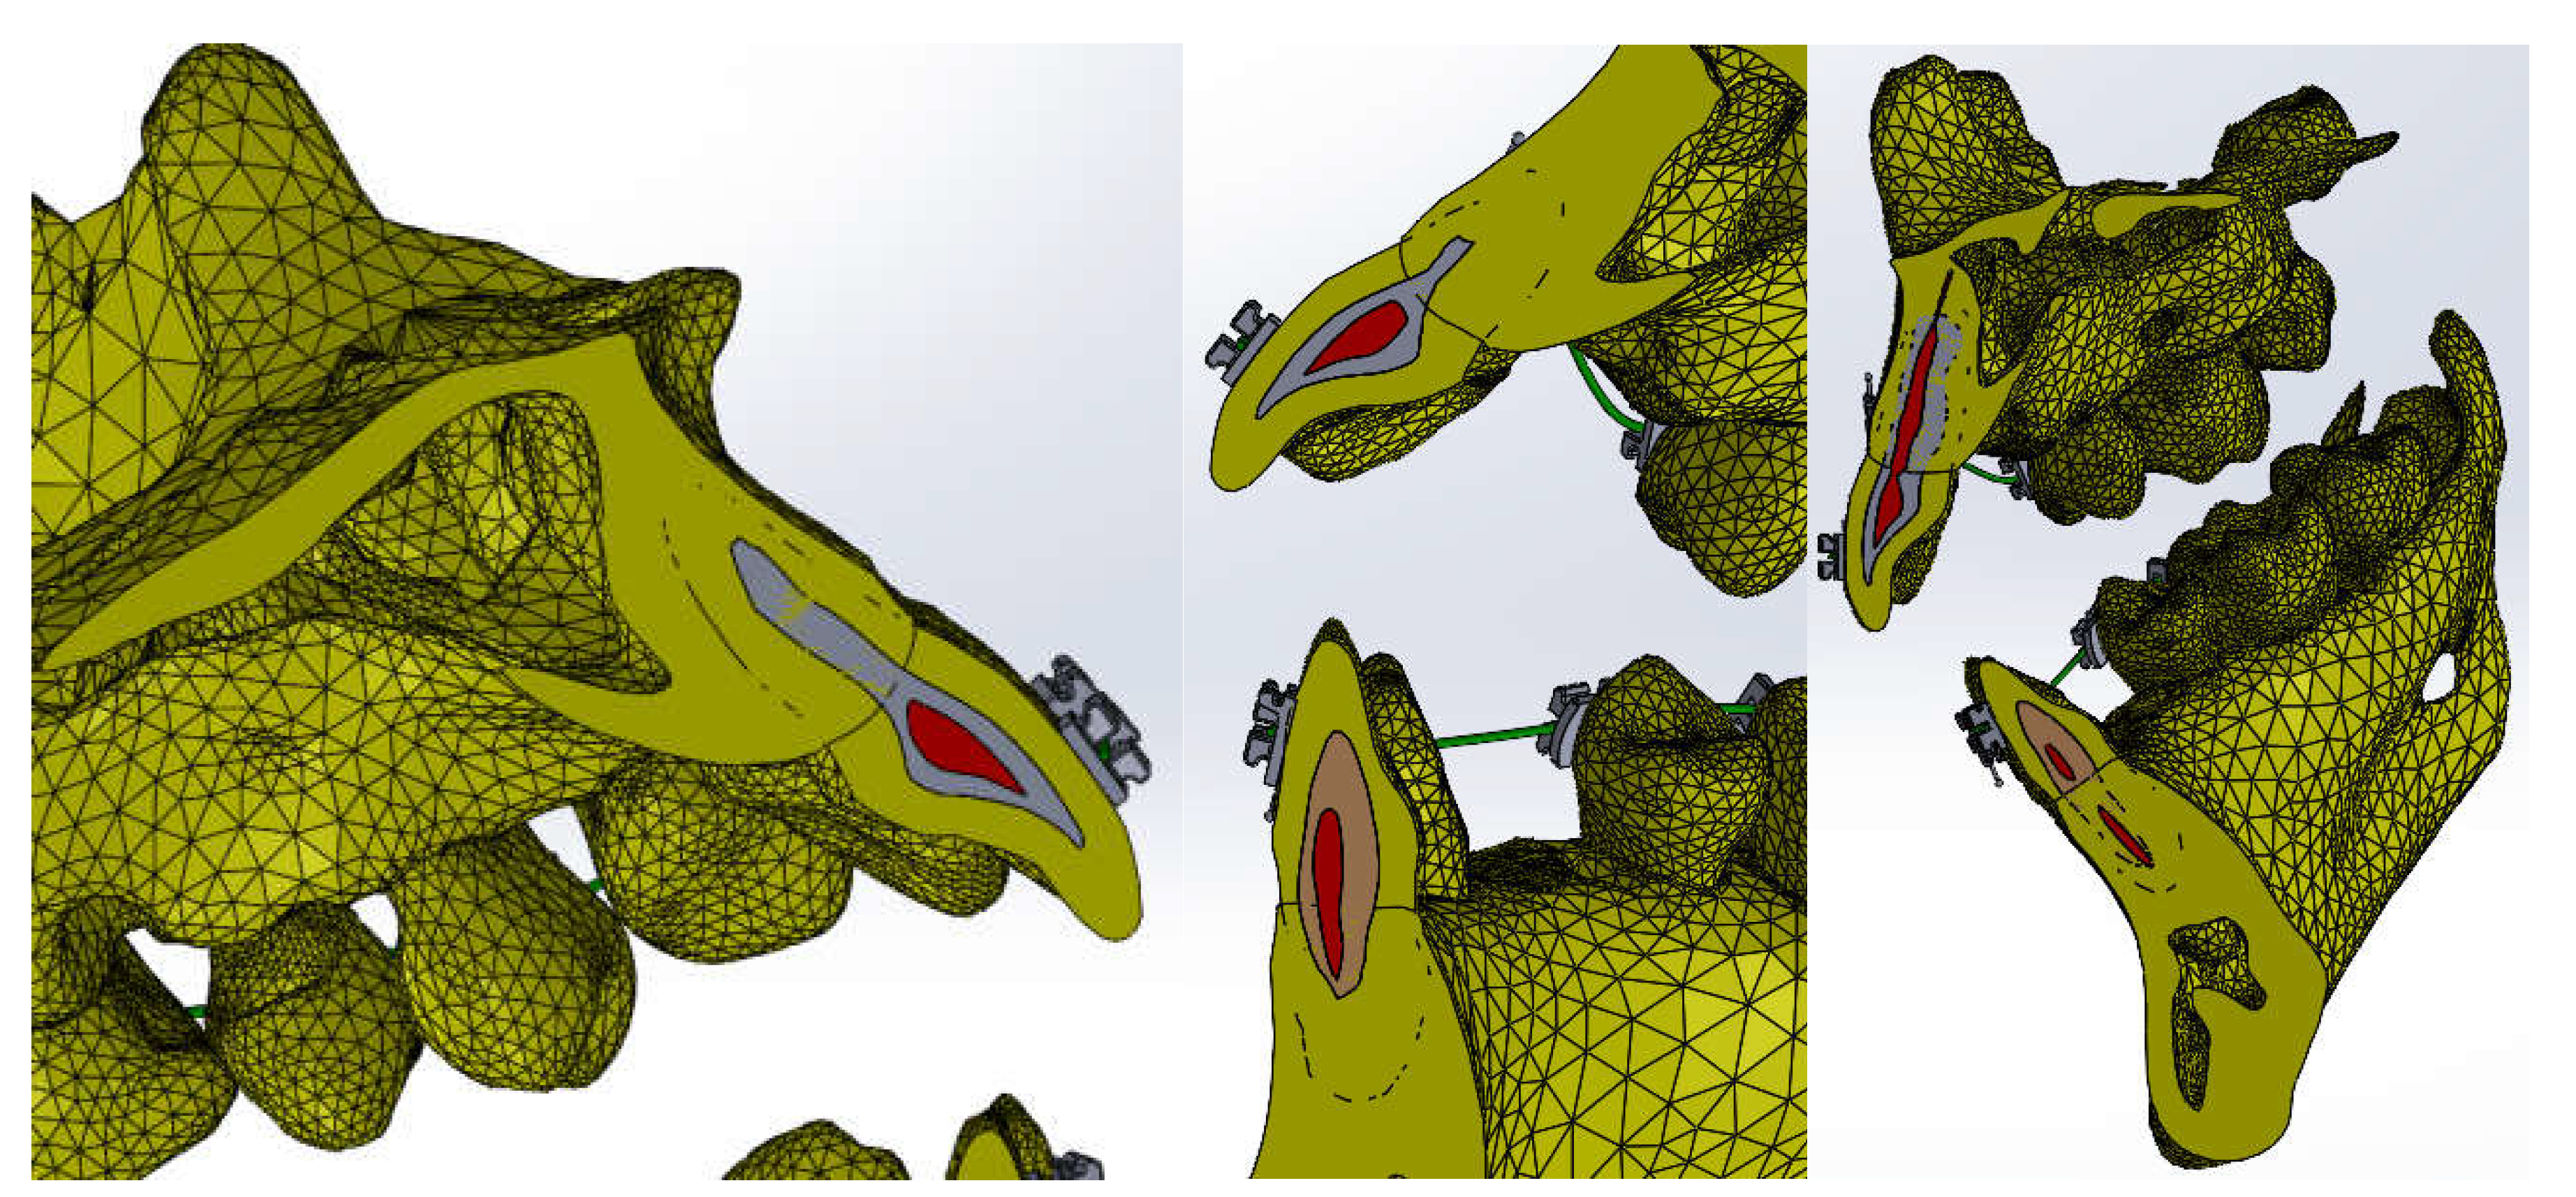
In
Figure 18, sections through teeth 1.1 and 4.1 are shown.
2.2. Preparation of Thermal Simulations
Two groups of simulations were carried out for:
- The model of the control stomatognathic apparatus (in the obtained model, the bracket and tube-type elements and the orthodontic arches were suppressed);
- The model of the stomatognathic apparatus with a fixed metallic orthodontic appliance.
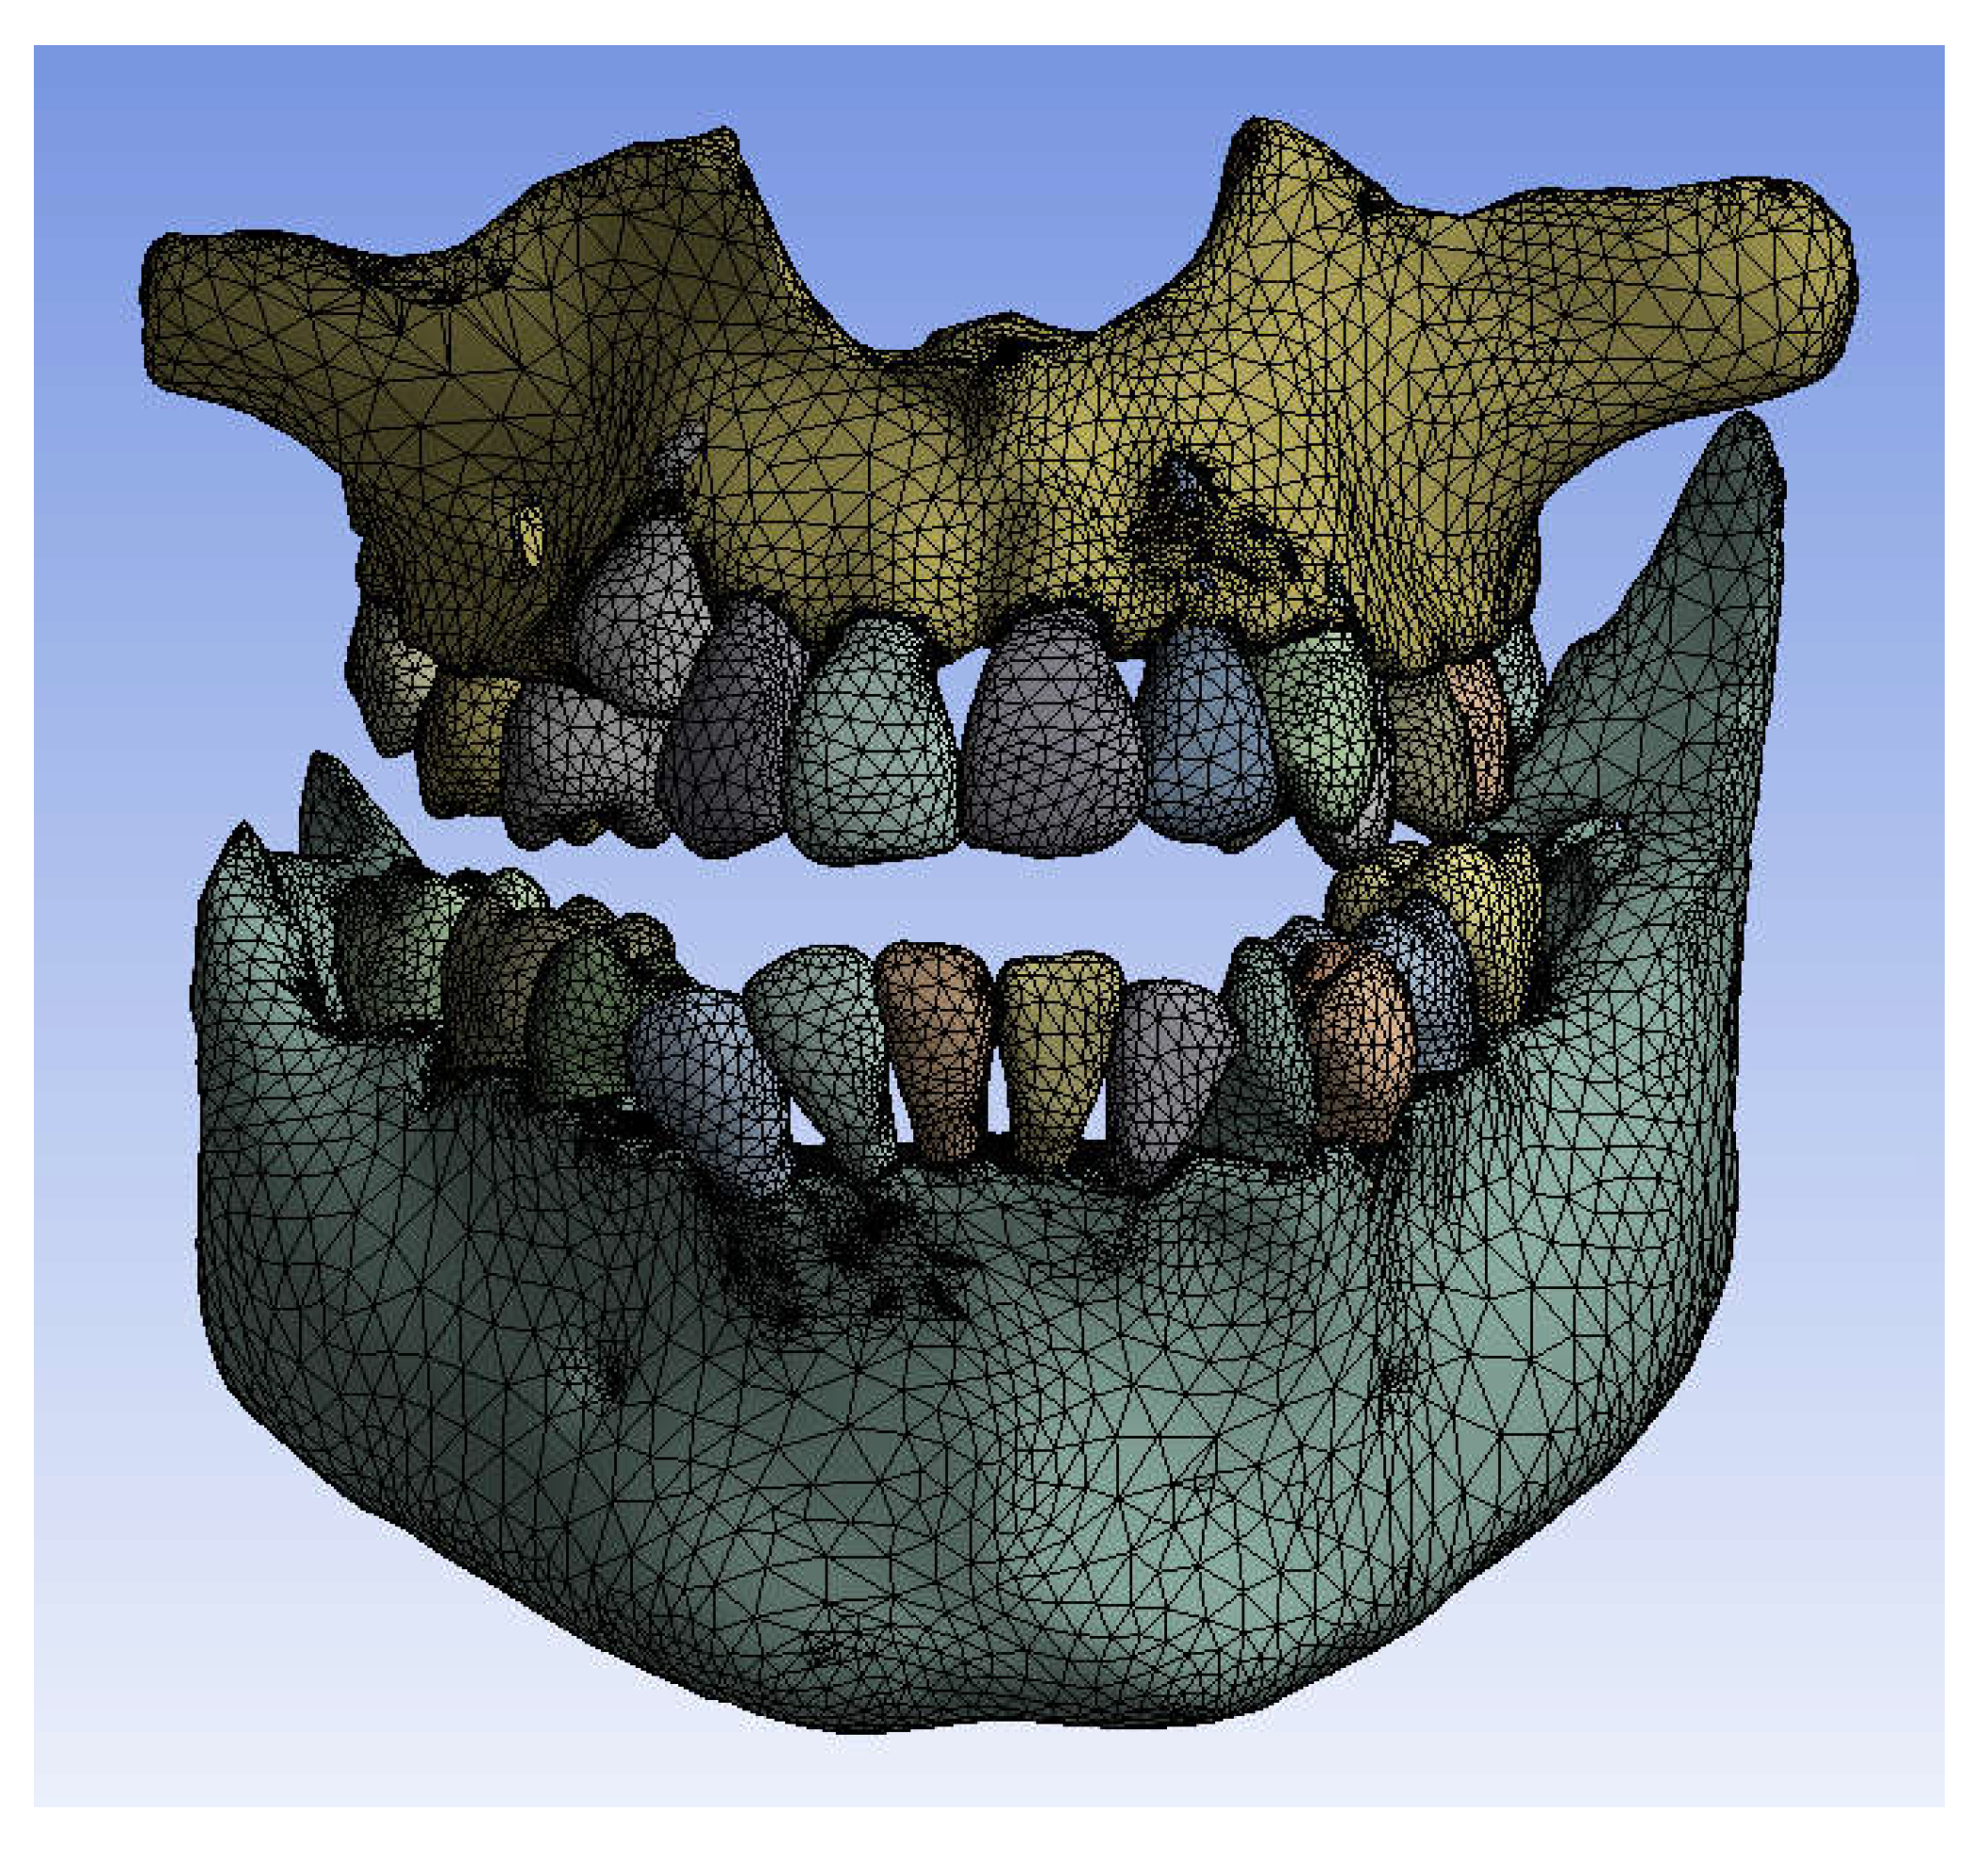
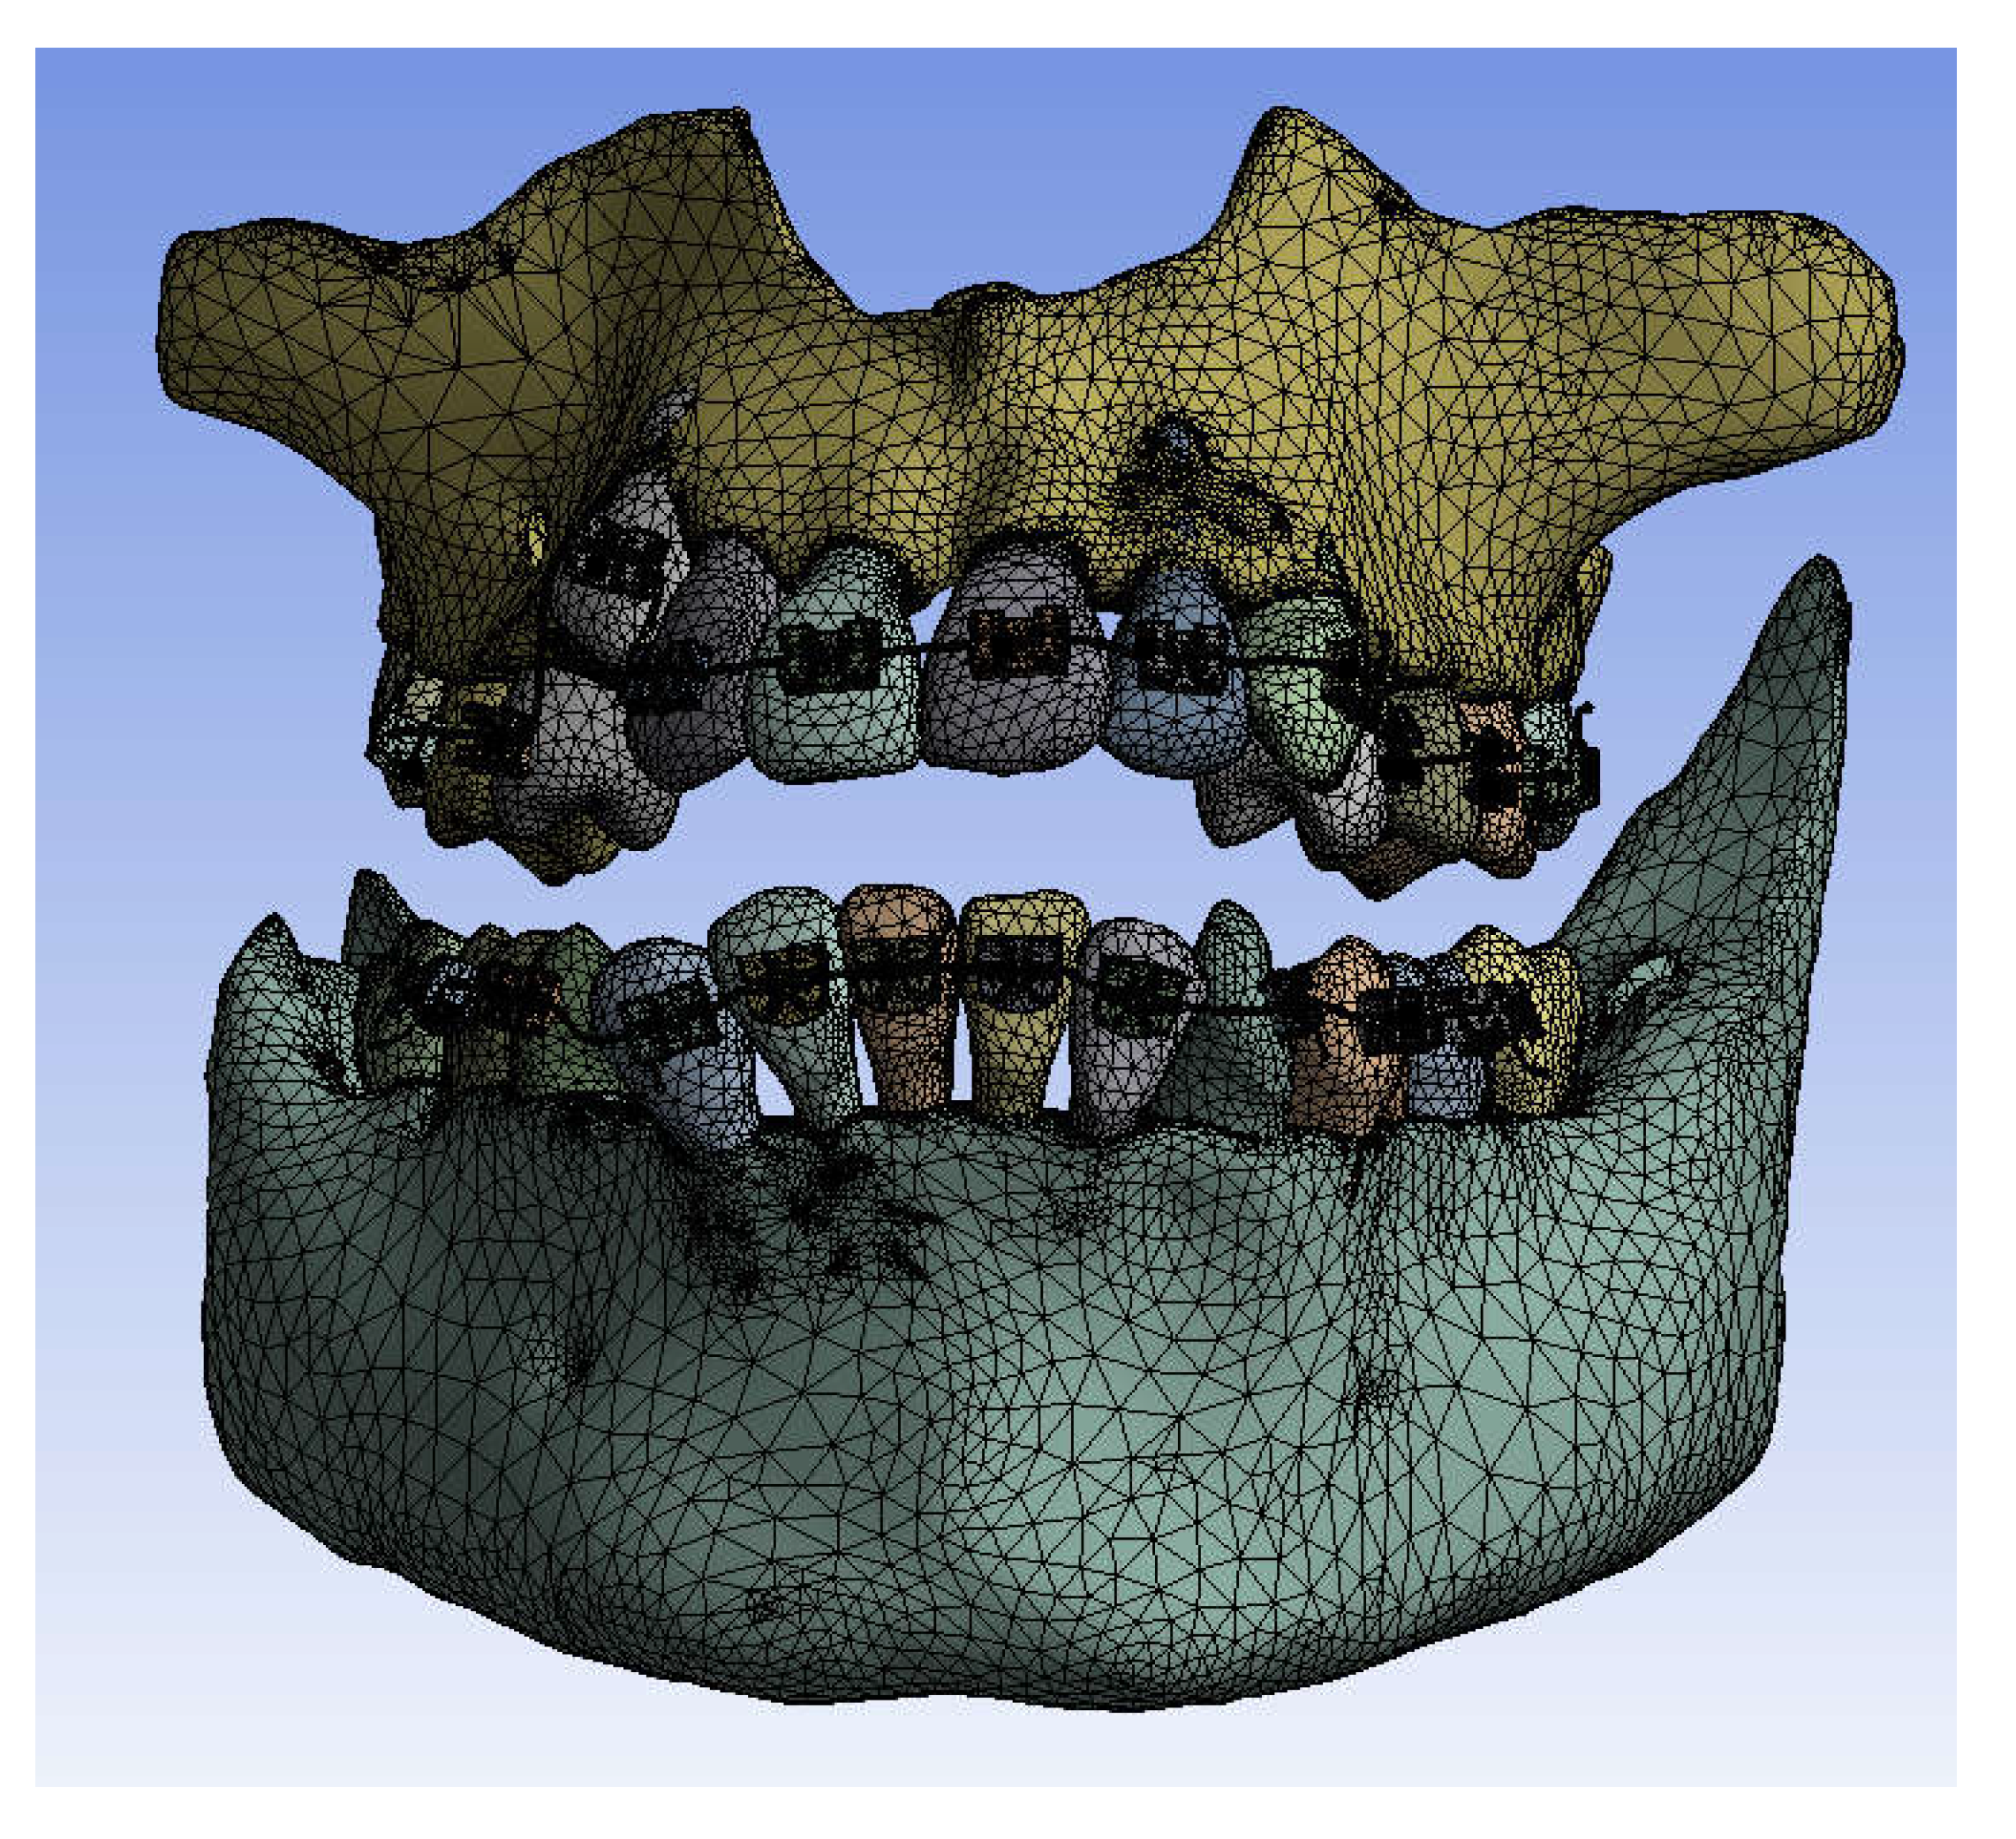
These models were imported into Ansys Workbench, in the Transient Thermal module, where they were divided into finite elements.
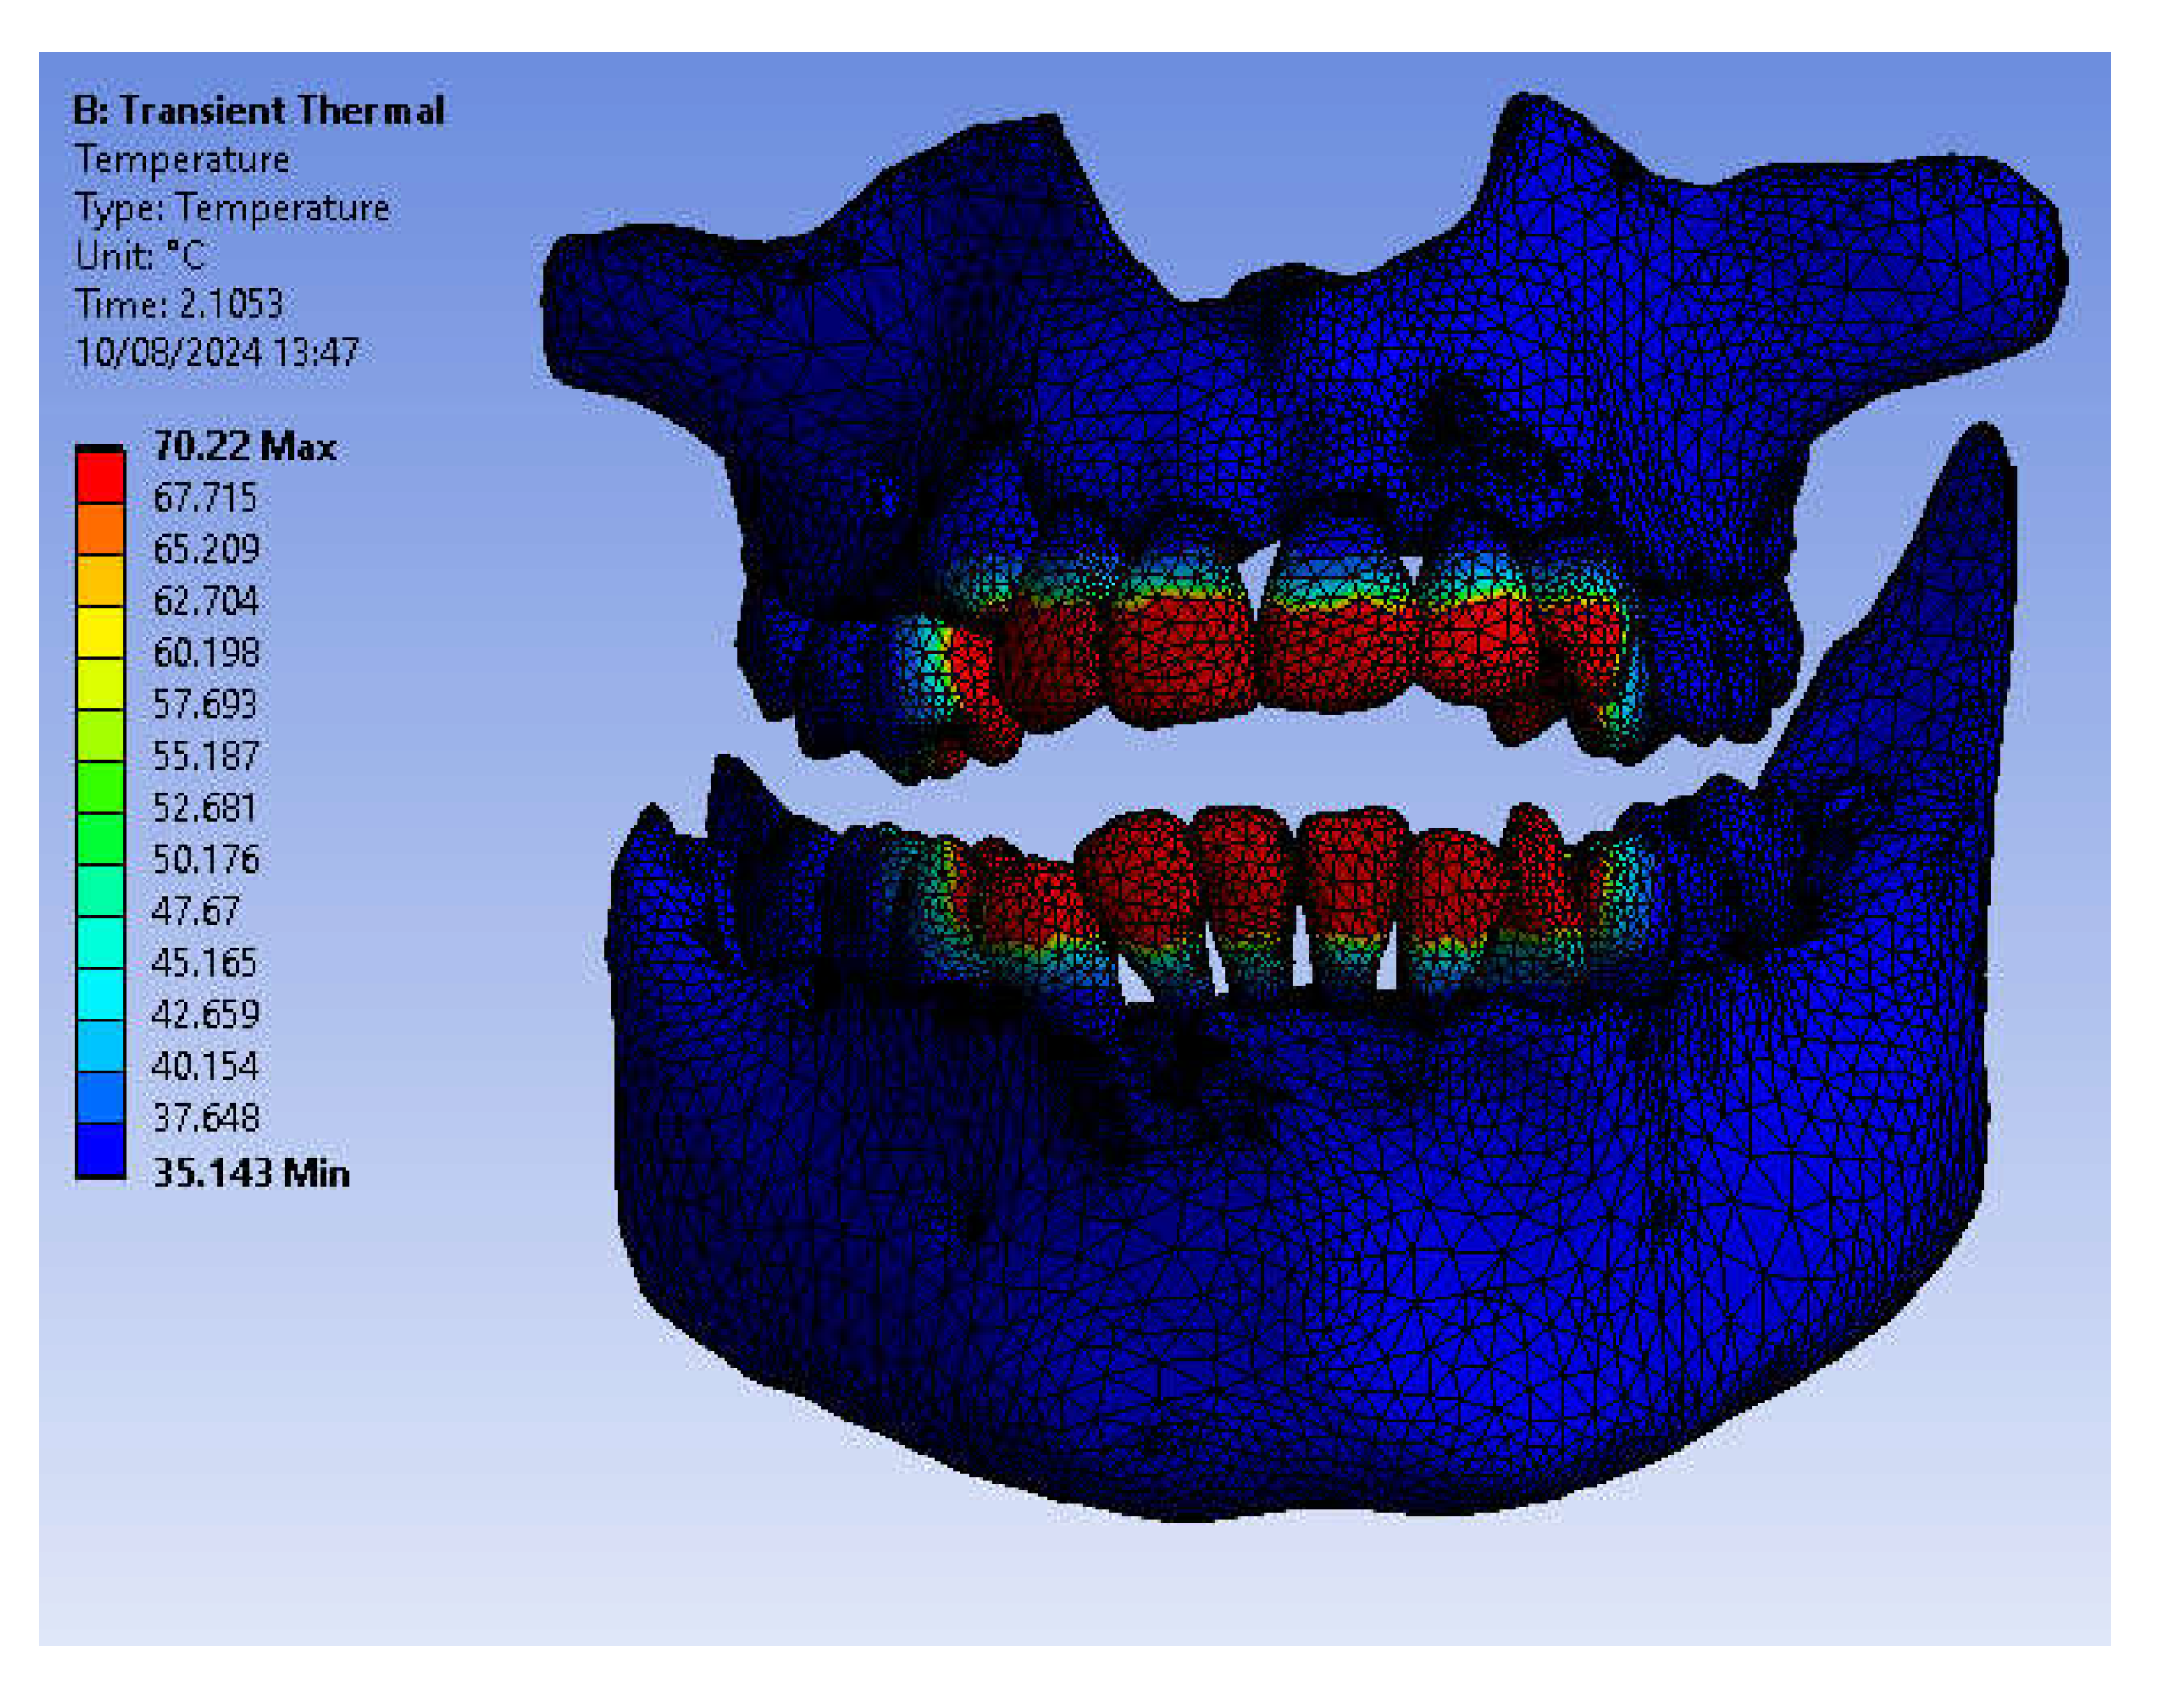
Figure 19 shows the finite element structure composed of 1,248,243 nodes and 726,343 elements for the model without a fixed metallic orthodontic appliance.
Figure 20 shows the finite element structure composed of 1,489,889 nodes and 827,771 elements for the model with a fixed metallic orthodontic appliance.
In the Engineering Data module, the materials used in the simulations were defined based on their physical and thermal properties.
Table 1 shows these materials that were used. Obviously, for the simulations without a fixed metallic orthodontic appliance., the two alloys (Ni+Cr, Ni+Ti) were not used [
8,
9,
10,
11,
12,
13,
14,
15,
16].
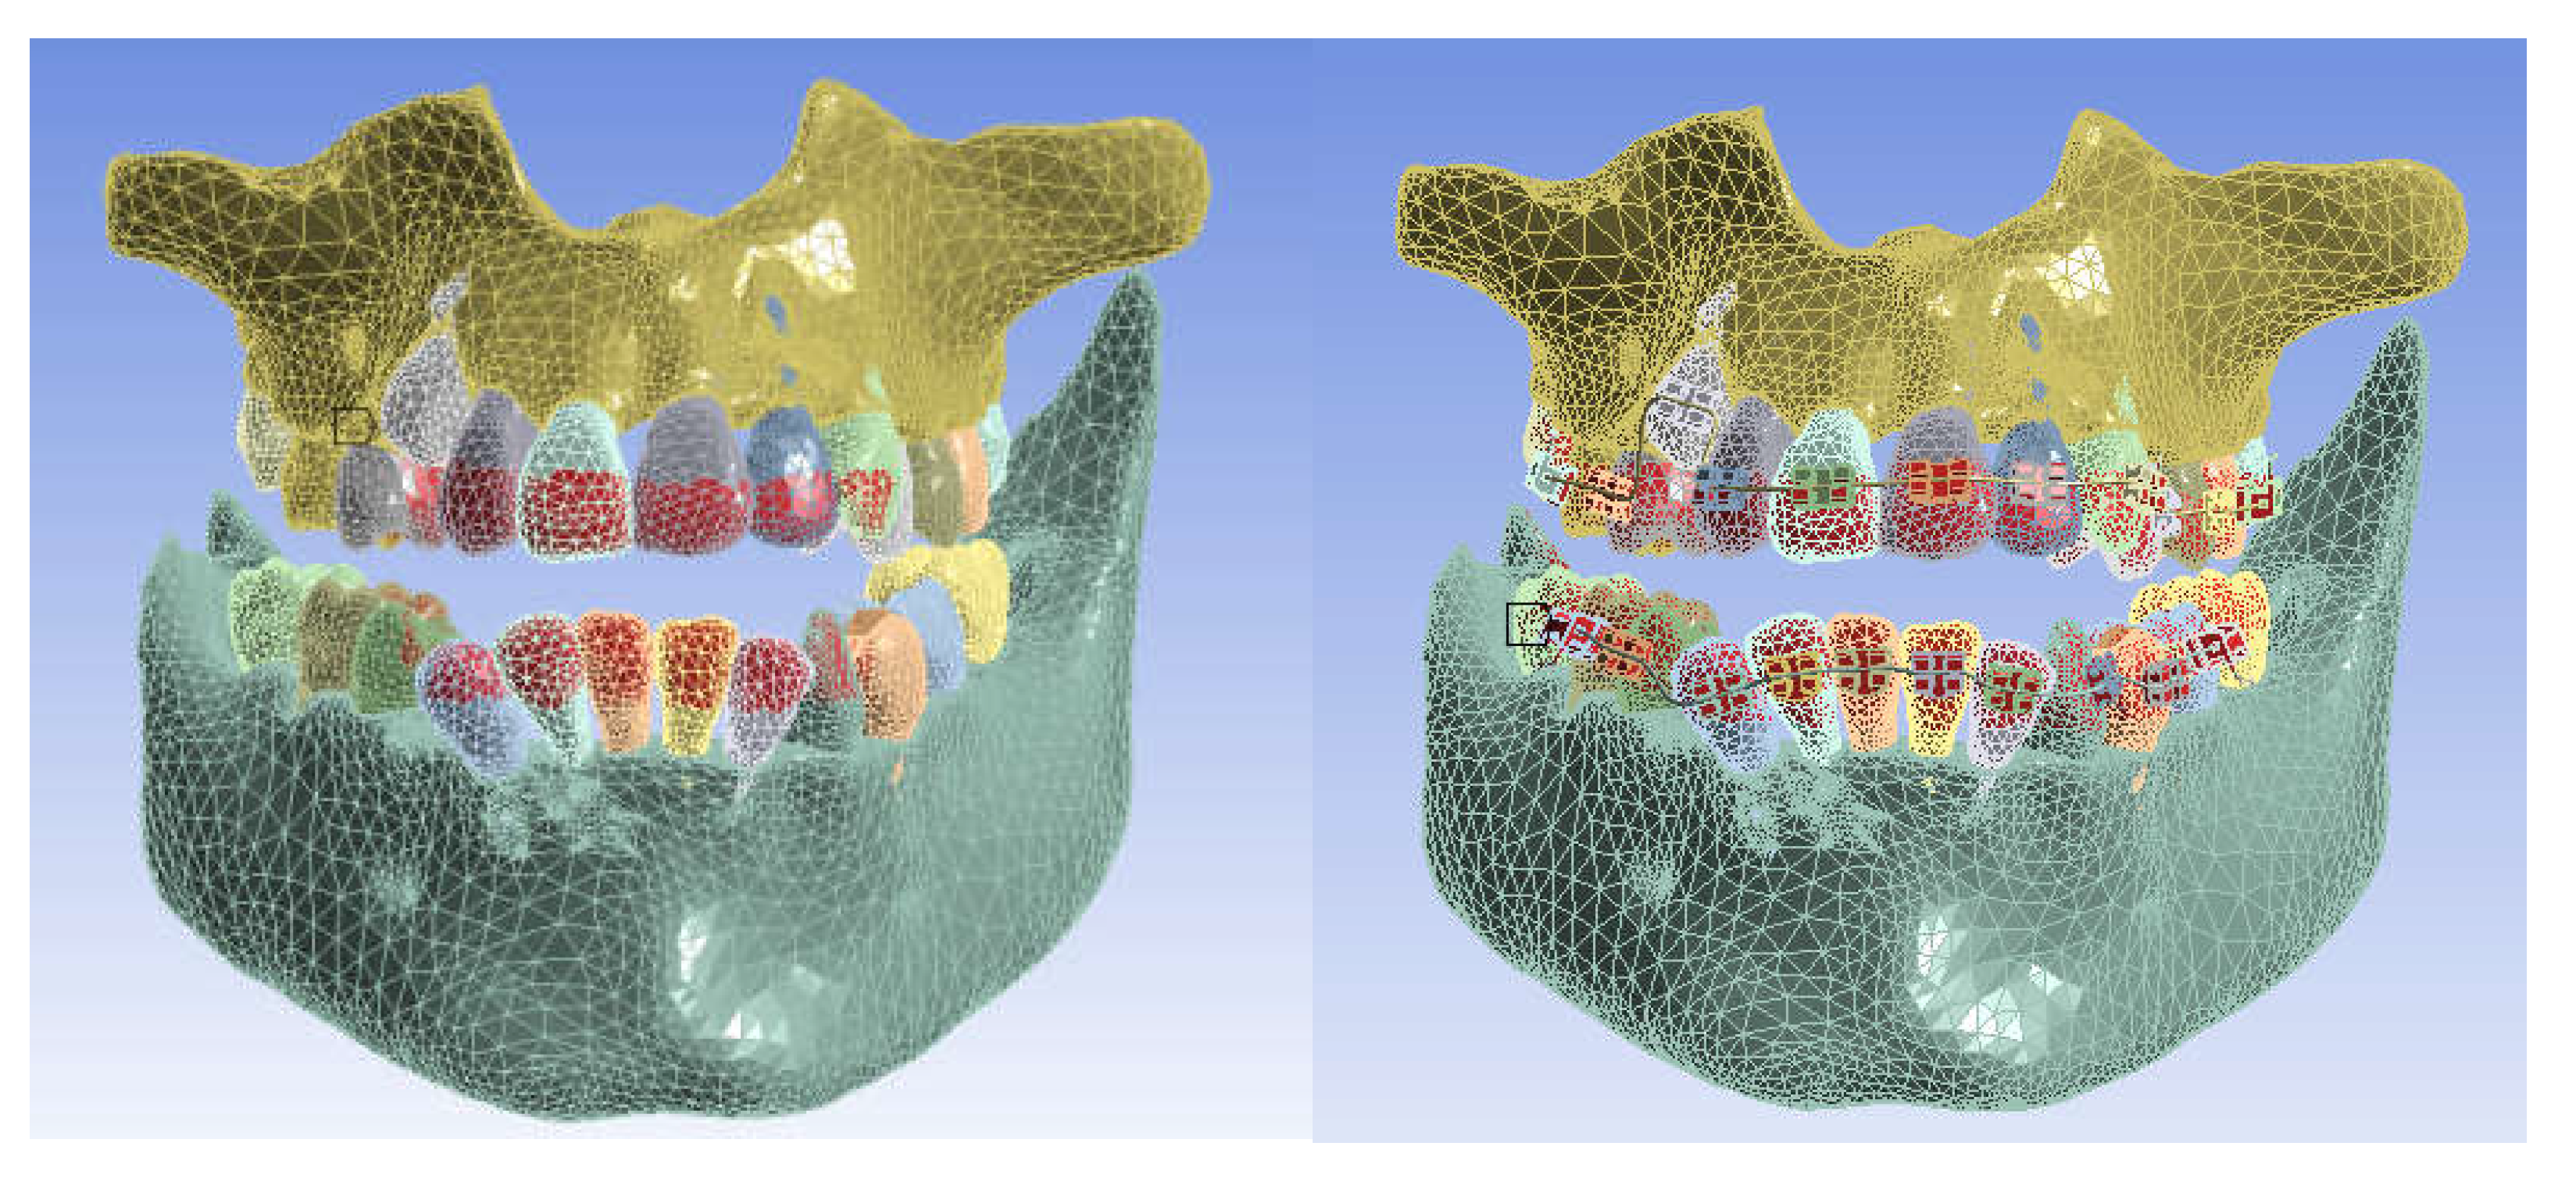
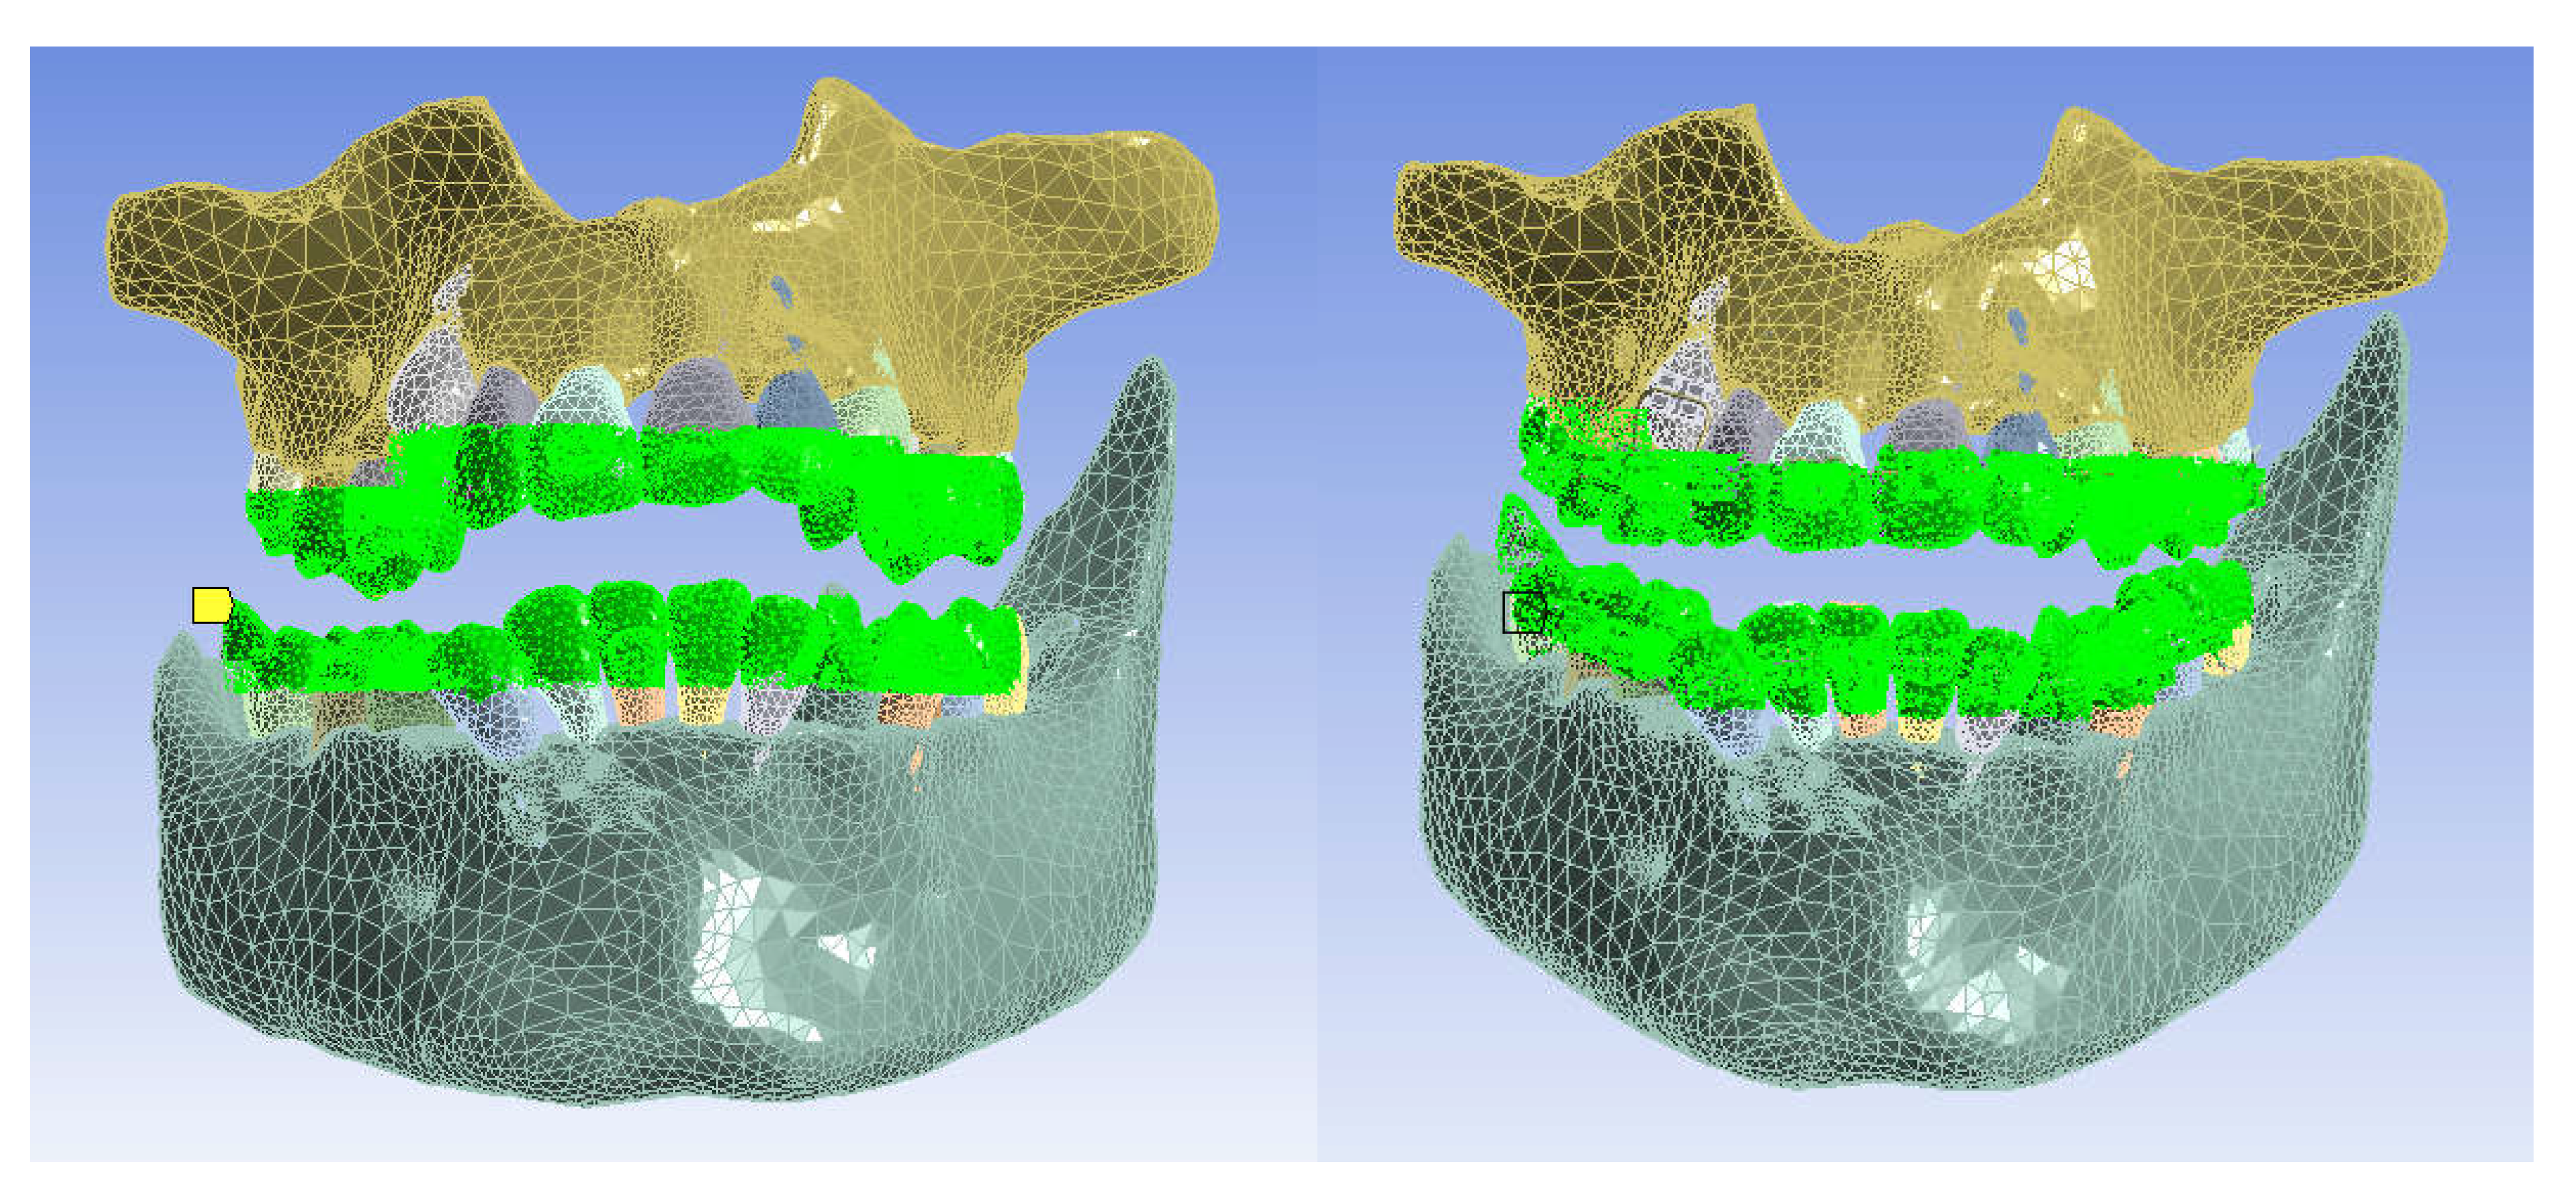
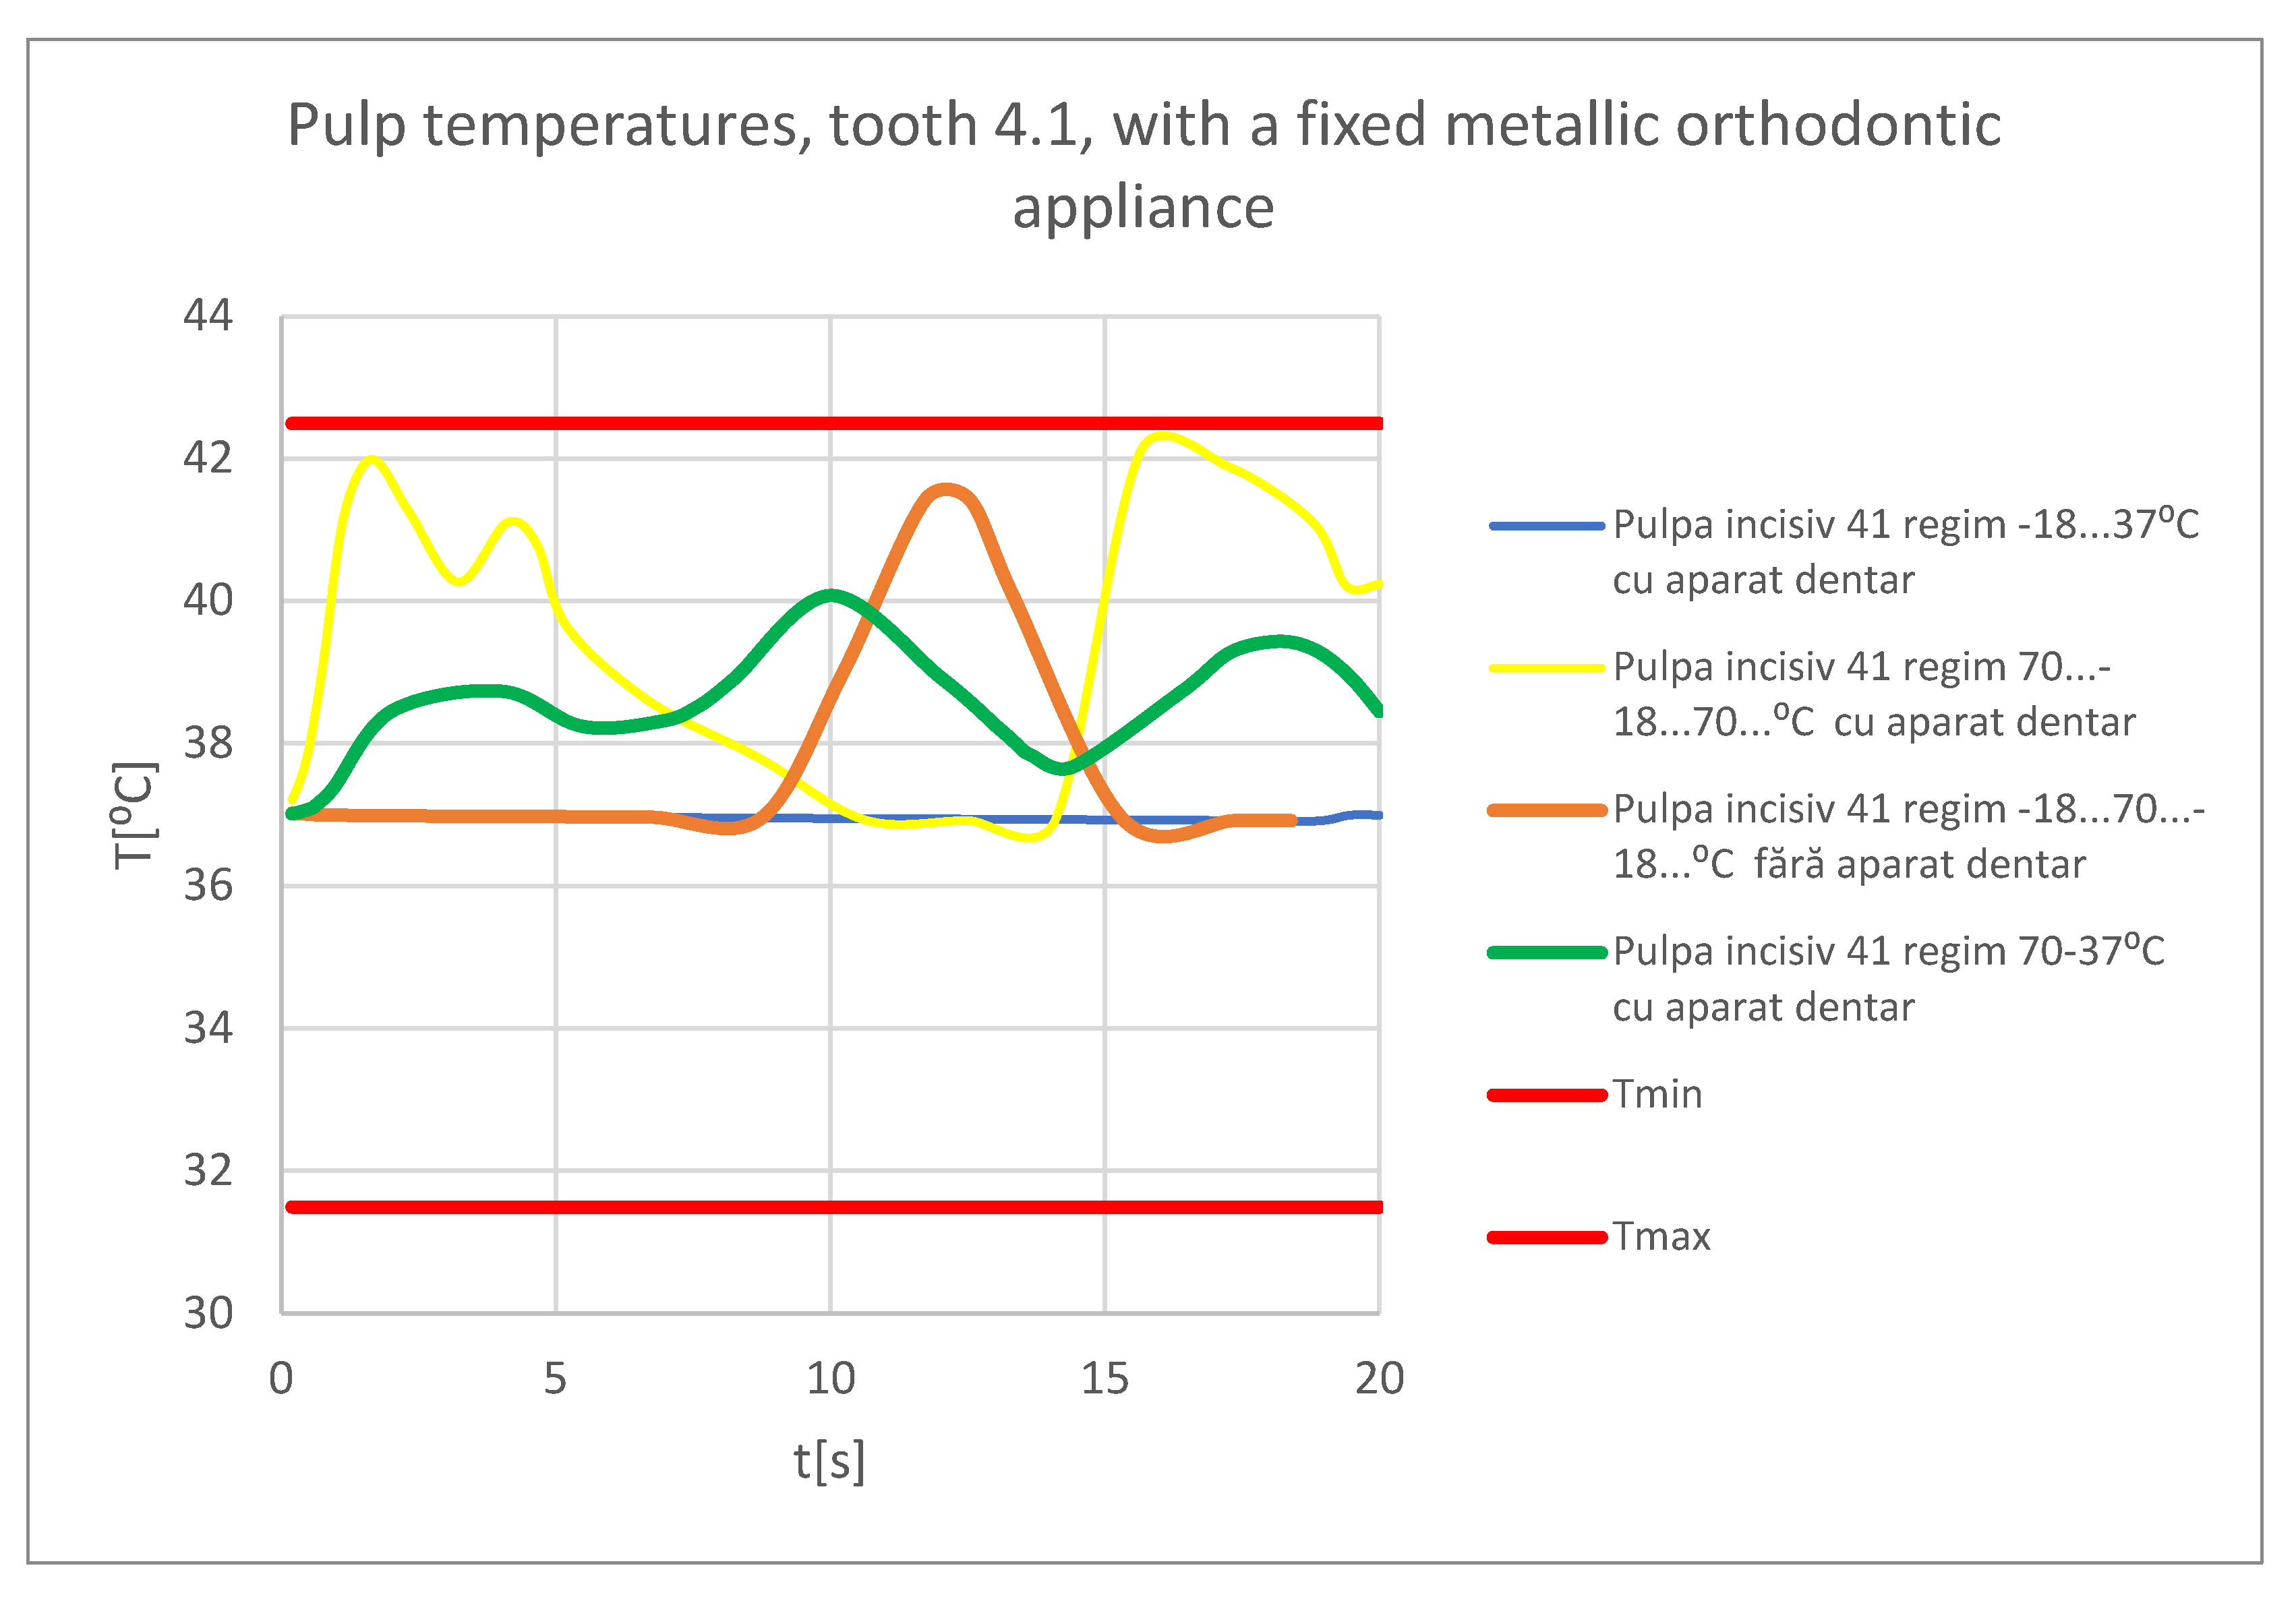
Next, a temperature source materialized by the surfaces that come into contact with hot or cold food was defined, as shown in
Figure 21.
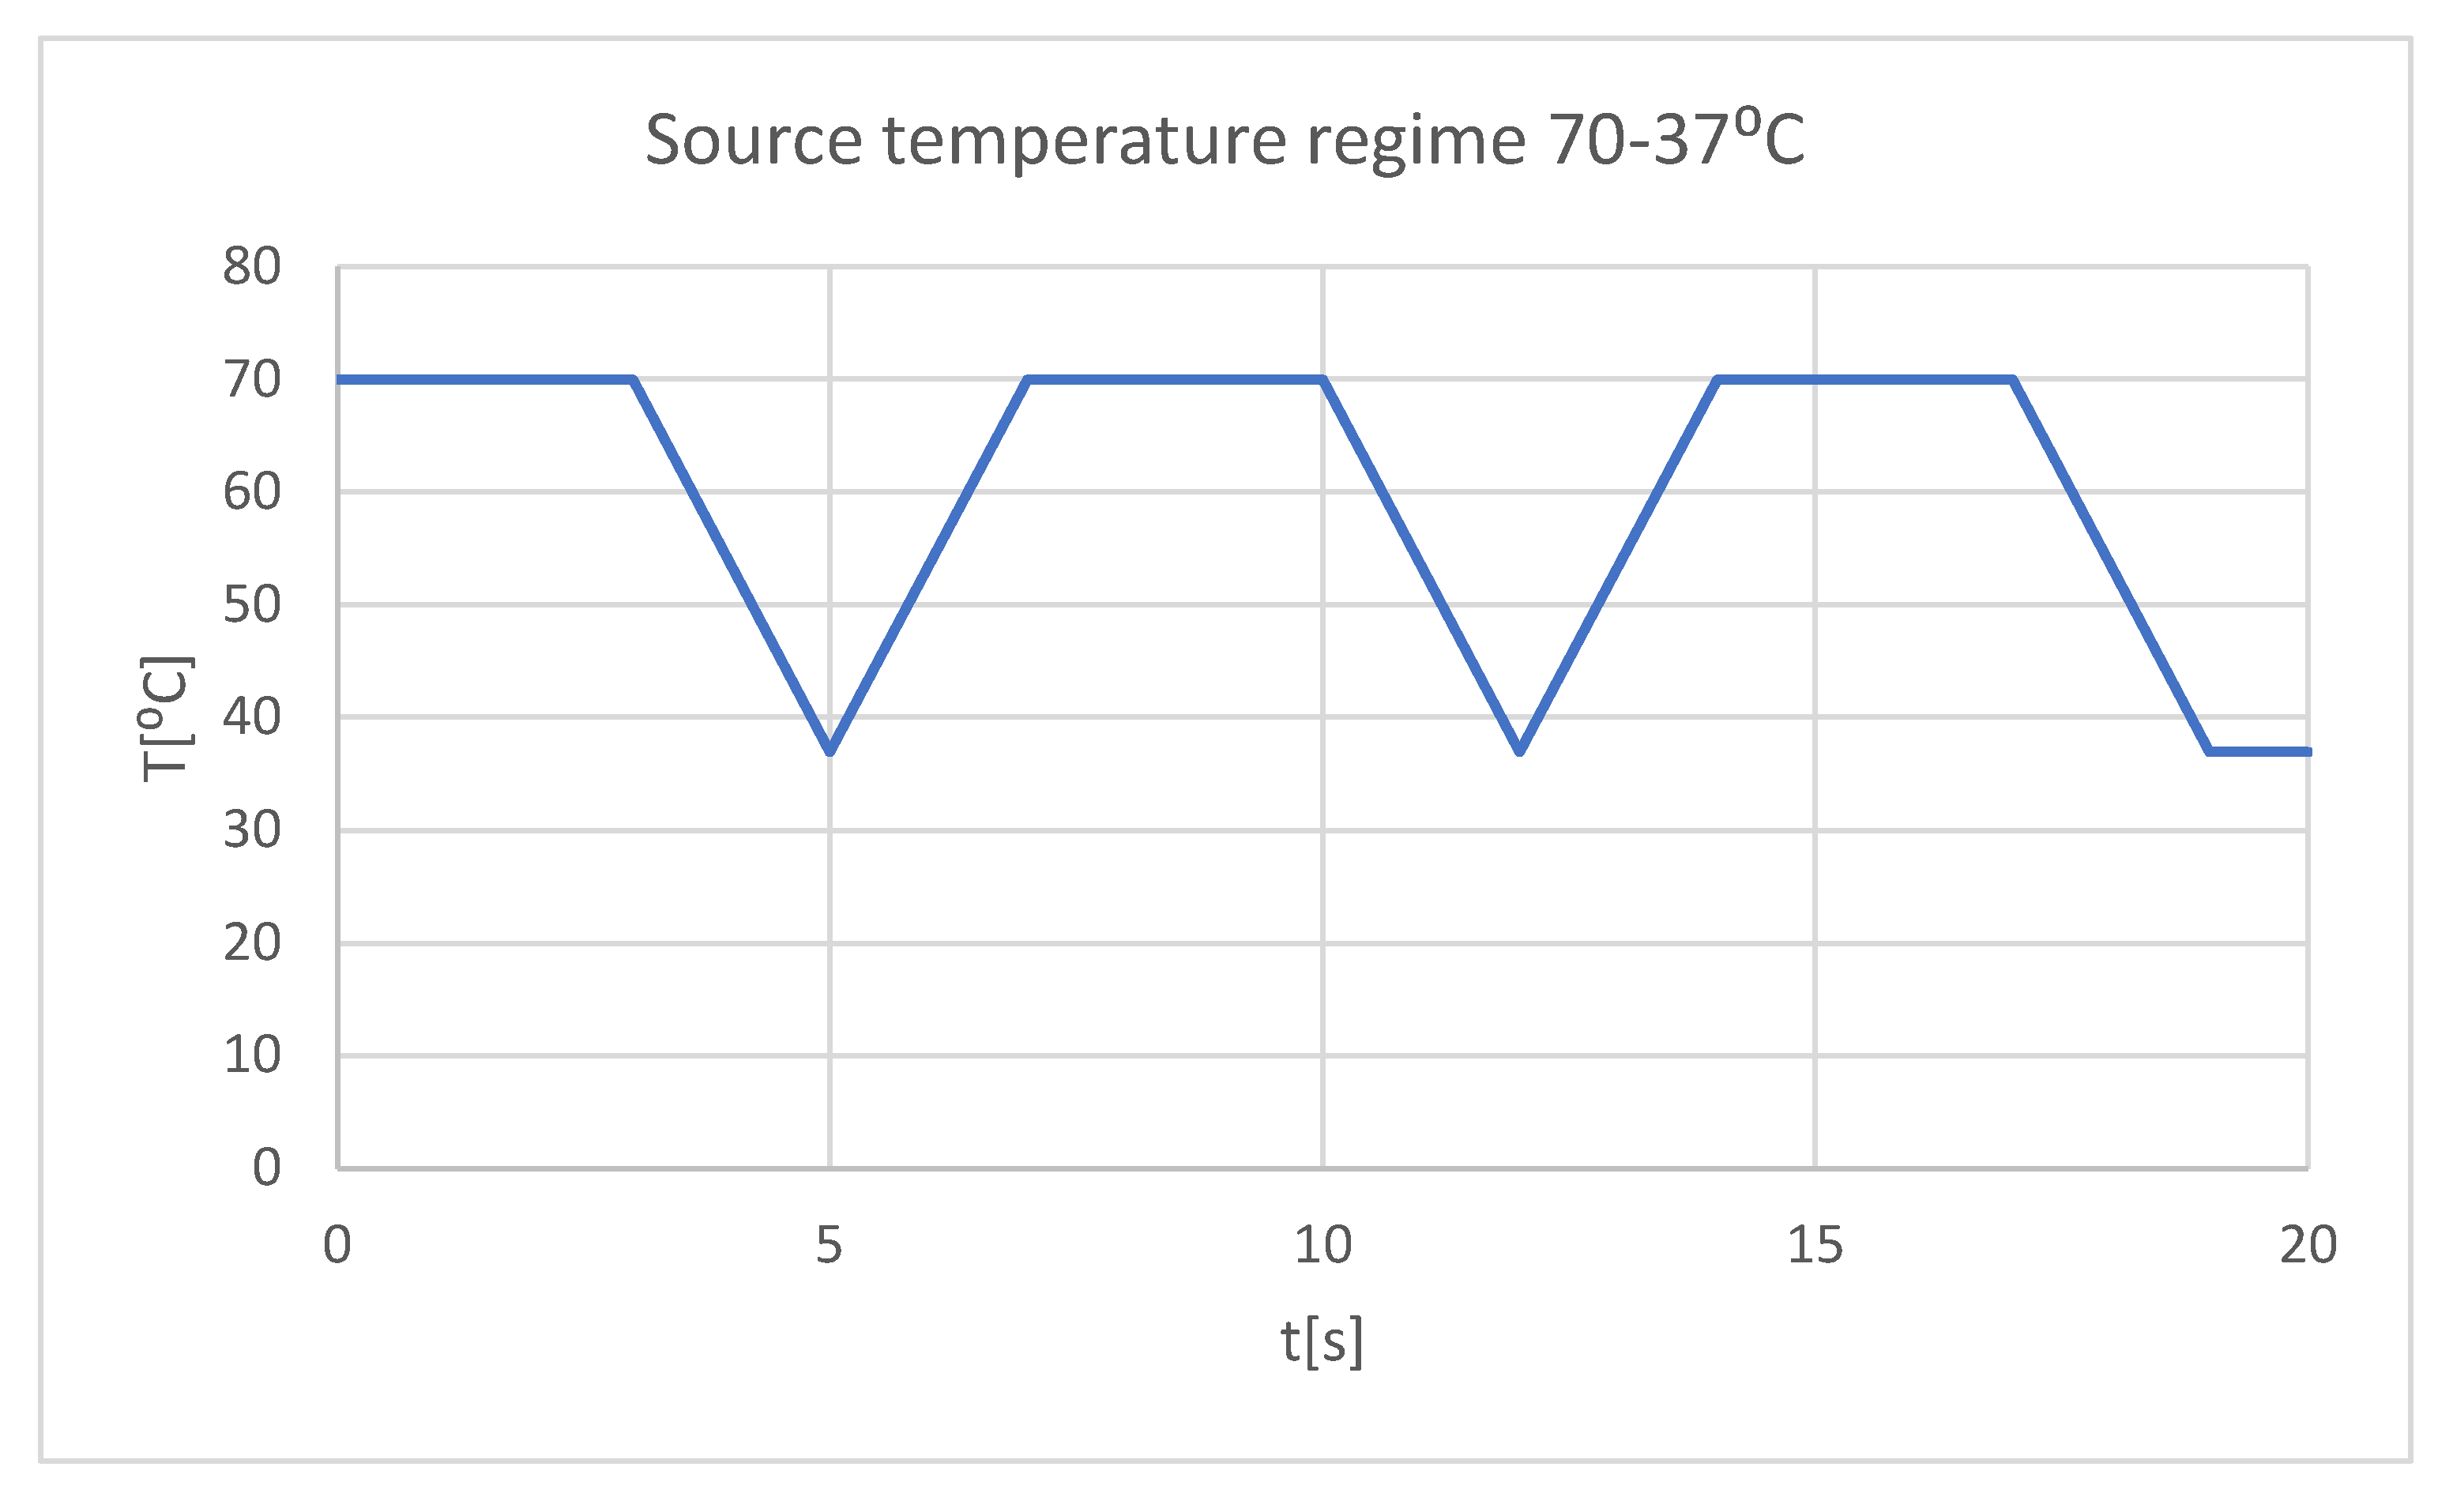
It was intended to study the behavior of these two systems in different situations materialized in two situations:
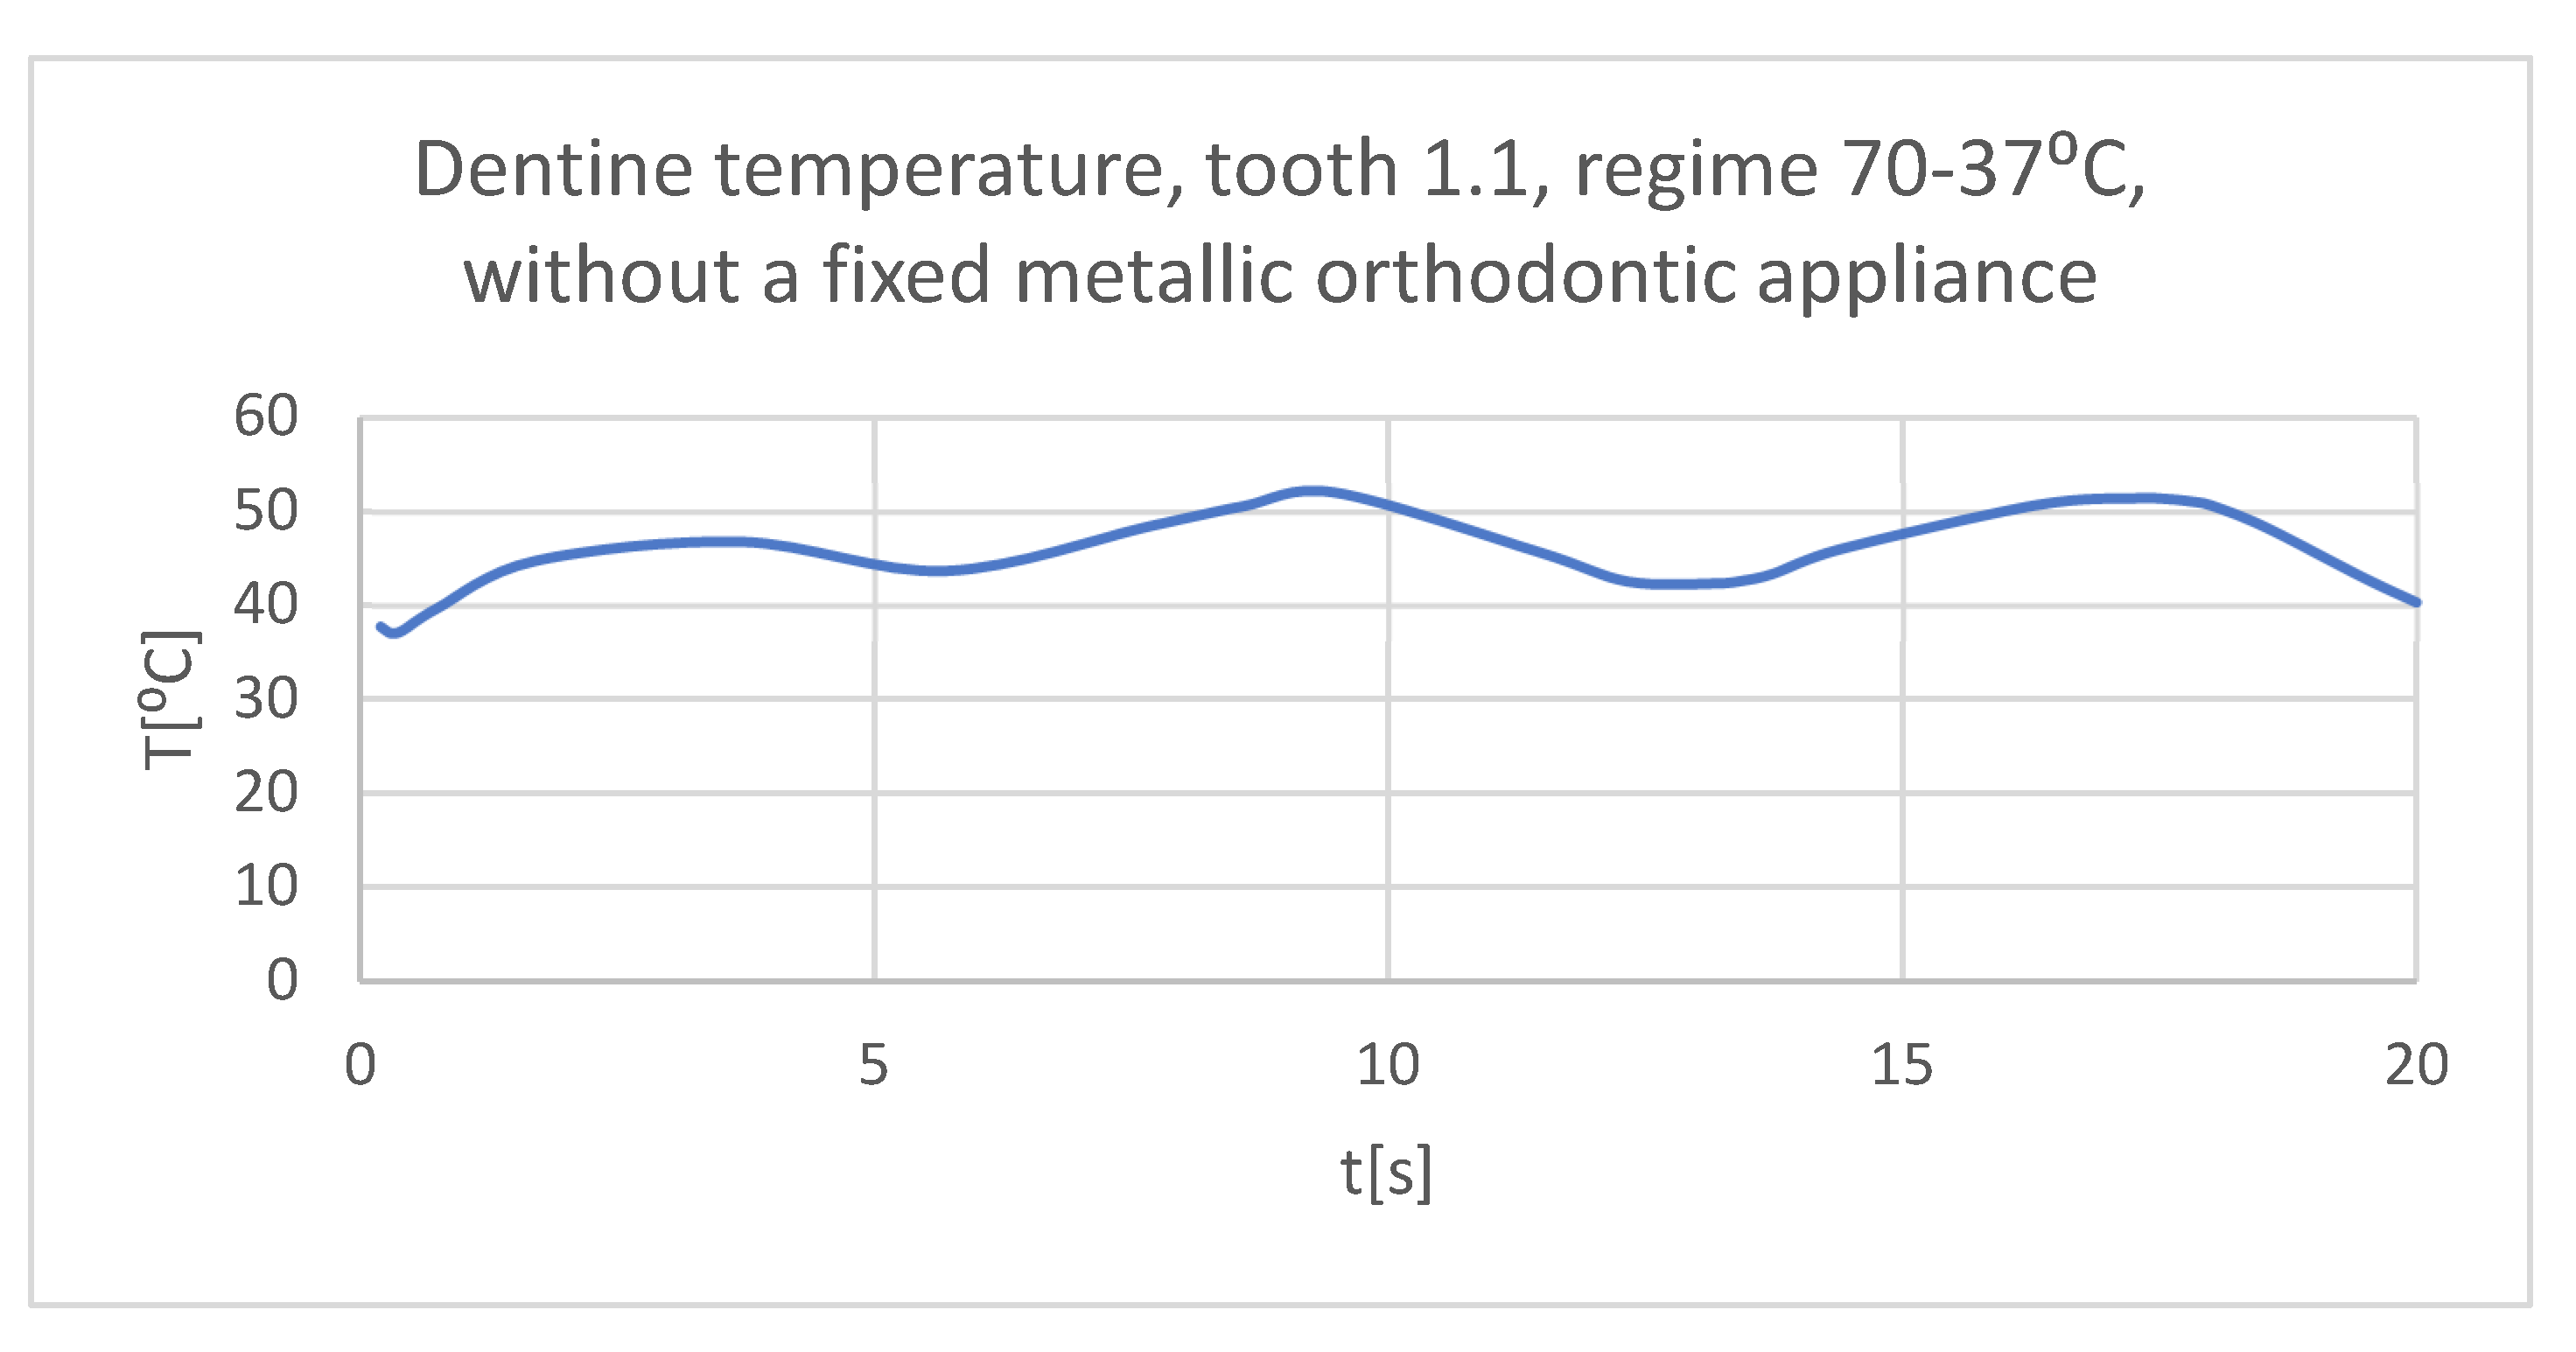
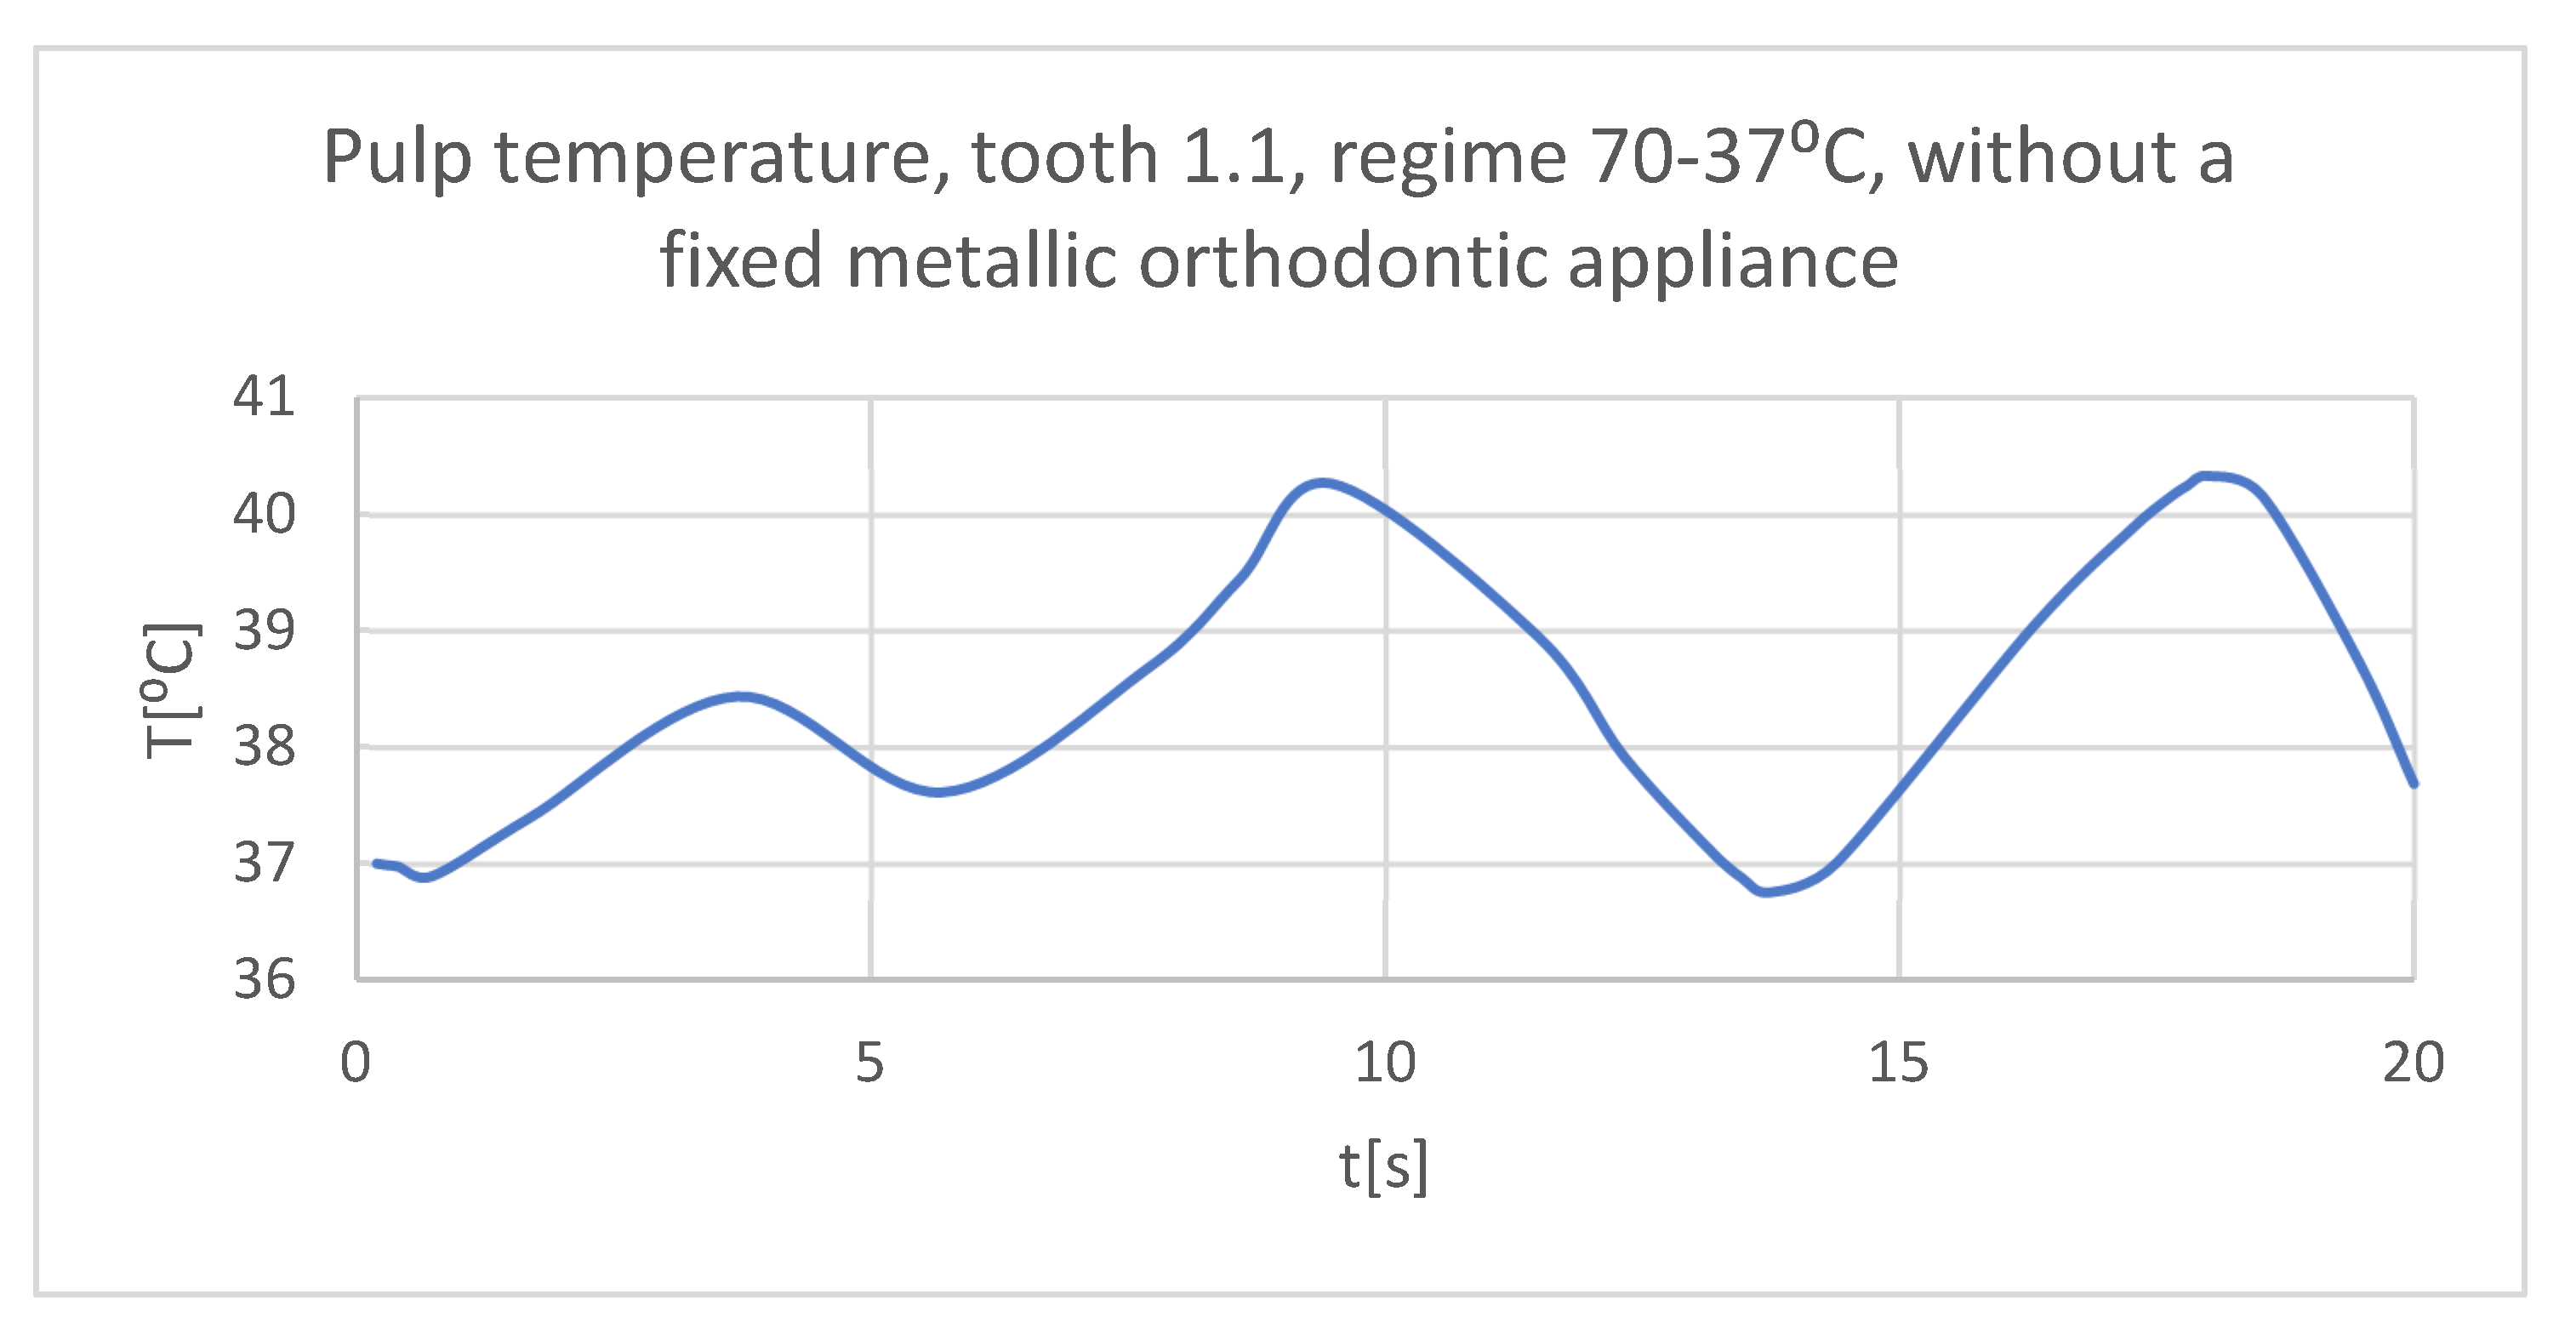
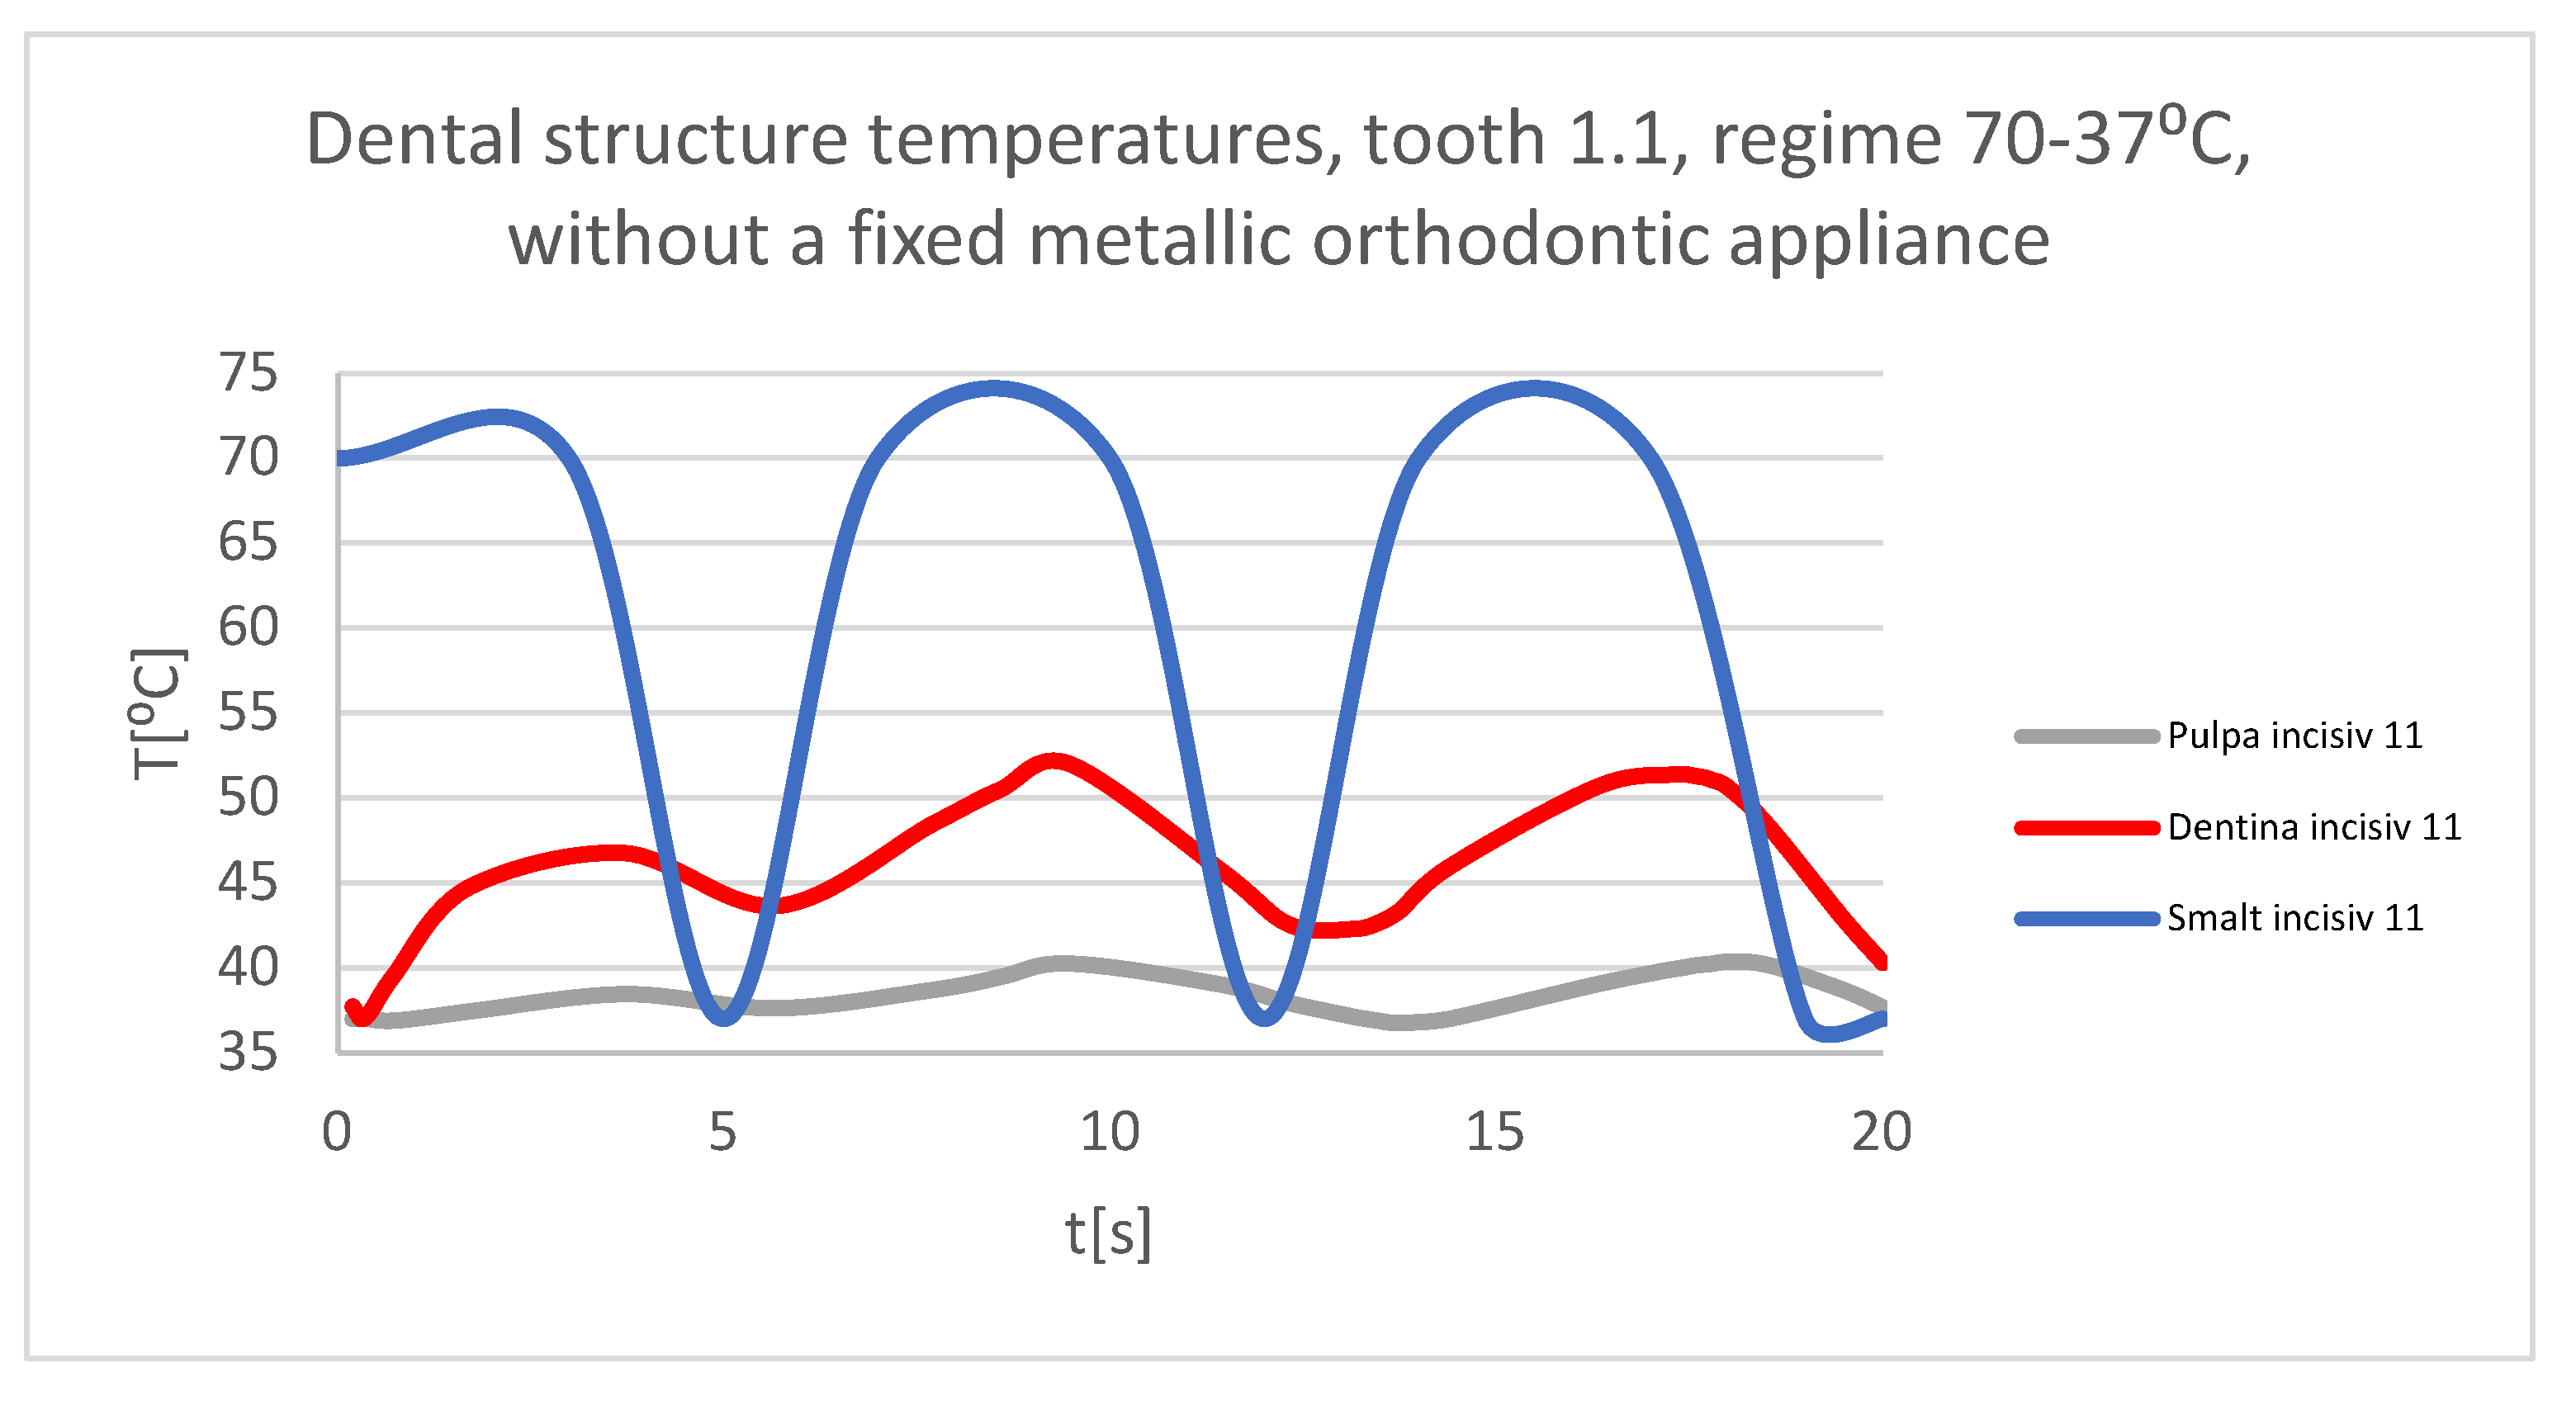
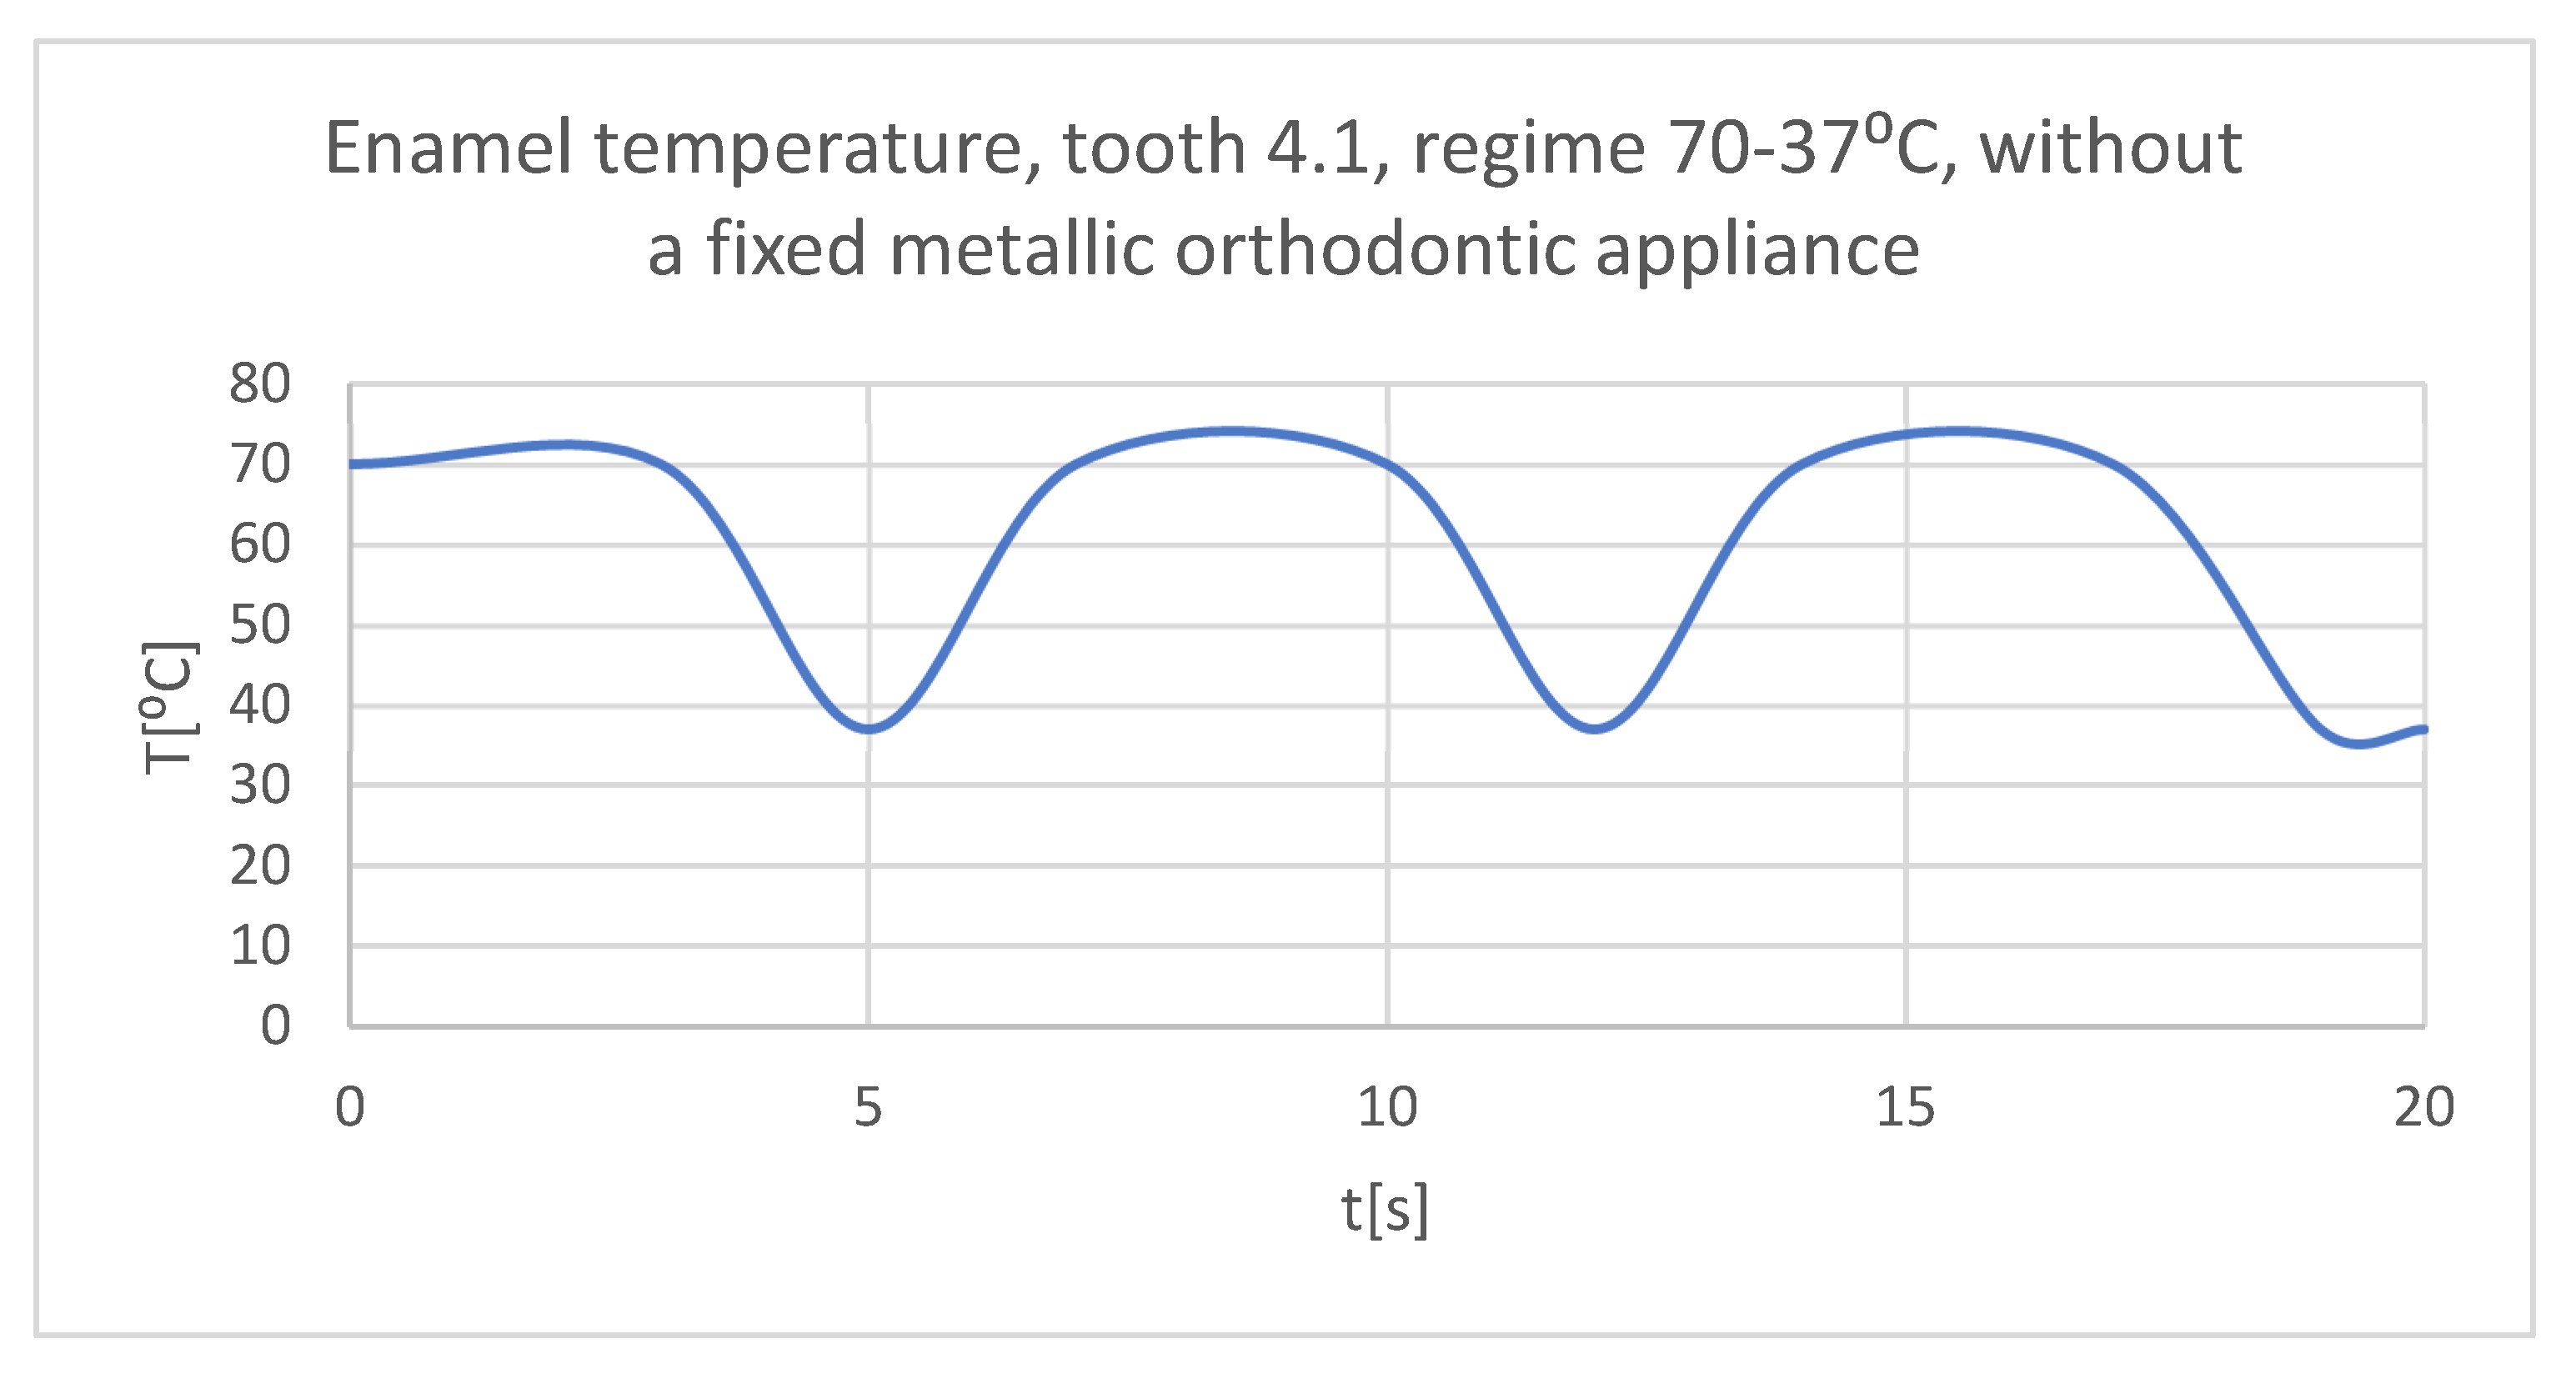
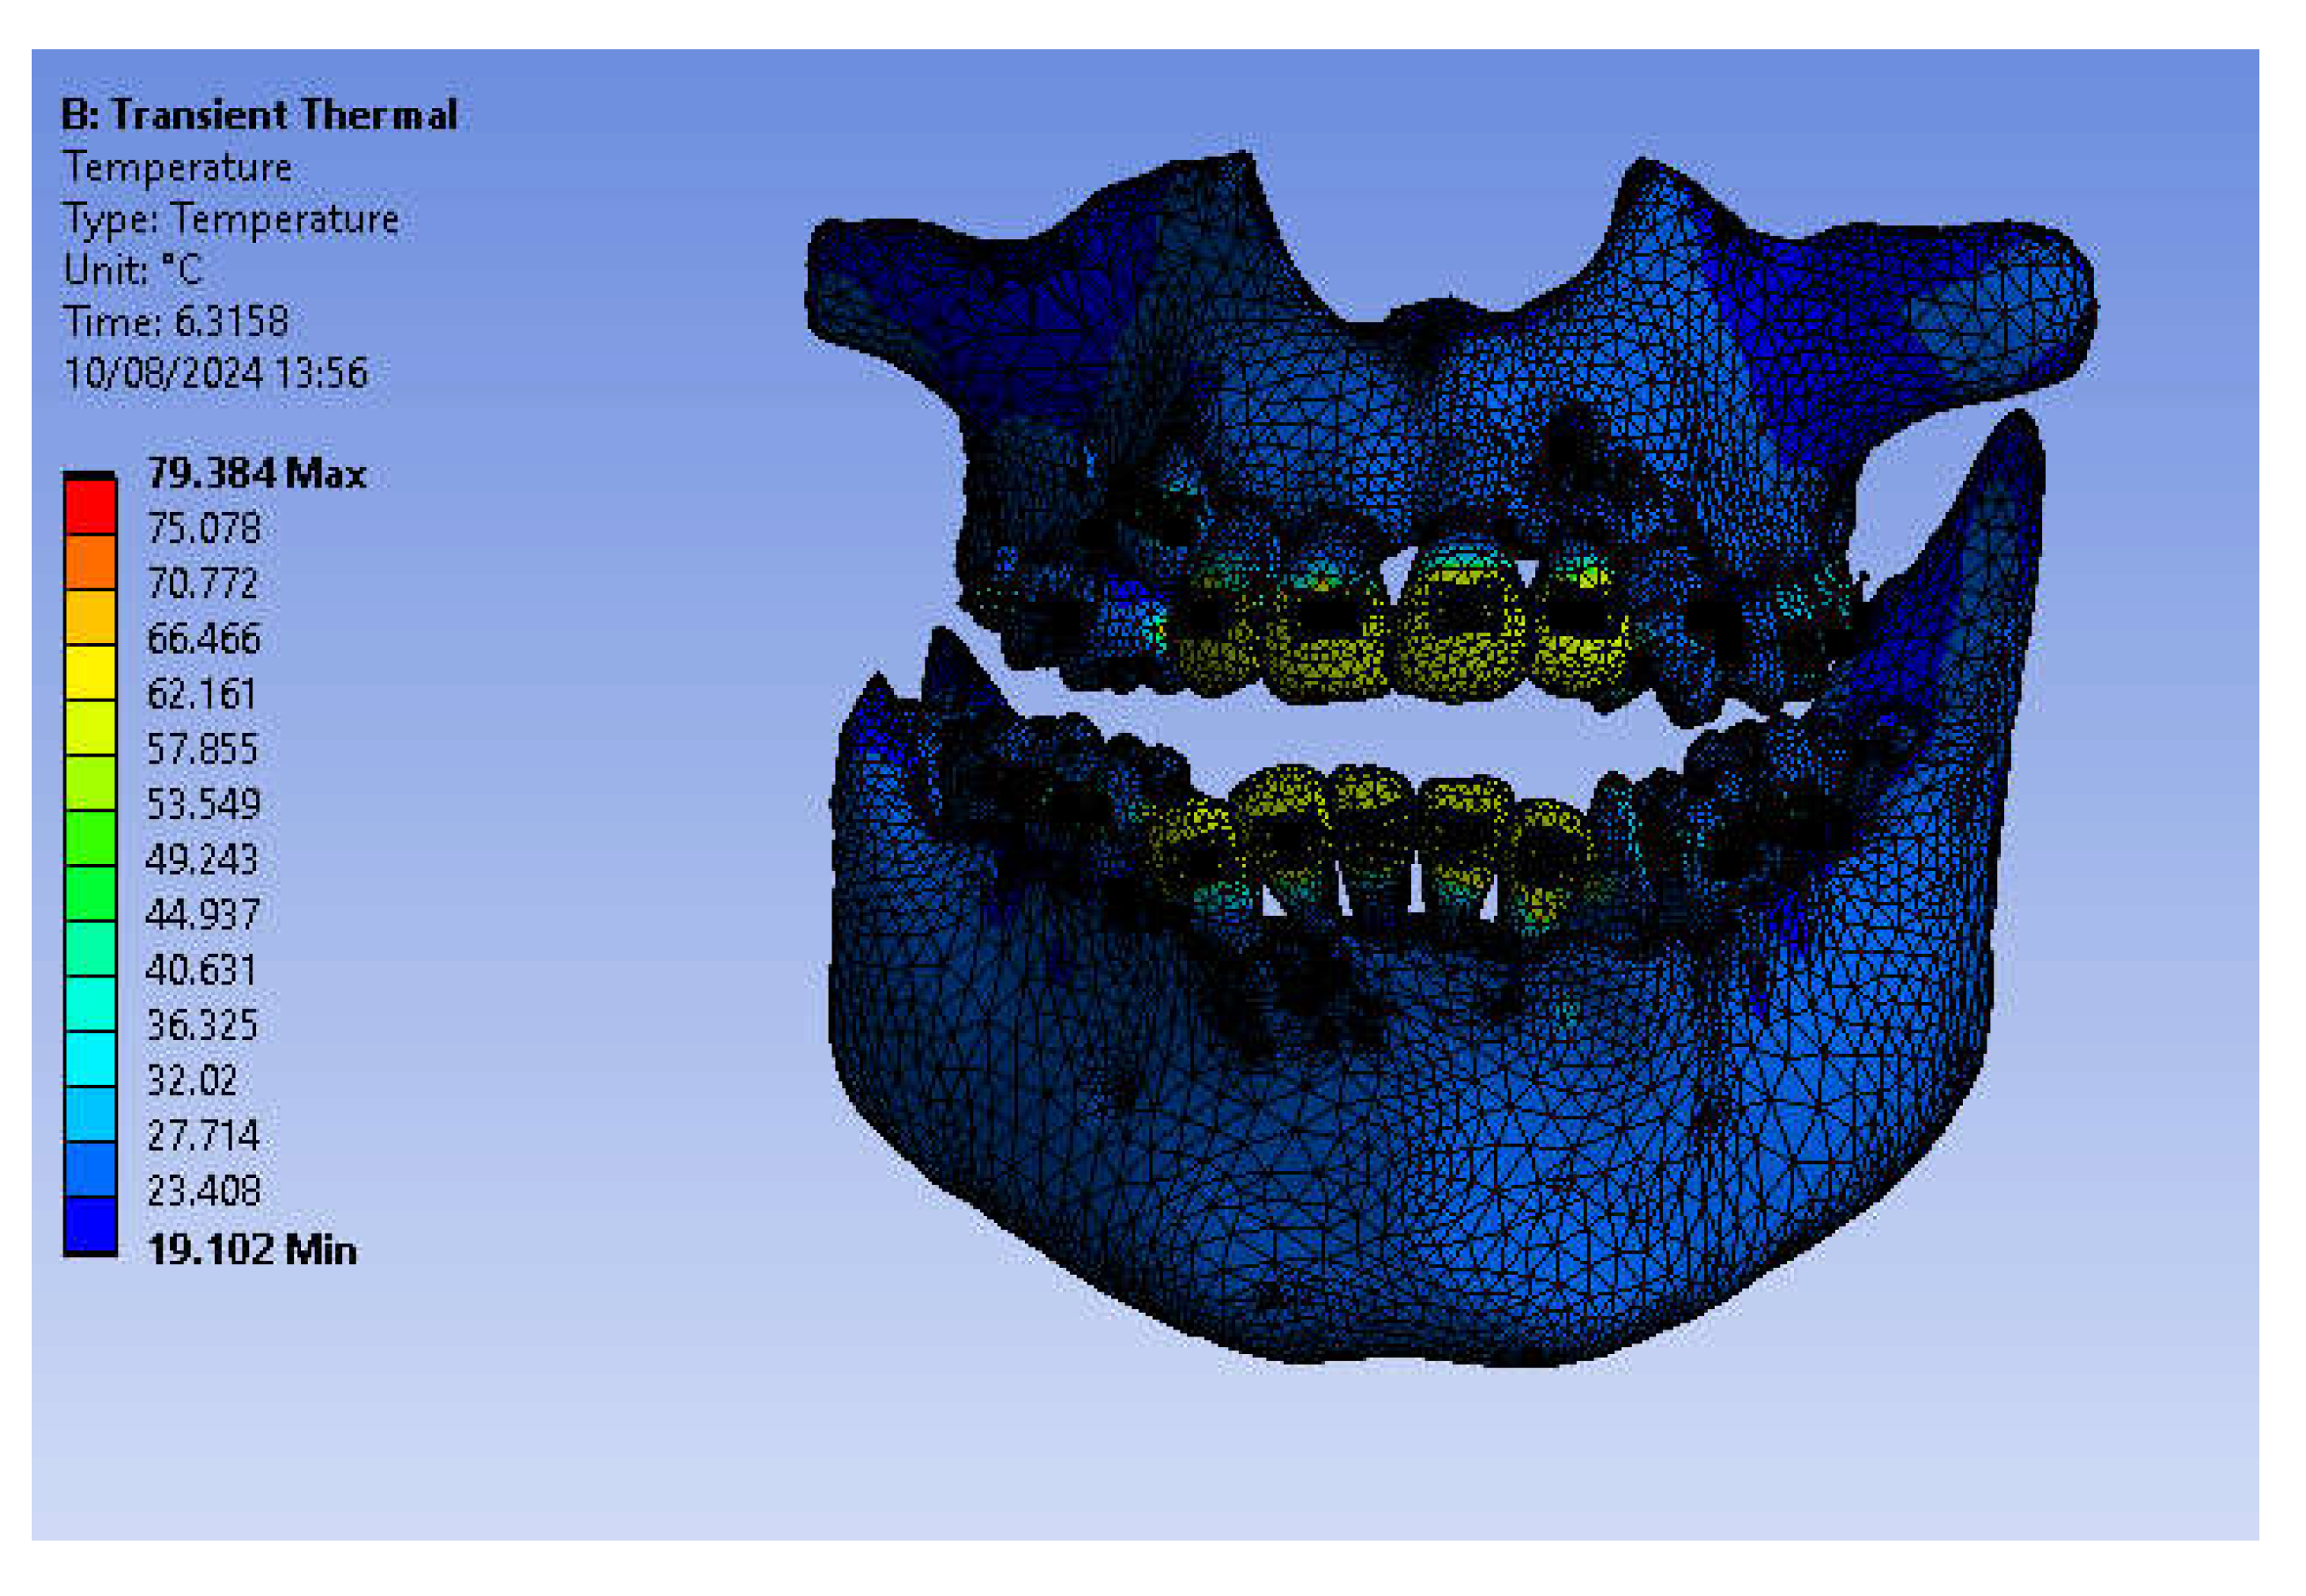
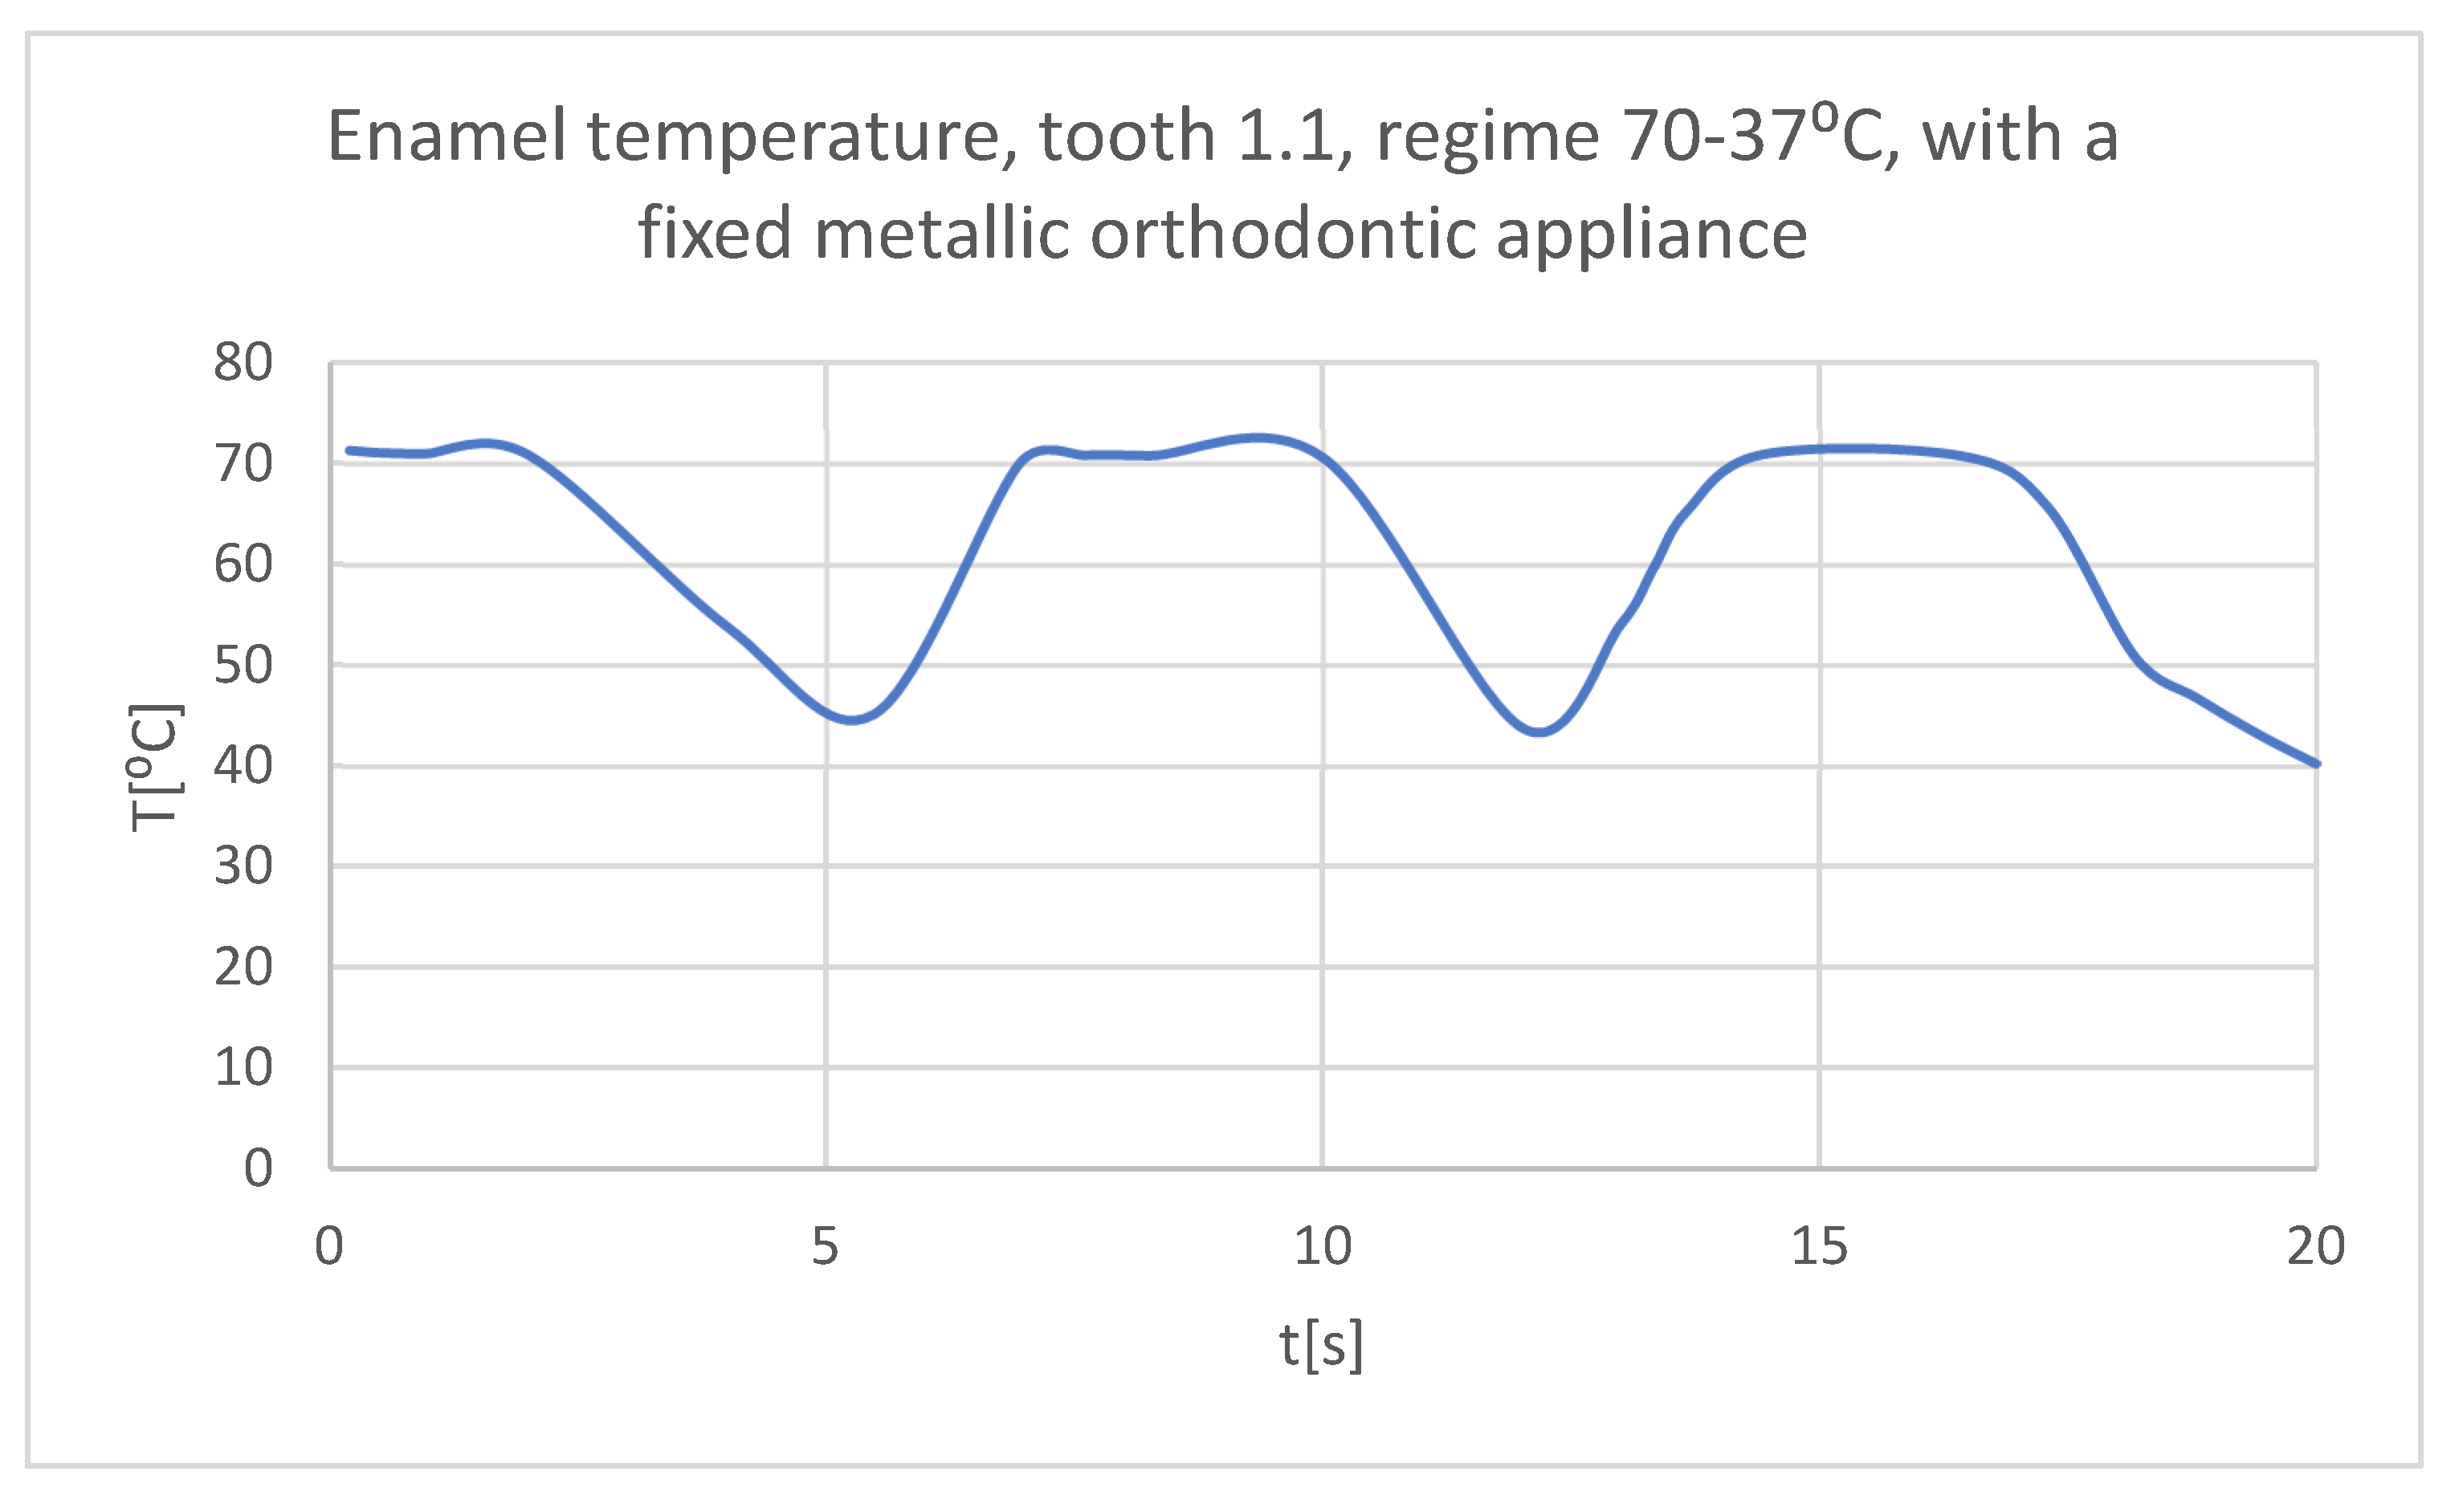
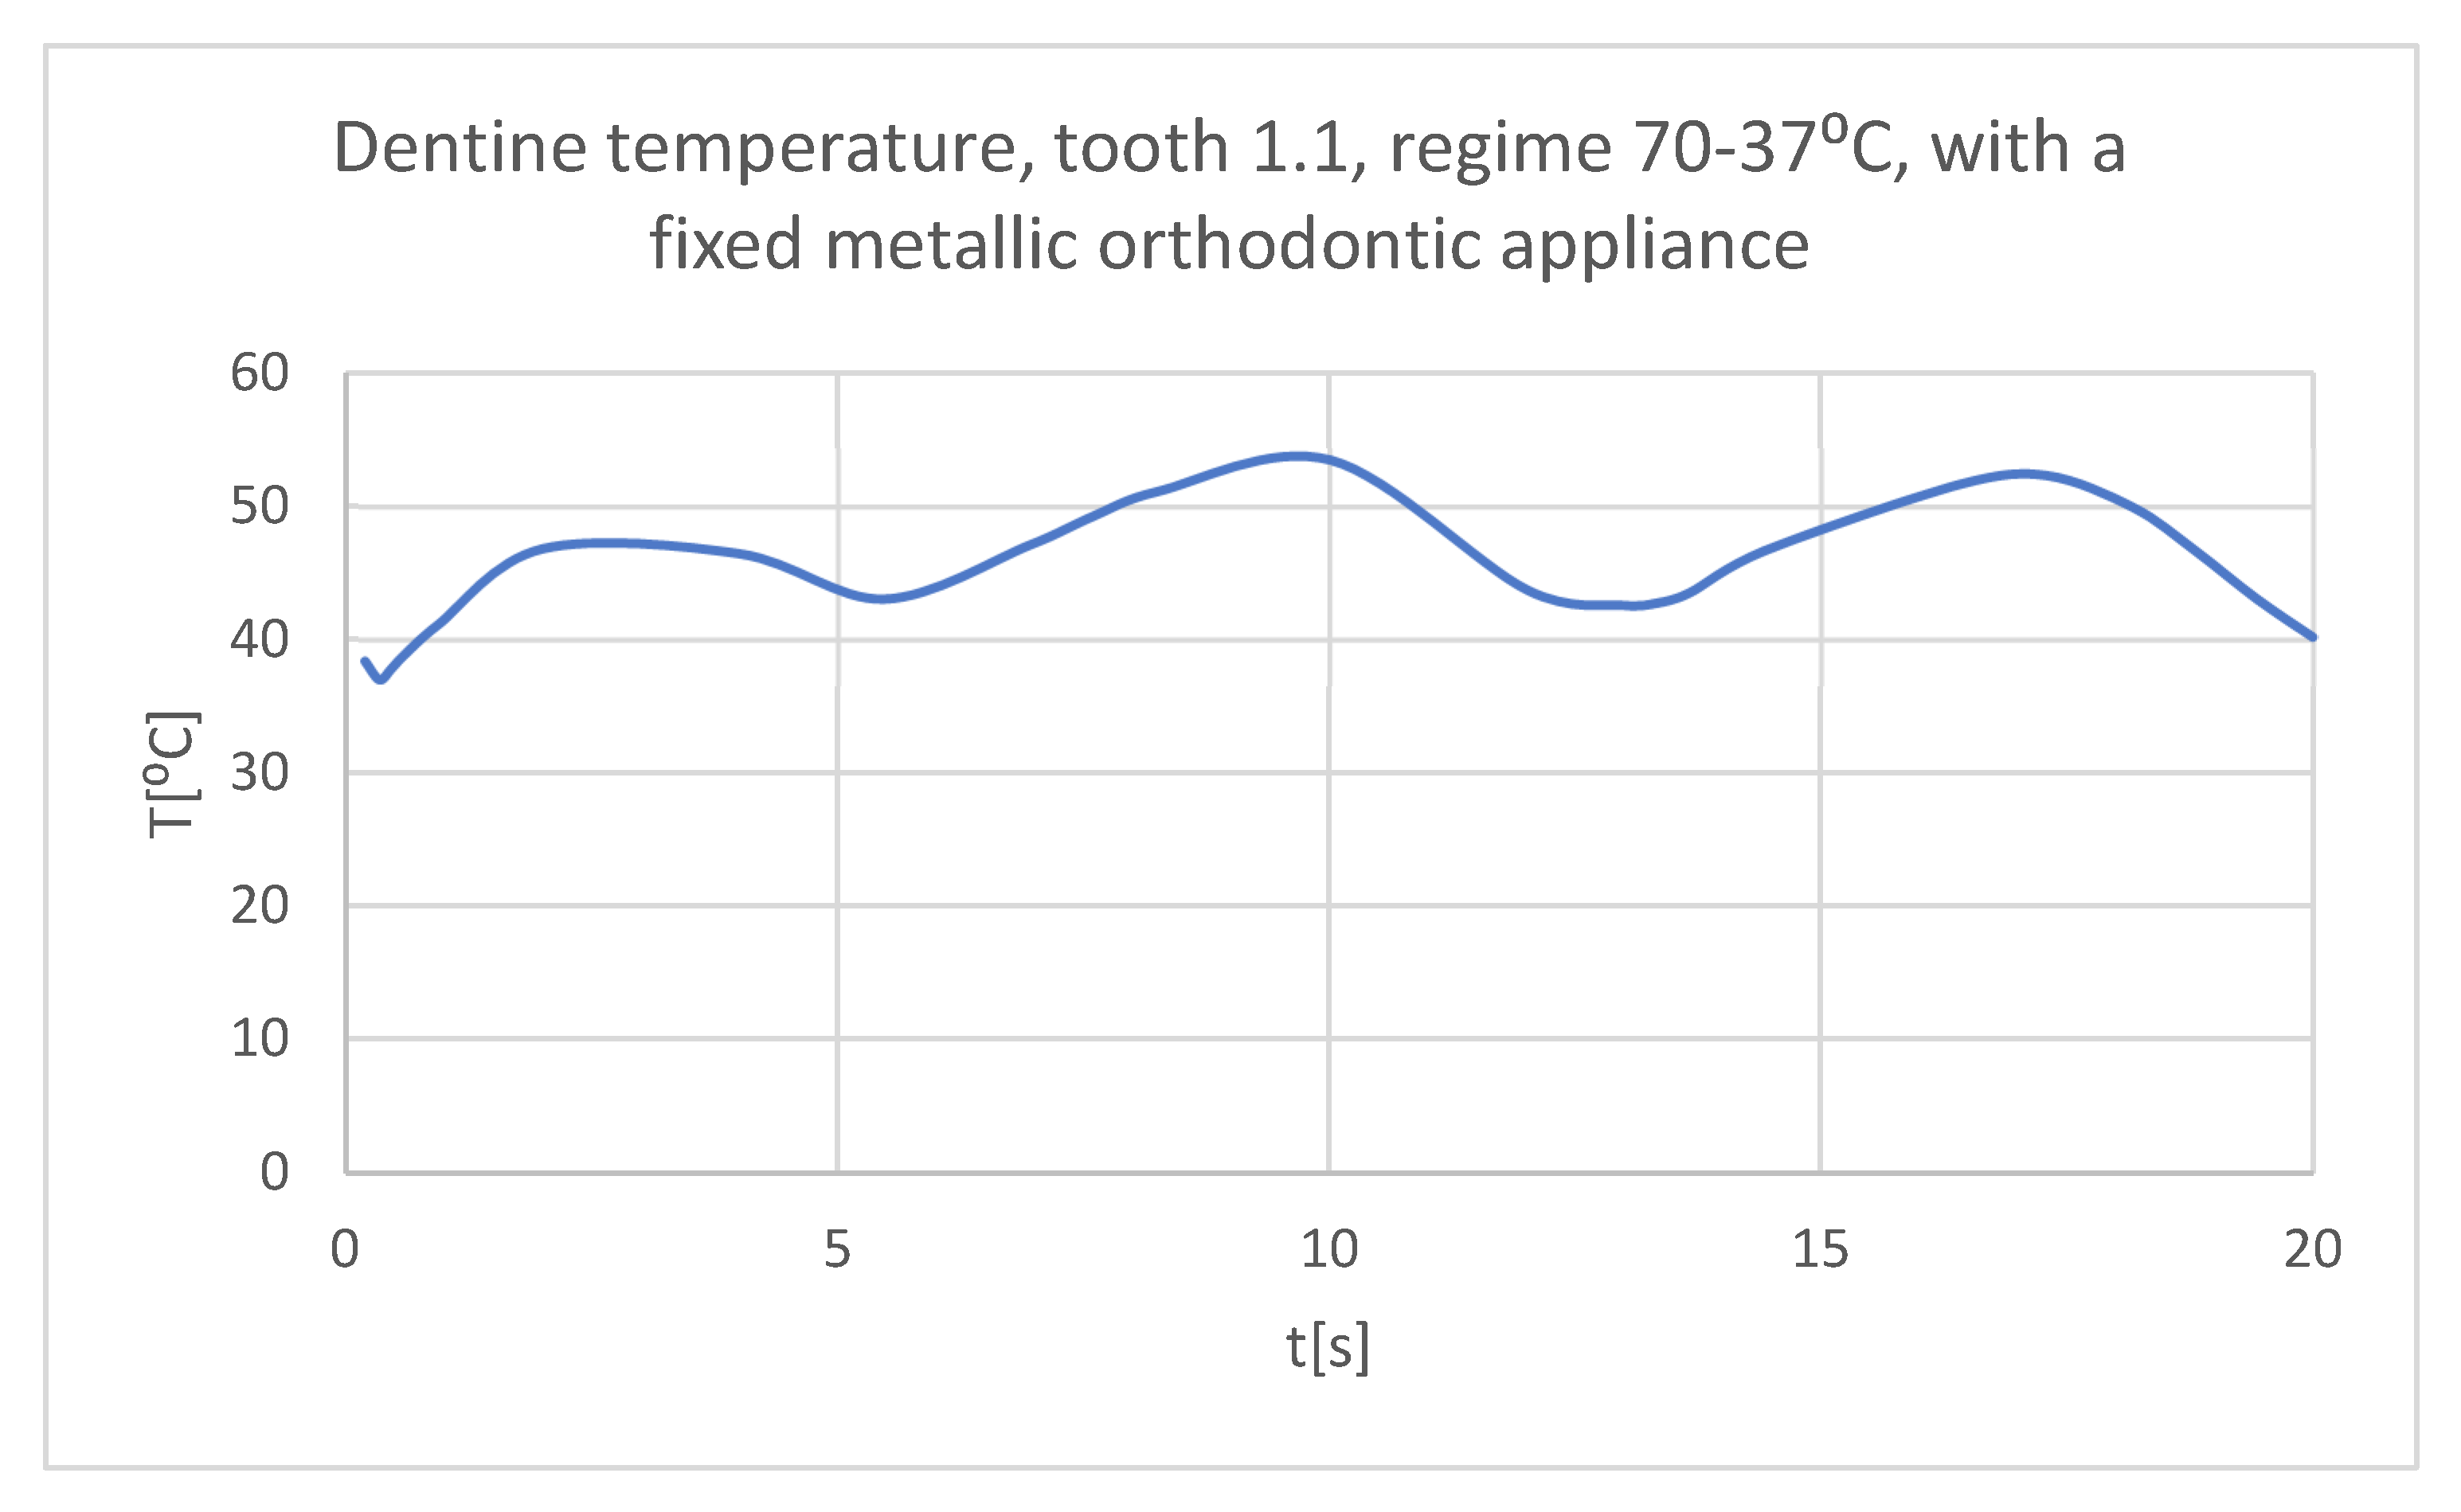
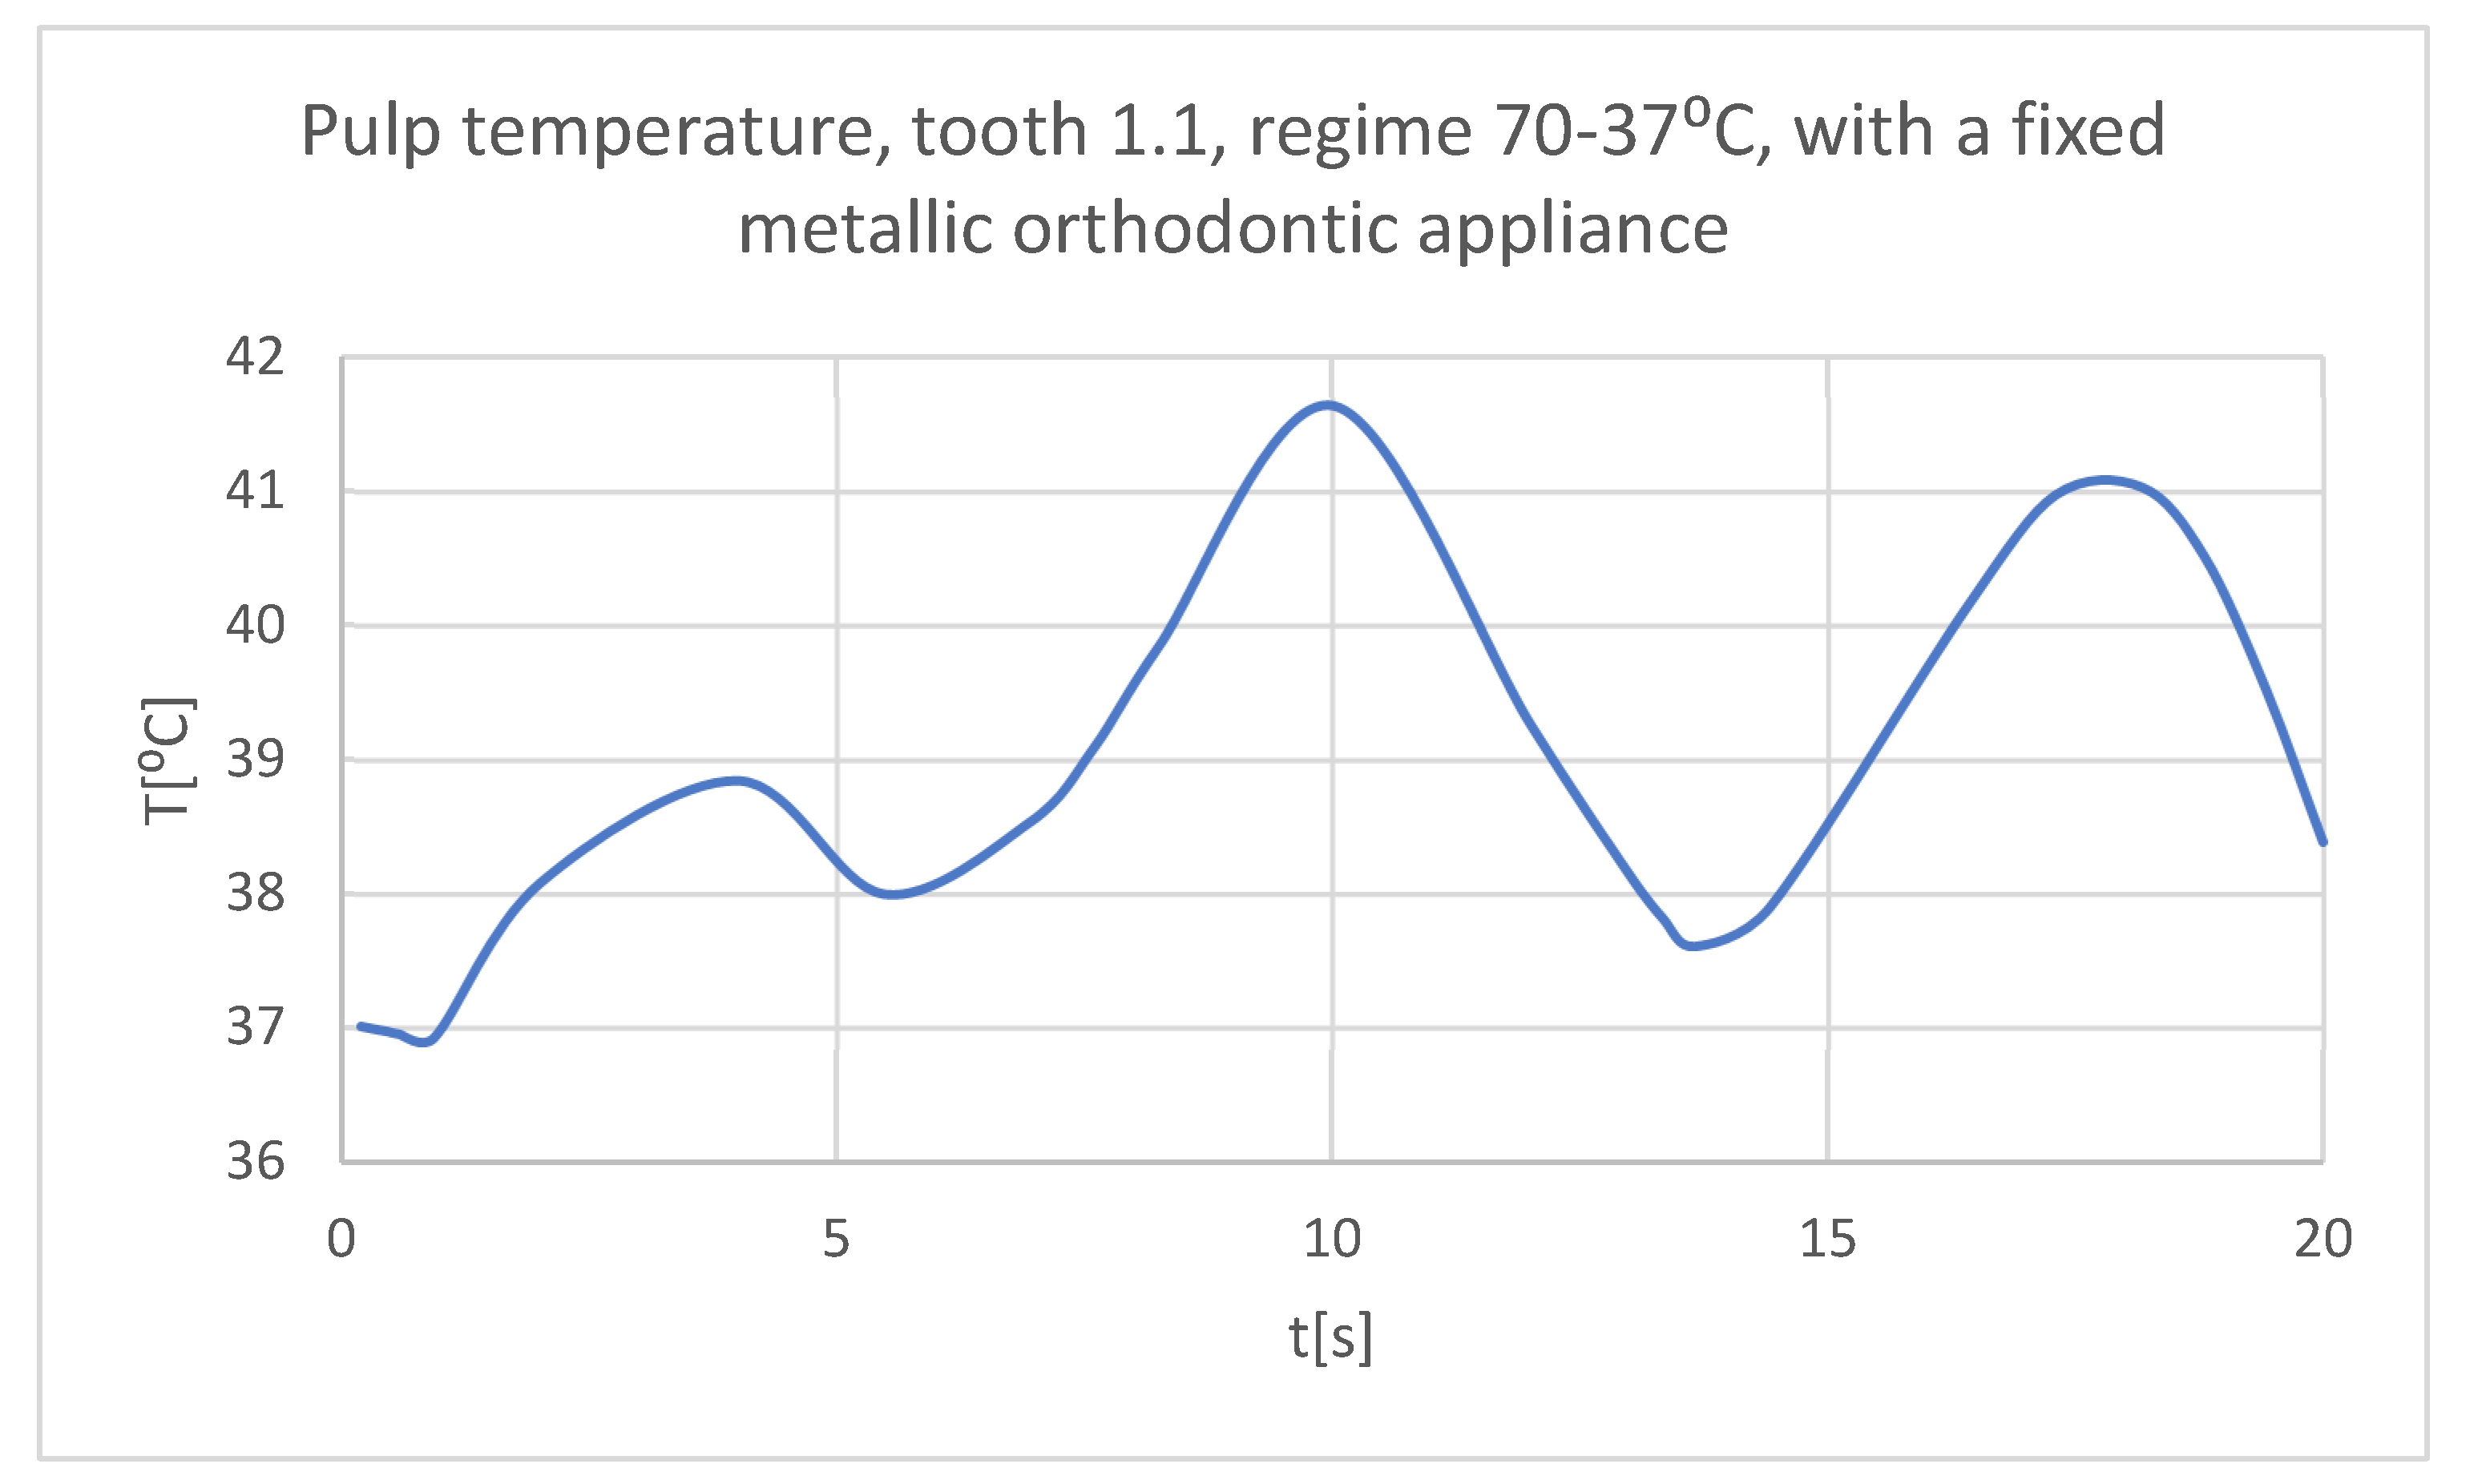
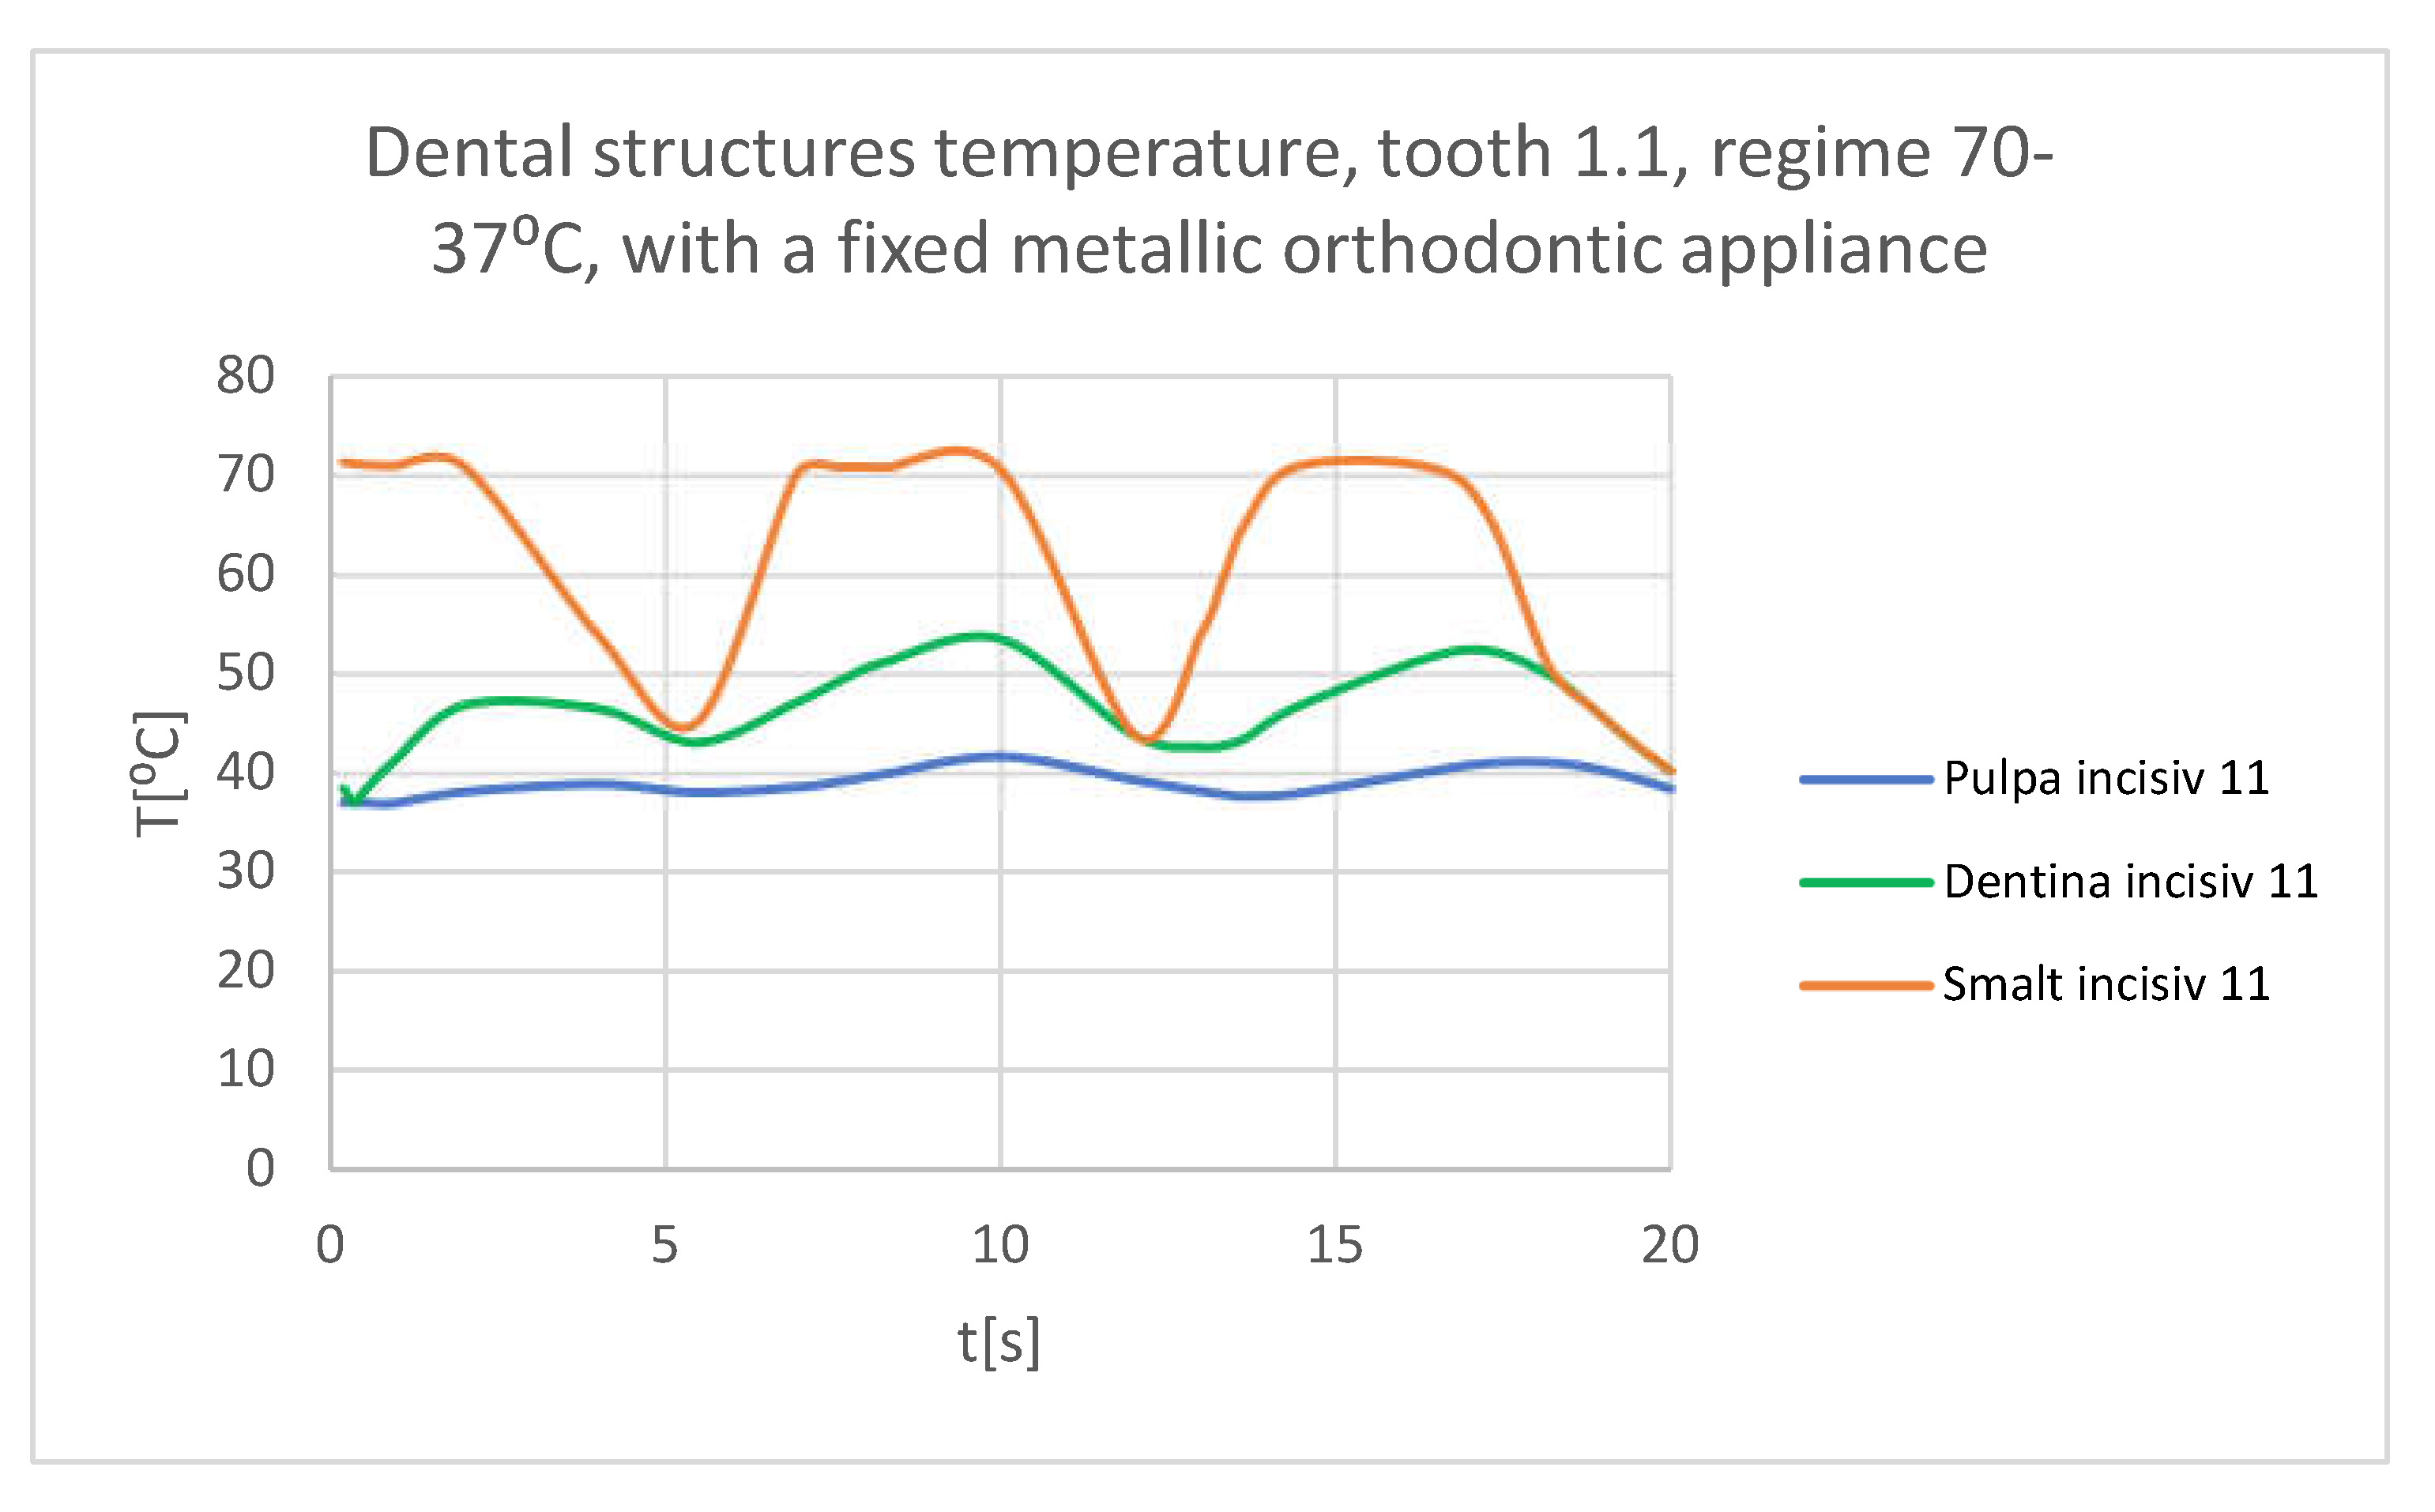
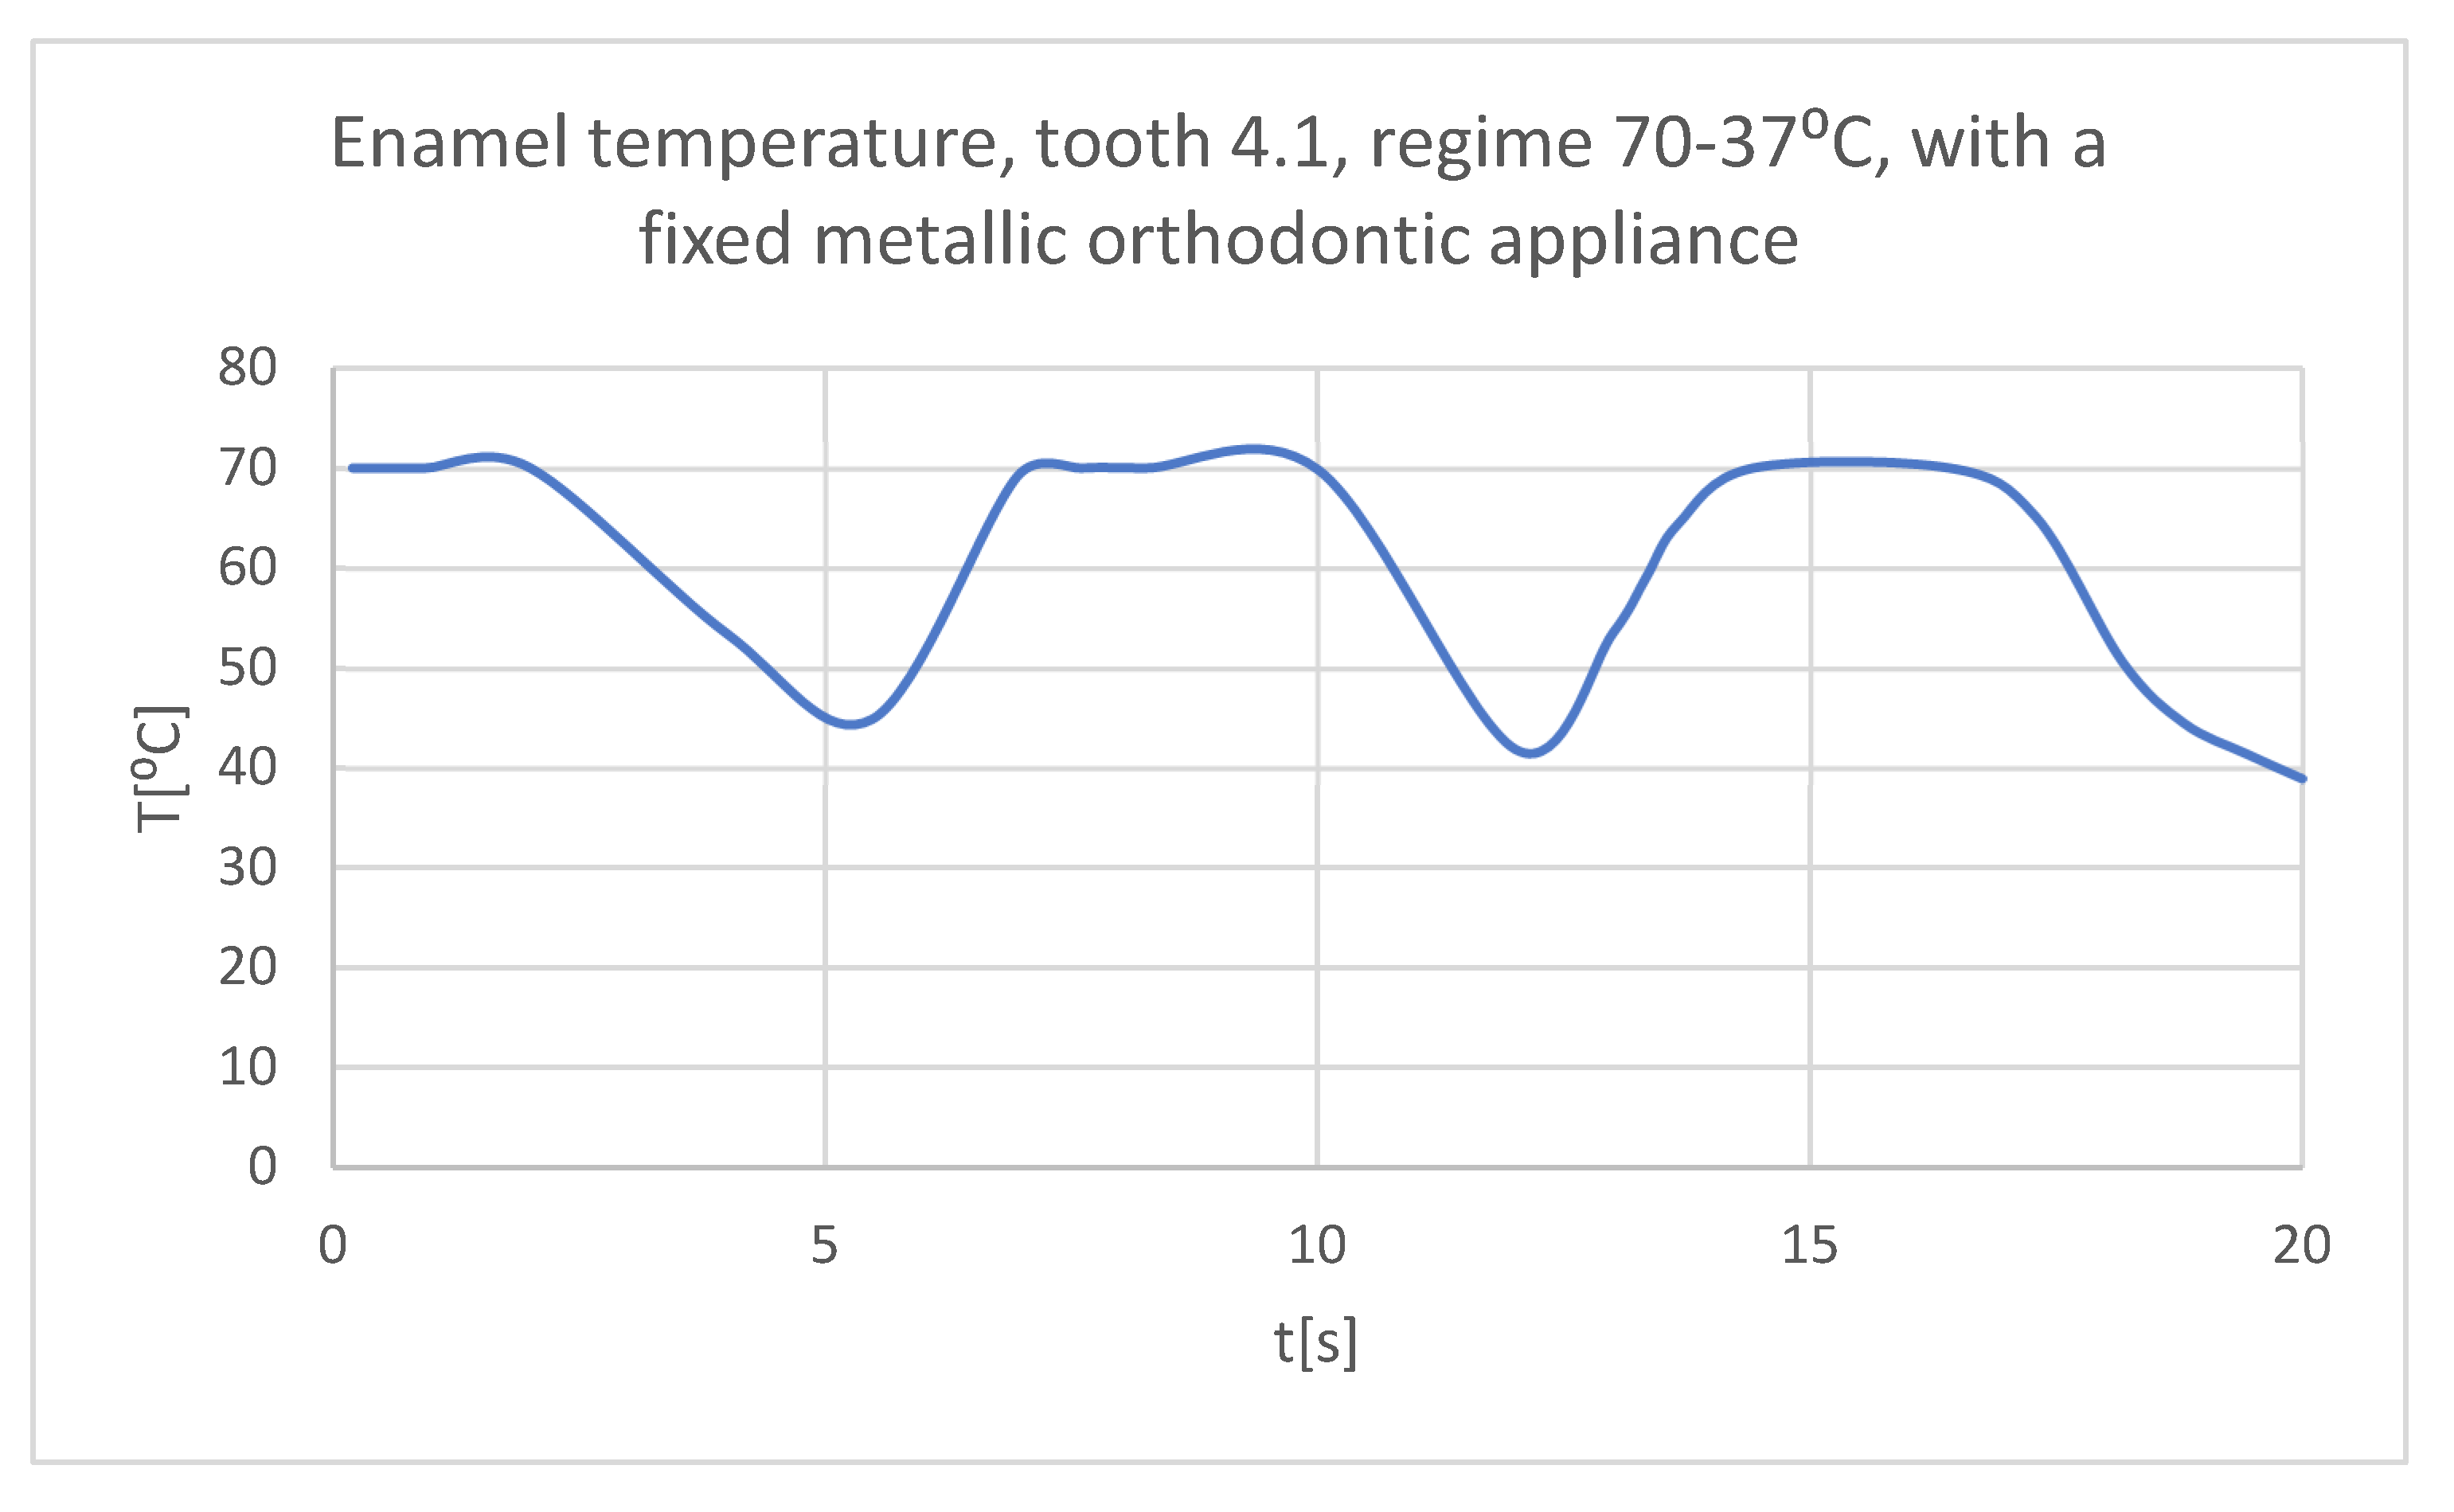
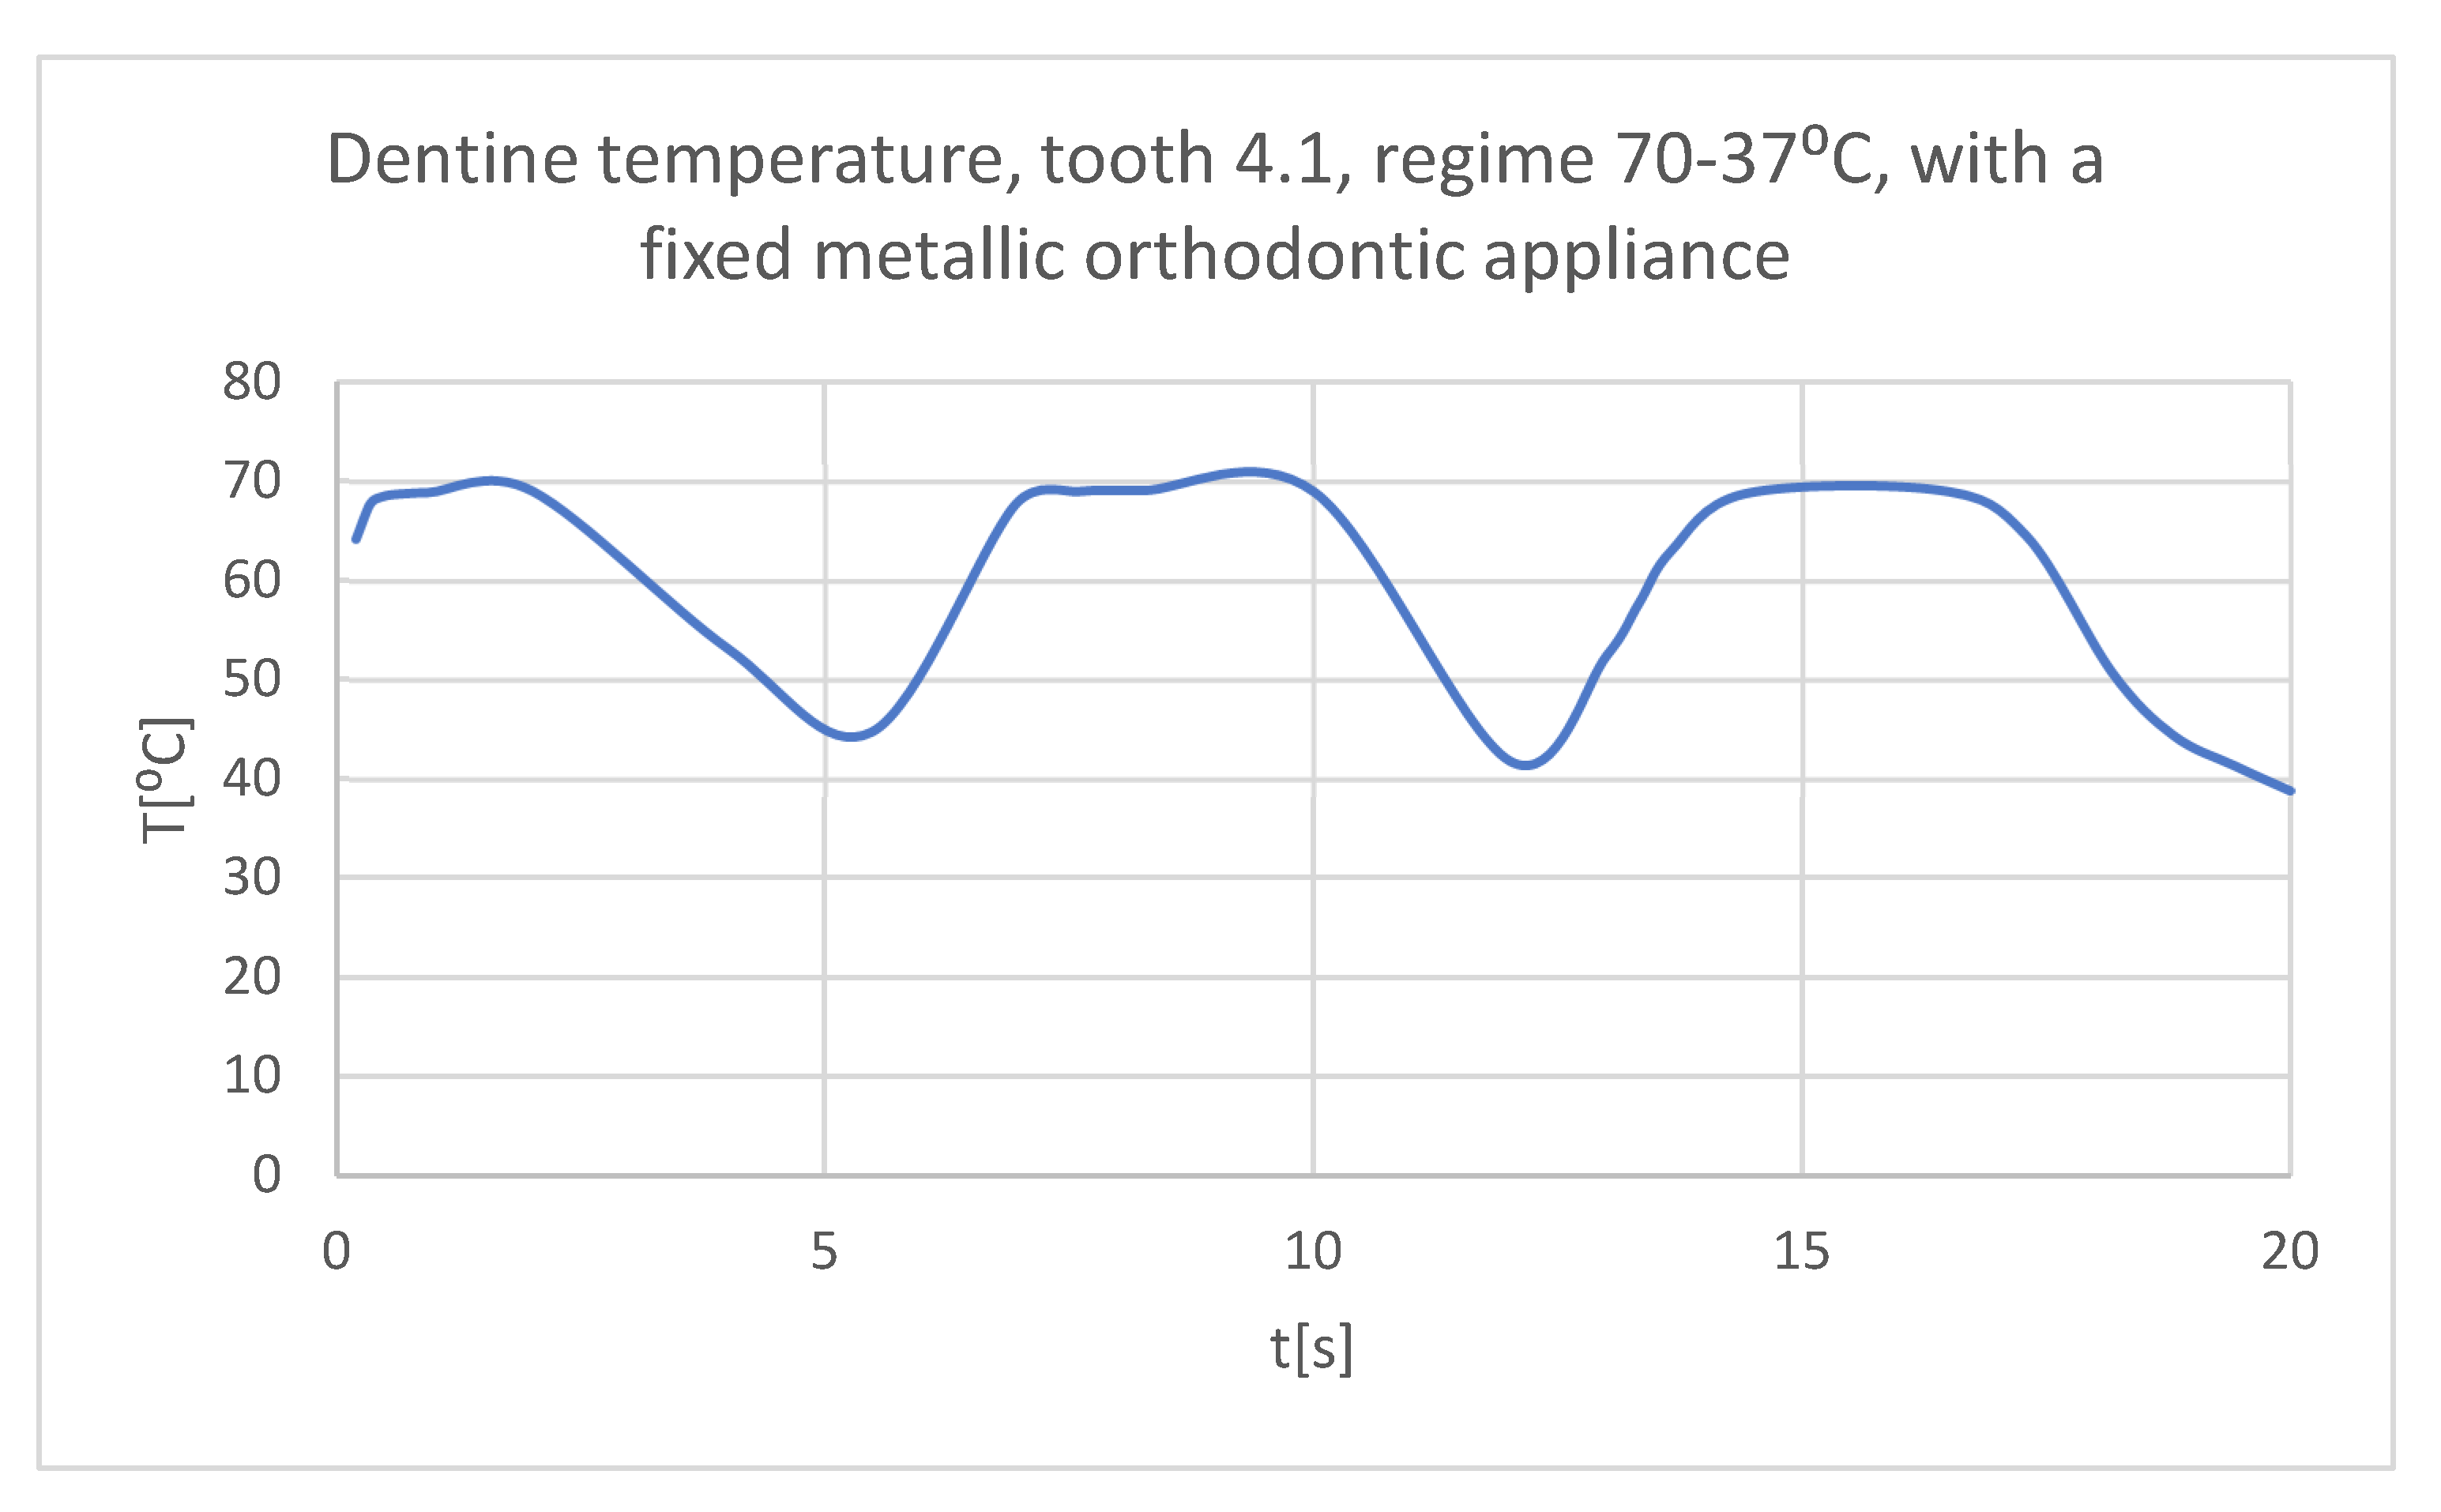
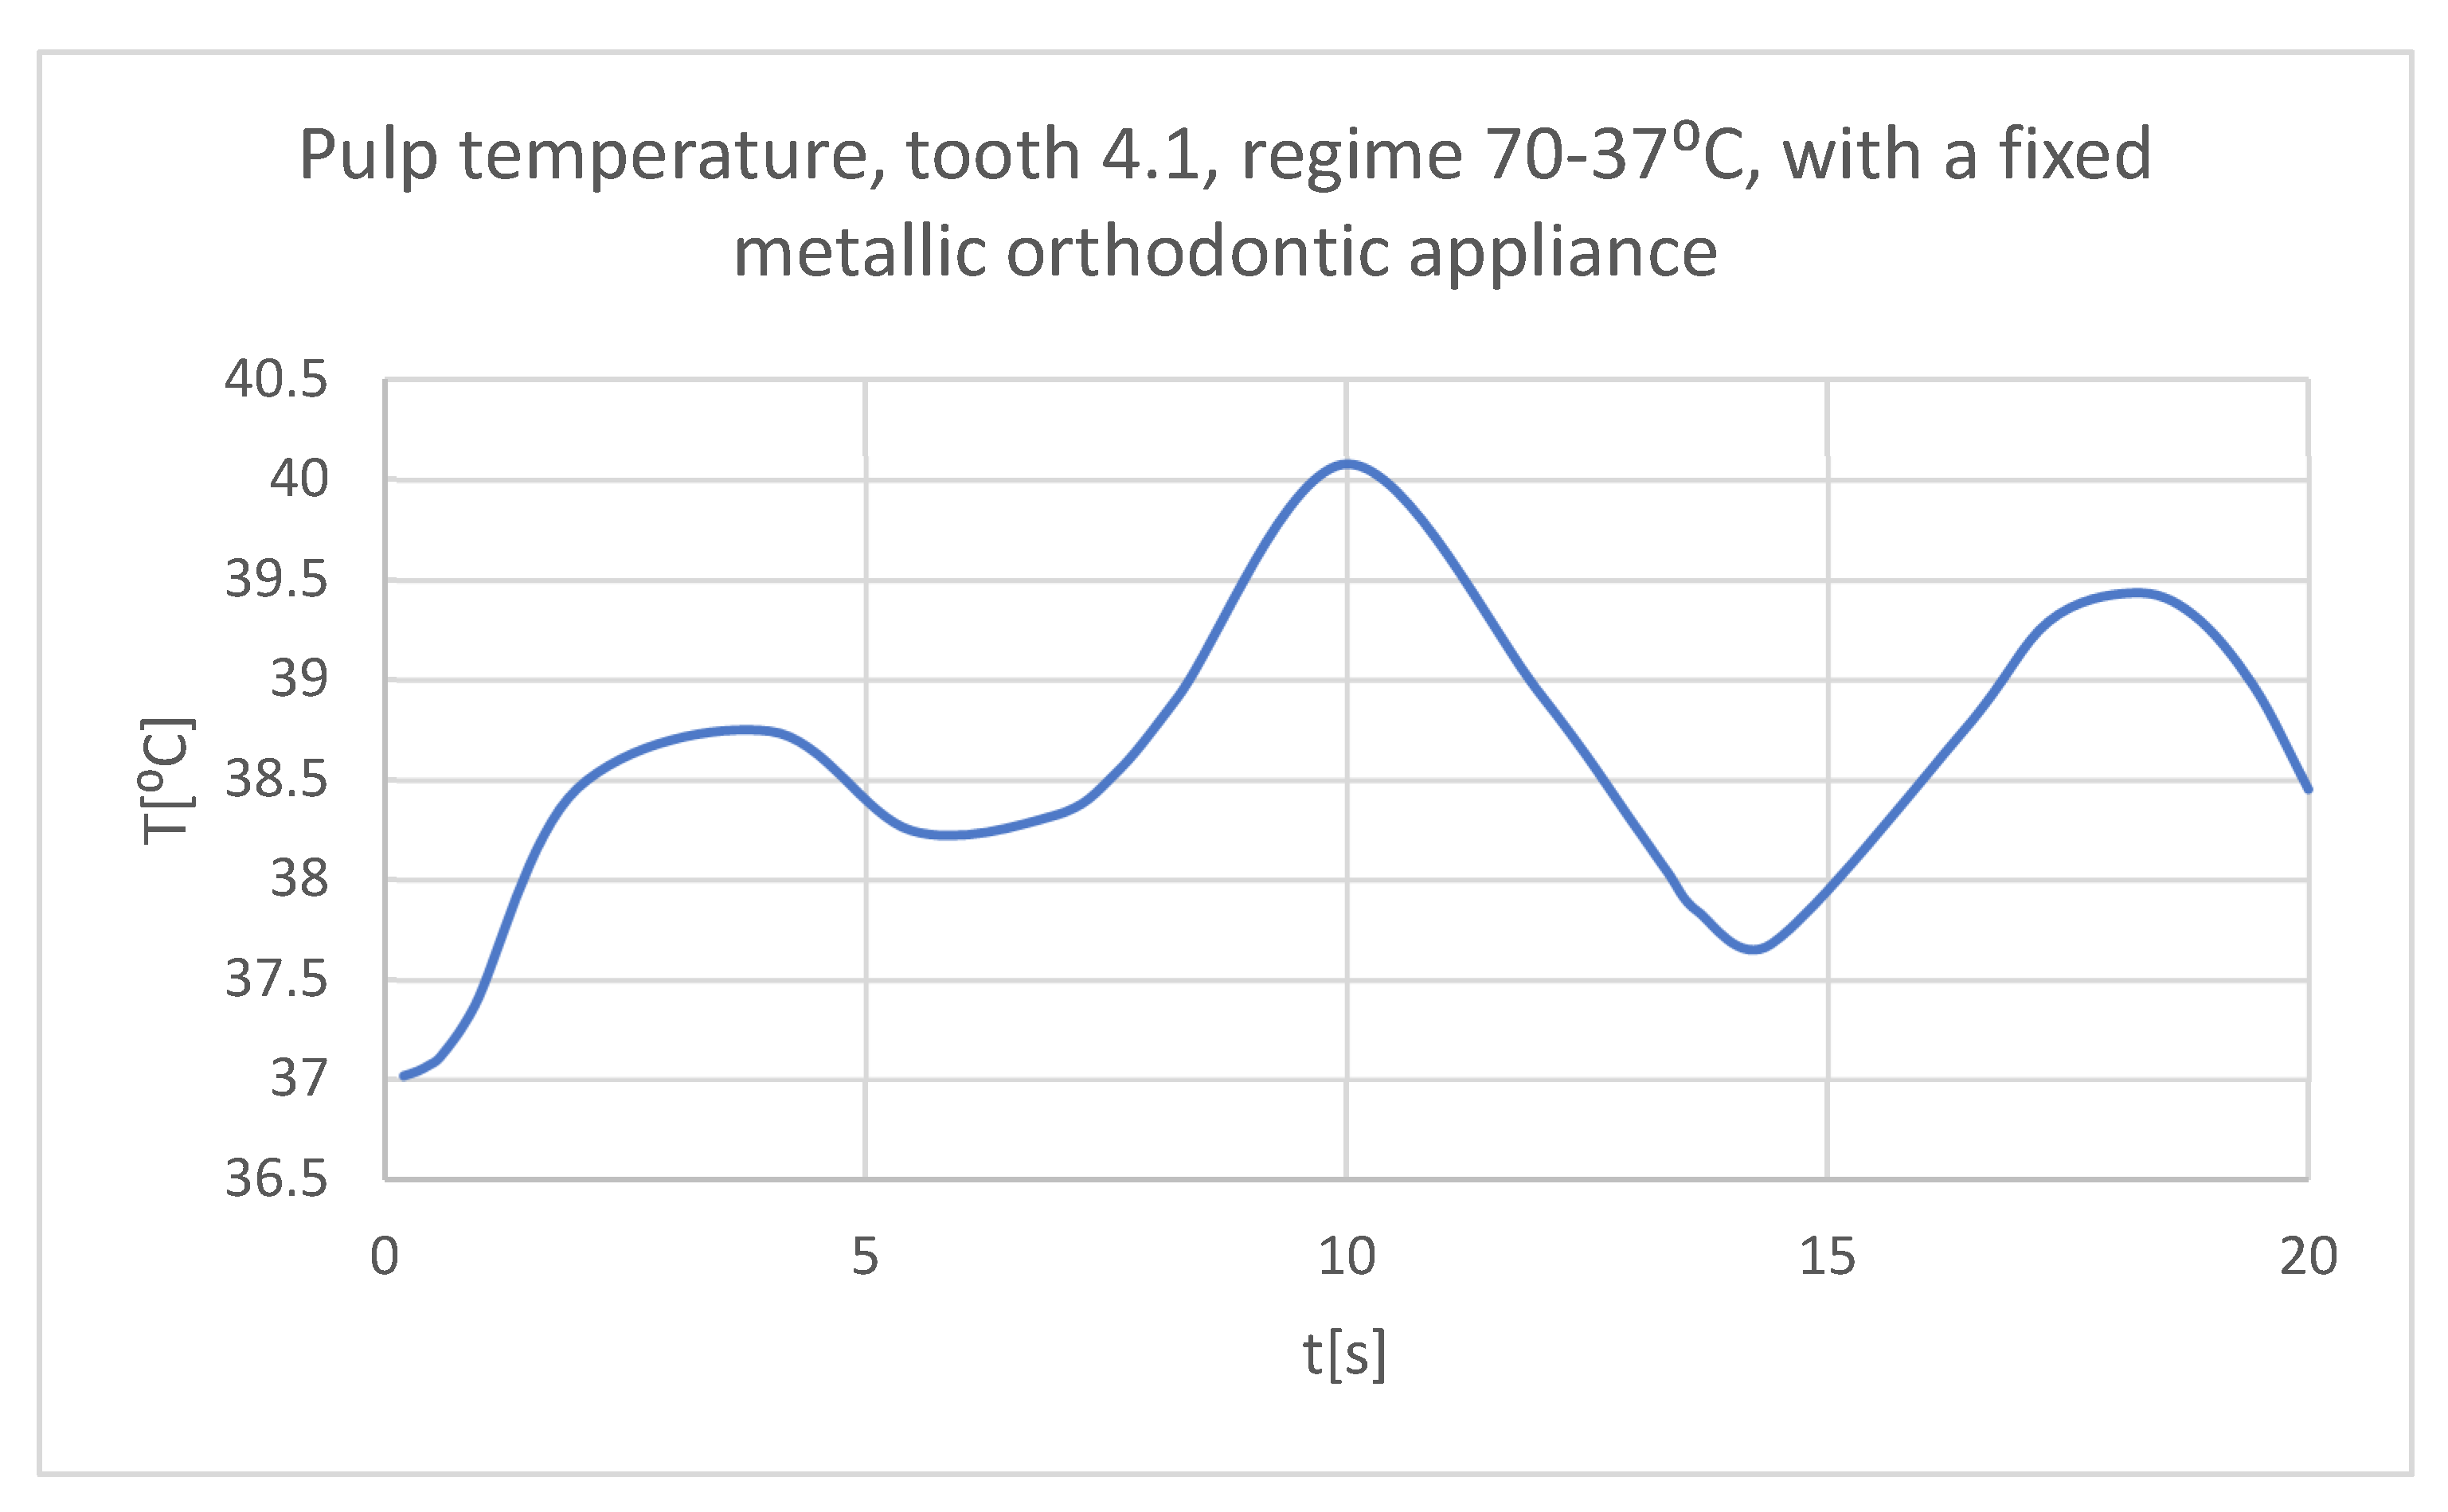
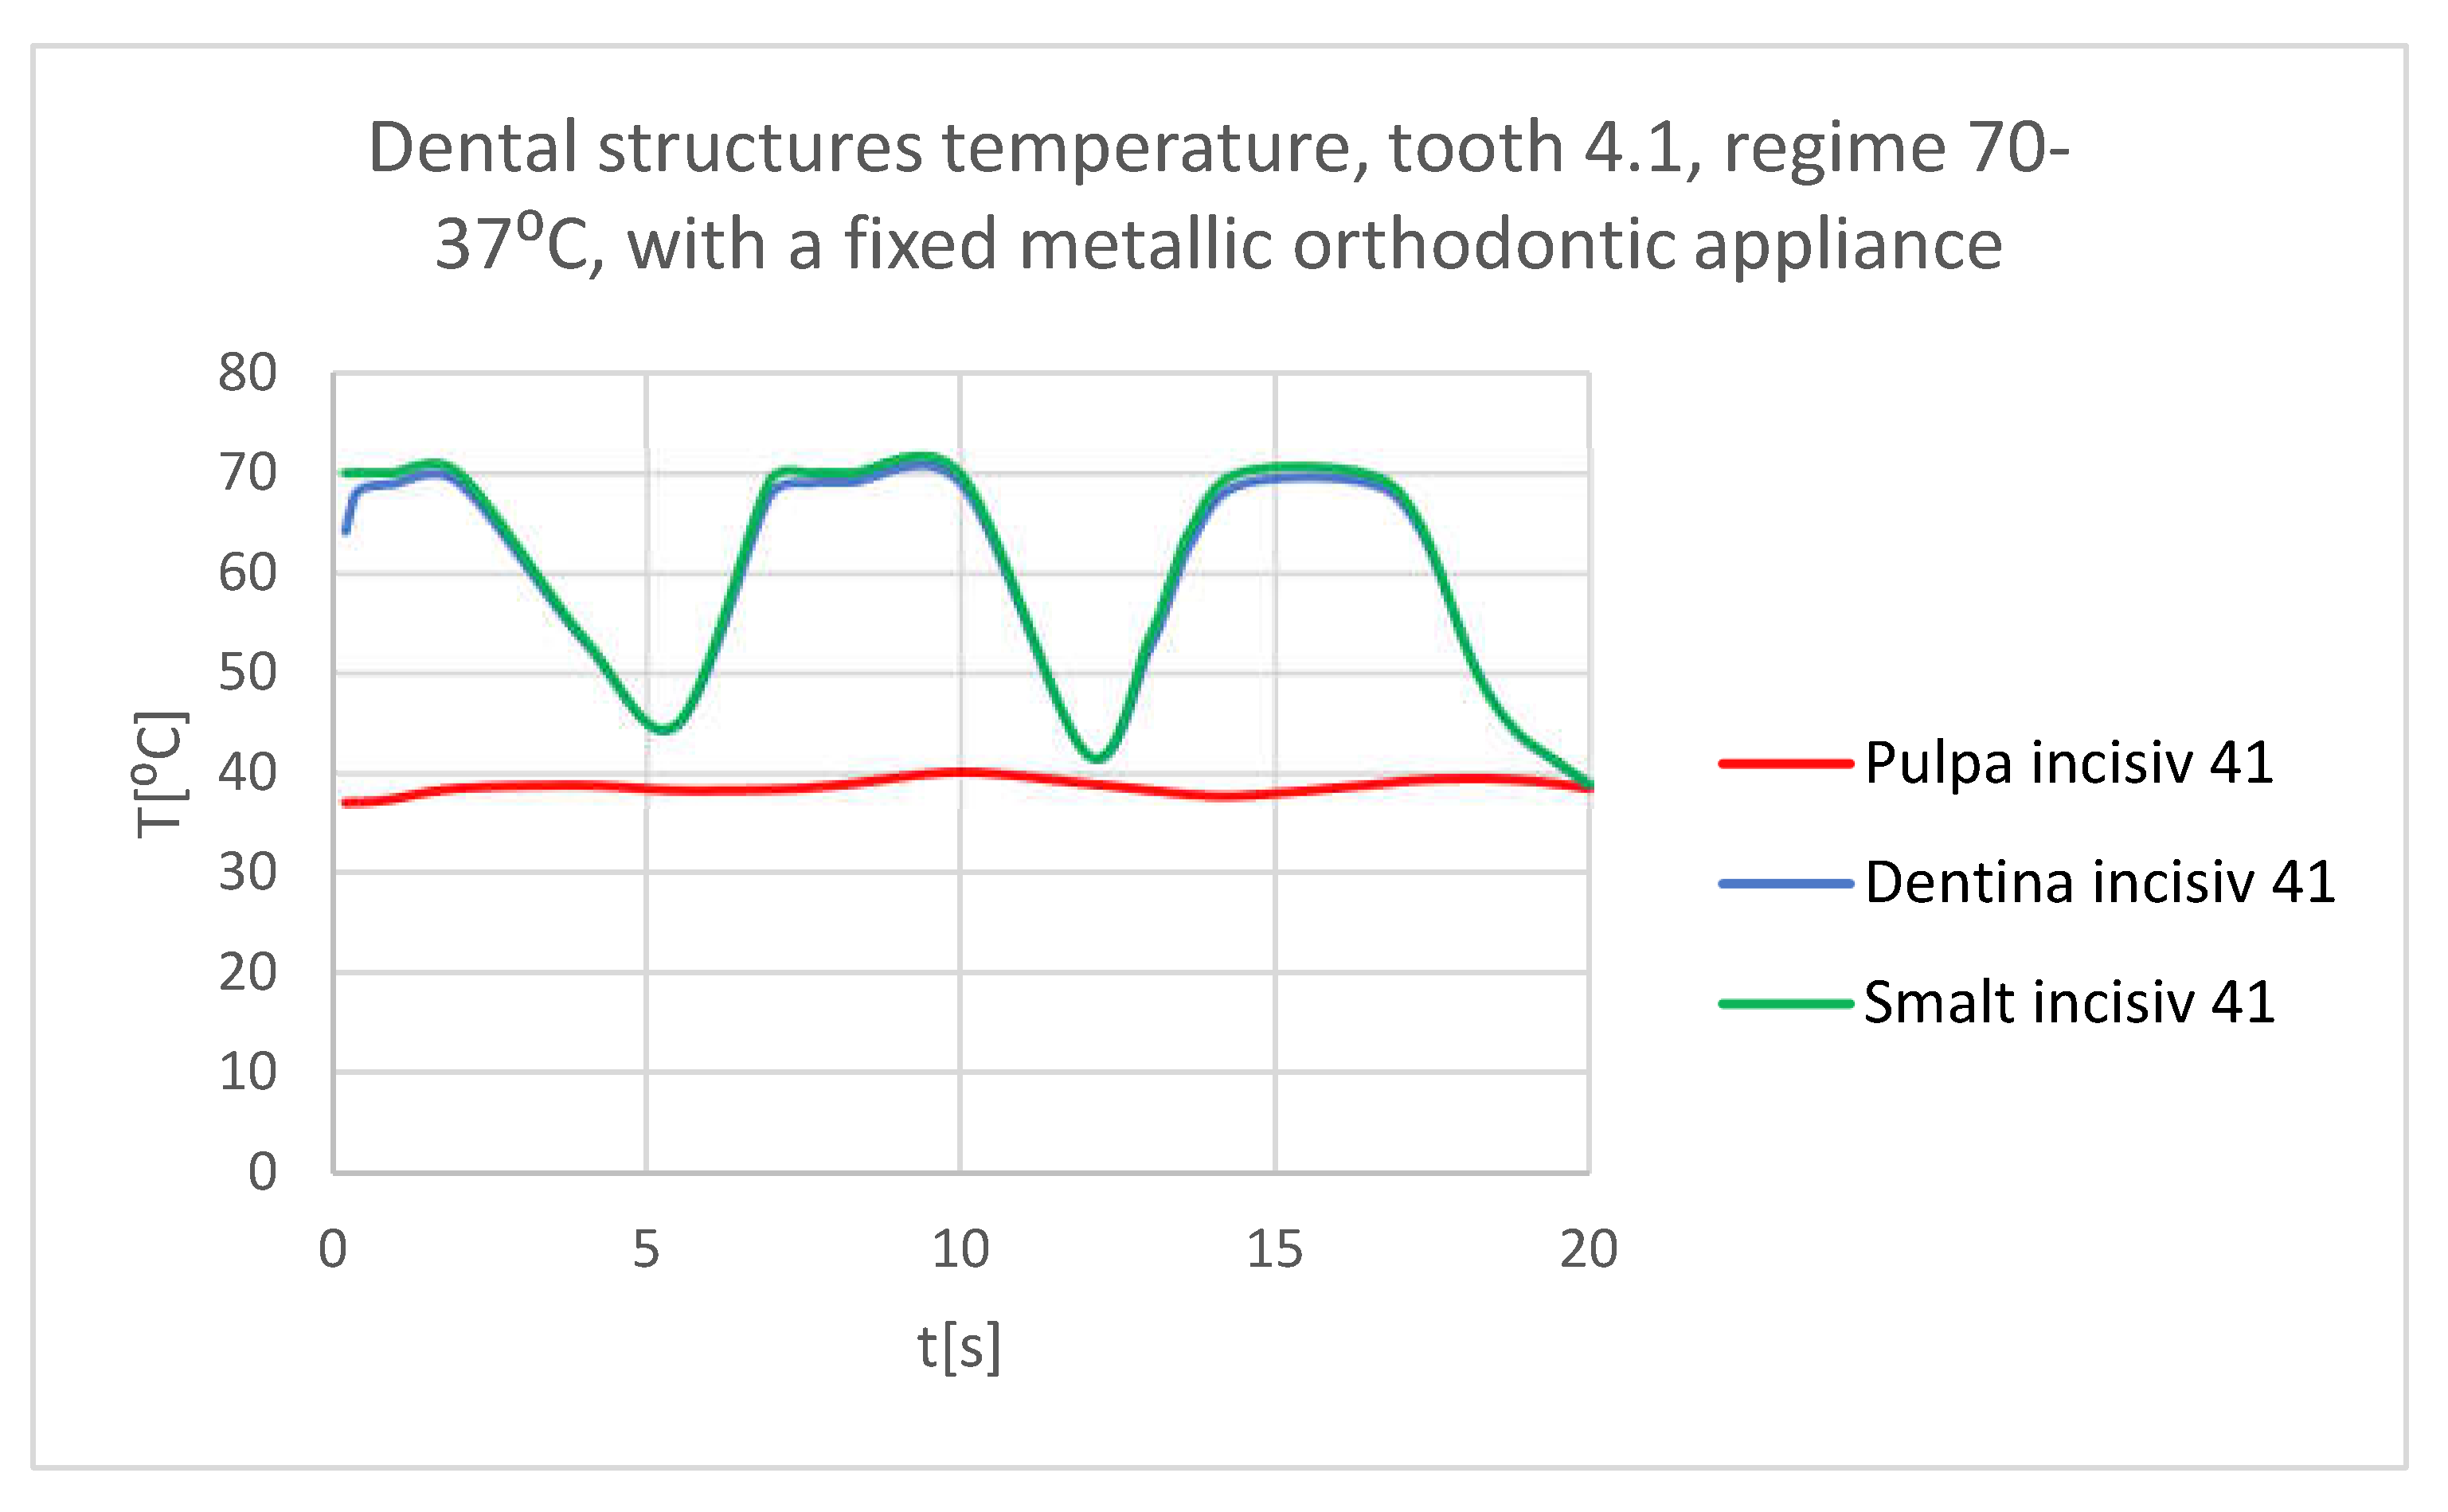
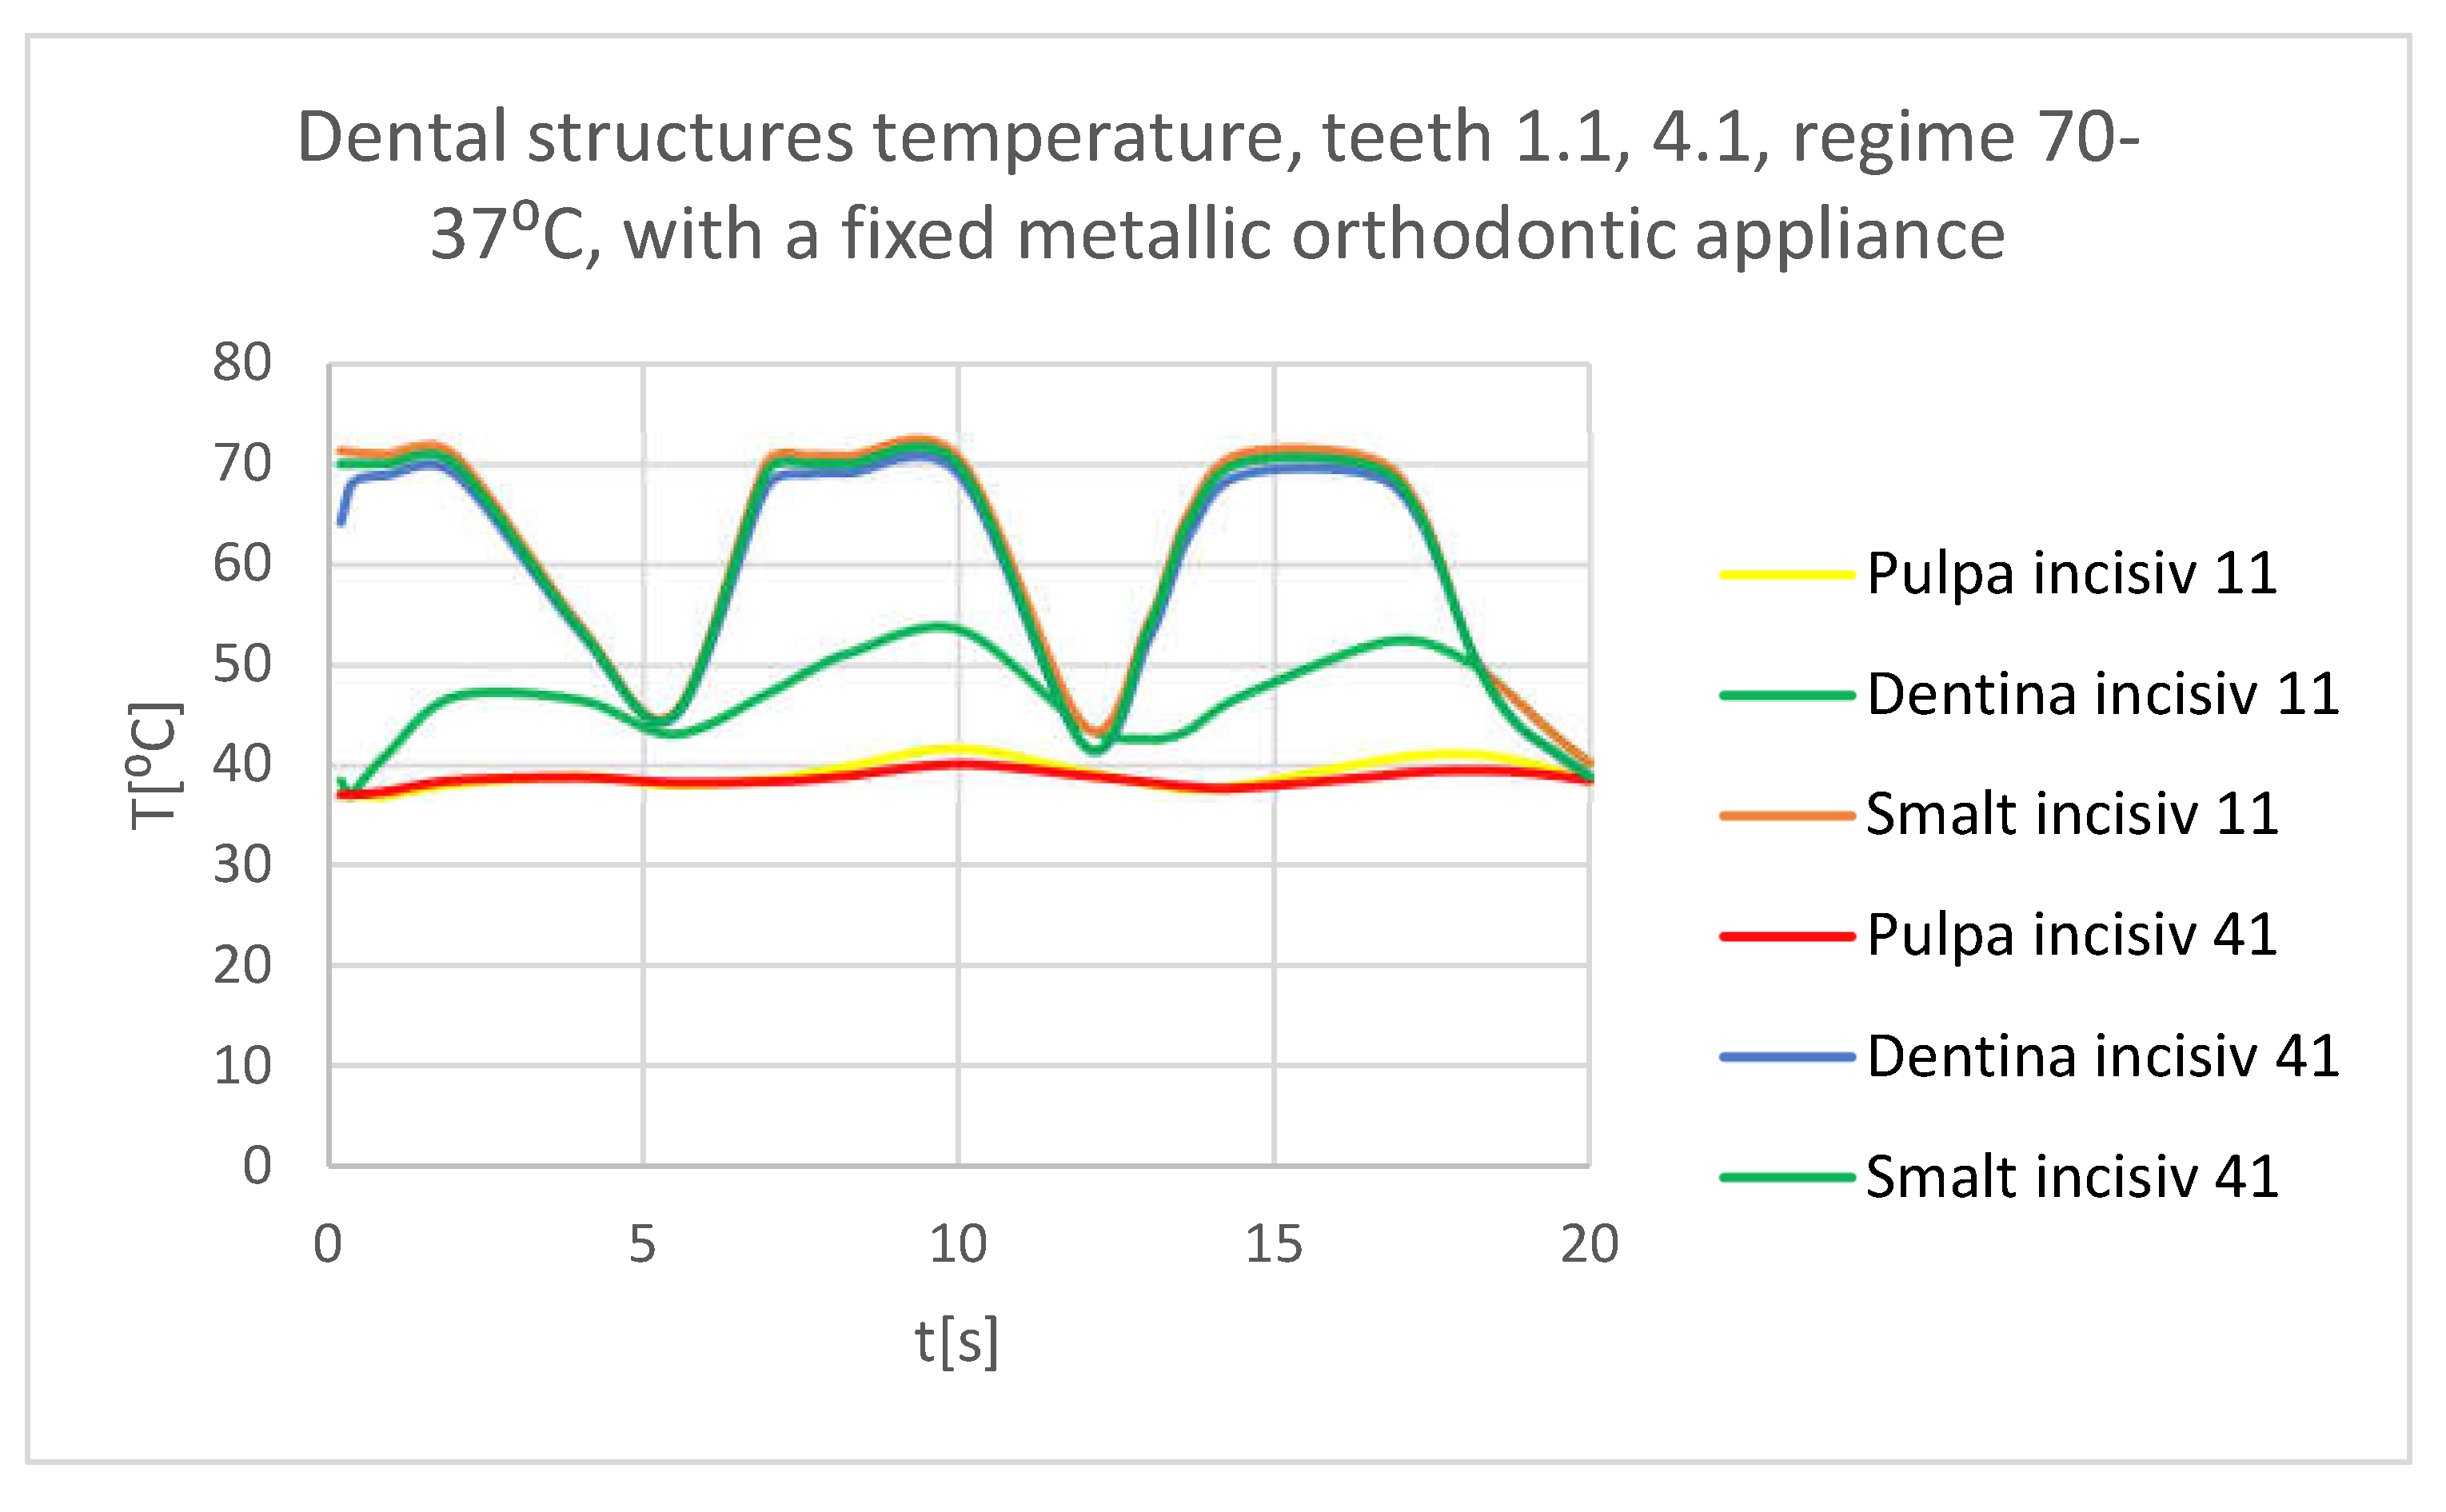
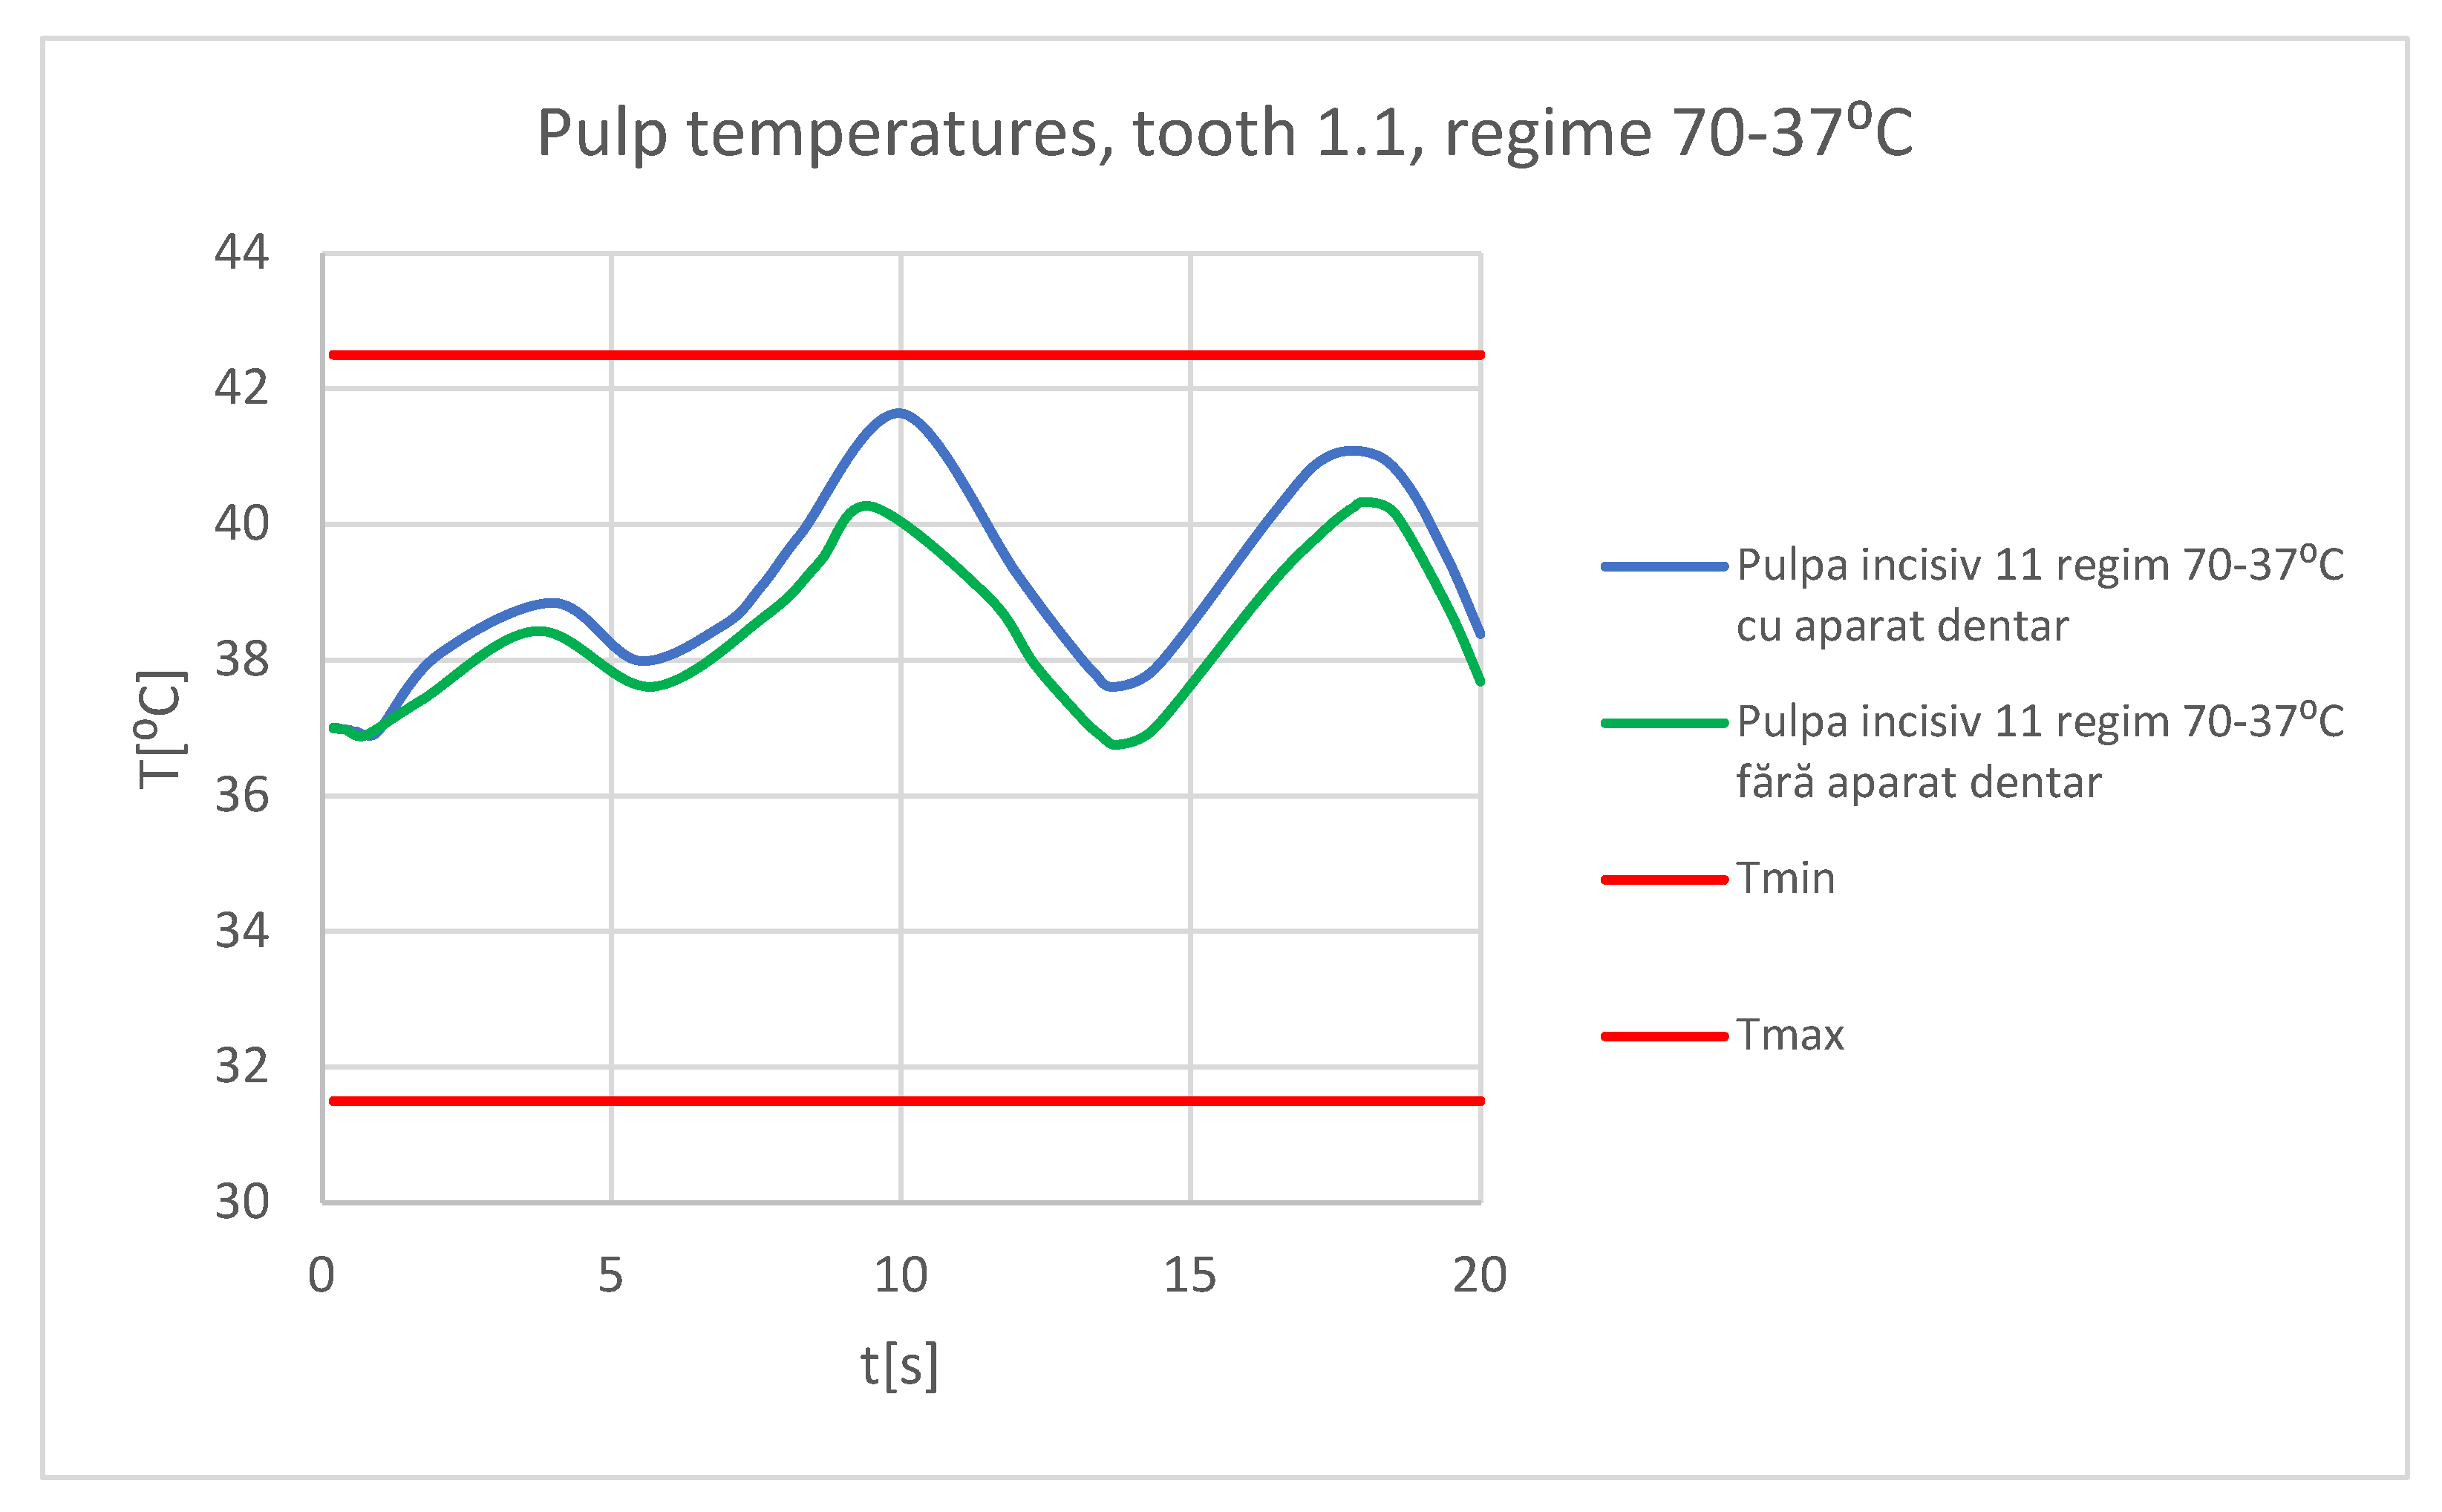
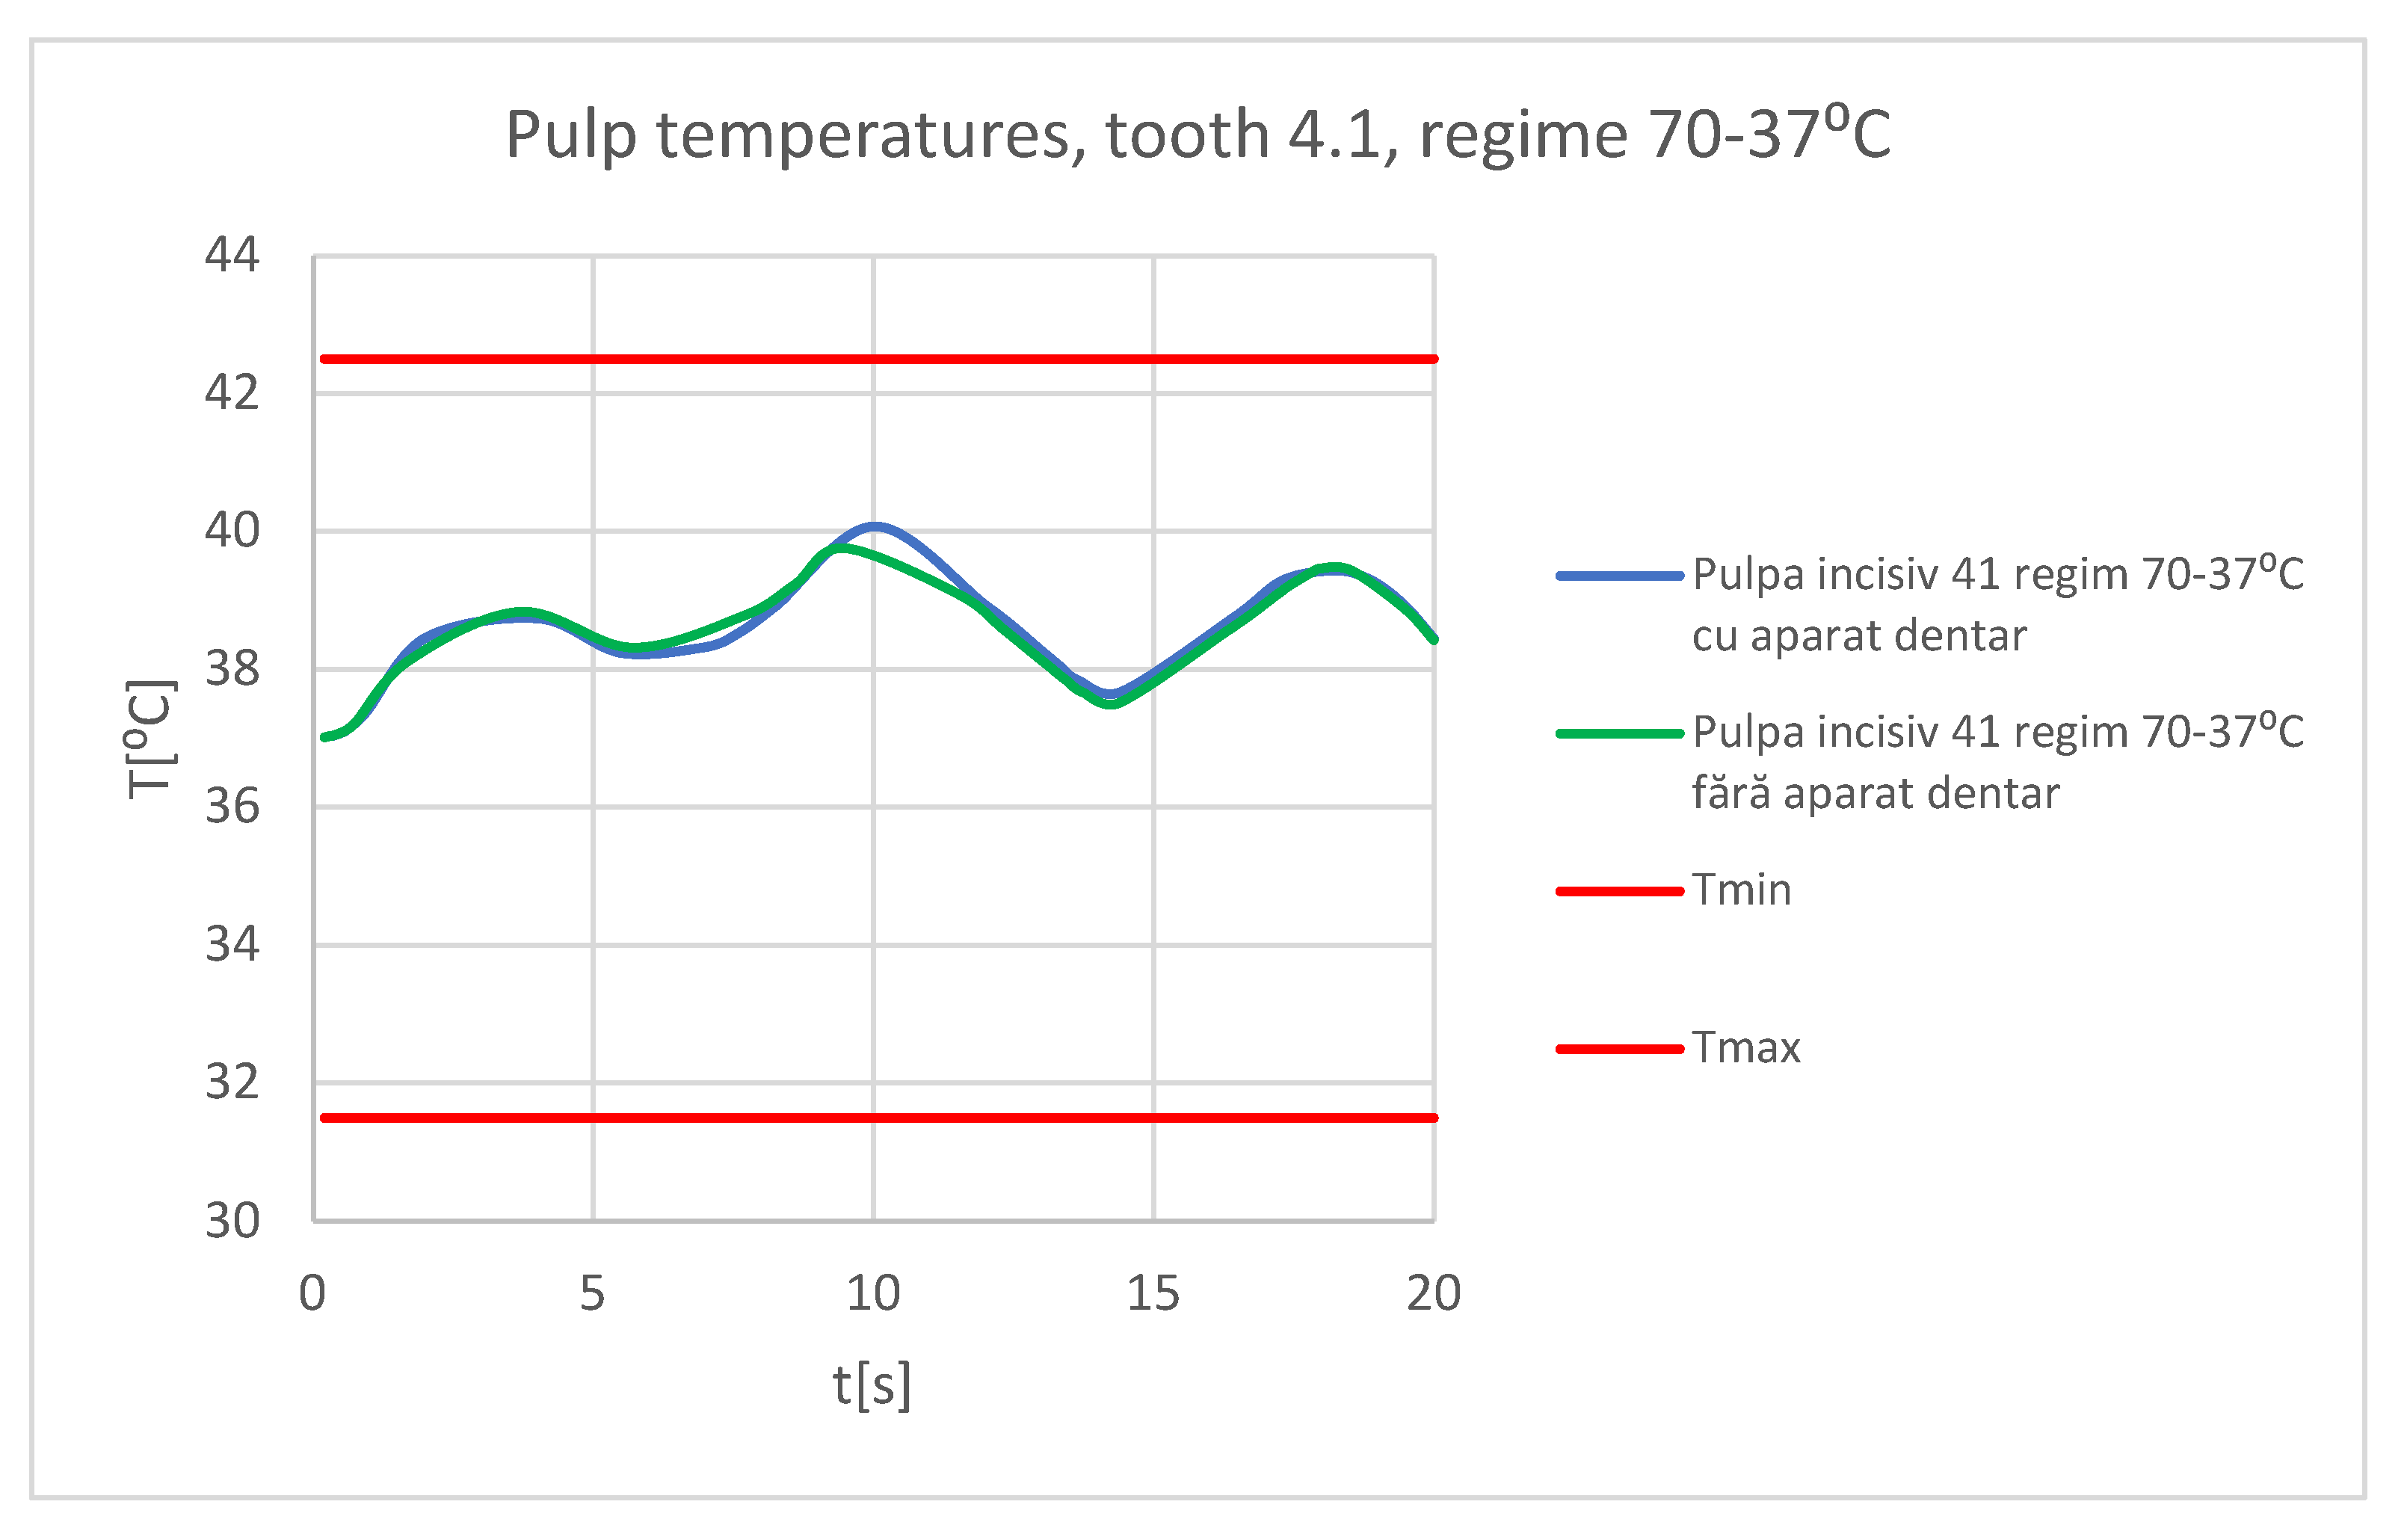
- very hot food (70 ⁰C) that acts for 3 seconds, then the temperature tends to 37 ⁰C, and the cycle is repeated two more times, the whole regime lasts 20 seconds (
Figure 22);
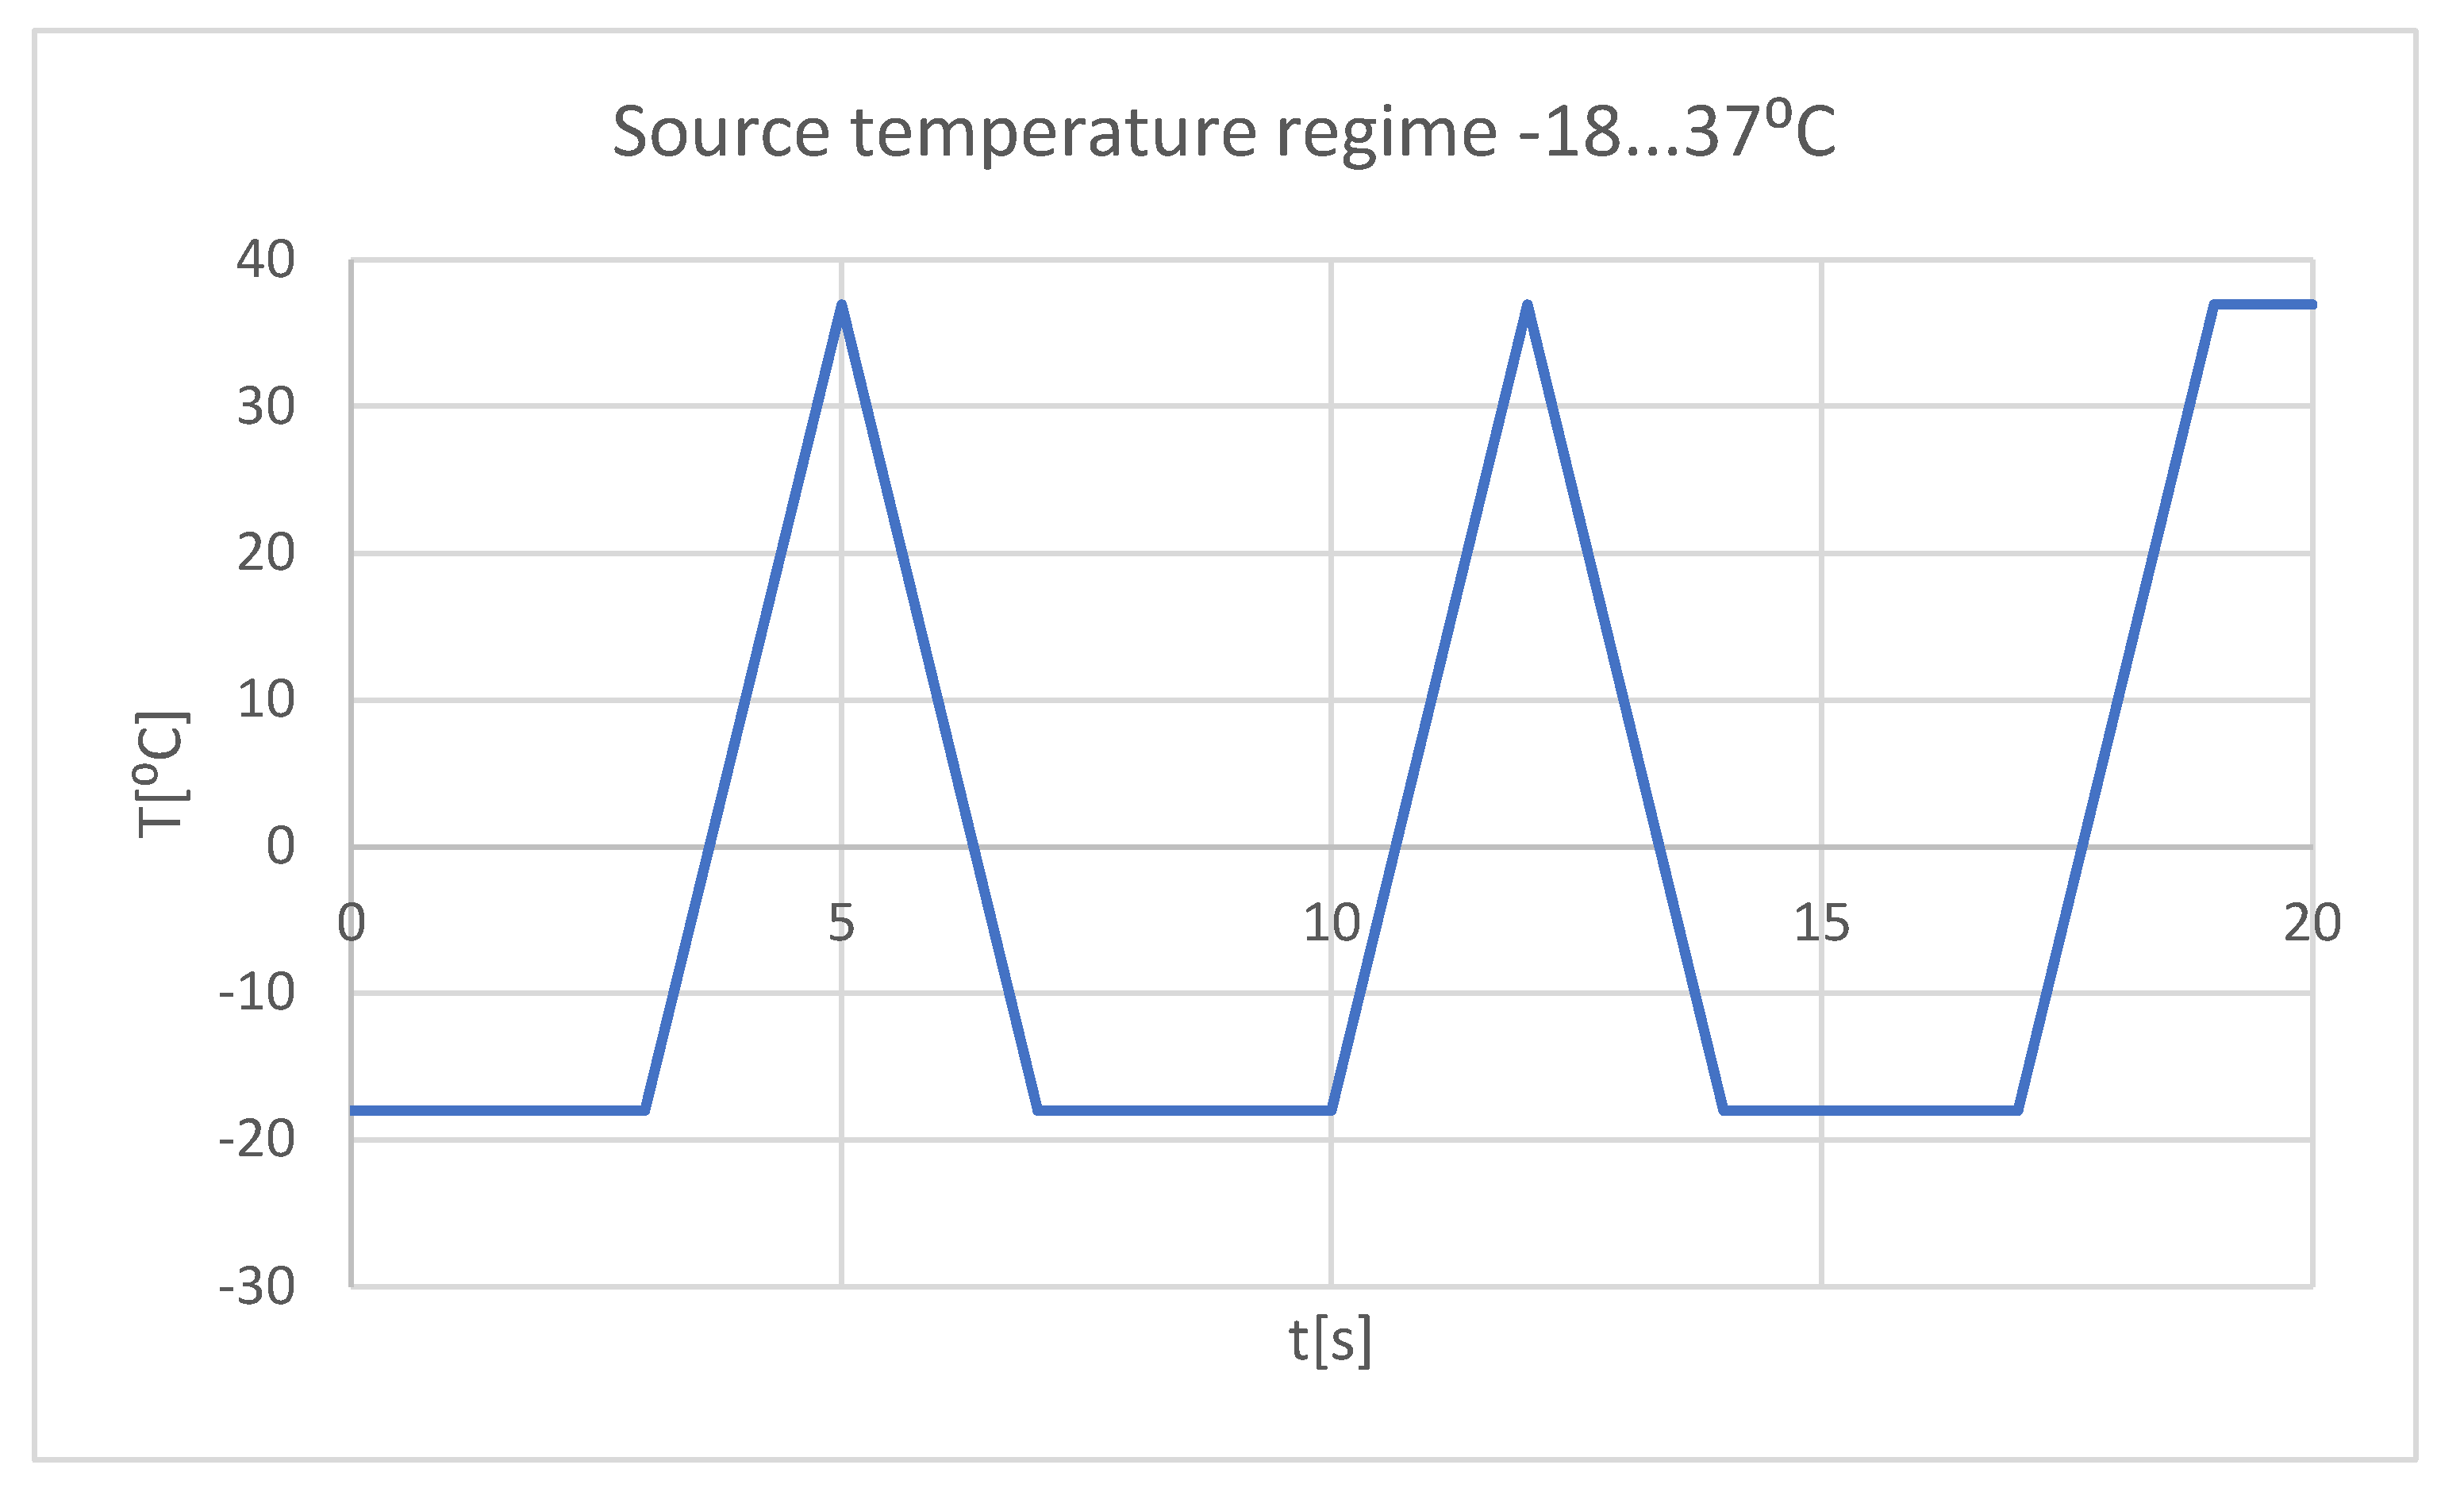
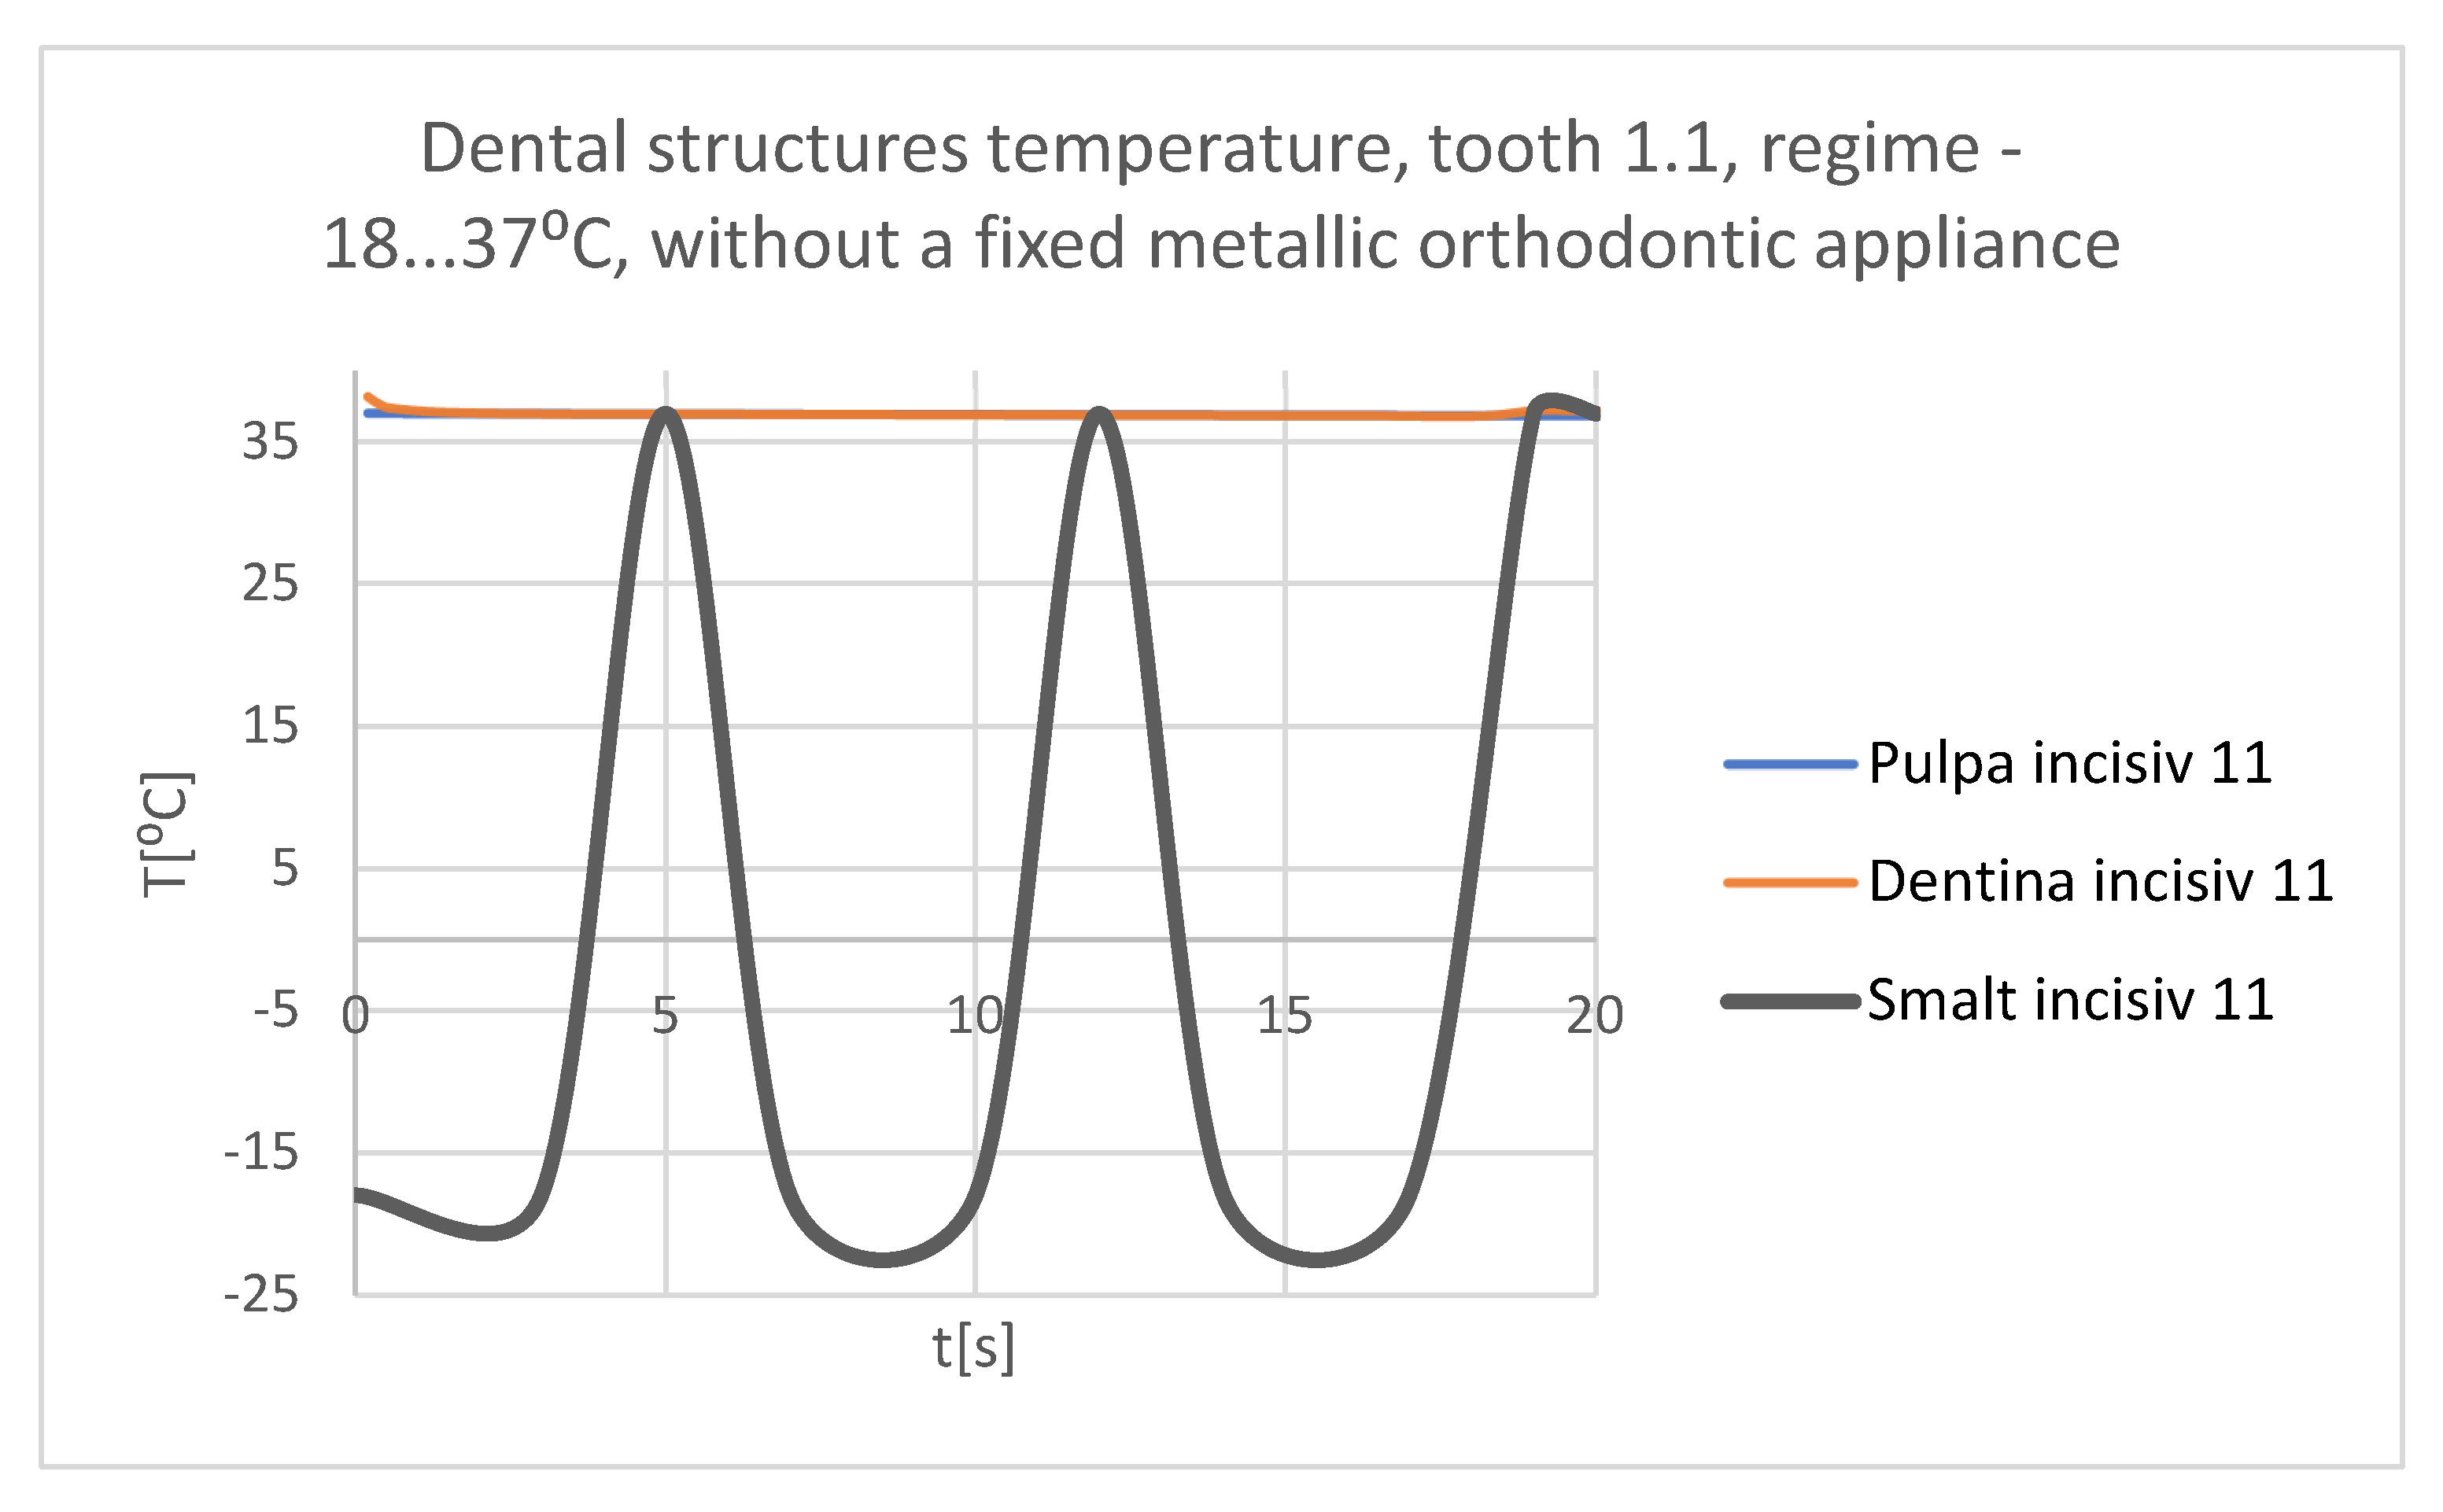
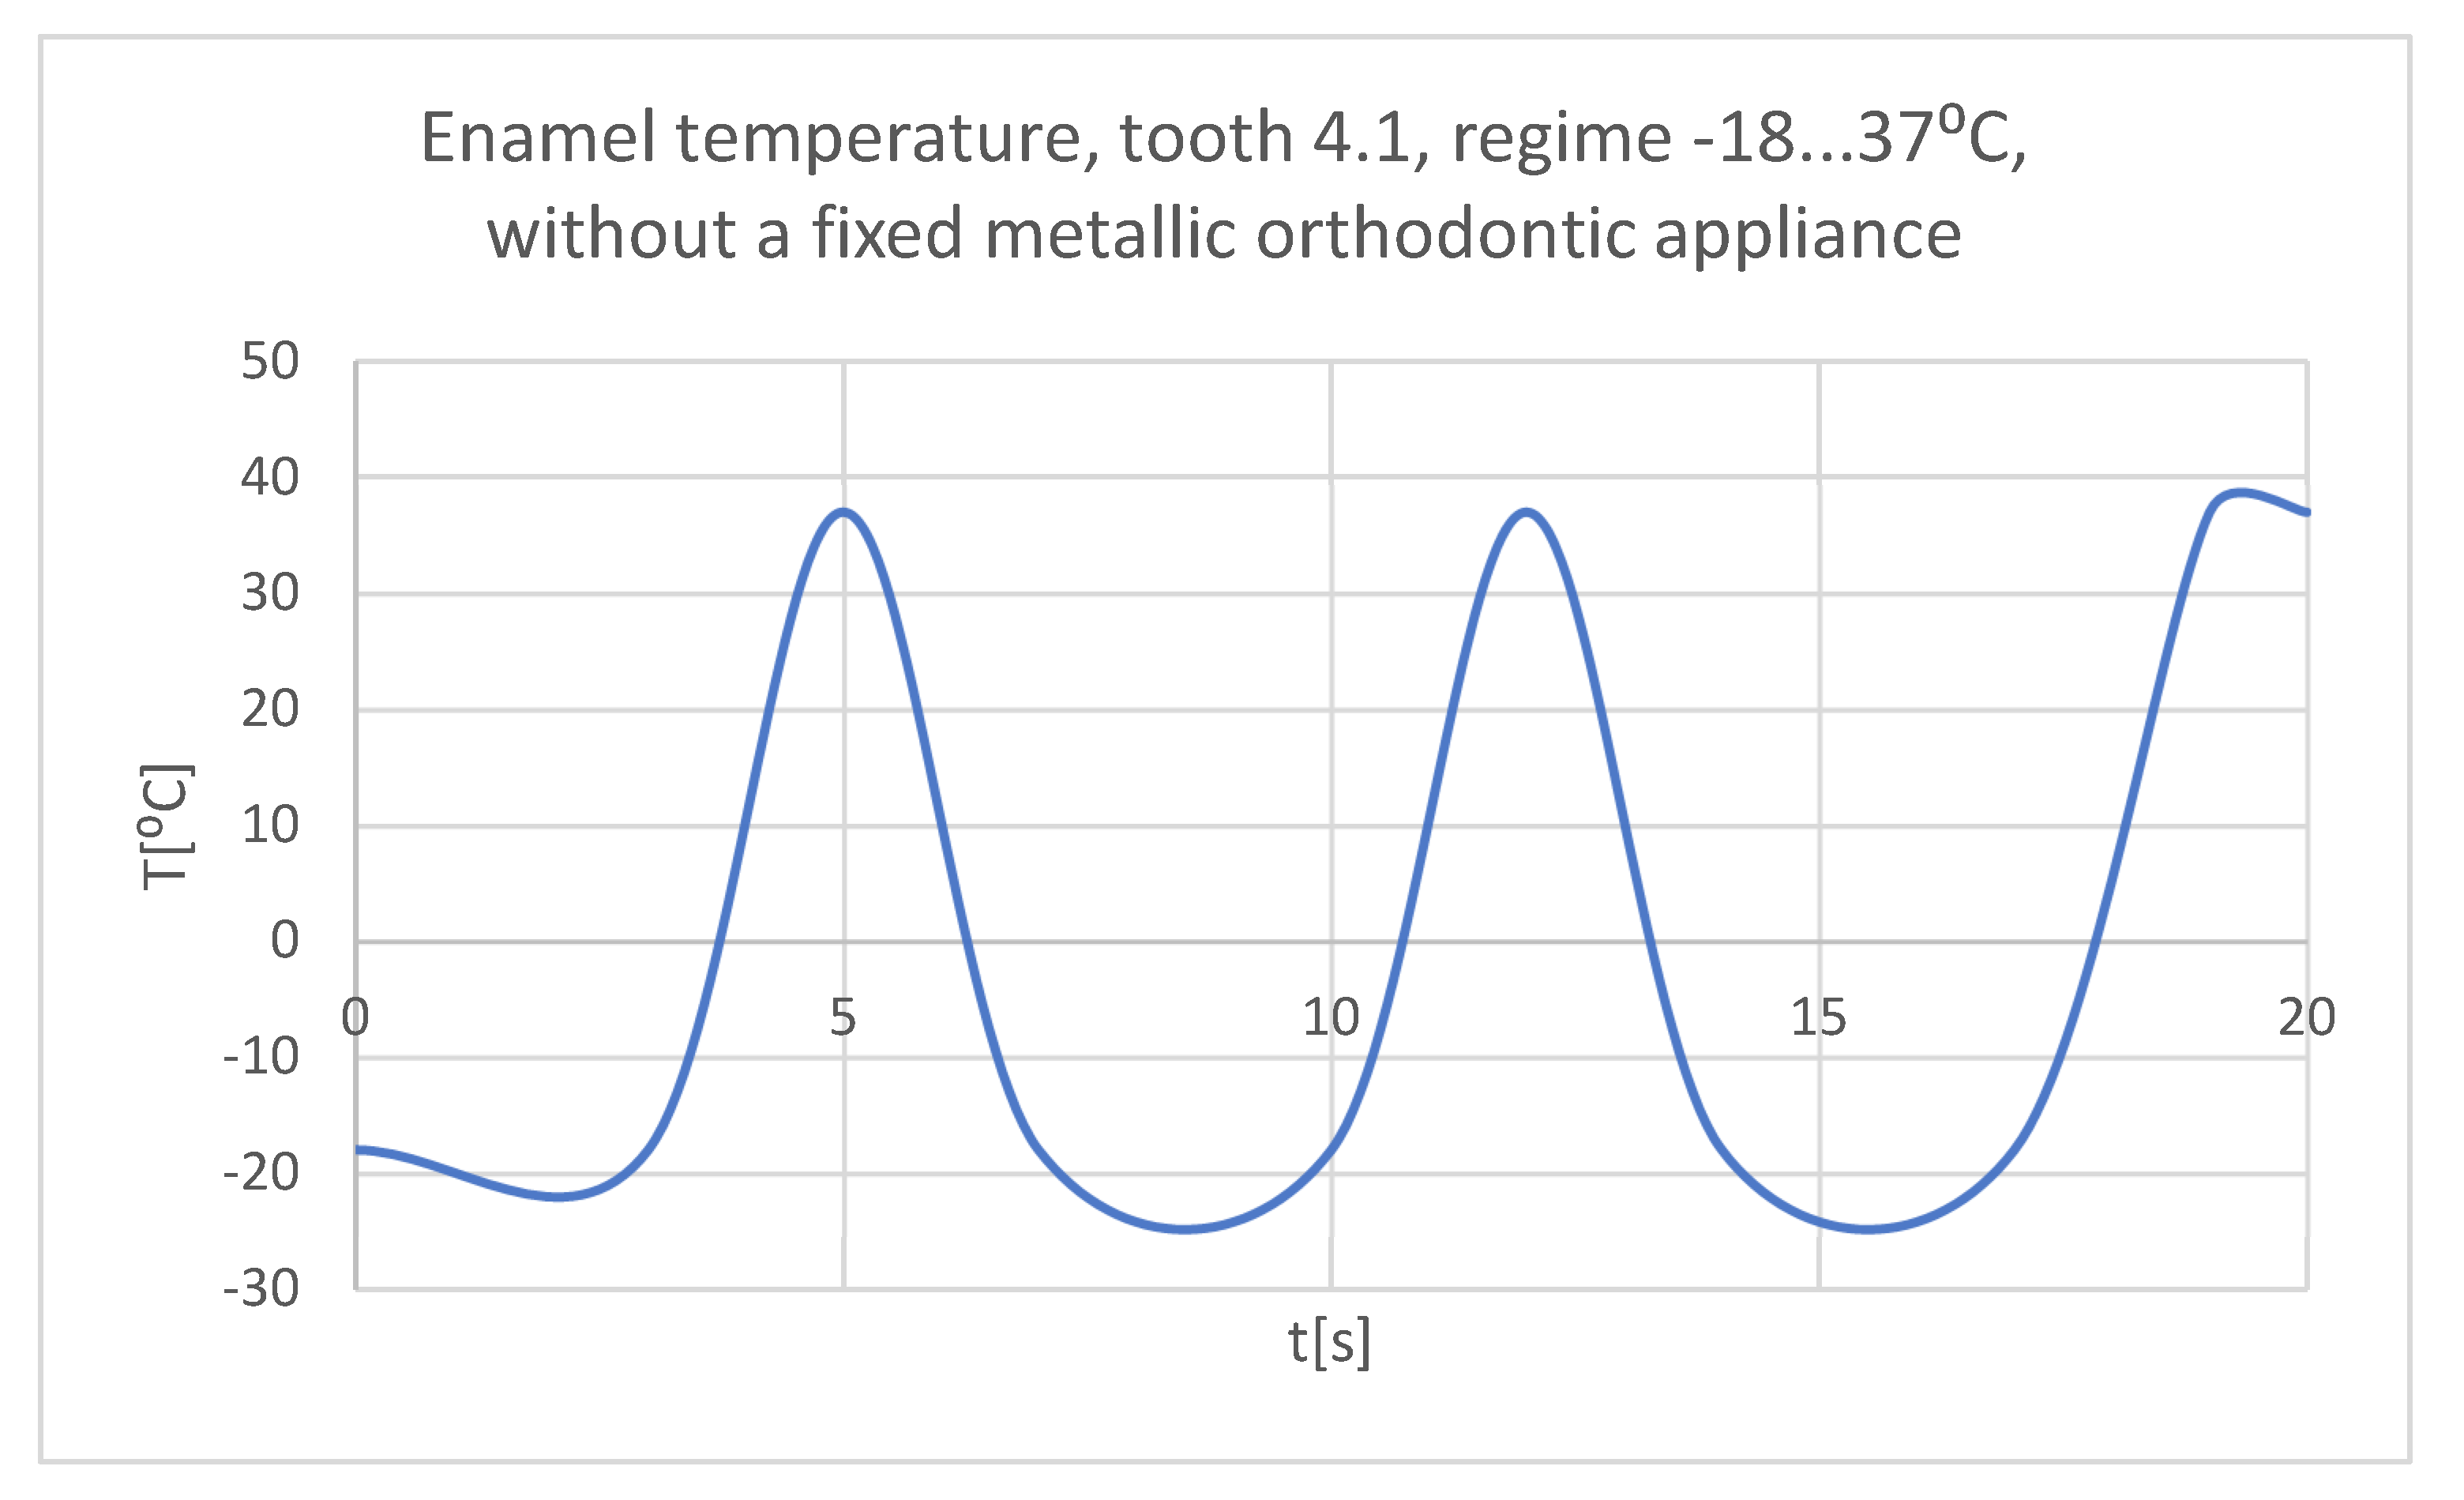
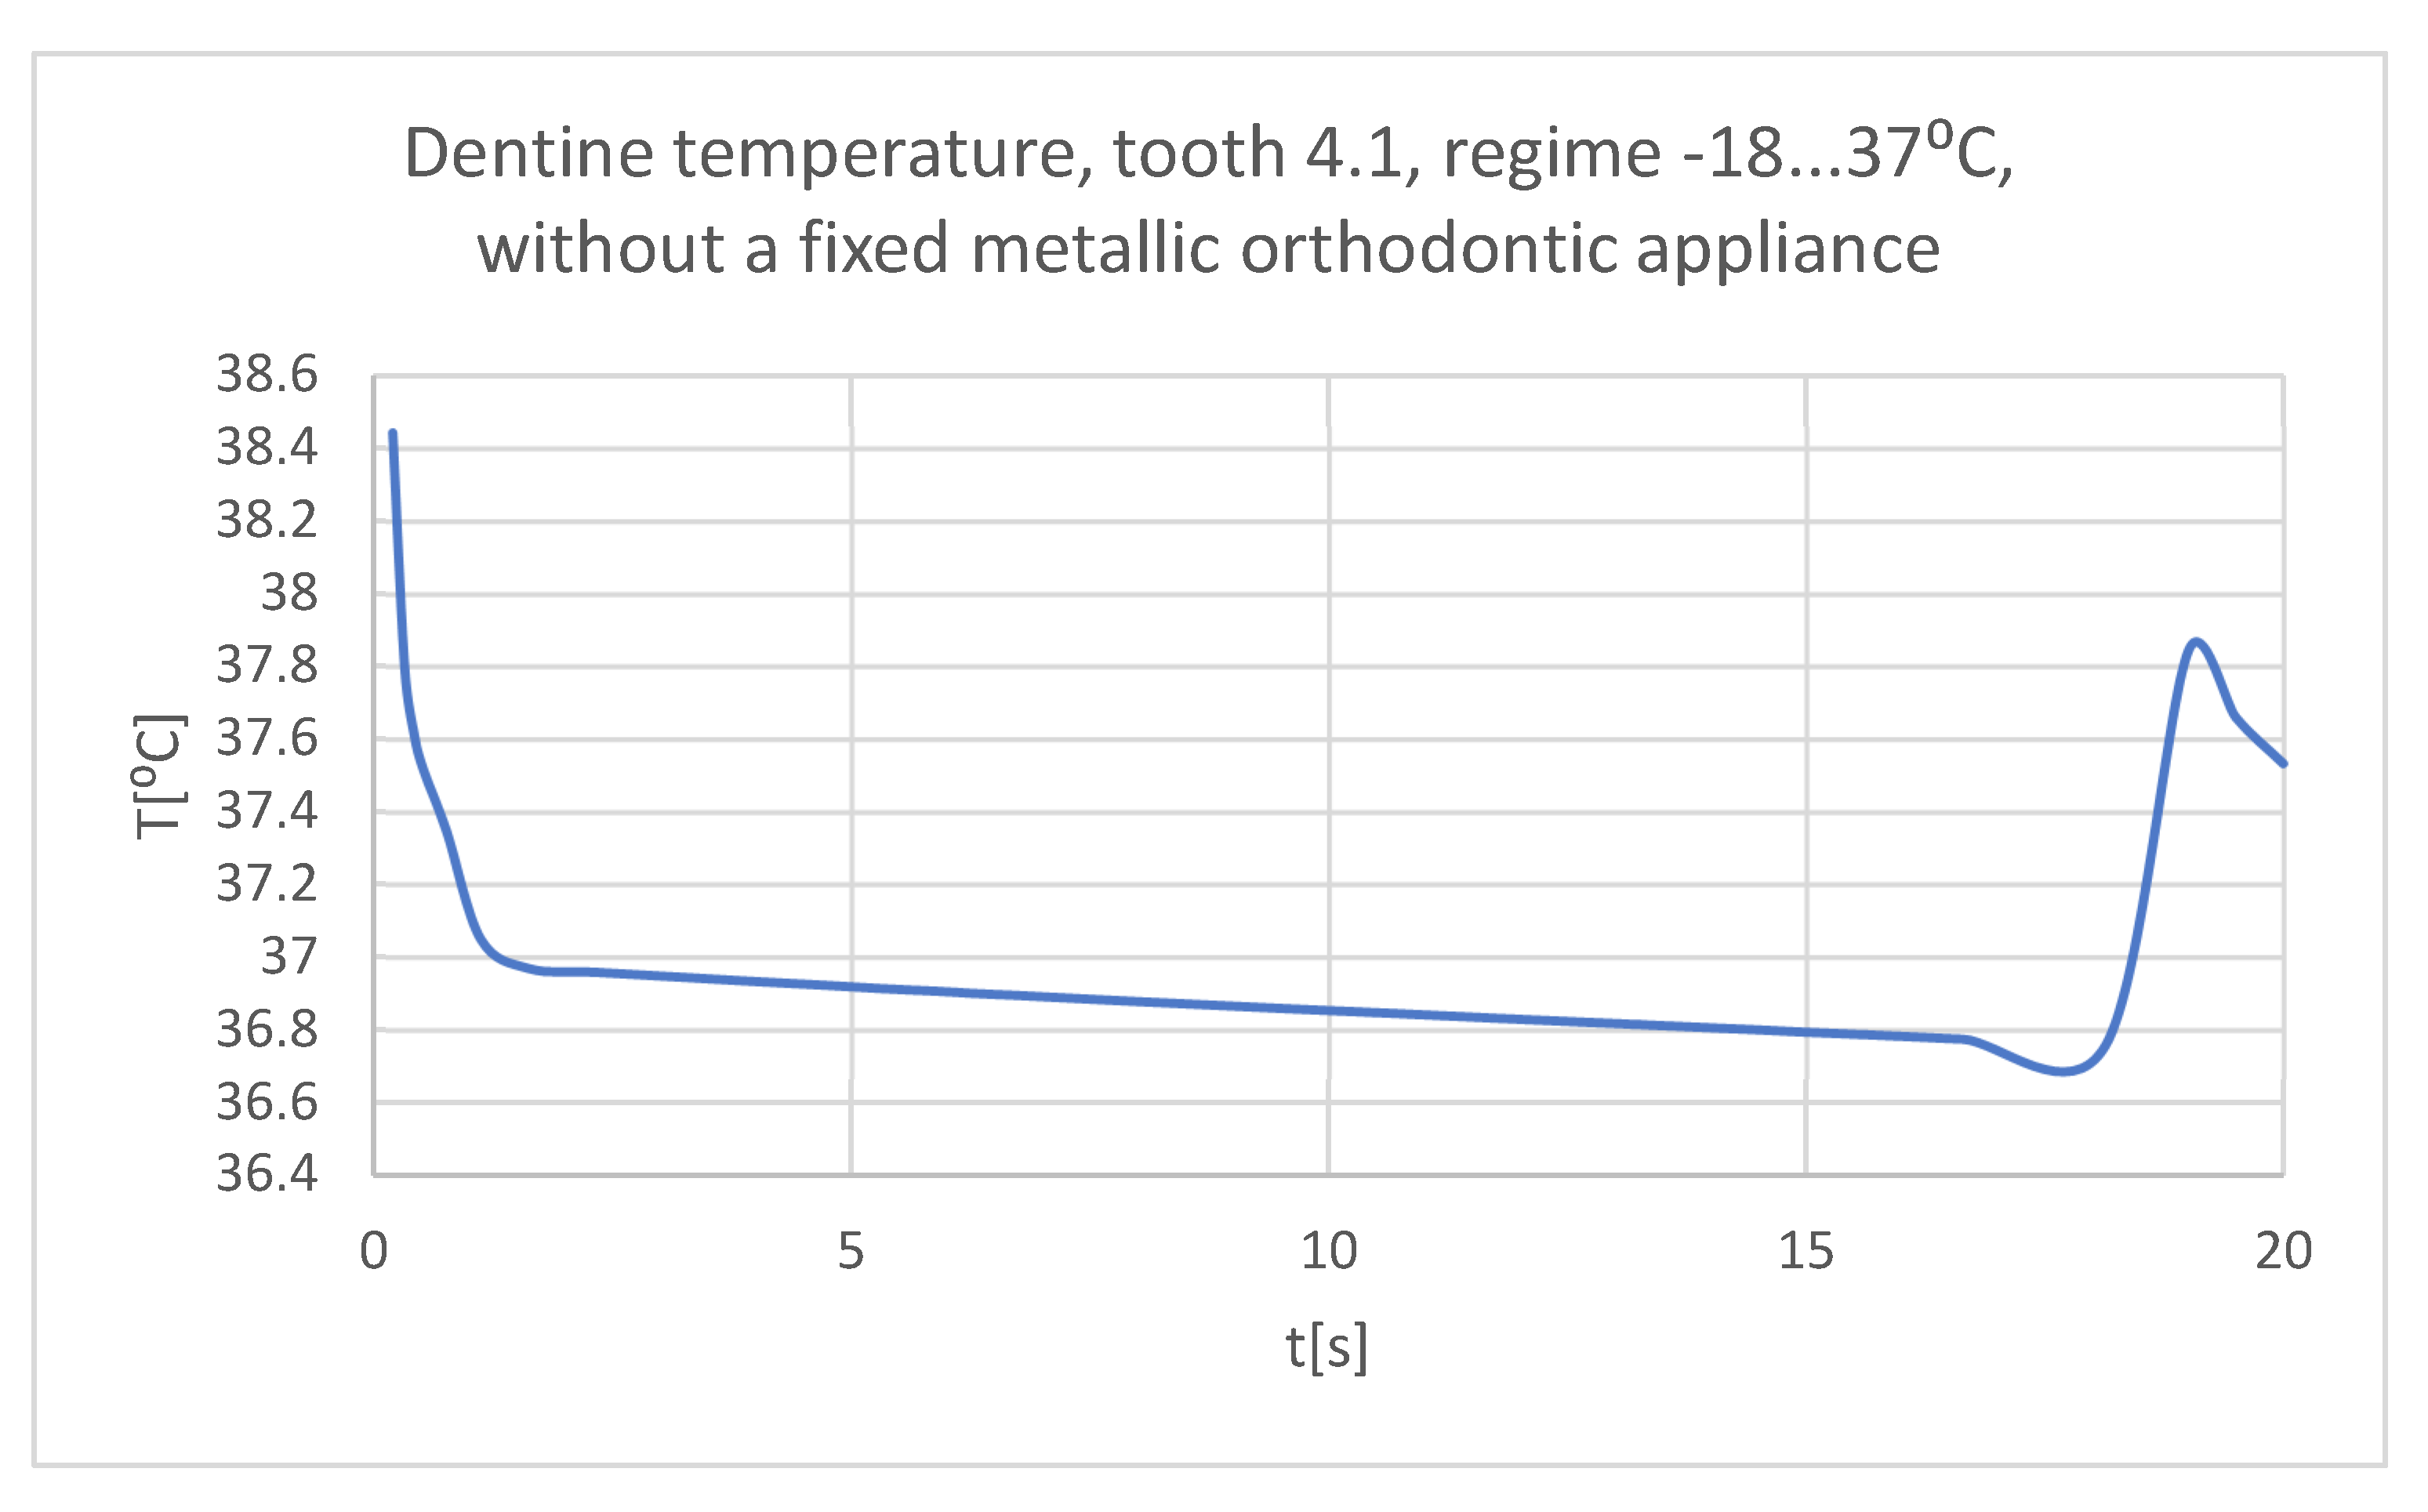
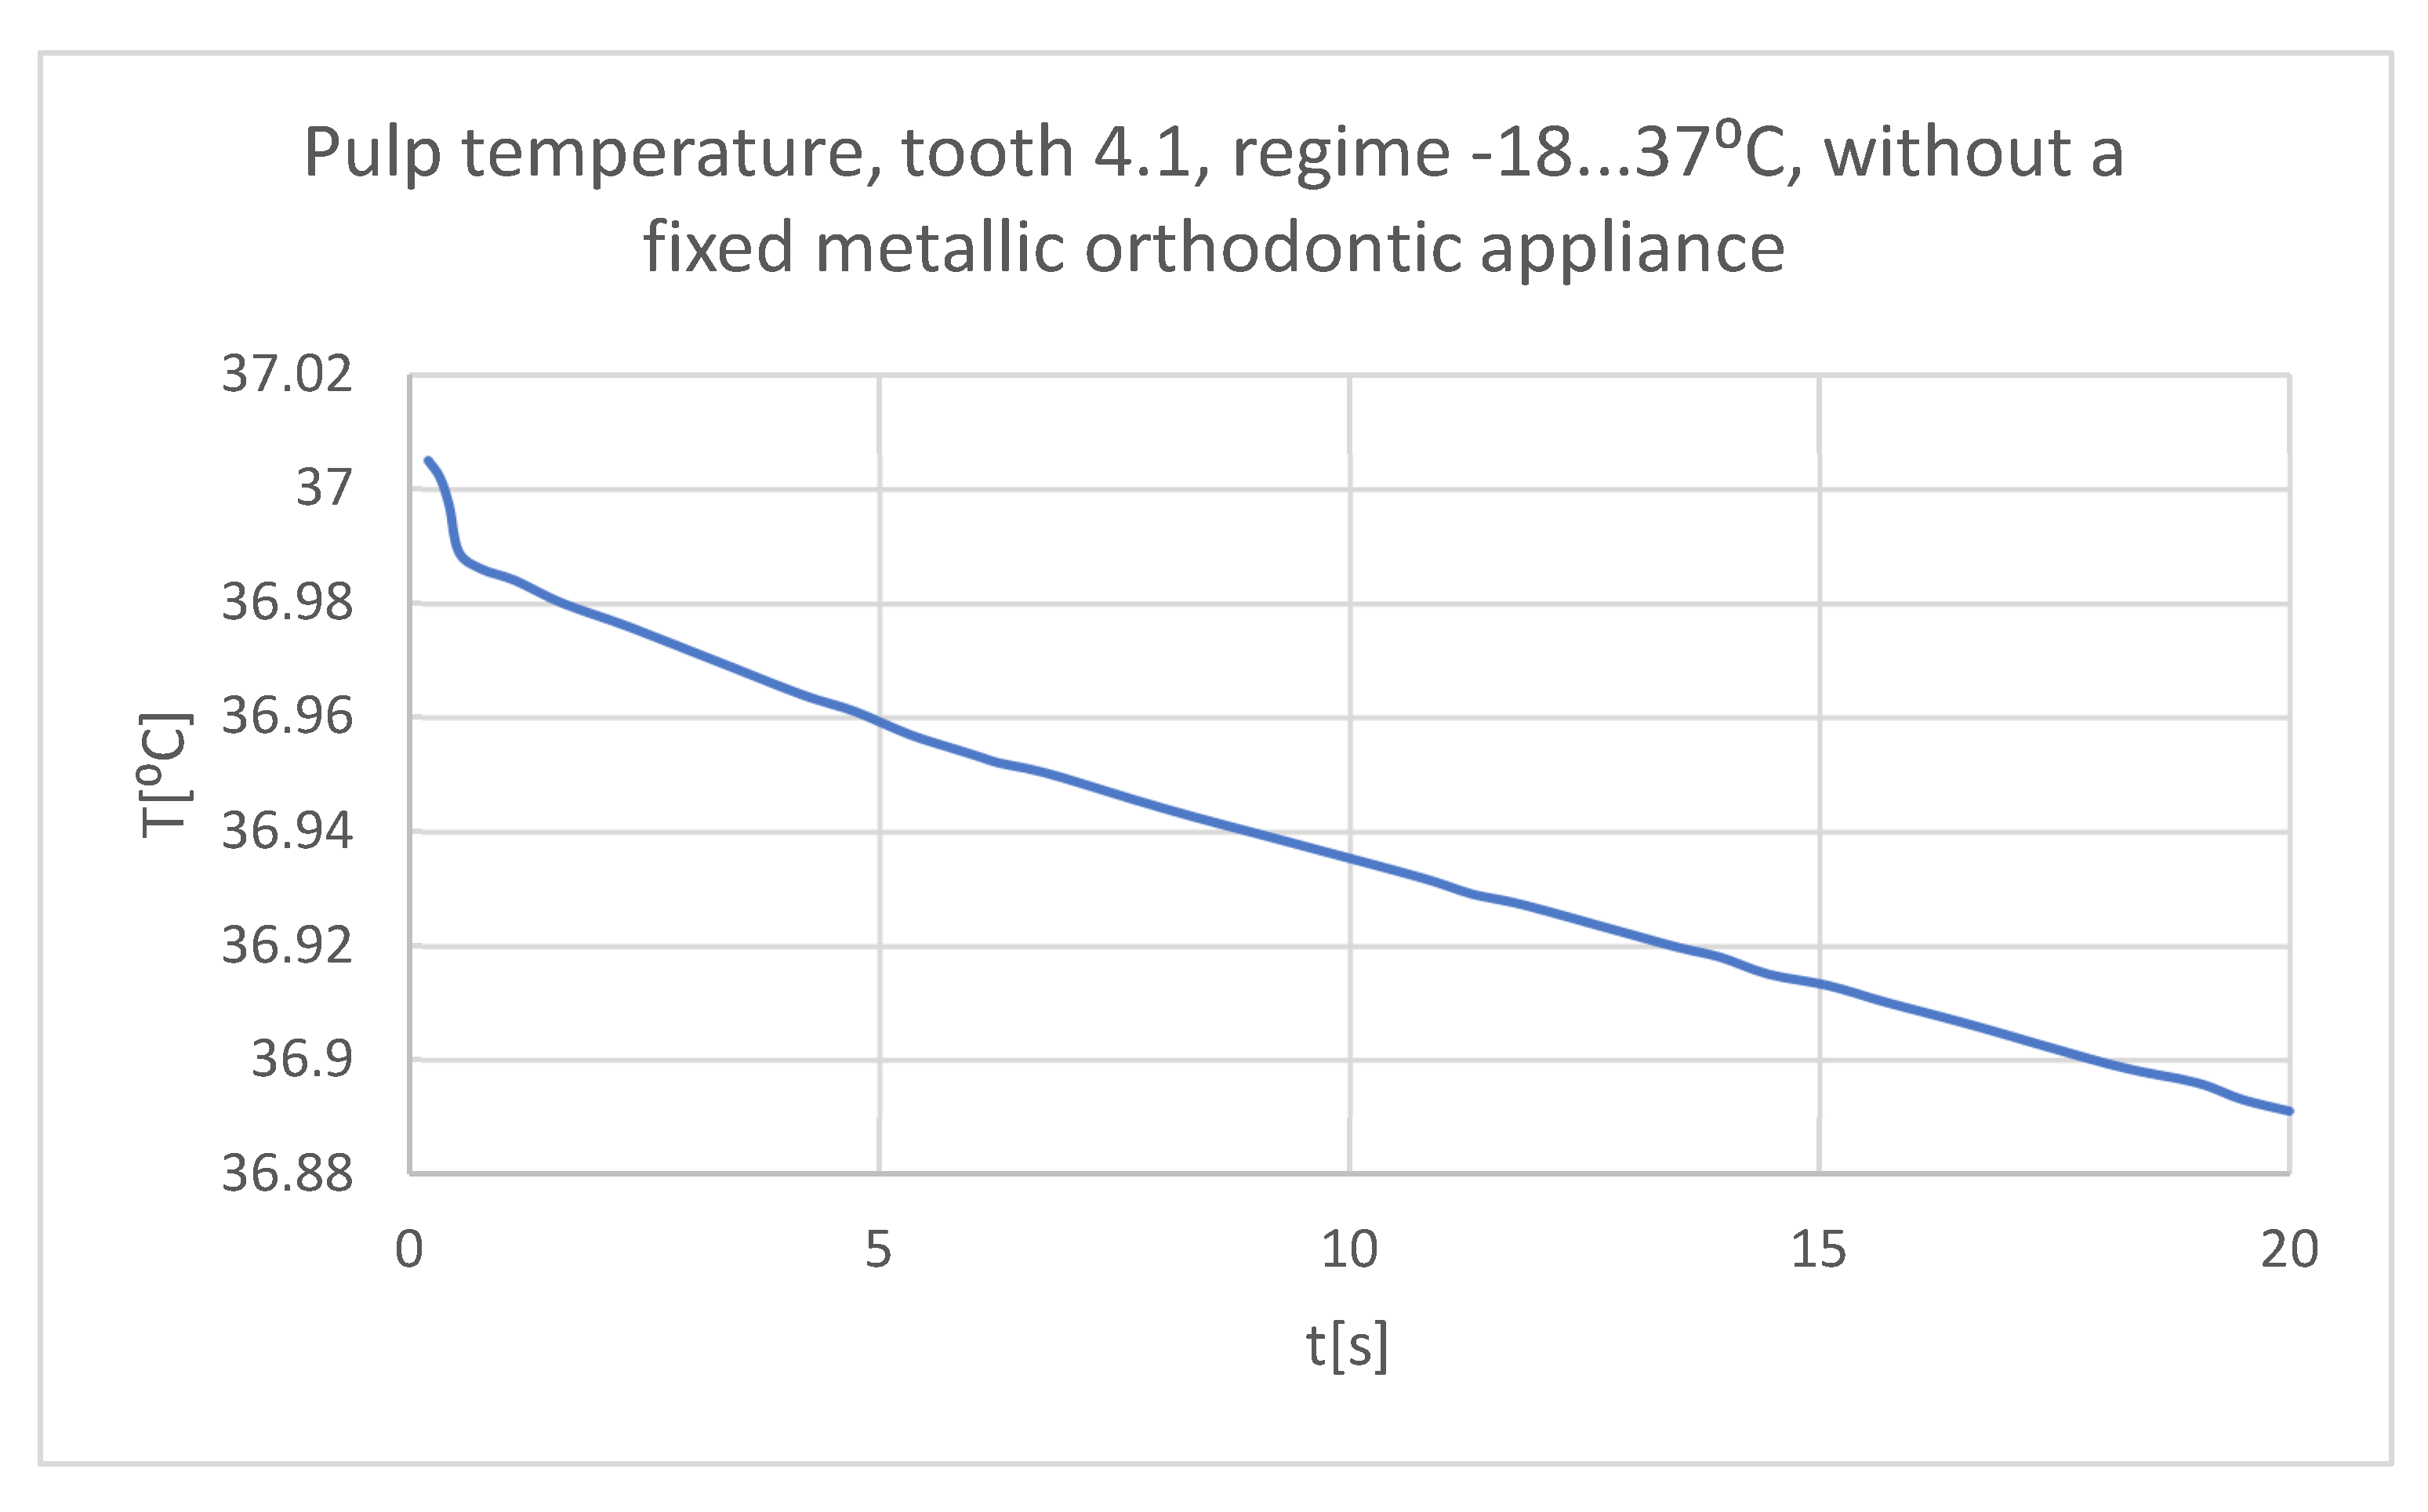
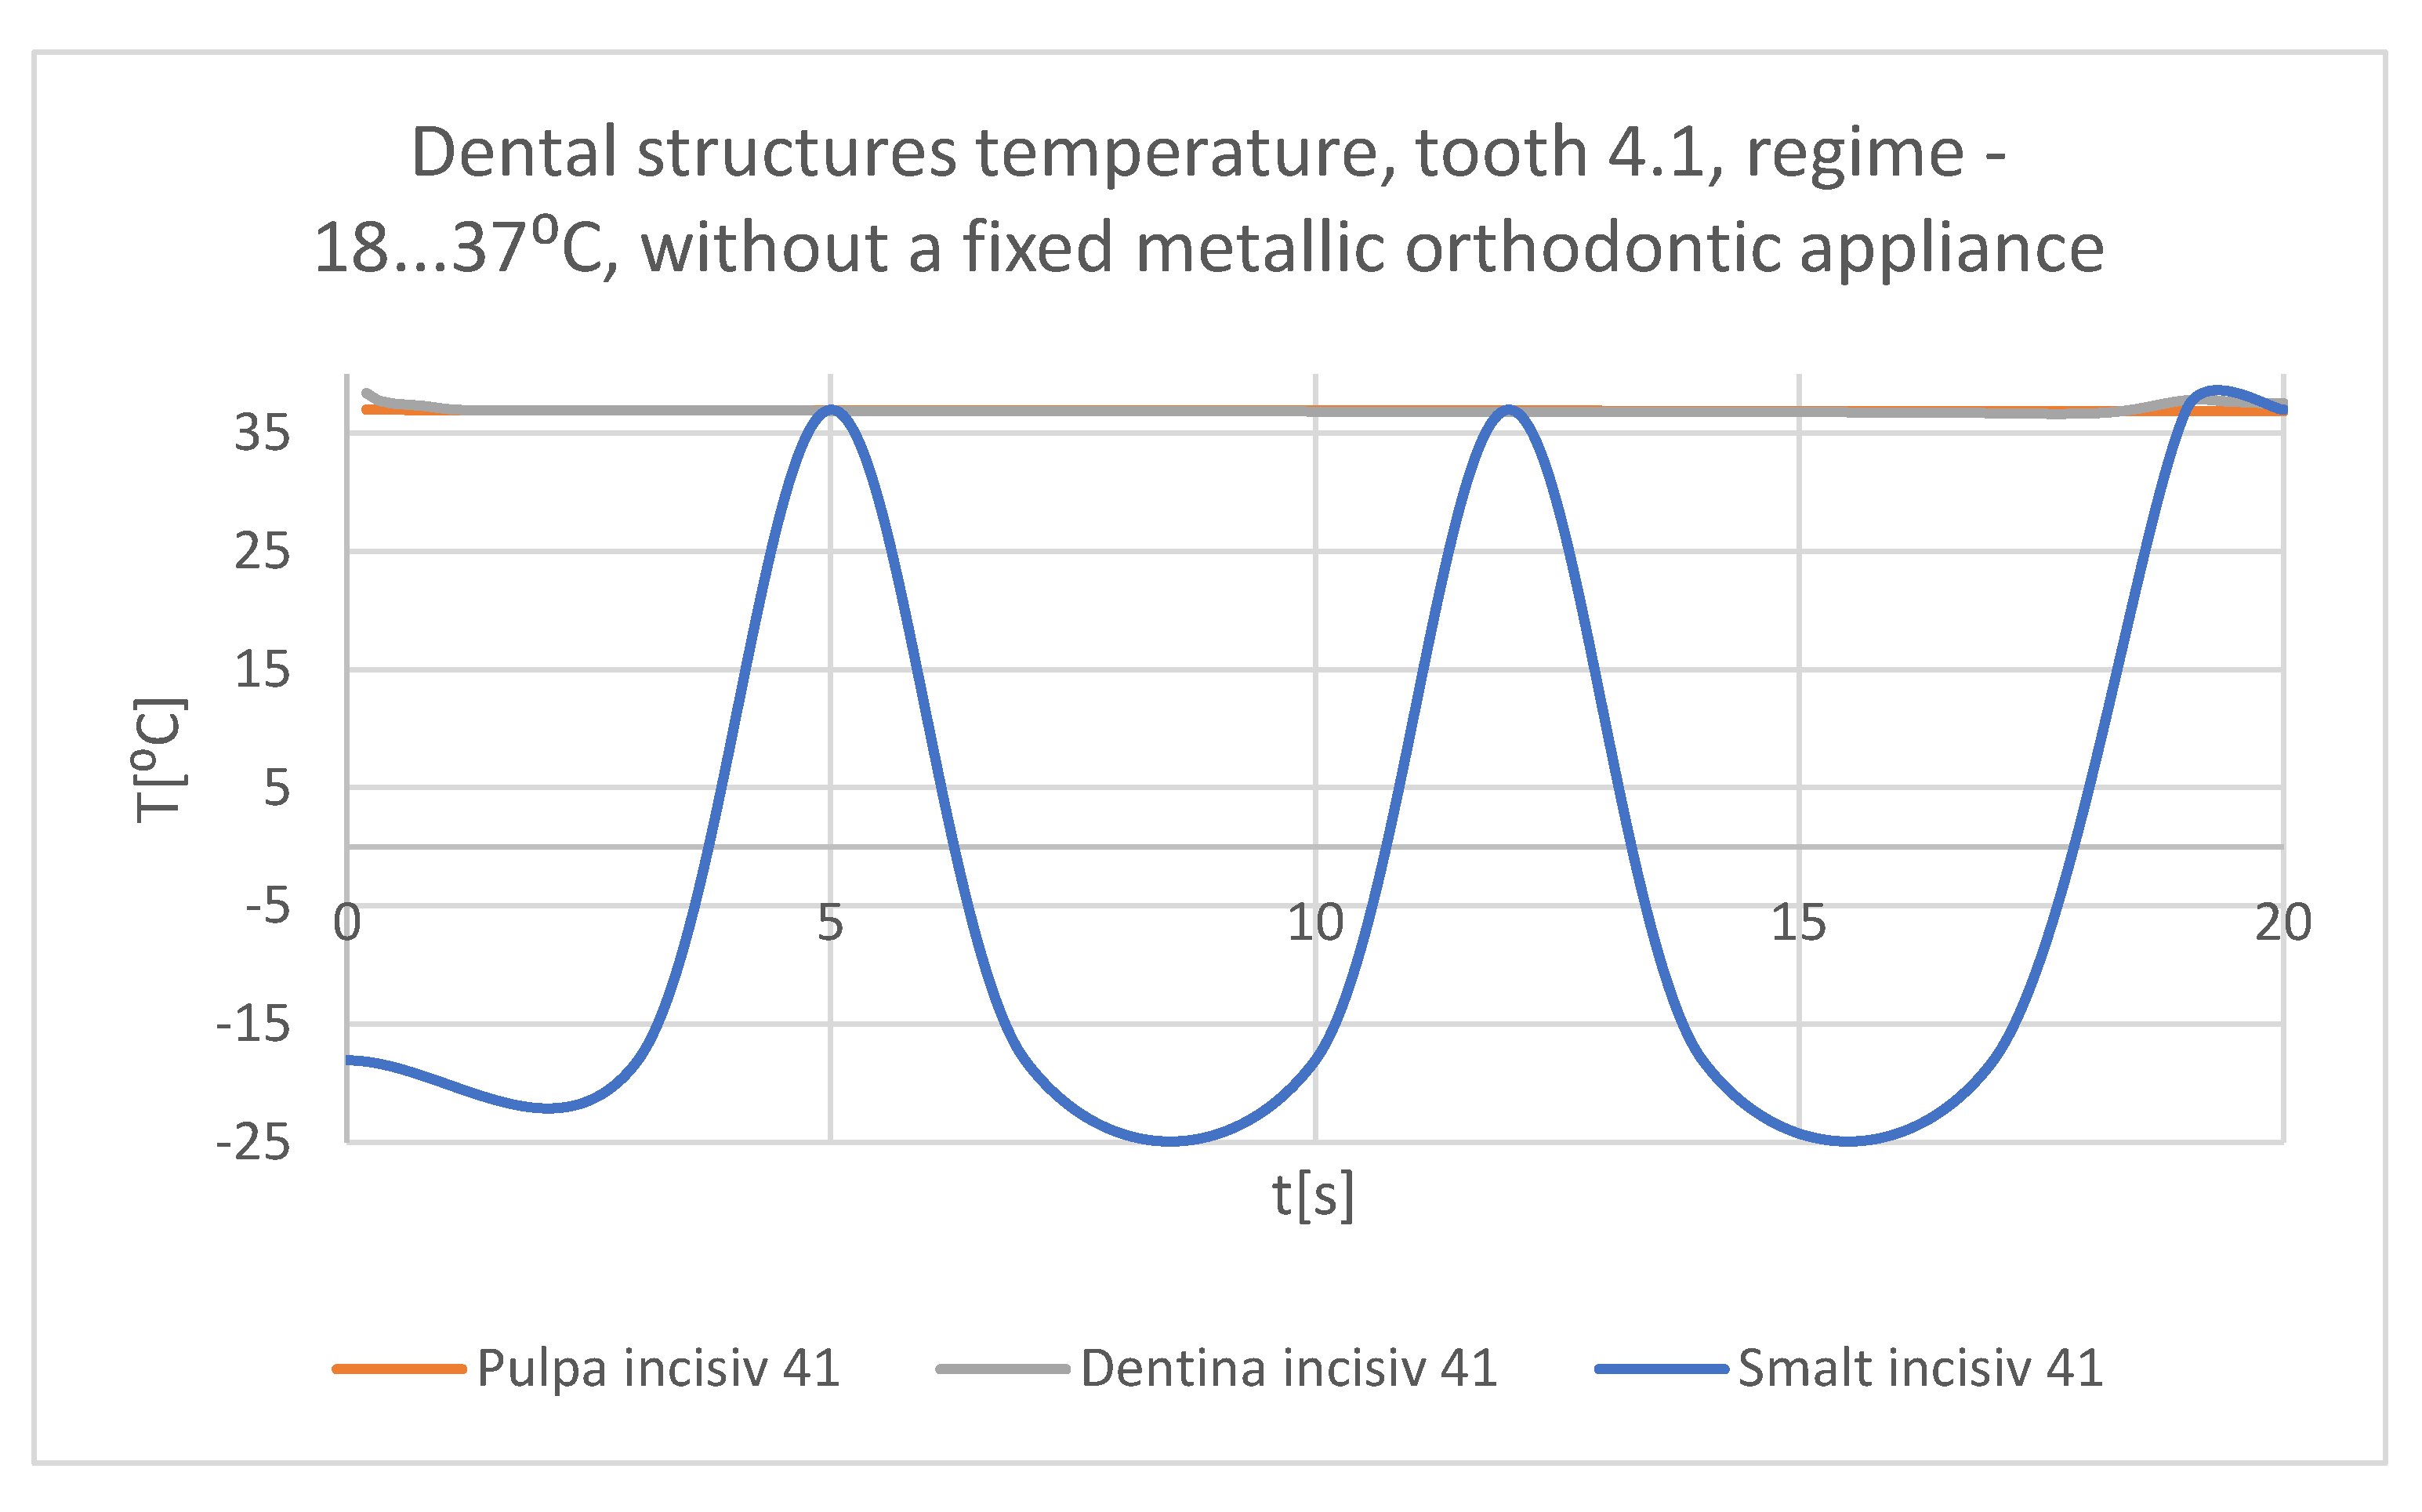
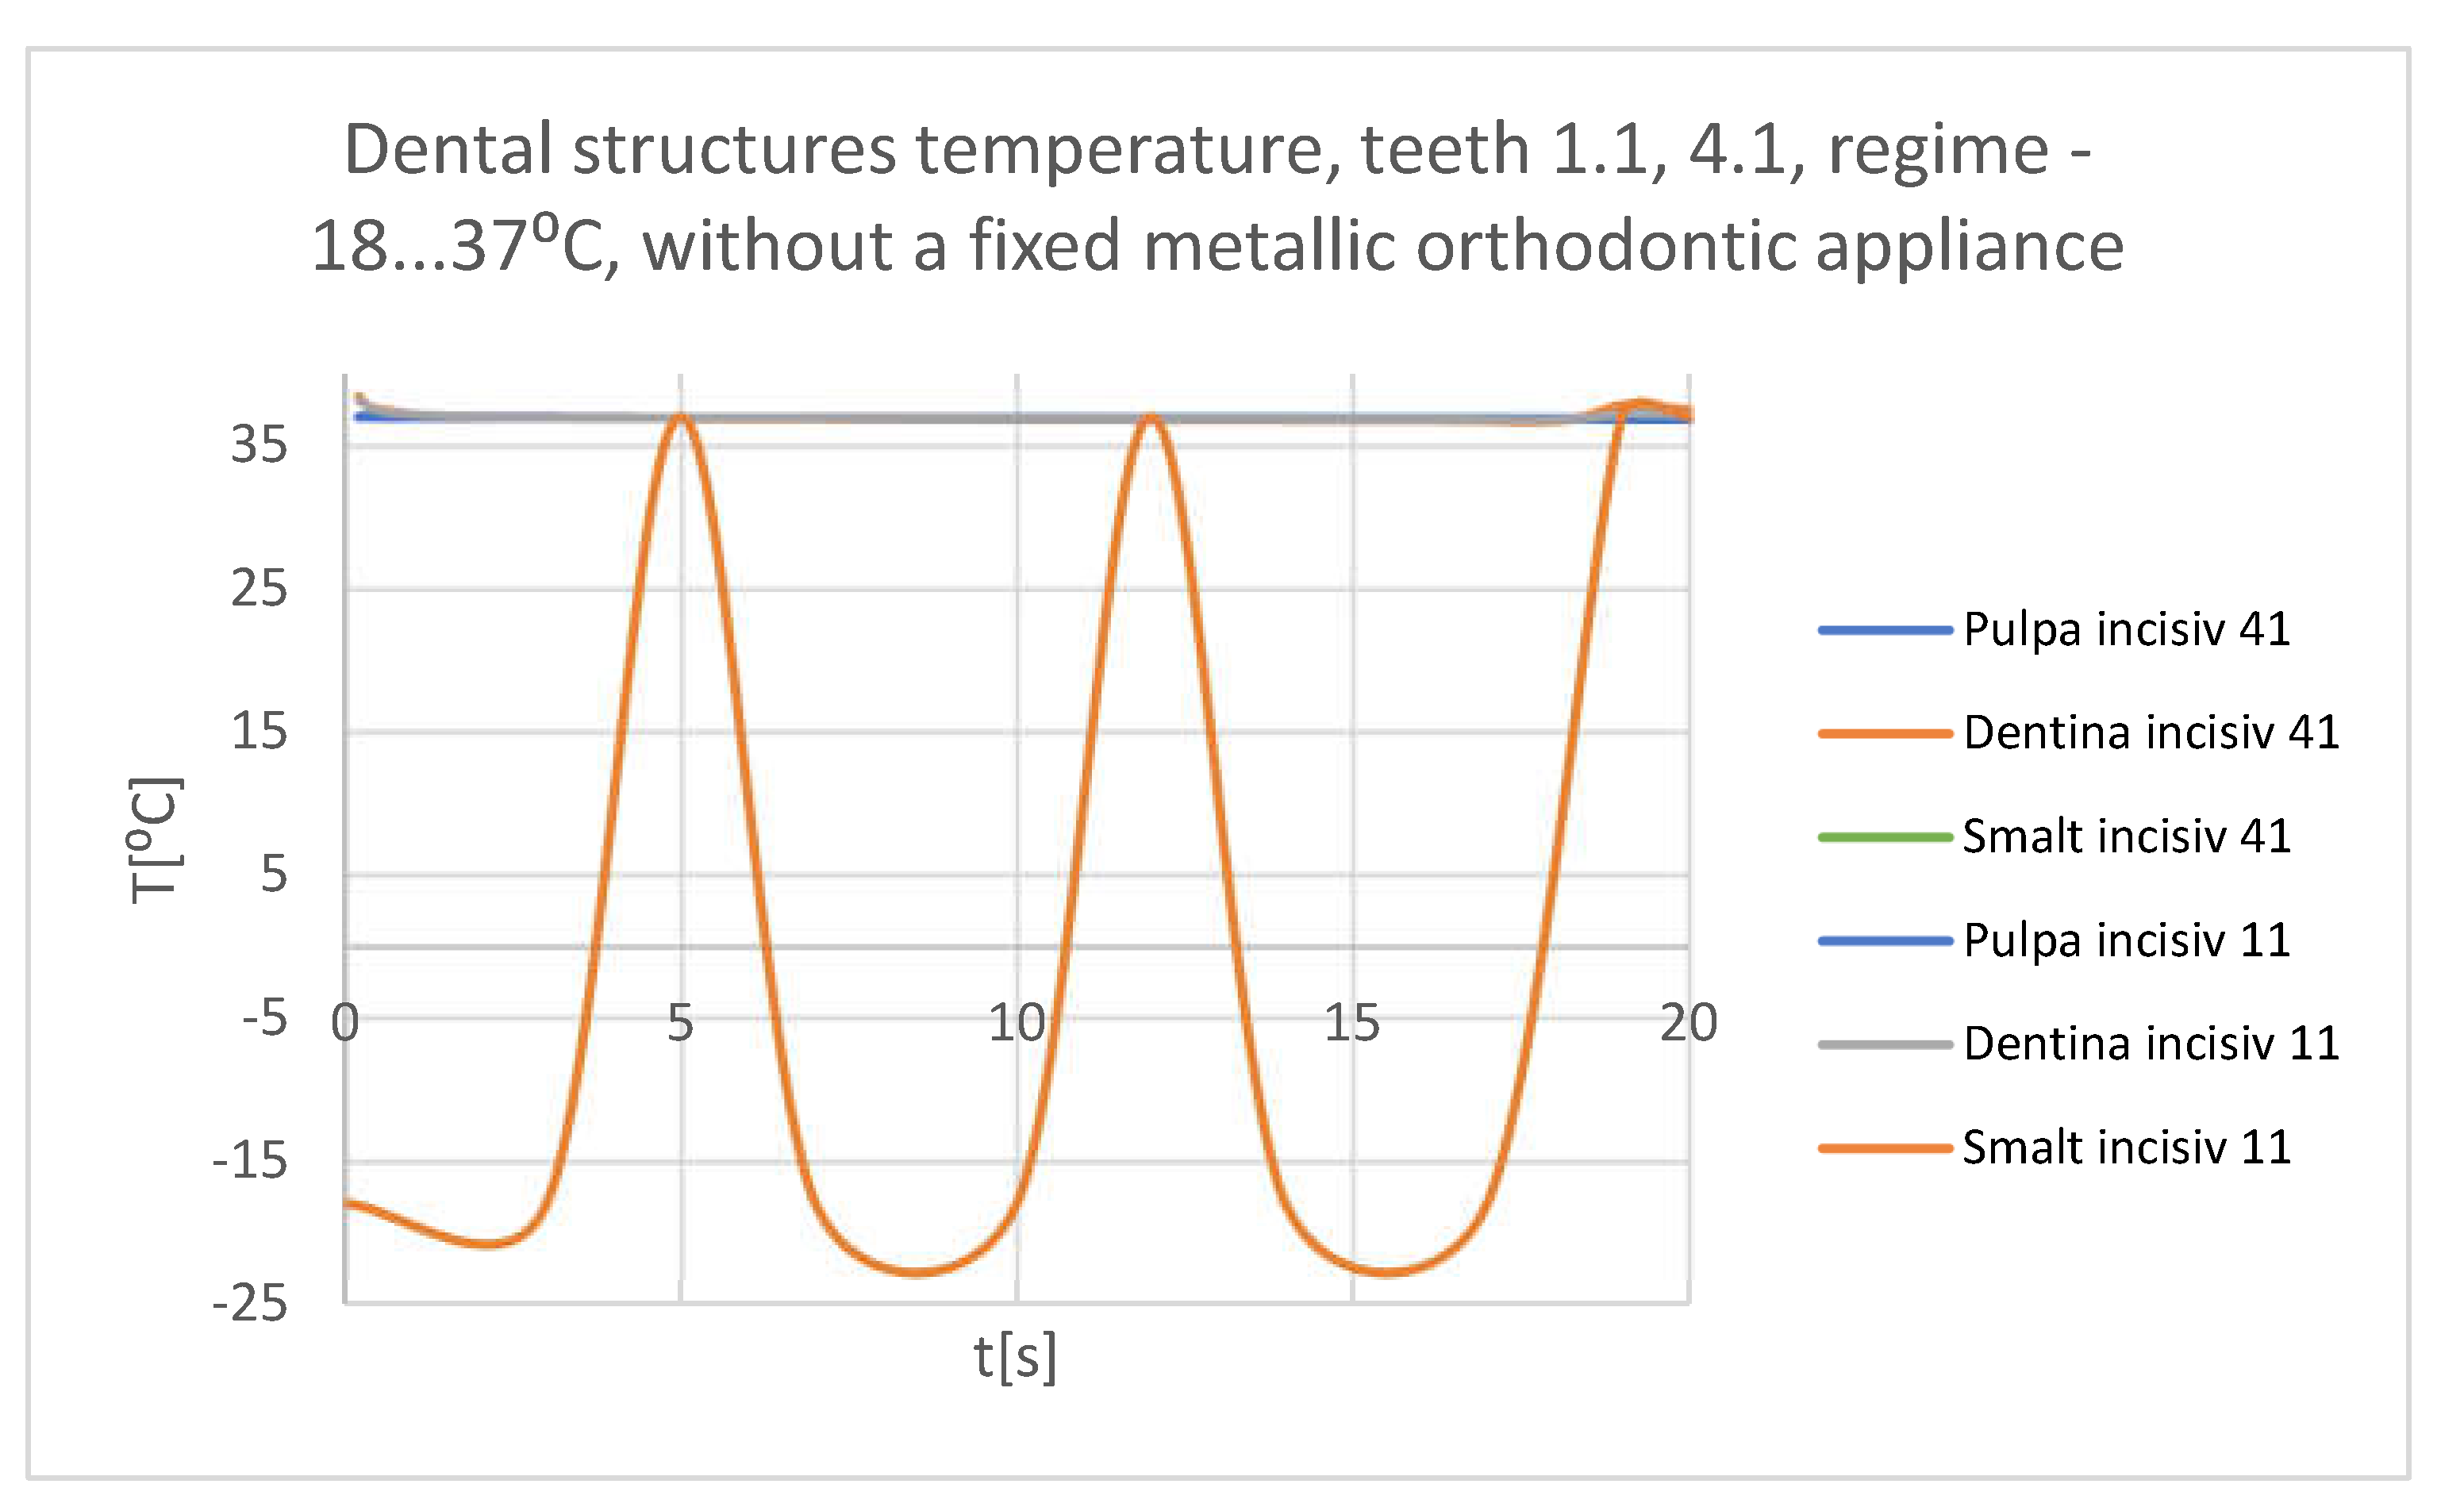
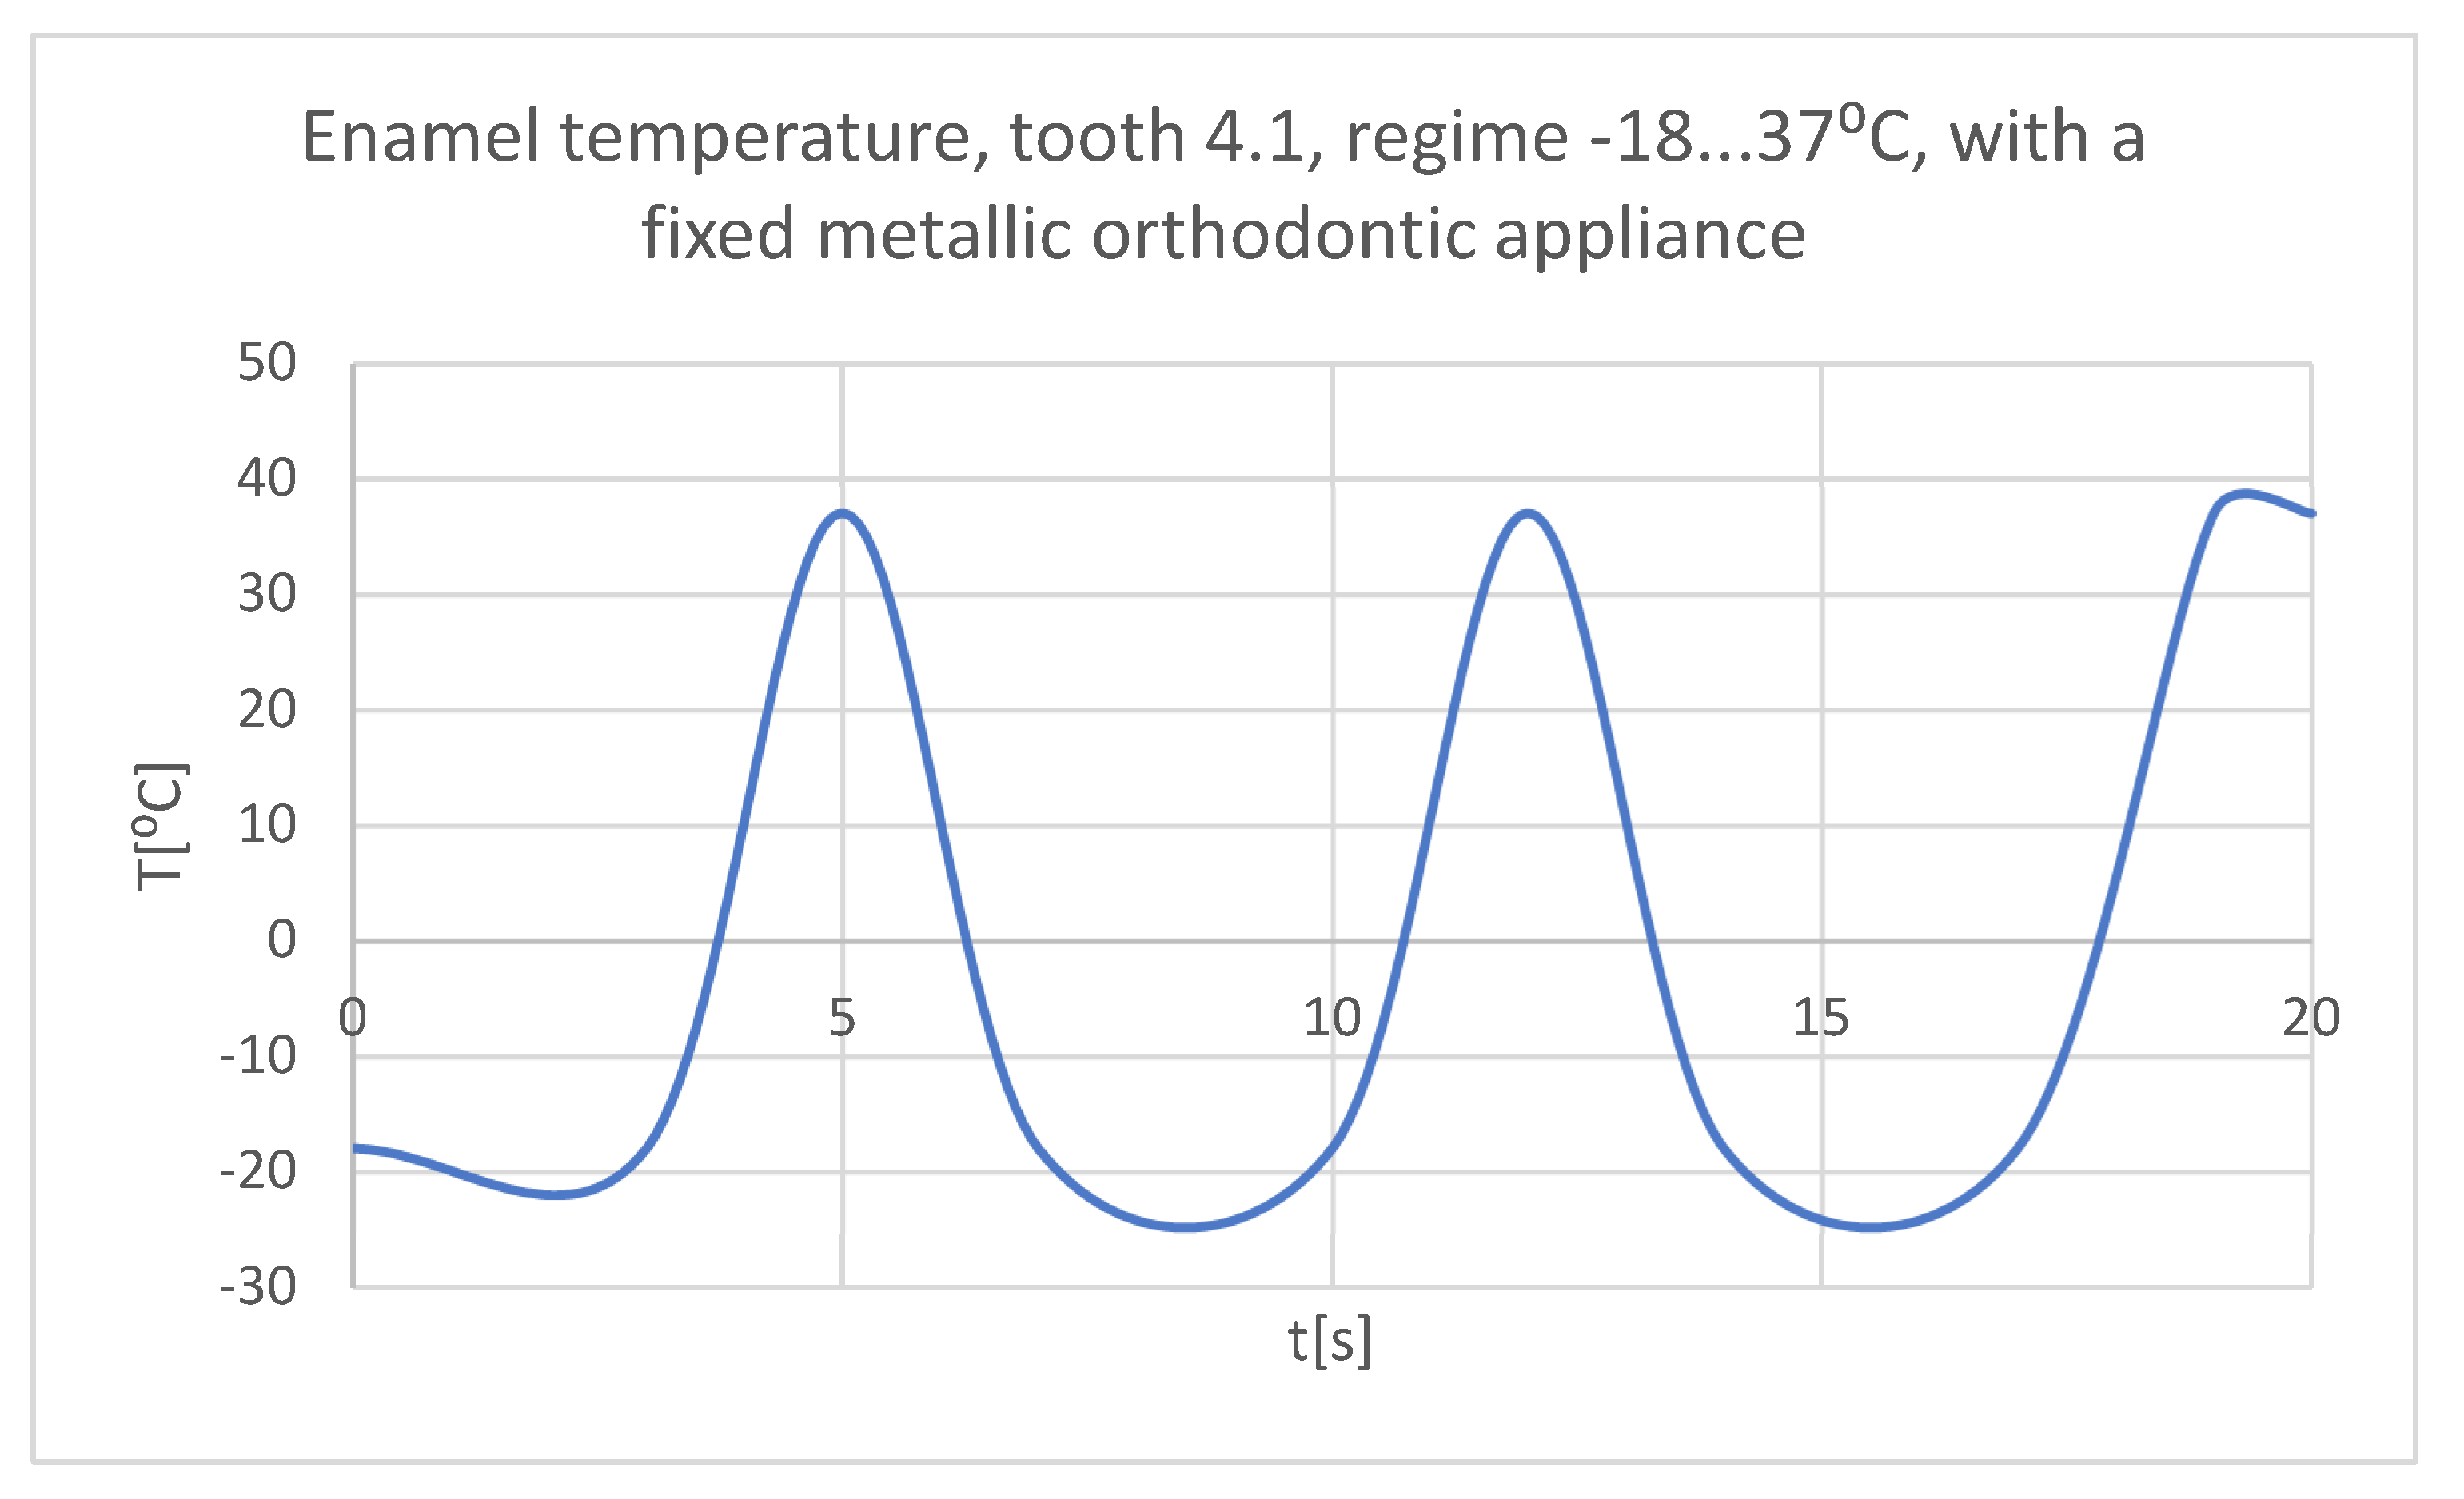
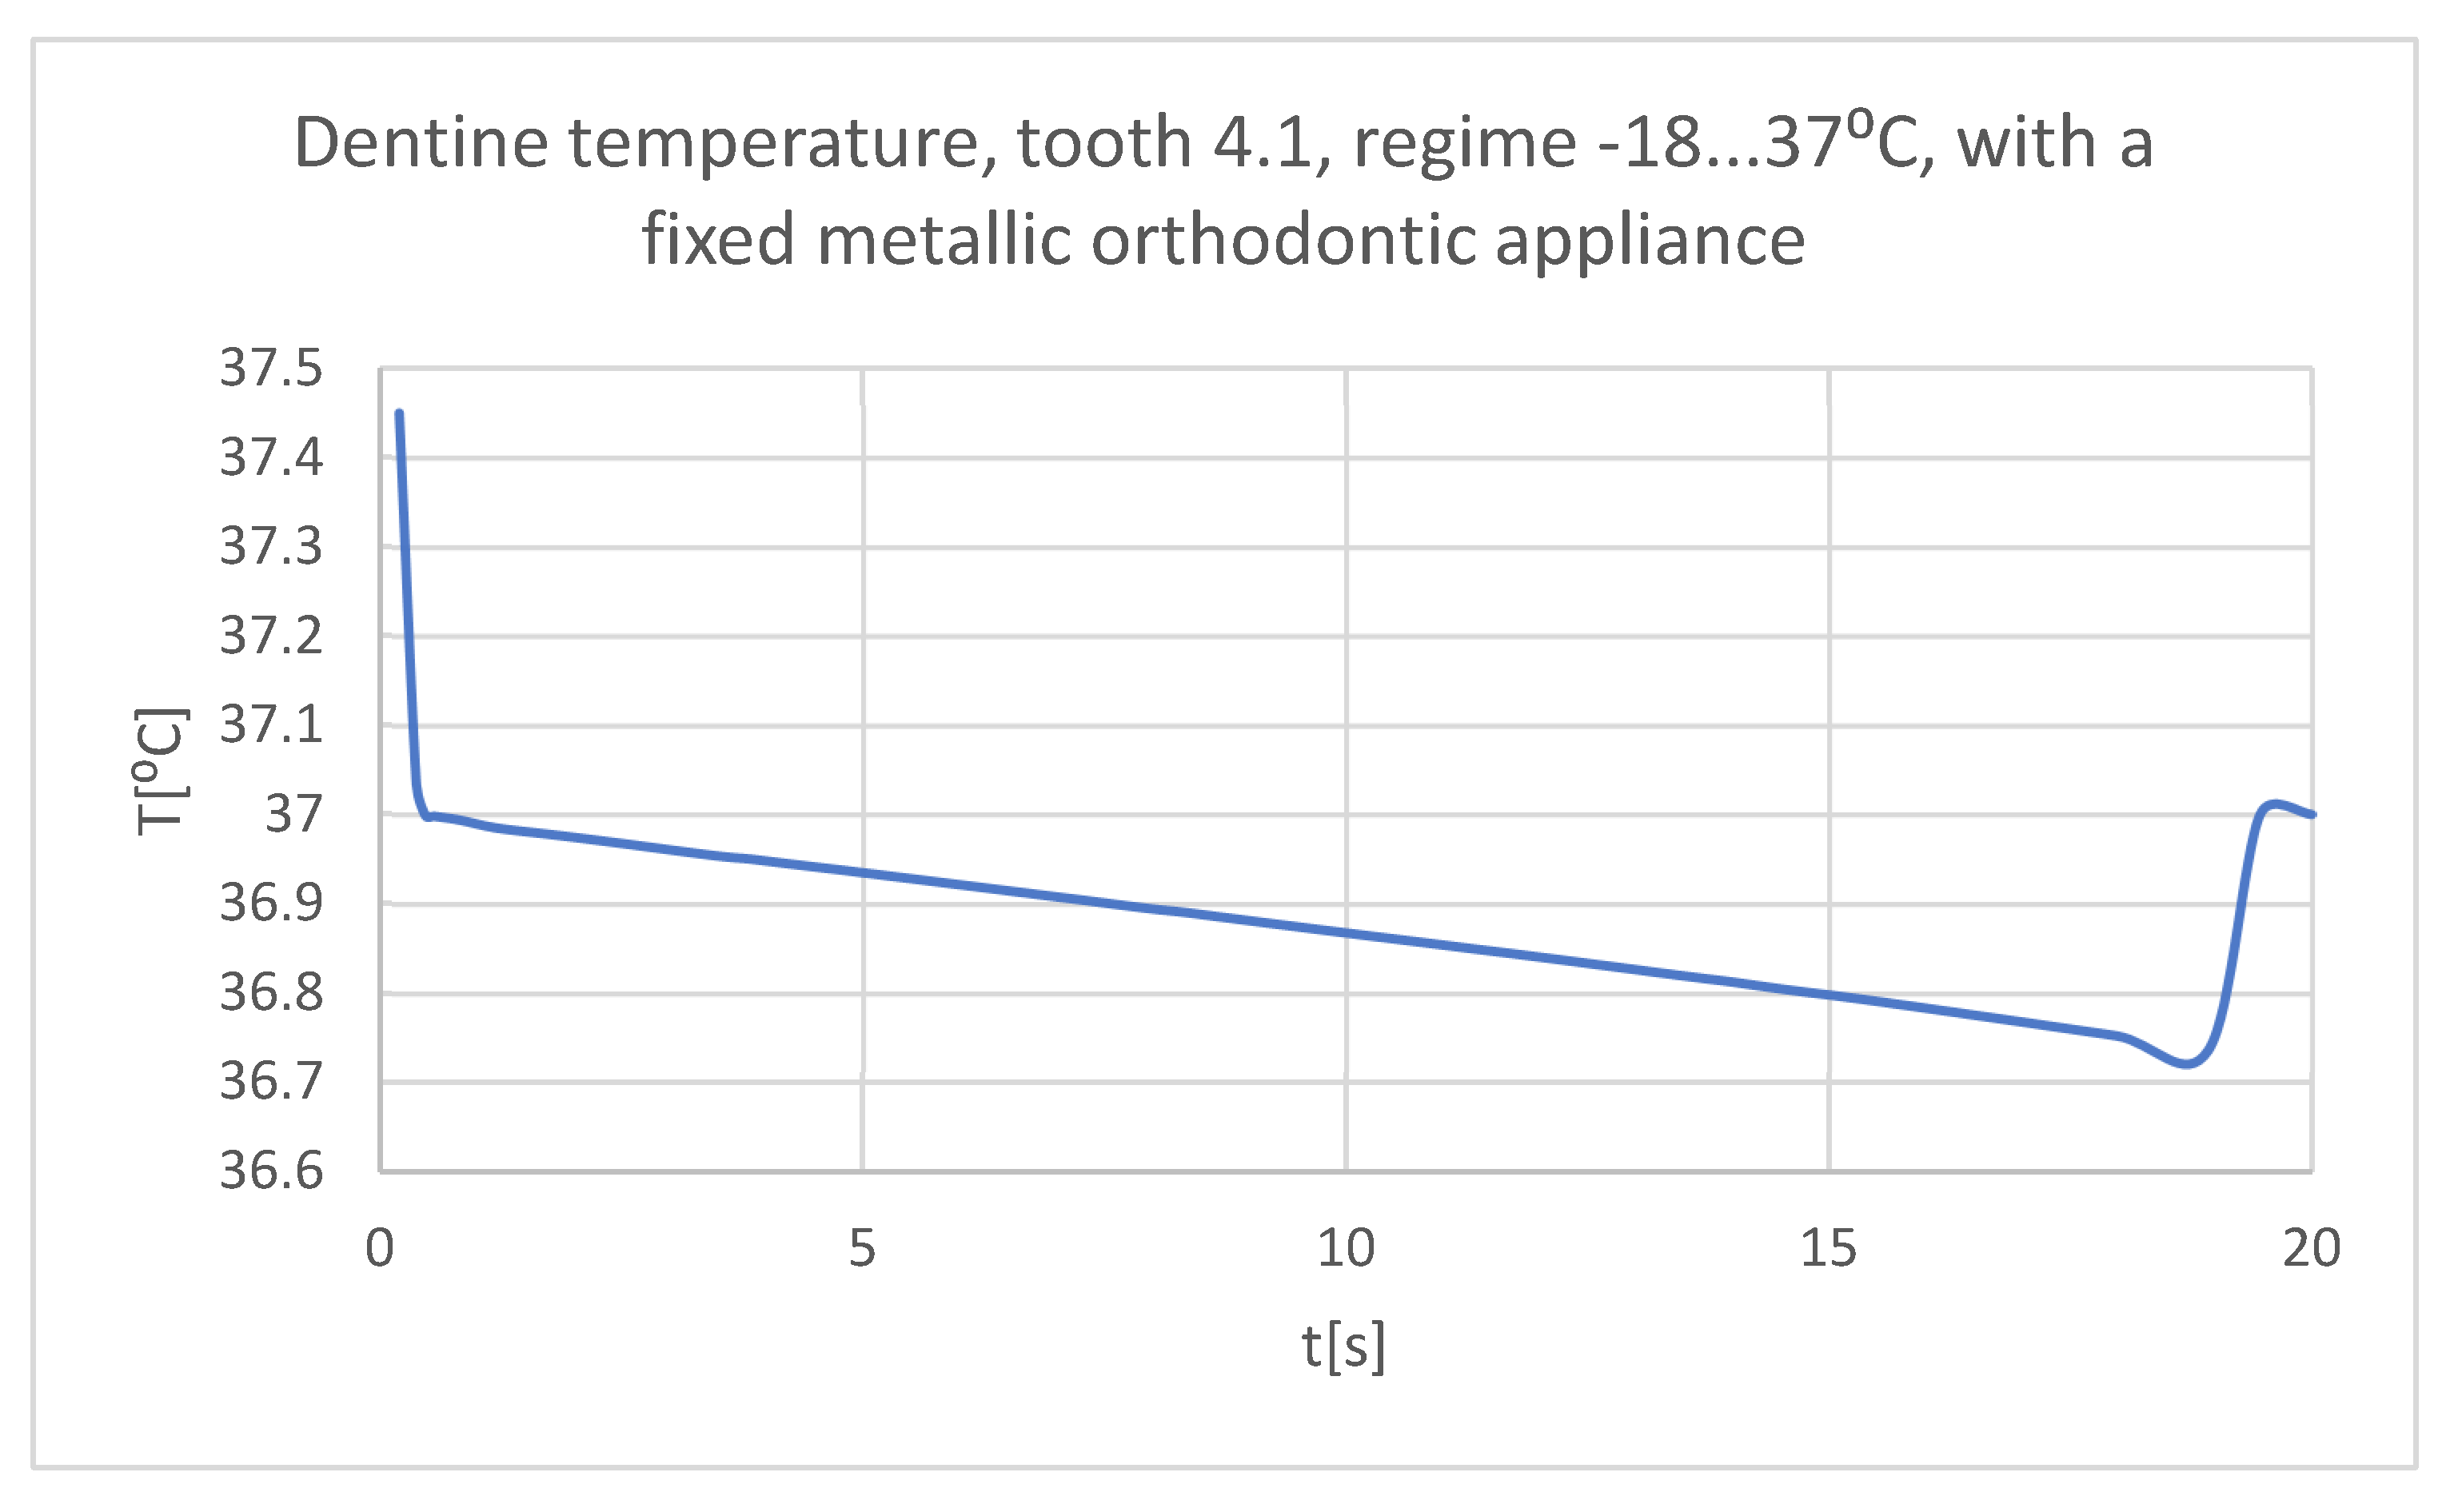
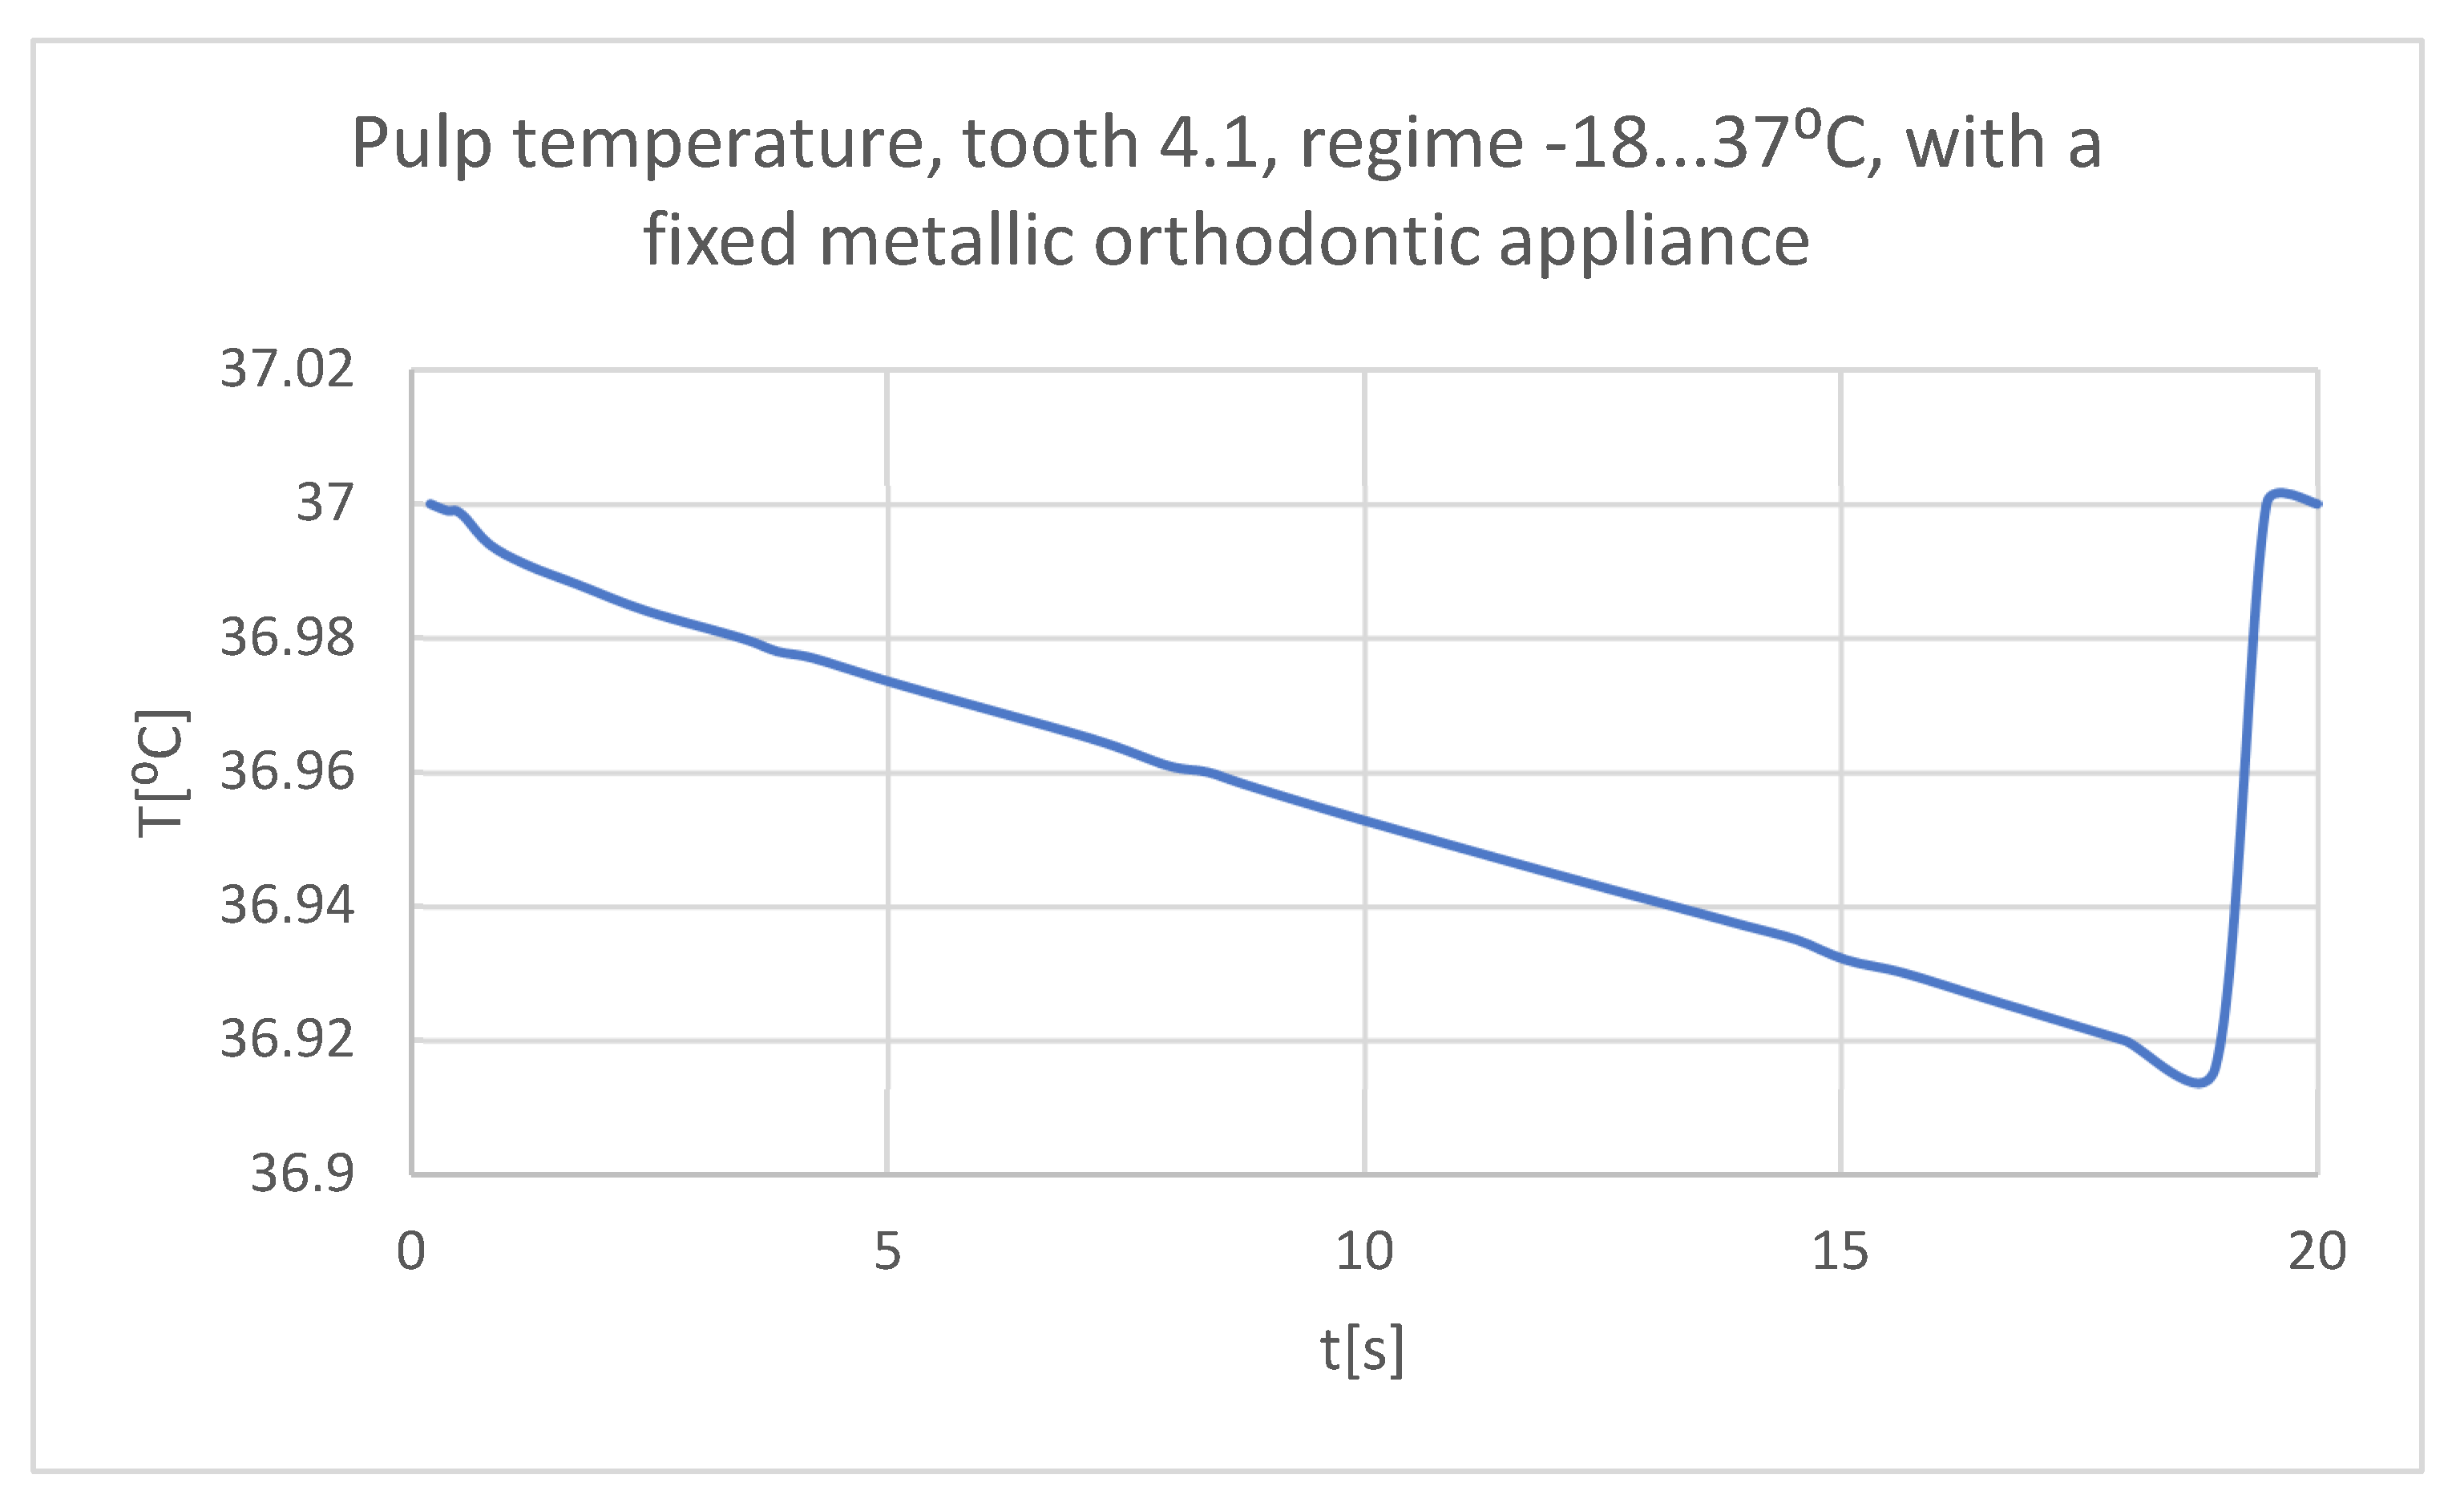
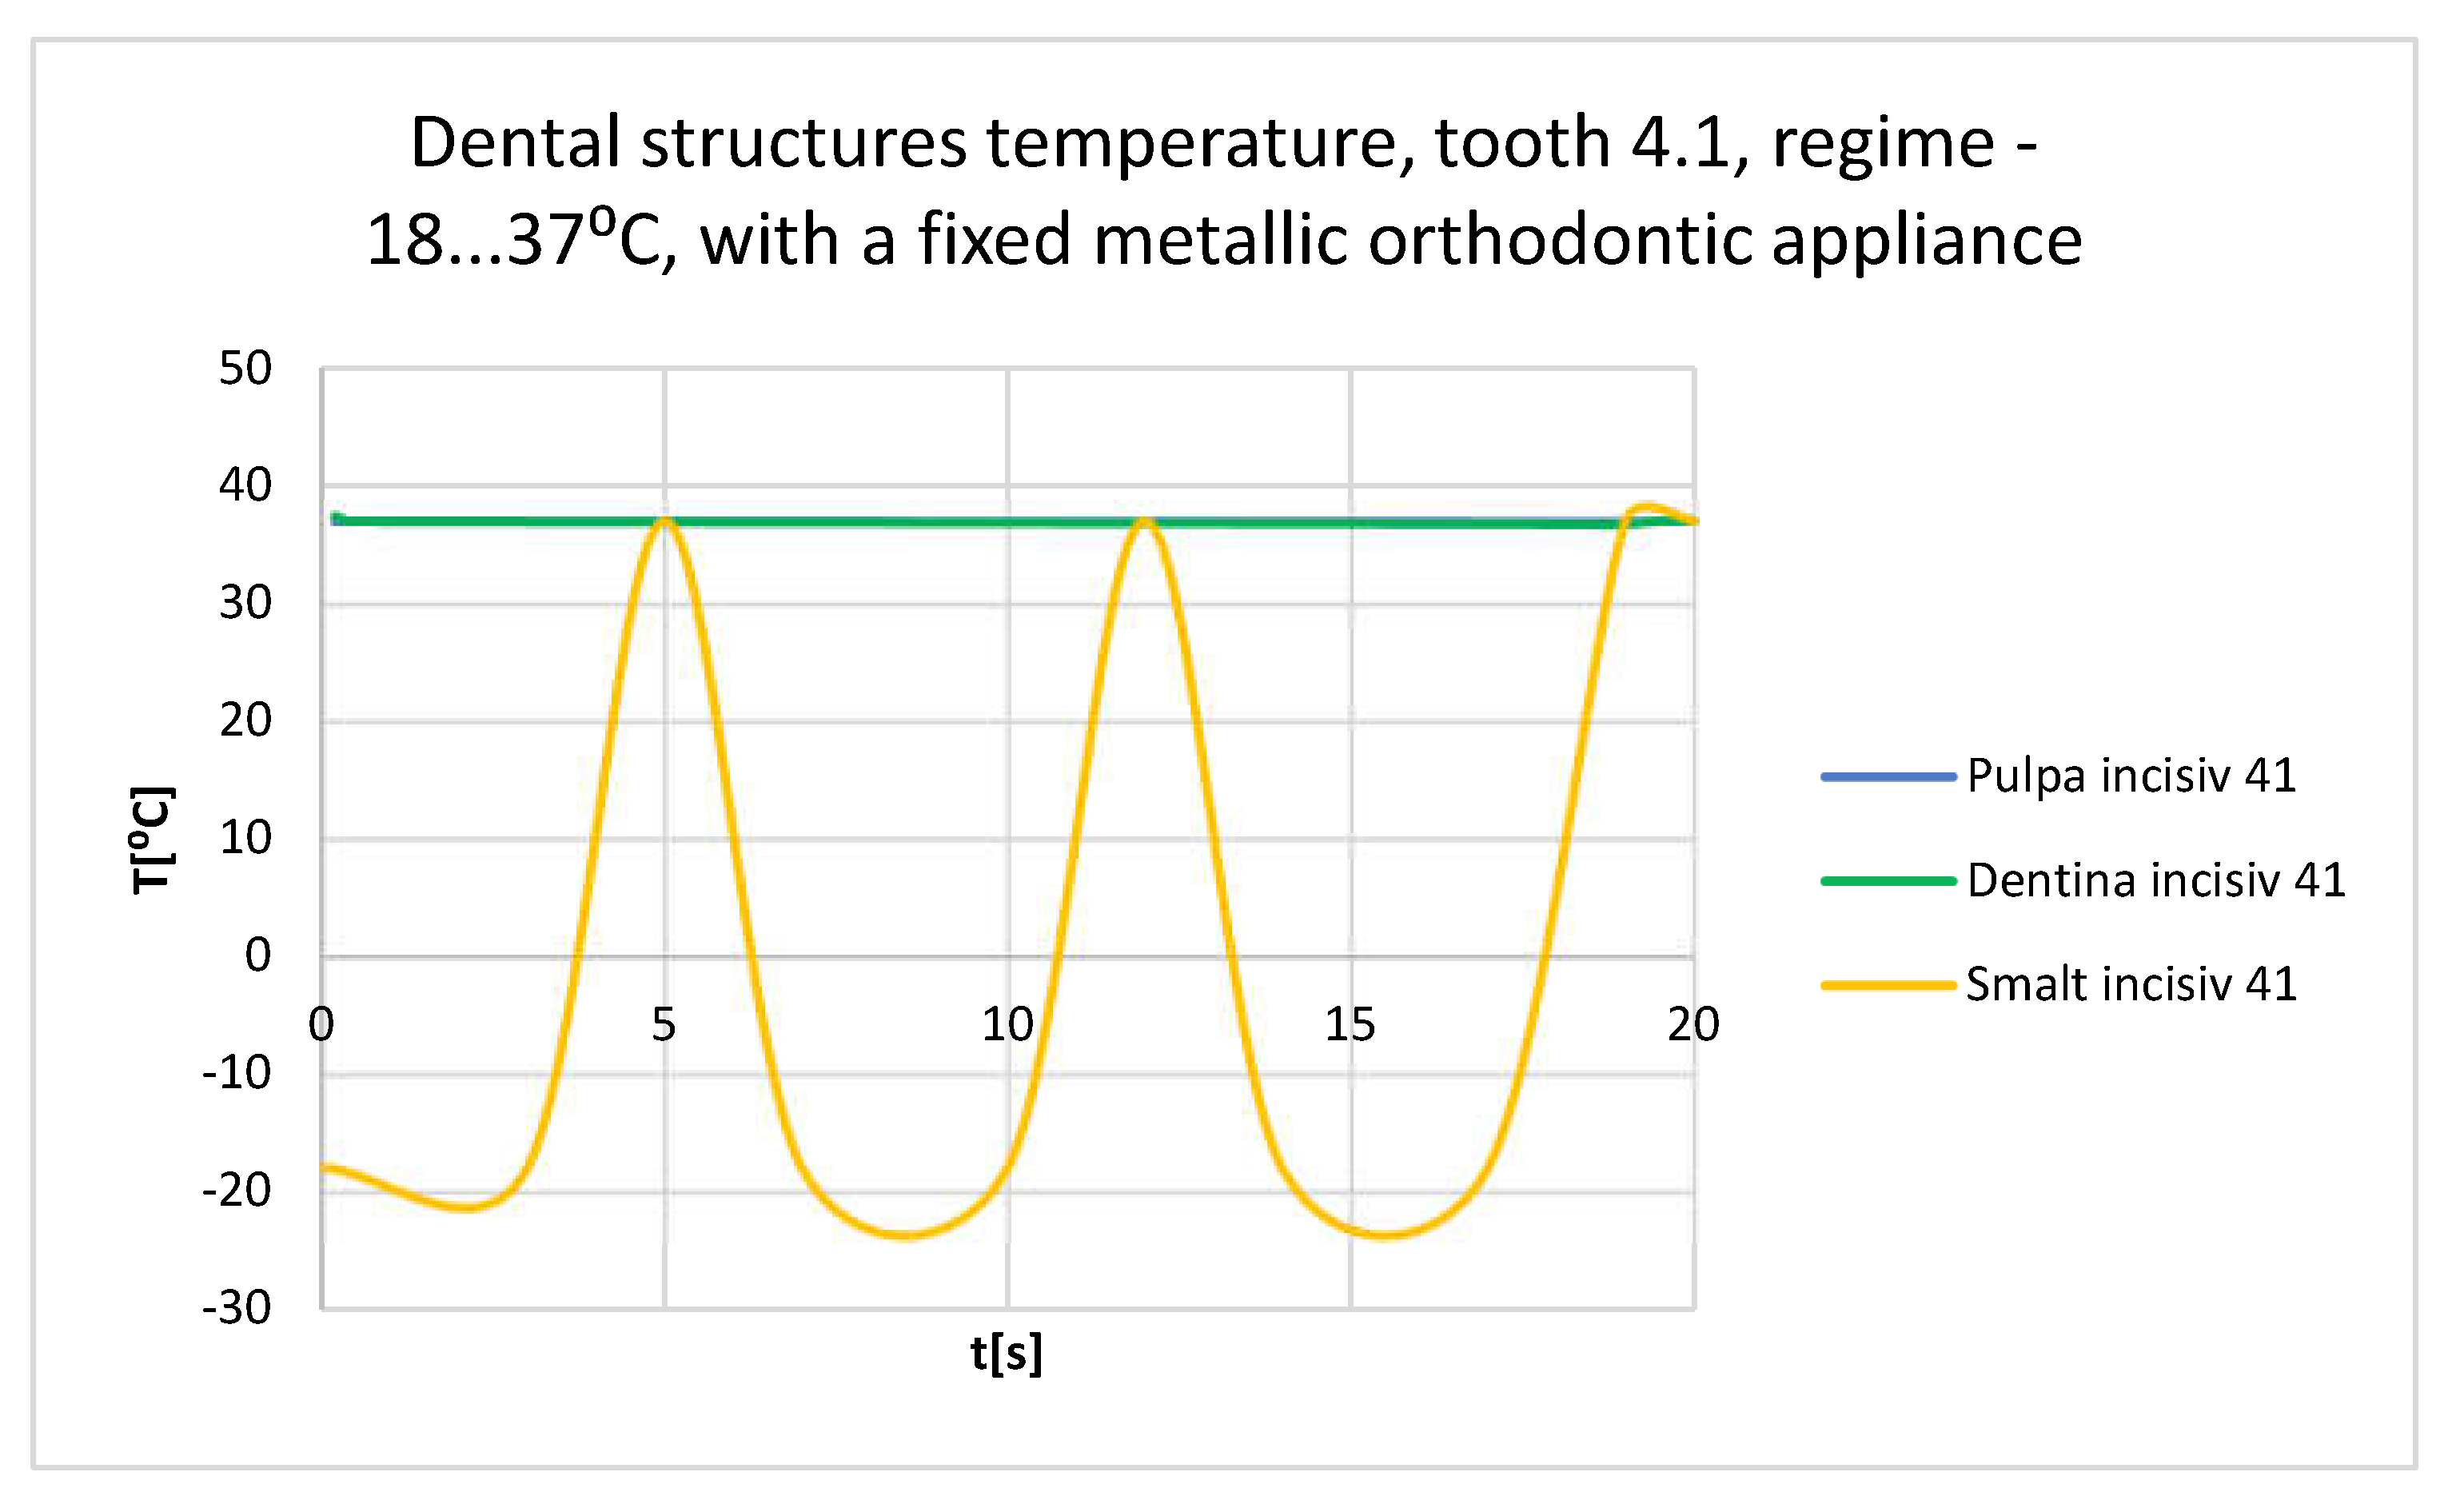
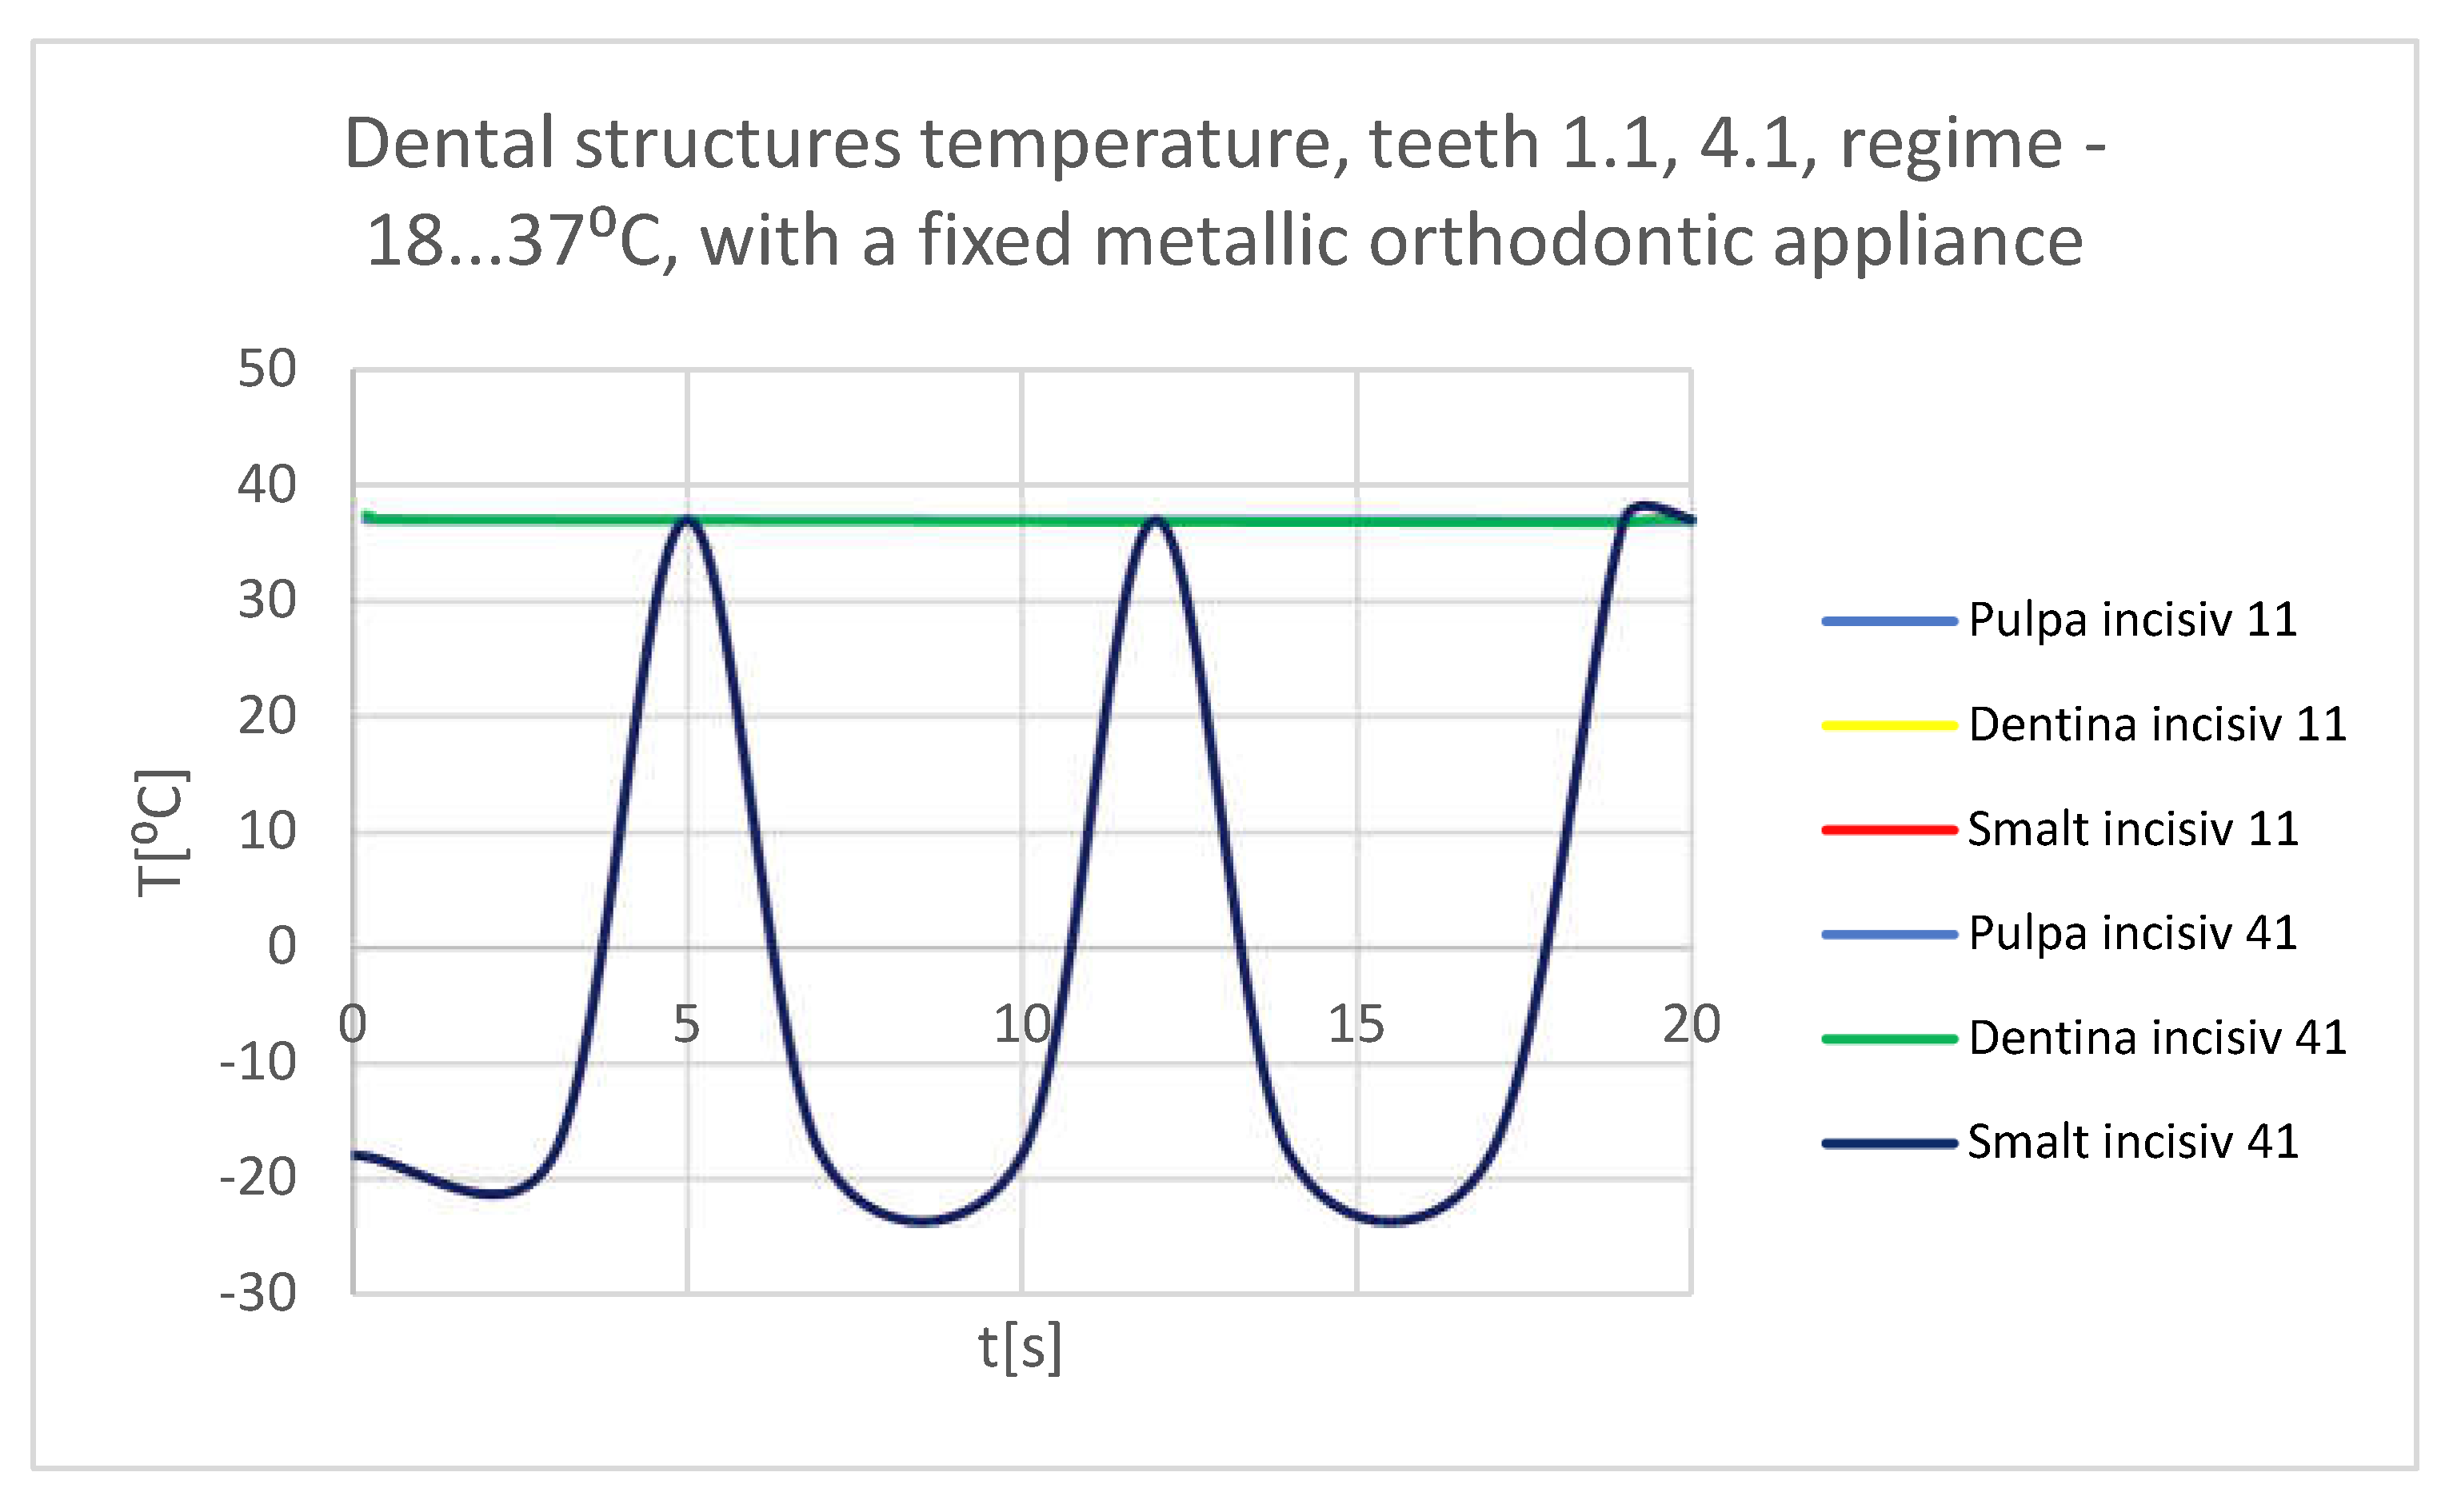
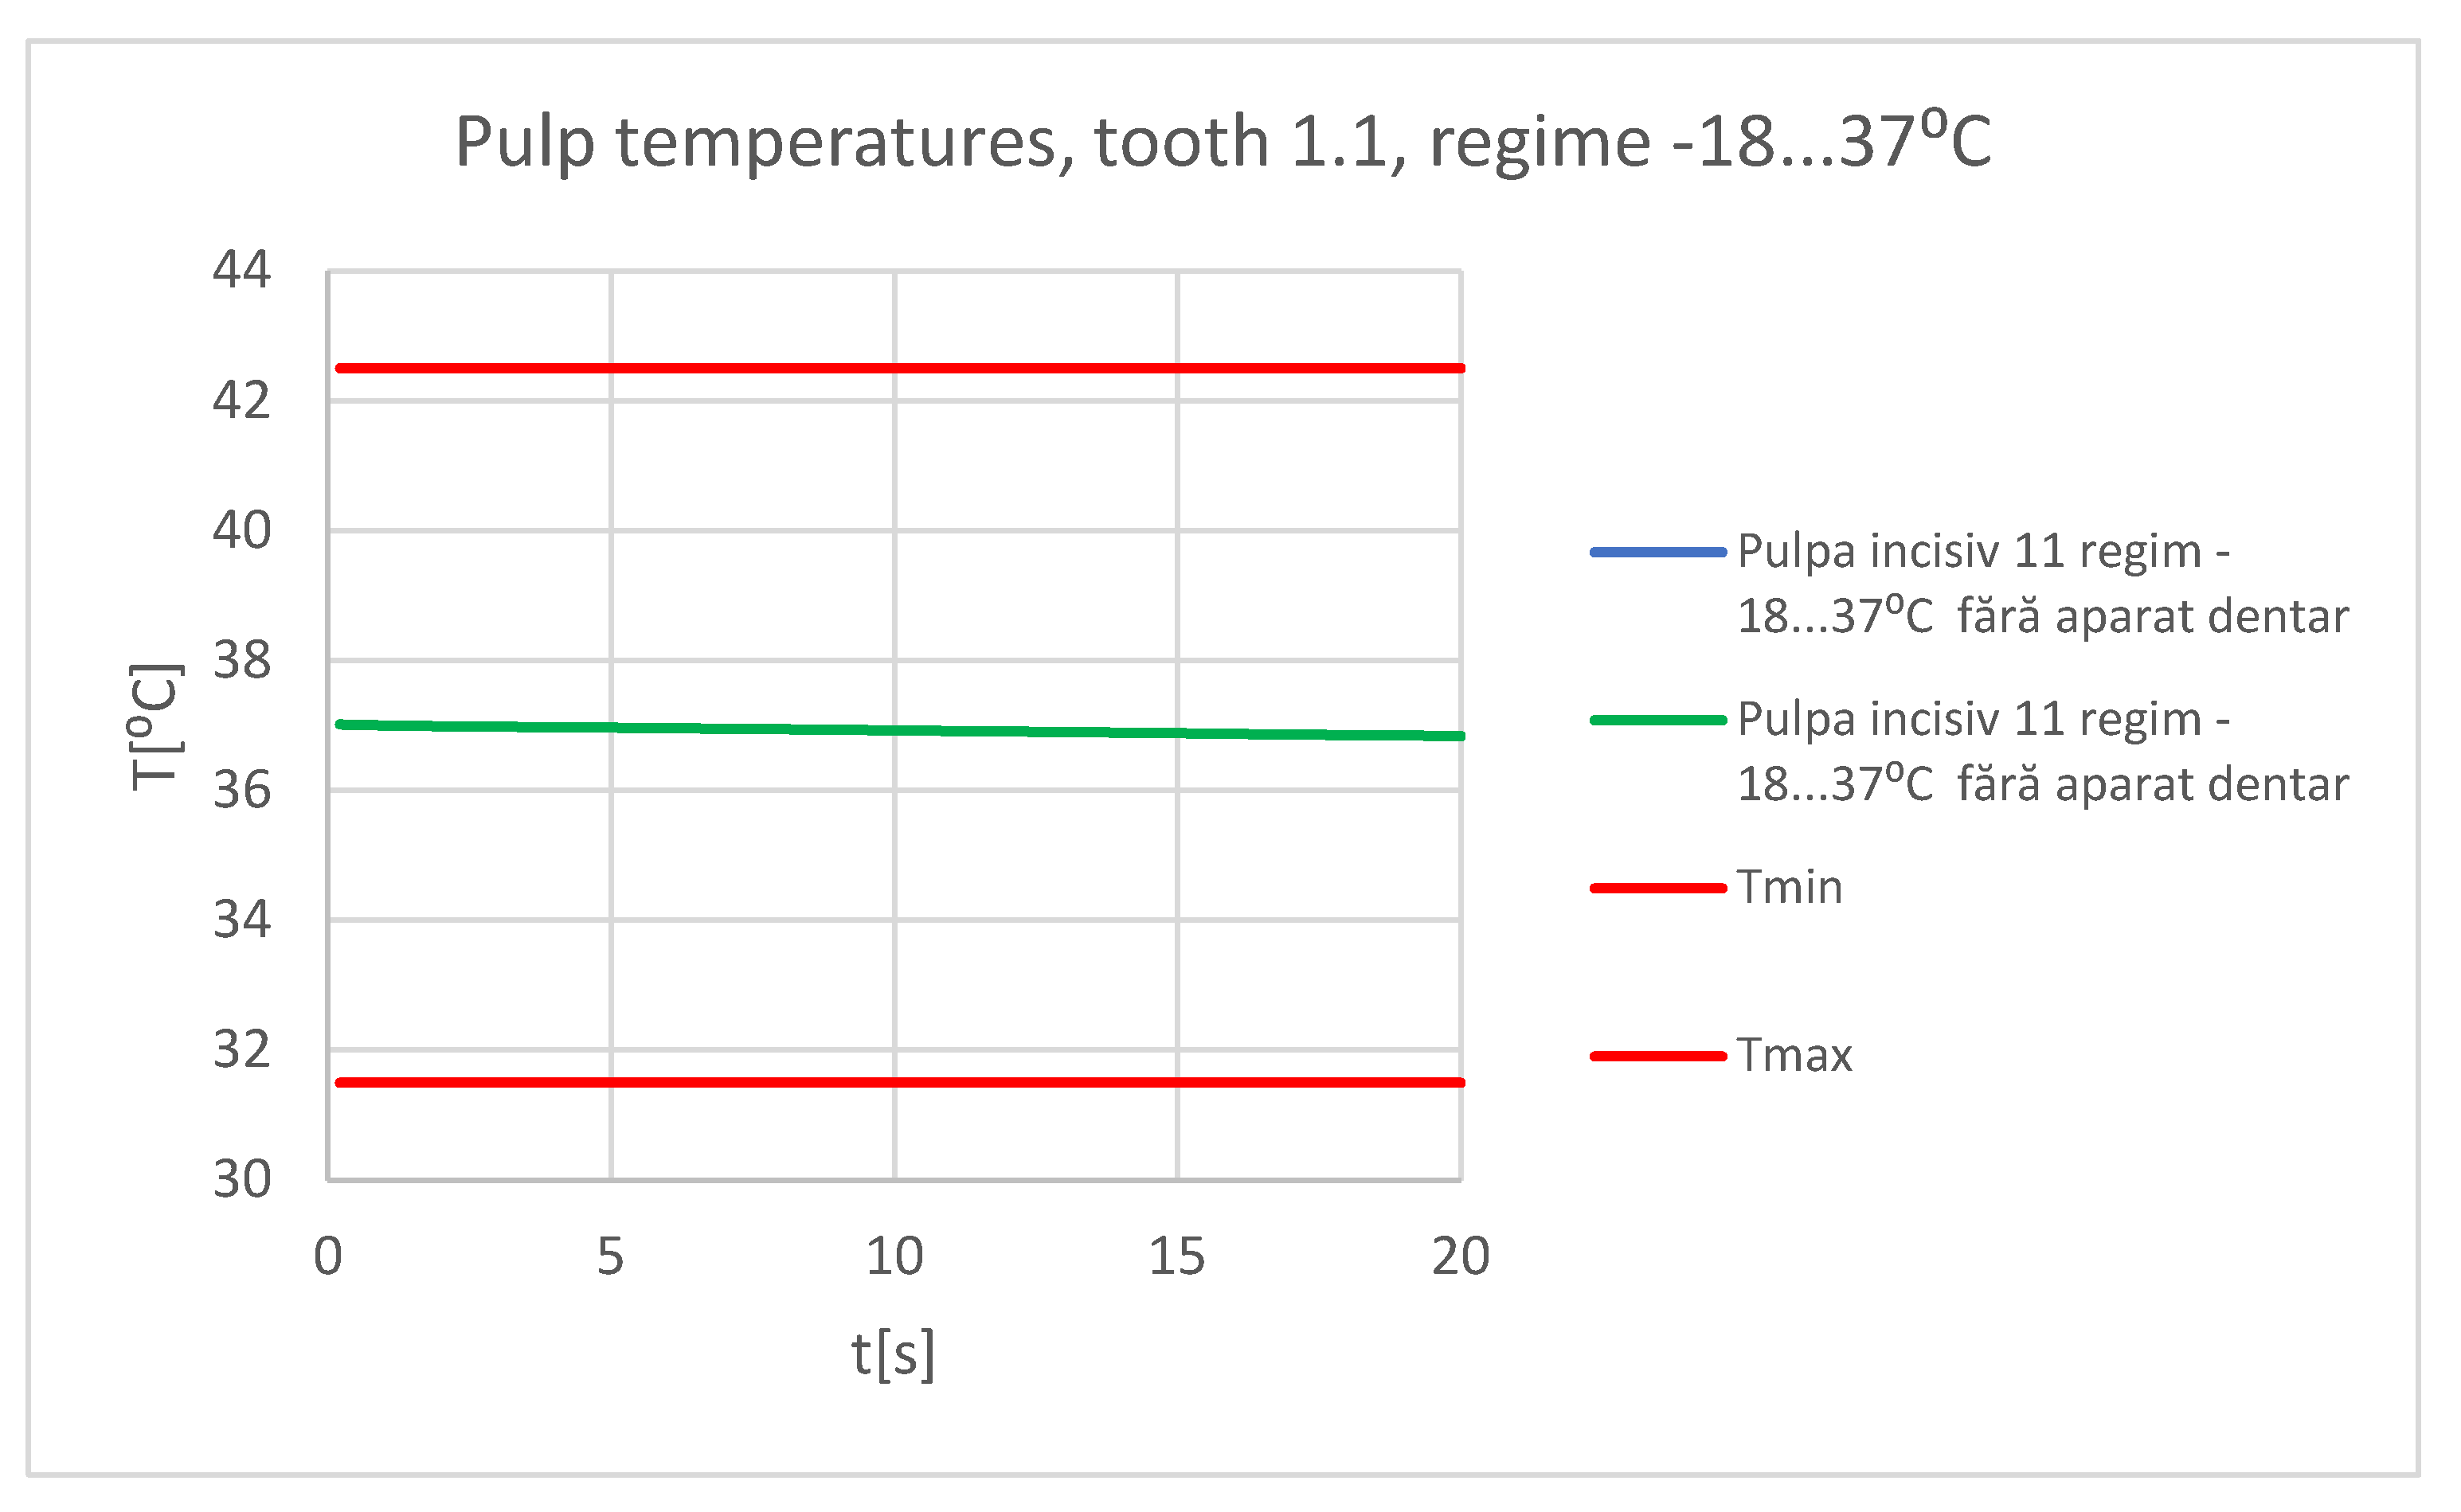
- very cold food (-18 ⁰C) that acts for 3 seconds, then the temperature tends to 37 ⁰C, and the cycle is repeated two more times, the whole regime lasts 20 seconds (
Figure 23);
Next, the area where the convection phenomenon acts was defined, as it can be seen in
Figure 24. The value of convection in the oral cavity is in the range of 2...3 W/m2 [
17].
In order to determine the dynamic temperature on the structures of teeth 1.1 and 4.1, some virtual temperature sensors were placed on them (using the Probe command). They record the temperature vs. time, the values being taken in a Microsoft Excel type file.
4. Discussion
In the specialized literature, there are few studies about thermal influence on different stomatognathic apparatus’ structures using FEM.
In the early period of FEM application, many simulations did not directly lead to the expected results, but indirectly, they imposed important results in the field of materials testing or in the nonlinear analysis of force application in virtual human joints [
19]. If initially, the analyzed models had a simplified geometry, and the division into finite elements was brief, nowadays, by improving the methods, multi-body structures with complicated loading configurations and complex constraints can be analyzed. Also, a series of physical phenomena have been interconnected and can be studied simultaneously, as simultaneous actions, such as thermal and structural study, and through the emergence of complex subroutines, rigid and flexible components with linear or non-linear mechanical behavior can be analyzed at the same time. In recent years, important progress has been made in the precise definition of the problem, but also in the multidisciplinary approach [
20,
21].
FEM can be utilized in the modeling and simulation of an orthodontic system, in order to determine the elastic forces that arise during orthodontic therapy with a fixed metallic appliance and the mechanical effect they cause. The study used CBCT scans from a patient who presented a malocclusion treated with the help of a fixed metallic orthodontic appliance. An upper orthodontic wire, a lower orthodontic wire, a set of bracket and tube-type elements were among the orthodontic components three-dimensional processed. A mathematical model of the forces that appear during fixed orthodontic treatment when a wire deforms was obtained using the Ansys Workbench program. As a result, the maximum deformation, maximum mechanical displacement, maximum stress, and deformation energy were determined [
5].
FEM can also be used to determine the behavior of a real orthodontic system subjected to different systems of loads. To analyze the real orthodontic system, the researchers studied the case of patient with Angle class II malocclusion. With the help of InVesalius program, DICOM-type images obtained from CBCT scans were transformed into three-dimensional structures. After editing, modifying, completing, and analyzing the three-dimensional structures with Geomagic software, the researchers obtained a three-dimensional model made up of perfectly closed surfaces, that can be transformed into virtual solids. This model was loaded into CAD programs. Bracket and tube-type elements, as well as orthodontic wires were added to the model. The complete geometrical model was exported to AnsysWorkbench program, which uses FEM. The researchers performed simulations for the forces from 0.5 to 1 N. After these simulations, result maps were obtained, that showed the displacement, strain, and stress. After the study, the researchers found that, in addition to the known rigidity, the orthodontic system has elasticity due to the orthodontic wires and periodontal ligaments [
6].
With varying degrees of periodontal tissue injury, a FEM study assessed the maximal stress, direction of force application, and displacement caused by the tooth-periodontal ligament-alveolar bone complex. The study showed that it is challenging to measure the forces produced during an orthodontic treatment with a fixed appliance from a clinical perspective. In the case of affected teeth, the researchers advise that the intensity of these forces should not exceed 1 N [
22].
Another FEM study showed the biomechanical behaviour of fixed orthodontic retainers, especially the influence of their stiffness and tooth resilience on force transmission and stress distribution. Using FEM, the authors of the study obtained a virtual model of the lower jaw from canine to canine with a retainer attached on the oral surface of the six teeth. Applying axial or oblique loads on the central incisors, the force transmission increased from 2 to 65% with increasing tooth resilience and retainer stiffness. Also, the researchers concluded that a smaller retainer diameter reduced the uniformity of the stress distribution in the bonding interfaces, causing concentrated stress peaks within a small field of the bonding area. Thus, they recommend to avoid using fixed orthodontic retainers that are excessively stiff, especially on teeth with high resilience [
23].
The limitations of our study are represented by the fact that we did not take into account the adhesive used for the bonding of the fixed metallic orthodontic appliance, which is found in a very thin layer between the base of the bracket or tube-type elements and the surface of the enamel. At the moment, the adhesives used in the field of orthodontics have thermal conductivity close to that of enamel, which is why we considered that it does not influence the results of our study.
In the future, we want to expand our research with similar FEM studies, alternating at short time intervals the thermal sources (cold-hot-cold and hot-cold-hot) to which various teeth are subjected.
Figure 1.
The interface of the InVesalius program with the Enamel filter activated.
Figure 1.
The interface of the InVesalius program with the Enamel filter activated.
Figure 2.
The primary geometry loaded in the Geomagic program.
Figure 2.
The primary geometry loaded in the Geomagic program.
Figure 3.
Steps to remove the bone components from the initial geometry in Geomagic.
Figure 3.
Steps to remove the bone components from the initial geometry in Geomagic.
Figure 4.
Removing the wisdom teeth from the dentition model.
Figure 4.
Removing the wisdom teeth from the dentition model.
Figure 5.
The final model of the dentition in Geomagic and SolidWorks.
Figure 5.
The final model of the dentition in Geomagic and SolidWorks.
Figure 6.
The interface of the InVesalius program with the Compact Bone filter activated.
Figure 6.
The interface of the InVesalius program with the Compact Bone filter activated.
Figure 7.
Processing stages of the model in Geomagic.
Figure 7.
Processing stages of the model in Geomagic.
Figure 8.
The virtual model of the bone components in Geomagic and in SolidWorks.
Figure 8.
The virtual model of the bone components in Geomagic and in SolidWorks.
Figure 9.
The virtual model of the studied stomatognathic apparatus.
Figure 9.
The virtual model of the studied stomatognathic apparatus.
Figure 10.
Dental enamel models of teeth 1.1 and 4.1.
Figure 10.
Dental enamel models of teeth 1.1 and 4.1.
Figure 11.
The external model of tooth 1.1 in Geomagic.
Figure 11.
The external model of tooth 1.1 in Geomagic.
Figure 12.
Obtaining the dentine model of tooth 1.1.
Figure 12.
Obtaining the dentine model of tooth 1.1.
Figure 13.
Model of the dental pulp of tooth 1.1 in Geomagic and SolidWorks.
Figure 13.
Model of the dental pulp of tooth 1.1 in Geomagic and SolidWorks.
Figure 14.
The dentin and dental pulp models of tooth 4.1.
Figure 14.
The dentin and dental pulp models of tooth 4.1.
Figure 15.
Final models of teeth 1.1 and 4.1 (one view and two sections).
Figure 15.
Final models of teeth 1.1 and 4.1 (one view and two sections).
Figure 16.
Bracket and tube-type elements.
Figure 16.
Bracket and tube-type elements.
Figure 17.
Placement of virtual orthodontic wires.
Figure 17.
Placement of virtual orthodontic wires.
Figure 18.
Sections through the studied orthodontic system.
Figure 18.
Sections through the studied orthodontic system.
Figure 19.
Finite element structure for simulations without a fixed metallic appliance.
Figure 19.
Finite element structure for simulations without a fixed metallic appliance.
Figure 20.
Finite element structure for simulations with a fixed metallic orthodontic appliance.
Figure 20.
Finite element structure for simulations with a fixed metallic orthodontic appliance.
Figure 21.
The areas in the models that come into contact with hot or cold food (temperature source).
Figure 21.
The areas in the models that come into contact with hot or cold food (temperature source).
Figure 22.
Mode of the heat source (hot food).
Figure 22.
Mode of the heat source (hot food).
Figure 23.
Heat source mode (cold food).
Figure 23.
Heat source mode (cold food).
Figure 24.
The areas where the phenomenon of thermal convection is present.
Figure 24.
The areas where the phenomenon of thermal convection is present.
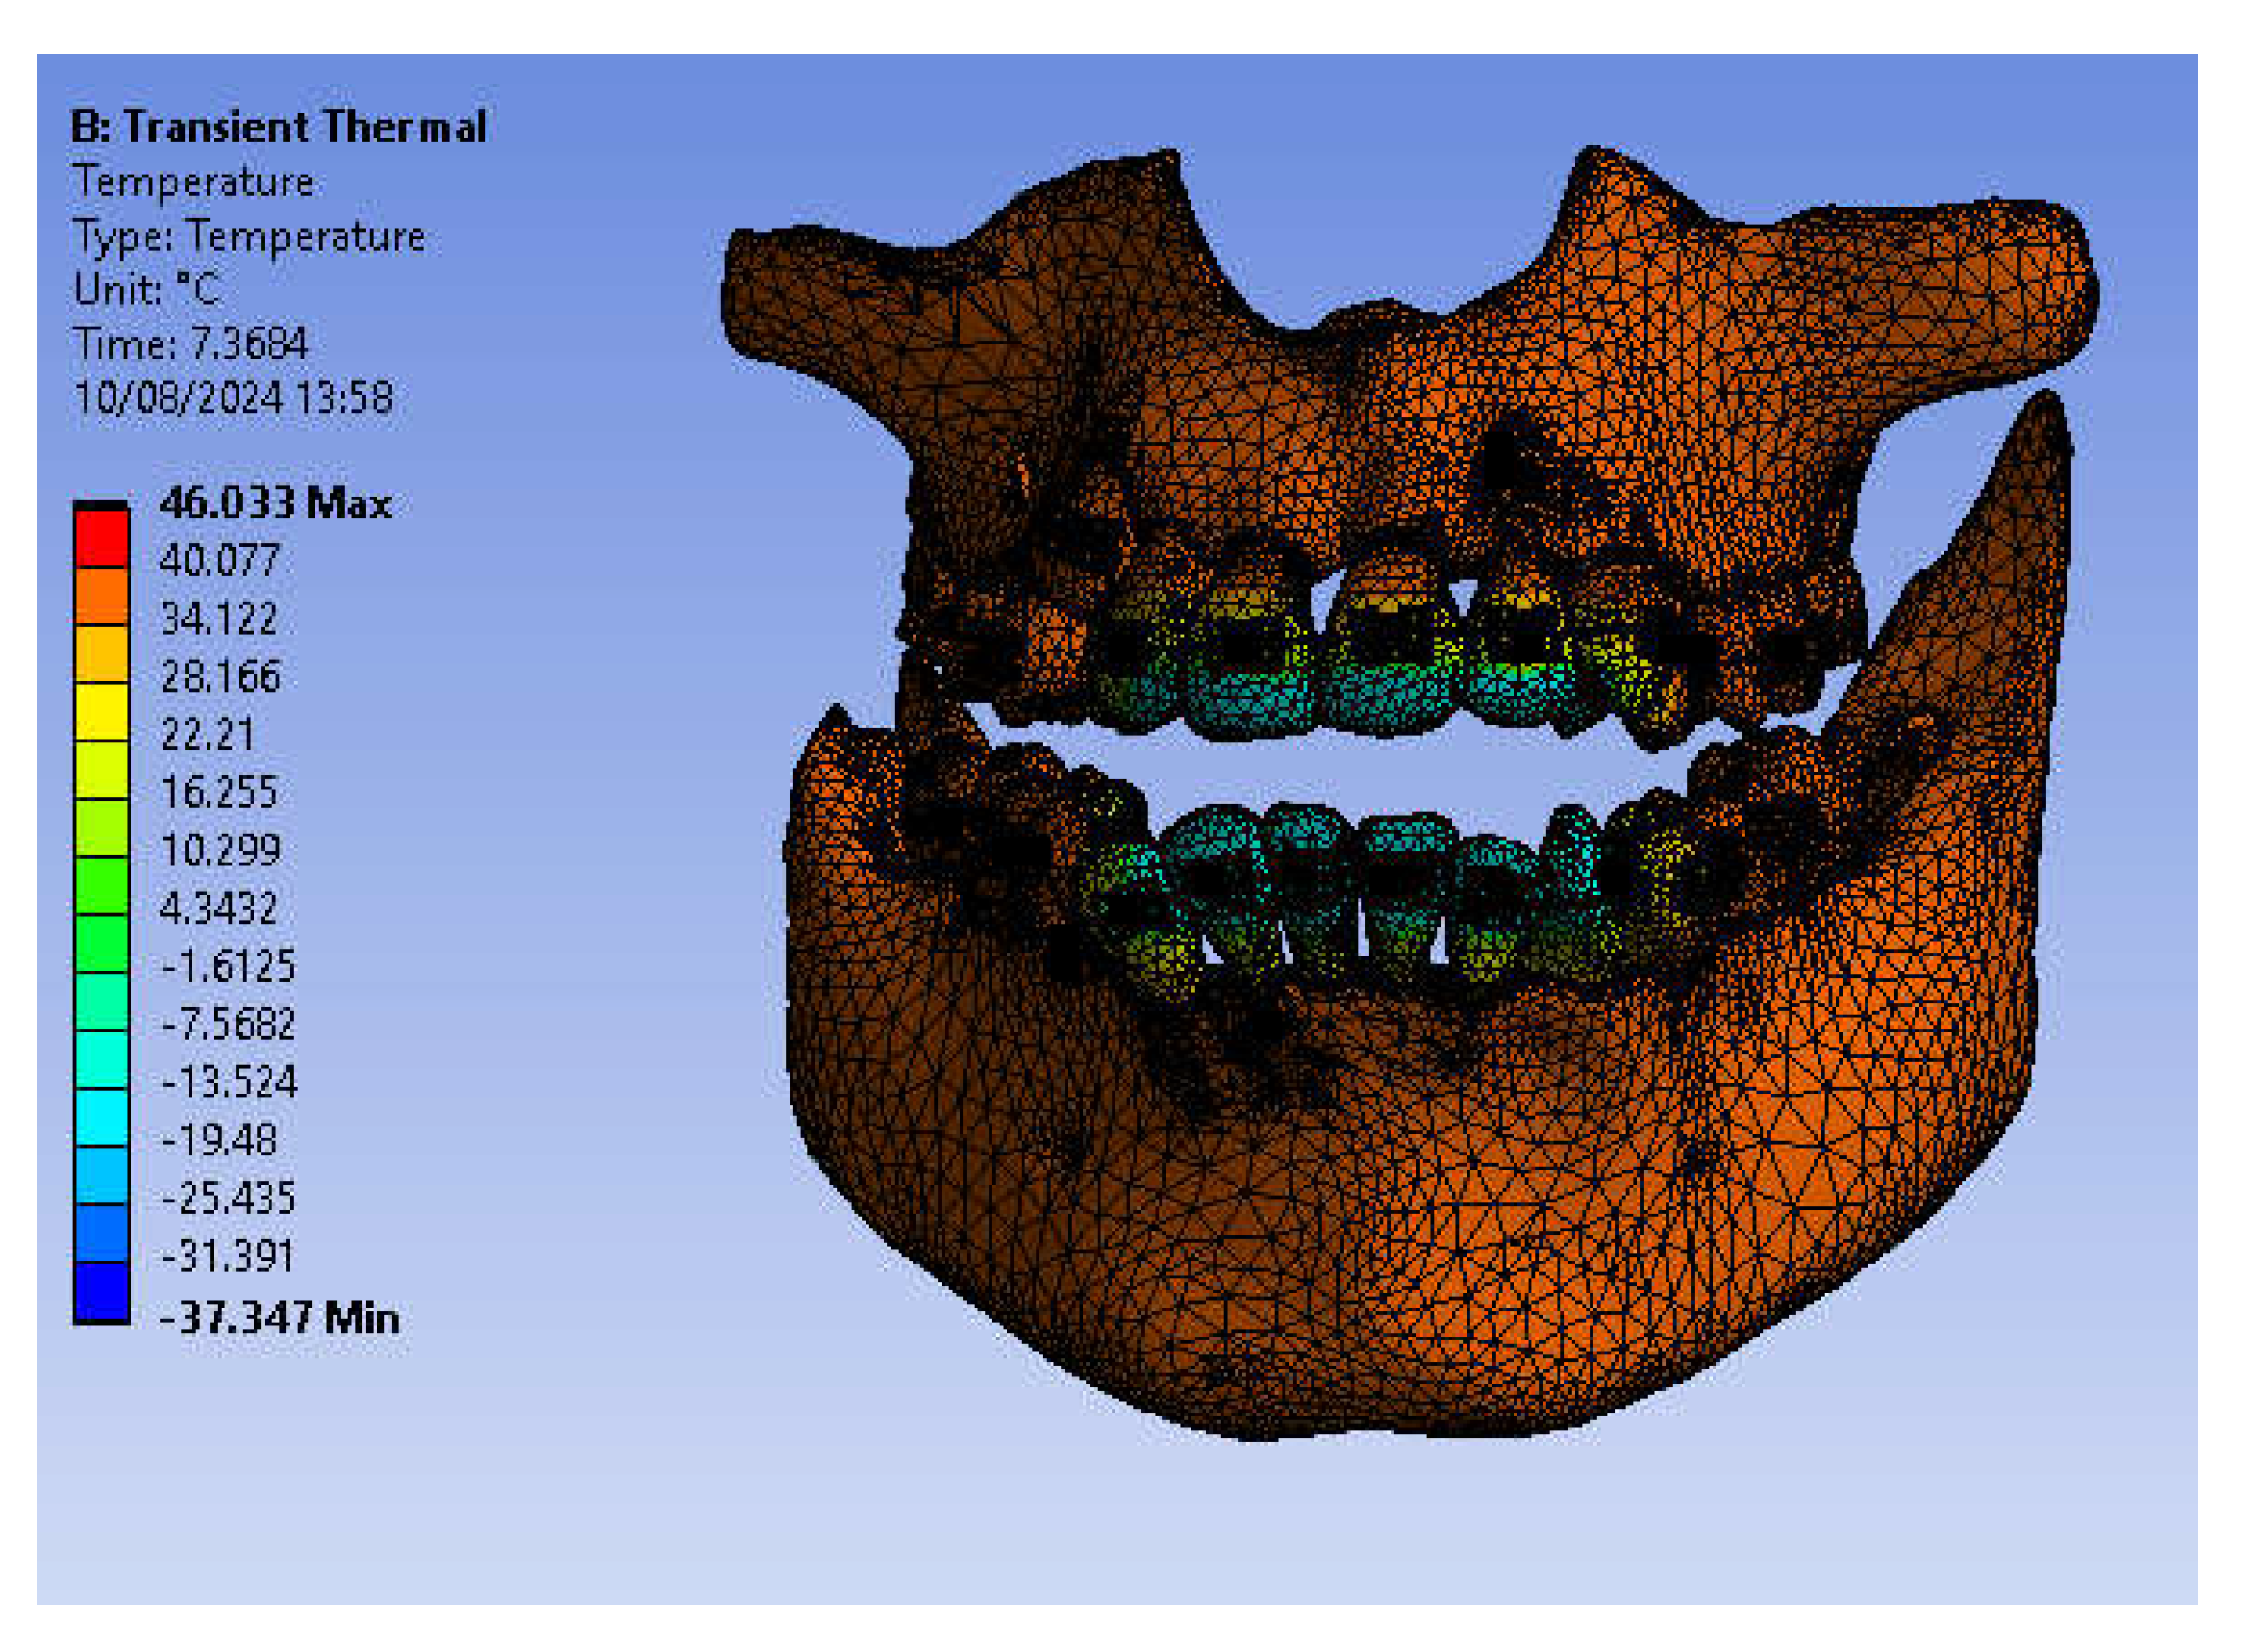
Figure 25.
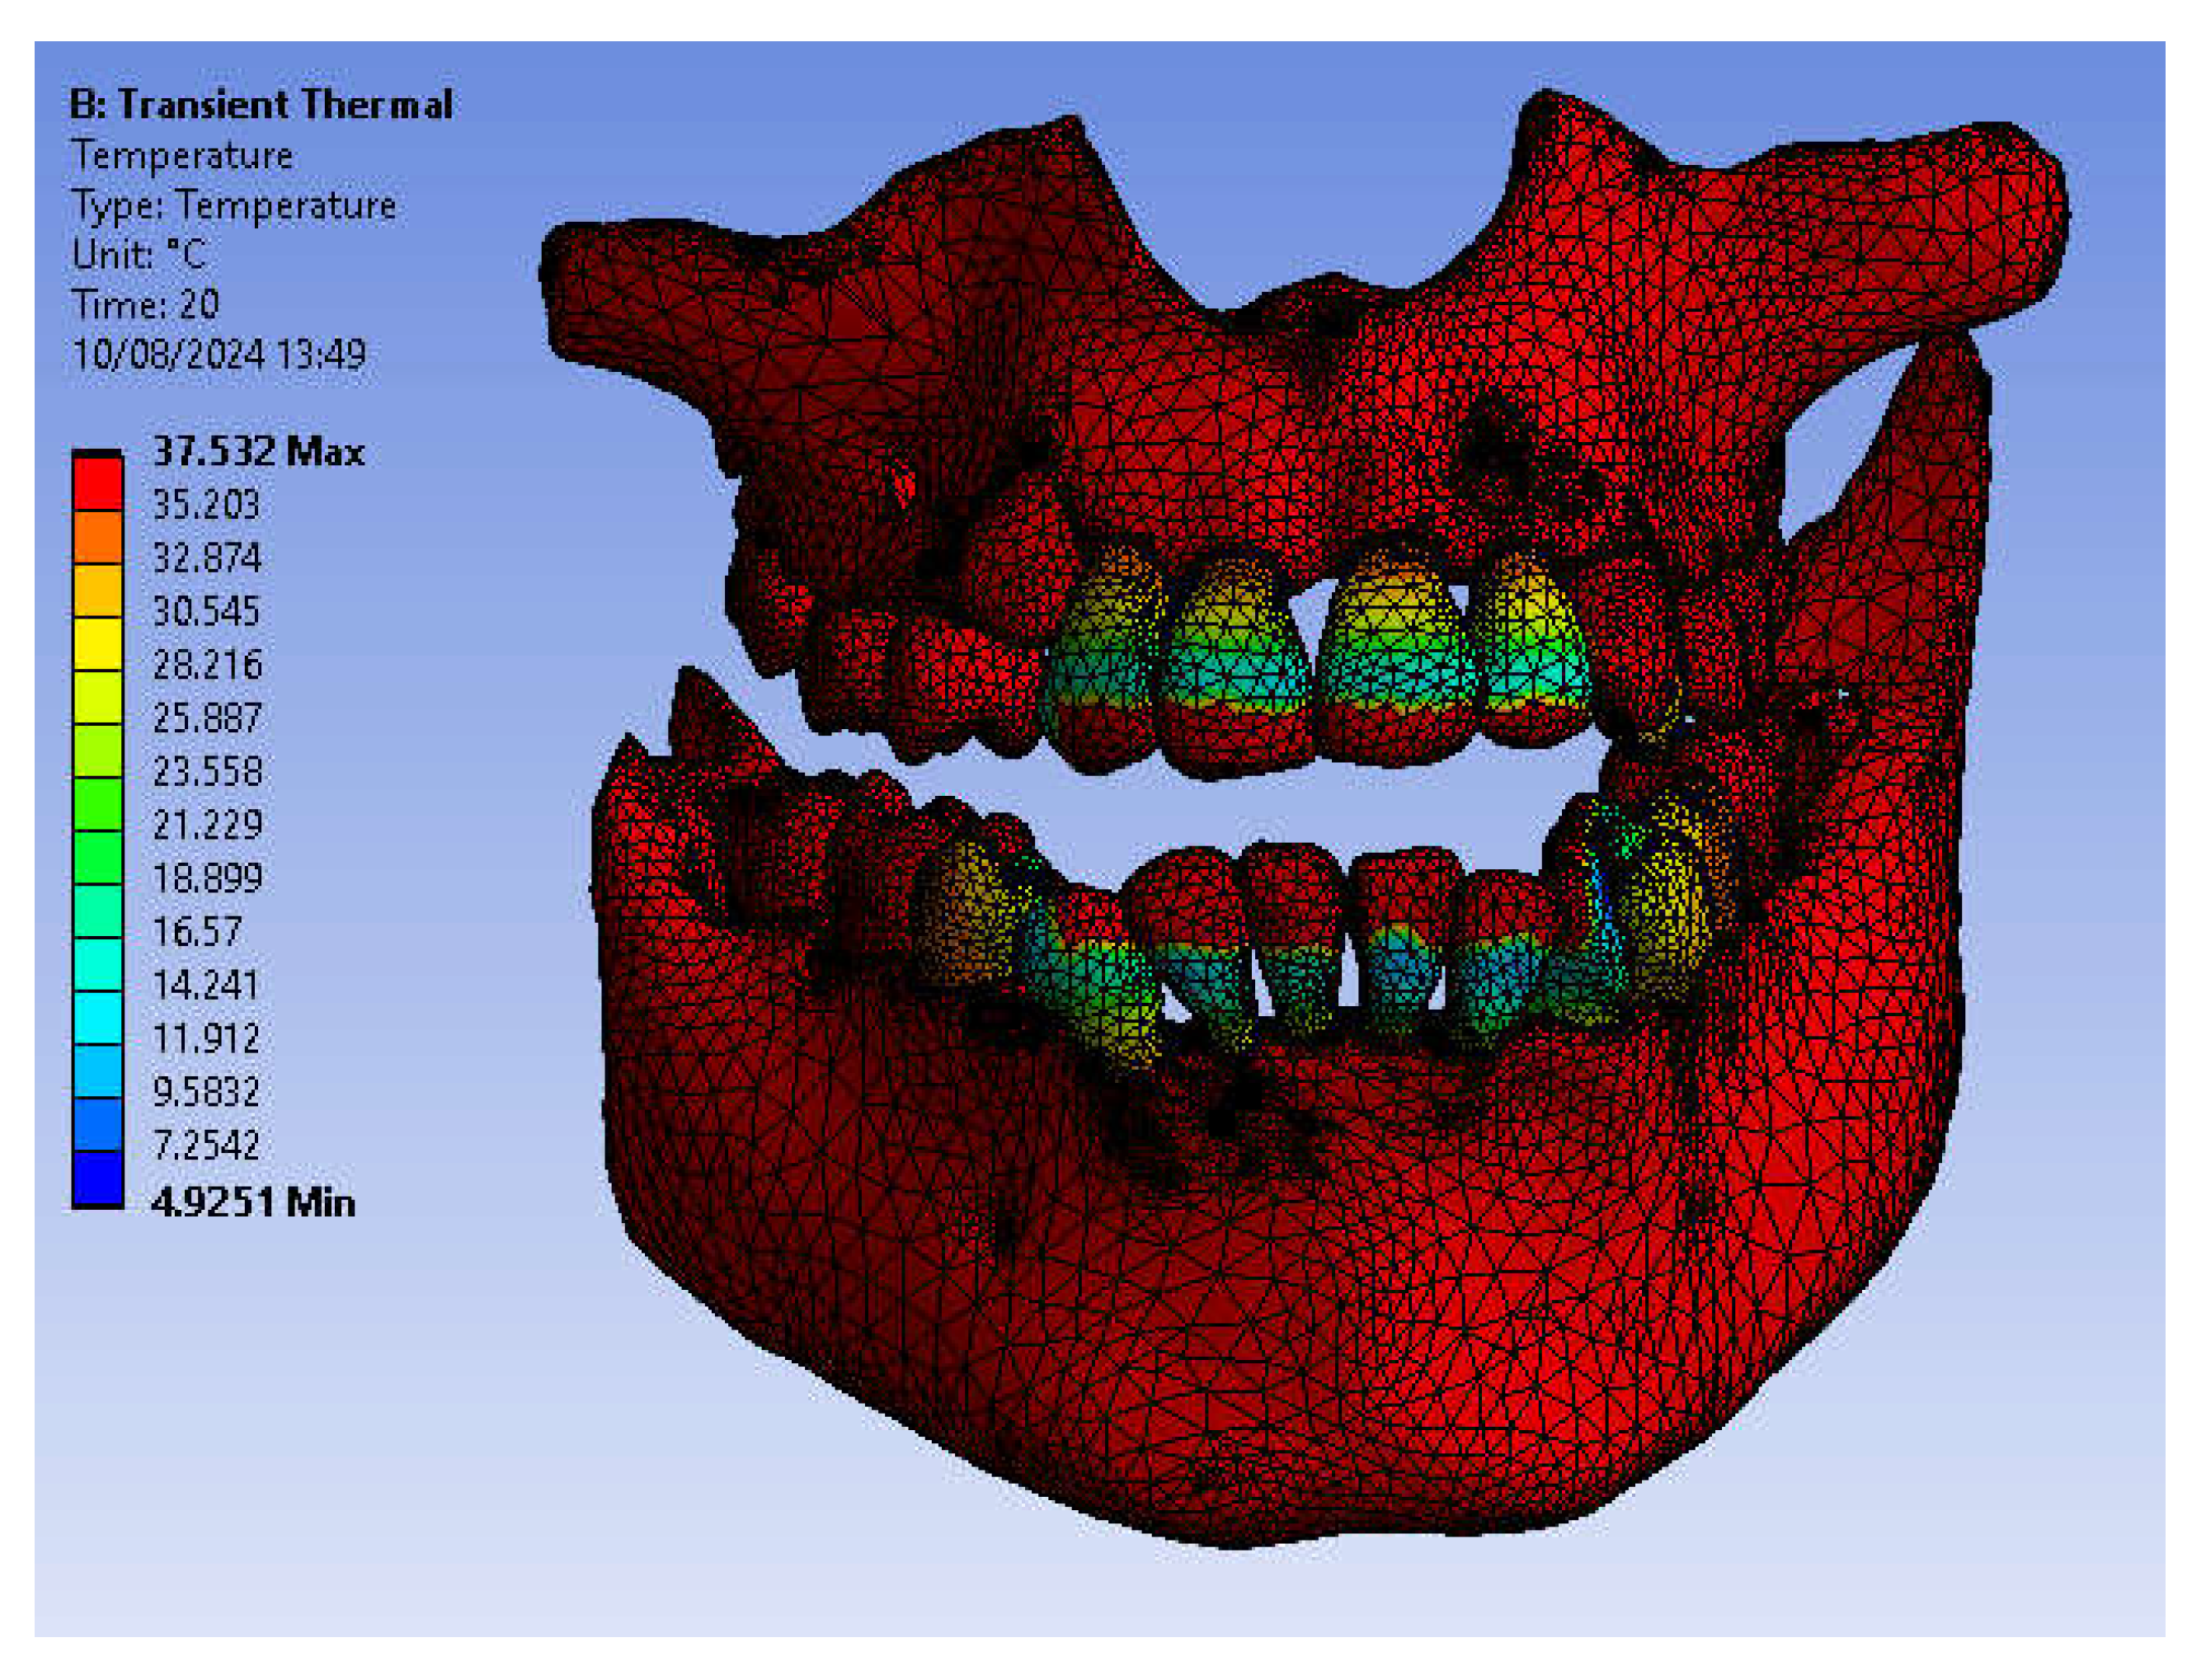
Temperature map.
Figure 25.
Temperature map.
Figure 26.
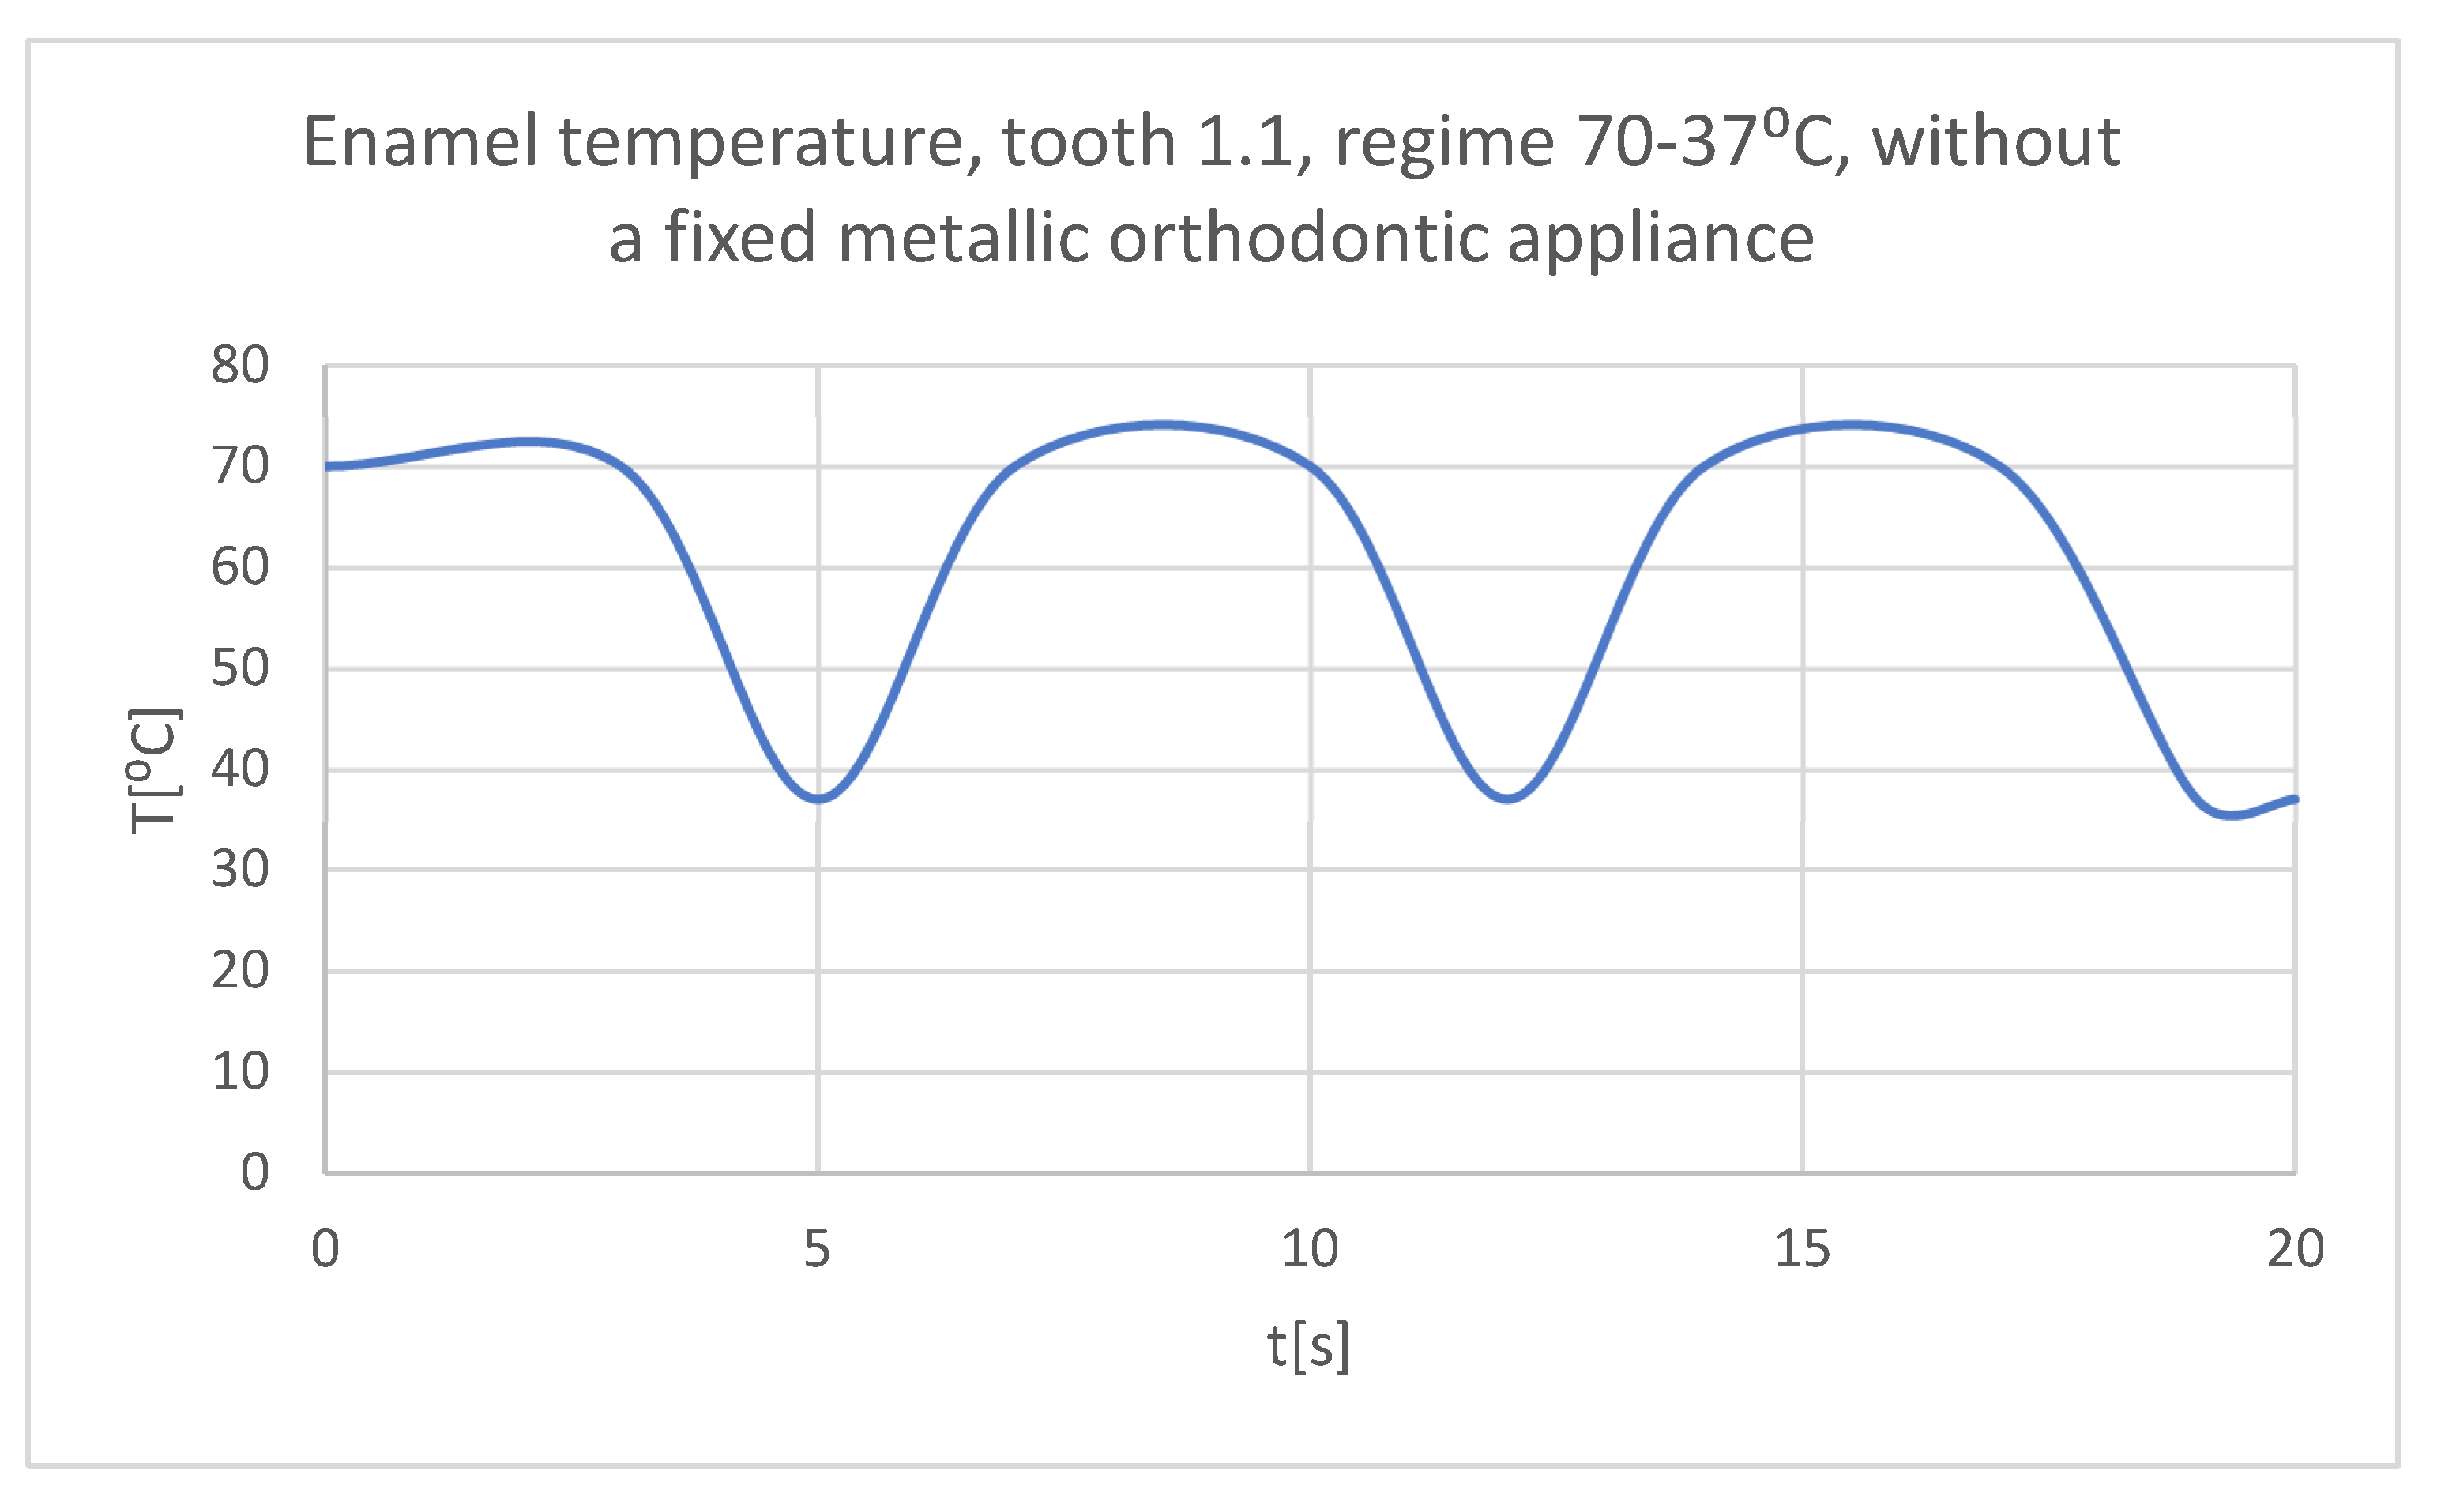
The temperature in the dental enamel of tooth 1.1 subjected to the hot thermal source.
Figure 26.
The temperature in the dental enamel of tooth 1.1 subjected to the hot thermal source.
Figure 27.
The temperature in the dentine of tooth 1.1 subjected to the hot thermal source.
Figure 27.
The temperature in the dentine of tooth 1.1 subjected to the hot thermal source.
Figure 28.
The temperature in the pulp of tooth 1.1 subjected to the hot thermal source.
Figure 28.
The temperature in the pulp of tooth 1.1 subjected to the hot thermal source.
Figure 29.
Comparative diagram of the dental structures temperatures of tooth 1.1 subjected to the hot thermal source.
Figure 29.
Comparative diagram of the dental structures temperatures of tooth 1.1 subjected to the hot thermal source.
Figure 30.
The temperature in the dental enamel of tooth 4.1 subjected to the hot thermal source.
Figure 30.
The temperature in the dental enamel of tooth 4.1 subjected to the hot thermal source.
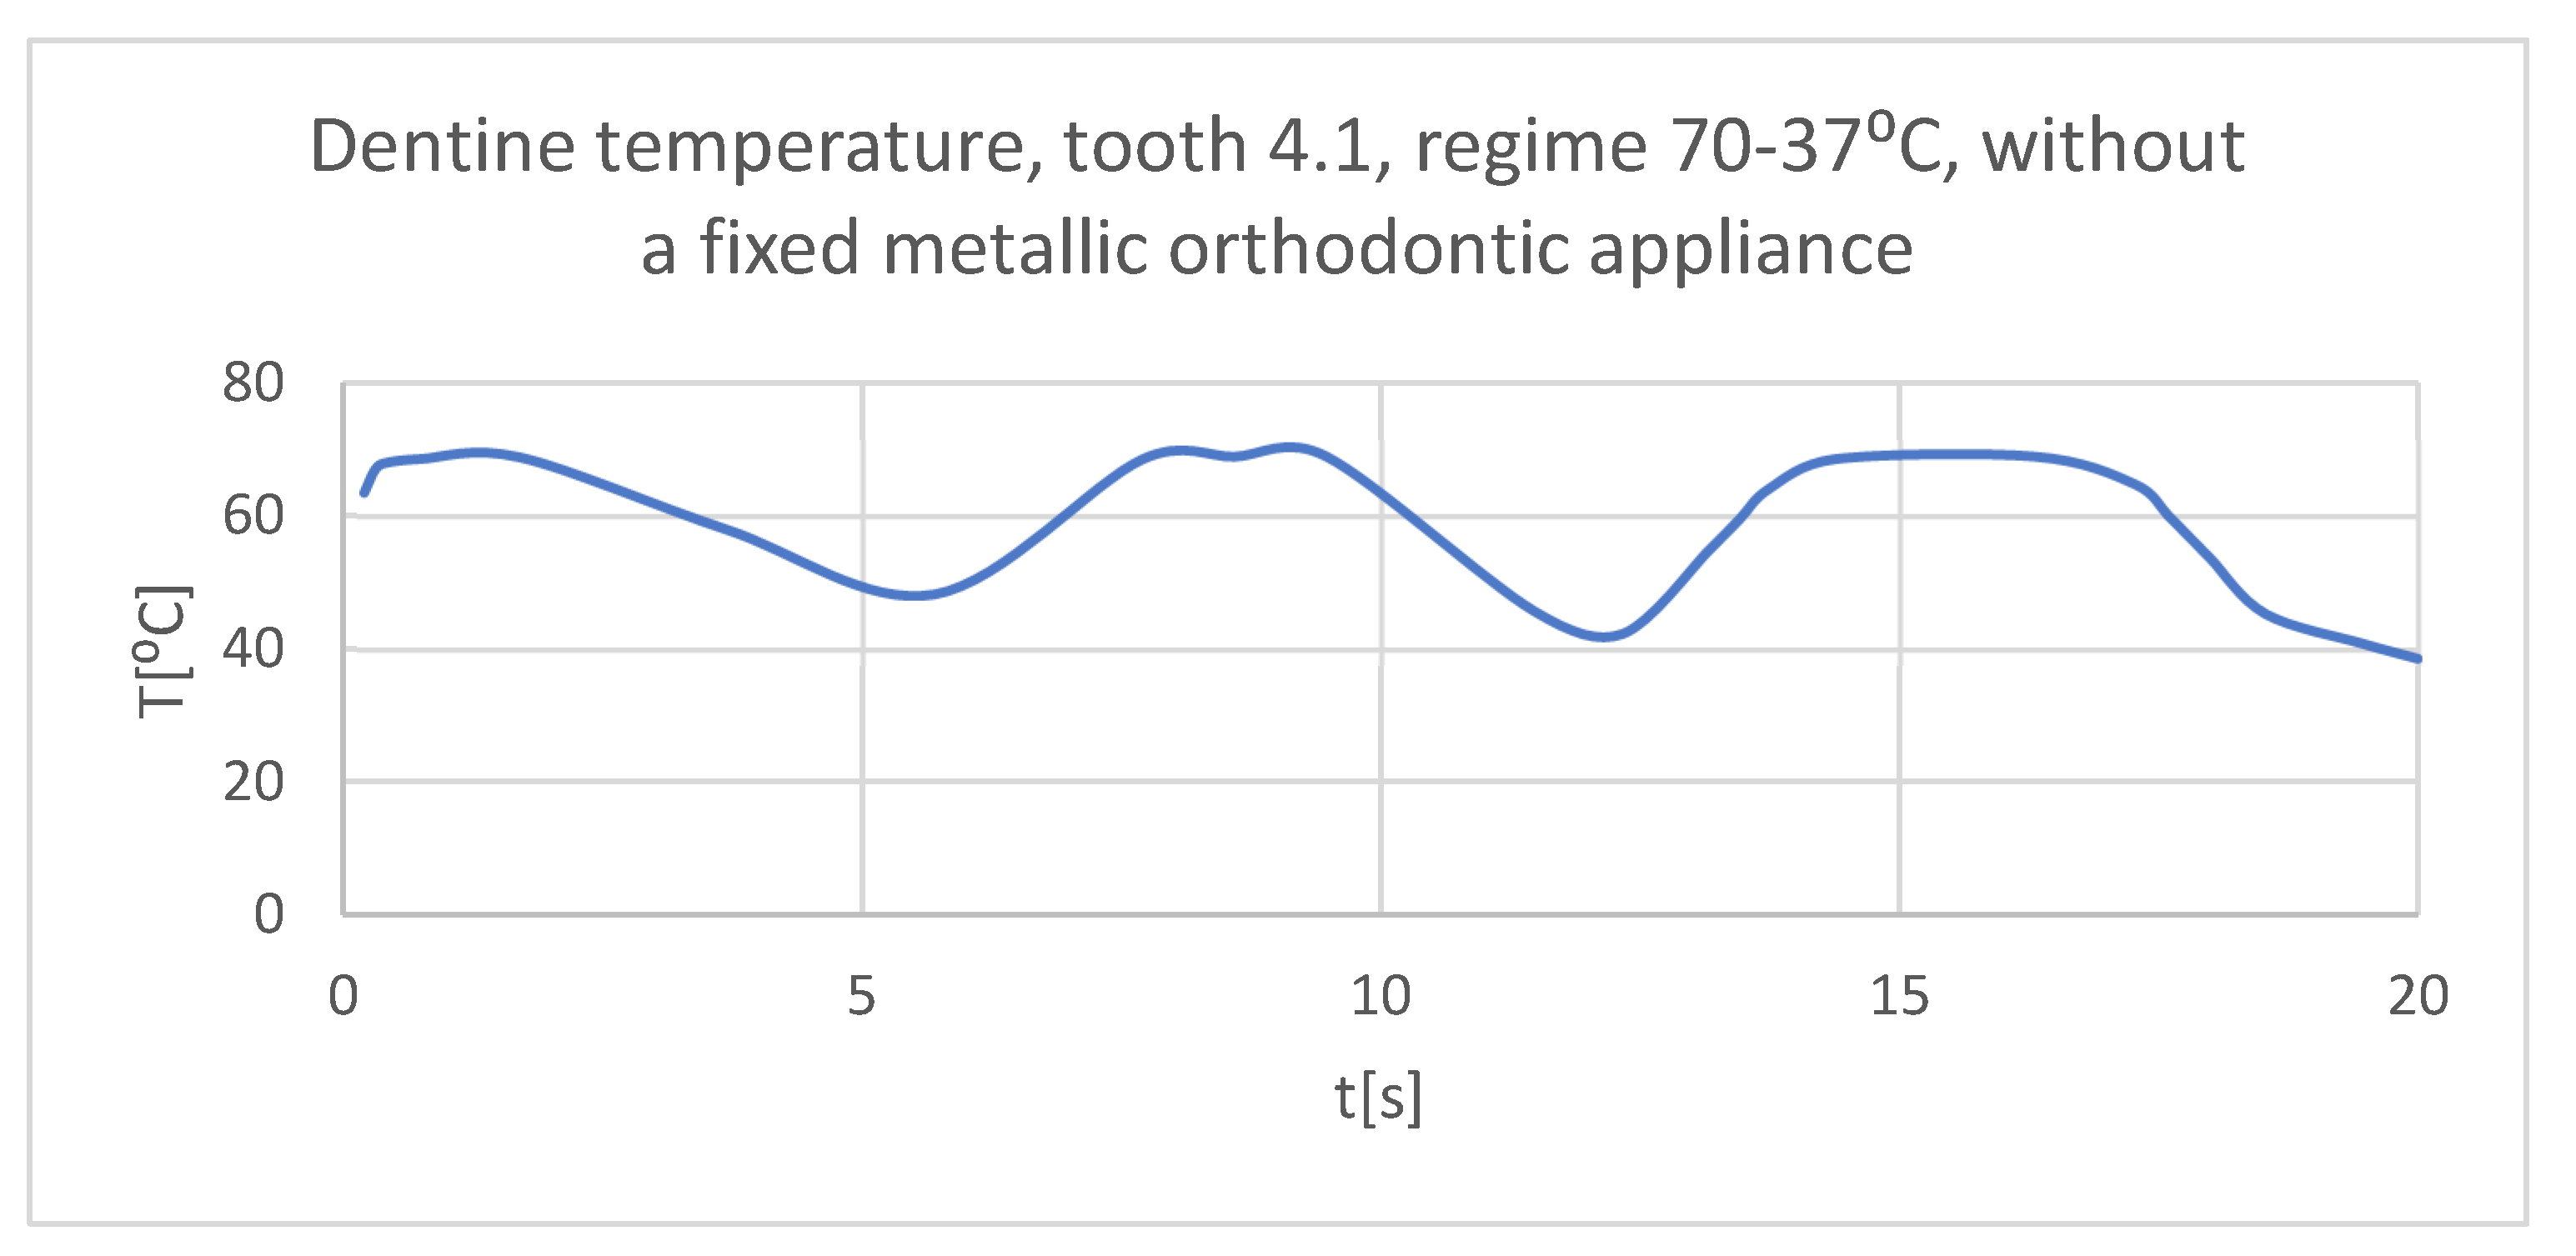
Figure 31.
The temperature in the dentin of tooth 4.1 subjected to the hot thermal source.
Figure 31.
The temperature in the dentin of tooth 4.1 subjected to the hot thermal source.
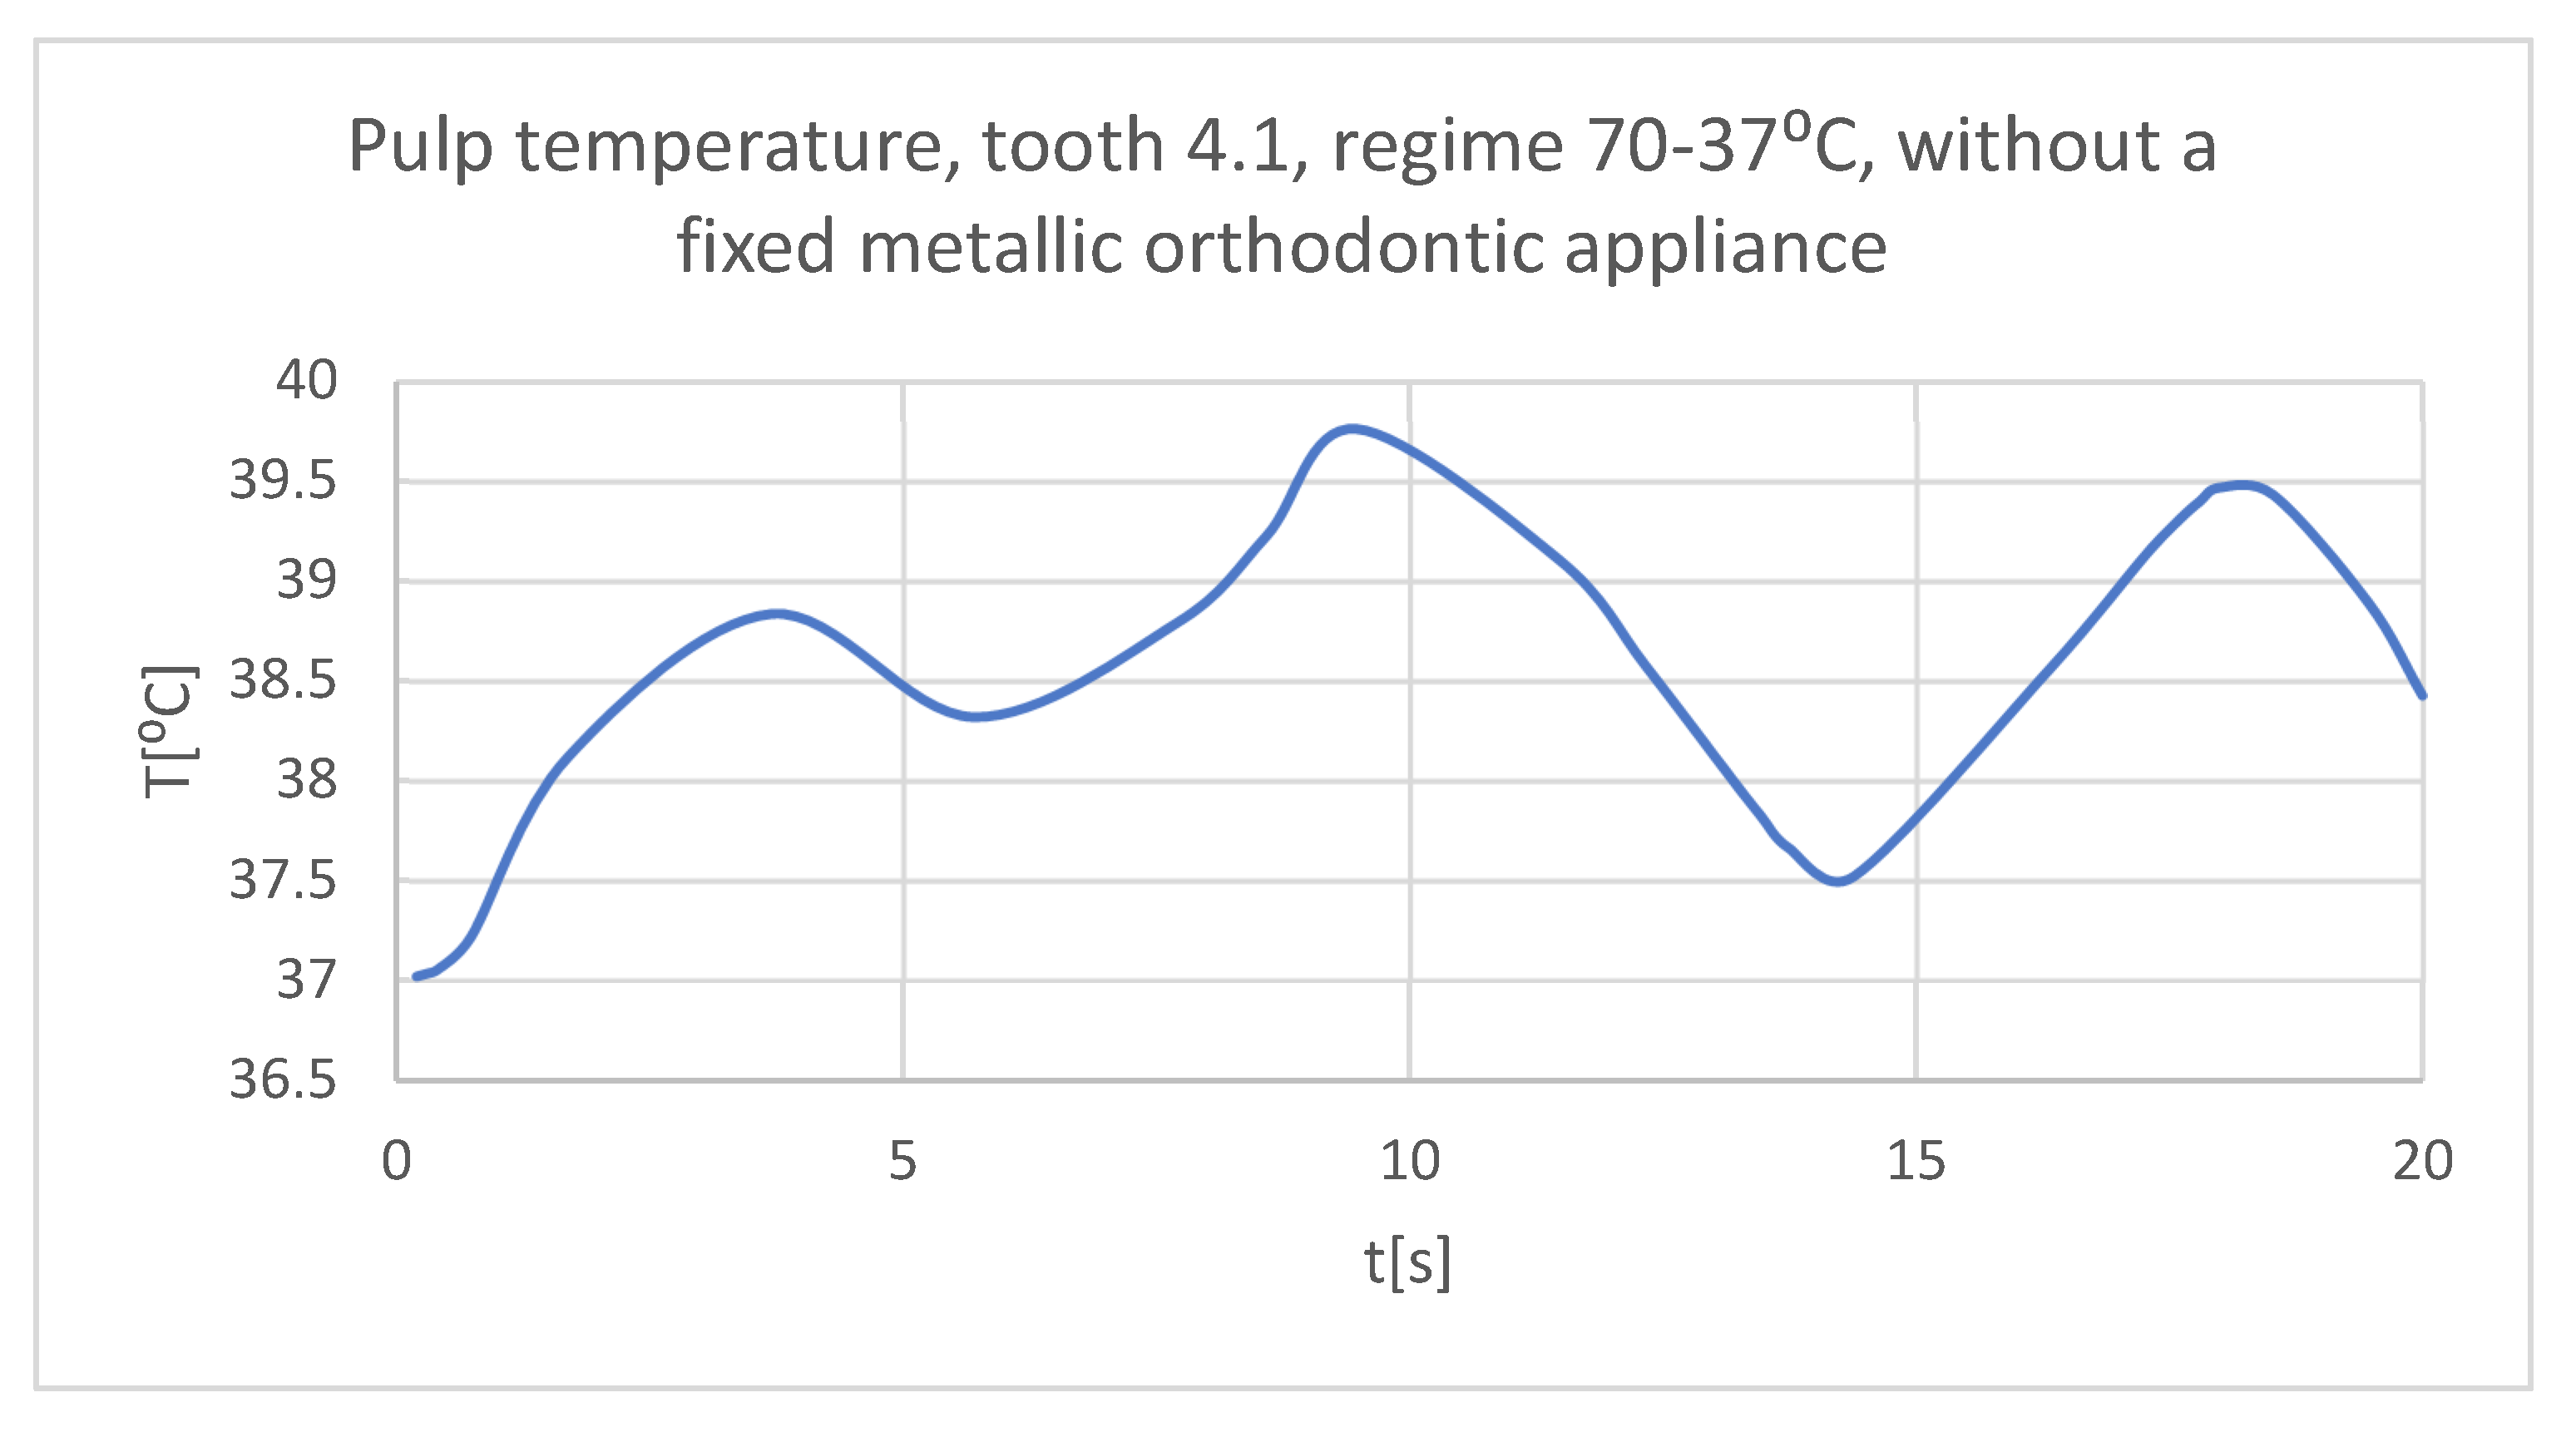
Figure 32.
The temperature in the pulp of tooth 4.1 subjected to the hot thermal source.
Figure 32.
The temperature in the pulp of tooth 4.1 subjected to the hot thermal source.
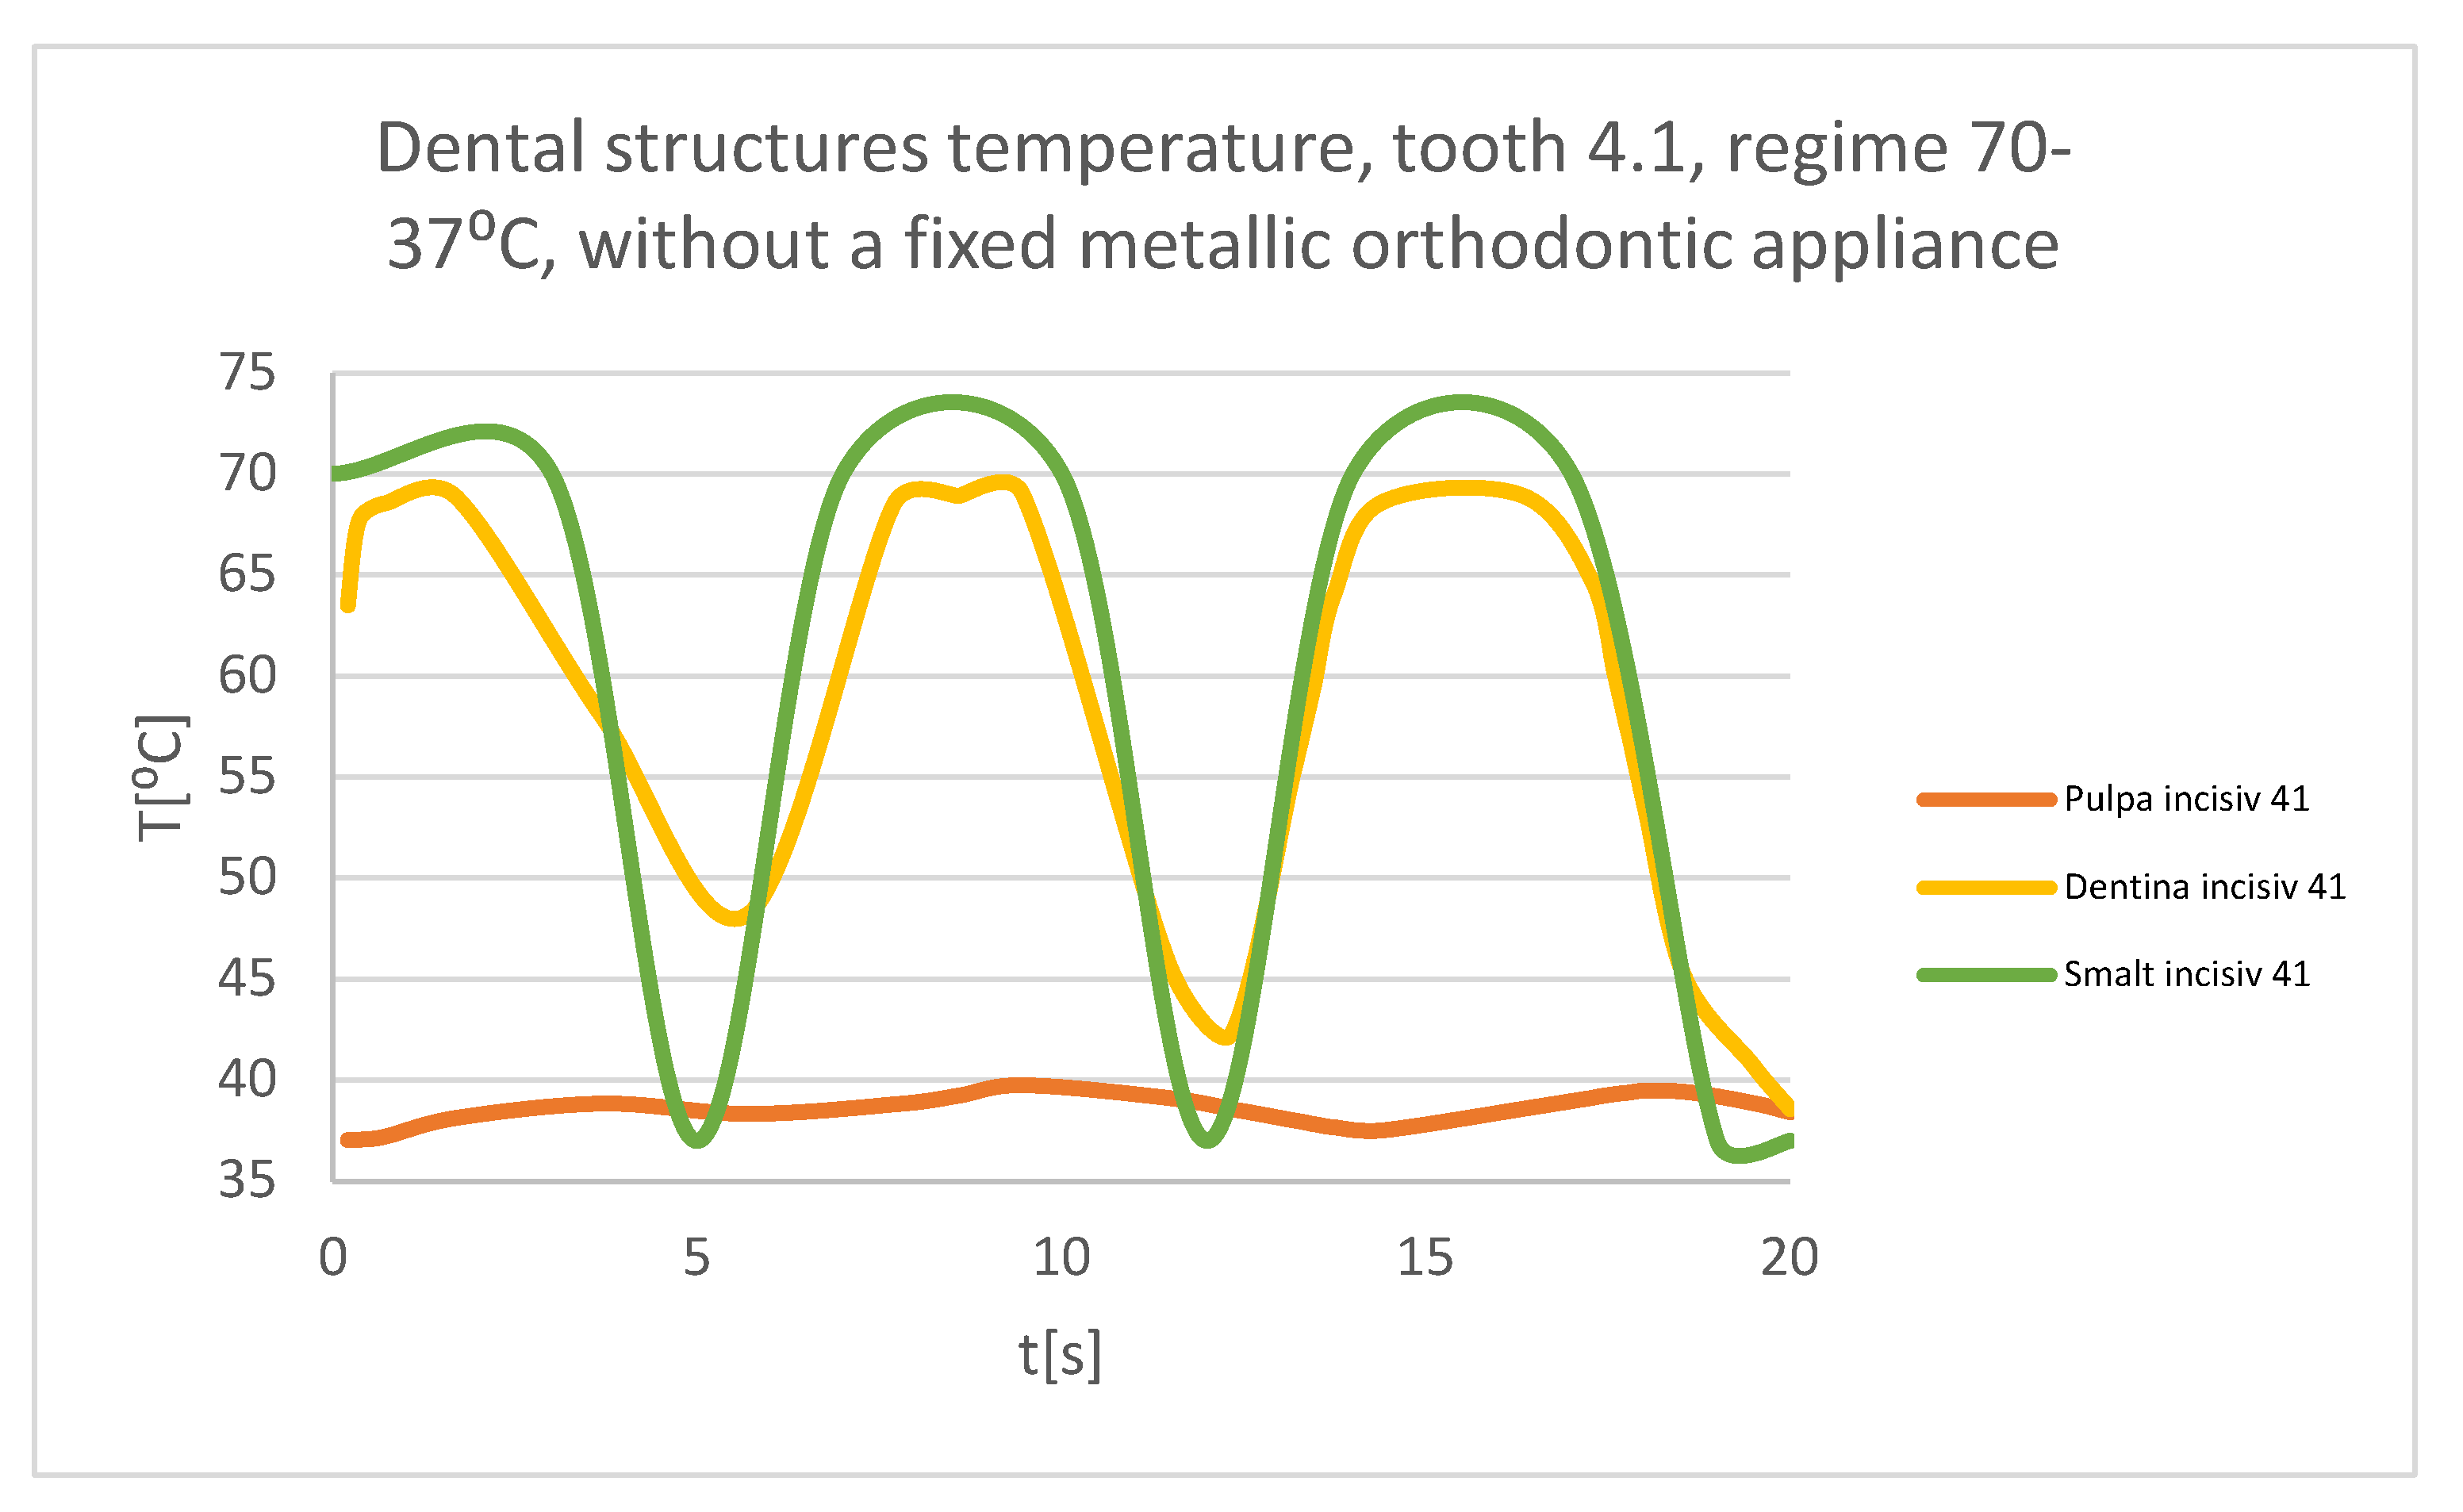
Figure 33.
Comparative diagram of the dental structures temperatures of tooth 4.1 subjected to the hot thermal source.
Figure 33.
Comparative diagram of the dental structures temperatures of tooth 4.1 subjected to the hot thermal source.
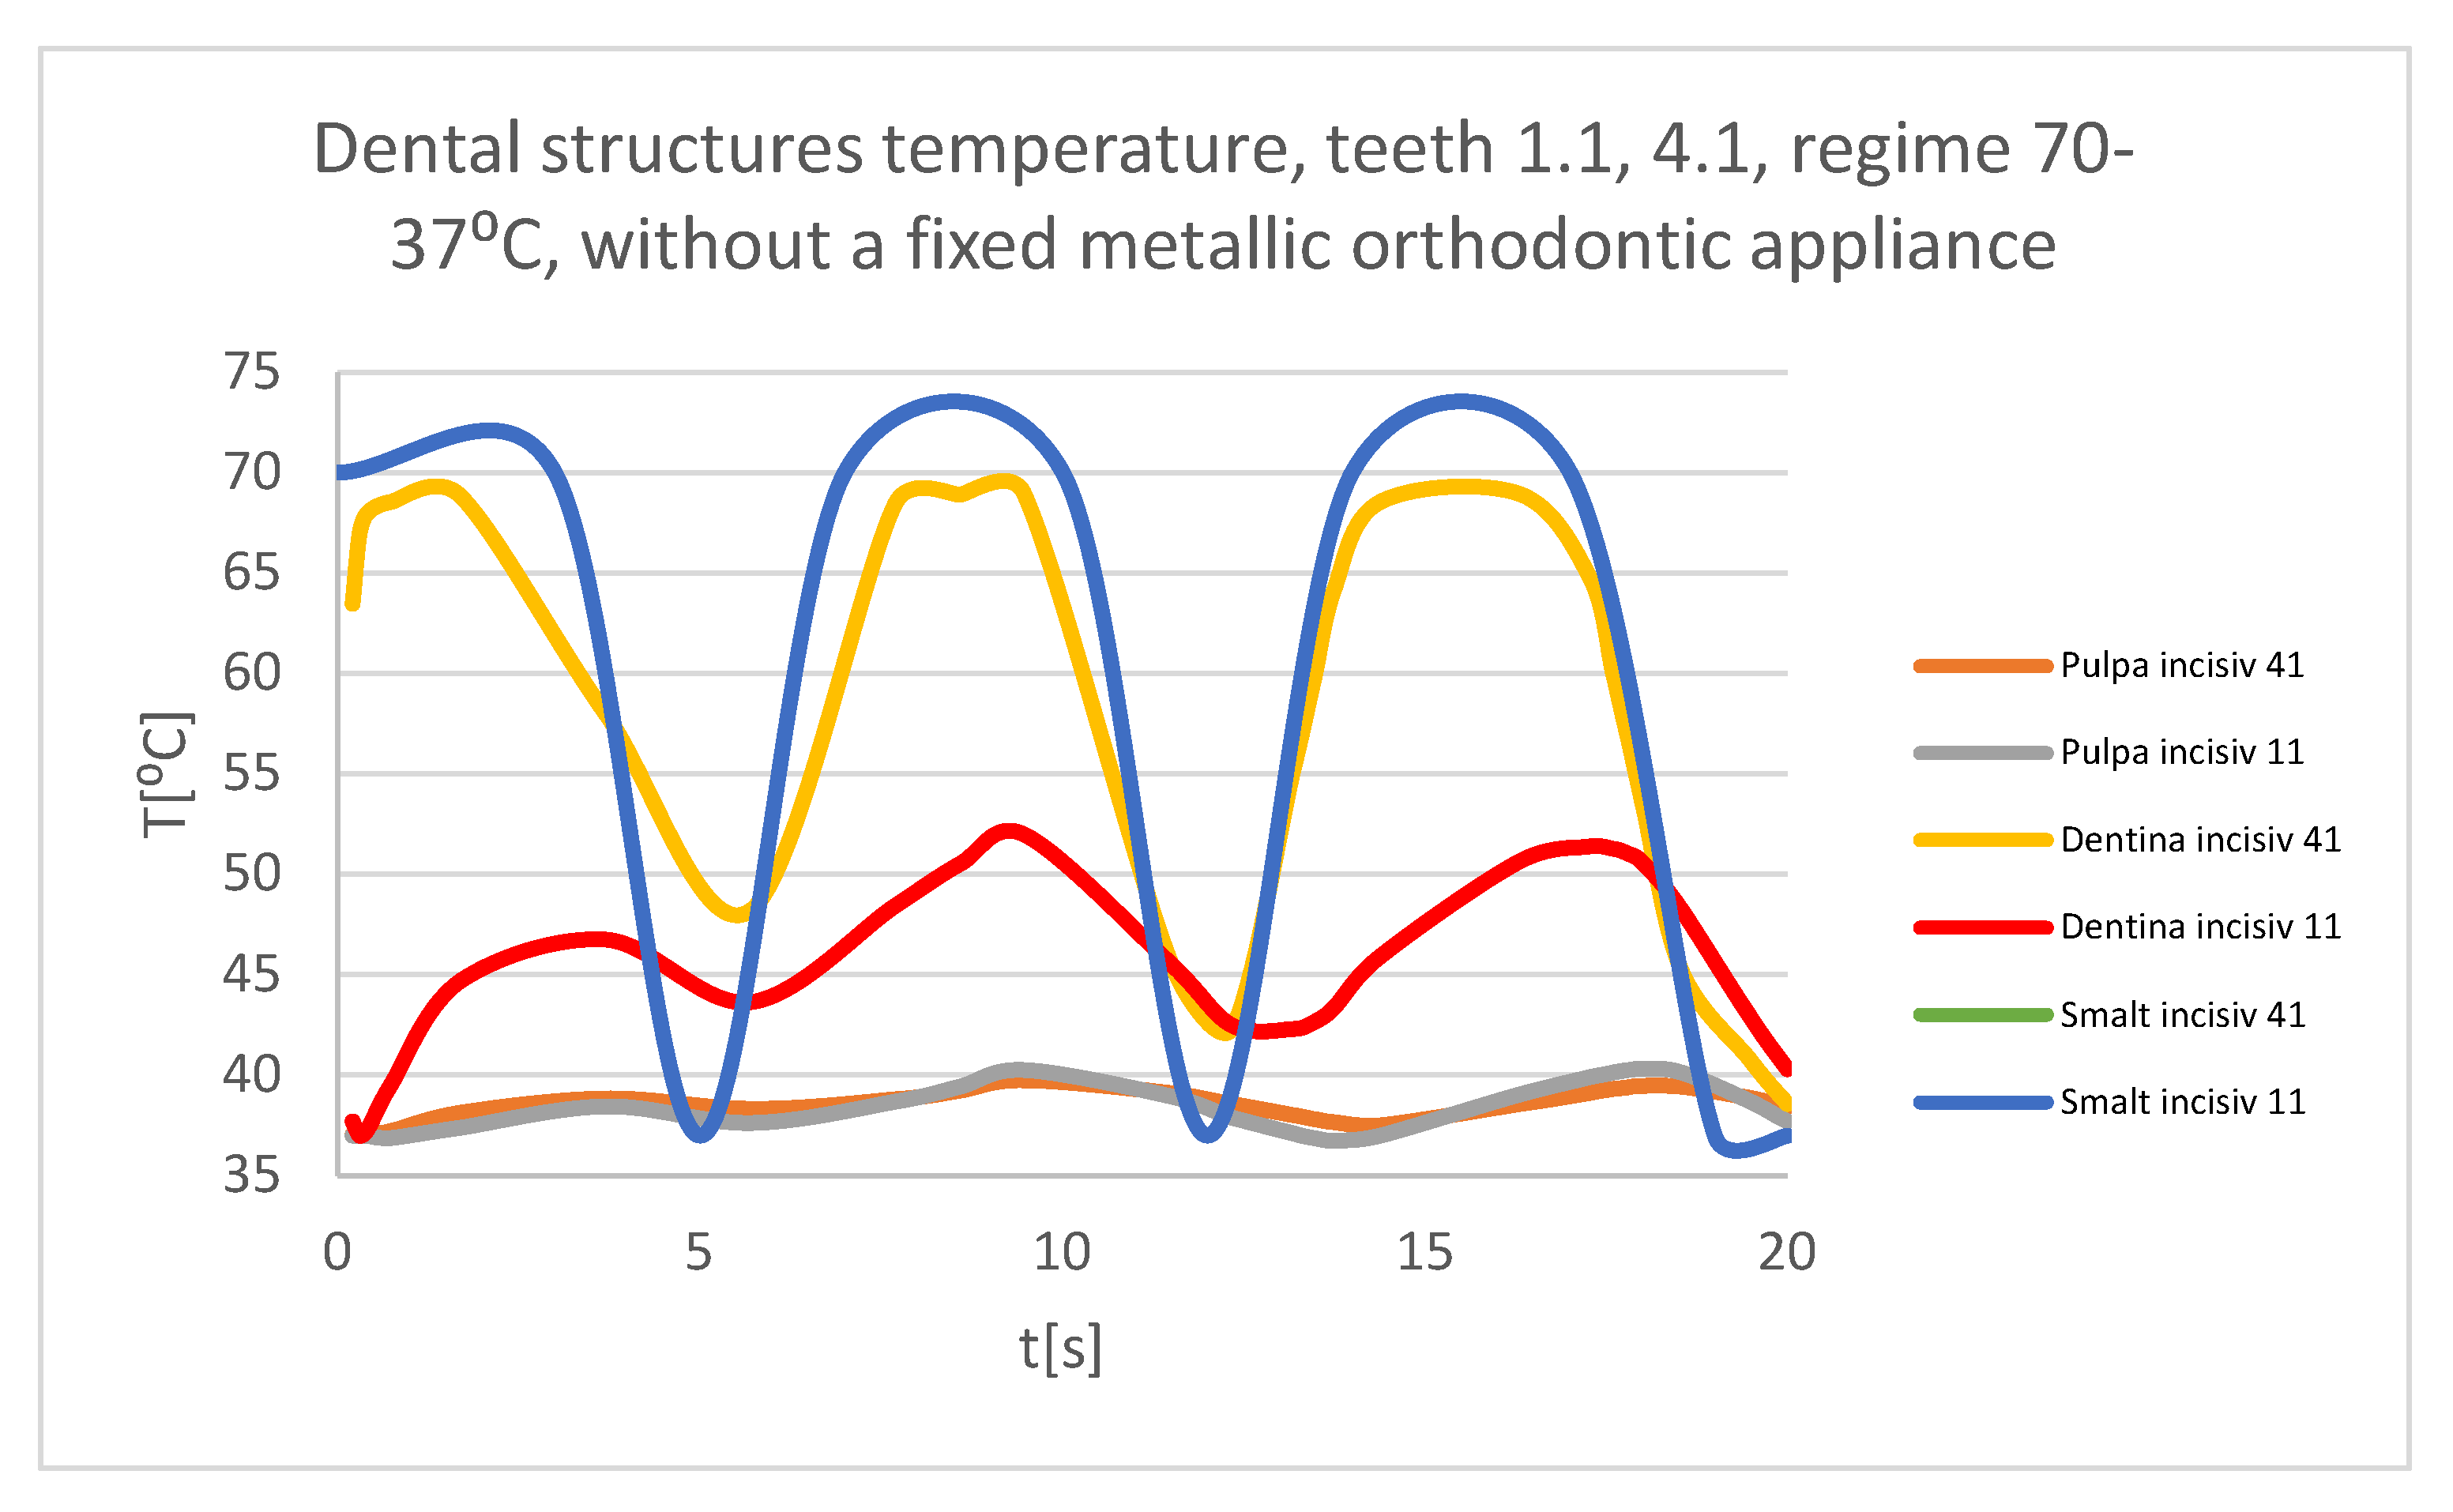
Figure 34.
Comparative diagram of the dental structures temperatures of teeth 1.1, 4.1 subjected to the hot thermal source.
Figure 34.
Comparative diagram of the dental structures temperatures of teeth 1.1, 4.1 subjected to the hot thermal source.
Figure 35.
Temperature map.
Figure 35.
Temperature map.
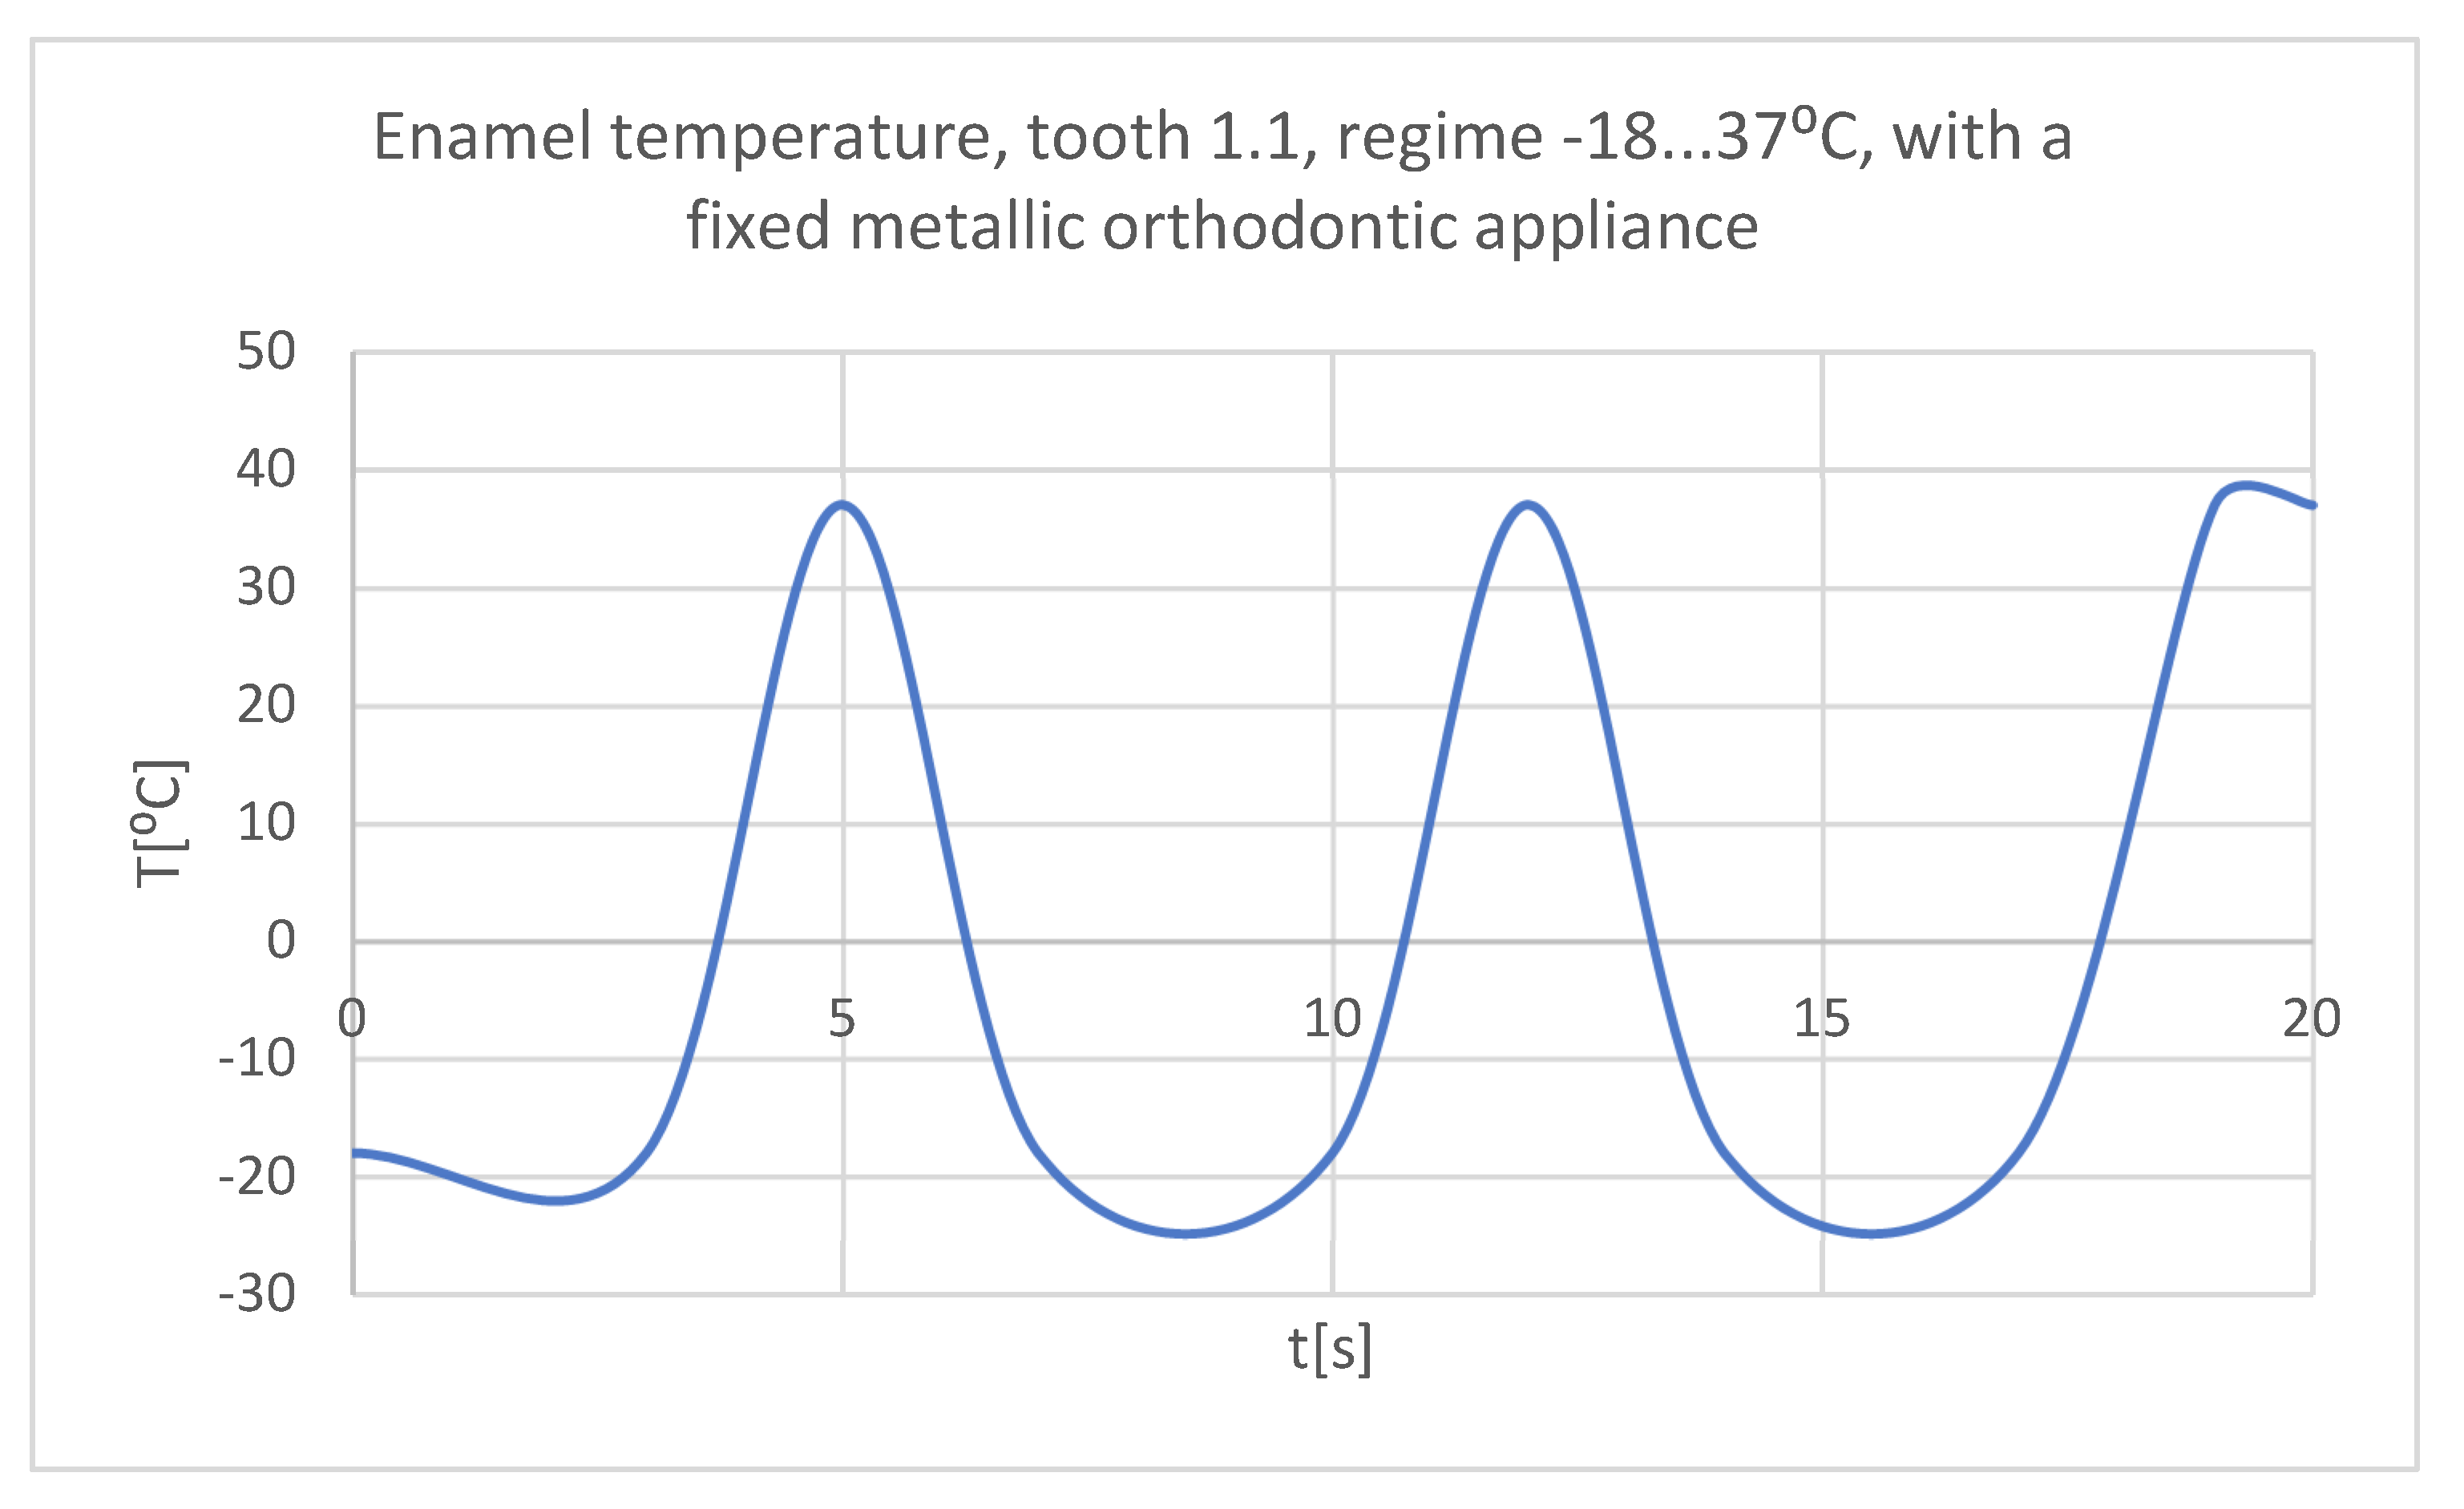
Figure 36.
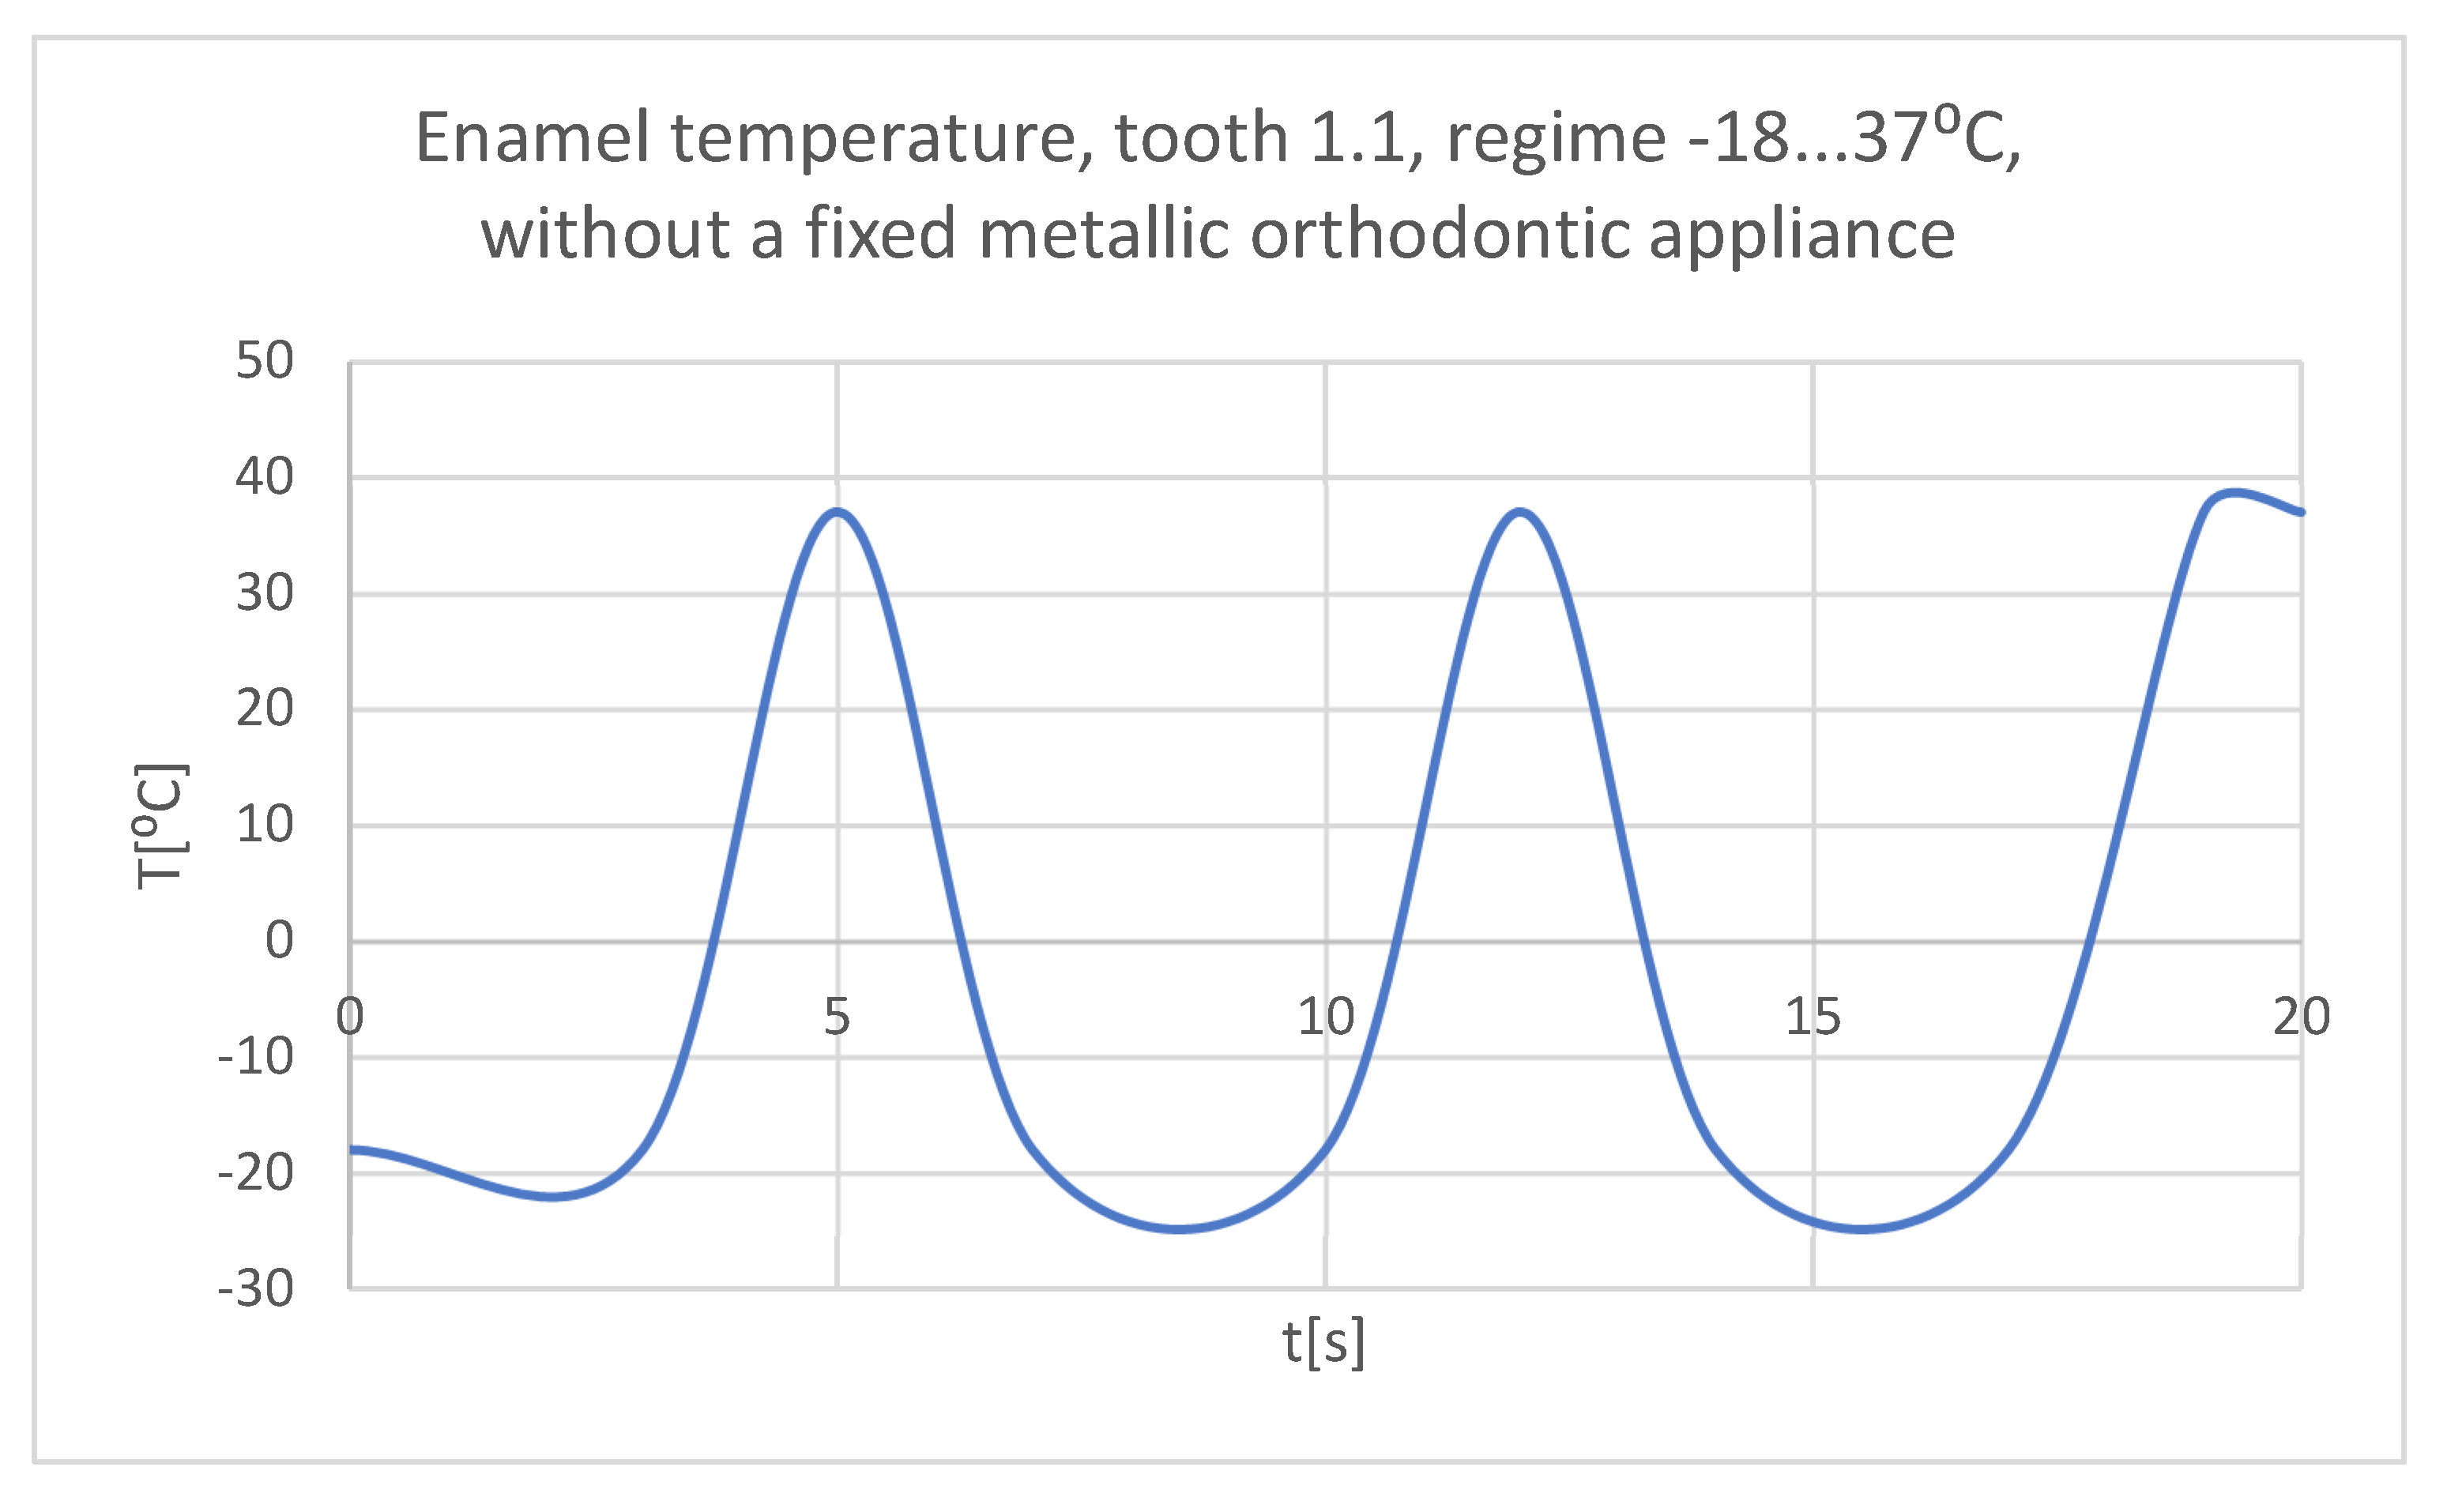
The temperature in the dental enamel of tooth 1.1 subjected to the cold thermal source.
Figure 36.
The temperature in the dental enamel of tooth 1.1 subjected to the cold thermal source.
Figure 37.
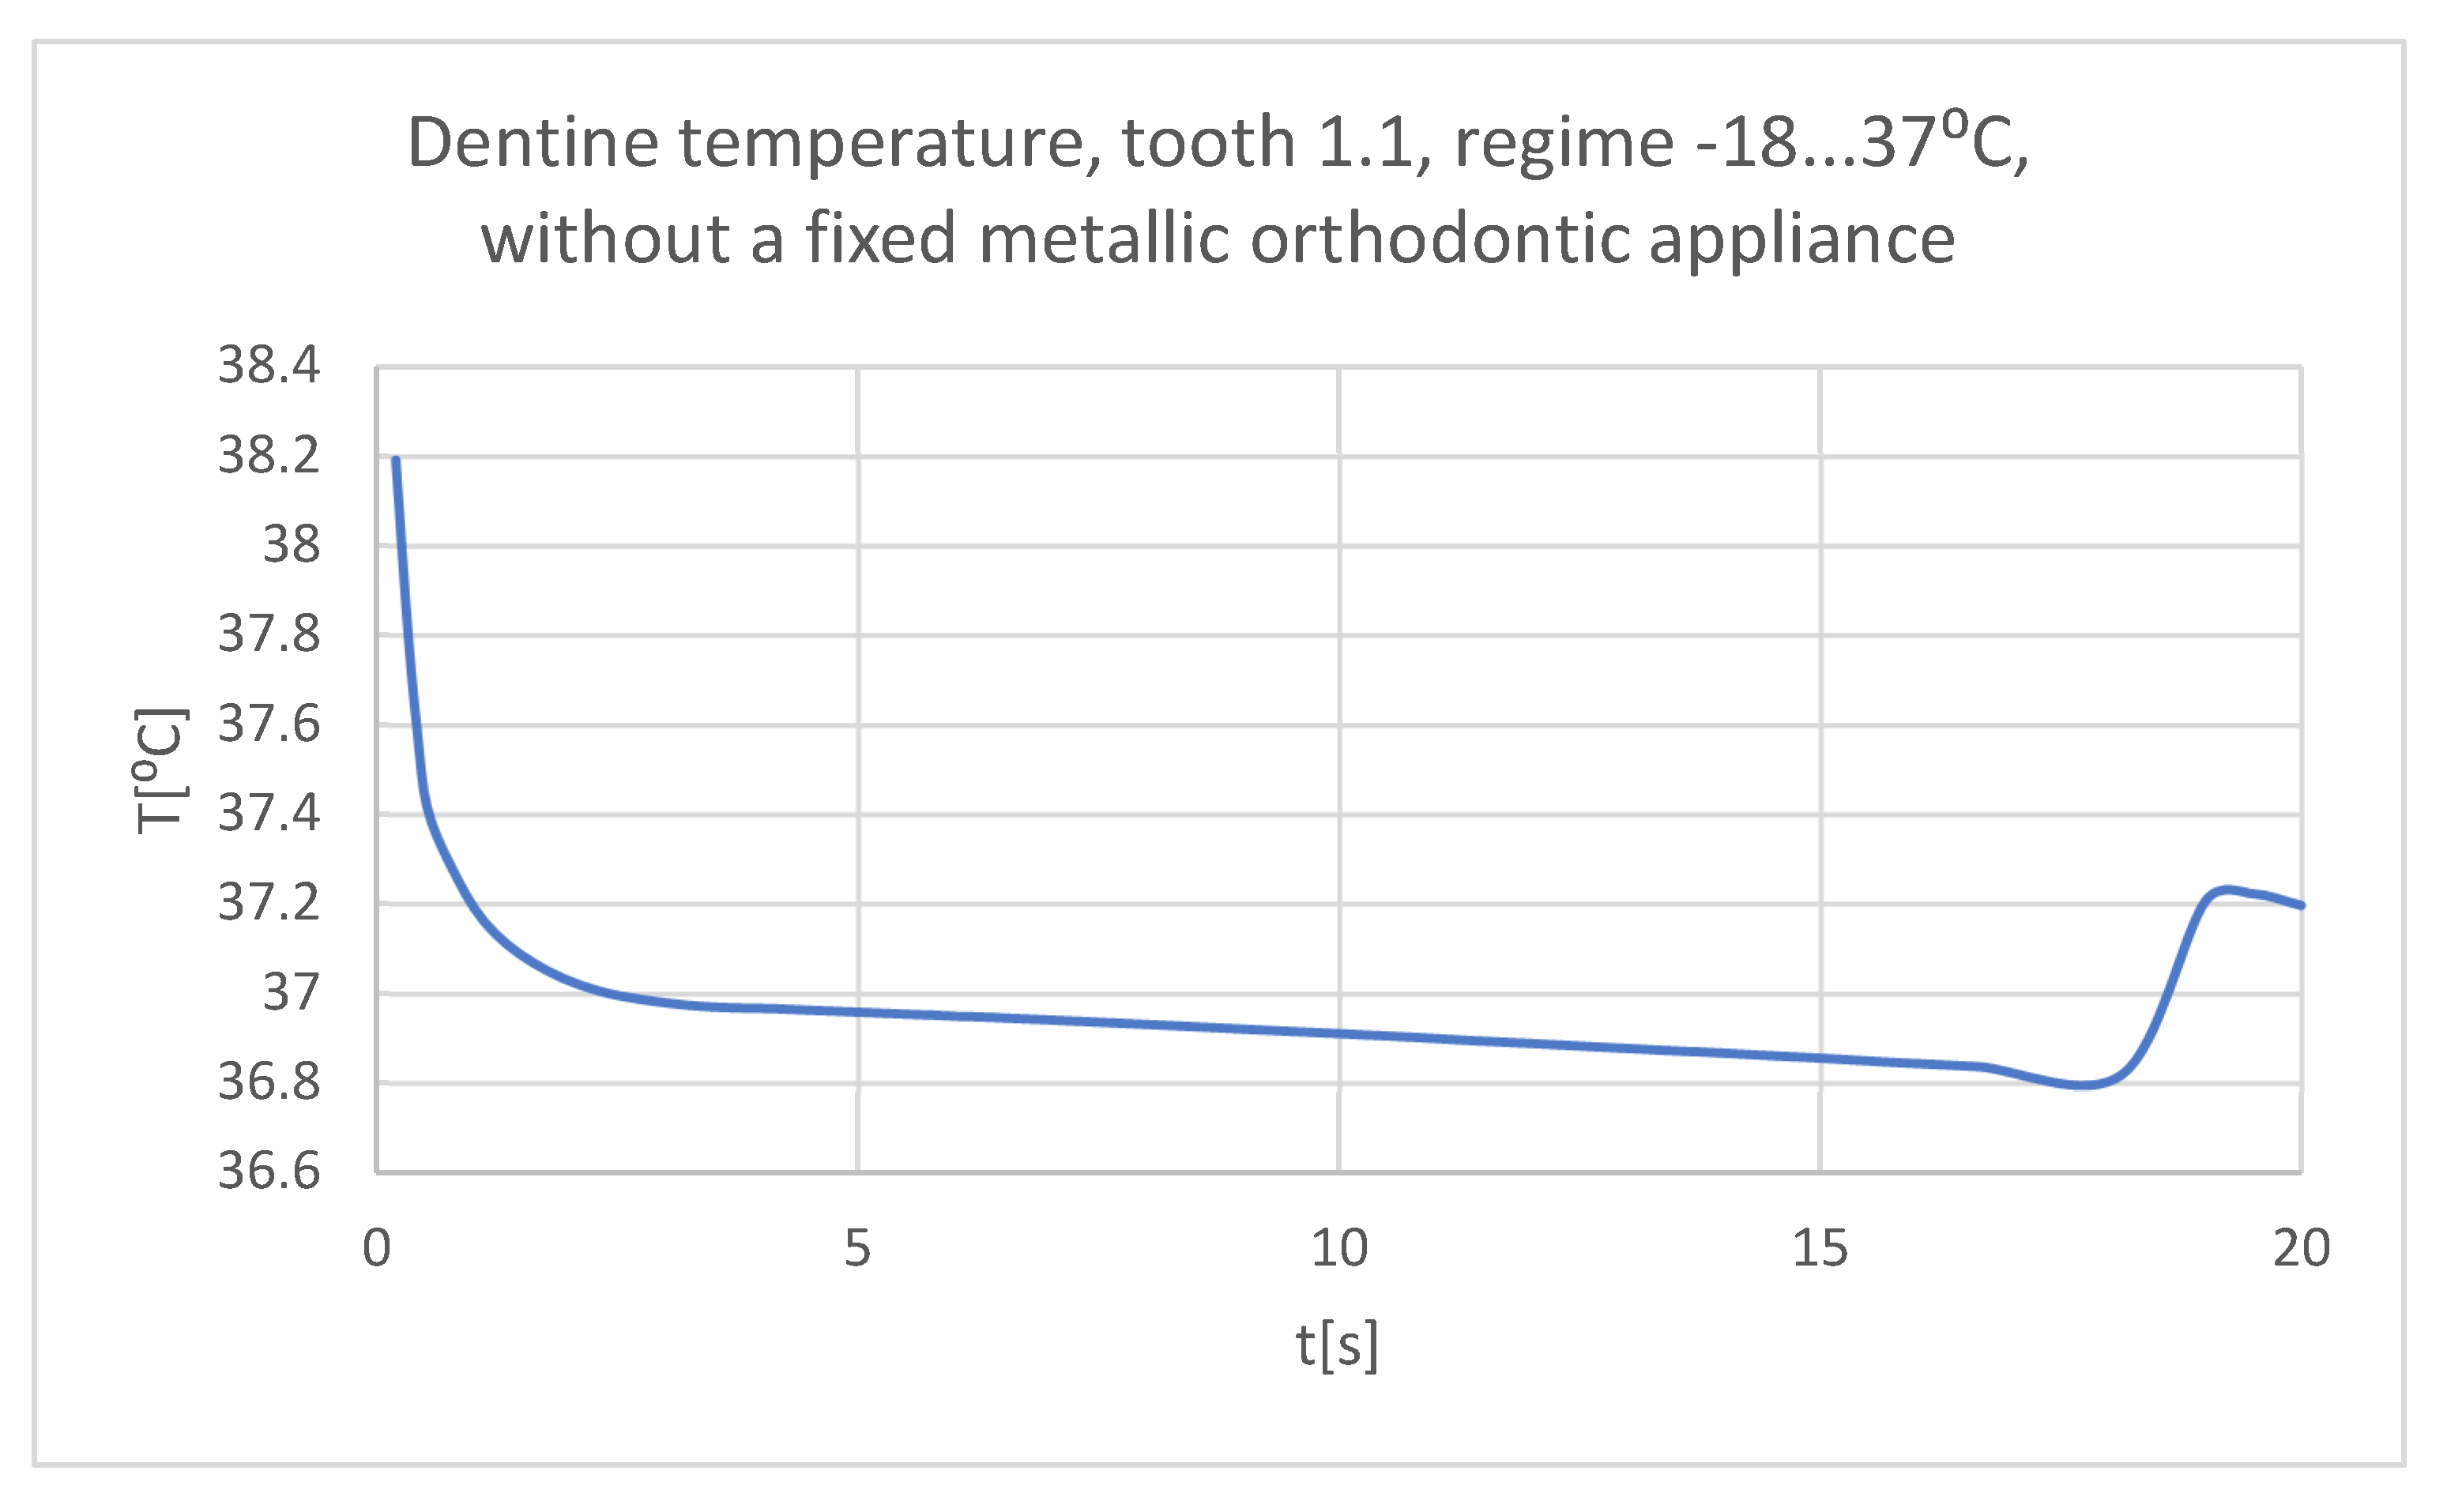
The temperature in the dentine of tooth 1.1 subjected to the cold thermal source.
Figure 37.
The temperature in the dentine of tooth 1.1 subjected to the cold thermal source.
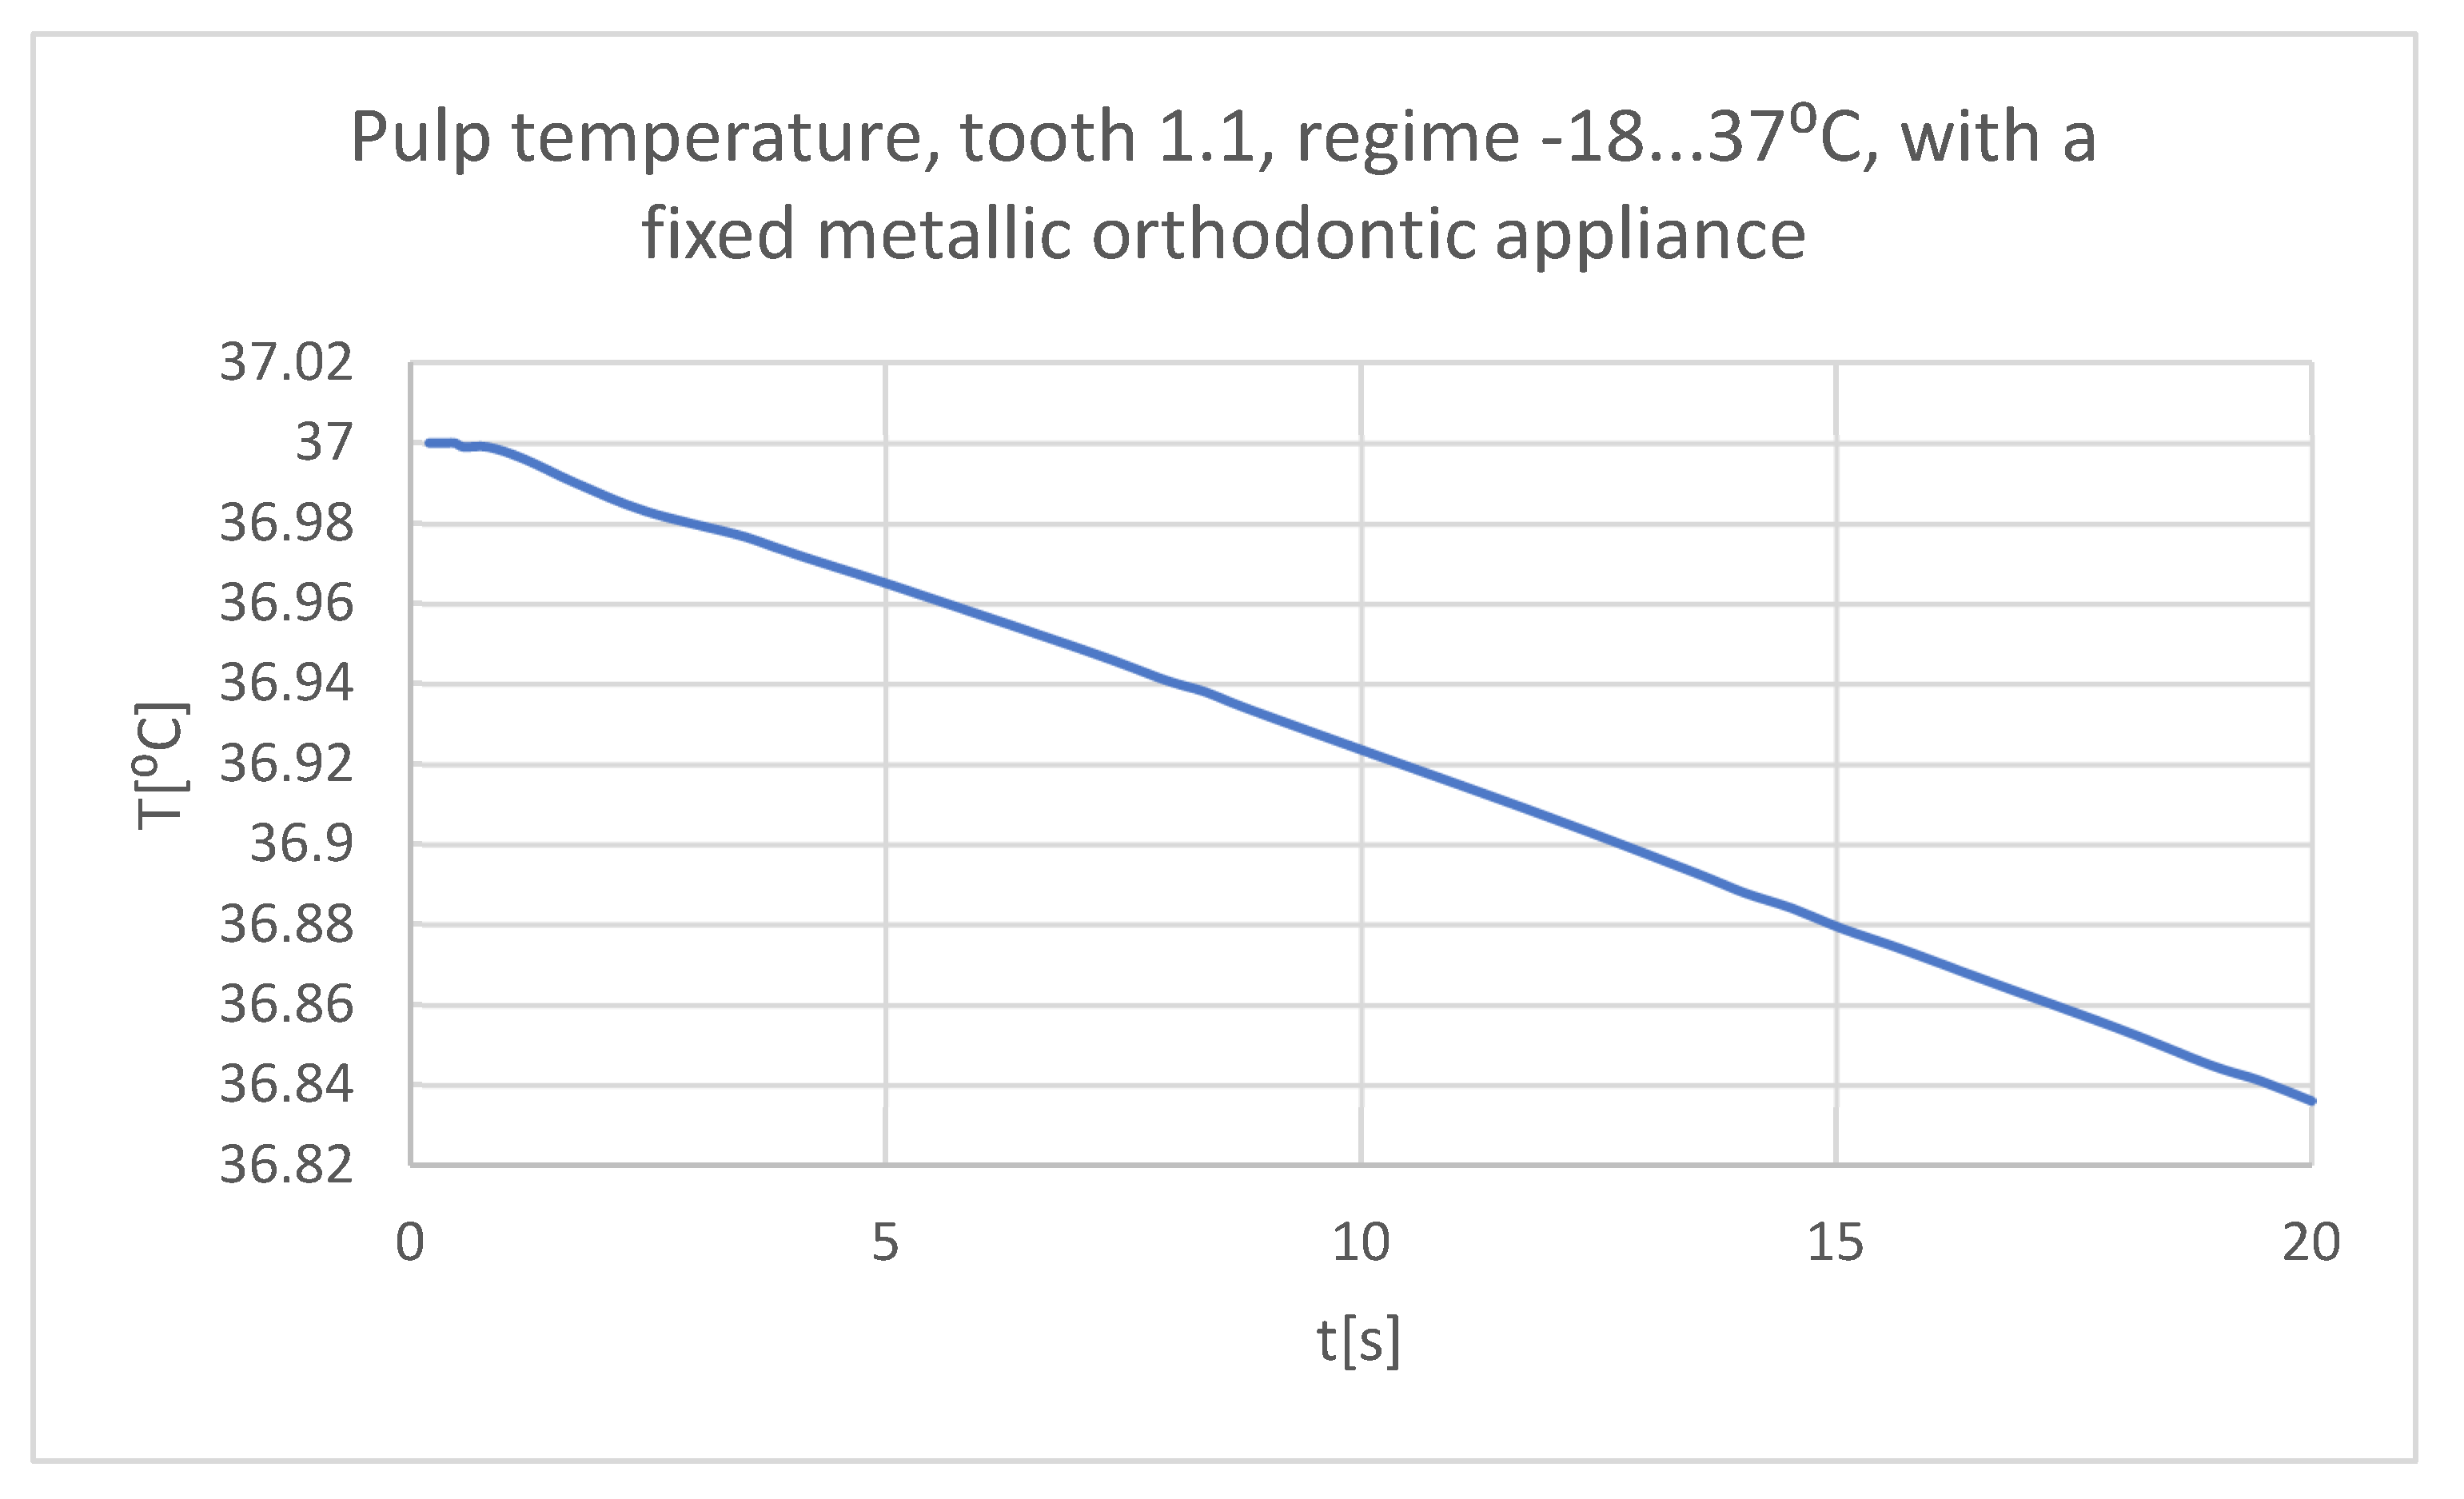
Figure 38.
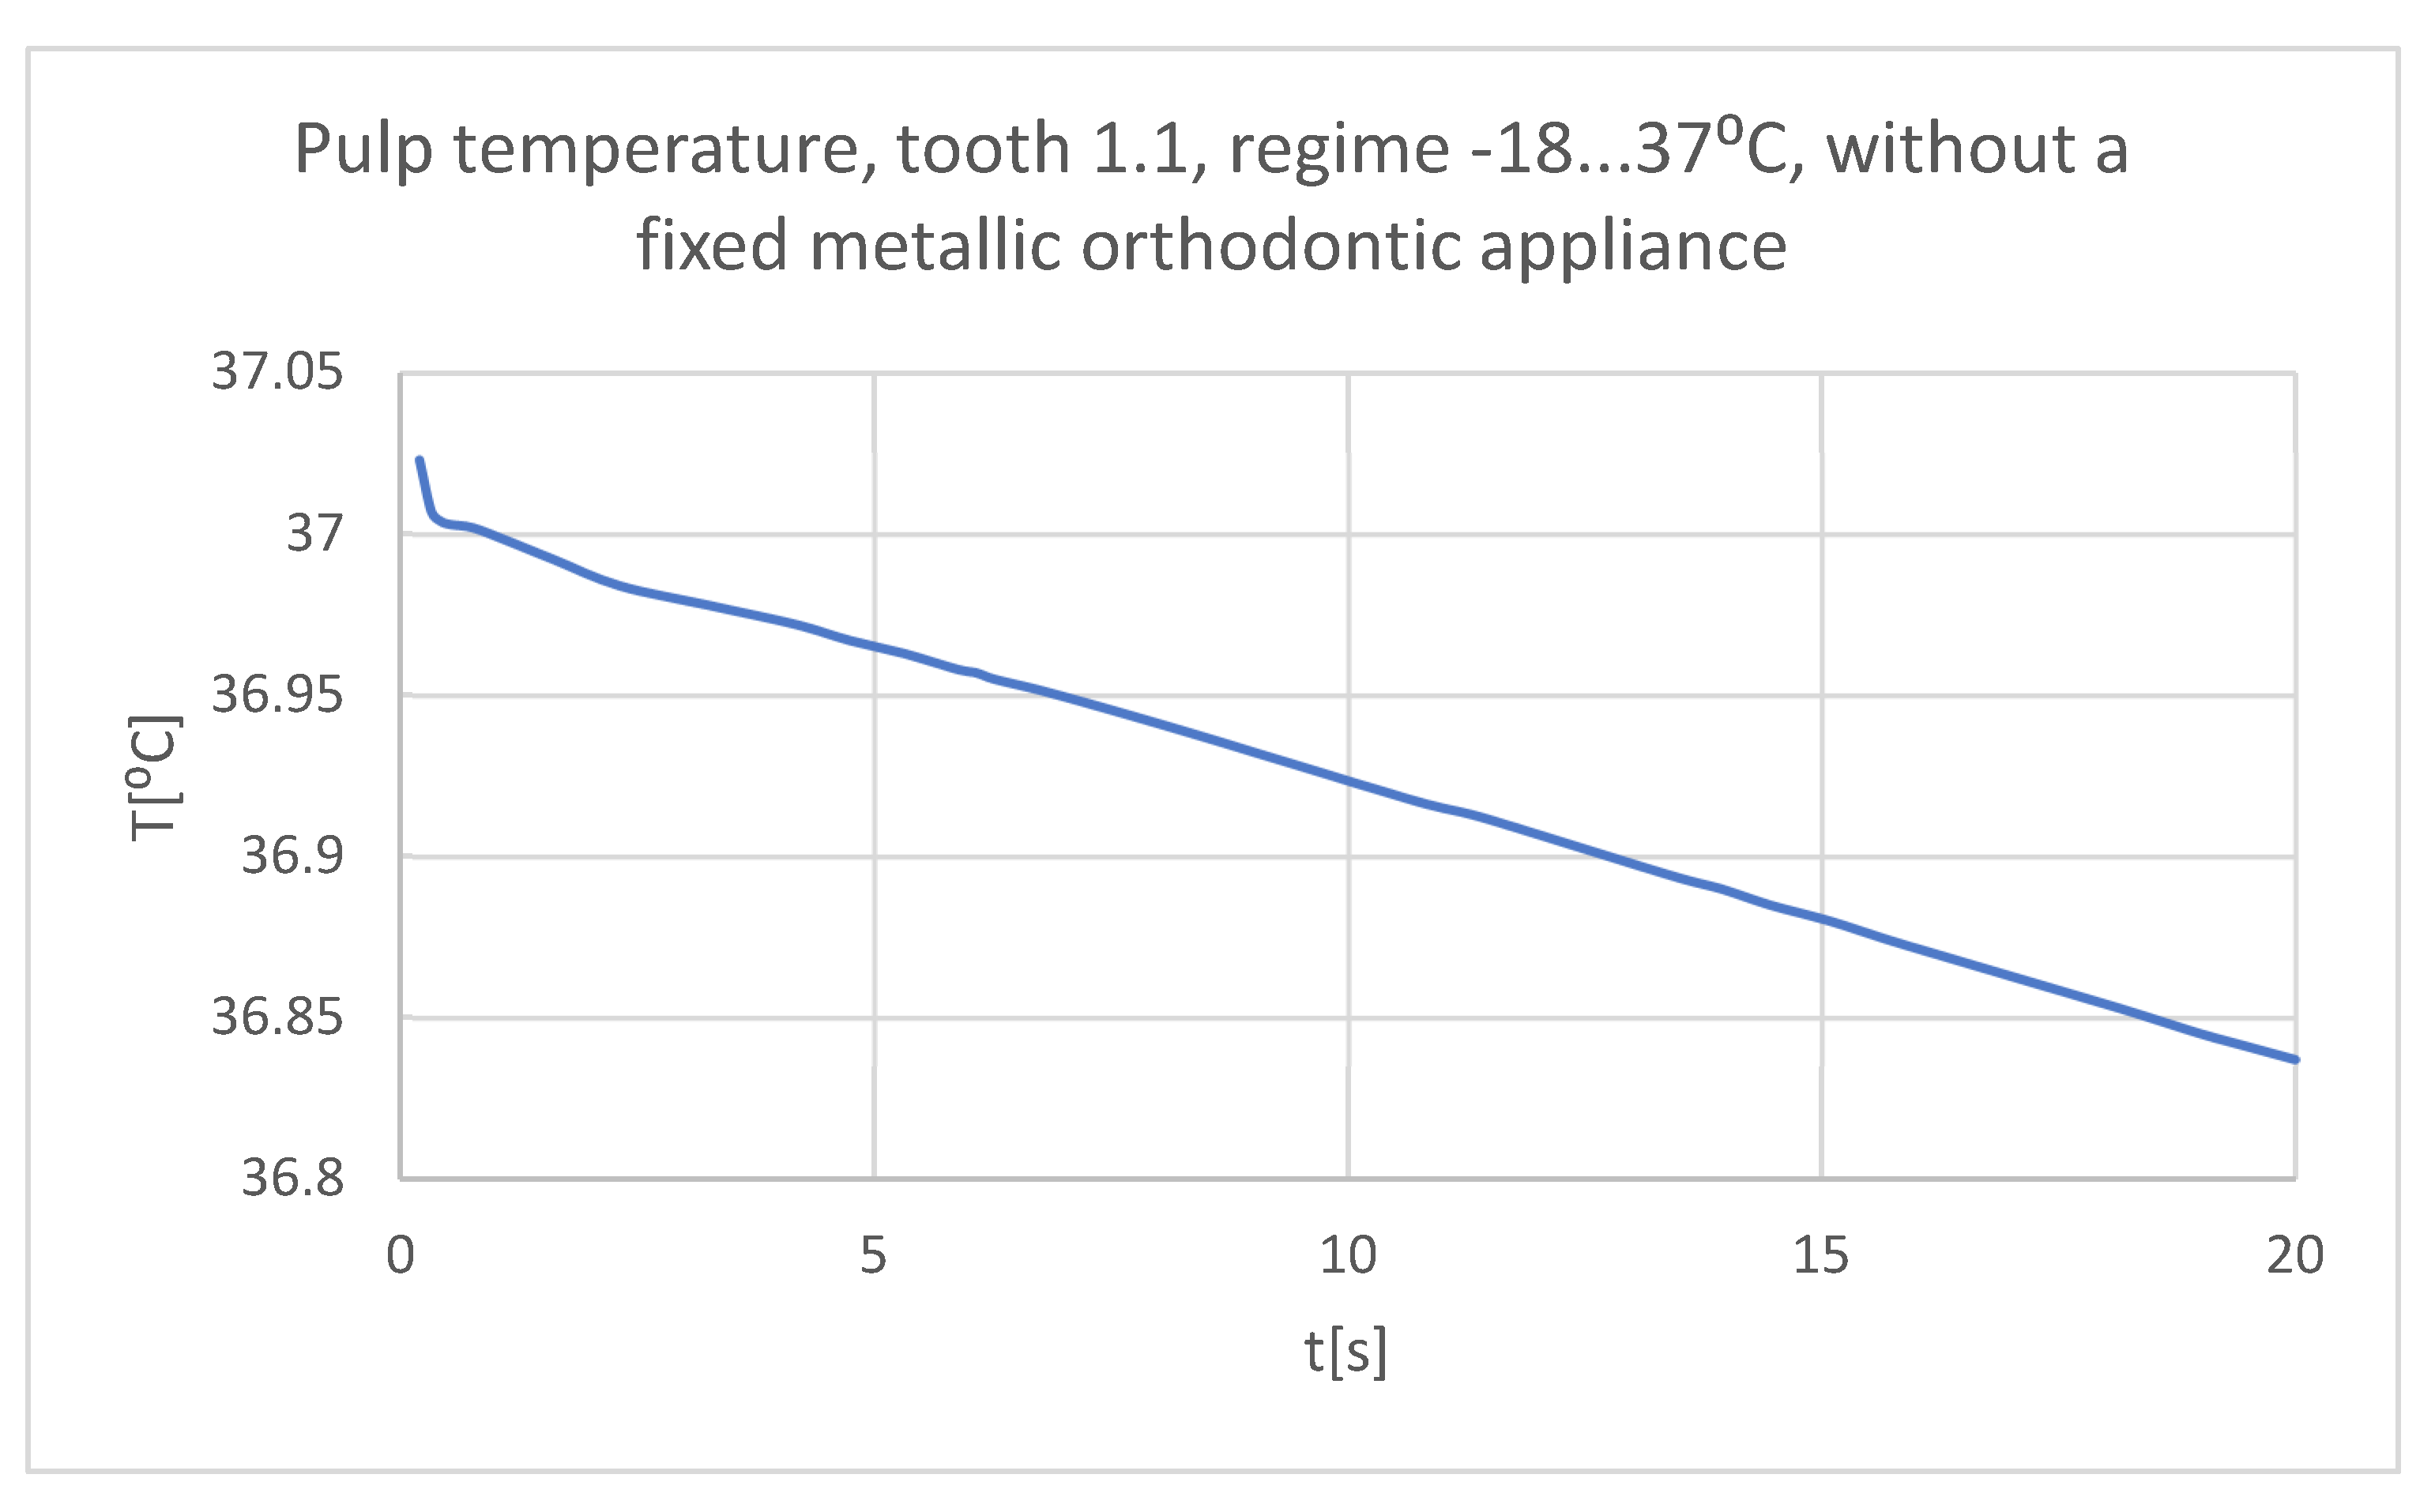
The temperature in the pulp of tooth 1.1 subjected to the cold thermal source.
Figure 38.
The temperature in the pulp of tooth 1.1 subjected to the cold thermal source.
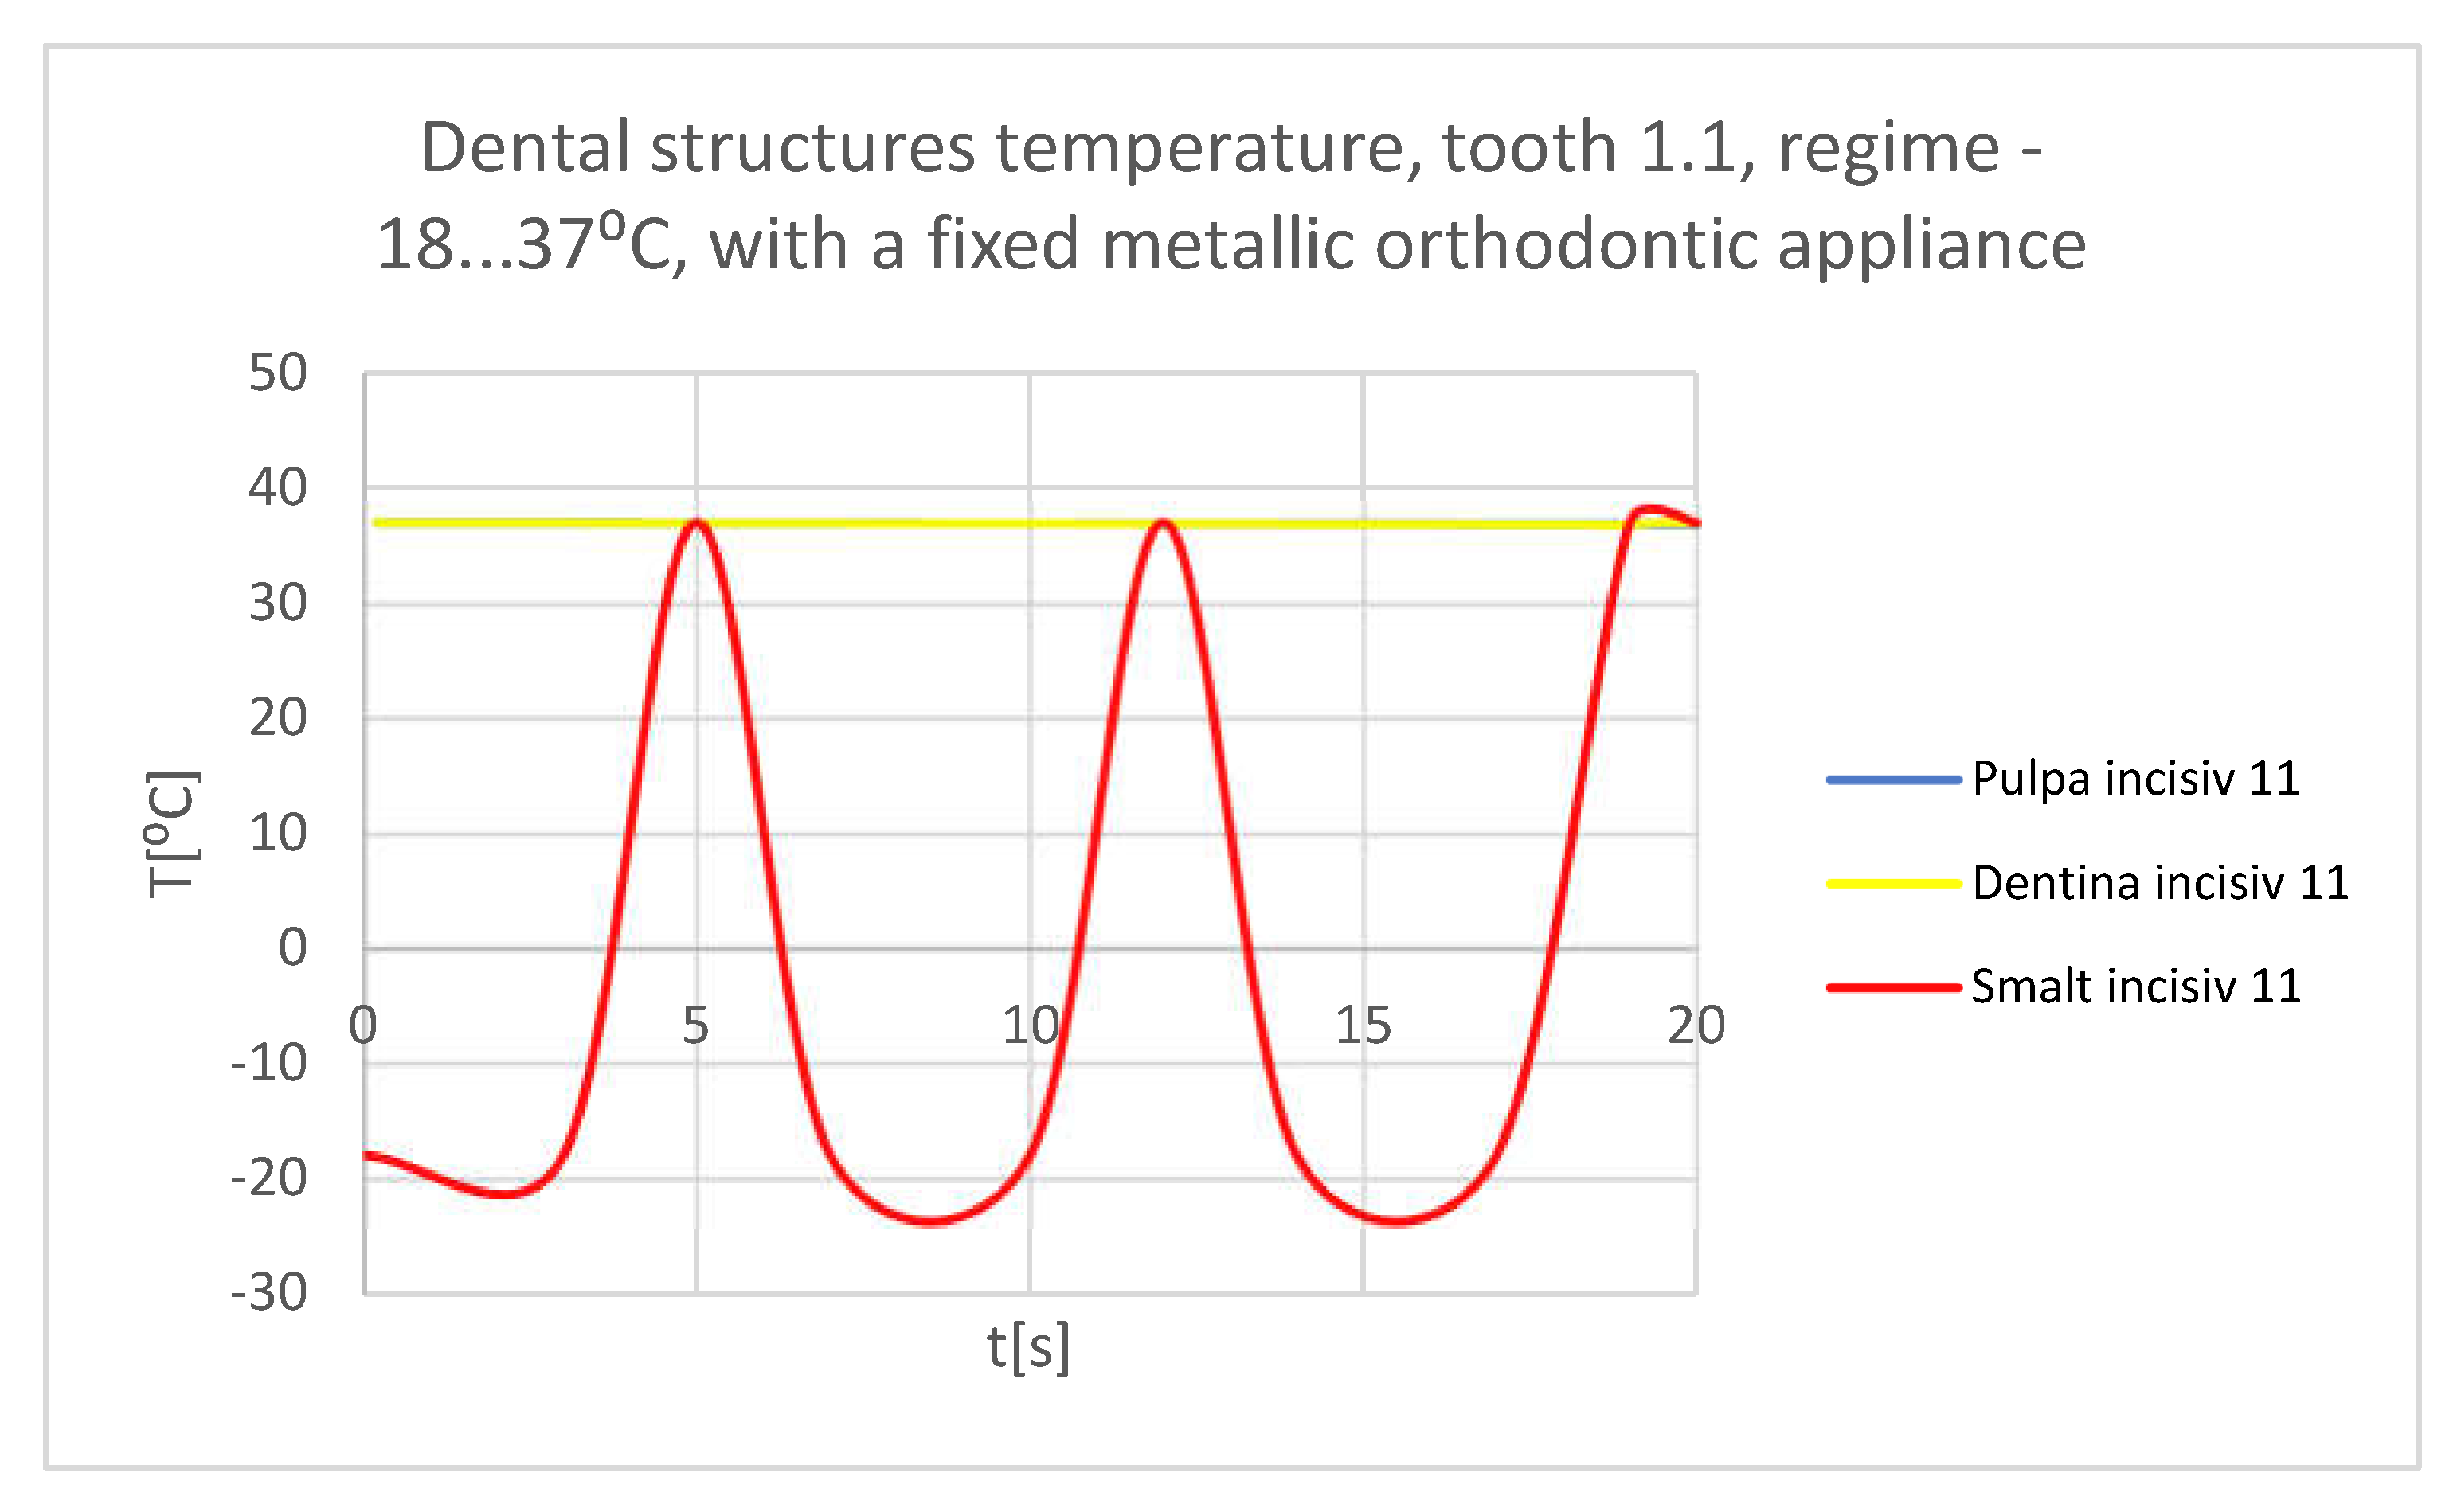
Figure 39.
Comparative diagram of the dental structures temperatures of tooth 1.1 subjected to the cold thermal source.
Figure 39.
Comparative diagram of the dental structures temperatures of tooth 1.1 subjected to the cold thermal source.
Figure 40.
The temperature in the dental enamel of tooth 4.1 subjected to the cold thermal source.
Figure 40.
The temperature in the dental enamel of tooth 4.1 subjected to the cold thermal source.
Figure 41.
The temperature in the dentin of tooth 4.1 subjected to the cold thermal source.
Figure 41.
The temperature in the dentin of tooth 4.1 subjected to the cold thermal source.
Figure 42.
The temperature in the pulp of tooth 4.1 subjected to the cold thermal source.
Figure 42.
The temperature in the pulp of tooth 4.1 subjected to the cold thermal source.
Figure 43.
Comparative diagram of the dental structures temperatures of tooth 4.1 subjected to the cold thermal source.
Figure 43.
Comparative diagram of the dental structures temperatures of tooth 4.1 subjected to the cold thermal source.
Figure 44.
Comparative diagram of the dental structures temperatures of teeth 1.1, 4.1 subjected to the cold thermal source.
Figure 44.
Comparative diagram of the dental structures temperatures of teeth 1.1, 4.1 subjected to the cold thermal source.
Figure 45.
Temperature map.
Figure 45.
Temperature map.
Figure 46.
The temperature in the dental enamel of tooth 1.1 subjected to the hot thermal source.
Figure 46.
The temperature in the dental enamel of tooth 1.1 subjected to the hot thermal source.
Figure 47.
The temperature in the dentine of tooth 1.1 subjected to the hot thermal source.
Figure 47.
The temperature in the dentine of tooth 1.1 subjected to the hot thermal source.
Figure 48.
The temperature in the pulp of tooth 1.1 subjected to the hot thermal source.
Figure 48.
The temperature in the pulp of tooth 1.1 subjected to the hot thermal source.
Figure 49.
Comparative diagram of the dental structures temperature of tooth 1.1 subjected to the hot thermal source.
Figure 49.
Comparative diagram of the dental structures temperature of tooth 1.1 subjected to the hot thermal source.
Figure 50.
The temperature in the dental enamel of tooth 4.1 subjected to the hot thermal source.
Figure 50.
The temperature in the dental enamel of tooth 4.1 subjected to the hot thermal source.
Figure 51.
The temperature in the dentin of tooth 4.1 subjected to the hot thermal source.
Figure 51.
The temperature in the dentin of tooth 4.1 subjected to the hot thermal source.
Figure 52.
The temperature in the pulp of tooth 4.1 subjected to the hot thermal source.
Figure 52.
The temperature in the pulp of tooth 4.1 subjected to the hot thermal source.
Figure 53.
Comparative diagram of the dental structures temperature of tooth 4.1 subjected to the hot thermal source.
Figure 53.
Comparative diagram of the dental structures temperature of tooth 4.1 subjected to the hot thermal source.
Figure 54.
Comparative diagram of the dental structures temperature of teeth 1.1, 4.1 subjected to the hot thermal source.
Figure 54.
Comparative diagram of the dental structures temperature of teeth 1.1, 4.1 subjected to the hot thermal source.
Figure 55.
Temperature map.
Figure 55.
Temperature map.
Figure 56.
The temperature in the dental enamel of tooth 1.1 subjected to the cold thermal source.
Figure 56.
The temperature in the dental enamel of tooth 1.1 subjected to the cold thermal source.
Figure 57.
The temperature in the dentine of tooth 1.1 subjected to the cold thermal source.
Figure 57.
The temperature in the dentine of tooth 1.1 subjected to the cold thermal source.
Figure 58.
The temperature in the pulp of tooth 1.1 subjected to the cold thermal source.
Figure 58.
The temperature in the pulp of tooth 1.1 subjected to the cold thermal source.
Figure 59.
Comparative diagram of the dental structures temperature of tooth 1.1 subjected to the cold thermal source.
Figure 59.
Comparative diagram of the dental structures temperature of tooth 1.1 subjected to the cold thermal source.
Figure 60.
The temperature in the dental enamel of tooth 4.1 subjected to the cold thermal source.
Figure 60.
The temperature in the dental enamel of tooth 4.1 subjected to the cold thermal source.
Figure 61.
The temperature in the dentin of tooth 4.1 subjected to the cold thermal source.
Figure 61.
The temperature in the dentin of tooth 4.1 subjected to the cold thermal source.
Figure 62.
The temperature in the pulp of tooth 4.1 subjected to the cold thermal source.
Figure 62.
The temperature in the pulp of tooth 4.1 subjected to the cold thermal source.
Figure 63.
Comparative diagram of the dental structures temperature of tooth 4.1 subjected to the cold thermal source.
Figure 63.
Comparative diagram of the dental structures temperature of tooth 4.1 subjected to the cold thermal source.
Figure 64.
Comparative diagram of the dental structures temperature of teeth 1.1, 4.1 subjected to the cold thermal source.
Figure 64.
Comparative diagram of the dental structures temperature of teeth 1.1, 4.1 subjected to the cold thermal source.
Figure 65.
Comparative diagram of the temperature effect on the dental pulp, hot thermal source, for tooth 1.1.
Figure 65.
Comparative diagram of the temperature effect on the dental pulp, hot thermal source, for tooth 1.1.
Figure 66.
Comparative diagram of the temperature effect on the dental pulp, hot thermal source, for tooth 4.1.
Figure 66.
Comparative diagram of the temperature effect on the dental pulp, hot thermal source, for tooth 4.1.
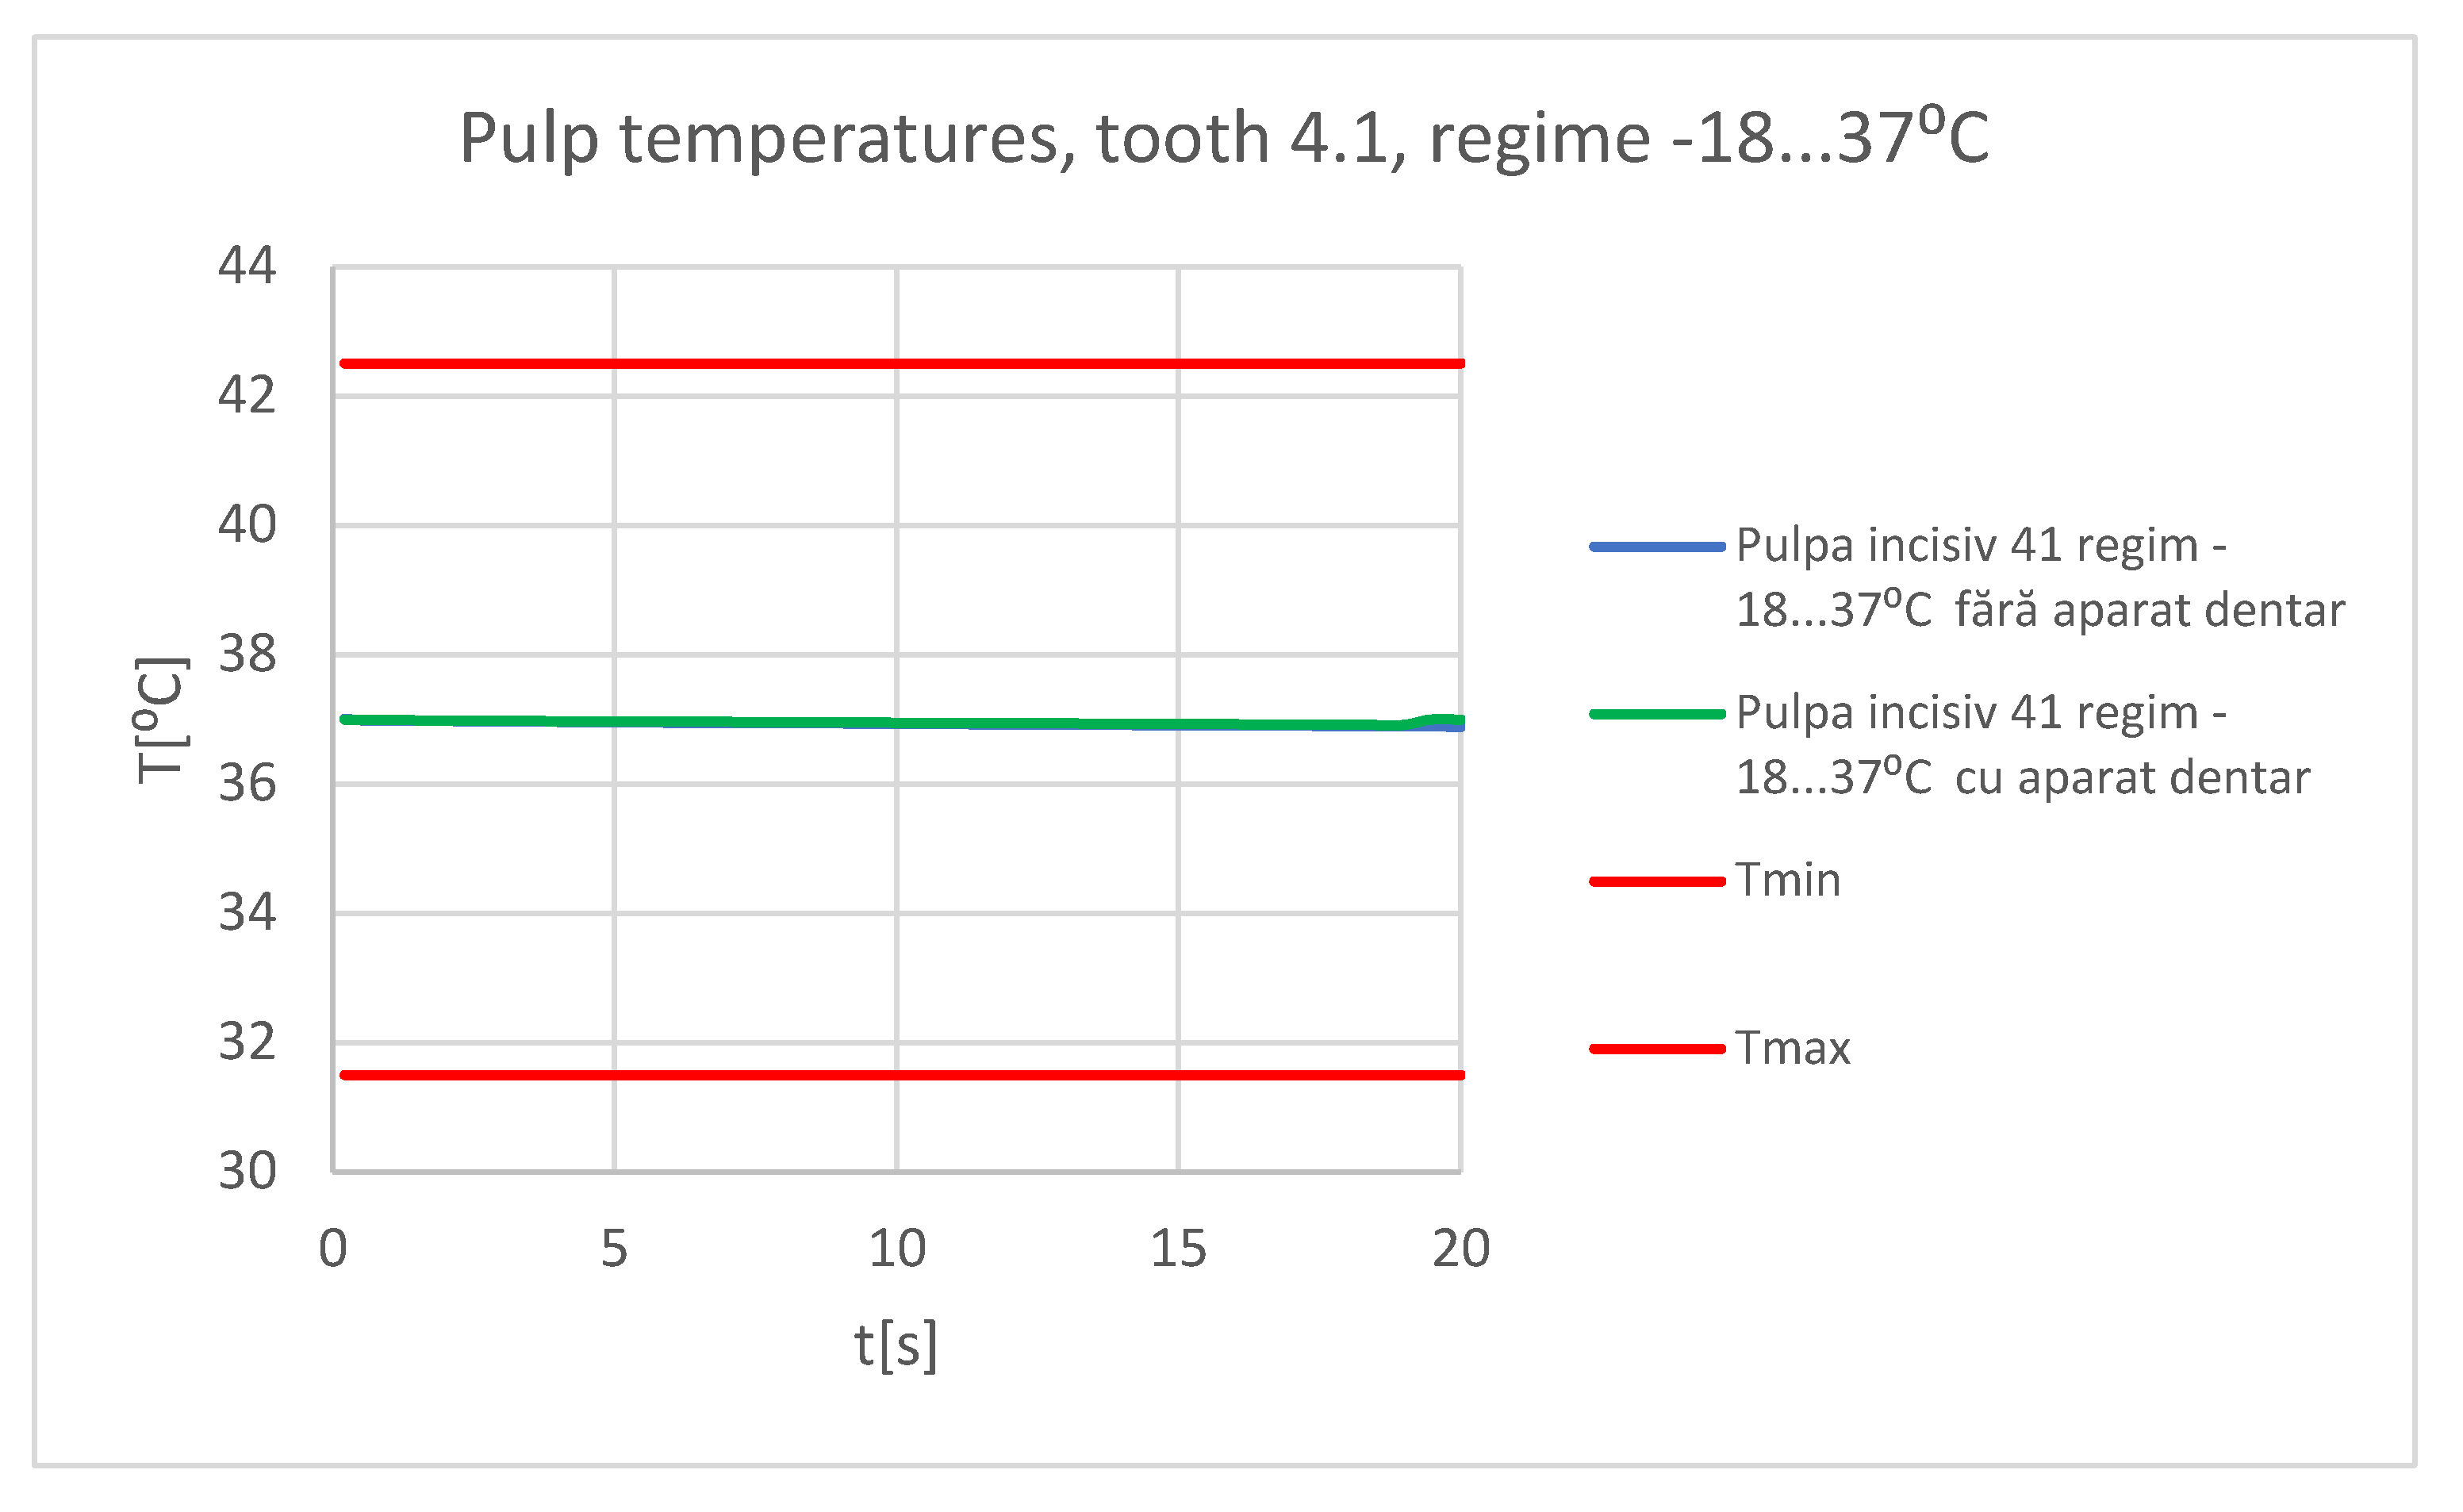
Figure 67.
Comparative diagram of the temperature effect on the dental pulp, cold thermal source, for tooth 1.1.
Figure 67.
Comparative diagram of the temperature effect on the dental pulp, cold thermal source, for tooth 1.1.
Figure 68.
Comparative diagram of the temperature effect on the dental pulp, cold thermal source, for tooth 4.1.
Figure 68.
Comparative diagram of the temperature effect on the dental pulp, cold thermal source, for tooth 4.1.
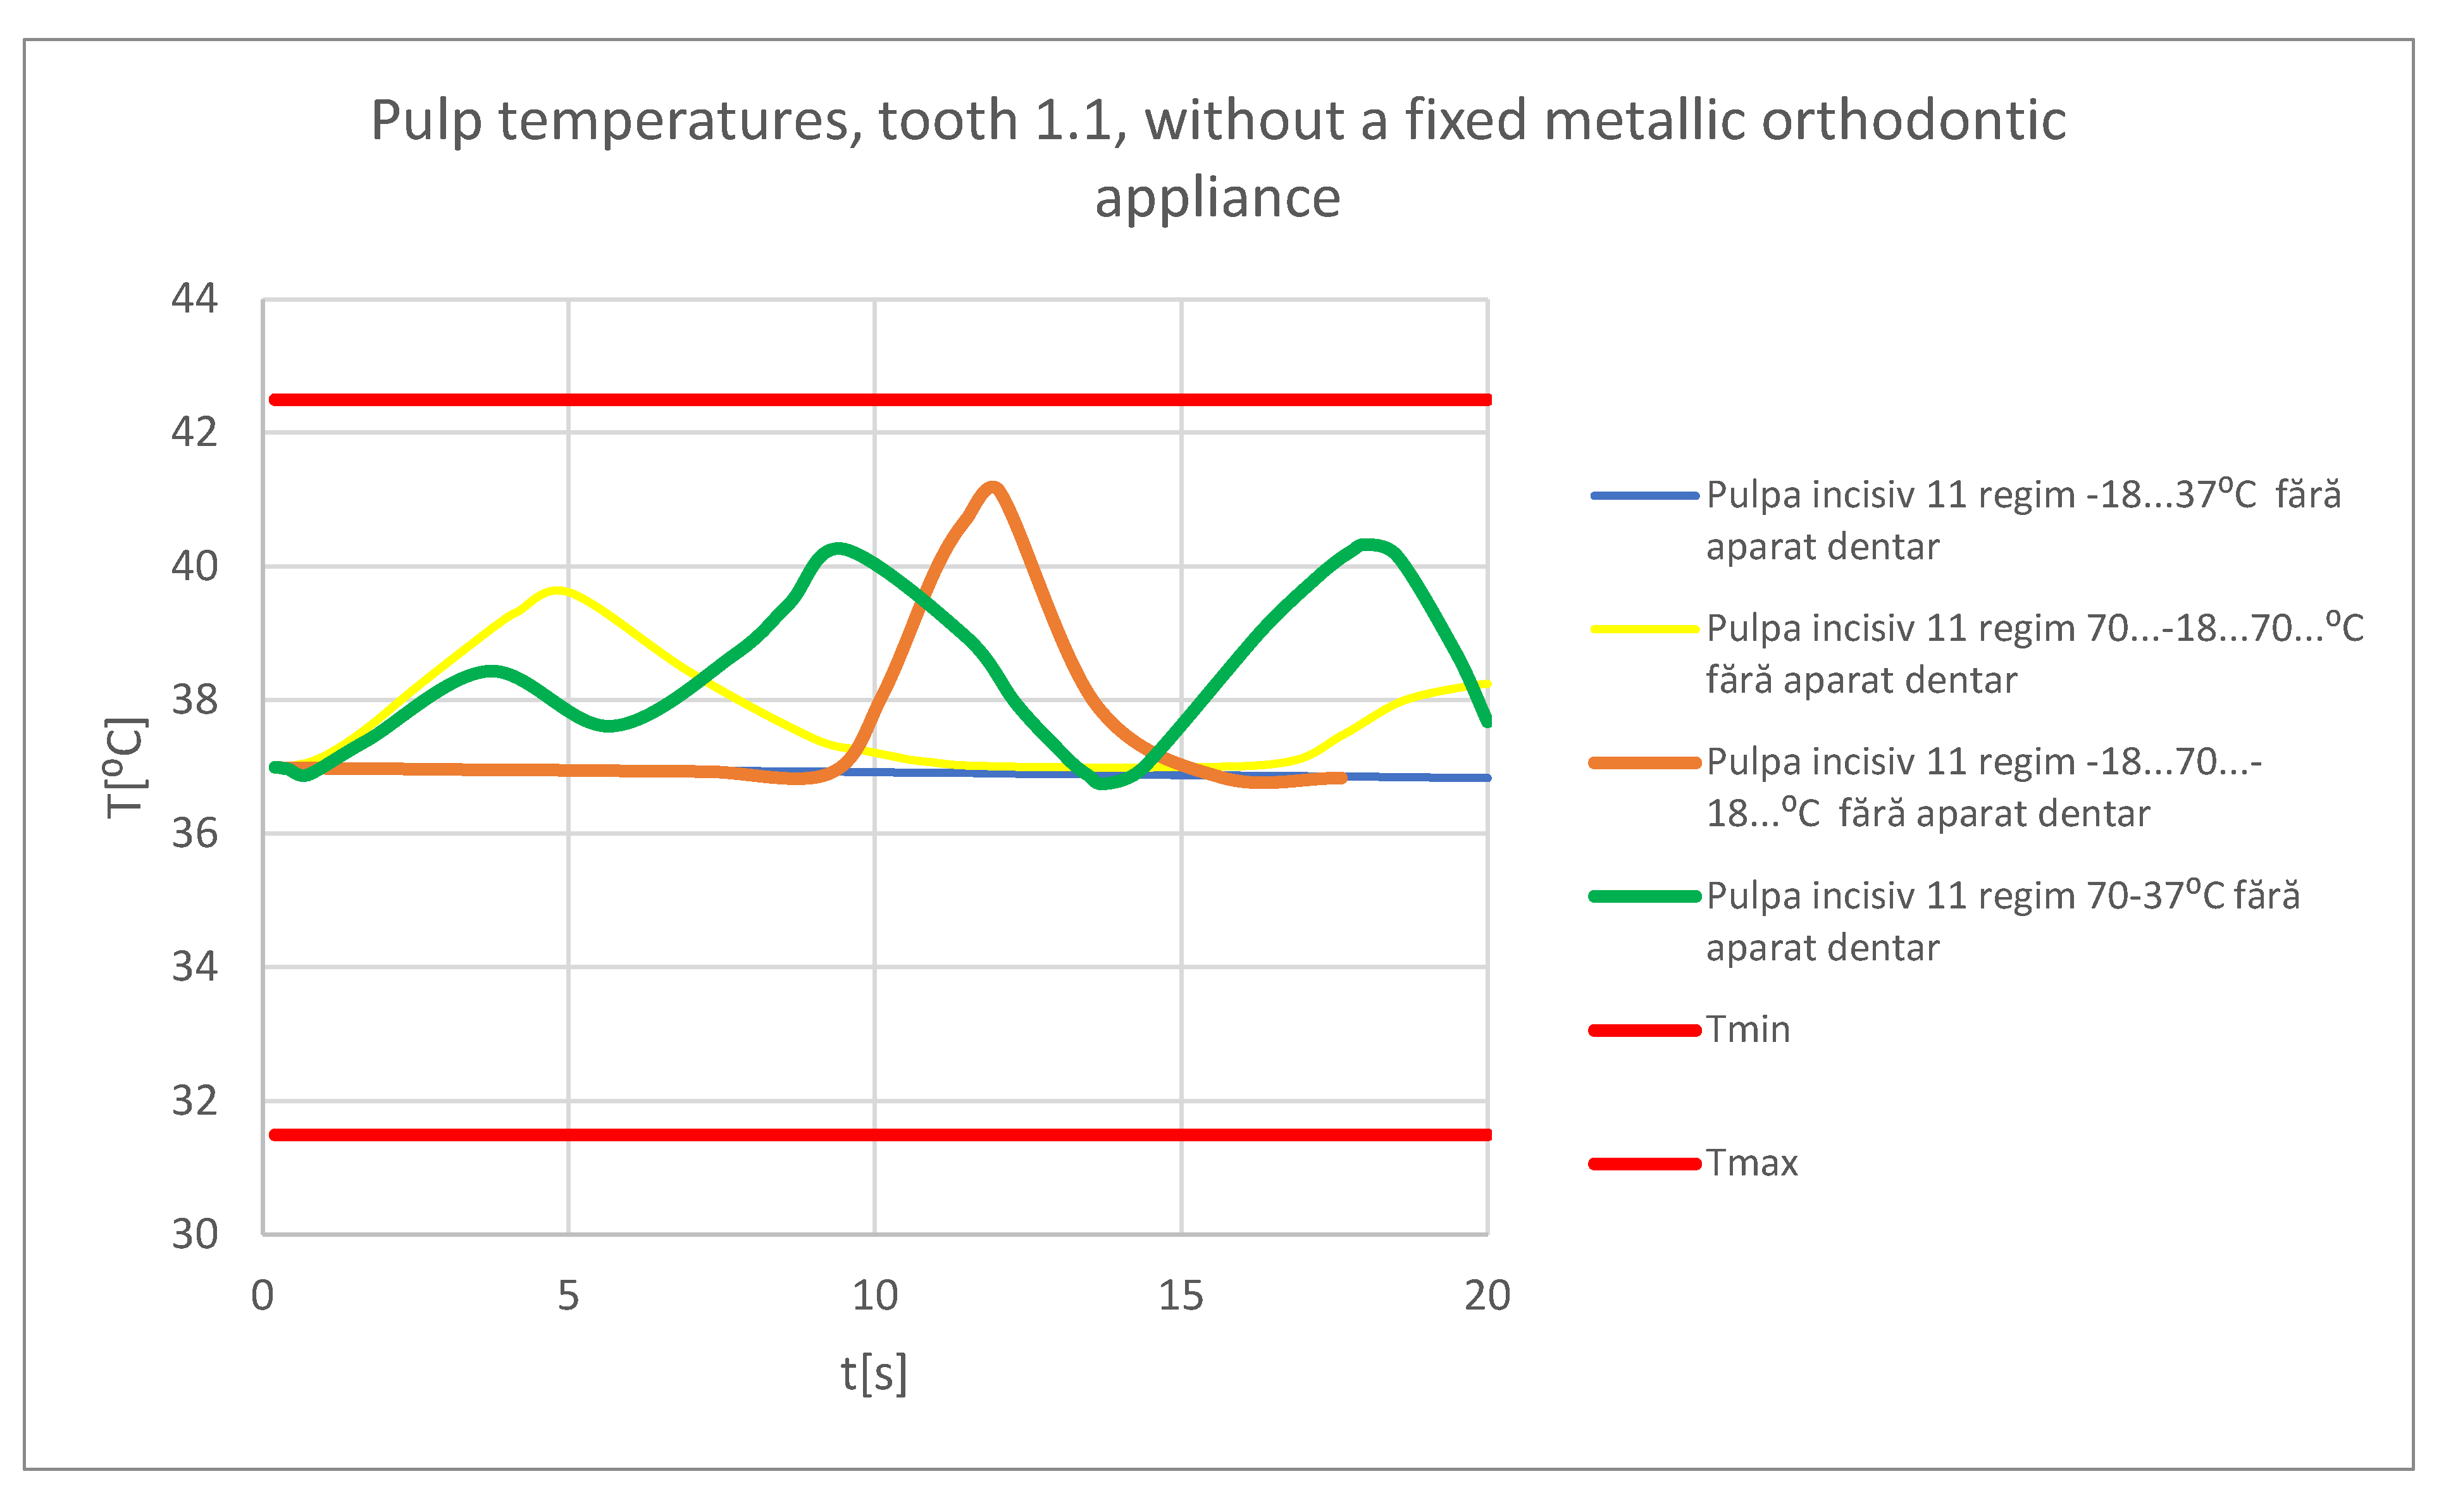
Figure 69.
Comparative diagram for the dental pulp of tooth 1.1, without a fixed metallic orthodontic appliance.
Figure 69.
Comparative diagram for the dental pulp of tooth 1.1, without a fixed metallic orthodontic appliance.
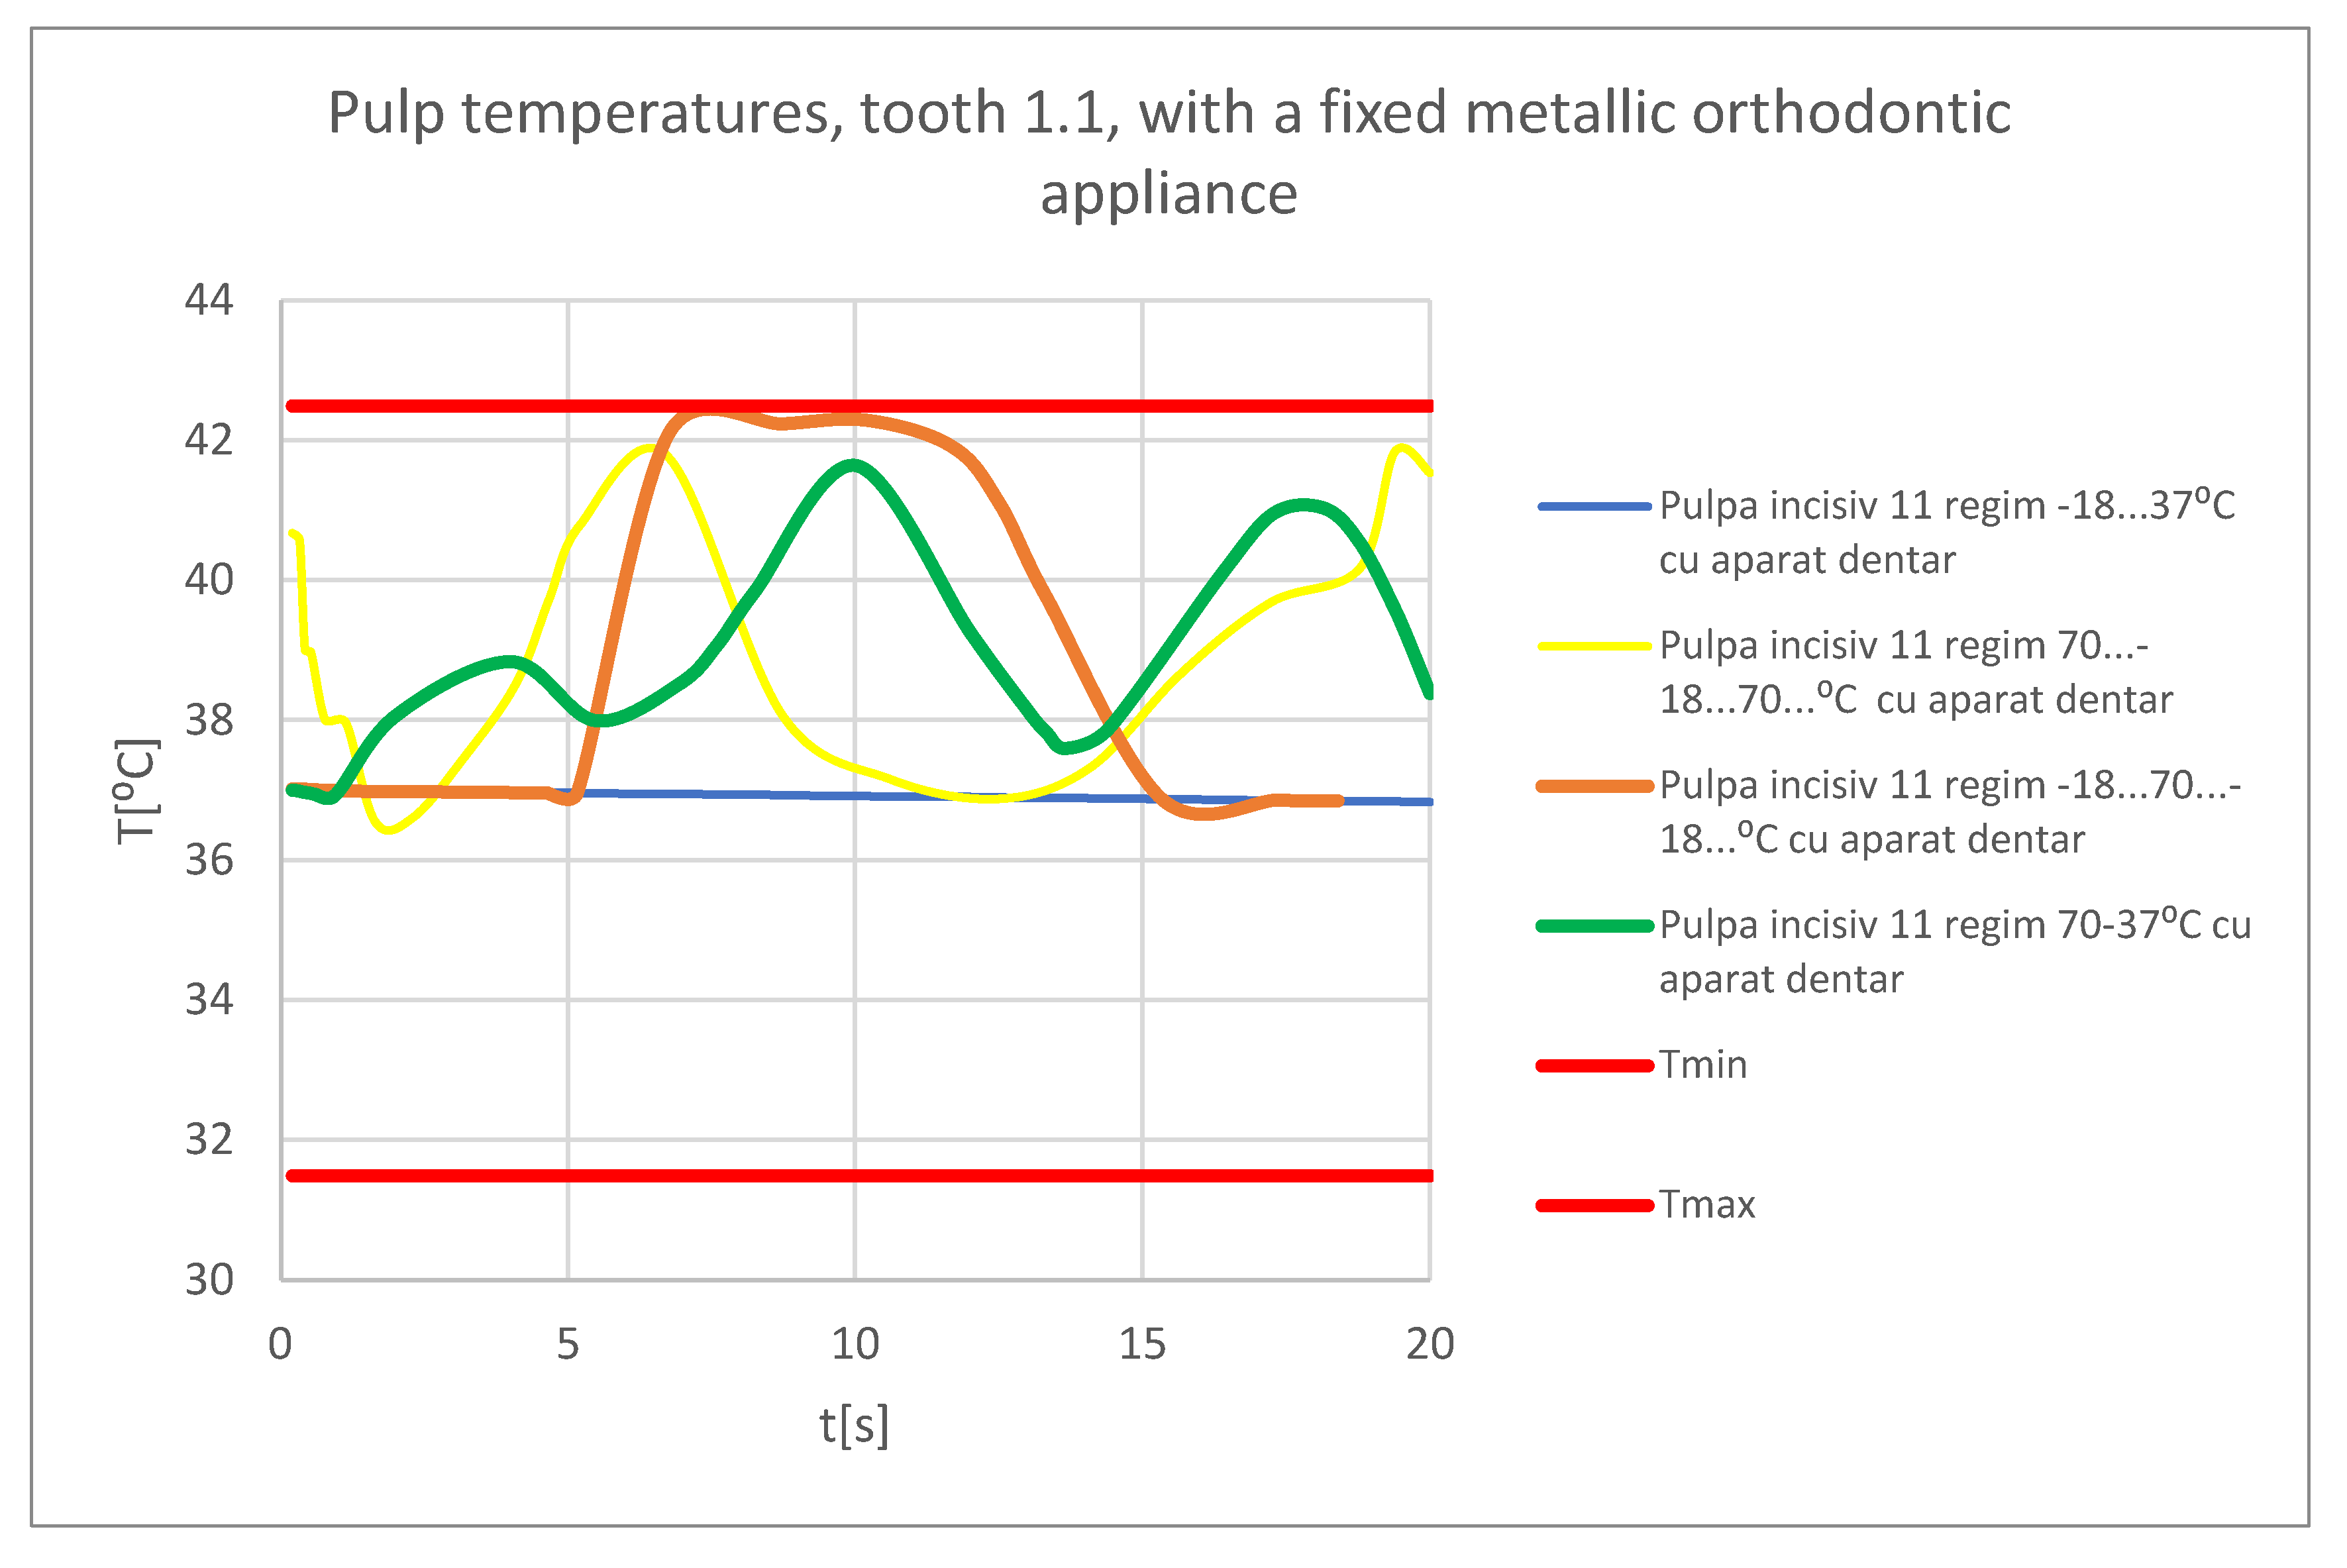
Figure 70.
Comparative diagram for the dental pulp of tooth 1.1, with a fixed metallic orthodontic appliance.
Figure 70.
Comparative diagram for the dental pulp of tooth 1.1, with a fixed metallic orthodontic appliance.
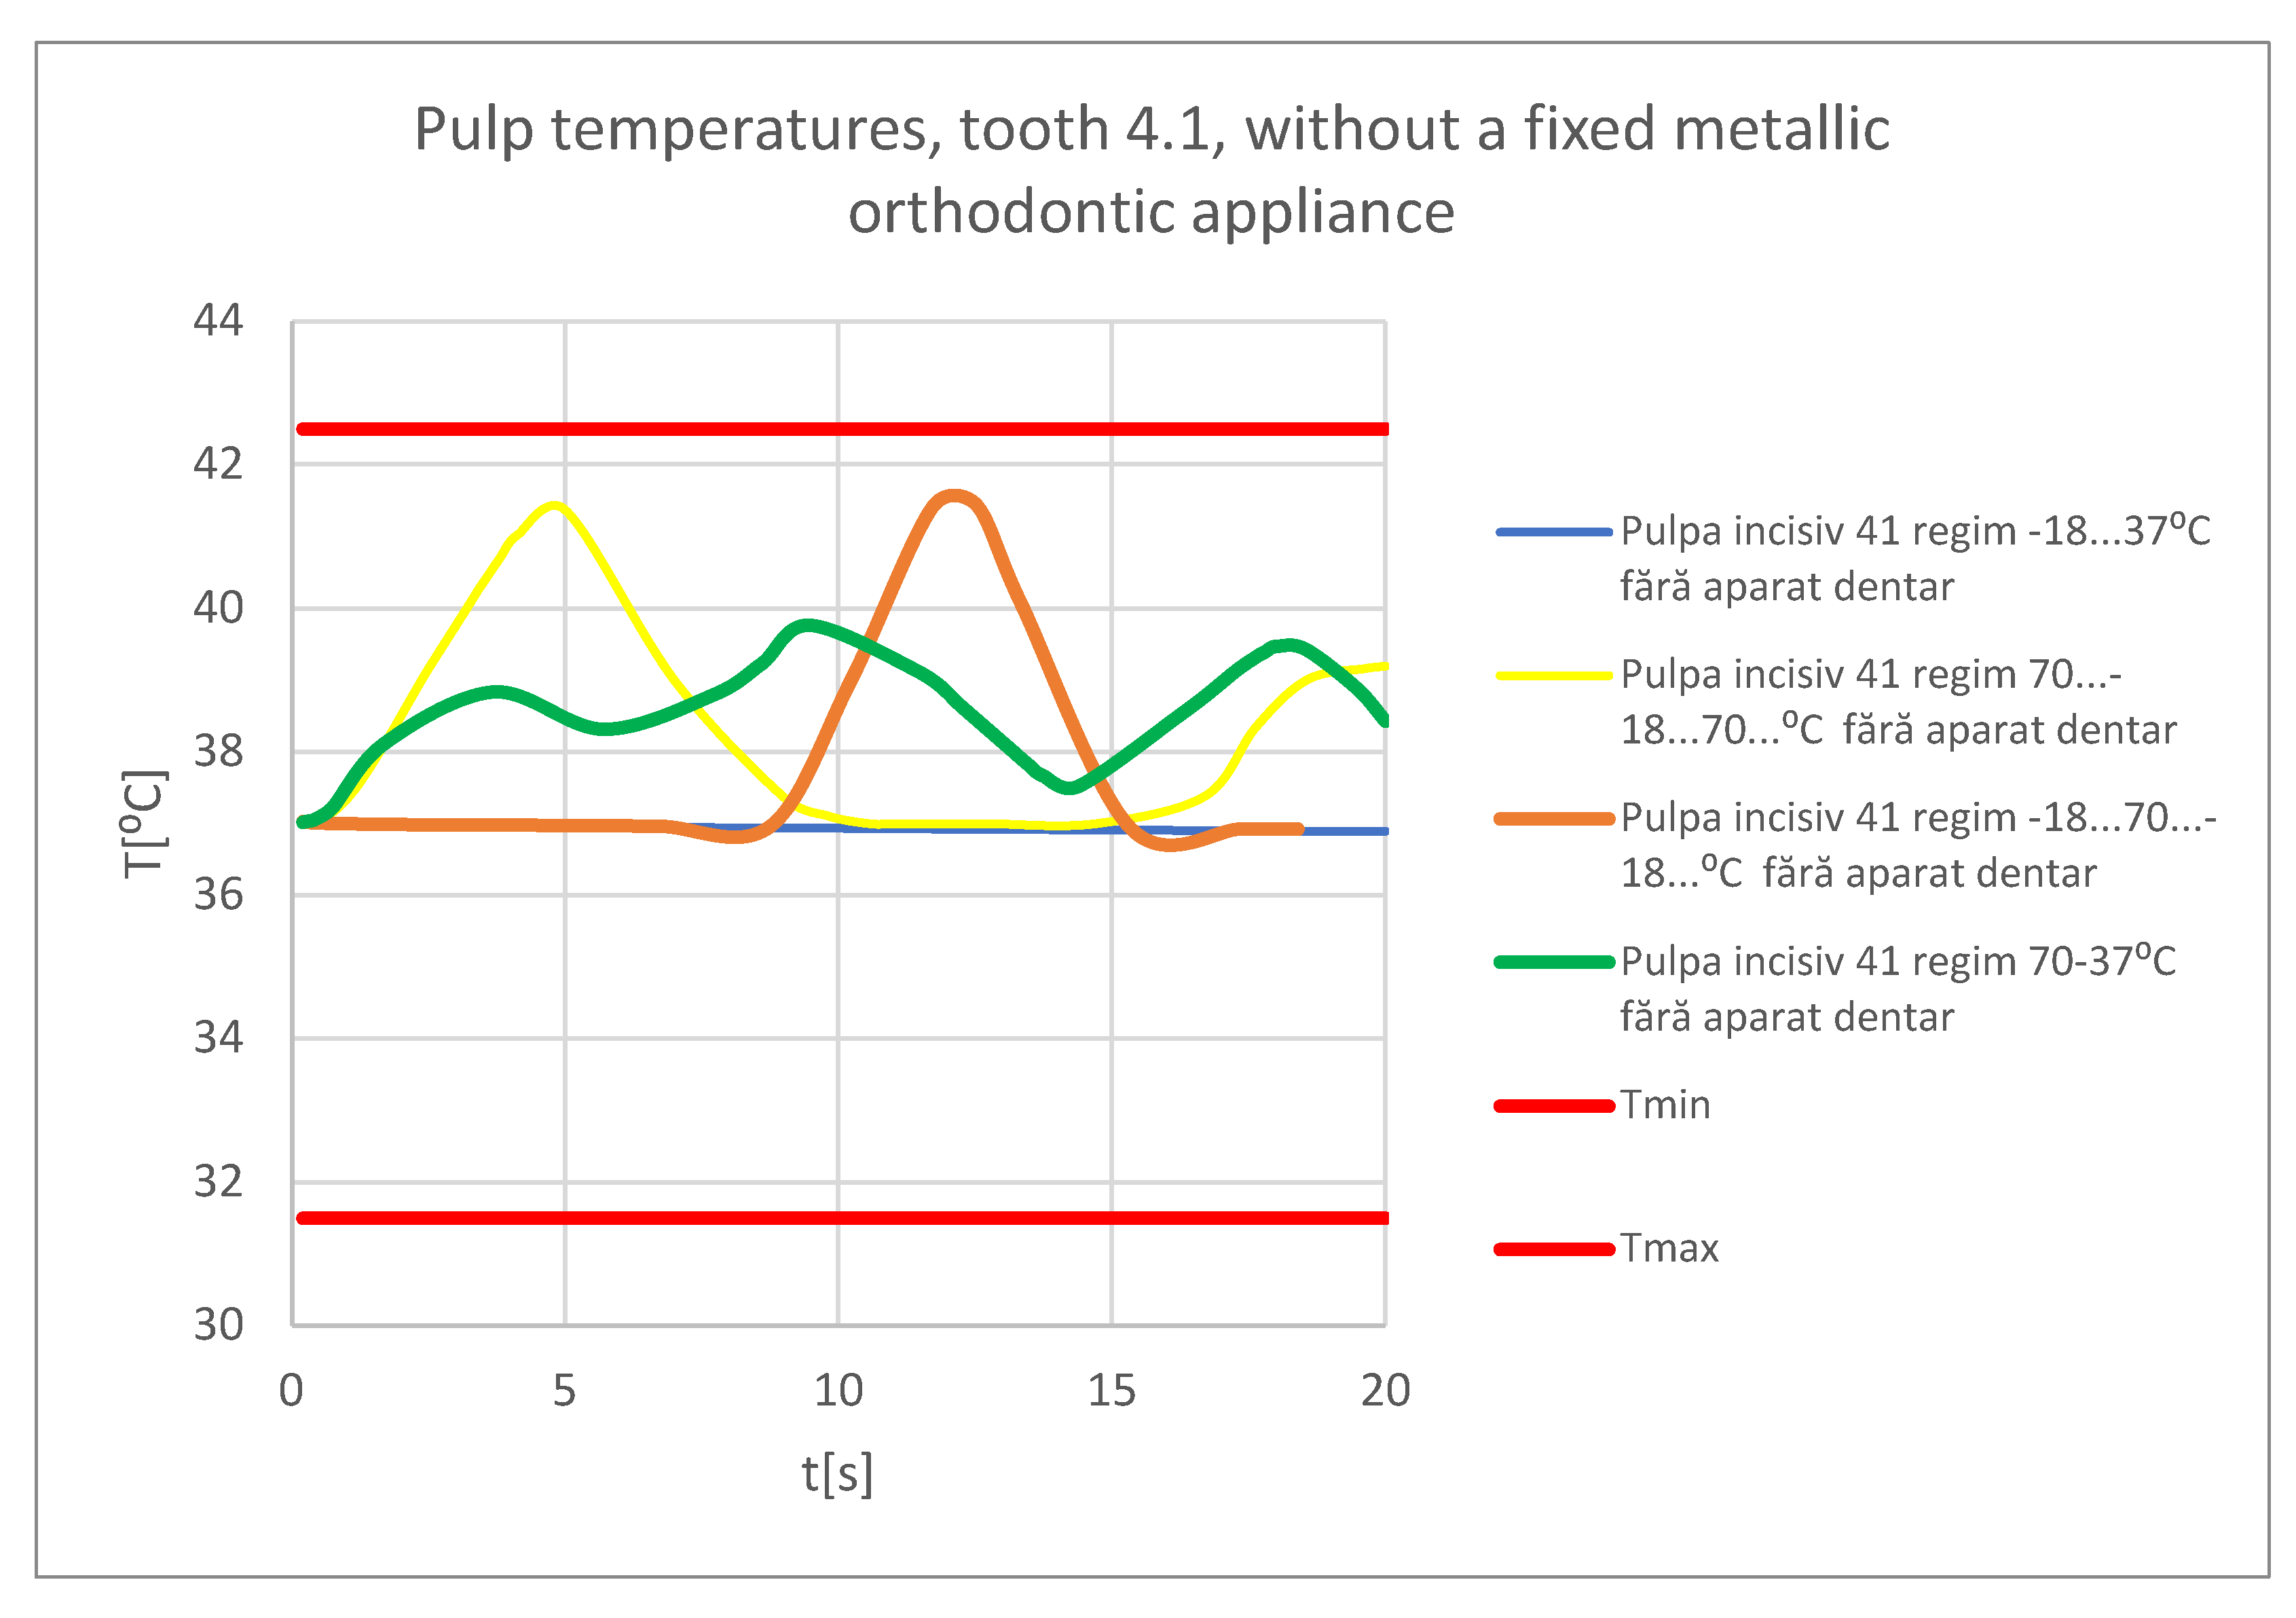
Figure 71.
Comparative diagram for the pulp of tooth 4.1, without a fixed metallic orthodontic appliance.
Figure 71.
Comparative diagram for the pulp of tooth 4.1, without a fixed metallic orthodontic appliance.
Figure 72.
Comparative diagram for the pulp of tooth 4.1, with a fixed metallic orthodontic appliance.
Figure 72.
Comparative diagram for the pulp of tooth 4.1, with a fixed metallic orthodontic appliance.
Table 1.
The thermal physical properties of the materials used in the simulations.
Table 1.
The thermal physical properties of the materials used in the simulations.
| Component |
Density [Kg/m3] |
Isotropic Thermal Conductivity [Wˑm/C⁰] |
Specific Heat [JˑKg/ C⁰] |
| Dental enamel |
2958 |
0.93 |
710 |
| Dentine |
2140 |
0.36 |
1302 |
| Pulp |
1000 |
0.0418 |
4200 |
| Mandible, maxillary |
2310 |
1 |
2650 |
| Bracket type components, Ni+Cr alloy |
8500 |
13 |
460 |
| Orthodontic arch, Ni+Ti alloy |
6450 |
60 |
457 |
