Preprint
Article

Anthropic-Induced Variability of Greenhouse Gasses and Aerosols at the WMO/GAW Coastal Site of Lamezia Terme (Calabria, Southern Italy): Towards a New Method to Assess the Weekly Distribution of Gathered Data

Altmetrics

Downloads

81

Views

68

Comments

0

A peer-reviewed article of this preprint also exists.

Submitted:

18 September 2024

Posted:

20 September 2024

You are already at the latest version

Alerts
Abstract
The key towards a sustainable future is the reduction of mankind’s impact on natural systems via the development of new technologies and the improvement of source apportionment. Though days, years and seasons are arbitrarily set, their mechanisms are based on natural cycles driven by Earth’s orbital periods. This is not the case for weeks, which are a pure anthropic category and are known from literature to influence emission cycles. For the first time since it started data gathering operations, CO (carbon monoxide), CO2 (carbon dioxide), CH4 (methane) and eBC (equivalent black carbon) values detected by the Lamezia Terme WMO/GAW station in Calabria, Southern Italy have been evaluated via a two-pronged approach accounting for weekly variations in absolute concentrations, as well as the number of hourly averages exceeding select thresholds. The analyses were performed on seven continuous years of measurements, from 2016 to 2022. Moreso, the two results have been combined into a new parameter: the hereby defined WDWO (Weighed Distribution of Weekly Outbreaks) normalizes weekly trends of CO, CO2, CH4 and eBC on an absolute scale as percentages, with the scope of providing regulators and researchers alike with a new tool meant to better evaluate anthropogenic pollution and mitigate its effects.
Keywords: 
Subject: Environmental and Earth Sciences  -   Atmospheric Science and Meteorology

1. Introduction

The issue of climate change and the notable increase in resources exploitation over the globe both require precise and direct actions be taken with sustainability in mind [1-2-3-4]. Reports on climate change indicate that anthropic activities are now responsible for major alterations of natural balances, and regulators are rushing to counteract accordingly [5-6-7-8]. A primary tool to achieve sustainable policies is source apportionment at scales ranging from local [9-10] to global [11-12]. Source apportionment efforts become necessary when specific pollutants are released by both natural and anthropogenic sources: via apportionments, ad hoc laws, policies, and restrictions can be aimed at mitigation [13-14-15-16]. Natural cycles and anthropic activities frequently depend on factors driven by Earth’s orbital periods: the daily cycle, as well as yearly and seasonal cycles, are the result of such periods and have a direct impact on both natural and anthropic processes [17-18]. Though days, seasons and years are arbitrarily defined in human culture, they do match these natural cycles.
There is however an arbitrarily set cycle of human activities that is not observed in nature: the week. In fact, most anthropic activities are not equally distributed over the course of a week, and their patterns may also have notable seasonal changes [19]. For instance, it’s known from literature ever since the 1970s that transportation results into weekly trends in pollutants [20-21-22]. In particular, ozone (O3) was found to be susceptible to weekly cycles due to a phenomenon defined OWE (Ozone Weekend Effect), which was first observed in New York [20]. Recent research on OWE has also been aimed at densely populated areas in the northern American continent [23]. OWE results into higher atmospheric concentrations of O3 during weekends caused by lower NOx (NO + NO2) emissions, which in turn are the result of reduced anthropic activities [20-24-21].
Please note that, from this point onwards, this paper defines “weekday” as any day of the week, including weekend days – Saturday and Sunday – which aren’t normally included in that definition. Where needed, weekend days will be specified.
Vast and densely populated metropolitan areas experience notable fluctuations in atmospheric concentrations of certain compounds, thus reflecting weekly cycles in anthropic activities [25-26-27]. Data gathering with weekly cycles in mind is particularly useful in the context of sustainable policies: peaks occurring during specific weekdays may be mitigated via adequate regulations [28]. In fact, many cities rely on various types of bans to mitigate peaks [29-30].
This research paper will focus on carbon monoxide (CO), carbon dioxide (CO2), methane (CH4), and black carbon (eBC). For the first time in its operational history, data gathered at the WMO/GAW (World Meteorological Organization – Global Atmosphere Watch) regional observation site of Lamezia Terme (LMT) located in Calabria, Southern Italy is evaluated depending on the weekday distribution of CO (ppb – parts per billion), CO2 (ppm – parts per million), CH4 (ppb), and eBC (μg/m3 – micrograms per cubic meter) values, as well as the persistence of certain thresholds throughout the week.
Carbon dioxide (CO2) has been known for decades to be a key driver of climate change [31-32-33]. Its effects on global warming were first suspected as early as 1856 [34]. CO2 is a relevant byproduct of fossil fuel burning [35]. Per se, CO2 does not have a strong GWP (Global Warming Potential) [36]; however, CO2’s very high concentration levels in the atmosphere, combined with its constant increase over time and perduring effects, make it the most considerable contributor to the greenhouse effect [37].
Carbon monoxide (CO) is a common byproduct of combustion processes such as wildfires [38]. Though its absolute concentrations are much lower compared to those of CO2, CO is indirectly involved in the increase of tropospheric ozone (O3) [39] and methane [40] levels. After years of constant rising trends [41], CO concentrations have been experiencing a notable decrease in the last two decades, largely due to sustainable policies and technologies meant to optimize combustion engines [42]. However, a lower decrease rate has been observed in recent years [43], which has been at times linked to CO outputs caused by wildfires [44]. A previous research study from the Lamezia Terme-LMT observatory exploited high CO yields, alongside other parameters, as an effective wildfire tracer in Calabria [45].
Methane (CH4) is over two orders of magnitude lower in atmospheric mole fractions compared to CO2, but its GWP is considerably higher: the GWP-20 (GWP in two decades) is as high as ≈83 CO2e, though it drops to ≈10 CO2e when GWP-500 (GWP in five centuries) is considered [46]. CH4 is by natural sources such as wetlands [47], as well as anthropic sources [48-49]. In fact, livestock and manure are responsible for a significant annual CH4 output [50], which has rushed regulators to find sustainable solutions to the issue such as feed additives meant to reduce emissions by livestock [51-52]. CH4 is also a byproduct of combustion processes, such as aviation fuel [53-54-55] and regular vehicle fuel [56] burning. Among GHGs, CH4 is known to have experienced a sharp global rise attributable to the Covid-19 outbreak in 2020-2021 [57-58-59]. That particular increase was also observed locally at LMT [55].
Black carbon (BC), just like carbon monoxide, is an effective tracer of combustion processes [38]. Commonly referred to as soot, BC falls in the fine particulate or PM2.5 category of aerosols and poses both health hazards [60] and climate alteration effects [61-62]. Specifically, in terms of GWP, its value is 900 (120 to 1800 range) [63], though it has been observed to last in the atmosphere for mere days [64-65], which partially compensates its climate altering potential. A previous study at LMT compared weekday/weekend variabilities of BC provided the first tangible evidence of a local weekly cycle [66].
In addition to the weekly cycle assessment of LMT observations, this research study is set to provide researchers, policy makers, and regulators with a new method meant to assess weekly cycles. This method, which is described in section 3.4, is meant to fill a gap in modern research with respect to the applicability of findings such as the ones presented in this paper in the broad field of sustainable policies. The paper is divided as follows: section 2 will describe the observation site of Lamezia Terme - LMT, its characteristics and past observation history, as well as the instruments, datasets and methodologies used to gather data analyzed in this research; section 3 and its subsections show the results of the study; sections 4 and 5 cover the discussion and conclusions, respectively. Supplementary Materials cover additional data processing and graphs not shown in the main article.

2. The Observation Site, Instruments, Datasets and Methods

2.1. The LMT WMO/GAW Station
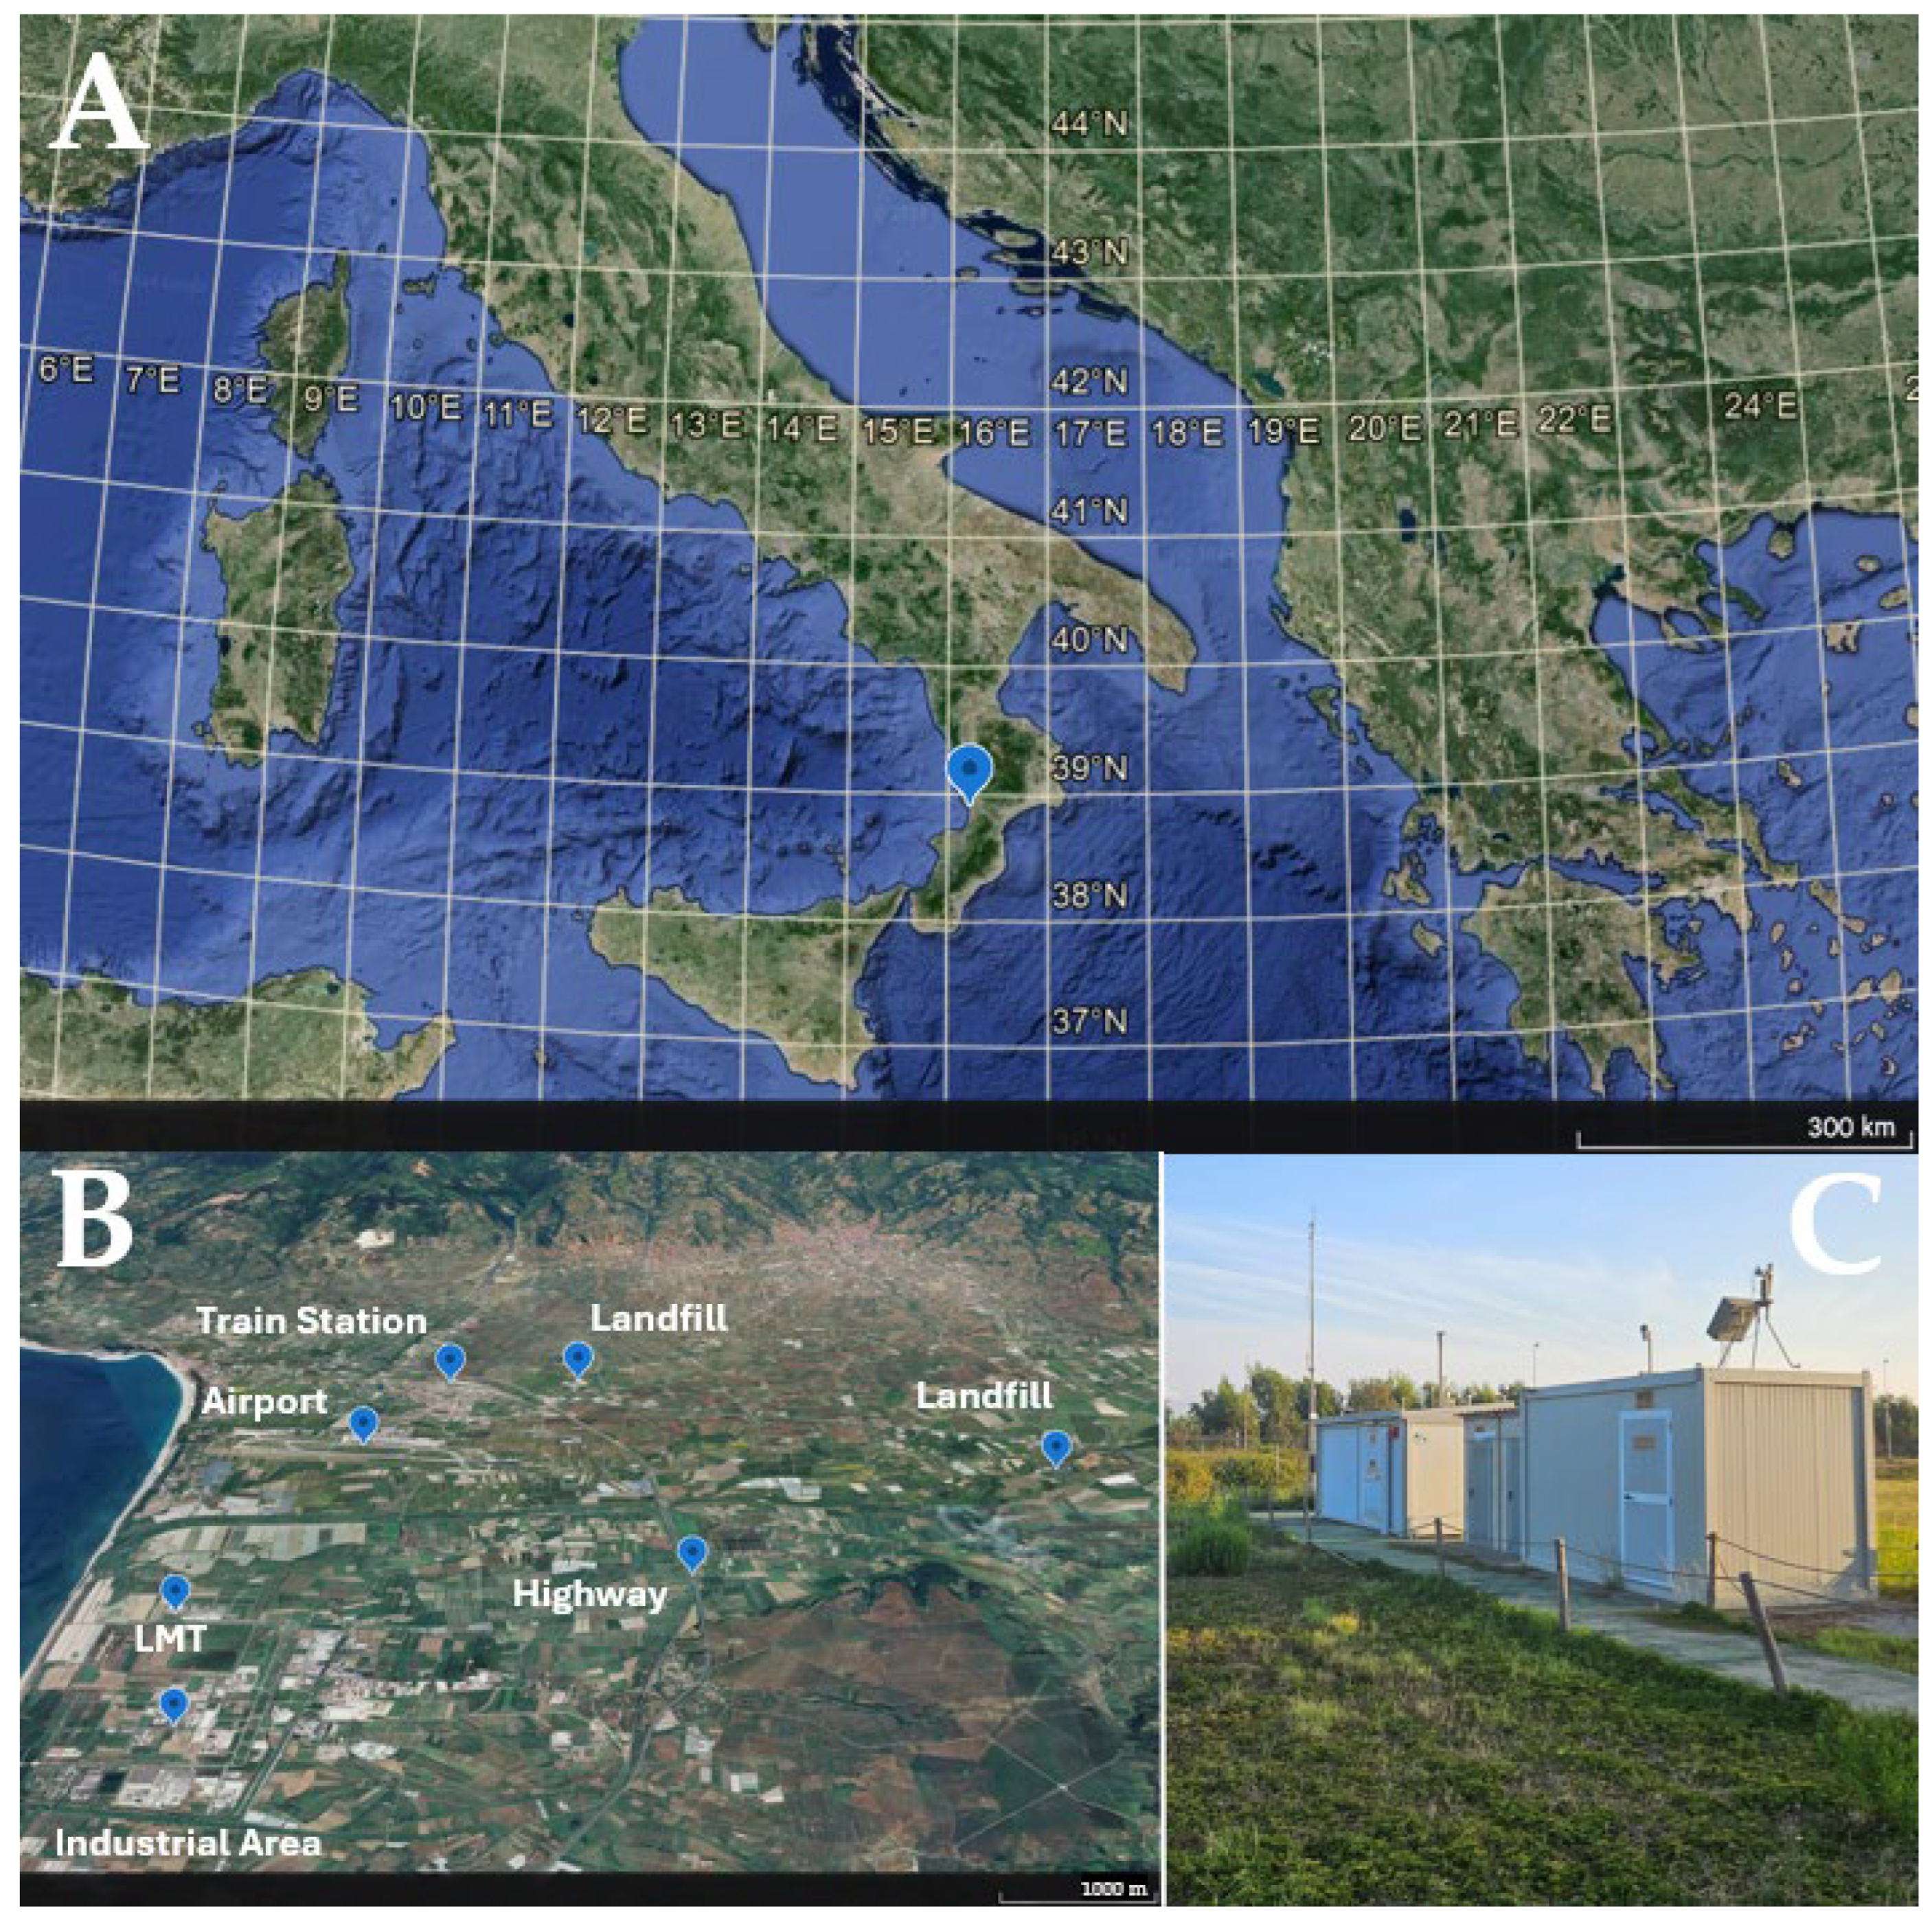
Located in the Tyrrhenian coast of Calabria, Southern Italy, approximately 600 meters from the coastline itself, the Lamezia Terme regional observatory (WMO/GAW code: LMT, Lat: 38.88°N; Lon: 16.23°E; 6m above sea level) is fully operated by the National Research Council of Italy – Institute of Atmospheric Sciences and Climate (CNR-ISAC). The regional observation site started its operations in 2015 and has since been collecting data on key atmospheric parameters such as meteorological data and mole fractions of greenhouse gases. The observation site is characterized by a breeze regime [67-68]. In particular, local wind circulation results into daily shifts between western-seaside winds and northeastern-continental winds, which are channeled through the W-E oriented the Catanzaro isthmus. An early study showed the influence of such regimes on detected concentrations of GHGs and other compounds in the atmosphere [69]. This was later confirmed by a recent study on methane concentrations, which also demonstrated how northeastern winds generally yield higher values, while western winds are linked to very low concentrations [55]. The Lamezia Terme International Airport (IATA: SUF; ICAO: LICA), located 3 kilometers north from the observatory, has a runway orientation that matches this wind regime, as seen in Fig. 1B.
Figure 1. A: Location of the Lamezia Terme (LMT) observation site in the Mediterranean Basin. B: 3D map (tilt: 65°) of the area where the observation site LMT is located, highlighting the geomorphological characteristics of the Catanzaro isthmus and key emission sources in the area. The Highway landmark refers to a point located in the N-NE sector from the observatory where the highway is close to LMT (≈4.3km). Farms are spread across the area. C: details of the observatory).
Preprints 118549 g001
Since the first data gathering operations, LMT emerged as a “multisource” observation site, with several local sources of emissions – both natural and anthropogenic – contributing to the total observed output. The above-mentioned airport, as well as local livestock farming and the A2 highway (which is part of the European route E45) have been mentioned in previous research as local sources affecting LMT data [69-55]. In the case of methane, possible weekly cycles linked to anthropic activities have been indicated in a previous work as indicators of anthropogenic sources [55].
Local wind circulation is subject to seasonal changes. Breezes control local circulation and show seasonal changes in wind speeds, as well as slight changes in terms of wind directions, over the main W-WSW/NE-ENE axis [67-45]. Large-scale forcing is the main driver of diurnal circulation in November, as well as during the winter; nocturnal flows are driven by the circulation of nocturnal breezes; during part of fall, as well as spring and summer, large-scale and local flows both contribute to daytime breezes [68]. The 850 hPa layer is subject a different wind orientation, as past research demonstrated a prevailing NW corridor [68]. A campaign launched in 2009, via the implementation of various instruments (Sodar, wind profilers, Lidar) and their integration with high resolution weather model products allowed to characterize synoptic flows in the area, the vertical structures of the Planetary Boundary Layer, and sea breezes [70]. In a separate research study, wind-lidar profiles set to multiple altitude thresholds, from 10 to 300 meters, helped to further to expand knowledge on local circulation [71]. A past study also characterized the optical properties of aerosols at the site via a direct comparison with data gathered at two other southern Italian sites, namely Capo Granitola (CGR) in Sicily and Lecce (ECO) in Apulia [72]. In terms of observation site characterization, it’s also worth noting that – due to its central location in the Mediterranean Basin – LMT has been subject to major Saharan dust events [73] and wildfire emissions affecting the region of Calabria [45].

2.2. Instruments and Datasets

Measurements of CO, CO2, CH4, and eBC have been performed using two instruments. Data on carbon monoxide (ppb), carbon dioxide (ppm), and methane (ppb) mole fractions have been gathered by a CRDS (Cavity Ring-Down Spectrometry) analyzer, the Picarro G2401 (Santa Clara, California, USA). CRDS analyzers rely on the ring-down principle to measure, with high degrees of precision, the concentration of trace gases thanks to their light scattering and absorption effects at characteristic wavelengths [74].
At LMT, G2401 analyzers operate using a four-point configuration type. An EMTMA-CE Vici-Valco rotative valve automatically switches between the following configurations at regular intervals: three points are connected to standard calibration cylinders (CO: WMO X2014; CO2: WMO X2019; CH4: WMO X2004), while the fourth point is used for ambient air gathering. The reference cylinders, provided by NOAA’s GML (Global Monitoring Laboratory), cover CO mole fractions in the 40-500 nmol/mol range, CO2 concentrations in the 250-520 µmol/mol range, and CH4 fractions in the 300-2600 nmol/mol range. The same cylinders are measured by the Picarro analyzer three times, for a time span of 30 minutes, every 14 days.
In addition to these WMO-compliant calibrations, three target cylinders with known concentrations of each gas are measured for quality assurance purposes every 19 hours. In order to dry ambient air and reduce the impact of water vapor on the accuracy of measurements, a MD-070-144S-4 Nafion dryer is used prior to CRDS analysis. The Picarro G2401 performs a measurement every 5 seconds with a precision of 1 ppb.
Equivalent black carbon (eBC) micrograms per cubic meter (μg/m3) have been measured by a Thermo Scientific 5012 (Franklin, Massachusetts, USA) MAAP (Multi-Angle Absorption Photometer). The instrument measures the short-wave absorption of eBC and aerosol. For aerosol sampling, a pump maintaining a constant flow rate of 200L/min gathers ambient air at 4m above ground level. The MAAP measures the short-wave radiation aerosol absorption coefficient (sa) and equivalent black carbon (eBC) values at 637nm on a per-minute basis [75-76]. Specifically, the MAAP illuminates a particle-loaded filter and measures, at the same time, the radiation passing through said filter, as well as backscattered light from three different angles [77]. The flow is set at a value of 16.7L/min. Via a mass closure, it was constantly verified that eBC was lower than 50% of the overall PM2.5 mass concentration.
Calibrated and verified hourly measurements from both instruments have been processed for data analysis separately (Picarro data for CO, CO2 and CH4, Thermo Scientific data for eBC): this allowed to maximize the amount of calibrated data per instrument, as relying on a combined dataset requiring each hour to have calibrated values for all parameters would have led to data loss. Details are shown in Table 1, where the amount of data used for this work as a percentage of the total amount of hours between January 1st, 2016 and December 31st, 2022 is reported. The two datasets have a coverage rate above 90%. eBC data have a higher rate compared to the other parameters.
Analyses have been performed in R 4.4.0 using ggplot2, ggpubr, tidyverse and dplyr packages/libraries. Just like in previous research [55], seasonal aggregations have been grouped as follows: MAM = March, April, May for Spring; JJA = June, July, August for Summer; SON = September, October, November for Fall; JFD = December, January, February for Winter.

3. Results

3.1. Yearly Concentrations through the Week
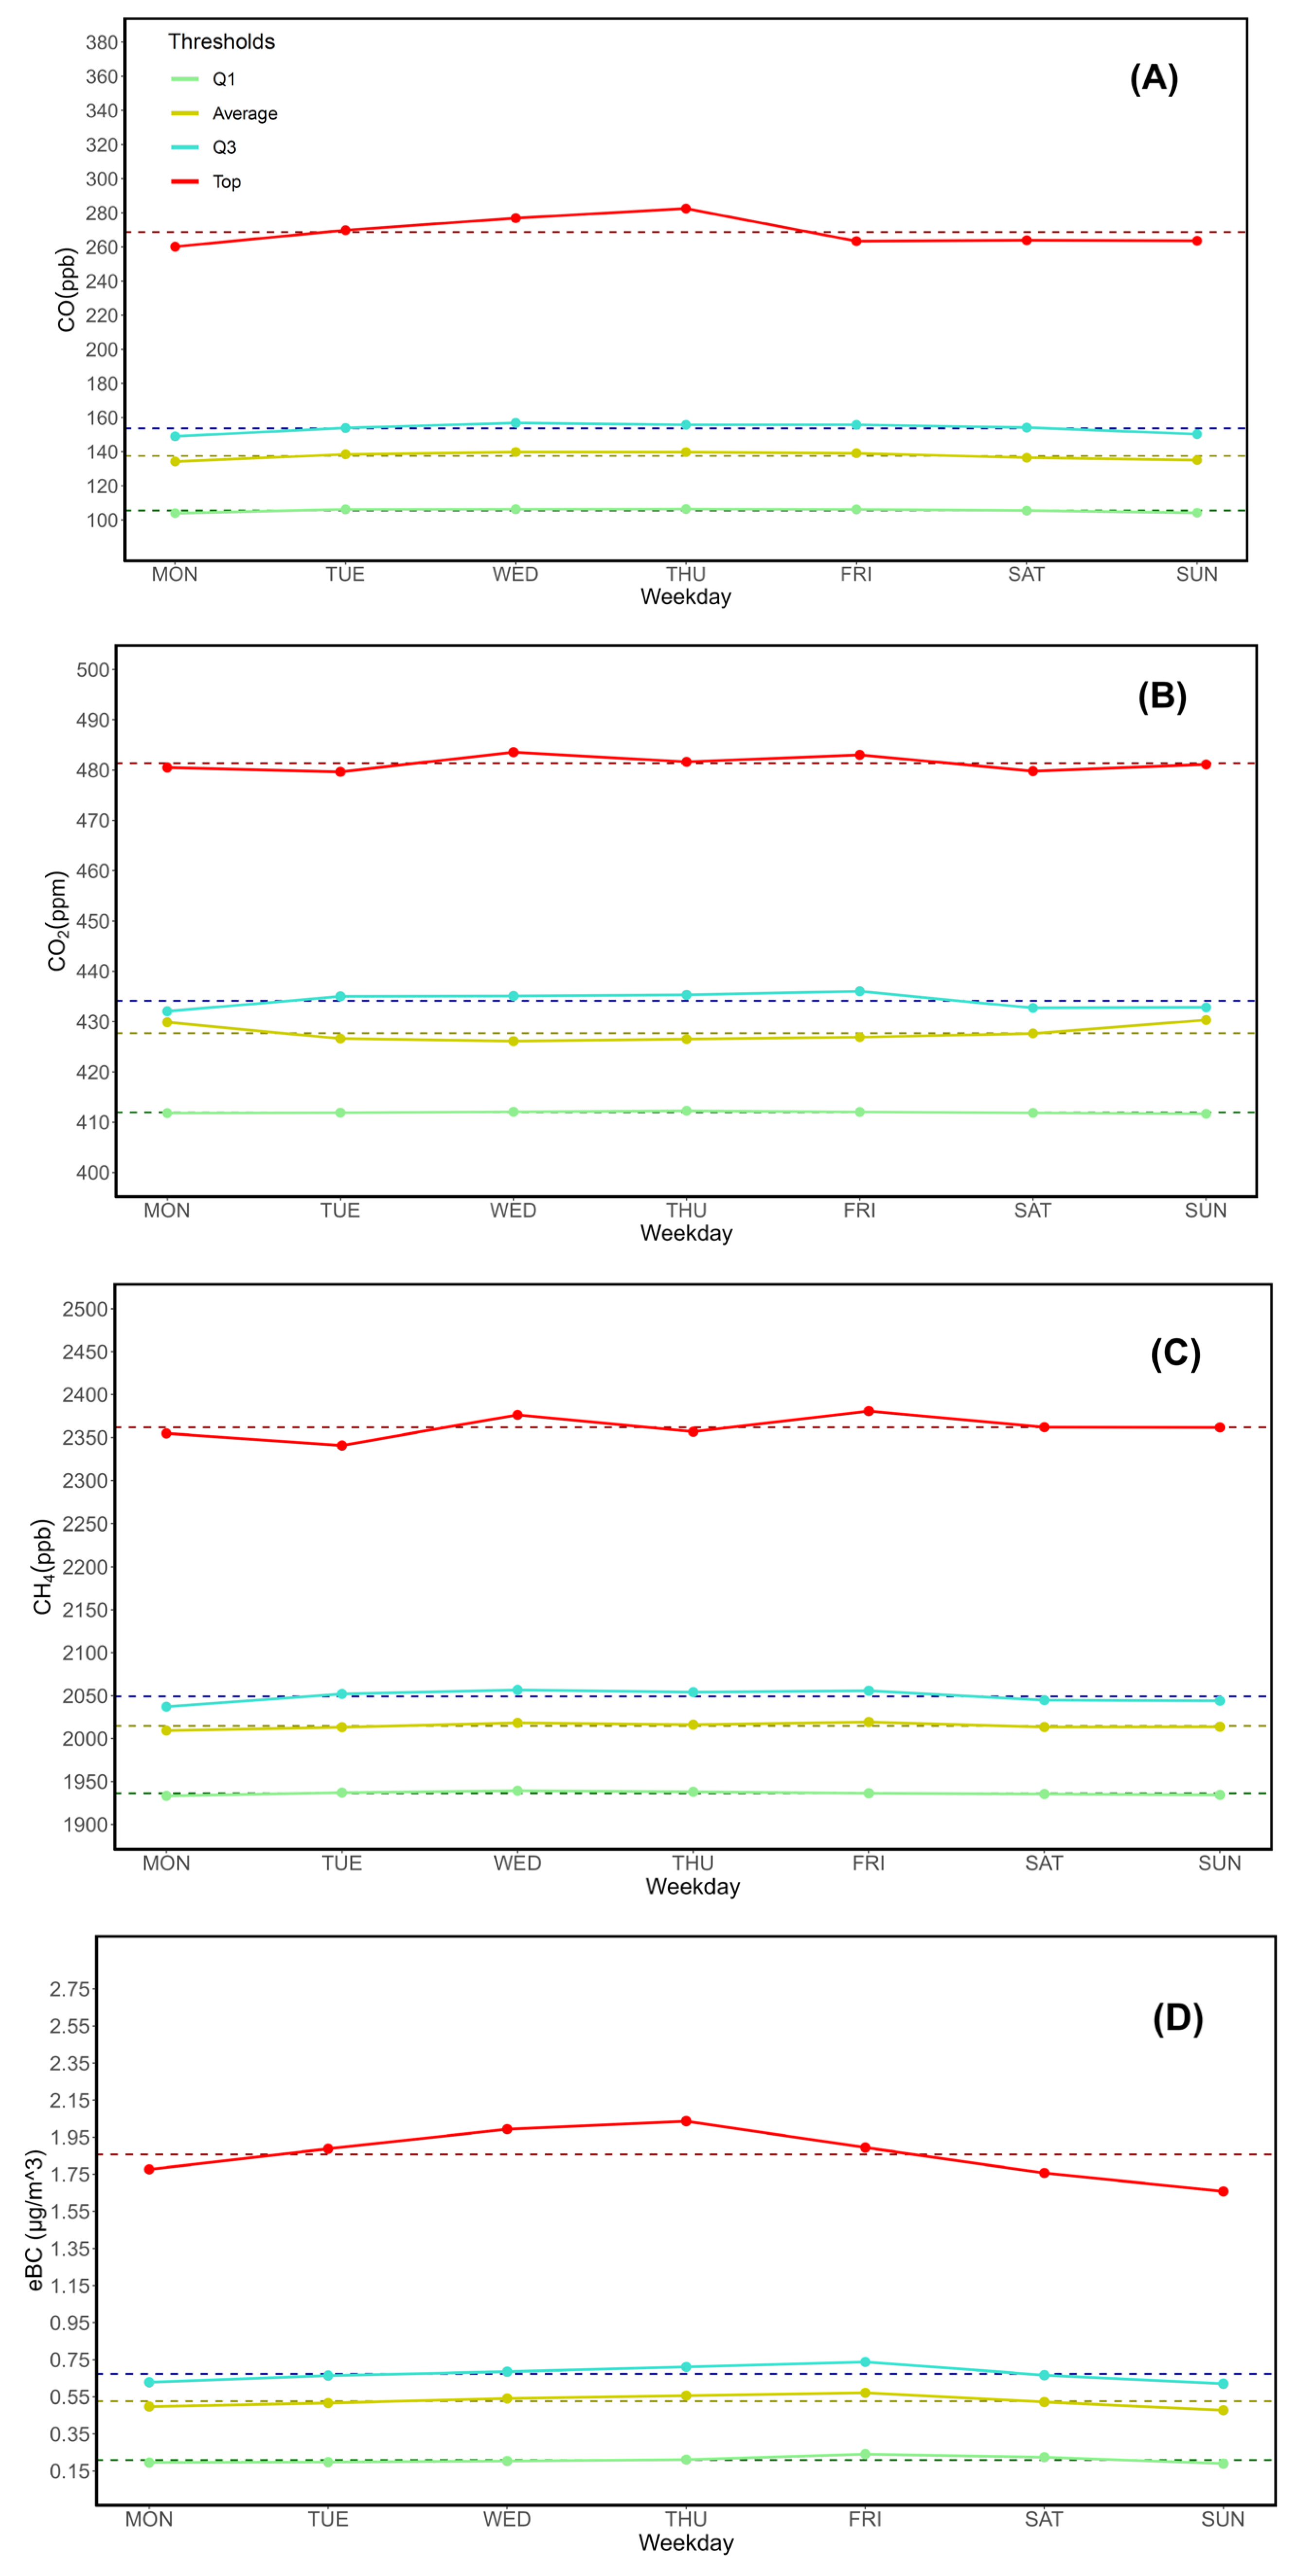
The first step towards the development of an assessment method aimed at addressing anthropic-driven variability over the course of a standard week was calculating key statistics and thresholds for each parameter. Weekdays (hereby intended as MON-SUN) and their respective statistical thresholds for CO, CO2, CH4 and eBC were therefore computed from both databases. The result is shown in Table 2 and Fig. 2, though it’s worth noting that averages computed over the entire observation period (2016-2022) show a bias caused by each parameter’s multi-year trend, such as the increasing CH4 concentrations shown in D’Amico et al. (2024a) [55]. Years have to be addressed separately, while seasonal tables and graphs could be more representative of intrinsic weekday variability. Each year is covered in Supplementary Material S1-A1 through S1-G5, while general seasonal variations are shown in section 3.2.
Following the method used in D’Amico et al. (2024a) [55] for the number of hourly outbreak occurrences of CH4, a Chi-squared test was performed on concentrations and observed values. Table 2 shows the results, which are not statistically significant in absolute terms. The levels of significance however show a progression from the lowest threshold value (Q1) to the top 2.5% interval of data. This progression is observed for all parameters with the exception of CO2. In fact, CO, CH4 and eBC show an increase of χ2 as well as a decrease of p-values.
Figure 2. Q1, mean, Q3 and top 2.5% values for all four parameters (A: CO; B: CO2; C: CH4; D: eBC), calculated over the entire observation period (2016-2022). Dashed parallel lines show average values for each parameter and help to visualize possible differences between weekdays. Please note that the vertical axes are distinct for each parameter. The legend is shown in Fig. 2A.
Preprints 118549 g002

3.2. Seasonal Analysis

Due to the variability on a local scale of emission sources throughout a calendar year (public transportation, industrial activities, and commuting may cause more emissions in the winter [69-55], while wildfires and similar processes normally occur during the summer [45]) a per-season evaluation was performed on the same datasets. As reported in subsection 2.2, seasons have been divided as follows: JFD (January, February, December) for Winter; MAM (March, April, May) for Spring; JJA (June, July, August) for Summer; SON (September, October, November) for Fall.
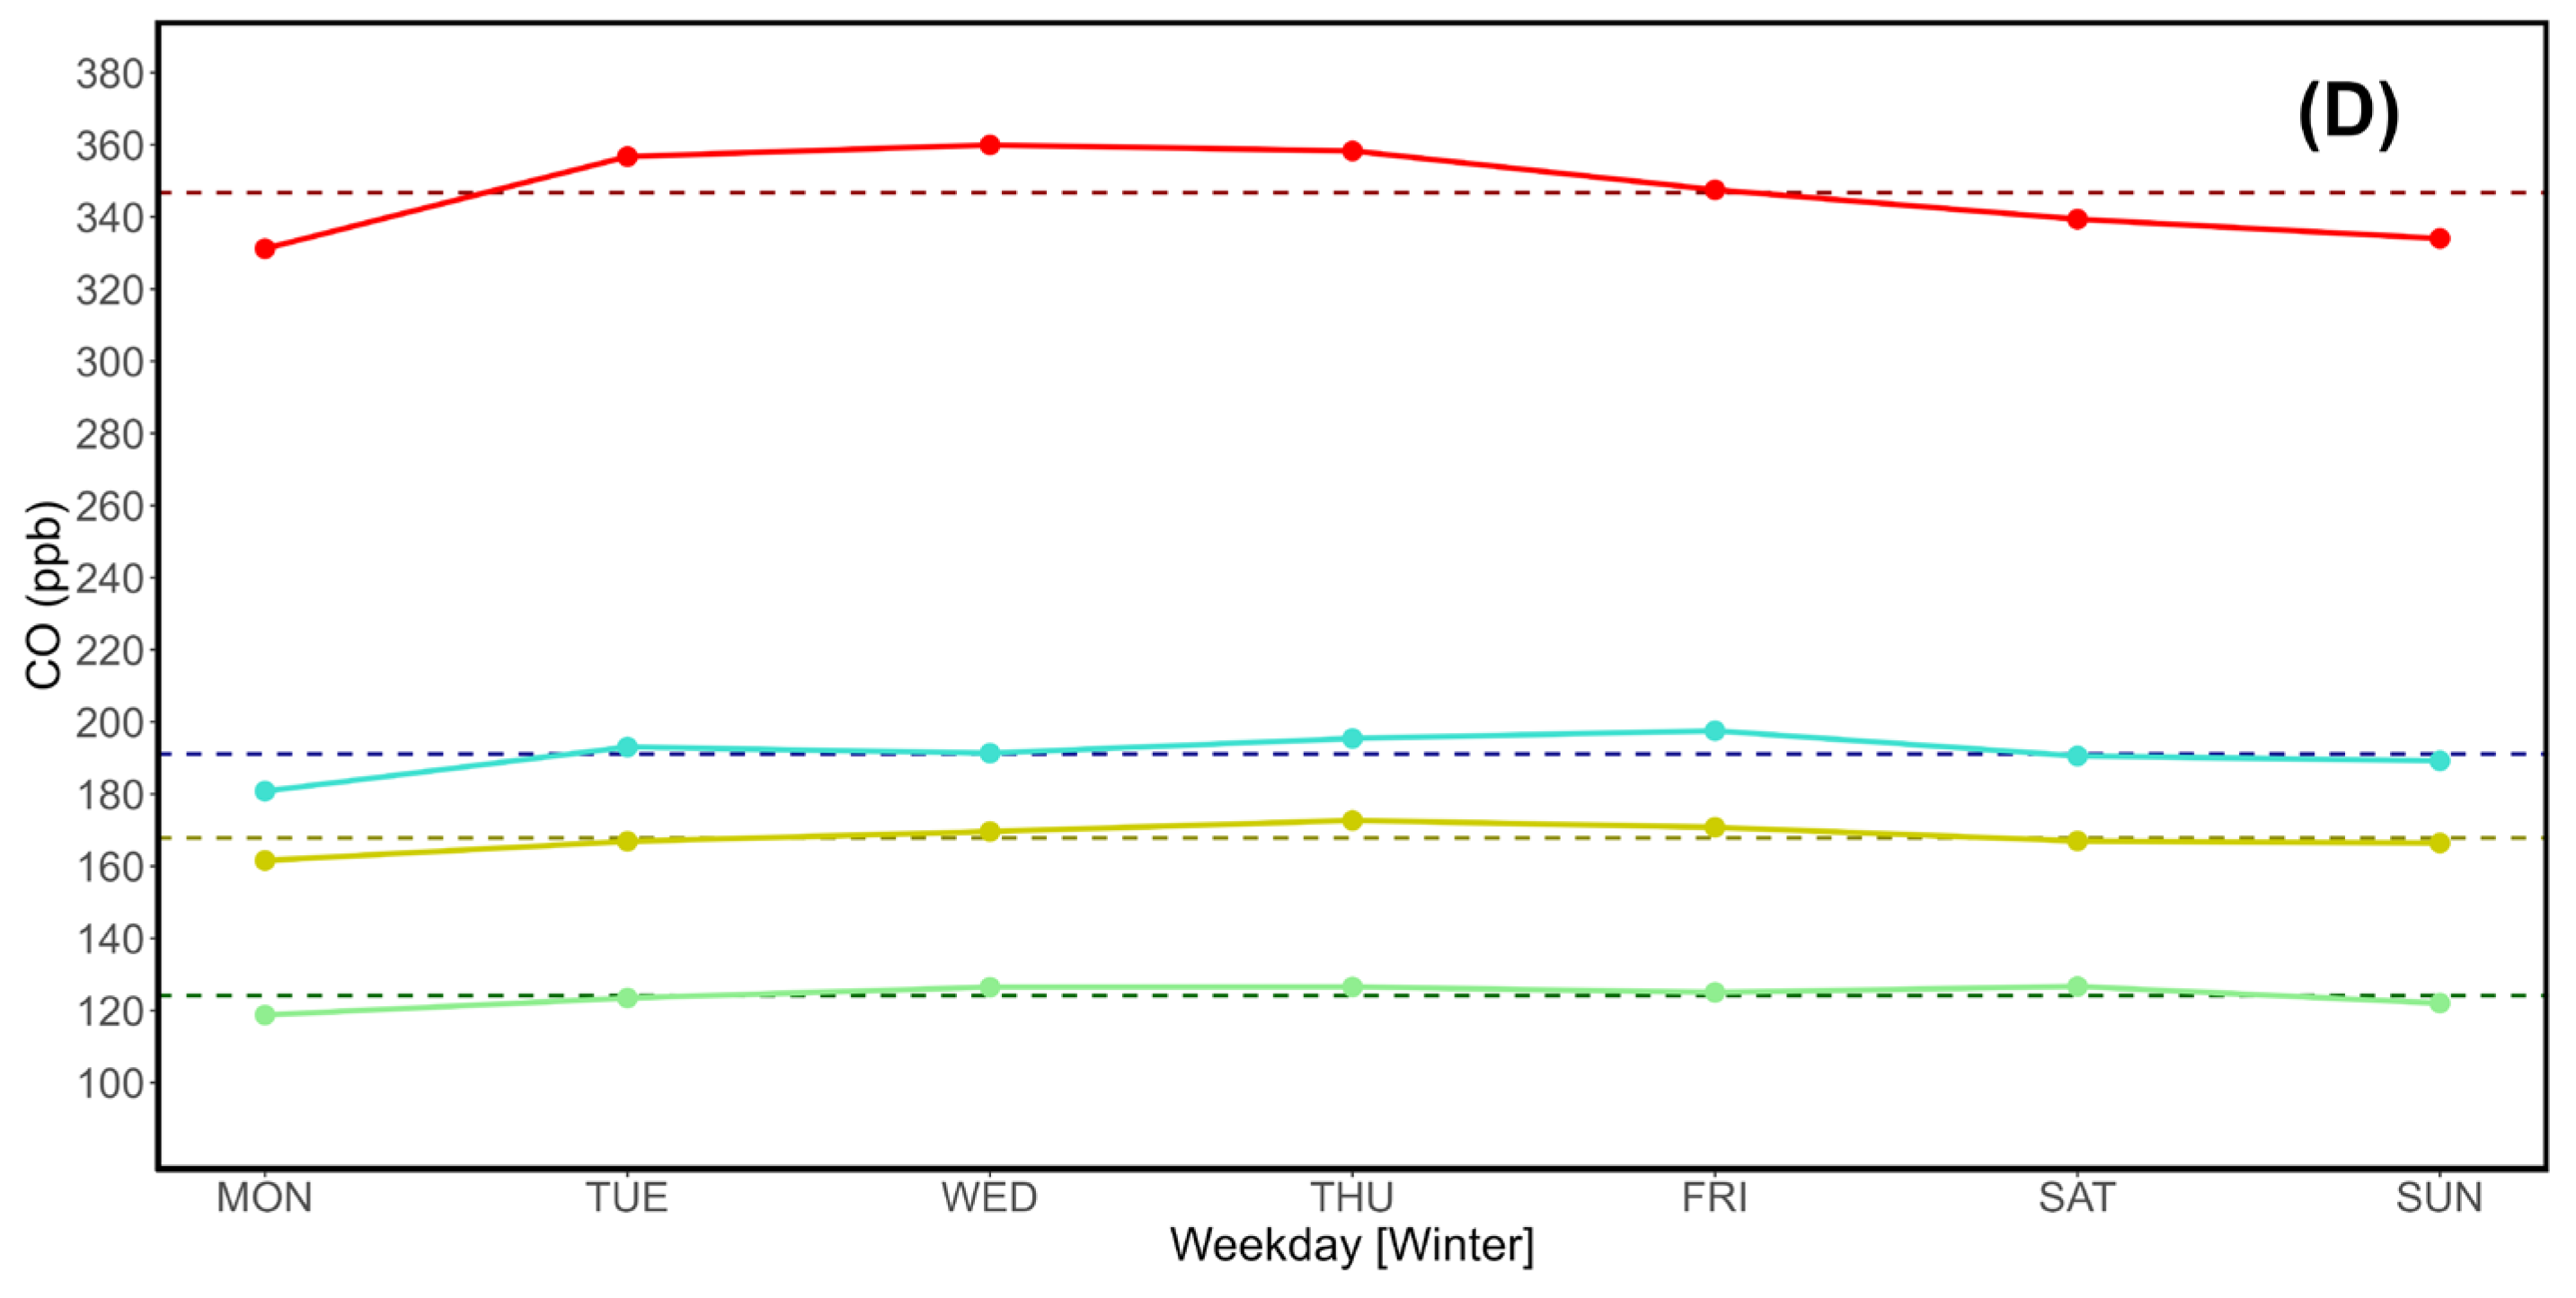
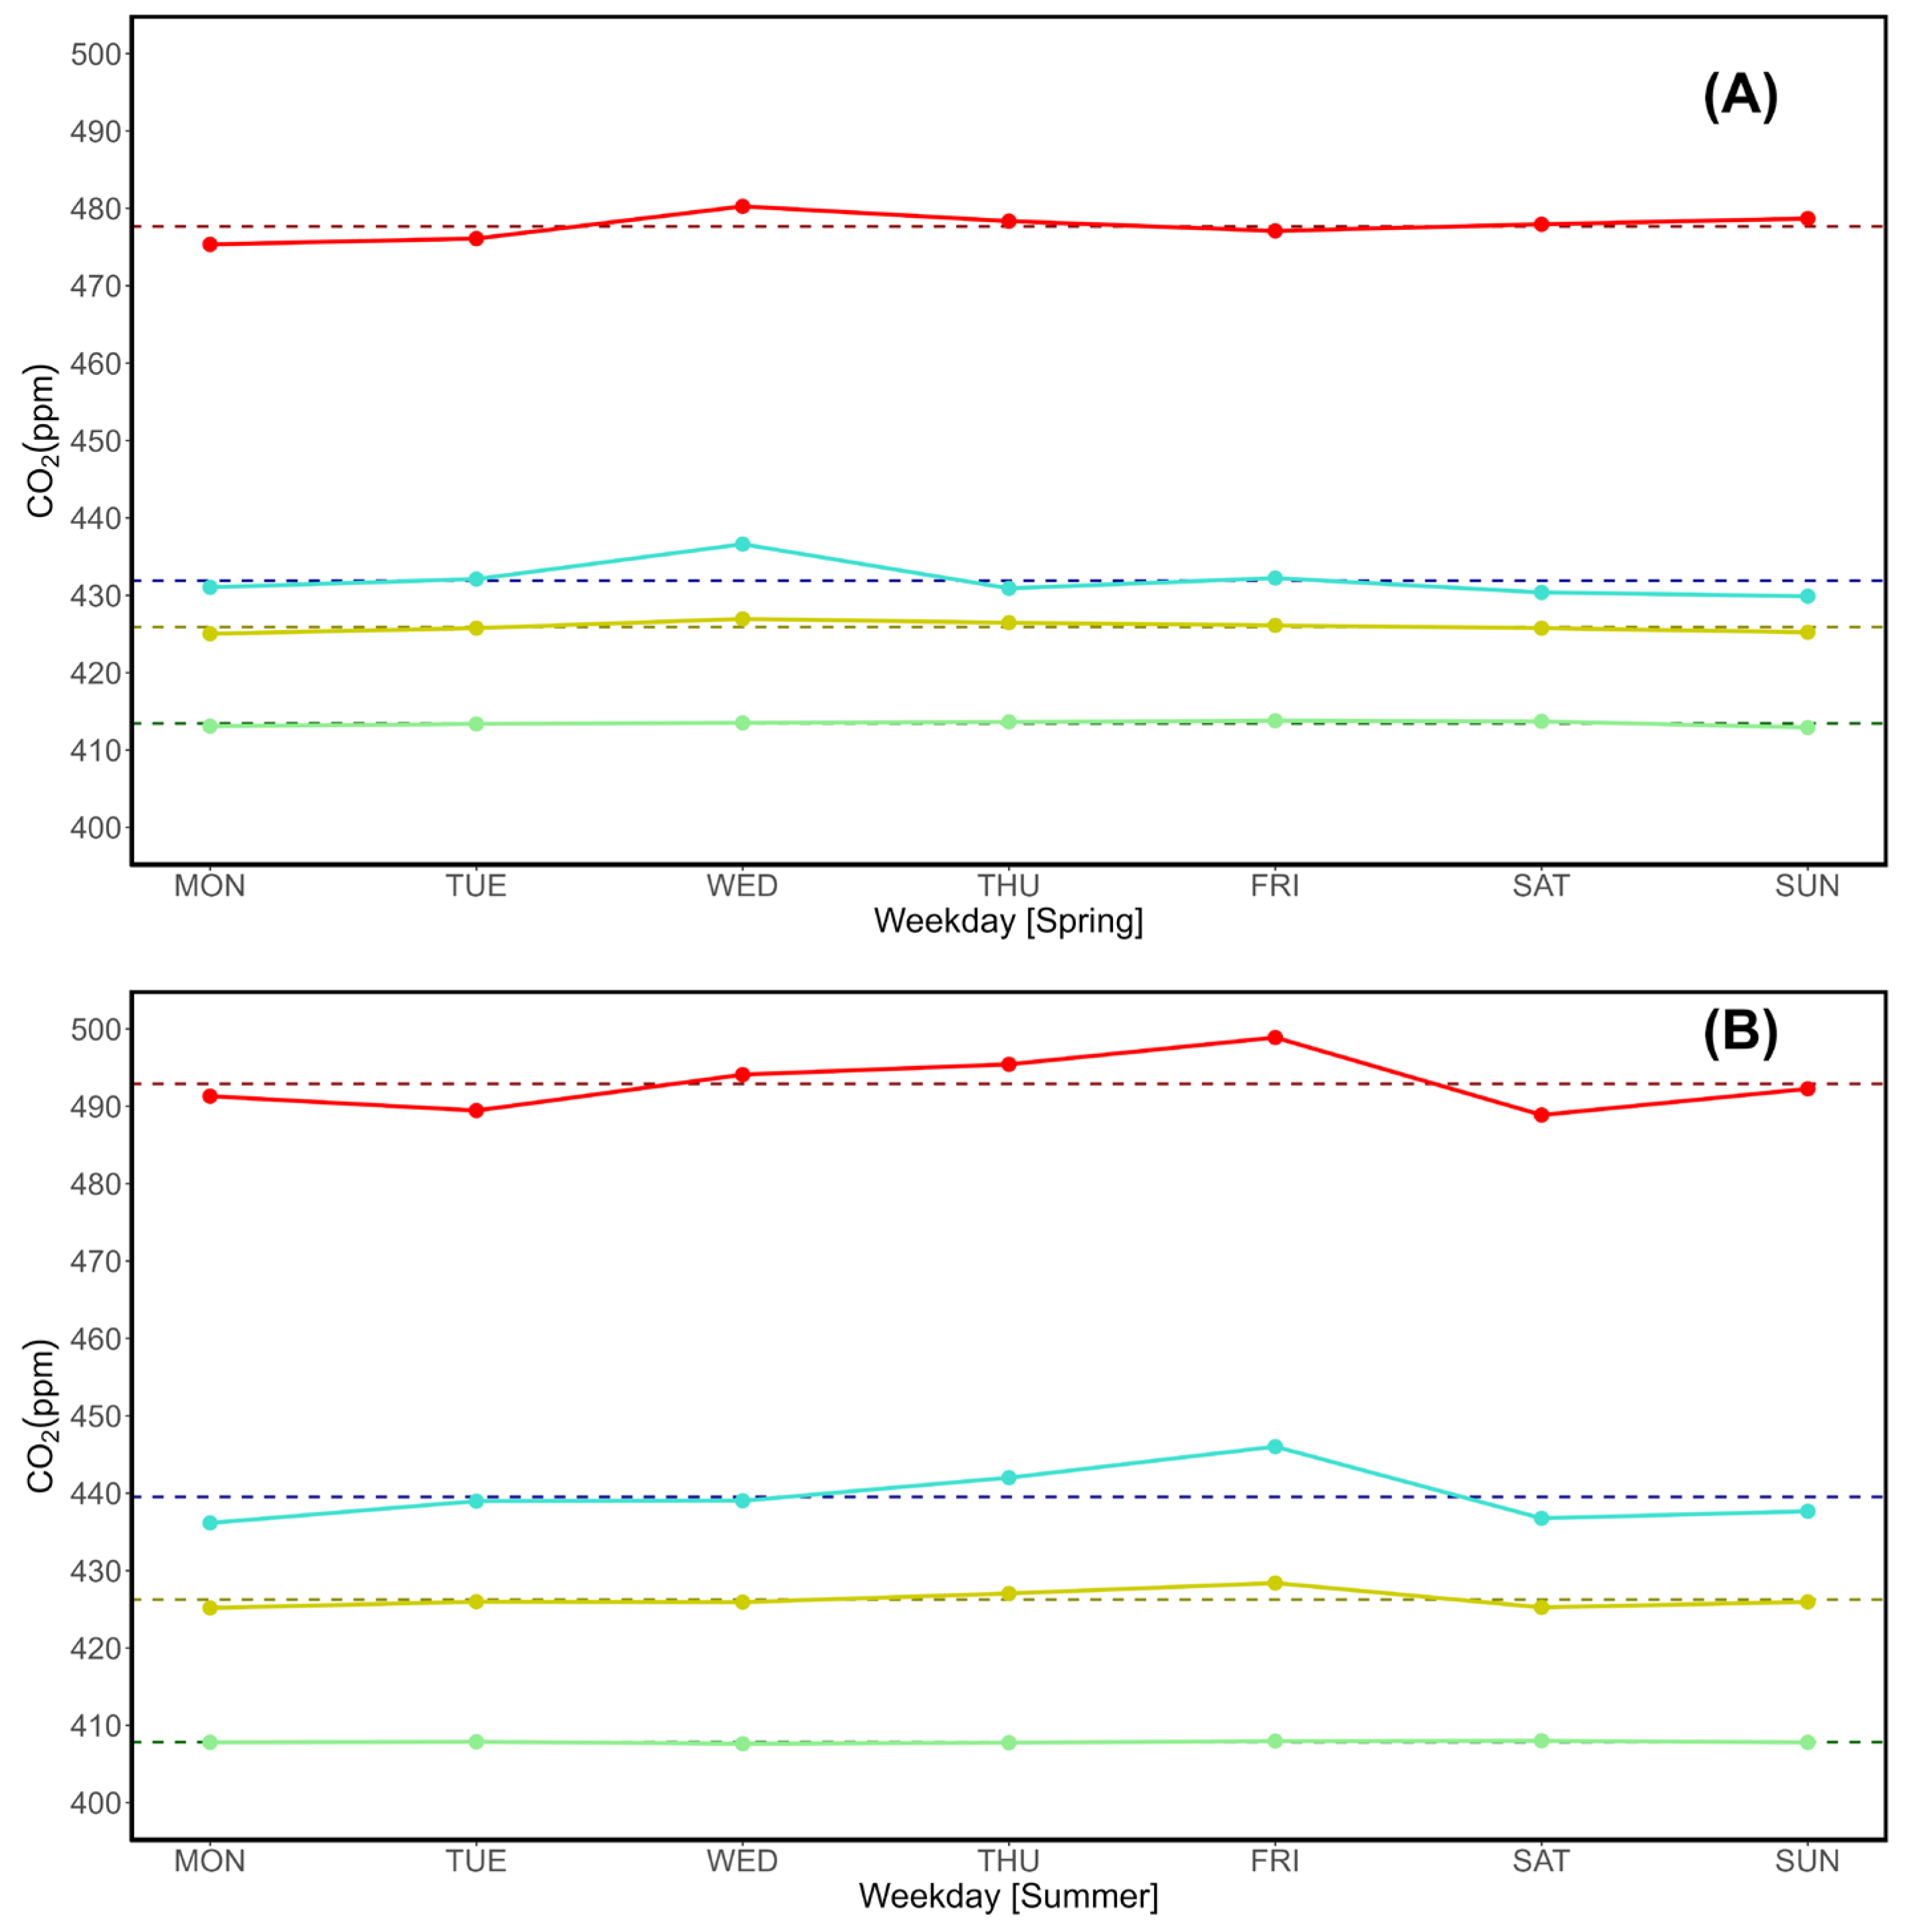
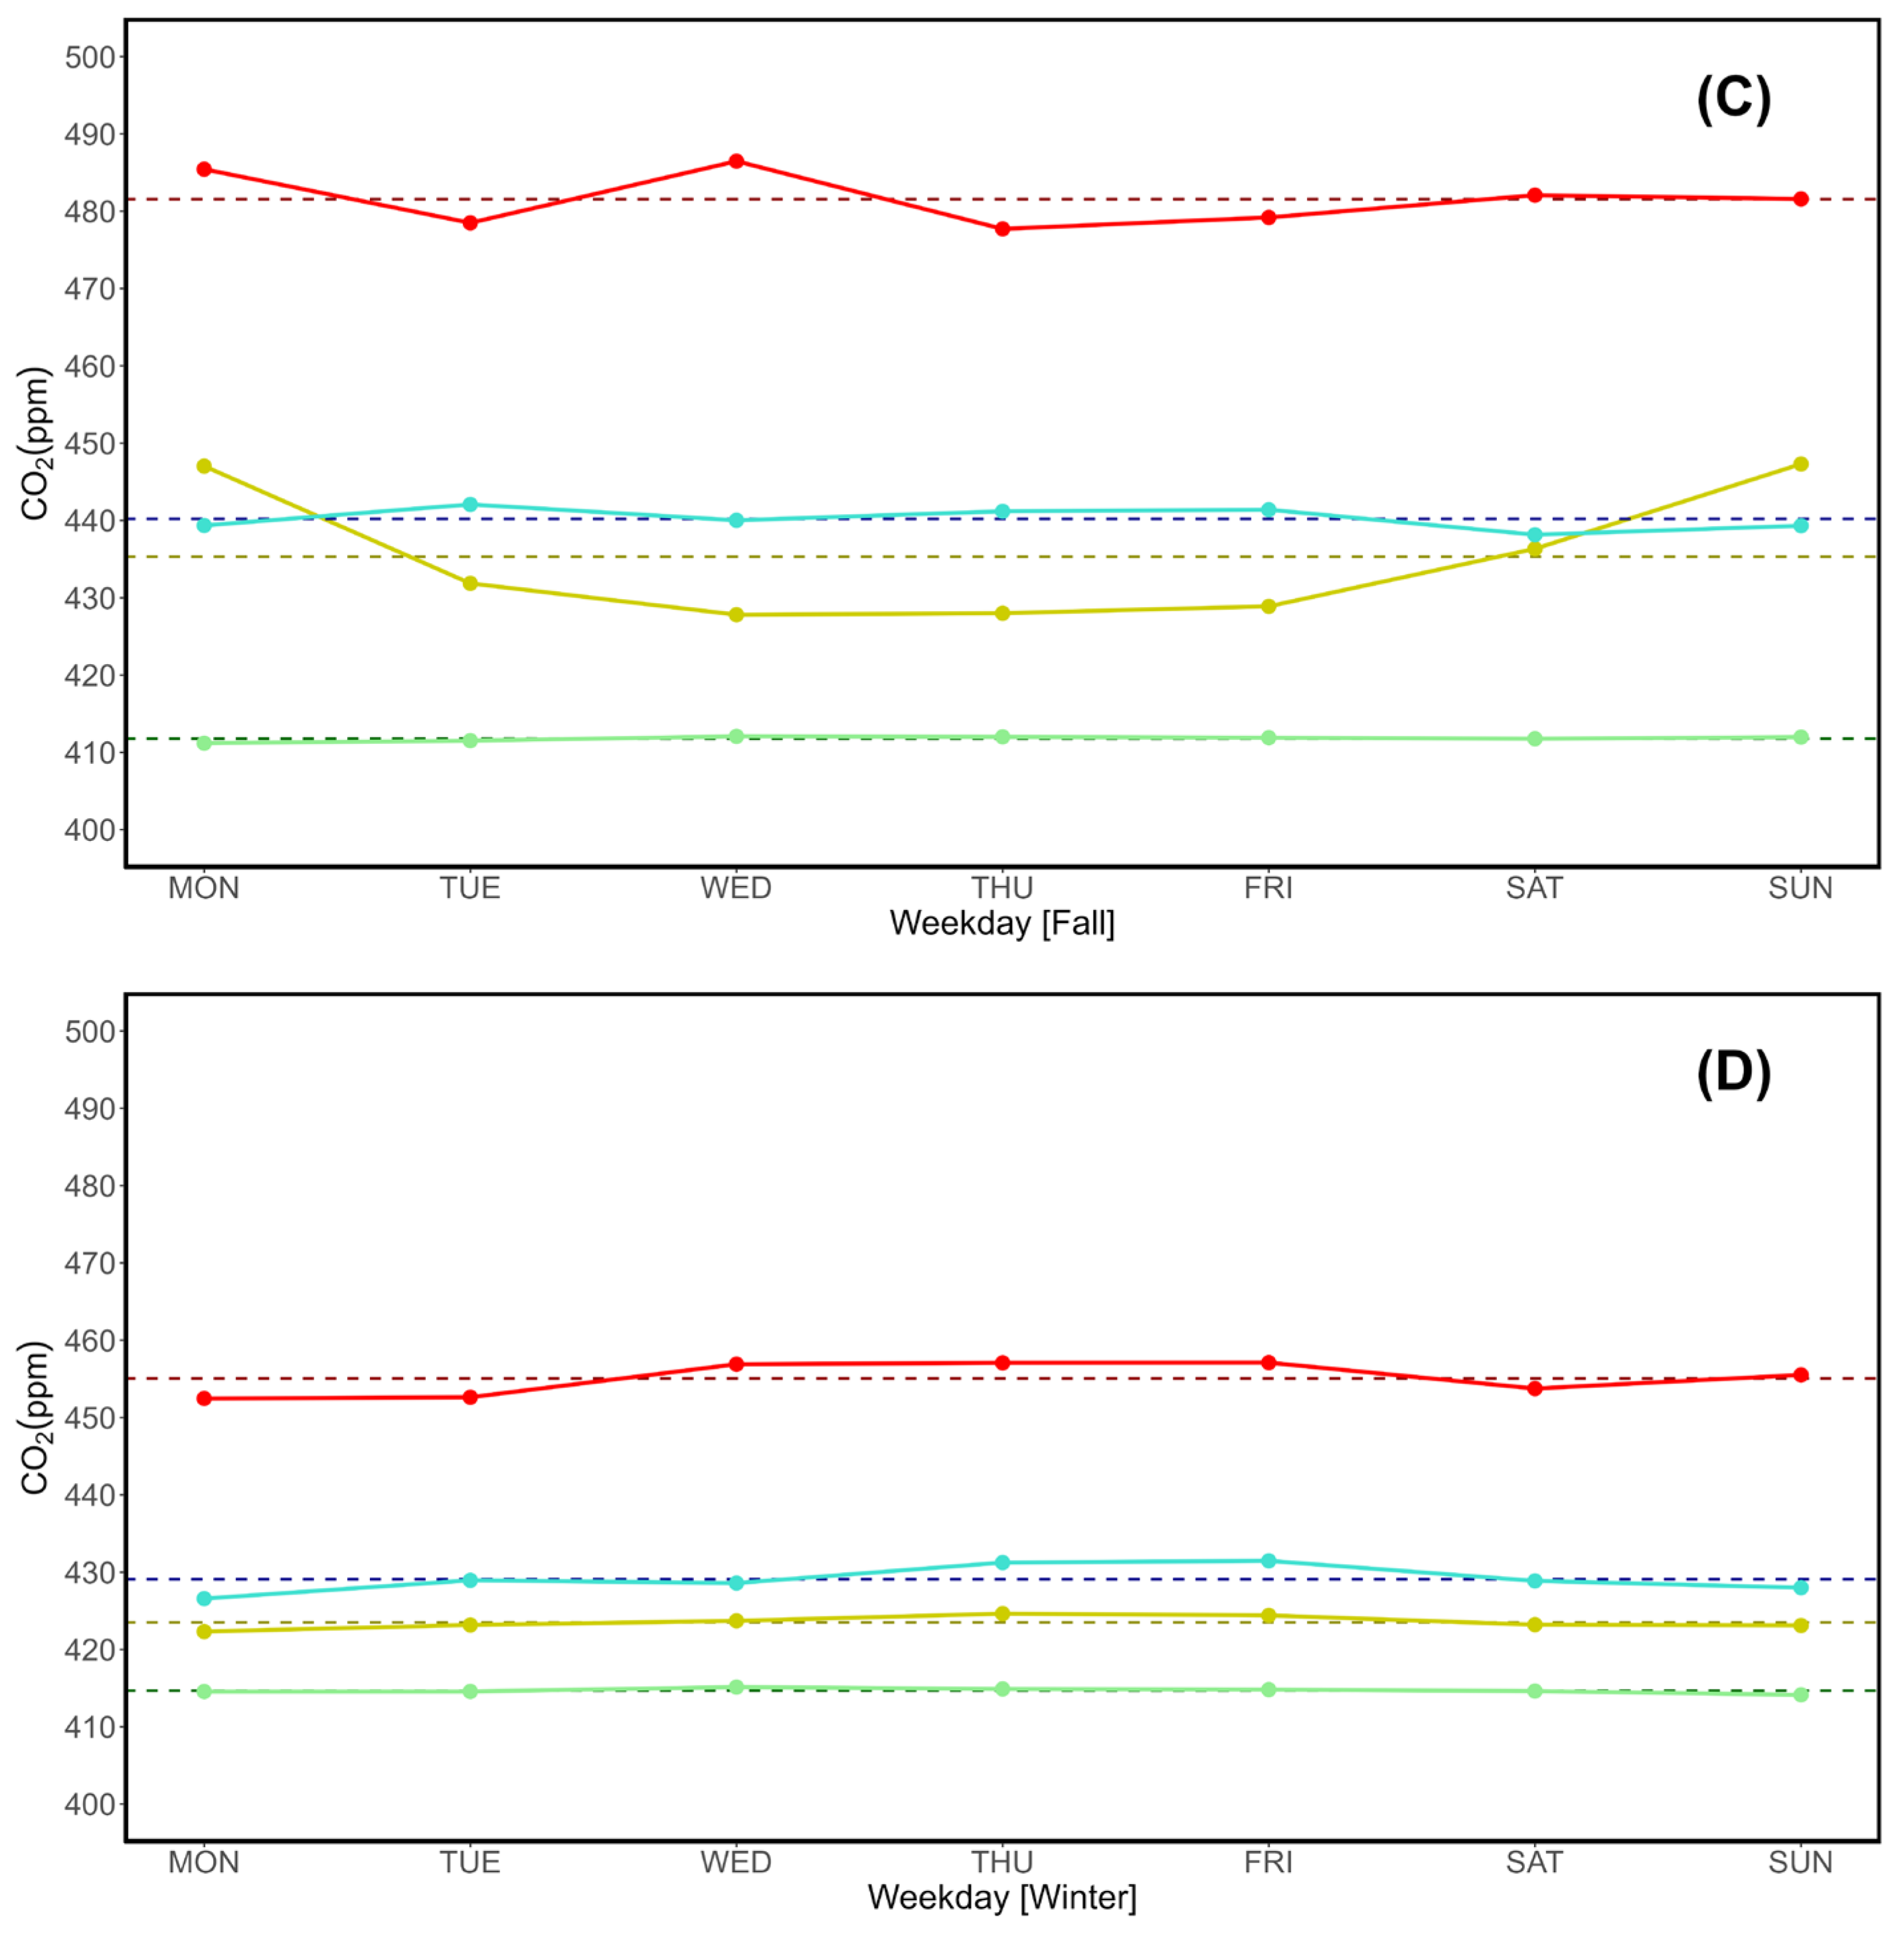
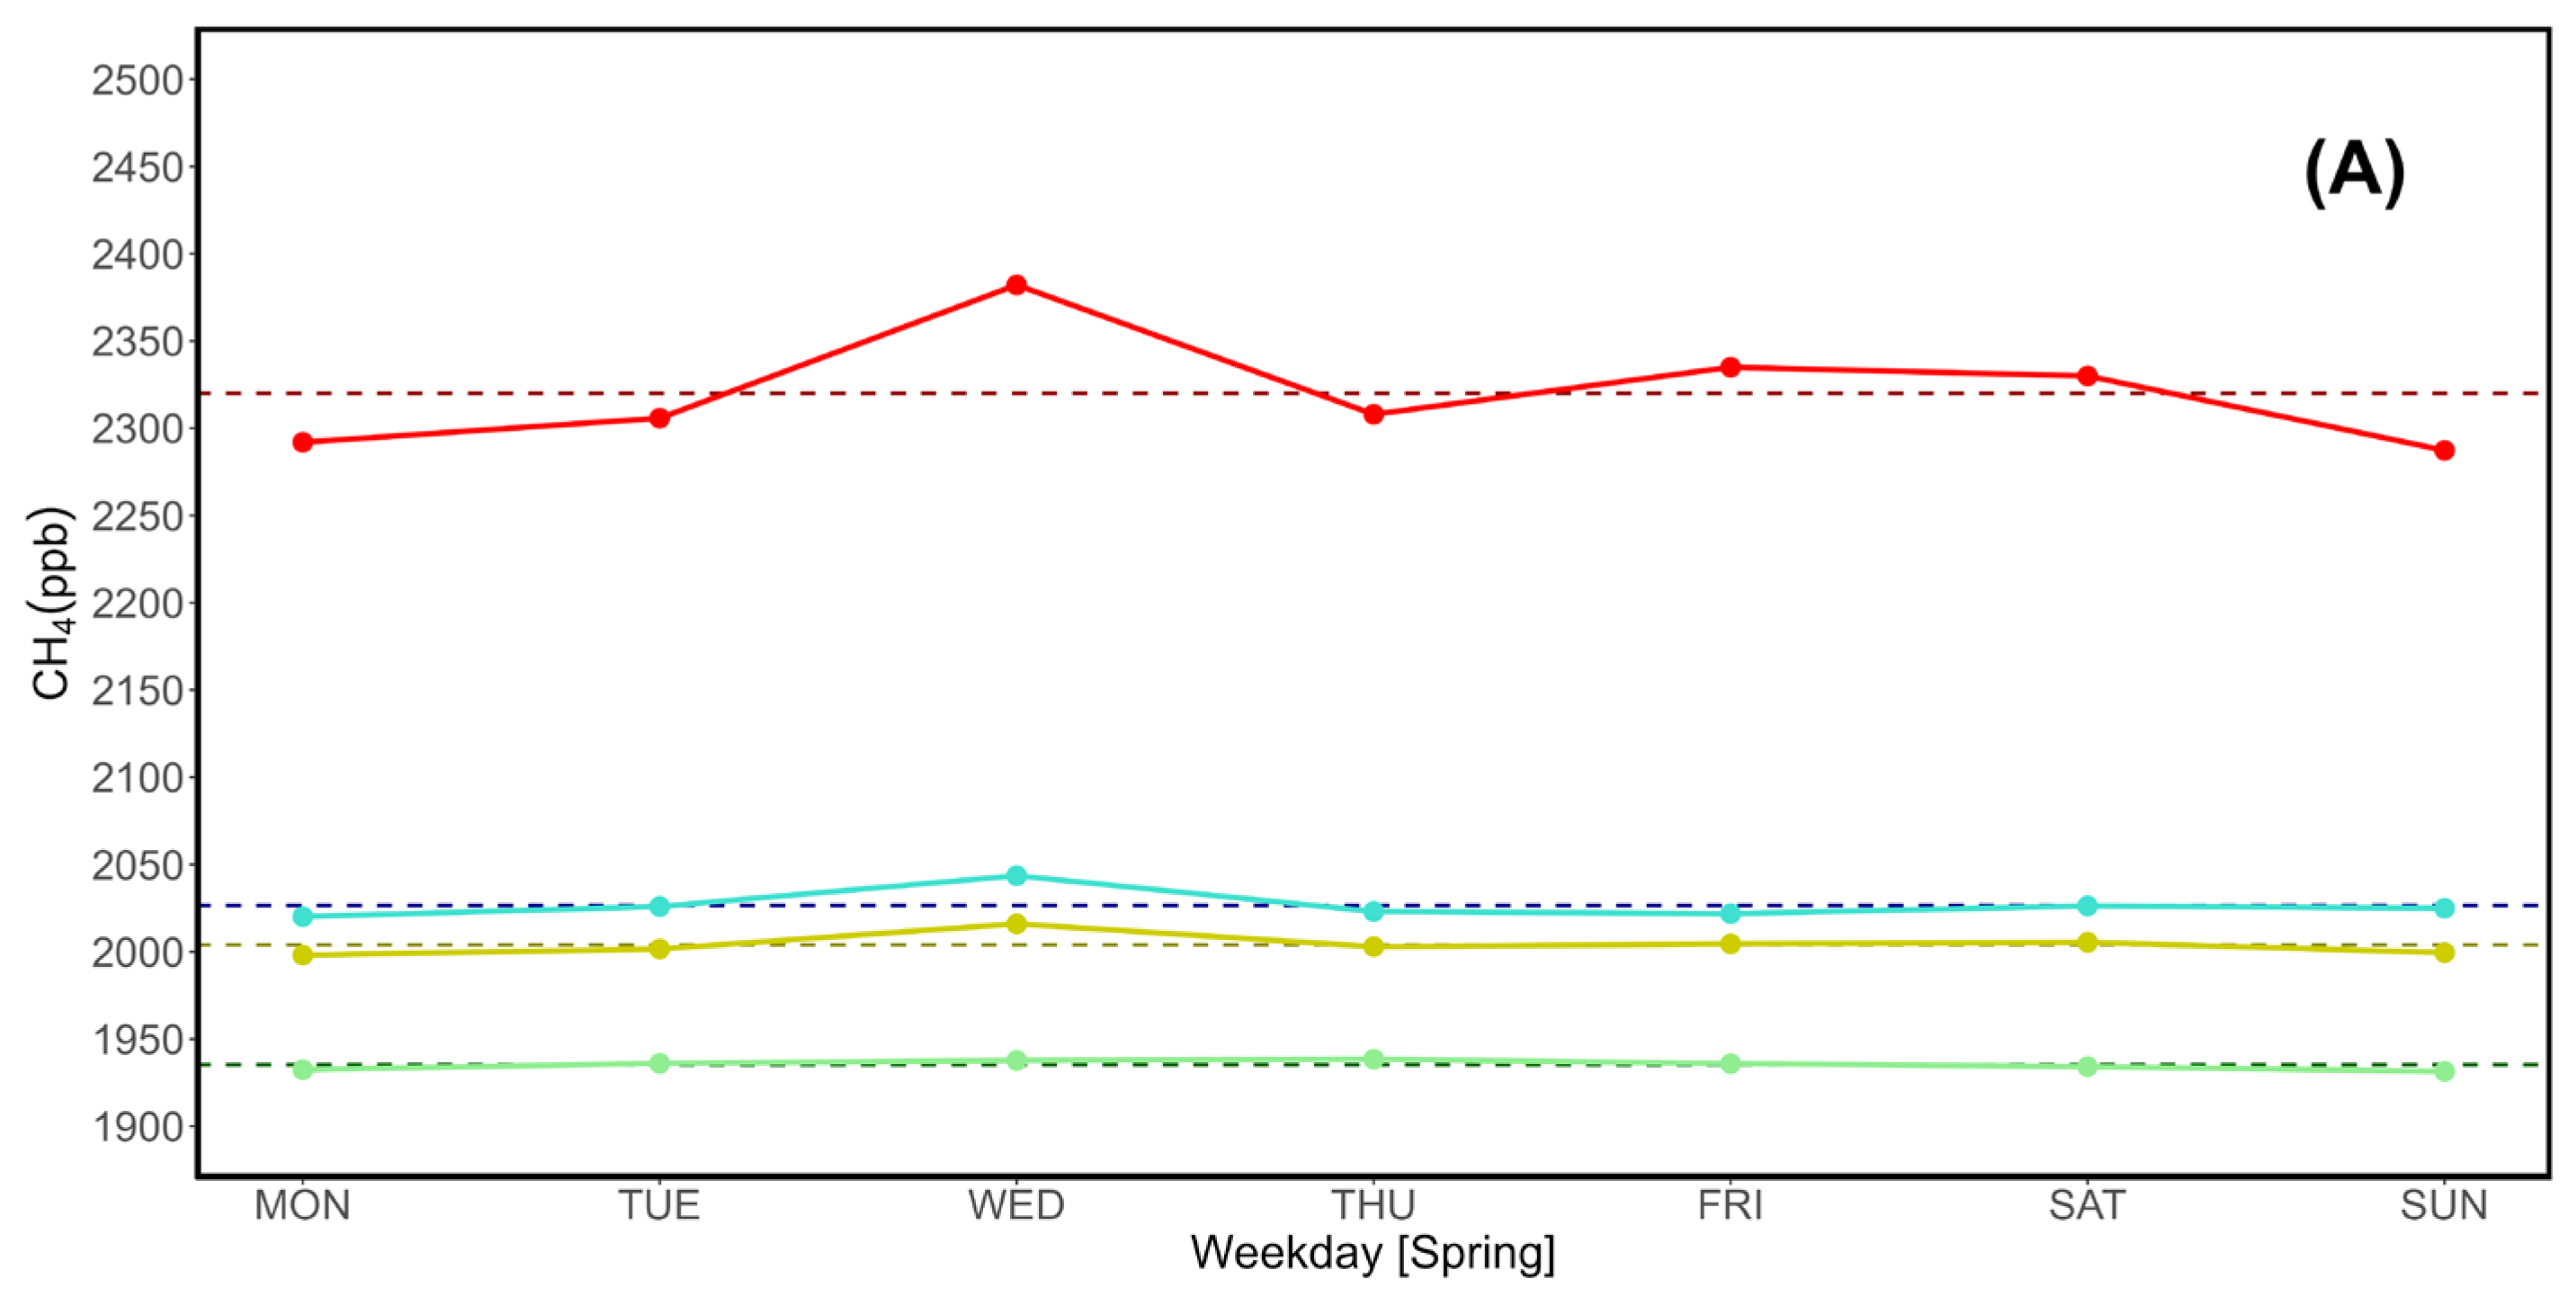
Adding an extra variable – namely, the season – leads to a higher number of tables and graphs. In order to help visualizing the results, Table 3, Table 4, Table 5 and Table 6 are shown in sequence on a per-season basis with all data concerning variations in CO (ppb), CO2 (ppm), CH4 (ppb) and eBC (μg /m3) values, while Figure 3, Figure 4, Figure 5 and Figure 6 address one observed parameter at a time to highlight possible variations between seasons.

3.3. Hourly Occurrence of Outbreak Events

Following the same methodology used in D’Amico et al. (2024a) [55] with respect to CH4, hourly values satisfying specific conditions have been counted throughout the entire CO, CO2 (Picarro) and eBC (Thermo Scientific) datasets, also accounting for seasonal changes, which in the case of CH4 have been evaluated in this research for the first time. This section will focus directly on seasonal evaluations, while yearly CO, CO2, and eBC results can be viewed as Supplementary Materials S2-A1 through S2-H3. Comparable CH4 plots are accessible from D’Amico et al. (2024a) as Supplementary Materials [55].
In order to account for multi-year trends such as the increase in methane reported in D’Amico et al. (2024a) [55], each seasonal threshold has been calculated on a yearly basis for each parameter, and the result shown in Table 7 is the sum of all outbreak hours across the entire 2016-2022 observation period. Overall, 224 sub-thresholds have been calculated via dedicated filters, which are not shown for the sake of conciseness. 20% of the reported lowest thresholds occur on Sundays.
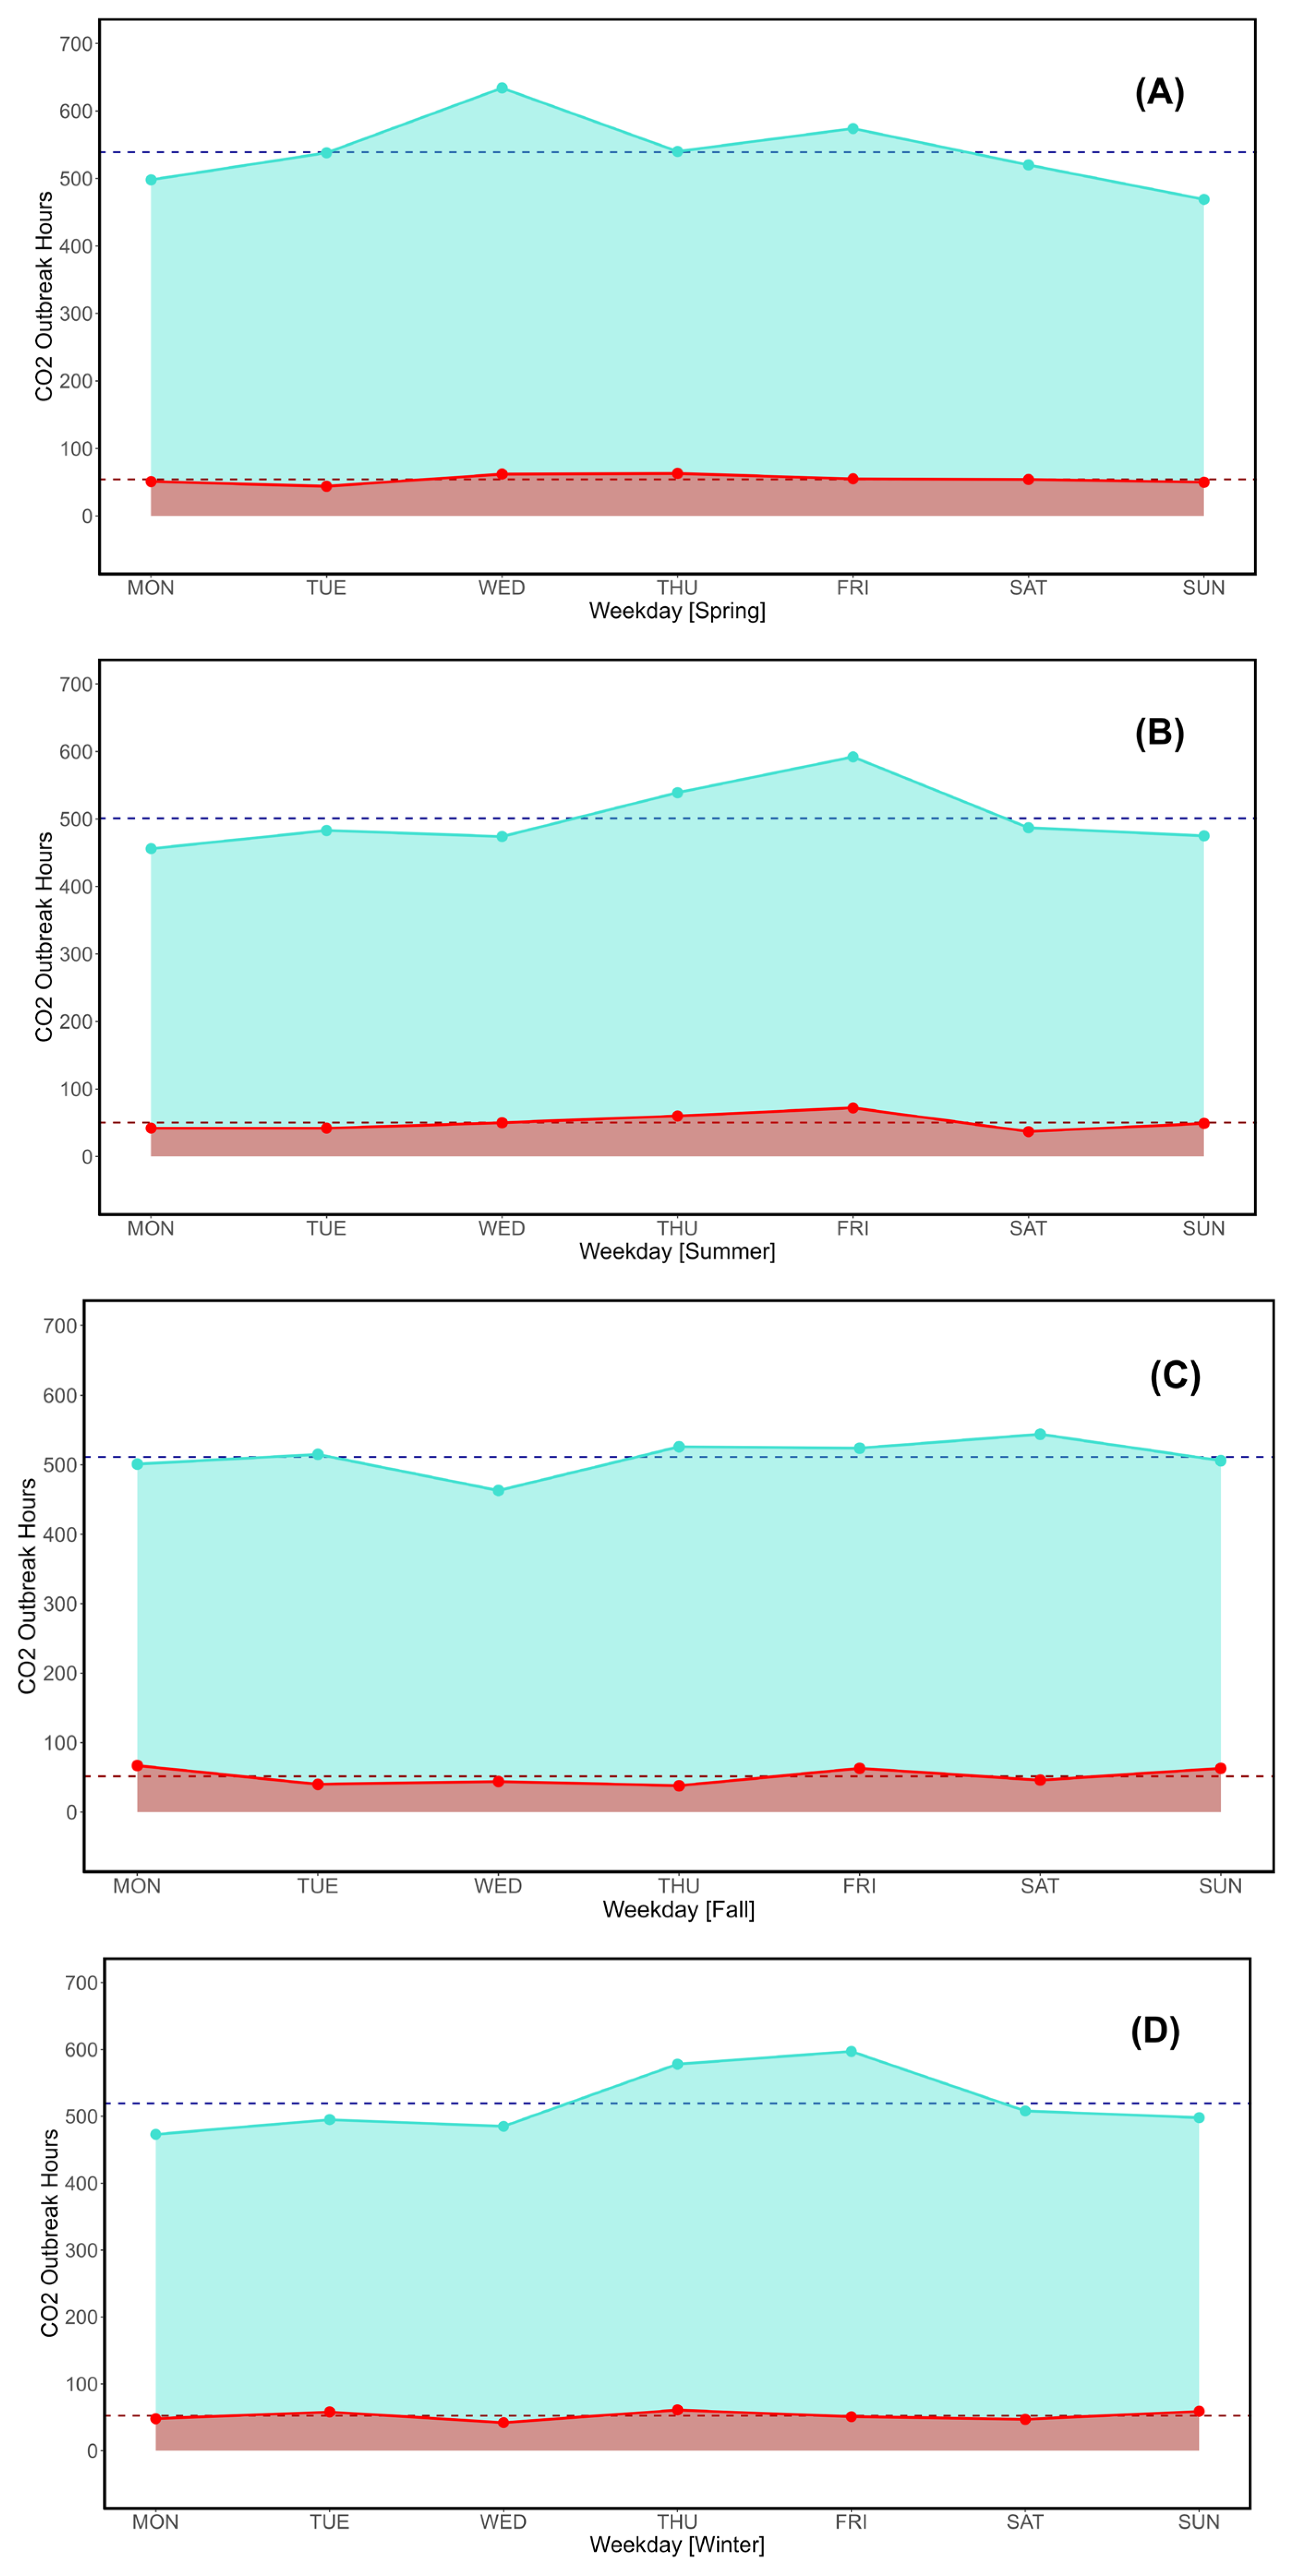
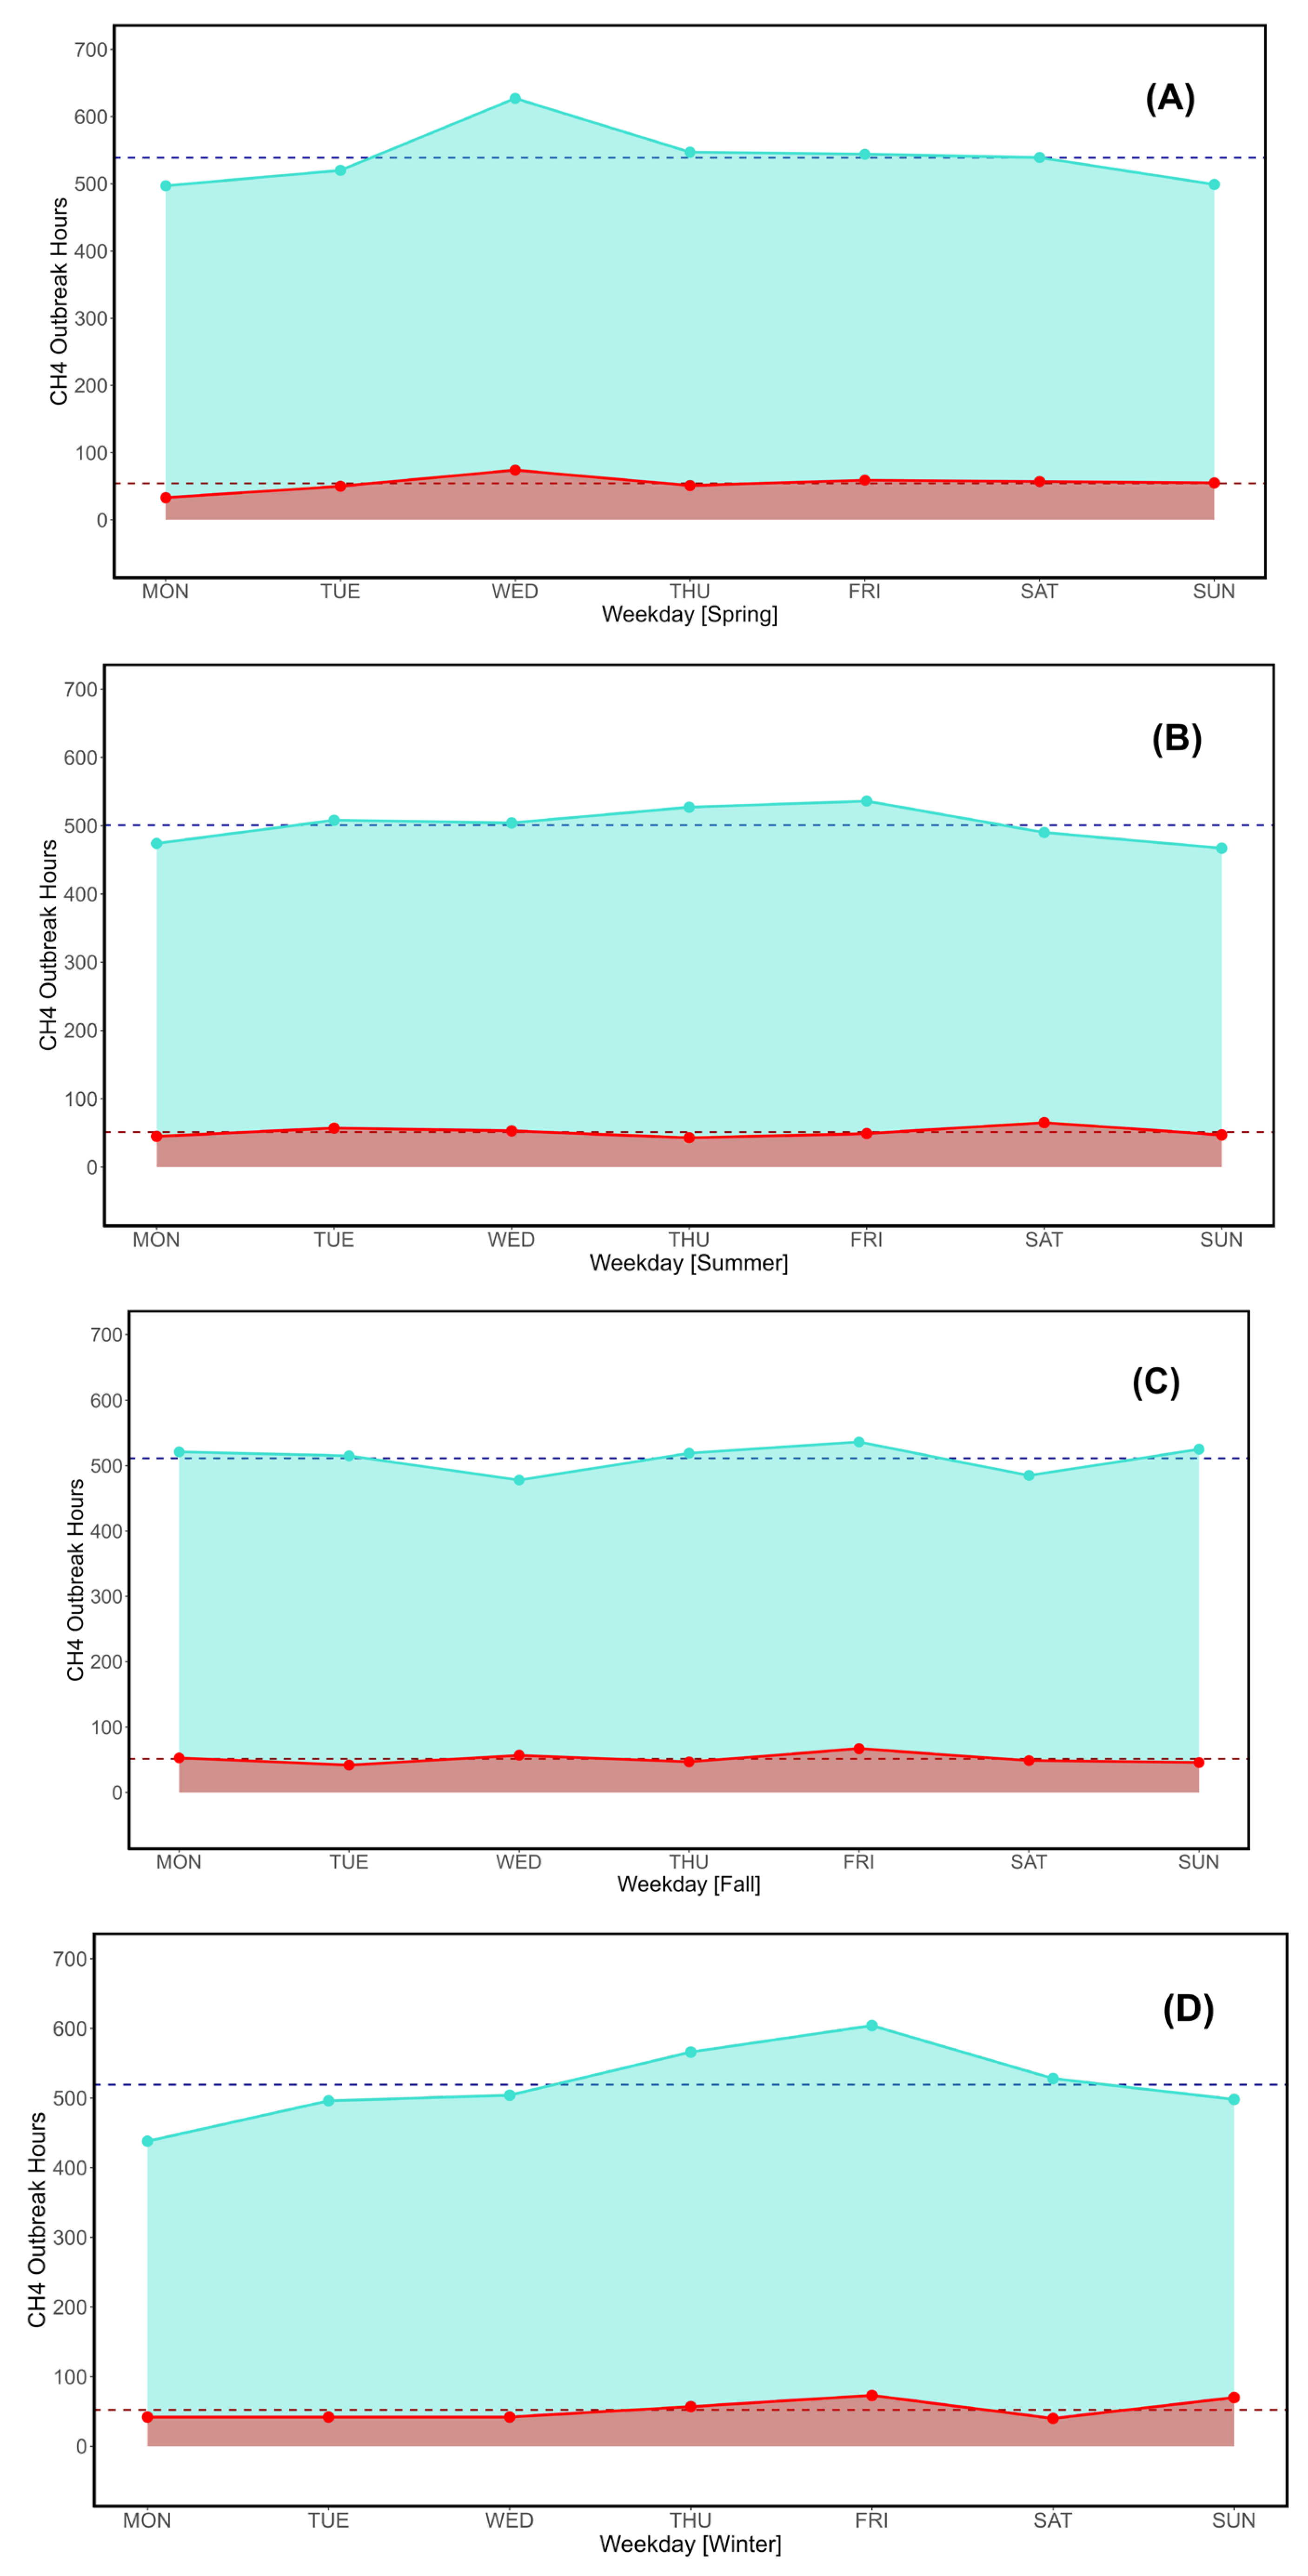
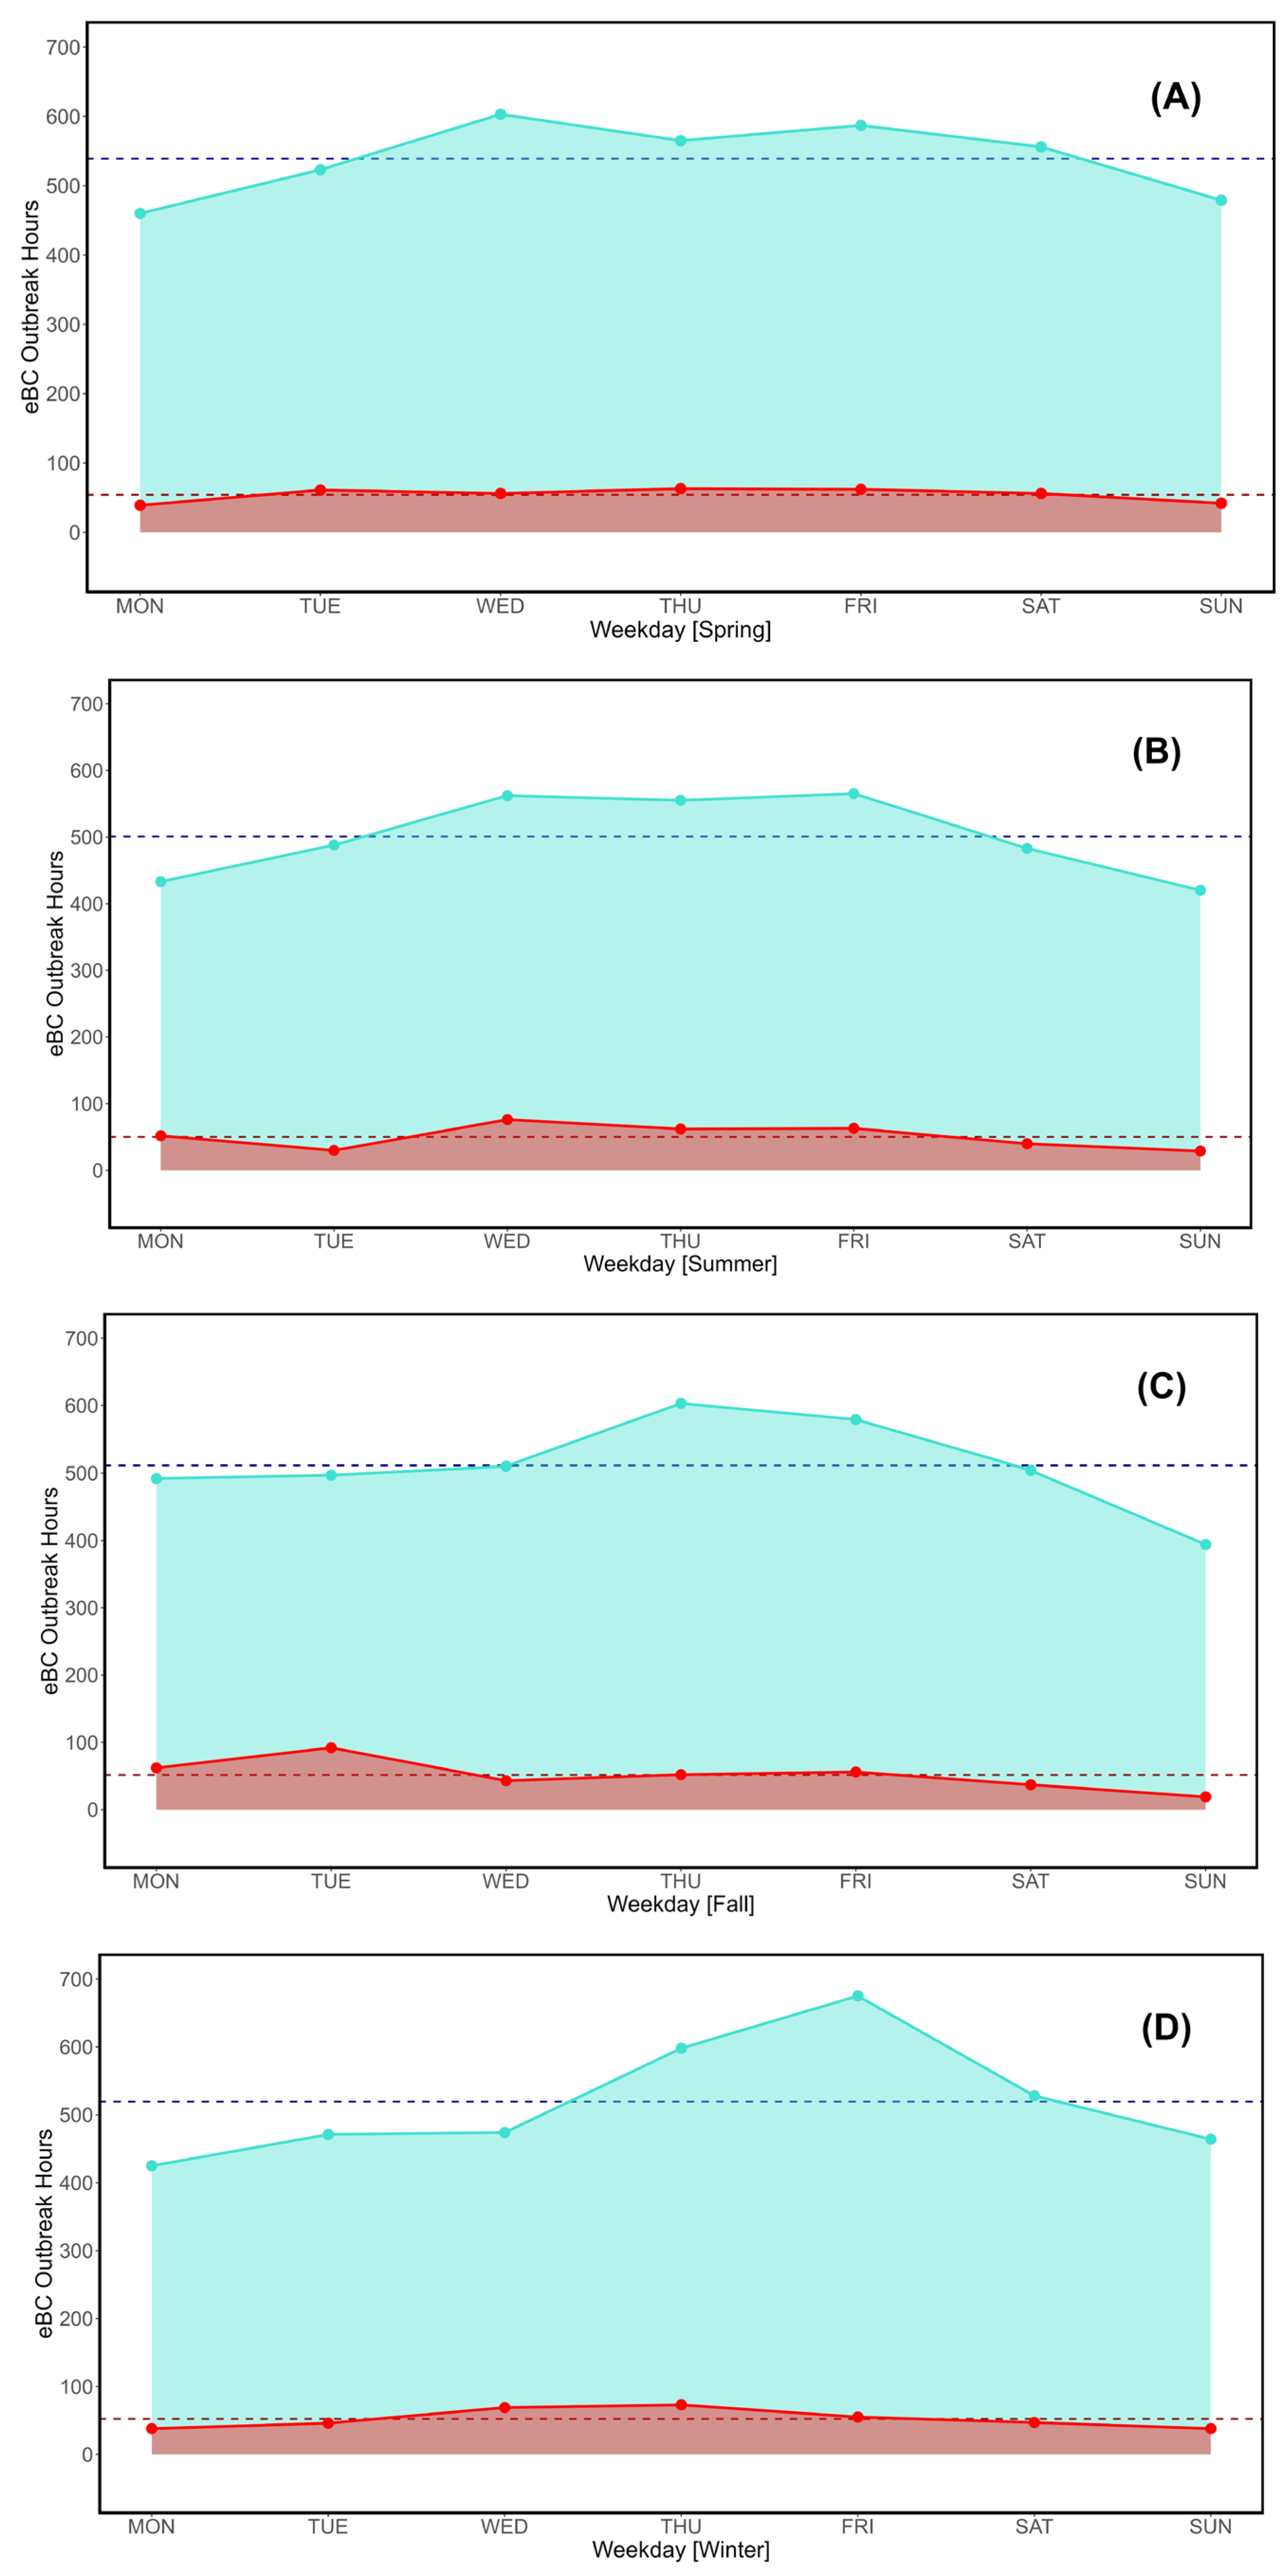
Figure 7, Figure 8, Figure 9 and Figure 10 show the number of outbreak hours on a per-parameter basis to highlight seasonal differences. Shaded areas follow the same pattern seen in D’Amico et al. (2024a) [55]. The y axis of all graphs is set on the same scale to ease data visualization.

3.4. Weighed Distribution of Weekly Outbreaks (WDWO)

Using seasonal values per weekday as well as the hourly count of observations greater or equal than Q3 and the top 2.5% thresholds, a weighed parameter hereby defined as WDWO (Weighed Distribution of Weekly Outbreaks) has been introduced to combine the two factors and provide a more representative view on weekly variations across the CO, CO2, CH4, and eBC datasets.
The value attributed to each day of the week, for each parameter, is multiplied by the number of hours (observations) satisfying the two before-mentioned thresholds. It is then divided by the sum of all values for all weekdays, which in turn is multiplied by the total number of observations per threshold. Equations 1 and 2 show the computed formulas for the Q3 and top 2.5% interval respectively, using Monday as example:
WDWO[MON]Q3 = (HRMON*VLMON)/(HRTOT*VLTOT)
WDWO[MON]T2.5 = (HRMON*VLMON)/(HRTOT*VLTOT)
Where Q3 and T2.5 refer to the 3rd quartile and top 2.5% thresholds, HRMON indicates the number of hours satisfying the Q3 and T2.5 filters occurring on Monday, and VLMON is the value linked to specific thresholds. Dividing by the HRTOT x VLTOT results in all seven values being conveniently shown as decimal fractions of 1. Moreso, this method conveniently normalizes as percentages quantities and measurements that are various in nature (hours, ppm, ppb, μg /m3) into a single, consistent scale.
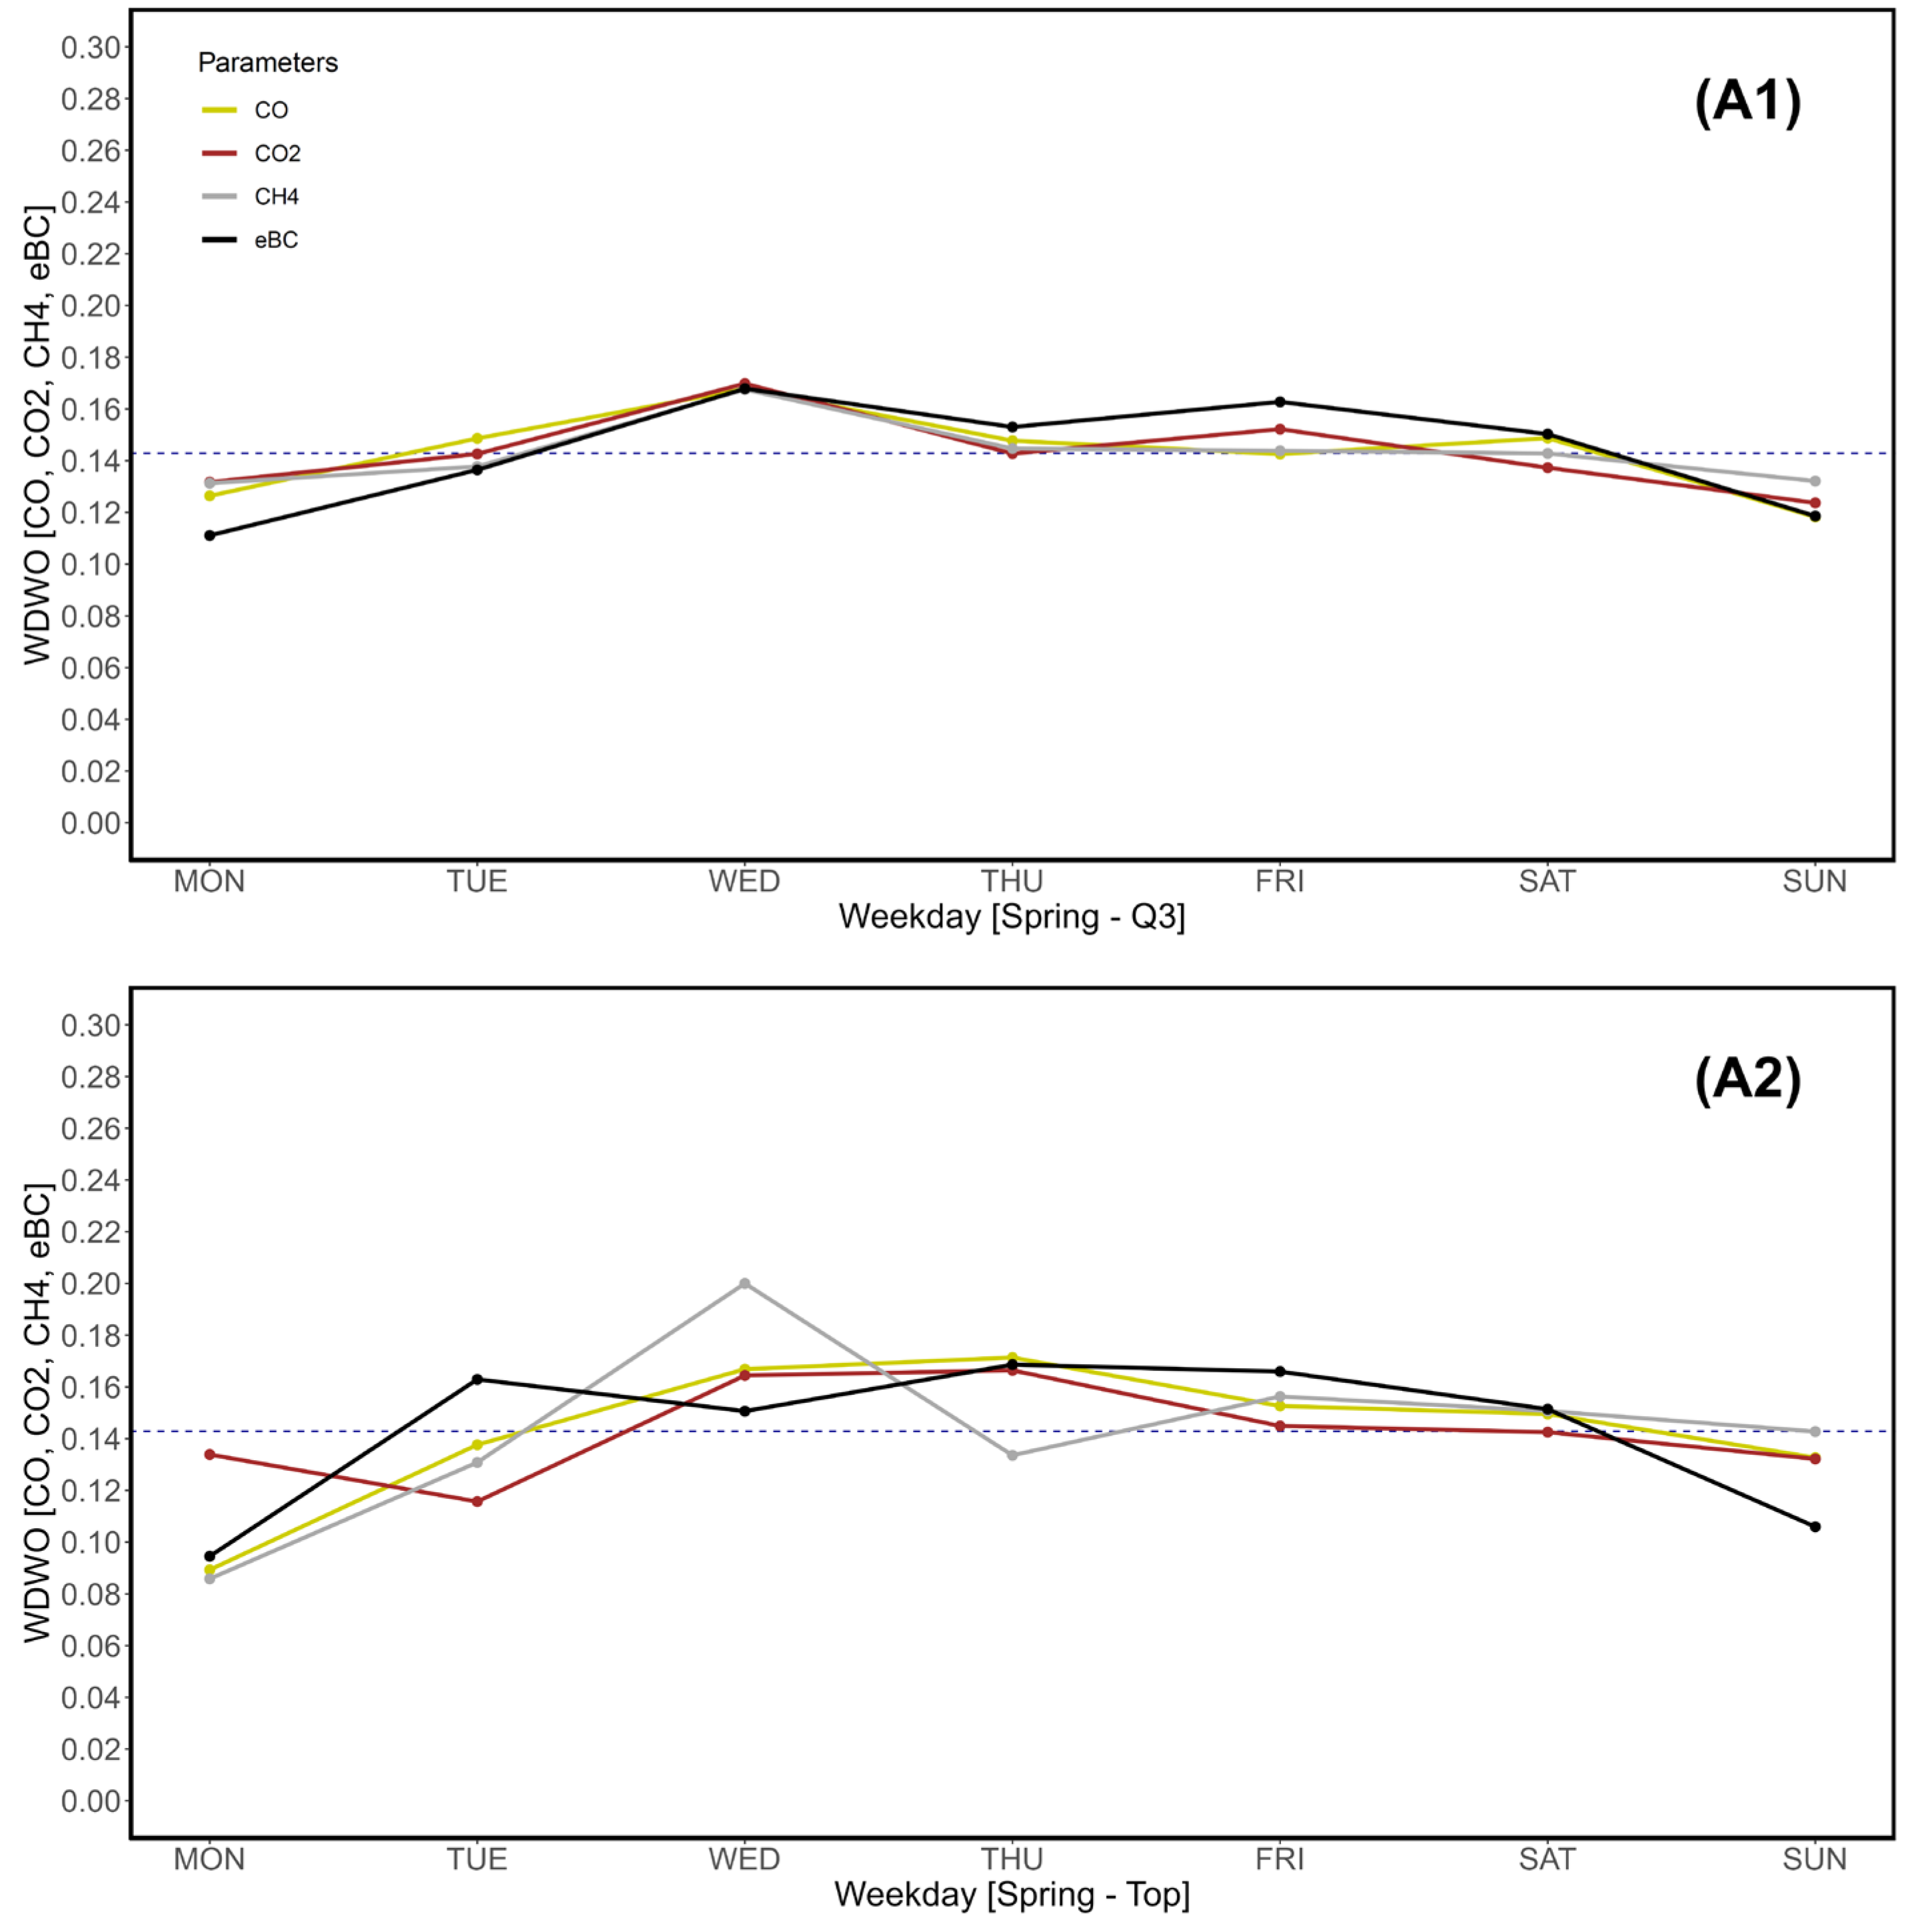
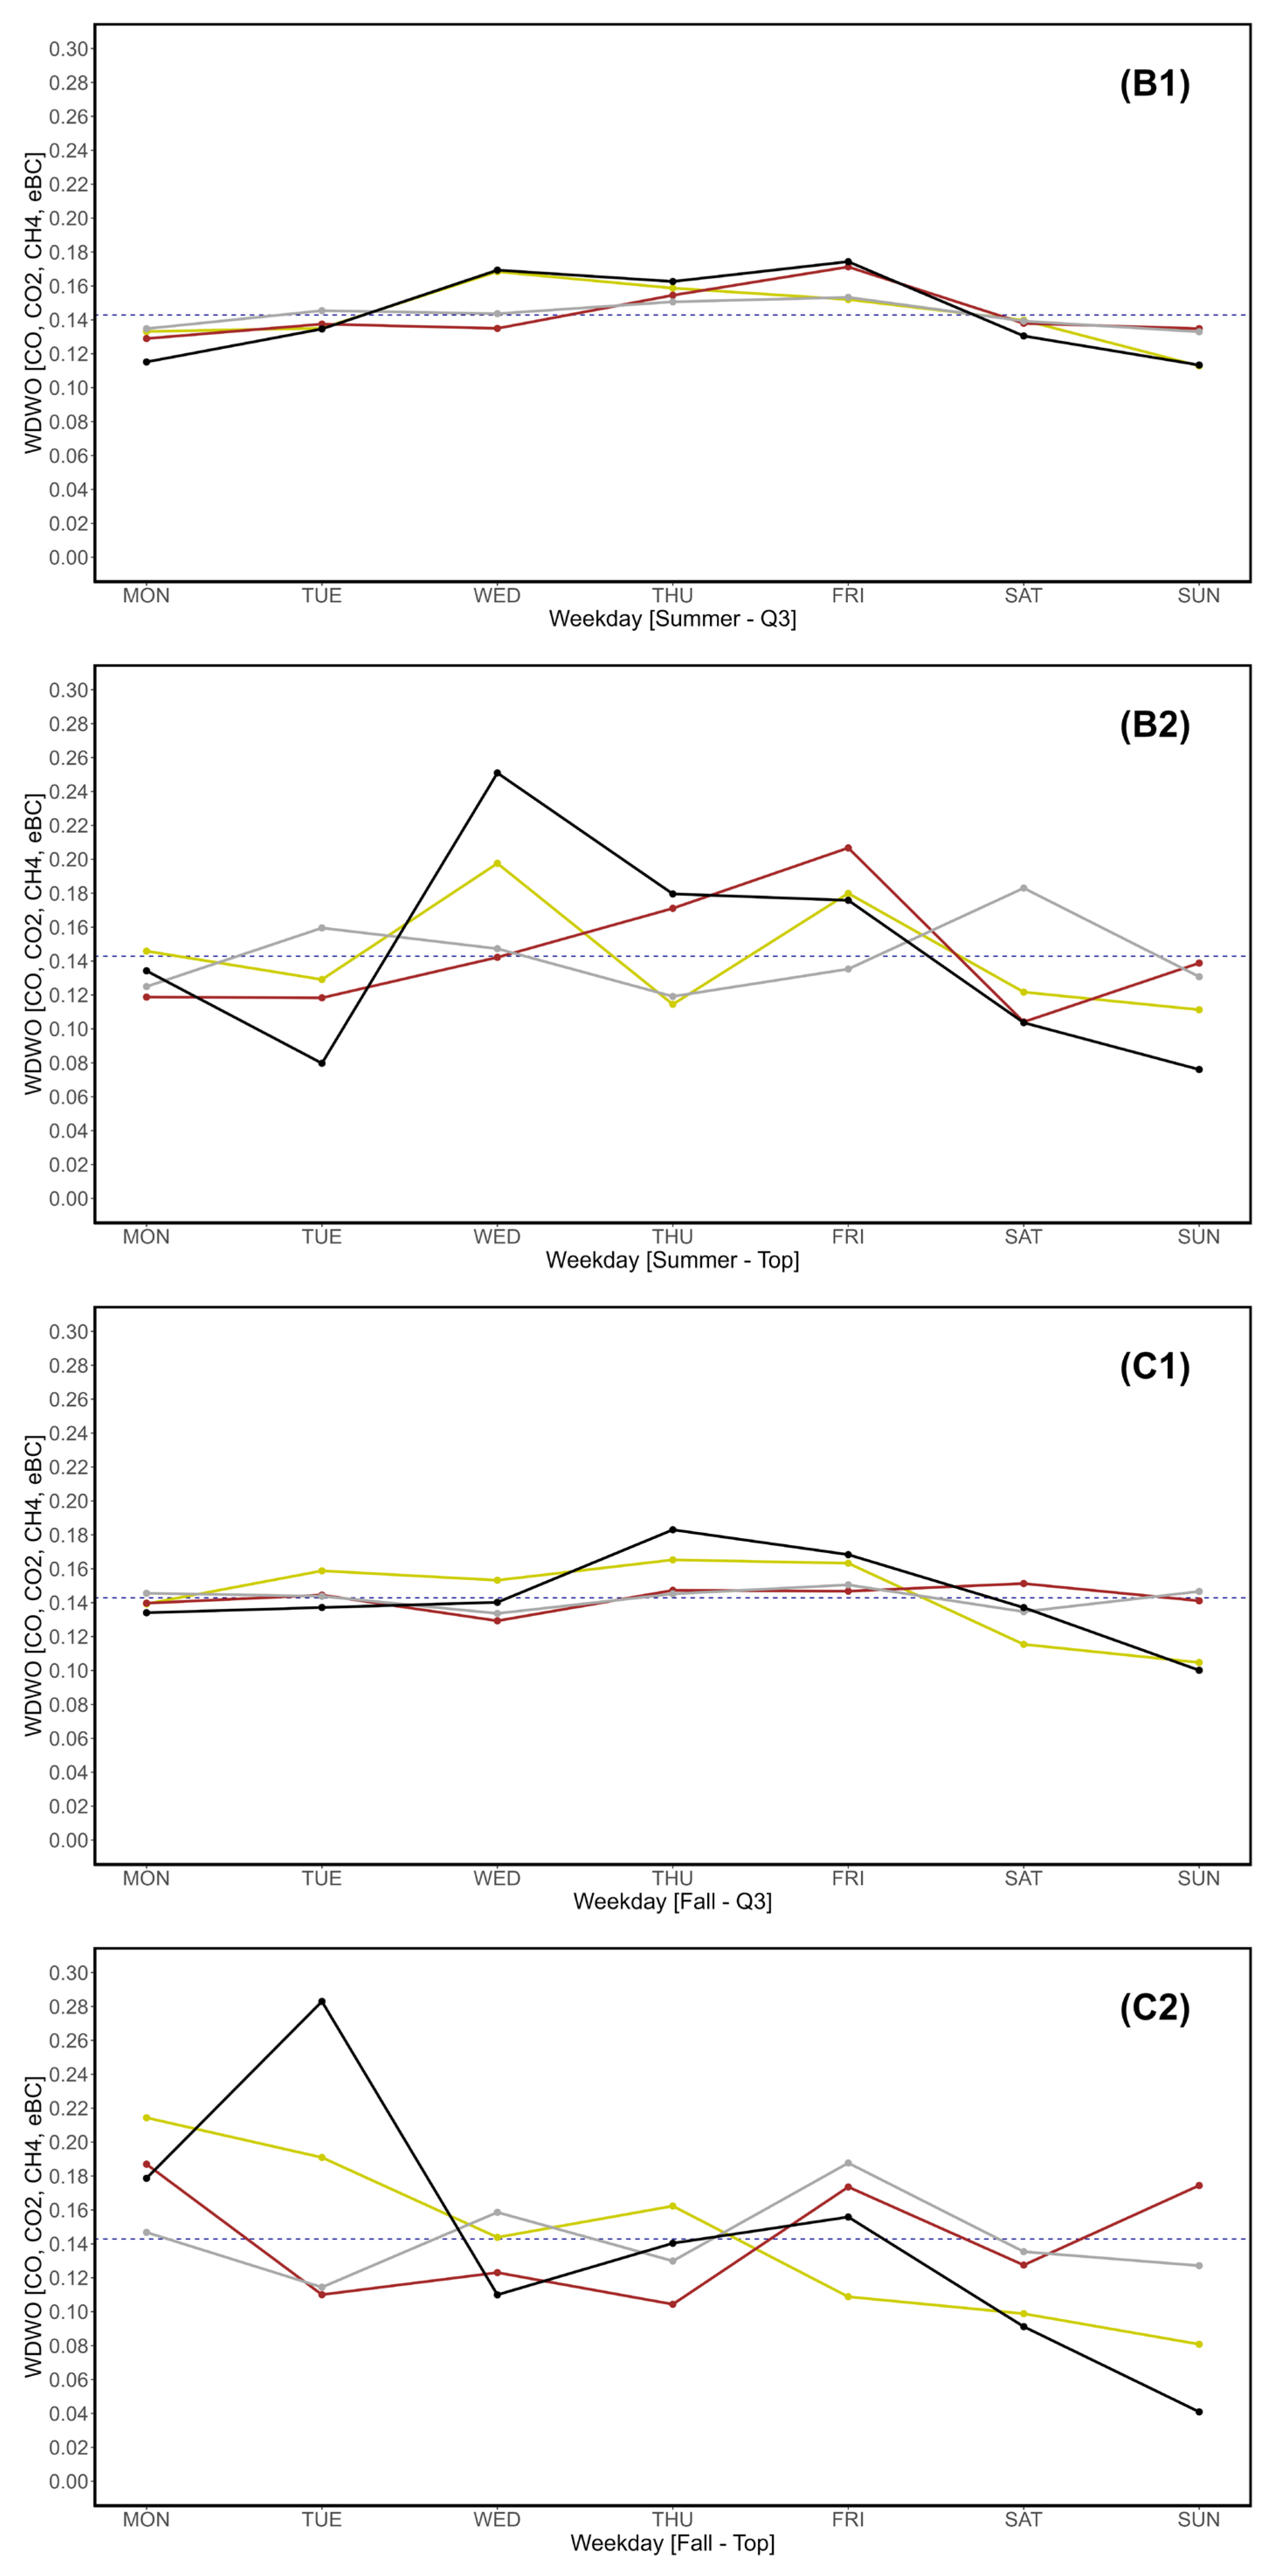
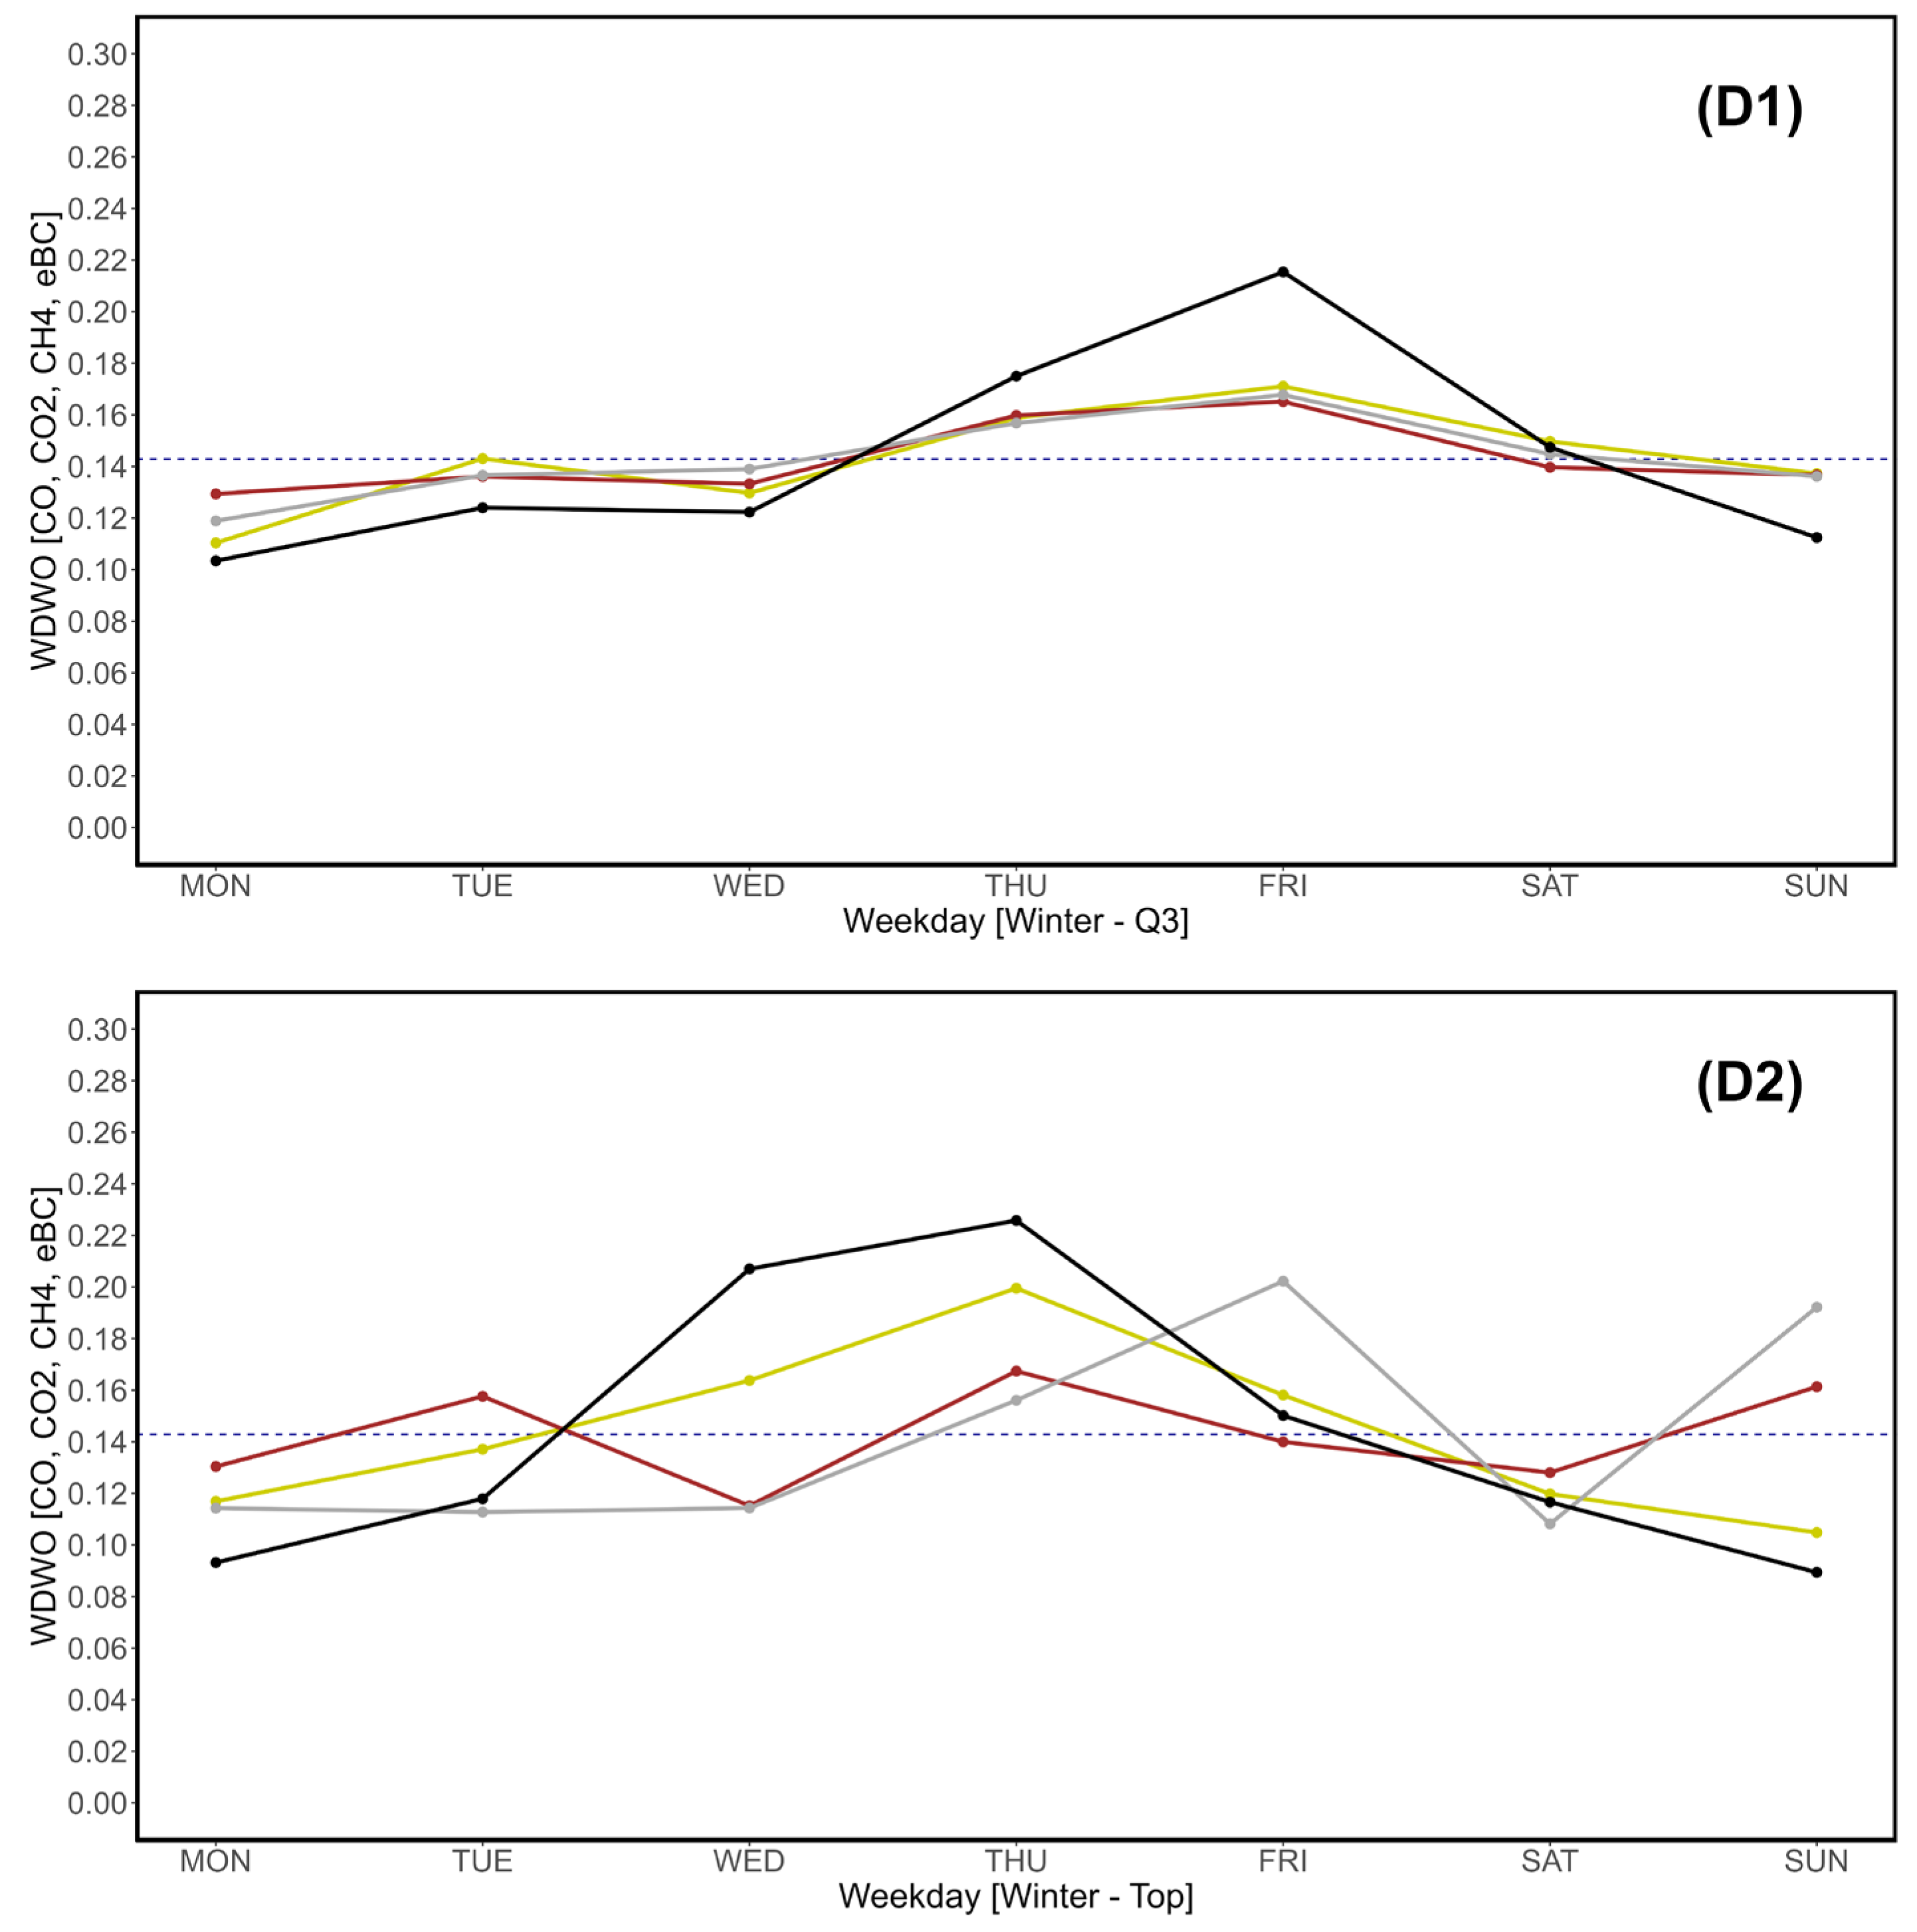
Table 8 and Fig. 11 show the seasonal variations of WDWO. Supplementary Material S3-A1 through S3-G8 cover each year using different vertical scales due to the presence of extremely high peaks (up to >0.7, with the average expected value per weekday being 0.1428). In Table 8 the standard deviations and ranges of each WDWO parameter are also shown, as indicators of WDWO variability: eBC yields the highest values in Fall, Summer and Winter; CH4 has the highest variability in Spring; CO2 and CH4 both have low variability in Fall; CO yields the lowest range value in Fall, though other values are intermediate; Spring and Summer variability of CO2 is also intermediate.

3.5. WD/WN Ratios Applied to WDWO

A final assessment using the newly introduced WDWO parameter was performed over the entire observation period, on a seasonal basis, by calculating the ratio between WDWO(WD), for “weekday”, and WDWO(WN), for “weekend”. Specifically, the ratio is calculated by dividing MON-FRI averages by their SAT-SUN counterparts. Please note that in this specific circumstance the terms weekday (MON-FRI) and weekend (SAT-SUN) retain their usual meaning. In fact, WD/WN will in fact be used to avoid confusion. The results are plotted in Table 9 for both categories (Q3 and top 2.5% interval).
Fall is characterized by two opposite values: a CO top interval surge in 2022 of 23.73, and a null eBC top interval value in the same year. Without considering these outliers, eBC top interval values are generally the highest throughout the entire list, especially during Winter, while CH4 yields generally low ratios, especially during the Summer season. CO is affected by major fluctuations, especially during Fall and Spring.

4. Discussion

For the first time in the operational history of Lamezia Terme (LMT), carbon monoxide (CO – ppb), carbon dioxide (CO2 – ppm), methane (CH4 – ppb) and black carbon (eBC – μg/m3) hourly aggregated values have been analyzed on a weekly basis to verify the influence of anthropic activities on detected concentrations, under the assumption that no natural phenomenon – unlike anthropic activities, which do have differences throughout the course of a week – can result into a weekly cycle.
The analysis of cumulative concentrations of all observed parameters throughout the entire observation period (2016-2022), did not yield relevant results with the exception of eBC, as evidenced in Table 2 and Fig. 2D. In fact, the Q3 threshold of Sunday is only 83,78% of its Friday’s counterpart; with respect to the top 2.5% interval, Sunday’s value is only 81,37% of the maximum peak observed on Thursday. Speaking of CO2 and CH4, both Table 2 and Fig. 2B, 2C indicate fluctuating weekly trends with no tangible gap between two particular weekdays. In the case of CO, the lowest observed top interval value (Monday) is 92,10% of the peak observed on Thursday.
These fluctuations and the lack of a well-defined weekly trend – except for eBC – led to a further investigation on seasonal variations, as performed in the monoparameter analyses from D’Amico et al. (2024a) [55]. Among anthropic activities, those of industrial, commuting, and agricultural nature may indeed lead to different peaks and trends on a seasonal basis, which reflect different activity levels over a standard calendar year. In addition to actual differences in terms of emission rates throughout the week, chemical reactions in the atmosphere are also responsible for changes in the concentrations of pollutants [20-21-22-23-24]. Moreso, it is known in literature that rainfall and other natural phenomena have an impact on mobility and other anthropic activities [78], but these impacts are also assumed in this research to be equally spread between weekdays. Wildfires, which locally result into high eBC and CO concentrations up to the point where they can both be used as effective tracers of these events, are typical of Mediterranean summer seasons [45]. During the other seasons, especially winter, CO for instance is assumed to derive from combustion engine emissions [38-42] which may show a weekly cycle based on commuting, domestic heating, and transportation, unlike the summertime wildfire counterparts.
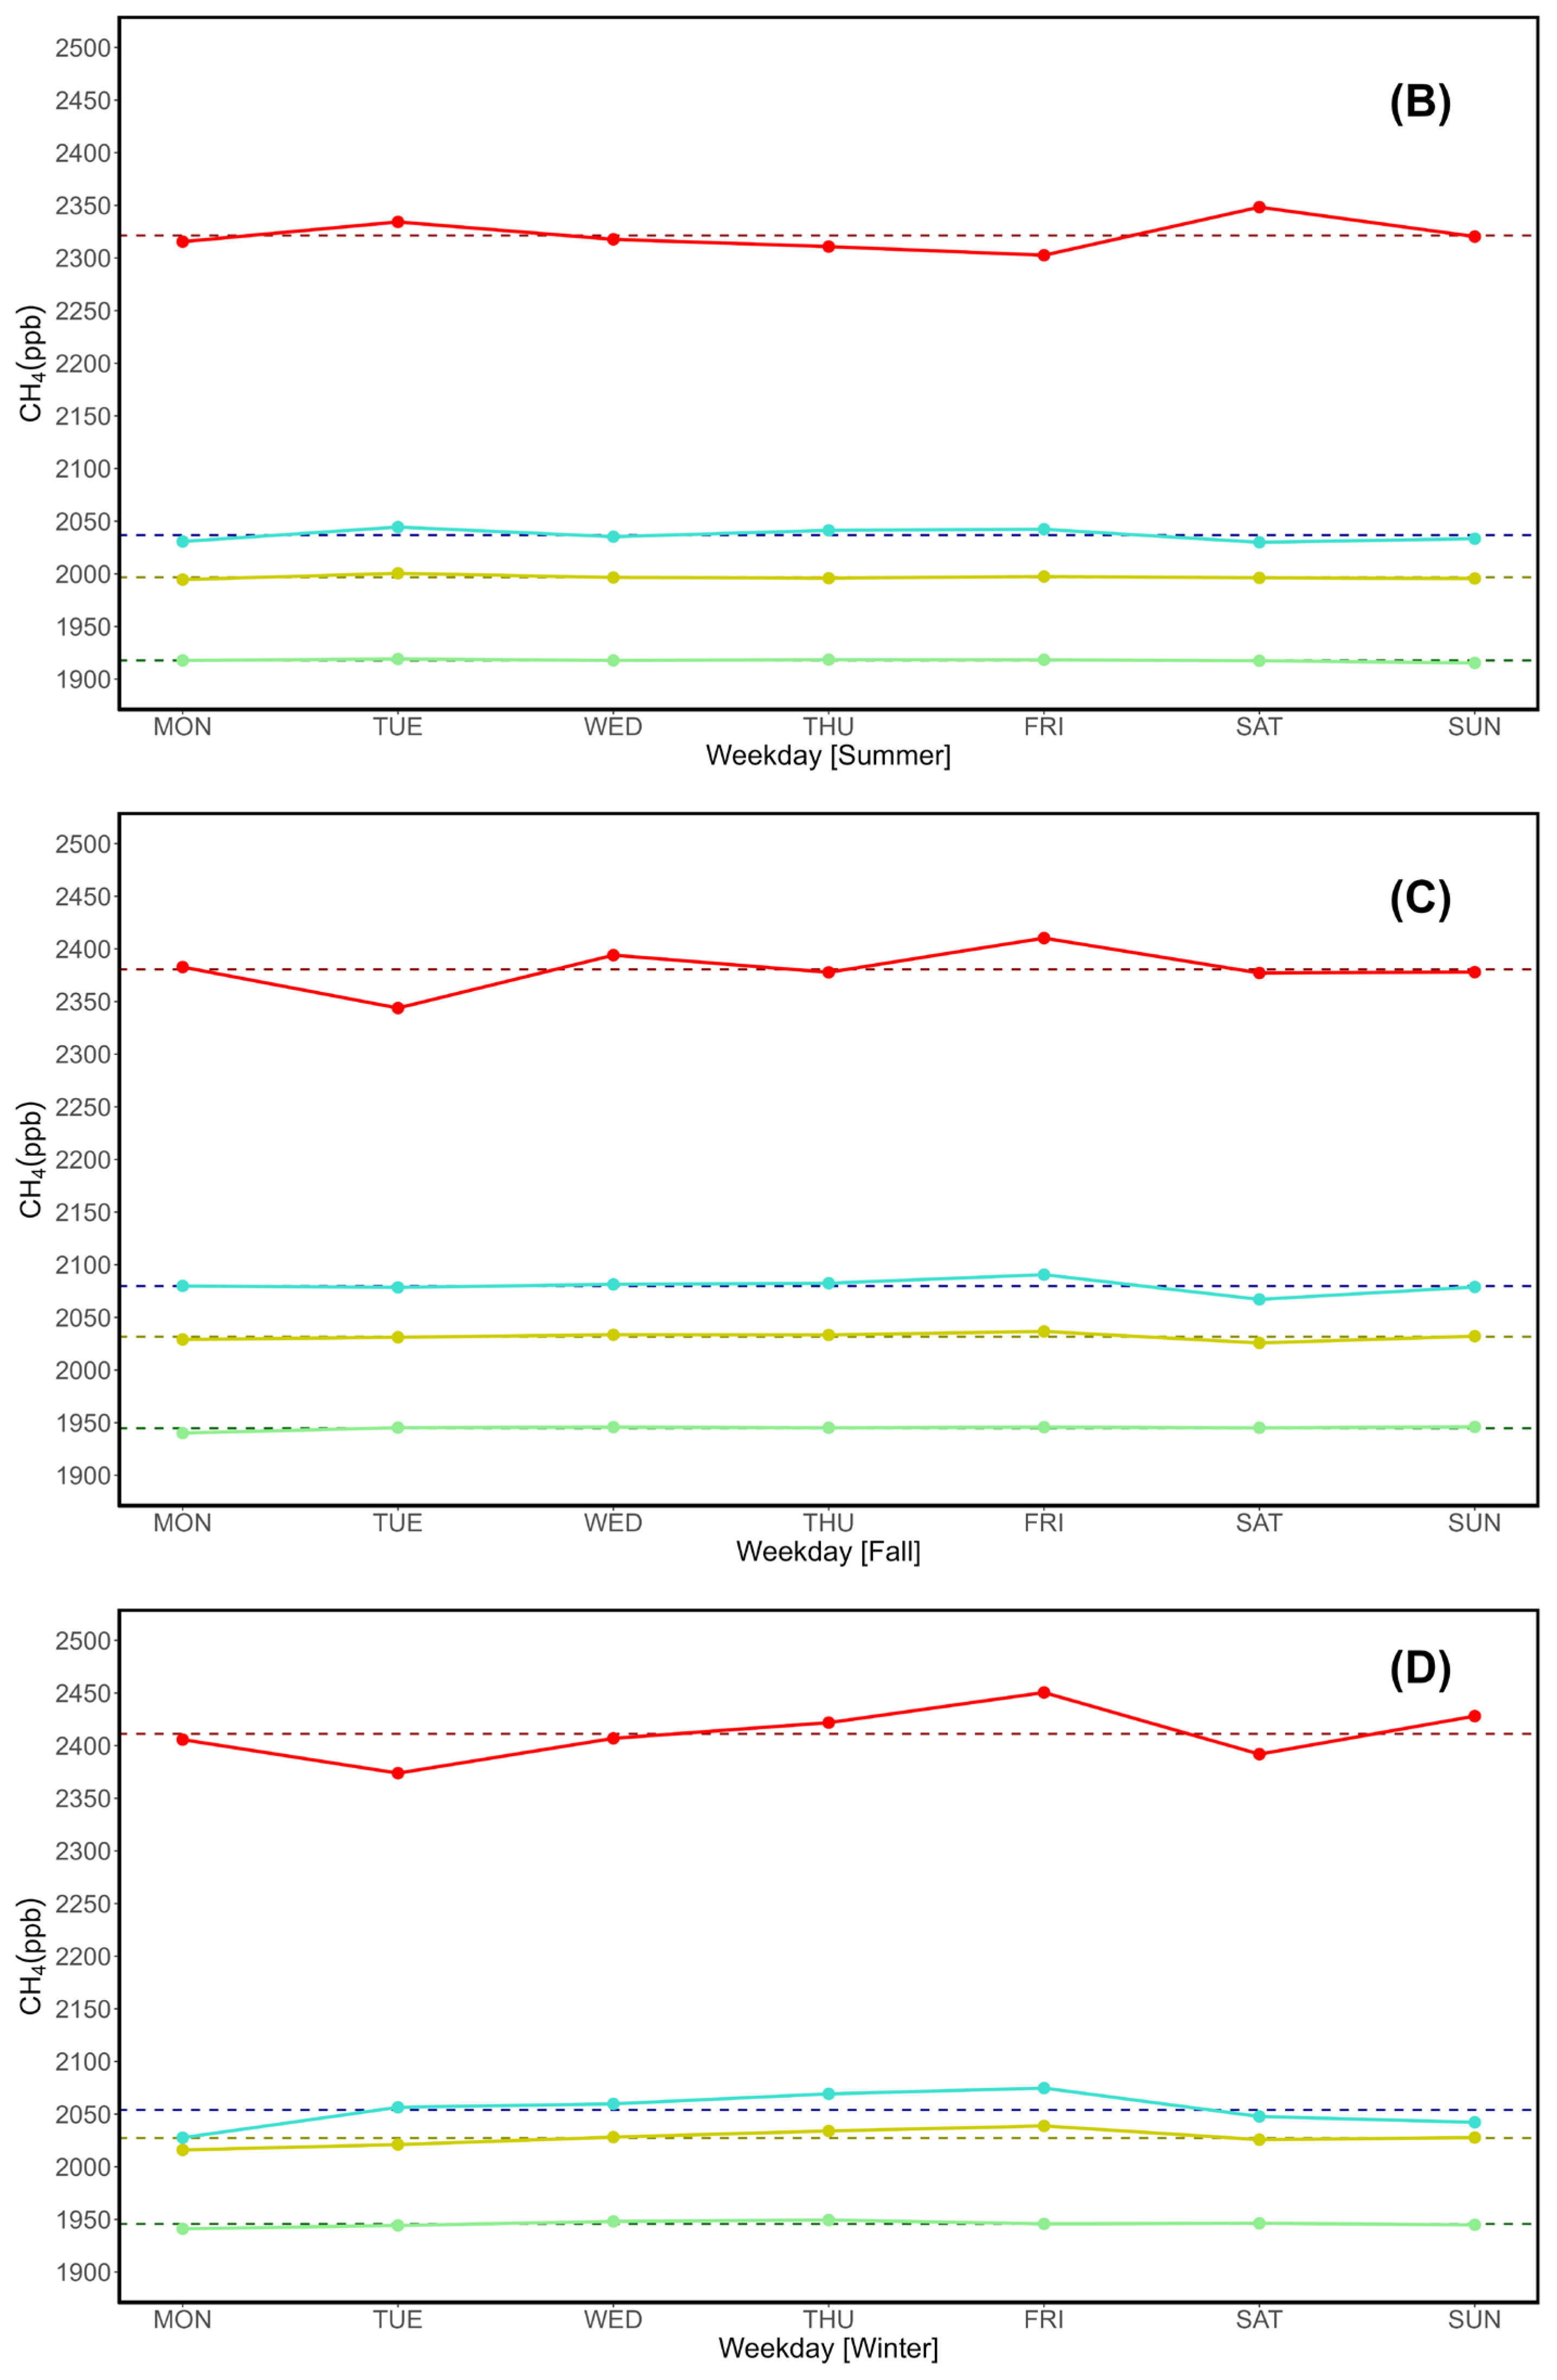
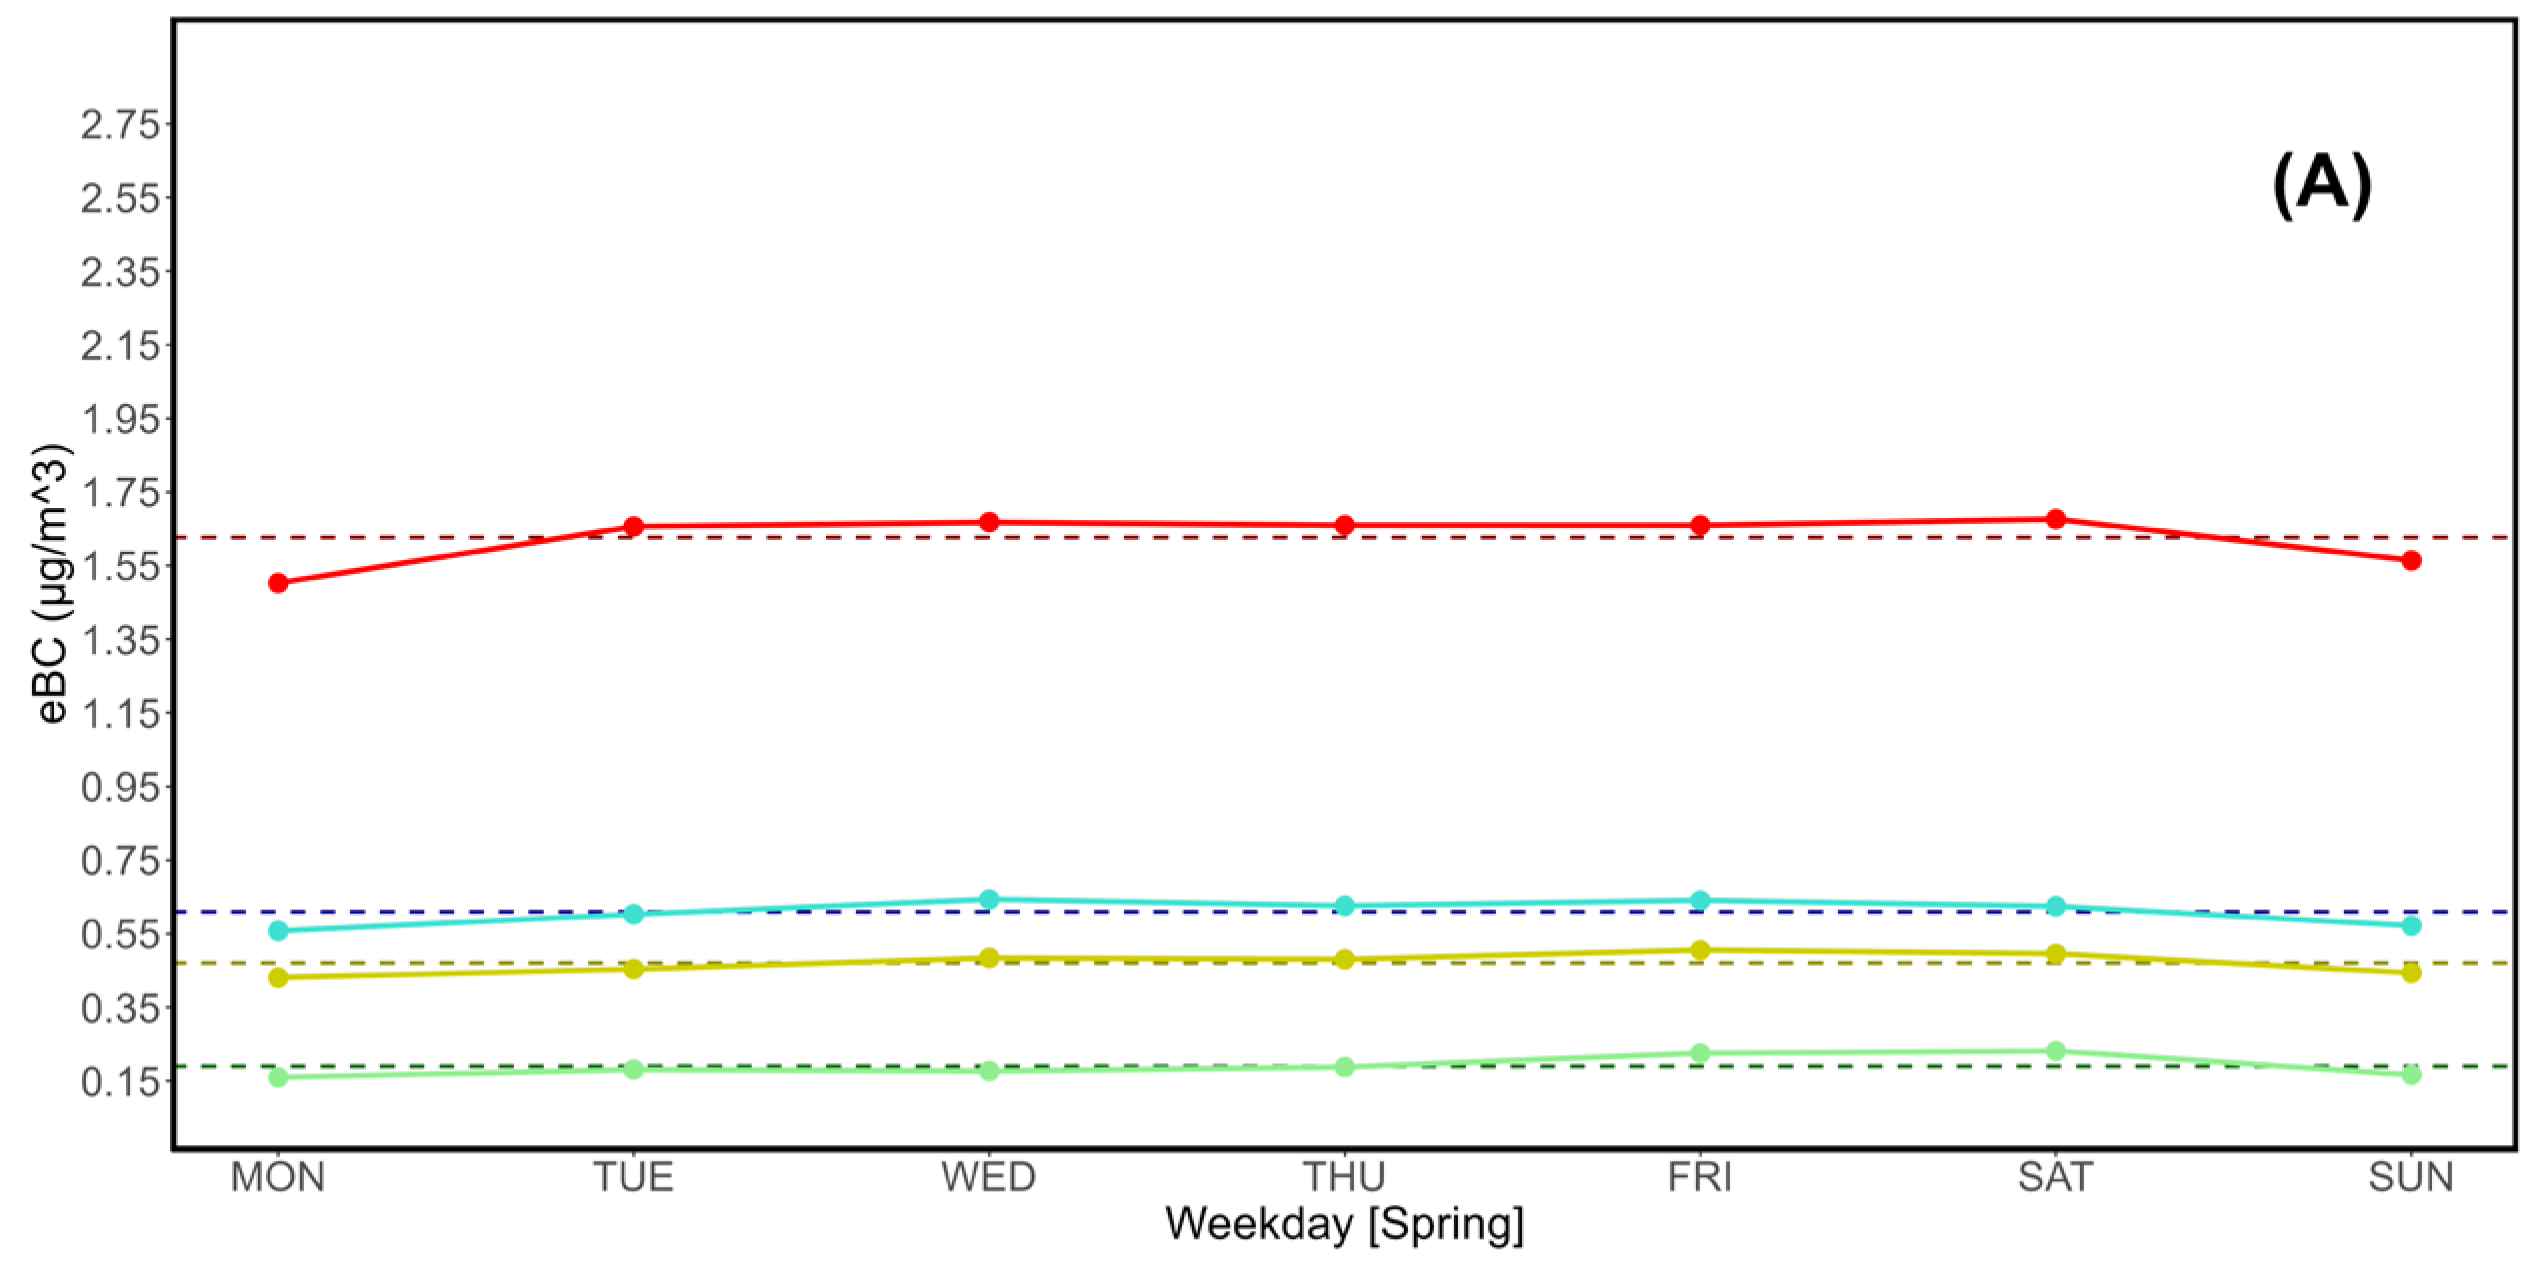
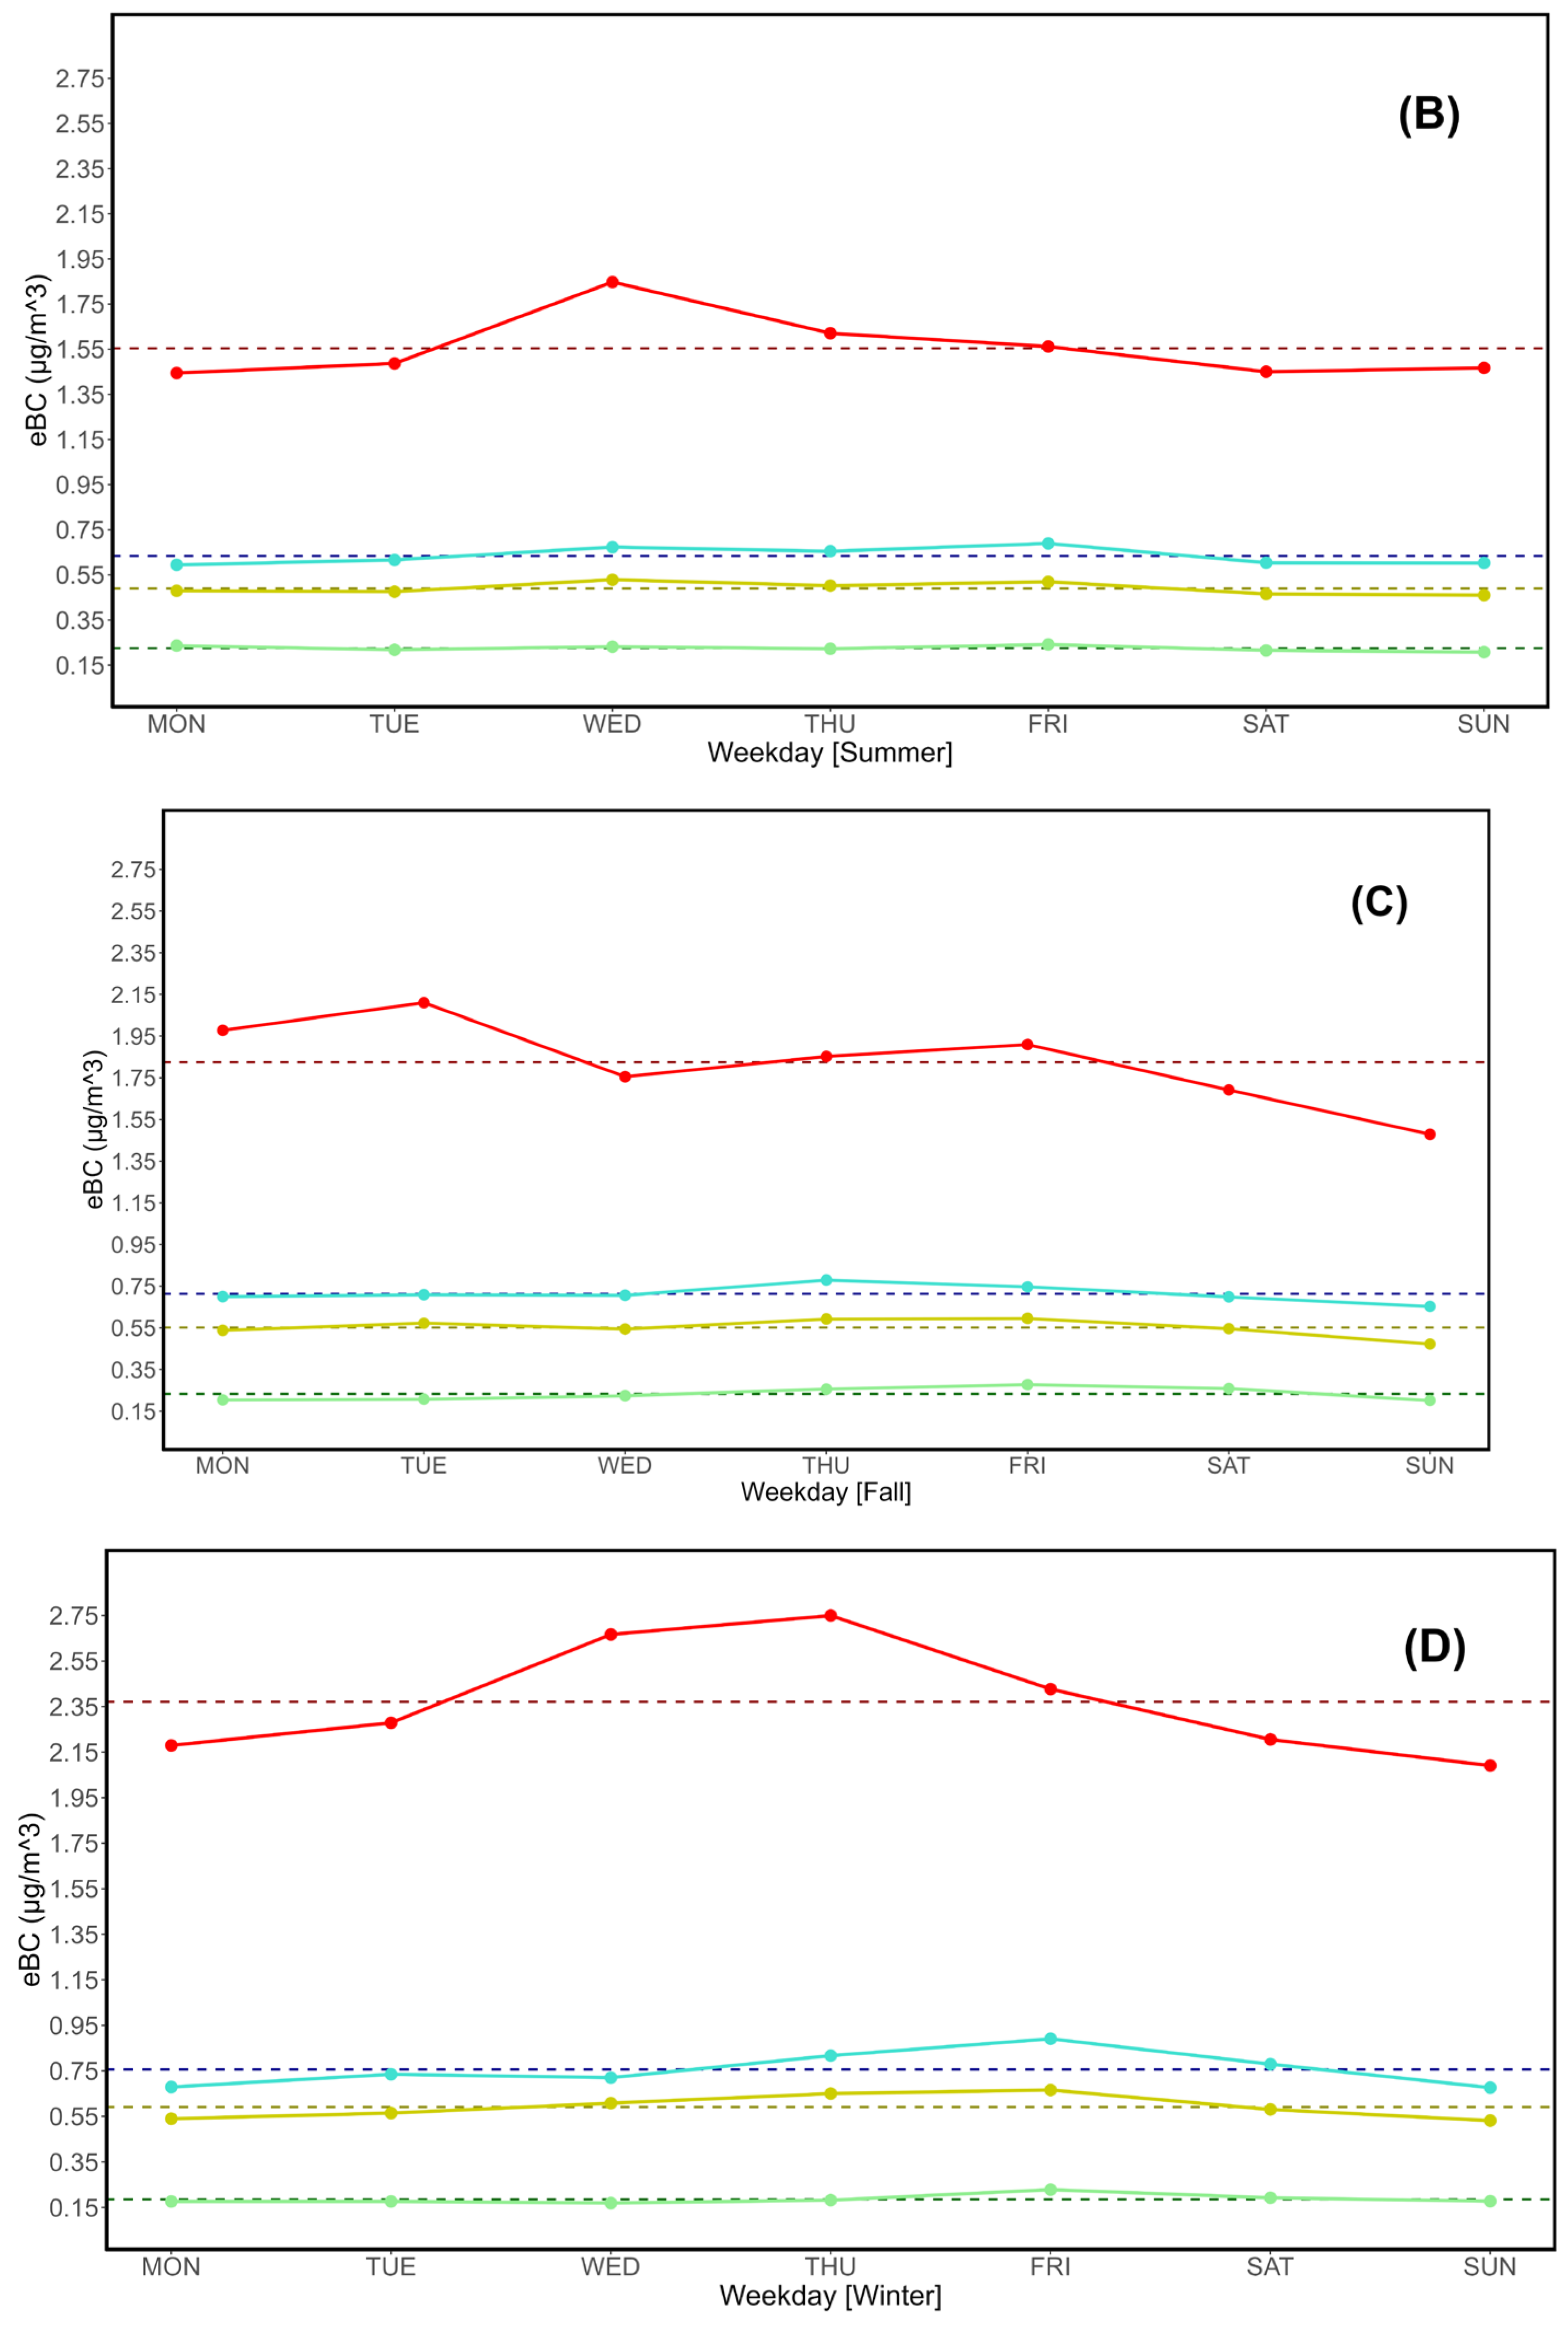
Seasonal variations seen in Table 3, Table 4, Table 5 and Table 6 and Fig. 3-6 go in the direction of demonstrating the existence of seasonal variations in weekly trends that would not otherwise be noticeable in pure yearly analyses. CO shows, with respect to most seasons, a top interval Wednesday peak whose origin requires further investigation (Fig. 3A, B, D). CO2 retains the Wednesday top interval anomaly in two out of four seasons (Fig. 4A, C) and shows a flat pattern in Winter (Fig. 4D). The Summer season (Fig. 4C) also shows a peculiar statistical occurrence, with average CO2 concentrations on Monday and Sunday being higher than Q3 mole fractions. With respect to CH4, a “Wednesday anomaly” is present for the Spring season (Fig. 5A), while Fall (Fig. 5C) and Winter (Fig. 5D) point to Friday as the weekday with the highest observed peaks. The last parameter, eBC, yields broader differences between weekdays on a per-season basis: in addition to another “Wednesday anomaly” in Summer (Fig. 6B), there is a generally low value on Sundays, which in the case of Winter is only 76% of the peak observed for Thursday (Fig. 6D). In Fall, Sunday’s value is only 70,14% compared to the observed Tuesday peak (Fig. 6C). A ≈30% gap in a season is considerable, especially if compared to the flat pattern seen during Spring (Fig. 6A).
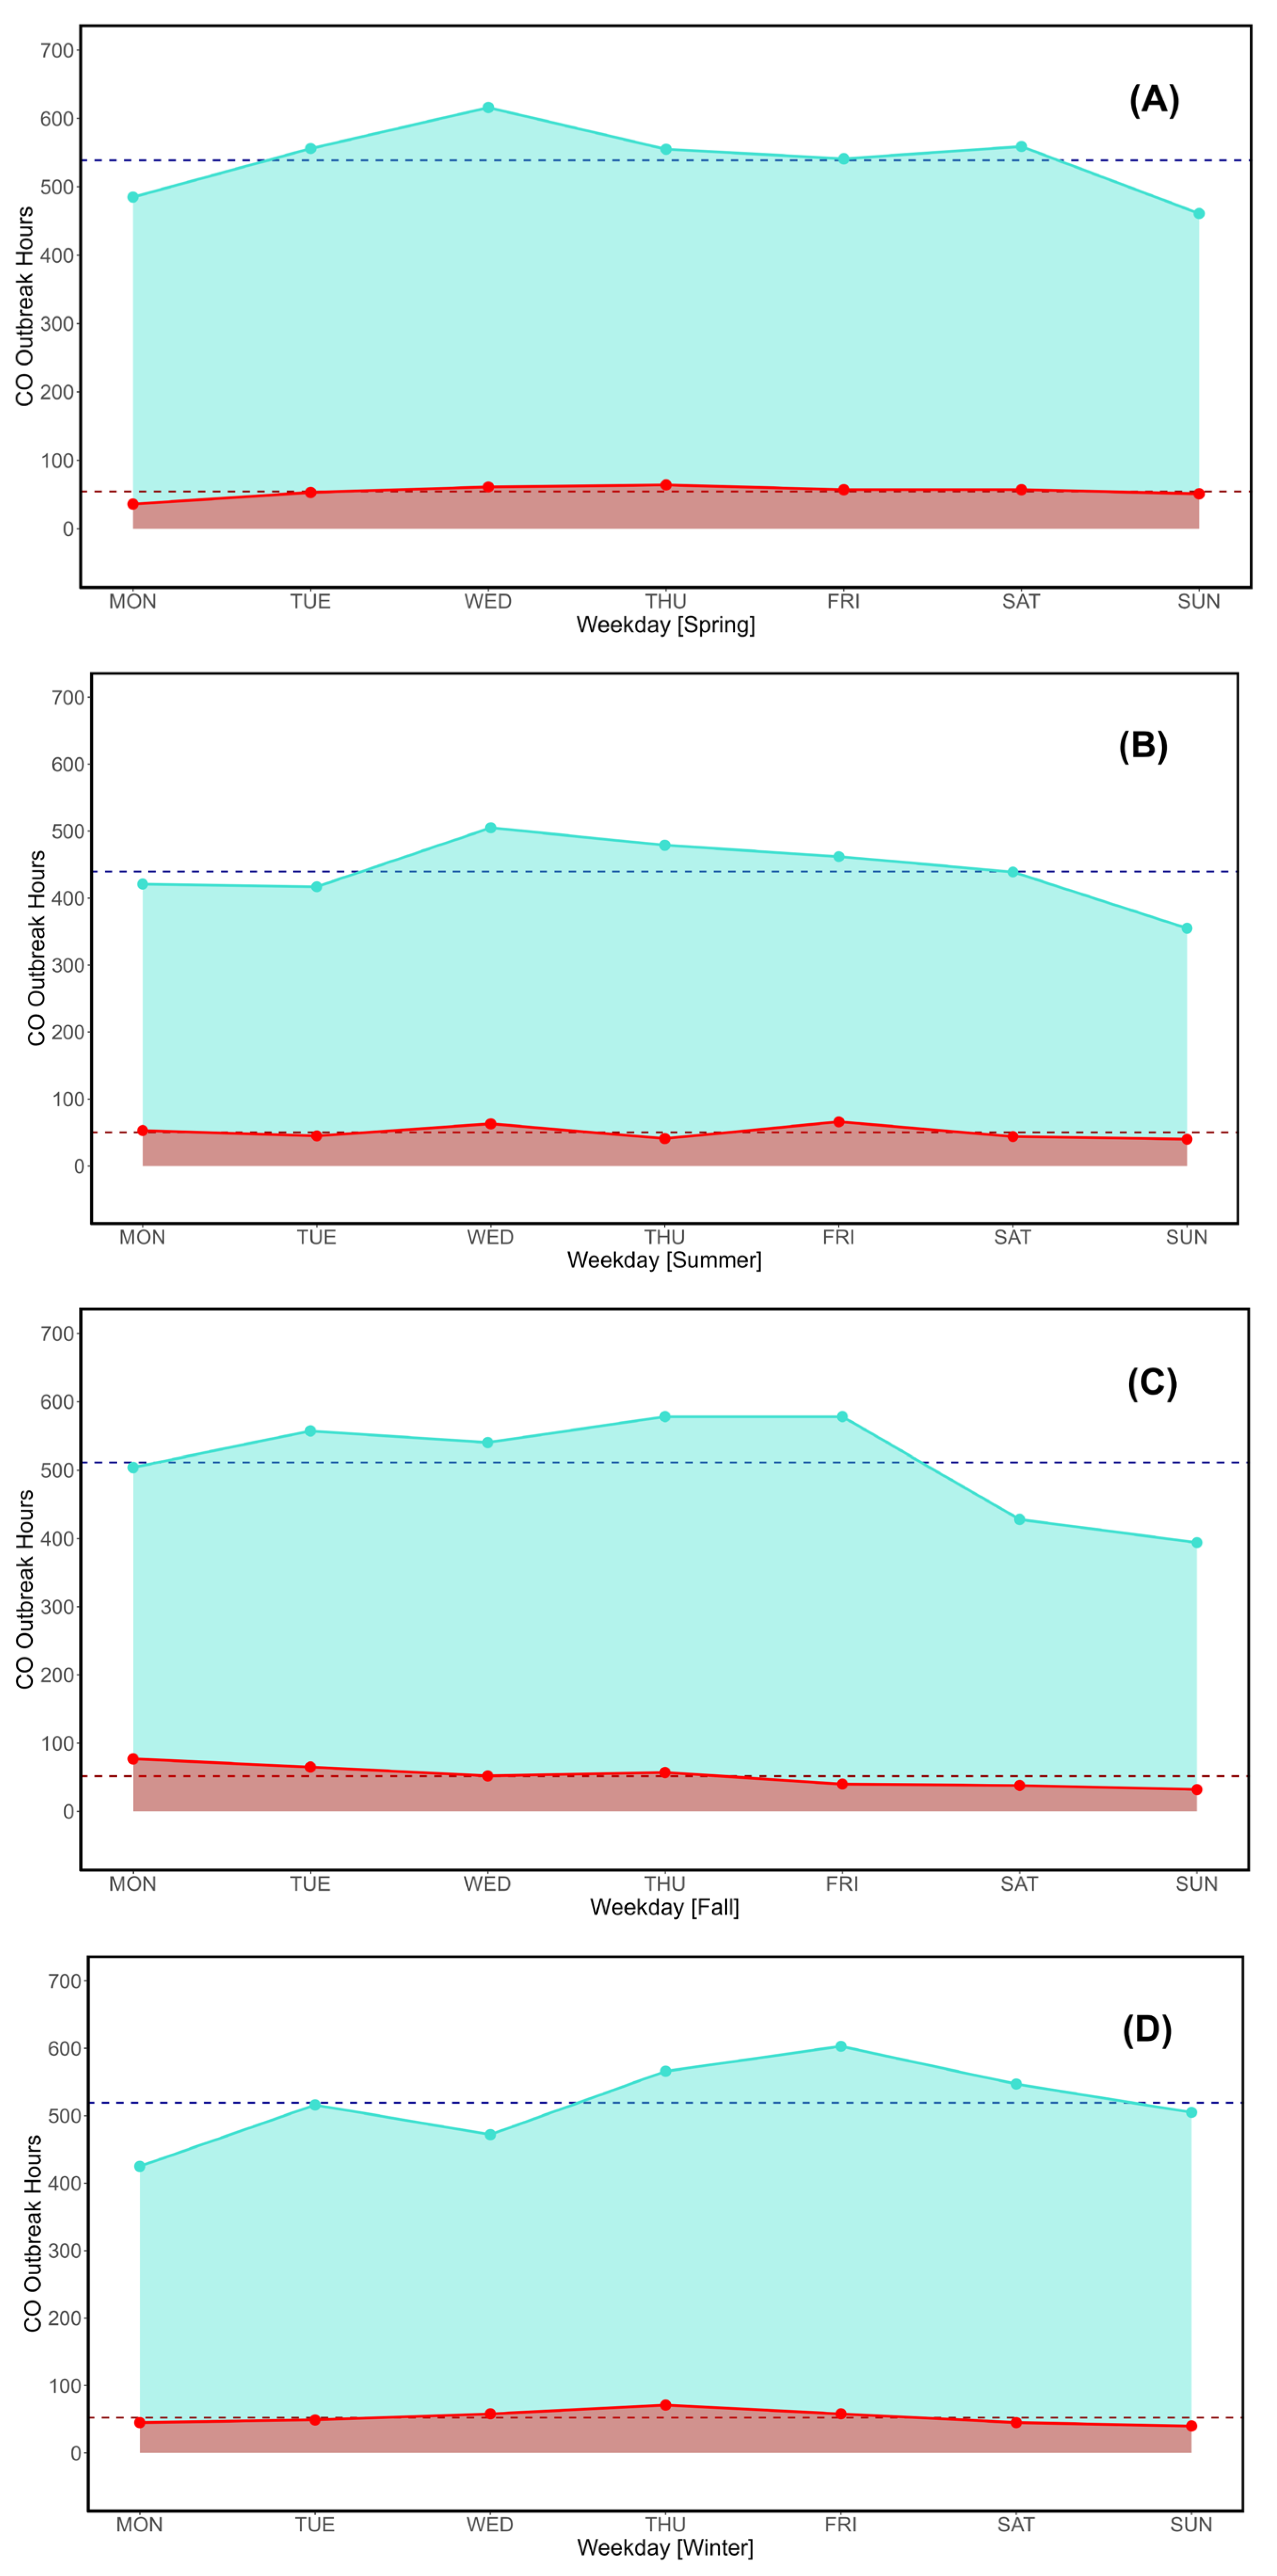
The analysis, following the findings seen in D’Amico et al. (2024a) [55], also considered the number (intended as frequency) of hourly outbreak events. Compared to the previous research, and considering the findings of this study, the analysis was aimed directly at seasonal variations. Table 7 shows, in addition to statistical data on outbreak hours divided by category (Q3 and top 2.5% interval), that 40% of the lowest outbreak hour counts occur on Sundays, which is approximately three times the expected frequency of a random distribution between weekdays (14.28%). With respect to each parameter, hourly frequency values can provide an insight into anthropogenic emissions and anthropic activities as the main drivers of observed differences between weekdays. In the case of CO, constant low frequencies on Sunday are observed throughout all seasons (Fig. 7A, B, C) except for Winter (Fig. 7D). In Fall, a very low value - though not as low as Sunday's - is also linked to Saturday (Fig. 7C). Considering CO’s nature as a frequent byproduct of combustion, lower values on Sunday may be attributable to reduced anthropic activities. Winter’s positive anomaly may be due to domestic heating, and Fall’s low value observed on Saturday may in fact corroborate this hypothesis: though anthropic activities may be reduced compared to the rest of the week (Monday-Thursday), home heating is less frequently used on Fall compared to Winter due to a difference in daily temperatures, which may provide a tangible explanation for the two distinct patterns.
CO2 once again points to a “Wednesday anomaly” in Spring (Fig. 8A), which at present does not have a clear explanation and may have to be further analyzed in the future. It’s also worth noting that Fall (Fig. 8C) has a flat pattern, while Summer (Fig. 8B) and Winter (Fig. 8D) have Thursday and Friday peaks. Considering CO2’s nature as a prominent byproduct of fossil fuel burning, Winter peaks may be attributable to commuting and the peak of other anthropic activities during that season. In the case of Summer, commuting may be at least partially replaced by tourism-related activities and transport, though proper source apportionment needs to be performed in the future to test this hypothesis. Summer is also affected by wildfire-related emissions, but they are presently assumed to be spread randomly through the week.
CH4 provides yet another example of “Wednesday anomaly”, which is noticeable during the Spring season (Fig. 9A). A generally flat pattern is overall reported, except for Winter (Fig. 9D), which has a sharp Friday peak. Though the Friday peak is consistent with anthropic activities, the general flatness of CH4 hourly outbreak events points to emission sources not being particularly affected by weekdays. This may be due to livestock and landfill emissions, if assumed to be constant throughout a week, though this can only be verified with detailed source apportionment. In this case, carbon isotope fractionation may help discriminating methane sources (livestock, burning, fossil fuel).
Just like in the previous evaluation accounting for concentration thresholds, eBC is once again showing major weekly fluctuations, this time in outbreak occurrences. In fact, Monday and Sunday are yield constantly the lowest frequency values, while Fall (Fig. 10C) and Winter (Fig. 10D) show relevant Thursday-Friday peaks, with the Friday peak in Winter being considerably higher than the lowest values seen in that season (Monday and Sunday). This is the most considerable difference (38%) between two weekdays among all observed parameters.
Two branches of this research (absolute concentrations and frequencies of hourly outbreak events) have been combined into the newly introduced WDWO (Weighed Distribution of Weekly Outbreaks). This parameter is meant to integrate other assessment methods of weekly anthropic activities [79], such as the WCA (Weekly Cycle Anomaly) and Weekly Cycle Anomaly Percentage (WCAP) proposed by He (2023) [80].
Via a normalized scale, WDWO has allowed to evaluate both results of this research using values conveniently falling in the 0-1 range, which allow direct comparisons between different parameters. For comparison, the WCA/WCAP method mentioned above has potentially high fluctuations, and strong negative values are also possible. In the case of WDWO, the entire assessment is constrained in a 0-1 scale, so standard comparison criteria and plots can be used for all parameters, regardless of the time scale involved. In literature, weekly cycle assessments generally do not use normalized/percentage scales and tend to focus on absolute concentrations [26,27,28,29,30,31,32,33,34,35,36,37,38,39,40,41,42,43,44,45,46,47,48,49,50,51,52,53,54,55,56,57,58,59,60,61,62,63,64,65,66,67,68,69,70,71,72,73,74,75,76,77,78,79,80,81,82,83,84,85,86,87], instead of the combination of concentrations and frequencies discussed in this work.
In the case of LMT in Calabria, all factors involved in the analysis, the introduction of WDWO has allowed to highlight a number of peculiar patterns: the so defined “Wednesday anomaly” is indeed a prominent factor in Spring (Fig. 11A1), with a particularly high peak in CH4’s top interval category (Fig. 11A2). Winter WDWO values also show a clear weekly cycle (Fig. 11D1).
Most parameters yield lower WDWO values on Monday and Sunday (Fig. 11A1, A2, B1, B2, D1). Wednesday through Friday (especially Thursday-Friday) yield the highest WDWO values most of the time. These results help corroborating the hypothesis by which a weekly cycle of multiple parameters does indeed exist at LMT and is deemed anthropogenic in origin. Besides the graphical values and their results, the WDWO values themselves have been evaluated via their standard deviations and ranges (Max-Min) to provide new indicators of variability. The results of this evaluation, shown in Table 8, further prove eBC’s higher degrees of variability over weekdays, which make it the parameter more subject to weekly cycles. This finding is in accordance with a previous study on eBC at LMT [66] and further expands the knowledge on observation site-specific weekly variability of eBC. CH4 yields low variability in WDWO, further demonstrating that its weekly cycle is likely controlled by a constant emission output, perhaps attributable with livestock farming, landfills and other local sources; this is also in accordance with previous studies on the concept of LMT as a “multisource” observation site [69-55]. CO and CO2 have both yielded intermediate variability indicators, with those of CO2 being generally the lowest between the two. CO’s values in particular tend to indicate a weekly variability that seems consistent with anthropic control, likely linked to activities such as combustion processes. This is consistent with other studies that attribute CO oscillations to anthropic activities, especially in the context of megacities [88]. In fact, CO WDWO variability decreases during the Summer, when the wildfire-related combustion outputs – assumed to be equally distributed between weekdays, unlike anthropic-driven outputs in other season such as Winter – become prominent. Additional remarks are possible thanks to the calculated WD/WN (MON-FRI/SAT-SUN) ratios of WDWO, as reported in Table 9. These ratios consolidate eBC’s leading role in terms of general variability especially with respect to the top 2.5% interval observed during Winter; CH4’s limited variability is also highlighted by WD/WN ratios, further corroborating the hypothesis by which local natural/anthropic sources of this compound do not have a proper weekly cycle. CO is affected by major fluctuations that drop considerably during the Summer, a pattern that is consistent with summertime wildfires being equally spread during the week, while other seasons are more effected by anthropic-driven weekly cycles in the use of combustion engines. CO2 does not yield high variability, especially during Fall; this apparent divergence with the other anthropogenic parameters could be explained by changes in the rates of photosynthesis that occur during the week, as research has shown many correlations between the concentrations of several pollutants, their weekly cycles, and CO2 uptake by plants [89]. Photosynthesis in the atmosphere leads to a characteristic isotopic fingerprint in CO2 [90]; future research at LMT could potentially observe weekly trends in isotopic fractionation that could provide evidence of a weekly cycle in photosynthesis rates.

5. Conclusions

For the first time in its observation history, data gathered at the WMO/GAW station of Lamezia Terme (LMT) in Calabria, Southern Italy have been evaluated using the weekly cycle as a possible indicator of anthropic emission outputs, under the assumption that such cycles do not exist in natural processes. This research considered the key statistical data of CO (ppb), CO2 (ppm), CH4 (ppb), and eBC (μg /m3), specifically the third quartiles and the top 2.5% intervals, both in terms of absolute concentrations of each observed parameter and in terms of frequency of outbreaks in hourly data. Preliminary analysis has demonstrated that seasonal patterns need to be considered. Several evaluations have found a so defined “Wednesday anomaly”, a positive anomaly which does not currently have an explanation and requires future studies to be adequately assessed.
Frequency analyses showed that Sunday yielded the lowest values 40% of the time, a figure that is approximately three times greater than the average of value 14.28% assumed for a random distribution. Black carbon (eBC) is the most affected parameter.
The new WDWO (Weighed Distribution of Weekly Outbreaks) method, which is hereby introduced as an evaluation tool for both researchers and policy makers, combined frequency and concentration data into percentages on an absolute scale in order to allow comparisons between all parameters regardless of their nature.
WDWO further corroborated the hypothesis by which weekly cycles in anthropic activities exist at LMT and influence the data gathered by the WMO/GAW regional observation site. Each parameter has been demonstrated to have characteristic WDWO values on a seasonal basis, though eBC shows very high variability indicators regardless of the season. CO, as a common byproduct of combustion processes, does generally show a weekly cycle, though its WDWO values during the Summer season seem compatible with a wildfire-related emission output that is equally spread between weekdays. CO2 shows the lowest WDWO variability in Winter under all categories, a circumstance that could be attributable to weekly changes in photosynthesis rates driven by changes in the concentrations of other parameters. CH4 was found to have generally low variability, attributable to sources – both anthropogenic and natural – that are not subject to weekly patterns. These sources will require further investigation, possibly relying on new instruments and atmospheric tracers.
Future works accounting for carbon isotope fractionation in CO2 and CH4, may discriminate anthropogenic and natural sources, then further expand the knowledge on the weekly characterization of emission outputs at LMT. This may prove useful especially in the effort of providing local regulators with data that may help defining new laws aimed at sustainable policies and the consequent mitigation of emission peaks. Generally speaking, the methodology proposed in this paper could be applied on a global scale in fields such as environmental monitoring, policy making, and emission reduction in densely populated areas.

Supplementary Materials

The following supporting information can be downloaded at the website of this paper posted on Preprints.org. for reviewing purposes, see the dedicated file].

Author Contributions

Conceptualization, F.D. and C.R.C.; methodology, F.D., C.R.C. and T.L.F.; software, F.D.; validation, C.R.C., T.L.F. and P.C.; formal analysis, F.D.; investigation, F.D.; data curation, F.D., I.A., D.G., E.A., T.L.F., P.C., L.M., D.P., S.S. and G.D.B.; writing—original draft preparation, F.D.; writing—review and editing, F.D., CR.C., I.A., D.G., E.A., T.L.F., M.D.P., P.C., L.M., D.P., S.S. and G.D.B.; visualization, F.D., C.R.C., D.G. and T.L.F.; supervision, C.R.C. and P.C.; funding acquisition, C.R.C. and M.D.P. All authors have read and agreed to the published version of the manuscript.

Funding

This research was funded by AIR0000032 – ITINERIS, the Italian Integrated Environmental Research Infrastructures System (D.D. n. 130/2022 - CUP B53C22002150006) under the EU - Next Generation EU PNRR - Mission 4 “Education and Research” - Component 2: “From research to business” - Investment 3.1: “Fund for the realization of an integrated system of research and innovation infrastructures”.

Data Availability Statement

The datasets presented in this article are not readily available because they are part of other ongoing studies.

Acknowledgments

The authors would like to thank the editorial board for their support and assistance. They would also like to thank the three anonymous reviewers who contributed to expand and improve the manuscript.

Conflicts of Interest

The authors declare no conflicts of interest.

References

  1. Hossain, M.R.; Singh, S.; Sharma, G.D.; Apostu, S.A.; Bansal, P. Overcoming the shock of energy depletion for energy policy? Tracing the missing link between energy depletion, renewable energy development and decarbonization in the USA. Energy Policy 2023, 174, 113469. [Google Scholar] [CrossRef]
  2. Akram, R.; Ai, F.; Srivastava, M.; Sharma, R. Considering natural gas rents, mineral rents, mineral depletion, and natural resources depletion as new determinants of sustainable development. Resour. Policy 2024, 96, 105200. [Google Scholar] [CrossRef]
  3. Wei, F.; Han, J.; Xu, W. Exploring the nexus between structural capital, carbon neutrality and sustainable competitiveness: Evidence from natural resource exploitation in the post-COVID-19 era. Resour. Policy 2024, 88, 104392. [Google Scholar] [CrossRef]
  4. Xu, L.; Tang, S. Sustainable development: Maximizing productivity in natural resource markets for a more ecologically friendly future. Resour. Policy 2024, 89, 104580. [Google Scholar] [CrossRef]
  5. Alsaleh, M.; Abdul-Rahim, A.; Abdulwakil, M.M. The importance of worldwide governance indicators for transitions toward sustainable bioenergy industry. J. Environ. Manage. 2021, 294, 112960. [Google Scholar] [CrossRef]
  6. Abbass, K.; Qasim, M.Z.; Song, H.; Murshed, M.; Mahmood, H.; Younis, I. A review of the global climate change impacts, adaptation, and sustainable mitigation measures. Environ. Sci. Pollut. Res. 2022, 29, 42539–42559. [Google Scholar] [CrossRef]
  7. Mont, O.; Lehner, M.; Dalhammar, C. Sustainable consumption through policy intervention—A review of research themes. Front. Sustain. 2022, 3, 921477. [Google Scholar] [CrossRef]
  8. Tu, C.; Liang, Y.; Fu, Y. How does the environmental attention of local governments affect regional green development? Empirical evidence from local governments in China. Humanit. Soc. Sci. Commun. 2024, 11, 371. [Google Scholar] [CrossRef]
  9. Zazzeri, G.; Graven, H.; Xu, X.; Saboya, E.; Blyth, L.; Manning, A.J.; Chawner, H.; Wu, D.; Hammer, S. Radiocarbon Measurements Reveal Underestimated Fossil CH4 and CO2 Emissions in London. Geophys. Res. Lett. 2023, 50(15), e2023GL103834. [Google Scholar] [CrossRef]
  10. Siciliano, T.; De Donno, A.; Serio, F.; Genga, A. Source Apportionment of PM10 as a Tool for Environmental Sustainability in Three School Districts of Lecce (Apulia). Sustainability 2024, 16(5), 1978. [Google Scholar] [CrossRef]
  11. Nisbet, E.G.; Fisher, R.E.; Lowry, D.; France, J.L.; Allen, G.; Bakkaloglu, S.; Broderick, T.J.; Cain, M.; Coleman, M.; Fernandez, J.; Forster, G.; Griffiths, P.T.; Iverach, C.P.; Kelly, B.F.J.; Manning, M.R.; Nisbet-Jones, P.B.R.; Pyle, J.A.; Townsend-Small, A.; al-Shalaan, A.; Warwick, N.; Zazzeri, G. Methane Mitigation: Methods to Reduce Emissions, on the Path to the Paris Agreement. Rev. Geophys. 2020, 58(1), e2019RG000675. [Google Scholar] [CrossRef]
  12. Ducruet, C.; Polo Martin, B.; Sene, M.A.; Lo Prete, M.; Sun, L.; Itoh, H.; Pigné, Y. Ports and their influence on local air pollution and public health: A global analysis. Sci. Total Environ. 2024, 915, 170099. [Google Scholar] [CrossRef] [PubMed]
  13. Dlugokencky, E.J.; Nisbet, E.G.; Fisher, R.; Lowry, D. Global atmospheric methane: budget, changes and dangers. Philos. T. Roy. Soc. A 2011, 369, 2058–2072. [Google Scholar] [CrossRef]
  14. Nisbet, E.G.; Dlugokencky, E.J.; Manning, M.R.; Lowry, D.; Fisher, R.E.; France, J.L.; Michel, S.E.; Miller, J.B.; White, J.W.C.; Vaughn, B.; Bousquet, P.; Pyle, J.A.; Warwick, N.J.; Cain, M.; Brownlow, R.; Zazzeri, G.; Lanoisellé, M.; Manning, A.C.; Gloor, E.; Worthy, D.E.J.; Brunke, E.-G.; Labuschagne, C.; Wolff, E.W.; Ganesan, A.L. Rising atmospheric methane: 2007–2014 growth and isotopic shift. Global Biogeochem. Cy. 2016, 30, 1356–1370. [Google Scholar] [CrossRef]
  15. Nisbet, E.G.; Manning, M.R.; Dlugokencky, E.J.; Fisher, R.E.; Lowry, D.; Michel, S.E.; Myhre, C.L.; Platt, S.M.; Allen, G.; Bousquet, P.; Brownlow, R.; Cain, M.; France, J.L.; Hermansen, O.; Hossaini, R.; Jones, A.E.; Levin, I.; Manning, A.C.; Myhre, G.; Pyle, J.A.; Vaughn, B.H.; Warwick, N.J.; White, J.W.C. Very Strong Atmospheric Methane Growth in the 4 Years 2014–2017: Implications for the Paris Agreement. Global Biogeochem. Cy. 2019, 33, 318–342. [Google Scholar] [CrossRef]
  16. Thunis, P.; Clappier, A.; Pirovano, G.; Riffault, V.; Gilardoni, S. Source apportionment to support air quality management practices, A fitness-for-purpose guide (V 4.0), Publications Office of the European Union 2022. [CrossRef]
  17. Zhao, F.; Zeng, N. Continued increase in atmospheric CO2 seasonal amplitude in the 21st century projected by the CMIP5 Earth system models. Earth Syst. Dynam. 2014, 5, 423–439. [Google Scholar] [CrossRef]
  18. Dowd, E.; Wilson, C.; Chipperfield, M.P.; Gloor, E.; Manning, A.; Doherty, R. Decreasing seasonal cycle amplitude of methane in the northern high latitudes being driven by lower-latitude changes in emissions and transport. Atmos. Chem. Phys. 2023, 23(13), 7363–7382. [Google Scholar] [CrossRef]
  19. Balthasar, N.; Ohnmacht, T.; Z’Rotz, J.; Hostettler Macias, L.; Rérat, P. The effects of teleworking on CO2 emissions from commuting: baselining key data to investigate transformative change in living labs. Consumption and Society 2024, 20, 1–23. [Google Scholar] [CrossRef]
  20. Cleveland, W.S.; Graedel, T.E.; Kleiner, B.; Warner, J.L. Sunday and Workday Variations in Photochemical Air Pollutants in New Jersey and New York. Science 1974, 186, 1037–1038. [Google Scholar] [CrossRef]
  21. Elkus, B.; Wilson, K.R. Photochemical air pollution: Weekend-weekday differences. Atmos. Environ. 1977, 11(6), 509–515. [Google Scholar] [CrossRef]
  22. Karl, T.R. Day of the week variations of photochemical pollutants in the St. Louis area. Atmos. Environ. 1978, 12(8), 1657–1667. [Google Scholar] [CrossRef]
  23. Hernández-Paniagua, I.Y.; Lopez-Farias, R.; Piña-Mondragón, J.J.; Pichardo-Corpus, J.A.; Delgadillo-Ruiz, O.; Flores-Torres, A.; García-Reynoso, A.; Ruiz-Suárez, L.G.; Mendoza, A. Increasing Weekend Effect in Ground-Level O3 in Metropolitan Areas of Mexico during 1988–2016. Sustainability 2018, 10, 3330. [Google Scholar] [CrossRef]
  24. Lebron, F. A comparison of weekend–weekday ozone and hydrocarbon concentrations in the Baltimore-Washington metropolitan area. Atmos. Environ. 1975, 9(9), 861–863. [Google Scholar] [CrossRef]
  25. Qin, Y.; Tonnesen, G.S.; Wang, Z. Weekend/weekday differences of ozone, NOx, Co, VOCs, PM10 and the light scatter during ozone season in southern California. Atmos. Environ. 2004, 38(1), 3069–3087. [Google Scholar] [CrossRef]
  26. Elansky, N.F.; Shilkin, A.V.; Ponomarev, N.A.; Semutnikova, E.G.; Zakharova. Weekly patterns and weekend effects of air pollution in the Moscow megacity. Atmos. Environ. 2020, 224, 117303. [Google Scholar] [CrossRef]
  27. Wang, H.; Gong, F.-Y.; Newman, S.; Zeng, Z.-C. Consistent weekly cycles of atmospheric NO2, CO, and CO2 in a North American megacity from ground-based, mountaintop, and satellite measurements. Atmos. Environ. 2022, 268, 118809. [Google Scholar] [CrossRef]
  28. Carvalho, V.S.B.; Freitas, E.D.; Martins, L.D.; Martins, J.A.; Mazzoli, C.R.; de Fátima Andrade, M. Air quality status and trends over the Metropolitan Area of São Paulo, Brazil as a result of emission control policies. Environ. Sci. Pol. 2015, 47, 68–79. [Google Scholar] [CrossRef]
  29. Rivera, N.M. Air quality warnings and temporary driving bans: Evidence from air pollution, car trips, and mass-transit ridership in Santiago. J. of Environ. Econ. Manag. 2021, 108, 102454. [Google Scholar] [CrossRef]
  30. Akintomide Ajayi, S.; Anum Adam, C.; Dumedah, G.; Adebanji, A.; Ackaah, W. The impact of traffic mobility measures on vehicle emissions for heterogeneous traffic in Lagos City. Sci. Afr. 2023, 21, e01822. [Google Scholar] [CrossRef]
  31. Wilson, D. Quantifying and comparing fuel-cycle greenhouse-gas emissions: Coal, oil and natural gas consumption. Energy Policy 1990, 18(6), 550–562. [Google Scholar] [CrossRef]
  32. Scheraga, J.D.; Leary, N.A. Improving the efficiency of policies to reduce CO2 emissions. Energy Policy 1992, 20(5), 394–404. [Google Scholar] [CrossRef]
  33. Smith, I.M. CO2 and climatic change: An overview of the science. Energy Convers. Manag. [CrossRef]
  34. Foote, E. Circumstances Affecting the Heat of the Sun's Rays. Am. J. Sci. Arts. 1856, 22(66), 382–383. [Google Scholar]
  35. Bolin, B.; Eriksson, E. Changes in the carbon dioxide content of the atmosphere and sea due to fossil fuel combustion. Rossby Memorial Vol. 1959, 130–146. [Google Scholar]
  36. Danny Harvey, L.D. A guide to global warming potentials (GWPs). Energy Policy 1993, 21(1), 24–34. [Google Scholar] [CrossRef]
  37. Keeling, C.D.; Whorf, T.P.; Wahlen, M.; van der Plichtt, J. Interannual extremes in the rate of rise of atmospheric carbon dioxide since 1980. Nature 1995, 375, 666–670. [Google Scholar] [CrossRef]
  38. Edwards, D.P.; Emmons, L.K.; Hauglustaine, D.A.; Chu, D.A.; Gille, J.C.; Kaufman, Y.J.; Pétron, G.; Yurganov, L.N.; Giglio, L.; Deeter, M.N.; Yudin, V.; Ziskin, D.C.; Warner, J.; Lamarque, J.-F.; Francis, G.L.; Ho, S.P.; Mao, D.; Chen, J.; Grechko, E.I.; Drummond, J.R. Observations of carbon monoxide and aerosols from the Terra satellite: Northern Hemisphere variability. J. Geophys. Res. Atmospheres. [CrossRef]
  39. Marenco, A. Variations of CO and O3 in the troposphere: Evidence of O3 photochemistry. Atmos. Environ. 1986, 20(5), 911–918. [Google Scholar] [CrossRef]
  40. Prather, M.J. Lifetimes and time scales in atmospheric chemistry. Phil. Trans. R. Soc. A. 1856. [Google Scholar] [CrossRef]
  41. Khalil, M.A.K.; Rasmussen, R.A. Carbon Monoxide in the Earth's Atmosphere: Increasing Trend. Science, /: 54-56. https, 4644. [Google Scholar]
  42. Zheng, B.; Chevallier, F.; Ciais, P.; Yin, Y.; Deeter, M.N.; Worden, H.M.; Wang, Y.; Zhang, Q.; He, K. Rapid decline in carbon monoxide emissions and export from East Asia between years 2005 and 2016. Environ. Res. Lett. 2018, 13(4), 044007. [Google Scholar] [CrossRef]
  43. Buchholz, R.R.; Worden, H.M.; Park, M.; Francis, G.; Deeter, M.N.; Edwards, D.P.; Emmons, L.K.; Gaubert, B.; Gille, J.; Martínez-Alonso, S.; Tang, W.; Kumar, R.; Drummond, J.R.; Clerbaux, C.; George, M.; Coheur, P.-F.; Hurtmans, D.; Bowman, K.W.; Luo, M.; Payne, V.H.; Worden, J.R.; Chin, M.; Levy, R.C.; Warner, J.; Wei, Z.; Kulawik, S.S. Air pollution trends measured from Terra: CO and AOD over industrial, fire-prone, and background regions. Remote Sens. Environ. 2021, 256, 112275. [Google Scholar] [CrossRef]
  44. Dennison, P.E.; Brewer, S.C.; Arnold, J.D.; Moritz, M.A. Large wildfire trends in the western United States, 1984–2011. Geophys. Res. Lett. 2928. [Google Scholar] [CrossRef]
  45. Malacaria, L.; Parise, D.; Lo Feudo, T.; Avolio, E.; Ammoscato, I.; Gullì, D.; Sinopoli, S.; Cristofanelli, P.; De Pino, M.; D’Amico, F.; Calidonna, C.R. Multiparameter detection of summer open fire emissions: the case study of GAW regional observatory of Lamezia Terme (Southern Italy). Fire 2024, 7(6), 198. [Google Scholar] [CrossRef]
  46. Myhre, G.; Shindell, D.; Bréon, F.M.; Collins, W.; Fuglestvedt, J.; Huang, J.; Koch, D.; Lamarque, J.F.; Lee, D.; Mendoza, B.; Nakajima, T.; Robock, A.; Stephens, G.; Takemura, T.; Zhan, H. Anthropogenic and Natural Radiative Forcing. In Climate Change 2013: The Physical Science Basis, Contribution of Working Group I to the Fifth Assessment Report of the Intergovernmental Panel on Climate Change. Cambridge, UK and New York, 2013.
  47. Saunois, M.; Stavert, A.R.; Poulter, B.; Bousquet, P.; Canadell, J.G.; Jackson, R.B.; Raymond, P.A.; Dlugokencky, E.J.; Houweling, S.; Patra, P.K.; Ciais, P.; Arora, V.K.; Bastviken, D.; Bergamaschi, P.; Blake, D.R.; Brailsford, G.; Bruhwiler, L.; Carlson, K.M.; Carrol, M.; Castaldi, S.; Chandra, N.; Crevoisier, C.; Crill, P.M.; Covey, K.; Curry, C.L.; Etiope, G.; Frankenberg, C.; Gedney, N.; Hegglin, M.I.; Höglund-Isaksson, L.; Hugelius, G.; Ishizawa, M.; Ito, A.; Janssens-Maenhout, G.; Jensen, K.M.; Joos, F.; Kleinen, T.; Krummel, P.B.; Langenfelds, R.L.; Laruelle, G.G.; Liu, L.; Machida, T.; Maksyutov, S.; McDonald, K.C.; McNorton, J.; Miller, P.A.; Melton, J.R.; Morino, I.; Müller, J.; Murguia-Flores, F.; Naik, V.; Niwa, Y.; Noce, S.; O’Doherty, S.; Parker, R.J.; Peng, C.; Peng, S.; Peters, G.P.; Prigent, C.; Prinn, R.; Ramonet, M.; Regnier, P.; Riley, W.J.; Rosentreter, J.A.; Segers, A.; Simpson, I.J.; Shi, H.; Smith, S.J.; Steele, L.P.; Thornton, B.F.; Tian, H.; Tohjima, Y.; Tubiello, F.N.; Tsuruta, A.; Viovy, N.; Voulgarakis, A.; Weber, T.S.; van Weele, M.; van der Werf, G.R.; Weiss, R.F.; Worthy, D.; Wunch, D.; Yin, Y.; Yoshida, Y.; Zhang, W.; Zhang, Z.; Zhao, Y.; Zheng, B.; Zhu, Q.; Zhu, Q.; Zhuang, Q. The Global Methane Budget 2000–2017. Earth Syst. Sci. Data 2020, 12, pgs–1561. [Google Scholar] [CrossRef]
  48. Szopa, S.; Naik, V.; Adhikary, B.; Artaxo, P.; Berntsen, T.; Collins, W.D.; Fuzzi, S.; Gallardo, L.; Kiendler-Scharr, A.; Klimont, Z.; Liao, H.; Unger, N.; Zanis, P. Short-Lived Climate Forcers. In: Climate Change 2021: The Physical Science Basis. Contribution of Working Group I to the Sixth Assessment Report of the Intergovernmental Panel on Climate Change, edited by: Masson-Delmotte, V., Zhai, P., Pirani, A., Connors, S.L., Péan, C., Berger, S., Caud, N., Chen,Y., Goldfarb, L., Gomis, M.I., Huang, M., Leitzell, K., Lonnoy, E., Matthews, J.B.R., Maycock, T.K., Waterfield, T., Yelekçi, O., Yu, R., and Zhou, B. Cambridge University Press, Cambridge, United Kingdom and New York, NY, USA, 2021, pgs. 817–922.
  49. Skeie, R.B.; Hodnebrog, Ø.; Myhre, G. Trends in atmospheric methane concentrations since 1990 were driven and modified by anthropogenic emissions. Commun. Earth Environ. 2023, 4, 317. [Google Scholar] [CrossRef]
  50. Chang, J.; Peng, S.; Ciais, P.; Saunois, M.; Dangal, S.R.S.; Herrero, M.; Havlík, P.; Tian, H.; Bousquet, P. Revisiting enteric methane emissions from domestic ruminants and their δ13CCH4 source signature. Nat. Commun. 2019, 10, 3420. [Google Scholar] [CrossRef] [PubMed]
  51. Beauchemin, K.A.; Kreuzer, M.; O’Mara, F.; McAllister, T.A. Nutritional management for enteric methane abatement: a review. Aust. J. Exp. Agric. [CrossRef]
  52. Herrero, M.; Henderson, B.; Havlík, P.; Thornton, P.K.; Conant, R.T.; Smith, P.; Wirsenius, S.; Hristov, A.N.; Gerber, P.; Gill, M.; Butterbach-Bahl, K.; Valin, H.; Garnett, T.; Stehfest, E. Greenhouse gas mitigation potentials in the livestock sector. Nat. Clim. Change. [CrossRef]
  53. Lee, D.S.; Fahey, D.; Forster, P.M.; Newton, P.J.; Wit, R.C.N.; Lim, L.L.; Owen, B.; Sausen, R. Aviation and global climate change in the 21st century. Atmos. Environ. 3520. [Google Scholar] [CrossRef]
  54. Lee, D.S.; Fahey, D.W.; Skowron, A.; Allen, M.R.; Burkhardt, U.; Chen, Q.; Doherty, S.J.; Freeman, S.; Forster, P.M.; Fuglestvedt, J.; Gettelman, A.; DeLeón, R.R.; Lim, L.L.; Lund, M.T.; Millar, R.J.; Owen, B.; Penner, J.E.; Pitari, G.; Prather, M.J.; Sausen, R.; Wilcox, L.J. The contribution of global aviation to anthropogenic climate forcing for 2000 to 2018. Atmos. Environ. 2021, 244, 117834. [Google Scholar] [CrossRef]
  55. D’Amico, F.; Ammoscato, I.; Gullì, D.; Lo Feudo, T.; De Pino, M.; Cristofanelli, P.; Malacaria, L.; Parise, D.; Sinopoli, S.; De Benedetto, G.; Calidonna, C.R. Integrated analysis of methane cycles and trends at the WMO/GAW station of Lamezia Terme (Calabria, Southern Italy), Atmosphere 2024, 15(8), 946. , 15(8),. [CrossRef]
  56. Clairotte, M.; Suarez-Bertoa, R.; Zardini, A.A.; Giechaskiel, B.; Pavlovic, J.; Valverde, V.; Ciuffo, B.; Astorga, C. Exhaust emission factors of greenhouse gases (GHGs) from European road vehicles. Environ. Sci. Eur. [CrossRef]
  57. Laughner, J.L.; Neu, J.L.; Schimel, D.; Wennberg, P.O.; Barsanti, K.; Bowman, K.W.; Chatterjee, A.; Croes, B.E.; Fitzmaurice, H.L.; Henze, D.K.; Kim, J.; Kort, E.A.; Liu, Z.; Miyazaki, K.; Turner, A.J.; Anenberg, S.; Avise, J.; Cao, H.; Crisp, D.; de Gouw, J.; Eldering, A.; Fyfe, J.C.; Goldberg, D.L.; Gurney, K. R.; Hasheminassab, S.; Hopkins, F.; Ivey, C.E.; Jones, D.B.A.; Liu, J.; Lovenduski, N.S.; Martin, R.V.; McKinley, G.A.; Ott, L.; Poulter, B.; Ru, M.; Sander, S.P.; Swart, N.; Yung, Y.L.; Zeng, Z.-C. Societal shifts due to COVID-19 reveal large-scale complexities and feedbacks between atmospheric chemistry and climate change. Proc. Natl. Acad. Sci. 2021, 118, e2109481118. [Google Scholar] [CrossRef]
  58. McNorton, J.; Bousserez, N.; Agustí-Panareda, A.; Balsamo, G.; Cantarello, L.; Engelen, R.; Huijnen, V.; Inness, A.; Kipling, Z.; Parrington, M.; Ribas, R. Quantification of methane emissions from hotspots and during COVID-19 using a global atmospheric inversion. Atmos. Chem. Phys. 5961. [Google Scholar] [CrossRef]
  59. Peng, S.; Lin, X.; Thompson, R.L.; Xi, Y.; Liu, G.; Hauglustaine, D.; Lan, X.; Poulter, B.; Ramonet, M.; Saunois, M.; Yin, Y.; Zhang, Z.; Zheng, B.; Ciais, P. Wetland emission and atmospheric sink changes explain methane growth in 2020. Nature 2022, 612, pgs–477. [Google Scholar] [CrossRef]
  60. Lighty, J.S.; Veranth, J.M.; Sarofim, A.F. Combustion aerosols: Factors governing their size and composition and implications to human health. J. Air Waste Manage. Assoc. 2000, 50(9), 1565–1618. [Google Scholar] [CrossRef]
  61. Horvath, H. Atmospheric light absorption: A review. Atmos. Environ. Part A 1993, 27, 293–317. [Google Scholar] [CrossRef]
  62. Chameides, W.L.; Bergin, M. Soot takes center stage. Science, /: 2214–2215. https, 2214. [Google Scholar]
  63. Bond, T.C.; Doherty, S.J.; Fahey, D.W.; Forster, P.M.; Berntsen, T.; DeAngelo, B.J.; Flanner, M.G.; Ghan, S.; Kärcher, B.; Koch, D.; Kinne, S.; Kondo, Y.; Quinn, P.K.; Sarofim, M.C.; Schultz, M.G.; Schulz, M.; Venkataraman, C.; Zhang, H.; Zhang, S.; Bellouin, N.; Guttikunda, S.K.; Hopke, P.K.; Jacobson, M.Z.; Kaiser, J.W.; Klimont, Z.; Lohmann, U.; Schwarz, J.P.; Shindell, D.; Storelvmo, T.; Warren, S.G.; Zender, C.S. Bounding the role of black carbon in the climate system: A scientific assessment. J. Geophys. Res. Atmospheres 2013, 118(11), 5380–5552. [Google Scholar] [CrossRef]
  64. Jacobson, M.Z. Strong radiative heating due to the mixing state of black carbon in atmospheric aerosols. Nature. 2001, 409, 695–697. [Google Scholar] [CrossRef]
  65. Ramanathan, V.; Carmichael, G. Global and regional climate changes due to black carbon. Nature Geosci. 2008, 1, 221–227. [Google Scholar] [CrossRef]
  66. Donateo, A.; Lo Feudo, T.; Marinoni, A.; Calidonna, C.R.; Contini, D.; Bonasoni, P. Long-term observations of aerosol optical properties at three GAW regional sites in the Central Mediterranean. Atmos. Res. 2020, 241, 104976. [Google Scholar] [CrossRef]
  67. Federico, S.; Pasqualoni, L.; De Leo, L.; Bellecci, C. A study of the breeze circulation during summer and fall 2008 in Calabria, Italy. Atmos. Res. [CrossRef]
  68. Federico, S.; Pasqualoni, L.; Sempreviva, A.M.; De Leo, L.; Avolio, E.; Calidonna, C.R.; Bellecci, C. The seasonal characteristics of the breeze circulation at a coastal Mediterranean site in South Italy. Adv. Sci. Res. 2010, 4, pgs–47. [Google Scholar] [CrossRef]
  69. Cristofanelli, P.; Busetto, M.; Calzolari, F.; Ammoscato, I.; Gullì, D.; Dinoi, A.; Calidonna, C.R.; Contini, D.; Sferlazzo, D.; Di Iorio, T.; Piacentino, S.; Marinoni, A.; Maione, M.; Bonasoni, P. Investigation of reactive gases and methane variability in the coastal boundary layer of the central Mediterranean basin. Elem. Sci. Anth. 2017, 2017 5, 12. [Google Scholar] [CrossRef]
  70. Lo Feudo, T.; Calidonna, C.R.; Avolio, E.; Sempreviva, A.M. Study of the Vertical Structure of the Coastal Boundary Layer Integrating Surface Measurements and Ground-Based Remote Sensing. Sensors 2020, 20, 6516. [Google Scholar] [CrossRef] [PubMed]
  71. Gullì, D.; Avolio, E.; Calidonna, C.R.; Lo Feudo, T.; Torcasio, R.C.; Sempreviva, A.M. Two years of wind-lidar measurements at an Italian Mediterranean Coastal Site. In European Geosciences Union General Assembly 2017, EGU – Division Energy, Resources & Environment, ERE. Energy Procedia 2017, 125, pgs–214. [Google Scholar] [CrossRef]
  72. Donateo, A.; Lo Feudo, T.; Marinoni, A.; Dinoi, A.; Avolio, E.; Merico, E.; Calidonna, C.R.; Contini, D.; Bonasoni, P. Characterization of In Situ Aerosol Optical Properties at Three Observatories in the Central Mediterranean. Atmosphere 2018, 9(10), 369. [Google Scholar] [CrossRef]
  73. Calidonna, C.R.; Avolio, E.; Gullì, D.; Ammoscato, I.; De Pino, M.; Donateo, A.; Lo Feudo, T. Five Years of Dust Episodes at the Southern Italy GAW Regional Coastal Mediterranean Observatory: Multisensors and Modeling Analysis. Atmosphere 2020, 11(5), 456. [Google Scholar] [CrossRef]
  74. Chu, P.M.; Hodges, J.T.; Rhoderick, G.C.; Lisak, D.; Travis, J.C. Methane-in-air standards measured using a 1.65μm frequency-stabilized cavity ring-down spectrometer. Proc. SPIE 6378, Chemical and Biological Sensors for Industrial and Environmental Monitoring II, 3780. [Google Scholar] [CrossRef]
  75. Petzold, A.; Kramer, H.; Schönlinner, M. Continuous Measurement of Atmospheric Black Carbon Using a Multi-angle Absorption Photometer. Environ. Sci. Pollut. Res. 2002, 4, 78–82. [Google Scholar]
  76. Petzold, A.; Schloesser, H.; Sheridan, P.J.; Arnott, P.; Ogren, J.A.; Virkkula, A. Evaluation of multiangle absorption photometry for measuring aerosol light absorption. Aerosol Sci. Technol. 2005, 39, 40–51. [Google Scholar] [CrossRef]
  77. Petzold, A.; Schönlinner, M. Multi-angle absorption photometry—a new method for the measurement of aerosol light absorption and atmospheric black carbon. J. Aerosol Sci. 2004, 35(4), 421–441. [Google Scholar] [CrossRef]
  78. Guo, P.; Sun, Y.; Chen, Q.; Li, J.; Liu, Z. The Impact of Rainfall on Urban Human Mobility from Taxi GPS Data. Sustainability 2022, 14, 9355. [Google Scholar] [CrossRef]
  79. Szulejko, J.E.; Adelodun, A.A.; Kim, K.-H.; Seo, J.W.; Vellingiri, K.; Jeon, E.-C.; Hong, J.; Brown, R.J.C. Short and Long-Term Temporal Changes in Air Quality in a Seoul Urban Area: The Weekday/Sunday Effect. Sustainability 2018, 10, 1248. [Google Scholar] [CrossRef]
  80. He, RR. Quantifying the weekly cycle effect of air pollution in cities of China. Stoch. Environ. Res. Risk. Assess. 2023, 37, 2445–2457. [Google Scholar] [CrossRef]
  81. Quaas, J.; Boucher, O.; Jones, A.; Weedon, G.P.; Kieser, J.; Joos, H. Exploiting the weekly cycle as observed over Europe to analyse aerosol indirect effect in two climate models. Atmos. Chem. Phys. 2009, 9(21), 8493–8501. [Google Scholar] [CrossRef]
  82. Kim, S.-W.; McDonald, B.C.; Baidar, S.; Brown, S.S.; Dube, B.; Ferrare, R.A.; Frost, G.J.; Harley, R.A.; Holloway, J.S.; Lee, H.-J.; McKeen, S.A.; Neuman, J.A.; Nowak, J.B.; Oetjen, H.; Ortega, I.; Pollack, I.B.; Roberts, J.M.; Ryerson, T.B.; Scarino, A.J.; Senff, C.J.; Thalman, R.; Trainer, M.; Volkamer, R.; Wagner, N.; Washenfelder, R.A.; Waxman, E. ; Young. C.J. Modeling the weekly cycle of NOx and CO emissions and their impacts on O3 in the Los Angeles-South Coast Air Basin during the CalNex 2010 field campaign. J. Geophys. Res.-Atmos. [CrossRef]
  83. Perrone, M.R.; Vecchi, R.; Romano, S.; Becagli, S.; Traversi, R.; Paladini, F. Weekly cycle assessment of PM mass concentrations and sources, and impacts on temperature and wind speed in Southern Italy. Atmos. Res. 2019, 218, 129–144. [Google Scholar] [CrossRef]
  84. Hilario, M.R.A.; Cruz, M.T.; Bañaga, P.A.; Betito, G.; Braun, R.A.; Stahl, C.; Cambaliza, M.O.; Lorenzo, G.R.; MacDonald, A.B.; AzadiAghdam, M.; et al. Characterizing Weekly Cycles of Particulate Matter in a Coastal Megacity: The Importance of a Seasonal, Size-Resolved, and Chemically Speciated Analysis. J. Geophys. Res. Atmos. 2020, 125(13), e2020JD032614. [Google Scholar] [CrossRef]
  85. Popovicheva, O.; Chichaeva, M.; Kovach, R.; Zhdanova, E.; Kasimov, N. Seasonal, Weekly, and Diurnal Black Carbon in Moscow Megacity Background under Impact of Urban and Regional Sources. Atmosphere 2022, 13(4), 563. [Google Scholar] [CrossRef]
  86. Rodó, X.; Navarro-Gallinad, A.; Kojima, T.; Morguí, J.-A.; Borràs, S.; Fontal, A. Sub-weekly signatures relate ultrafine aerosols enriched in metals from intensive farming and urban pollution to Kawasaki disease. Environ. Res. Lett. 2023, 18, 074011. [Google Scholar] [CrossRef]
  87. Peccarrisi, D.; Romano, S.; Fragola, M.; Buccolieri, A.; Quarta, G.; Calcagnile, L. New insights from seasonal and weekly evolutions of aerosol absorption properties and their association with PM2.5 and NO2 concentrations at a central Mediterranean site. Atmos. Pollut. Res. 2024, 15(7), 102131. [Google Scholar] [CrossRef]
  88. Yang, J.; Fu, X.; Qiao, L.; Yao, L.; Zhang, F.; Li, W. Characteristics of Atmospheric Pollution in a Chinese Megacity: Insights from Three Different Functional Areas. Sustainability 2023, 15, 2429. [Google Scholar] [CrossRef]
  89. He, L.; Rosa, L.; Lobell, D.B.; Wang, Y.; Yin, Y.; Doughty, R.; Yao, Y.; Berry, J.A.; Frankenberg, C. The weekly cycle of photosynthesis in Europe reveals the negative impact of particulate pollution on ecosystem productivity. P. Natl. Acad. Sci. USA 2023, 120(49), ee2306507120. [Google Scholar] [CrossRef] [PubMed]
  90. Graven, H.; Keeling, R.F.; Rogelj, J. Changes to carbon isotopes in atmospheric CO2 over the industrial era and into the future. Glob. Biogeochem. Cycles 2020, 34, e2019GB006170. [Google Scholar] [CrossRef] [PubMed]
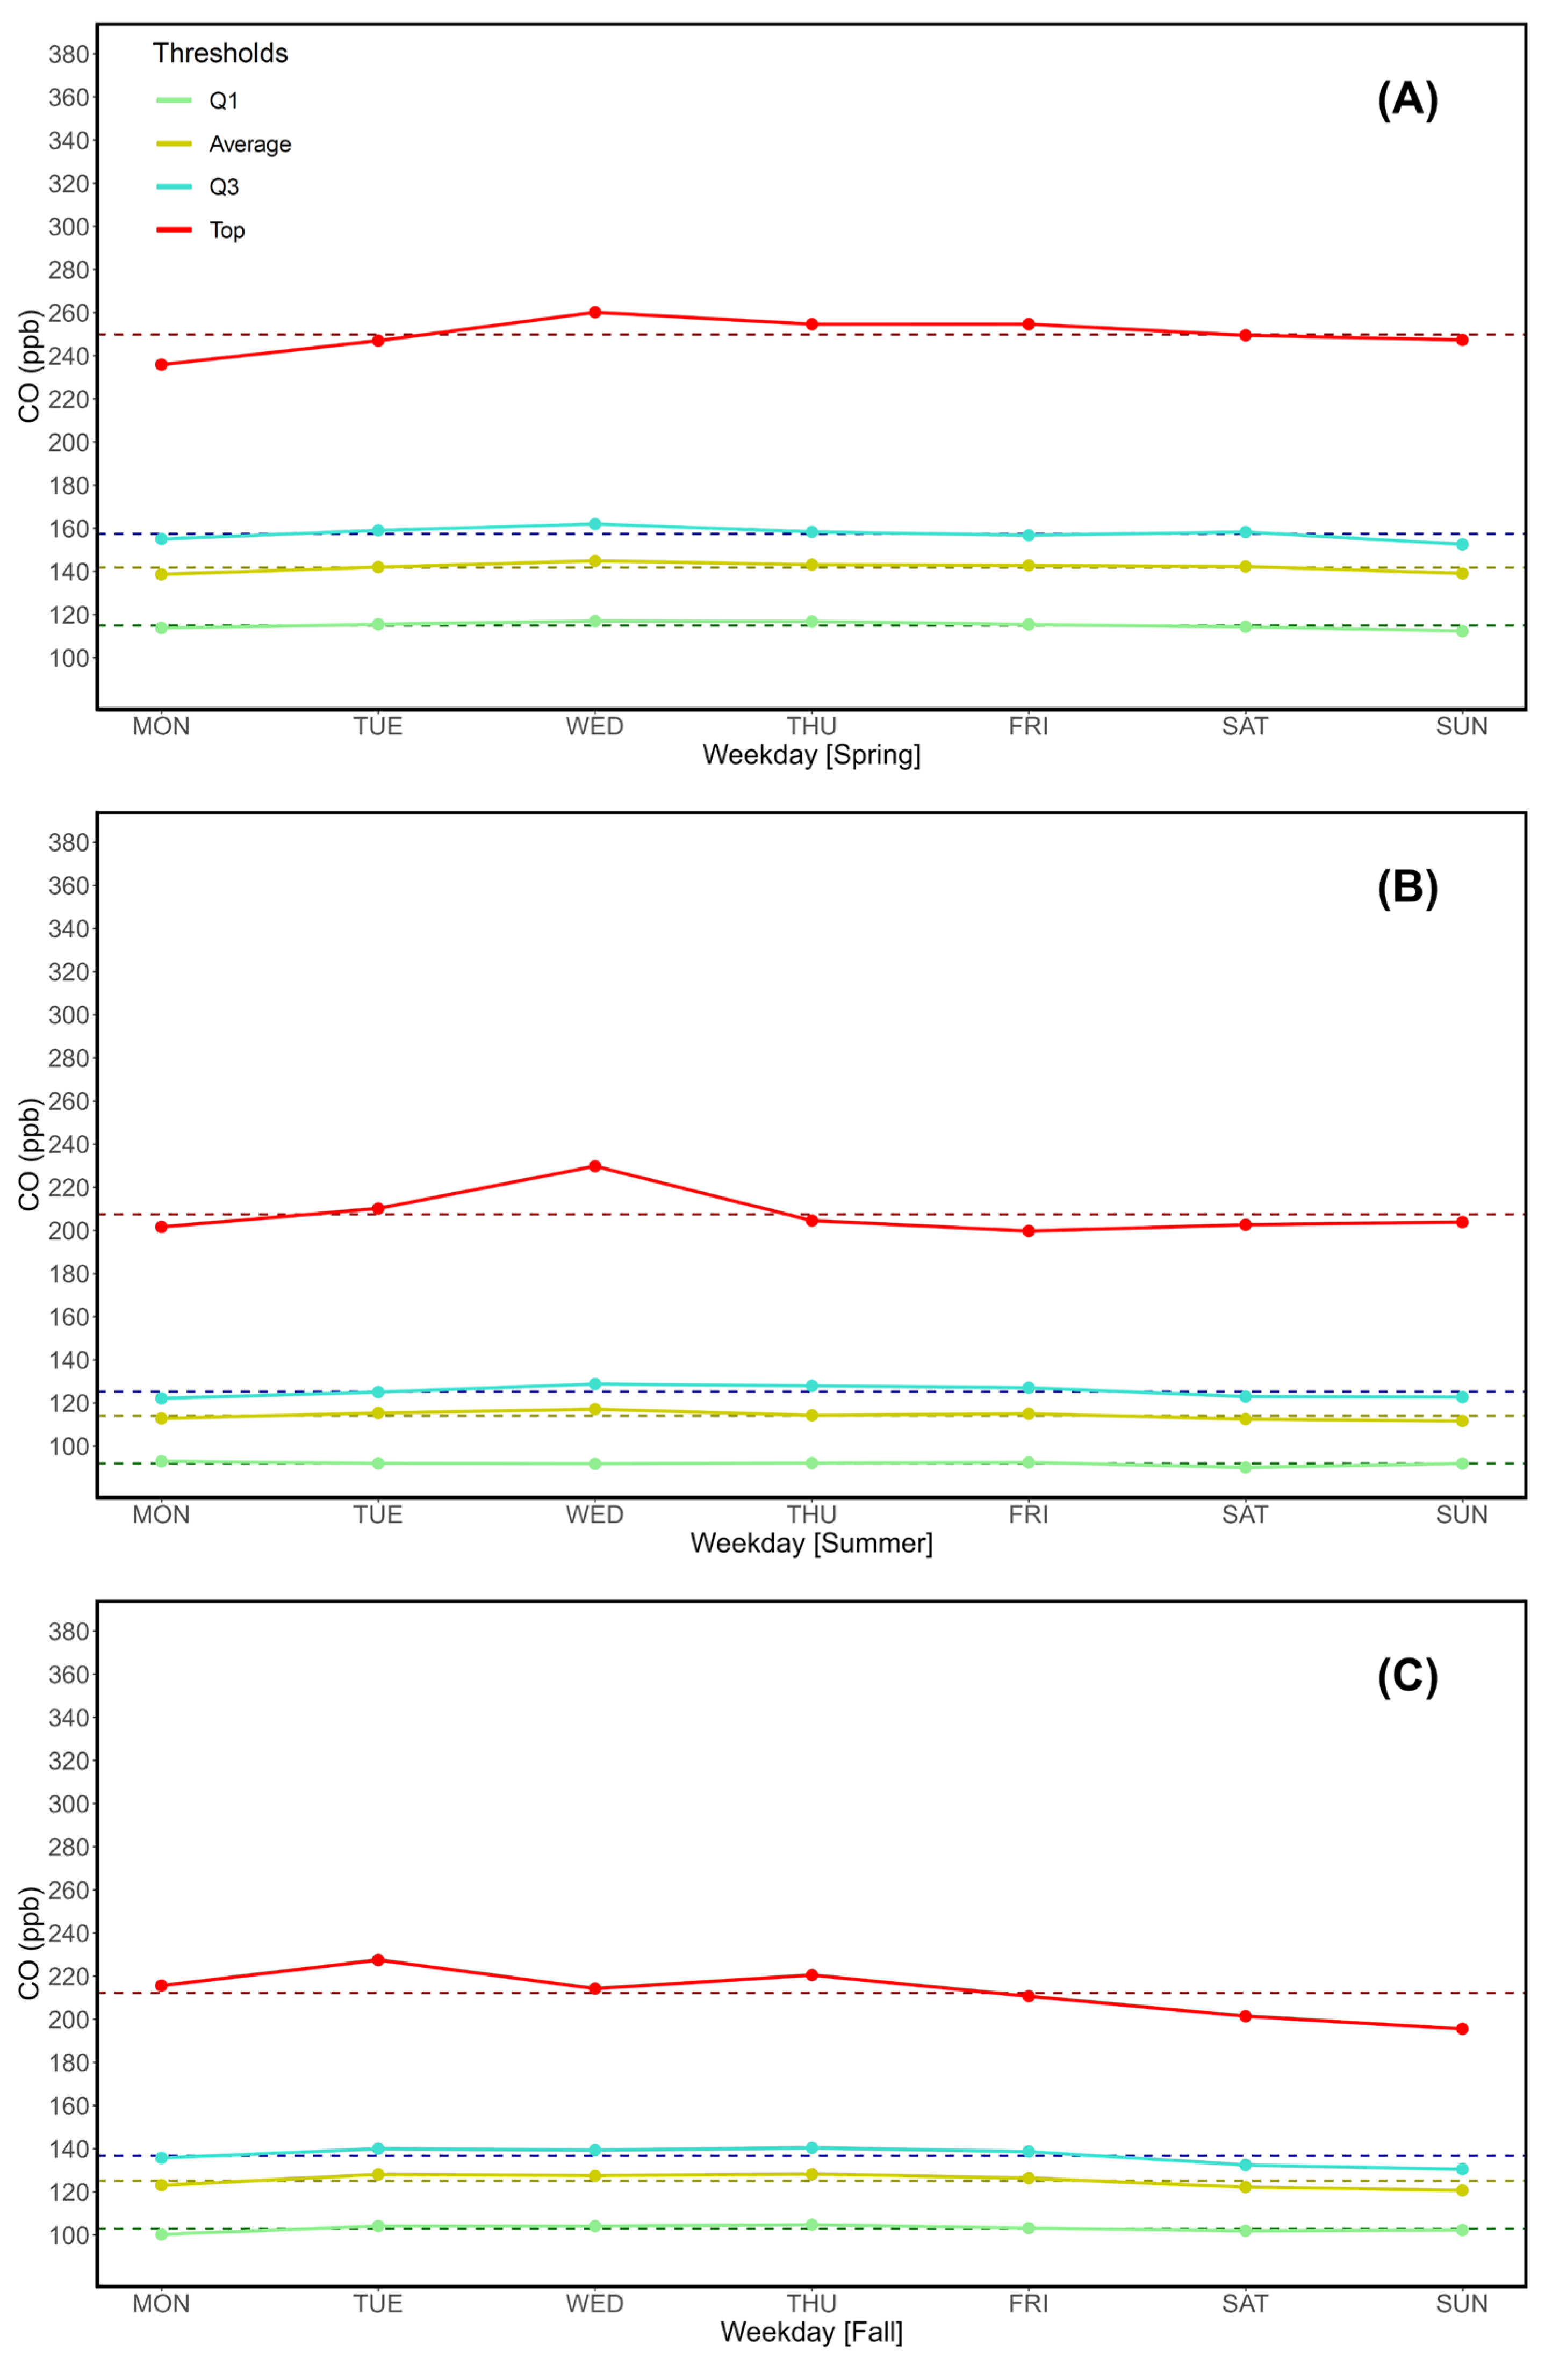
Figure 3. Seasonal variations of CO (ppb). A: Spring; B: Summer; C: Fall; D: Winter.
Preprints 118549 g003aPreprints 118549 g003b
Figure 4. Seasonal variations of CO2 (ppm). A: Spring; B: Summer; C: Fall; D: Winter.
Preprints 118549 g004aPreprints 118549 g004b
Figure 5. Seasonal variations of CH4 (ppb). A: Spring; B: Summer; C: Fall; D: Winter.
Preprints 118549 g005aPreprints 118549 g005b
Figure 6. Seasonal variations of eBC (μg /m3). A: Spring; B: Summer; C: Fall; D: Winter.
Preprints 118549 g006aPreprints 118549 g006b
Figure 7. Seasonal variations of CO (ppb) in terms of outbreak hours of occurrence (Q3 and top 2.5% interval thresholds). A: Spring; B: Summer; C: Fall; D: Winter.
Preprints 118549 g007
Figure 8. Seasonal variations of CO2 (ppm) in terms of outbreak hours of occurrence (Q3 and top 2.5% interval thresholds). A: Spring; B: Summer; C: Fall; D: Winter.
Preprints 118549 g008
Figure 9. Seasonal variations of CH4 (ppb) in terms of outbreak hours of occurrence (Q3 and top 2.5% interval thresholds). A: Spring; B: Summer; C: Fall; D: Winter.
Preprints 118549 g009
Figure 10. Seasonal variations of eBC (μg /m3) in terms of outbreak hours of occurrence (Q3 and top 2.5% interval thresholds). A: Spring; B: Summer; C: Fall; D: Winter.
Preprints 118549 g010
Figure 11. Seasonal variations of the newly introduced WDWO for CO (yellow), CO2 (brown), CH4 (dark gray) and eBC (black). A: Spring; B: Summer; C: Fall; D: Winter. “1” images refer to the Q3 threshold, while “2” refer to the top 2.5% of data. The intercept parallel to the x axis indicates the average expected value per day, which is 0.1428.
Preprints 118549 g011aPreprints 118549 g011bPreprints 118549 g011c
Table 1. Picarro and Thermo Scientific data coverage compared to the total amount of hours in the 2016-2022 observation period. Also shown are the parameters of a hypothetical “Combined” dataset which would have resulted in loss of data, if used.
Total hours CO, CO2, CH4 (hours) CO, CO2, CH4 (%) eBC
(hours)
eBC
(%)
Combined (hours) Combined (%)
61368 57926 94.39% 58968 96.08% 559601 91.18%2
1 1966 and 3008 hours less compared to the Picarro and Thermo Scientific datasets, respectively. 2 3,21% and 4,9% less compared to the datasets, respectively.
Table 2. General Q1, mean, Q3 and 97.5% (top 2.5% interval) thresholds for CO, CO2, CH4 and eBC over the entire 2016-2022 observation period at LMT.
Day CO (ppb) CO2 (ppm)
Q1 Mean Q3 97.5% Q1 Mean Q3 97.5%
MON 103.95 134.17 149.03 260.18 411.82 429.88 432.04 480.50
TUE 106.24 138.41 153.90 269.75 411.90 426.64 435.03 479.66
WED 106.34 139.78 156.82 276.91 412.08 426.11 435.11 483.54
THU 106.43 139.73 155.72 282.48 412.28 426.52 435.33 481.63
FRI 106.22 139.06 155.73 263.37 412.04 426.92 436.04 483.01
SAT 105.53 136.46 154.12 263.89 411.87 427.66 432.72 479.80
SUN 104.22 135 150.31 263.58 411.68 430.31 432.83 481.12
Average 105.56 137.51 153.66 268.60 411.95 427.72 434.16 481.32
χ2 0.062831 0.23195 0.33497 1.5219 0.00055834 0.04028 0.03425 0.028361
p-value 1.001 1 0.9999 0.9573 1 1 1 1
Day CH4 (ppb) eBC (μg /m3)
Q1 Mean Q3 97.5% Q1 Mean Q3 97.5%
MON 1933.35 2009.44 2037.02 2354.75 0.20 0.50 0.63 1.78
TUE 1937.12 2013.36 2052.16 2340.72 0.20 0.52 0.66 1.89
WED 1939.30 2018.48 2056.81 2376.46 0.20 0.54 0.68 1.99
THU 1938.10 2016.33 2054.24 2356.72 0.21 0.56 0.71 2.04
FRI 1936.38 2019.41 2055.87 2380.99 0.24 0.57 0.74 1.89
SAT 1935.49 2013.56 2044.81 2361.95 0.22 0.52 0.67 1.76
SUN 1934.45 2013.90 2044.04 2361.65 0.19 0.48 0.62 1.66
Average 1936.31 2014.93 2049.28 2361.89 0.21 0.53 0.67 1.86
χ2 0.013287 0.034817 0.16136 0.46693 0.0093821 0.012555 0.015767 0.059077
p-value 1 1 1 0.999 1.463 1.227 1.178 1
1 Footer, TBFIL.
Table 3. General Q1, mean, Q3 and 97.5% thresholds for CO, CO2, CH4 and eBC over the entire 2016-2022 observation period at LMT. Spring season.
Day CO (ppb) CO2 (ppm)
Q1 Mean Q3 97.5% Q1 Mean Q3 97.5%
MON 113.81 155.05 138.62 235.88 413.09 431.04 425.03 475.34
TUE 115.53 159.02 142.00 246.98 413.38 432.10 425.75 476.10
WED 116.99 162.00 144.90 260.16 413.52 436.61 426.95 480.26
THU 116.81 158.35 143.12 254.64 413.64 430.90 426.46 478.35
FRI 115.44 156.75 142.79 254.66 413.79 432.23 426.11 477.09
SAT 114.37 158.27 142.29 249.49 413.71 430.37 425.75 477.94
SUN 112.33 152.56 139.08 247.34 412.91 429.88 425.22 478.69
Average 115.04 157.43 141.83 249.88 413.43 431.87 425.90 477.68
Day CH4 (ppb) eBC (μg /m3)
Q1 Mean Q3 97.5% Q1 Mean Q3 97.5%
MON 1932.47 2020.17 1998.09 2291.96 0.16 0.56 0.43 1.50
TUE 1936.10 2025.94 2001.63 2305.78 0.18 0.60 0.45 1.66
WED 1937.77 2043.60 2016.02 2382.10 0.18 0.64 0.48 1.67
THU 1938.46 2023.10 2002.94 2307.98 0.19 0.63 0.48 1.66
FRI 1935.97 2021.85 2004.55 2334.98 0.23 0.64 0.51 1.66
SAT 1934.21 2026.30 2005.43 2329.96 0.23 0.62 0.50 1.68
SUN 1931.49 2024.96 1999.52 2287.32 0.17 0.57 0.44 1.56
Average 1935.21 2026.56 2004.03 2320.01 0.19 0.61 0.47 1.63
Table 4. General Q1, mean, Q3 and 97.5% thresholds for CO, CO2, CH4 and eBC over the entire 2016-2022 observation period at LMT. Summer season.
Day CO (ppb) CO2 (ppm)
Q1 Mean Q3 97.5% Q1 Mean Q3 97.5%
MON 92.96 122.11 112.82 201.61 407.81 436.16 425.17 491.31
TUE 91.97 125.04 115.32 210.16 407.88 438.98 425.98 489.45
WED 91.79 128.77 117.09 229.79 407.63 439.03 425.93 494.09
THU 92.10 127.93 114.26 204.53 407.76 442.01 427.05 495.42
FRI 92.43 127.03 114.98 199.72 407.97 446.02 428.39 498.89
SAT 90.07 122.96 112.49 202.61 408.01 436.76 425.24 488.87
SUN 91.89 122.73 111.61 203.83 407.81 437.67 425.95 492.26
Average 91.89 125.22 114.08 207.46 407.84 439.52 426.24 492.90
Day CH4 (ppb) eBC (μg /m3)
Q1 Mean Q3 97.5% Q1 Mean Q3 97.5%
MON 1917.79 2030.74 1994.56 2315.50 0.24 0.59 0.48 1.44
TUE 1919.13 2044.44 2000.50 2334.25 0.22 0.62 0.48 1.49
WED 1917.80 2035.29 1996.58 2317.70 0.23 0.67 0.53 1.85
THU 1918.53 2041.35 1995.89 2310.85 0.22 0.65 0.50 1.62
FRI 1918.40 2042.36 1997.47 2302.64 0.24 0.69 0.52 1.56
SAT 1917.47 2029.94 1996.19 2348.31 0.22 0.60 0.47 1.45
SUN 1915.38 2033.39 1995.59 2320.33 0.21 0.60 0.46 1.47
Average 1917.78 2036.79 1996.68 2321.37 0.22 0.63 0.49 1.55
Table 5. General Q1, mean, Q3 and 97.5% thresholds for CO, CO2, CH4 and eBC over the entire 2016-2022 observation period at LMT. Fall season.
Day CO (ppb) CO2 (ppm)
Q1 Mean Q3 97.5% Q1 Mean Q3 97.5%
MON 100.18 135.75 123.09 215.60 411.19 439.35 447.03 485.43
TUE 104.15 140.01 128.02 227.49 411.52 442.07 431.87 478.49
WED 104.12 139.36 127.42 214.22 412.08 440.02 427.81 486.47
THU 104.74 140.41 128.18 220.50 412.01 441.18 428.00 477.71
FRI 103.20 138.71 126.36 210.69 411.90 441.39 428.89 479.19
SAT 101.89 132.45 122.22 201.42 411.77 438.16 436.34 482.07
SUN 102.26 130.50 120.69 195.57 411.98 439.32 447.30 481.59
Average 102.93 136.74 125.14 212.21 411.78 440.21 435.32 481.57
Day CH4 (ppb) eBC (μg /m3)
Q1 Mean Q3 97.5% Q1 Mean Q3 97.5%
MON 1940.13 2079.88 2029.05 2382.75 0.20 0.70 0.54 1.98
TUE 1945.30 2078.51 2031.13 2343.82 0.21 0.71 0.57 2.11
WED 1945.82 2081.40 2033.51 2394.04 0.22 0.71 0.54 1.75
THU 1945.22 2082.45 2033.34 2377.77 0.26 0.78 0.59 1.85
FRI 1945.78 2090.59 2036.65 2410.27 0.28 0.75 0.60 1.91
SAT 1945.17 2067.08 2025.76 2377.11 0.26 0.70 0.55 1.69
SUN 1946.04 2078.91 2032.16 2377.95 0.20 0.65 0.47 1.48
Average 1944.78 2079.83 2031.66 2380.53 0.23 0.71 0.55 1.82
Table 6. General Q1, mean, Q3 and 97.5% thresholds for CO, CO2, CH4 and eBC over the entire 2016-2022 observation period at LMT. Winter season.
Day CO (ppb) CO2 (ppm)
Q1 Mean Q3 97.5% Q1 Mean Q3 97.5%
MON 118.77 180.82 161.58 331.21 414.56 426.58 422.32 452.47
TUE 123.47 193.04 166.89 356.73 414.57 428.95 423.17 452.63
WED 126.48 191.33 169.62 359.95 415.14 428.59 423.71 456.90
THU 126.55 195.43 172.69 358.30 414.90 431.24 424.63 457.07
FRI 125.03 197.55 170.80 347.52 414.81 431.47 424.41 457.10
SAT 126.67 190.56 167.00 339.37 414.62 428.88 423.21 453.75
SUN 122.05 189.22 166.44 334.03 414.13 428.00 423.10 455.51
Average 124.14 191.14 167.86 346.73 414.68 429.10 423.51 455.06
Day CH4 (ppb) eBC (μg /m3)
Q1 Mean Q3 97.5% Q1 Mean Q3 97.5%
MON 1941.15 2027.64 2016.00 2405.69 0.18 0.68 0.54 2.18
TUE 1944.28 2056.49 2021.10 2373.83 0.18 0.73 0.56 2.28
WED 1948.13 2059.77 2028.18 2406.91 0.17 0.72 0.61 2.67
THU 1949.43 2069.25 2034.01 2421.81 0.18 0.82 0.65 2.75
FRI 1945.83 2074.72 2038.80 2450.45 0.23 0.89 0.67 2.43
SAT 1946.35 2047.75 2025.77 2391.88 0.19 0.78 0.58 2.21
SUN 1944.90 2042.27 2027.78 2428.05 0.18 0.68 0.53 2.09
Average 1945.72 2053.98 2027.38 2411.23 0.19 0.76 0.59 2.37
Table 7. Seasonal distributions of outbreak hours, listed by category (Q3, top 2.5% interval) and parameter. Max/Min indicates weekdays with the maximum and minimum number of outbreak data, respectively.
Hours ≥ 3rd Q. Average
(3rd Q.)
Max/Min
(3rd Q.)
Hours ≥
Top 2.5%
Average
(T2,5%)
Max/Min
(T2,5%)
CO (ppb)
Spring 3773 539 WED/SUN 379 54 THU/MON
Summer 3078 440 WED/SUN 352 50 FRI/SUN
Fall 3579 511 THU/SUN 361 52 MON/SUN
Winter 3634 519 FRI/MON 366 52 THU/SUN
CO2 (ppm)
Spring 3773 539 WED/SUN 379 54 THU/TUE
Summer 3506 501 FRI/MON 352 50 FRI/SAT
Fall 3579 511 SAT/WED 361 52 MON/TUE
Winter 3634 519 FRI/MON 366 52 THU/WED
CH4 (ppb)
Spring 3773 539 WED/MON 379 54 WED/MON
Summer 3506 501 FRI/SUN 359 51 SAT/THU
Fall 3579 511 FRI/WED 361 52 FRI/TUE
Winter 3634 519 FRI/MON 366 52 FRI/SAT
eBC(μg /m3)
Spring 3773 539 WED/MON 379 54 THU/MON
Summer 3506 352 FRI/SUN 501 50 WED/SUN
Fall 3579 511 THU/SUN 361 52 TUE/SUN
Winter 3635 519 FRI/MON 366 52 THU/M-SU1
1 Both Monday and Sunday in this case yield the same value of 38 outbreak hours.
Table 8. Weighed Distributions of Weekly Outbreaks (WDWO) for each parameter, divided by season and threshold type. Bold characters mark the highest standard deviation and range values per season, while italics mark the lowest.
Seasons Wdays CO CO2 CH4 eBC
Q3 Top Q3 Top Q3 Top Q3 Top
Fall MON 0.139 0.214 0.140 0.187 0.146 0.147 0.134 0.179
TUE 0.159 0.191 0.145 0.110 0.144 0.114 0.137 0.283
WED 0.153 0.144 0.129 0.123 0.134 0.159 0.140 0.110
THU 0.165 0.162 0.147 0.104 0.145 0.130 0.183 0.140
FRI 0.163 0.109 0.147 0.174 0.151 0.188 0.168 0.156
SAT 0.115 0.099 0.151 0.127 0.135 0.135 0.137 0.091
SUN 0.105 0.081 0.141 0.174 0.147 0.127 0.100 0.041
SD 0.022 0.046 0.007 0.032 0.006 0.023 0.025 0.071
Range 0.143 0.168 0.145 0.155 0.145 0.165 0.158 0.242
Spring MON 0.126 0.089 0.132 0.134 0.131 0.086 0.111 0.095
TUE 0.149 0.138 0.143 0.116 0.138 0.131 0.136 0.163
WED 0.168 0.167 0.170 0.164 0.168 0.200 0.168 0.151
THU 0.148 0.171 0.143 0.166 0.145 0.134 0.153 0.169
FRI 0.143 0.153 0.152 0.145 0.144 0.156 0.163 0.166
SAT 0.149 0.150 0.137 0.143 0.143 0.151 0.150 0.151
SUN 0.118 0.133 0.124 0.132 0.132 0.143 0.119 0.106
SD 0.015 0.025 0.014 0.017 0.011 0.032 0.020 0.028
Range 0.153 0.146 0.156 0.150 0.156 0.168 0.148 0.141
Summer MON 0.133 0.146 0.129 0.119 0.135 0.125 0.115 0.134
TUE 0.135 0.129 0.138 0.118 0.145 0.160 0.135 0.080
WED 0.168 0.198 0.135 0.142 0.144 0.147 0.169 0.251
THU 0.159 0.114 0.155 0.171 0.151 0.119 0.163 0.180
FRI 0.152 0.180 0.171 0.207 0.153 0.135 0.174 0.176
SAT 0.140 0.122 0.138 0.104 0.139 0.183 0.131 0.104
SUN 0.113 0.111 0.135 0.139 0.133 0.131 0.113 0.076
SD 0.017 0.031 0.014 0.033 0.007 0.021 0.024 0.059
Range 0.151 0.166 0.158 0.174 0.146 0.162 0.151 0.192
Winter MON 0.110 0.117 0.129 0.130 0.119 0.114 0.103 0.093
TUE 0.143 0.137 0.136 0.158 0.137 0.113 0.124 0.118
WED 0.130 0.164 0.133 0.115 0.139 0.114 0.122 0.207
THU 0.159 0.200 0.160 0.167 0.157 0.156 0.175 0.226
FRI 0.171 0.158 0.165 0.140 0.168 0.202 0.215 0.150
SAT 0.150 0.120 0.140 0.128 0.145 0.108 0.147 0.117
SUN 0.137 0.105 0.137 0.161 0.136 0.192 0.112 0.089
SD 0.018 0.031 0.013 0.018 0.015 0.038 0.037 0.050
Range 0.153 0.169 0.152 0.149 0.153 0.165 0.178 0.176
Table 9. WD/WN ratios of WDWO parameters, calculated on a per-season and yearly basis. Average values and standard deviations are provided for each season. Peaks are in bold character, while the lowest values are in italics.
Season Year CO CO2 CH4 eBC
Q3 Top Q3 Top Q3 Top Q3 Top
Fall 2016 1.30 1.03 0.99 4.04 0.84 1.07 1.14 5.02
2017 1.06 1.37 0.95 0.97 0.93 1.46 0.96 1.57
2018 1.10 1.24 0.97 0.80 1.13 1.27 1.44 1.59
2019 1.16 4.55 1.25 2.25 1.28 1.09 1.49 1.53
2020 2.08 3.38 1.00 0.64 0.99 2.12 2.20 2.66
2021 1.59 0.77 0.79 0.75 0.83 0.35 1.27 1.50
2022 2.59 23.73 0.87 0.32 1.32 2.69 1.56 0.00
Avg 1.56 5.15 0.97 1.40 1.05 1.44 1.44 1.98
SD 0.54 7.69 0.13 1.22 0.19 0.71 0.37 1.43
Spring 2016 1.01 1.09 1.15 1.81 1.12 1.42 1.42 2.56
2017 1.26 2.44 1.61 2.38 1.46 0.99 1.33 2.19
2018 0.92 0.43 1.10 2.03 0.97 1.27 0.80 0.48
2019 1.04 0.44 1.05 0.59 1.03 1.31 1.07 0.78
2020 1.01 0.58 0.80 0.44 0.72 0.27 0.59 0.63
2021 1.17 1.33 0.89 0.80 0.92 1.19 1.00 1.67
2022 1.30 8.81 1.74 1.39 1.44 1.21 1.97 2.10
Avg 1.10 2.16 1.19 1.35 1.09 1.09 1.17 1.49
SD 0.13 2.79 0.33 0.70 0.25 0.36 0.42 0.79
Summer 2016 1.00 1.63 0.83 0.85 0.80 0.47 0.71 3.05
2017 1.40 1.59 0.99 1.18 1.19 1.07 1.73 3.40
2018 1.34 1.52 1.26 1.26 1.18 1.23 1.31 1.29
2019 1.04 1.06 0.99 0.96 1.05 0.76 0.96 0.83
2020 1.09 1.50 1.14 2.58 1.09 0.96 1.12 1.58
2021 1.12 0.92 1.11 1.45 0.85 1.17 1.61 0.79
2022 1.71 1.85 1.19 0.68 1.45 0.68 1.62 2.81
Avg 1.24 1.44 1.07 1.28 1.09 0.91 1.29 1.96
SD 0.24 0.30 0.13 0.58 0.20 0.26 0.35 1.02
Winter 2016 0.72 1.39 0.67 0.76 0.56 0.38 0.69 3.37
2017 1.69 2.79 1.46 1.26 1.46 0.66 2.42 2.97
2018 0.71 0.77 0.87 0.63 0.91 1.06 0.98 1.39
2019 1.00 1.95 0.98 1.12 0.97 1.42 1.14 0.65
2020 1.02 1.21 0.98 1.58 0.98 1.14 0.98 1.05
2021 0.96 1.76 1.38 1.97 1.60 1.03 1.26 2.31
2022 1.18 1.03 1.32 0.52 1.13 1.61 1.27 1.57
Avg 1.04 1.56 1.09 1.12 1.09 1.04 1.25 1.90
SD 0.31 0.63 0.27 0.49 0.33 0.39 0.51 0.94
Disclaimer/Publisher’s Note: The statements, opinions and data contained in all publications are solely those of the individual author(s) and contributor(s) and not of MDPI and/or the editor(s). MDPI and/or the editor(s) disclaim responsibility for any injury to people or property resulting from any ideas, methods, instructions or products referred to in the content.
Copyright: This open access article is published under a Creative Commons CC BY 4.0 license, which permit the free download, distribution, and reuse, provided that the author and preprint are cited in any reuse.
Prerpints.org logo

Preprints.org is a free preprint server supported by MDPI in Basel, Switzerland.

Subscribe

© 2024 MDPI (Basel, Switzerland) unless otherwise stated