
Submitted:
11 September 2024
Posted:
12 September 2024
You are already at the latest version
Abstract
A comprehensive 3D Multiphysics model was developed to simulate a plate fin heat exchanger designed for hydrogen liquefaction, incorporating ortho-para- hydrogen conversion catalyst in the hot fin channel. The model encompassed the 3D serrate fin structure, turbulent flow within the cold fin channel, and porous flow through the catalytic hot fin channel. Species transportation within the hot fin channel is coupled with ortho-para hydrogen conversion kinetics, while heat transfer mechanisms between the hot and cold fin channels are rigorously accounted for. Addi-tionally, the state- of- art equation of state is employed to accurately describe the thermodynamic properties of ortho- and para- hydrogen within the model. Numerous operational parameters, including the gas hourly space velocity, cold gas velocity, ortho-para- hydrogen conversion ki-netics, and operating pressure, were systematically varied to identify the kinetic and heat transfer constraints during the heat exchanger operation. The findings revealed that the ortho-para- hy-drogen conversion kinetic parameter predominantly governs operations requiring high gas hourly space velocity, particularly in large- scale hydrogen liquefaction processes. Furthermore, significant pressure drop within the catalytic filled channel was observed, however, operating at higher pressure mitigates this issue while mildly enhancing ortho-para-hydrogen conversion kinetics.
Keywords:
plate fin heat exchanger
; ortho-para- hydrogen conversion
; Multiphysics modelling
; hydrogen liquefaction
1. Introduction
Liquid hydrogen (LH2) plays a pivotal role in large-scale and long-distance storage and distribution of hydrogen, despite its inherent challenges of high energy consumption [1]. A significant aspect of this challenge relates to the ortho- to para-hydrogen conversion (OPC) during the liquefaction process. At ambient temperature, hydrogen gas consists of 75% ortho-hydrogen and 25% para-hydrogen. However, at the normal boiling temperature of LH2 (20.3 K), the equilibrium shifts dramatically with para-hydrogen concentration reaching 99.8%. To reduce boil off so that long term storage of LH2 is achievable, the ortho-hydrogen must be converted to para form in the presence of a catalyst during hydrogen liquefaction process. Otherwise, the heat generated due to the exothermicity of the OPC leads to increase of LH2 evaporation, since the enthalpy difference between ortho- and para-hydrogen exceeds the latent heat of LH2 evaporation [2].
To improve the energy efficiency of hydrogen liquefaction, a continuous cooling during the OPC process has been suggested by Lipman [3] based on the thermodynamic principle that power requirements are minimized by removing heat at the highest possible temperature. Modelling results also suggested that the specific energy consumption for continuous-conversion based process is 21.8% and 28.7% lower than the adiabatic and isothermal ones [4]. This continuous cooling approach is commonly implemented in practical commercial processes using catalyst filled plate fin heat exchangers (CPFHE) [5,6].
Plate fin heat exchangers (PFHEs) are extensively utilized in cryogenic applications due to their high specific surface area and compactness [7]. Typically constructed from aluminium for its excellent thermal conductivity and strength at cryogenic temperatures, PFHEs employ a configuration of fins and parting sheets to create separate flow passages for the hot and cold media. The theoretic analysis of PFHEs has been well established [8,9]. The introduction of catalyst into PFHEs, however, complicates the design in several ways. Firstly, catalyst filling alters the heat transfer characteristics of the heat exchanger within the hot flow channel. Secondly, OPC, an exothermic reaction, introduces varying kinetics along its path, thereby increasing the thermal load on the heat exchanger. Thirdly, the catalyst-filled hot channel acts as a packed-bed chemical reactor, constrained by the kinetics of OPC. Given the increased complexity of CPFHE, mathematical modelling approaches are commonly employed for theoretically analyse and design optimization.
Early efforts in modelling CPFHE were pioneered by Meagher [10], who applied classic correlations for heat transfer and pressure drop in both the open passage (cold channel) and catalyst-filled passage (hot channel) of CPFHE. His work utilized a simplified one-dimensional finite difference approach coupled with a logarithmic model of OPC kinetics based on Hutchinson et al. [11], providing initial insights into the prediction of the hydrogen liquefaction process. Wilhelmsen et al. [12] presented a steady-state one-dimensional mathematical model that incorporates the geometry of the heat exchanger, nonequilibrium ortho-para conversion, and correlations to account for the pressure drop and heat transfer coefficients due to the possible boiling/condensation of the refrigerant at the lowest temperatures. Based on available experimental data, a kinetic model with four parameters was developed. This approach achieved a close prediction of experimental data with an average deviation of 2.2%. Donaubauer et al. [13] developed a pseudo-homogeneous model for CPFHE, considering energy balance, mass balance and momentum balances. The first-order and a Langmuir-Hinshelwood kinetics have been derived and it is confirmed that the first-order approaches as the most suitable model. Park et al. [14] studied the CPFHE numerically by developing a model including continuity equation, momentum equation and energy equation to describe the fluid flow and heat transfer. The numerical model provided insights into pressure drop mechanisms in the porous region filled with ortho-para catalyst through development of a new correlation. O’Neill et al. [15] developed a comprehensive one-dimensional mathematical model that included OPC kinetics, heat transfer dynamics, and pressure drop considerations with more precise accounting for catalyst fraction effects. The result suggested that the outlet parahydrogen fraction is determined to be ca. ten times more sensitive to reaction rate relative to heat transfer.
Despite these advancements, existing models for CPFHE predominantly remain one-dimensional, with separate descriptions of controlling physics based on classic correlations. In this case, the mechanisms of flows (turbulent flow in open channel and porous flow in catalyst filled channel), heat transfer between the channels and parting sheets, and OPC kinetics are determined separately and how these mechanisms are interacted with each other is not fully understood.
Recently, a pioneering 3D model based on ANSYS® Fluent® has emerged [16], aiming to capture the complex flow and heat transfer processes within CPFHE. The flow and heat transfer process of hydrogen in the cold sides is described by the mass conservation equation, momentum conservation equation and energy conservation equation. However, to simplify the flow and heat transfer process in the hot channel, the porous media model and Ergun equation were applied in the model. The equation of state (EoS) of ortho-parahydrogen was also fitted with piecewise polynomial functions. The flow and heat transfer performance and the efficiency of OPC in the CPFHE are quantitatively evaluated, and the effects of the structural parameters of fins on the flow and heat transfer coupled with OPC are analysed. Zhu et al. [17] established a three-dimensional model of CPFHE and revealed the local thermal non-equilibrium effect in the heat exchanger, which is most significant at the inlet of the porous medium, while the fluid and the solid reach an approximately thermal equilibrium in fully developed section inside the heat exchanger. The model also suggested that excellent heat transfer performance and catalytic efficiency can be achieved when the Reynold number is in the range of 170 to 300.
The simulation of a practical plate fin heat exchanger filled with ortho-para- hydrogen conversion catalyst presents significant challenges due to its multifaceted nature involving multiple physics phenomena. These include turbulent flow in the cold channel, porous flow and OPC catalytic reaction in the catalyst filled hot channel, and heat transfer between the cold and hot channels. The complexity is further compounded when these flows are coupled within a three-dimensional structure. Nevertheless, this comprehensive approach is indispensable for elucidating the controlling mechanisms governing the operation of a CPFHE.
To address these challenges, the studies have employed COMSOL Multiphysics® software, a versatile simulation platform capable of fully coupled Multiphysics modelling capability, to establish a 3D based CPFHE model. The works aim to predict the overall performance of CPFHEs while exploring the impact of two primary controlling mechanisms, i.e. OPC kinetics and heat transfer dynamics. This endeavour not only provides valuable insights into CPFHE operation but also lays the groundwork for future advancements towards optimizing CPFHE designs.
2. Three-Dimensional Modelling
2.1. PFHE Geometry
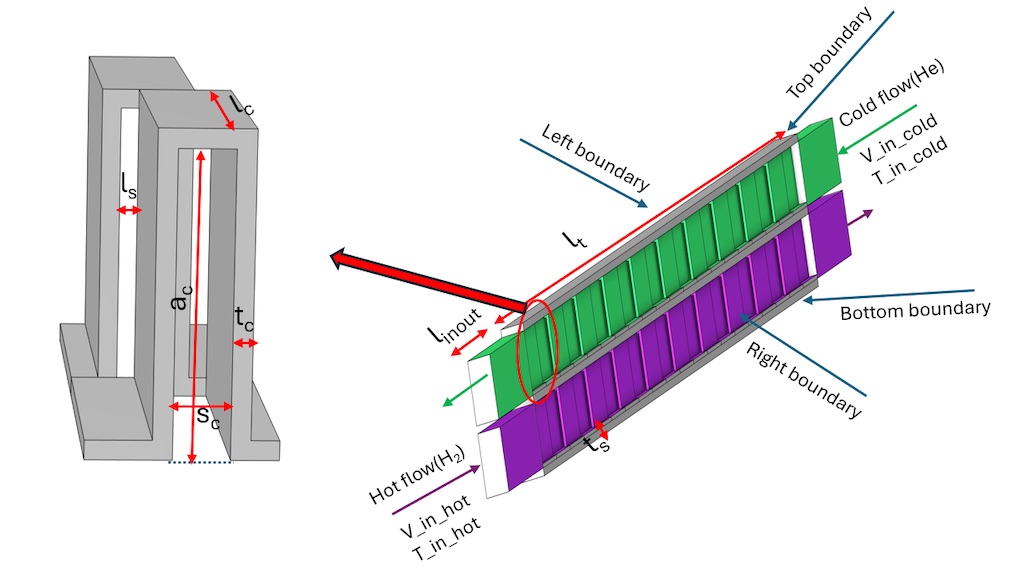
The 3D geometry of a primitive serrated fin with front and back fins is shown in Figure 1(a). To characterise the serrated fins, there are four dimensions to be considered, which are fin altitude (ac), fin thickness (tc), fin spacing (sc) and serration length (lc). The stagged length of front and back fin (ls) is half of the fin spacing. It is not the intention for this study to optimize these structure parameters of fins for improved heat transfer performance, so all the structure parameters are taken from literature [10] without changes.
Figure 1(b) illustrates the 3D configuration of the PFHE constructed using periodic arrangements of these primitive serrated fins. The PFHE incorporates double-layered flow channels for the cold and hot media, separated by parting sheets with a thickness of ts. In this configuration, both the hot and cold channels share identical structural parameters for the fins. To ensure well-developed flow within the heat exchanger, the total effective length (lt) of the heat exchanger is set as 20 times of the serration length. Additionally, to minimize inlet/ outlet flow effects, free- flow zone extending 2.5 times the serration length (linout) are incorporated before and after the flow path seperately, as shown in Figure 1(b). Detailed dimensions of the structural parameters are provided in Table 1.
2.2. Model Description
The mathematical model for the CPFHE is developed under the following specified conditions:
- (1)
- The cold channel operates with helium as the working fluid, while hydrogen is used on the hot channel. The hydrogen is a mixture of ortho- and para- form with given concentration.
- (2)
- The catalyst particles are uniformly filled exclusively in the hot side of fin channel, maintaining fixed porosity and permeability in the catalyst bed.
- (3)
- Both the flow dynamics and heat transfer in the cold and hot channels, as well as the OPC kinetics in the hot channel, are assumed to be at steady state.
The modelling approach for CPFHE involves solving a set of governing equations:
- (1)
- Mass and momentum conservation equations: These equations describe the flow behaviour in both the cold and hot channels separately, accounting for their distinct flow characteristics.
- (2)
- Species transport equation: This equation governs the transport of ortho- and para- hydrogen species in the hot channel with considering the OPC kinetics.
- (3)
- Heat transfer equation: This equation governs the transfer of heat between the cold and hot channels and the parting sheet, taking into account the enthalpy changes due to the OPC reaction.
The simulations were conducted using the commercial software package COMSOL Multiphysics® 6.2. The software provides a robust platform for integrating and solving these multi-physics phenomena. A brief introduction of the theory for modelling and selection of physics interfaces from the software are given in the following sections and a details description can be found in elsewhere [18].
2.2.1. Flow Characteristics
The fluid dynamics inside the cold channel of CPFHE was modelled using the Navire-Stoke equation. The continuity equation and momentum equations were given as:
Since the flow in the cold channel is in the turbulent flow range, the standard k-epsilon (k−ϵ) model for turbulence flow was adopted, as given by
The value of constant is given as =0.09, =1.00, =1.3, =1.44 and =1.92.
Due to the presence of catalyst particles in the hot channel of CPFHE, the fluid flow was modelled as porous medium flow and was given by the Brinkman equation, which extends Darcy’s law to describe the dissipation of the kinetic energy by viscous shear, similar to the Navier–Stokes equations.
The built-in physical interfaces in COMSOL as turbulent flow (spf) and free and porous flow (fp) were selected accordingly. Both flows are treated as compressible flow with Mach number less than 0.3. The velocity field and pressure profile are the dependent variables for both channels and will be solved separately.
2.2.2. Species Transportation
The chemical species (ortho- para- hydrogen) present inside the hot channel are subject to diffusion and convection, in addition to the OPC chemical reaction. The species transportation equation is given as:
The mixture averaged approximation model is selected in calculating the diffusion model, given as:
The conversion of orthohydrogen (H2,o) to parahydrogen (H2,p) is exothermic and is described by the following:
H2,o⇌H2,p ΔH =- Qconv
Kinetic models selected from literature will be tested and applied to calculate the reaction rate (R), which will be discussed in the next section.
The built-in physical interfaces in COMSOL as Transport of Concentrated Species (tcs) and Chemistry (chem) were selected for modelling. The mole concentrations of species are the dependent variables and will be solved.
2.2.3. Heat Transfer
Without considering the work done by pressure change and viscous dissipation, the heat transfer equation following energy balance is given as:
The built-in physical interfaces in COMSOL, i.e. heat transfer in solids and fluids (ht), was selected, where the porous medium property has been also added into the physics in describing the heat transfer in the porous media. To simplify the model, the viscous dissipation during the flow is not considered in the energy balance. The temperature is the dependent variables and will be solved.
2.2.4. Multiphysics Coupling
With the previous individual physical interface being set up, it was identified that these physical interfaces are of Multiphysics nature, i.e., the heat transfer physics (ht) is coupled with the velocity field of cold and hot channel, which was calculated from two flow physics (spf and fp). In this case, the nonisothermal flow Multiphysics interfaces in COMSOL, are being enabled. Two nonisothermal flow Multiphysics coupling (nitf1, nitf2), which coupled the spf and ht, fp and ht respectively, were added into the model.
2.3. Material Property
Aluminium was selected as material of construction for the fins and parting sheet in the model, in order to mimic actual industrial liquefaction process. The catalyst used is the hydrous ferric oxide, commercially available under the trade name Ionex® [19]. The physical properties of the material are given in Table 2.
Accurately determining thermophysical properties such as densities, viscosities, and thermal conductivities of fluids, including both the cold (helium) and hot (hydrogen) media, is crucial for the precise simulation of the hydrogen liquefaction process.
State-of-art EoS for para-hydrogen, ortho-hydrogen and normal hydrogen has been developed by Leachman et al. [20]. The EoS is implemented in the thermodynamic property package, namely RefProp®, which was developed by National Institute of Standards and Technology (NIST) [21]. It provides comprehensive thermodynamic property data necessary for modelling cryogenic processes accurately.
In this work, helium is selected as the cold media to cool hydrogen down to cryogenic temperature and facilitate the ortho- to para- conversion. The thermodynamic properties of helium are also obtained from RefProp® to ensure consistency and accuracy in the simulation model.
Due to the absence of a direct interface between COMSOL Multiphysics® and RefProp®, a CAPE-OPEN interface [22] has been utilized. This interface facilitates seamless interoperability between COMSOL Multiphysics® and RefProp®, enabling the simulation software to access and utilize the thermodynamic properties calculated by RefProp®.
2.4. Boundary Conditions and Solver Setting
The CPFHE operates as a counter-current model for the hot and cold fluids. A practical heat exchanger can involve multi fins in the width direction. Due to the computation resource limitations, it is impractical to increase the number of fins in the width direction beyond what is showing in Figure 1(b). Therefore, asymmetric boundary conditions are applied to the left and right boundaries, while periodic boundary conditions are applied to the top and bottom boundaries. In this way, the 3D structure can be expanded effectively without increase the computation resource. In details:
Fluid Flow Calculation (spf and fp):
- Inlet Boundary: Normal inflow velocity is specified. The inlet velocity for the cold flow is denoted as V_in_cold, and for the hot flow as V_in_hot.
- Outlet Boundary: Specified as a pressure boundary with suppressed backflow.
- Wall Boundary: Non-slip wall boundary condition is applied to all walls.
- Asymmetric Boundaries: Left and right boundaries are set as asymmetric to accommodate the flow dynamics.
Ortho-para-hydrogen concentration calculation (tcs):
- Inlet Boundary: Specified as normal hydrogen consisting of 75% ortho-hydrogen and 25% para-hydrogen.
- Reaction Source: Includes a reaction source term considering the production of para-hydrogen from OPC.
- Asymmetric Boundaries: Left and right boundaries are set as asymmetric to capture concentration gradients effectively.
Temperature calculation (ht):
- Inlet Boundary: Fixed temperature is specified. The inlet temperature for the cold flow is T_in_cold, and for the hot flow is T_in_hot.
- Heat Source: Includes a heat source term accounting for the heat generated by the OPC reaction.
- Boundary Conditions: Left and right boundaries are set as asymmetric, while the top and bottom boundaries are set as periodic to simulate continuous heat exchange.
Solver Settings:
- Dependent variable: A segregated solver is employed to solve for eight dependent variables, which includes pressure (P1), velocity (v1), turbulent dissipation rate (ɛ) and turbulent kinetic energy (k) for the cold channel; pressure (P2) and velocity (v2) for the hot channel; temperature (T) for the entire heat exchanger; and parahydrogen mass fraction (ω) in the hot channel.
- Relative Tolerance: A relative tolerance of 1E-3 is set for each variable to ensure numerical stability and accuracy.
3. Results and Discussion
3.1. Model Verification
3.1.1. Mesh Size Setting
COMSOL Multiphysics® utilizes the finite element method (FEM) for computation. In FEM calculations, the modelling space is discretized using a mesh, and the accuracy of the solution depends directly on the mesh size. A refined mesh leads to a solution that more closely approximates the true solution.
For the simulation, a user-controlled mesh was employed. Free triangular mesh with distribution was applied to the three parting sheets, while a free tetrahedral mesh was used for the flow domain. To accurately capture thin boundary layers along the no-slip boundaries in fluid flow domain, a boundary layer mesh with dense element distribution normal to selected boundaries was applied. The boundary layer consists of five layers with a stretch factor of 1.2.
A simple case was configured for the simulation. The case does not include OPC reaction but with the following conditions:
- Both hot and cold flow inlet velocity set to V_in_cold= V_in_hot= 5 m/s;
- Hot flow inlet temperature T_in_hot= 77K and cold flow inlet temperature T_in_cold = 60K.
The results were obtained by solving the model with progressively finer meshes. Four different mesh sizes were tested:
- Coarse mesh with 890,000 elements;
- Normal mesh of 2.21million elements;
- Fine mesh of 4.46 million elements;
- Finer mesh of 8.87 million elements.
All the mesh sizes can produce similar temperature distribution profile of the PFHE, as showing in Figure 2(a) that derive from the result of fine mesh. This profile is characteristic of a counterflow heat exchanger. Uniform temperature difference between the cold and hot fluid along the flow path is evident, which is favourable for a uniform rate of heat transfer throughout the heat exchanger.
To facilitate comparison of the results from different mesh size, the logarithmic mean temperature difference (LMTD), which determines the temperature driving force for heat transfer in heat exchangers, was utilized.
LMTD is defined as:
Figure 2(b) displays the LMTD changes with the mesh size. As the mesh becomes finer, LMTD starts to converge, showing negligible differences between the fine and finer meshes. Considering both the computation time and the accuracy of the result, the fine mesh with 4.46 million elements was selected for further studies. A snapshot of the fine mesh for the 3D model is showing in Figure 3.
3.1.2. Verification of Heat Transfer
The performance of traditional PFHE with serrated fin structure in the absence of catalyst have been extensive studied. The first objective of the study is to validate the developed model’s accuracy in term of the prediction of heat transfer performance and pressure loss of PFHE.
To validate the modelling results, simulation cases were configured to calculate the overall heat transfer coefficient (U) of the heat exchanger. In the simulation, the gas velocity in the cold channel was varied while the gas velocity of hot channel remained constant. U is calculated based on:
The Colburn number (j) is commonly used to characterize the heat transfer performance. The Colburn number for serrated fins has been empirically correlated with Reynold number of flow and the fin structure parameters, given as [23]:
The hydraulic diameter of the fin is used for calculating the Reynold number and is defined from fin structural parameters, given as
The heat transfer coefficient (h) for both the cold and hot channels can be derived from the Colburn number, which is given as:
Given that the heat transfer areas in both the cold and hot channels are the same in the model, the overall heat transfer coefficient can be expressed as:
Comparing the overall heat transfer coefficient between the simulated case (Us from Equation 14) and the analytic correlation case (Ua from Equation 18) provides an indication of the model’s accuracy. The comparison, varying the Reynold number of the cold flow while keeping the Reynold number of hot flow fixed, is presented in Figure 4.
The model predicts that the overall heat transfer coefficient increases with the increase of the gas velocity, with Us ranging between 70 to 110 W/m2-K across the specified Reynold number range of the cold flow. The reported heat transfer coefficient for forced convention in PFHE typically ranges between 35 to 350 W/m2-K [24] and the model prediction falls within this range.
Quantitatively, however, the simulation results exhibit up to approximately 30% discrepancy compared to the results derived from the analytical correlation (Ua). This discrepancy could be due to different reasons. On one side, the derivation of the correlated Colburn number with Reynold number (Equation 15) was originally developed for a steam- air system [24], where the wall temperature remains constant due to steam condensation, a condition significantly different from our cryogenic modelling system. On the other hand, the experimental data used for derivation the Colburn number correlation reports an error band of approximately 20% [23]. Considering these factors, the accuracy of the current model is deemed acceptable within practical engineering tolerances.
3.1.3. Verification of Pressure Drop
The model was further verified in terms of friction associated with pressure drop (Δp). To achieve this, a simulation case was established to calculate the pressure loss correlation with the gas flow Reynold number. In this simulation, the inlet gas velocity of cold channel was varied, and the pressure loss (Δp) was computed. The Fanning friction factor (fF), a dimensionless number used to analyze fluid friction in pipes, can be determined from the pressure loss as:
The fanning friction factor for serrated fins, correlated with Reynold number and fin structure parameters, has been derived from the literature [23], given as:
The comparison the fF,s and fF,a is shown in Figure 5. The model predicts that the fF,s decreases with the increase of Re, which fits with the trend derived from analytical correlation (fF,a). At low Reynold number, the simulated results agree well with the value derived from the correlation. However, discrepancies increase with the increase of Reynold number, reaching up to 20% at Reynold number of 3000.
Potential reasons for these discrepancies include the accuracy limitations of k−ϵ model in simulating turbulence flow at high Reynold number. Additionally, the derivation of Fanning friction factor (Equation 20) correlation is reported with an experimental error band of approximately ±20% [23].
With the verification results and the above considerations, the validity of the developed 3D model can be confirmed with an acceptable level of accuracy in predicting the heat transfer and pressure loss characteristics of the PFHE.
3.1.4. Verification of Kinetic Models
Three kinetics models for the OPC reaction that were developed in the literature were evaluated in here.
The parameters are given in Table 3.
The kinetic parameters are given in Table 5.
For all the three models, is the equilibrium ortho concertation, which is temperature dependent and can be calculated as [10]:
Hutchinson [11] conducted extensive experimental work to measure the OPC kinetics at LN2 temperature under various pressure using a 1/4" OD x 1/8" ID copper tube reactor with a length of 5 inches. To verify the kinetic models, a simulation case based on an isothermal plug flow model was set up. In the plug flow model, the inlet gas velocity was varied, resulting in a range of gas hourly specific velocity (GHSV, min-1), defined as the actual flow rate per unit bulk volume of the catalyst, and the outlet parahydrogen concentration was predicted.
The simulation case was compared with the experimental data at a pressure of 2.06 bar and temperature of 76K [11]. The comparison is given in Figure 6. It is evident that only the Elovich model can quantitatively predict the experimental data, while the other two models yielded significantly different results. It is not clear the cause of such significant deviation of other two kinetic models at this stage. Therefore, the Elovich kinetic model was chosen for the further studies.
It is important to note that Hutchinson defines GHSV as the actual flow rate per unit bulk volume of the catalyst. This definition complicates comparisons across different temperature and pressure. Therefore, another definition is also used in this study, known as the Gas Hourly Space Velocity at Standard Temperature and Pressure (GHSV_STP, min⁻¹), which represents the flow rate at standard temperature and pressure (STP) per unit bulk volume of the catalyst. Generally, GHSV_STP is larger than GHSV.
3.2. General Description of the Features of CPFHE
This section provides a general description of a default simulation case of CPFHE focused on the hot channel. The simulated parameters are set as follows: T_in_hot=77K, V_in_hot=0.2 m/s (corresponding to GHSV_STP= 465 min-1), T_in_cold=60K, V_in_cold=5 m/s, while the pressure maintained at atmosphere level. It is noted that the simulated case exhibits a significant mass ratio between the cold side and the hot side (m_cold /m_hot= 63.8), indicating the heat transfer is not the controlling factor in the scenario.
The present study employs a three-dimensional approach, enabling observation of the actual flow field in both channels. To visualize the velocity distribution more clearly, a 2D velocity profile of a section of the cross-section of the hot channel (parallel to the flow direction with 0.003 m above the bottom parting sheet) is shown in Figure 7.
The model accurately predicts the wall effect on the flow field, where the flow velocity is zero at the wall. A boundary layer grows over the fin surface and is abruptly disrupted at the end of fin length. Additionally, a low-velocity zone is observed at the tip of fin outlet, while velocities are high at the gap between the front and back fins. The periodic variations in gas velocity contribute to improved heat transfer performance [25]. It is anticipated that a shorter fin length could enhance heat transfer performance due to the increased frequence of high and low velocity change and shorter boundary layer, however this may lead to an increase of pressure loss. This analysis aligns with the findings of Xu et al. [16], who systematically studied the effect of structure parameter of a PFHE on both heat transfer performance and pressure loss.
A temperature profile of the cross-section fin channels (taken vertically to the flow direction, positioned 0.05 m away from the hot inlet) and temperature distribution along the fin width (taken at half of the fin height) are showing in Figure 8. Observations indicate that the temperature distribution on the hot side is more unform compared to the cold side, attributed to the presence of catalyst particles. The temperature of the parting sheet is closer to that of hot side, suggesting that the primary heat transfer resistance occurs on the cold side. The temperature distribution along half of the fin height further illustrates these characteristics, emphasizing the influence of catalyst presence on thermal uniformity and heat transfer dynamics within the plate fin heat exchanger.
The parahydrogen distribution in one of the hot channels is illustrated in Figure 9. The concentration of para-hydrogen is non-uniform within the small fin channel and shows a reverse correlation with the temperature. Specifically, the para concentration is higher at the fin wall due to lower temperatures, while it decreases towards the middle of fin. This observation suggested that despite the compact geometry, there is room for improvement in heat transfer within the fin channels.
The previous discussion reveals a non-uniform distribution of temperature in both hot and cold channel and a non-uniform distribution of parahydrogen concentration within hot channel of the CPFHE. For practical performance analysis, focusing on average values is of interest. The average temperature distribution along the axial length of hot side is presented in Figure 10.
In the simulated case, due to the significant flow of cooling media, the hot side experience rapid cooling, resulting in a pronounced temperature drop at the inlet. From a heat transfer perspective, this operation model is suboptimal, leading to increased exergetic losses due to inefficient utilization the cold energy. However, this cooling pattern is desirable from OPC kinetics standpoint. The OPC kinetics are driven by the difference between the para concentration and equilibrium para concentration, where the latter is temperature- dependent. As illustrated in Figure 10, the maximum kinetics rate occurs at the inlet of hot side, followed by a decrease along the flow direction.
Figure 11 depicts the para concentration along the axial length of flow direction, accompanied by the calculated equilibrium para concentration using equation (28). The equilibrium para concentration stabilizes shortly after the inlet, while the actual para concentration increases gradually due to the kinetic constraints.
To assess the efficiency of OPC reaction, a parameter Rp, defined as the ratio of actual para concertation to the equilibrium para concentration, is used to quantify the analysis. Achieving Rp = 1 indicates that the para concentration has reaches the equilibrium, so that the entropy loss due to ortho para conversion will be minimized. In the simulated case with the specified GHSV-STP, Rp at the heat exchanger exit reaches 0.95.
3.3. Sensitivity Analysis of CPFHE Model
This section conducts a sensitivity analysis to investigate the performance of CPFHE by varying the heat transfer parameters (through change the gas flow velocities on the cold and hot channels), OPC kinetics (through changes in the kinetic constant) and reaction pressure. This approach aims to deepen our understanding of CPFHE performance. The Reynold number (based on hydraulic diameter) for the hot side ranges from 50 to 220, while it varies between 800 to 3300 on the cold side.
3.3.1. GHSV Effect
To investigate the effect of GHSV, the inlet velocity of hot side was varied while keeping other parameters constant.
As the inlet velocity of hot side increases (resulting in an increase in GHSV or a decrease in the mass flow ratio between cold and hot media, i.e. m_c/m_h), the heat transfer U also increases, as shown in Figure 12, indicating an overall improvement in heat transfer performance of the heat exchanger. This improvement is further validated by the increase in outlet temperature of cold side with higher hot side velocity. It is important to note that in this analysis, the cold media flow is always in excess (m_c/m_h>10), ensuring that heat transfer is not the constrained factor.
This is example 2 of an equation:
Figure 13 illustrates the variation of Rp at the heat exchanger outlet with GHSV-STP. It is observed that Rp decreases as GHSV-STP increase. At low GHSV (approximately 500 min-1), Rp can reach 0.95, indicating close approach to equilibrium. However, at higher GHSV (around 2300 min-1), Rp drops significantly to 0.64. The low para concentration at outlet suggested that the kinetic is the constraint of the CPFHE.
In term of heat transfer, cold media is utilized to remove both heat generated from the OPC reaction and the latent heat of the hot media. To quantify this, another parameter, Rh, defined as the ratio of the heat required to remove the OPC reaction to the total required heat, is also plotted in Figure 13. Rh decreases as GHSV increases, indicating that more heat is used to remove the latent heat of hydrogen than the OPC reaction heat.
The study of GHSV presents conflicting outcomes where an improvement in heat transfer coincides with a decrease in OPC efficiency with the increase of hot flow velocity.
3.3.2. Cooling Effects
For large-scale of hydrogen liquefiers, it is crucial that the heat exchanger efficiently handles high volumes of gas flow at a fixed catalyst volume (i.e. large GHSV-STP) without compromising Rp. In our analysis, achieving Rp of 0.95 at GHSV-STP of 2300 min-1 was set as the goal, although this specific GHSV value may not be directly apply to any practical hydrogen liquefication applications.
Figure 14 illustrates the effects of heat transfer by varying the flow rate of cold media at a fixed GHSV-STP of 2300 min-1. The heat transfer coefficient (U) initial increase rapidly with increasing flow rate of the cold media, and it becomes less responsive at higher flow rate. Conversely, the outlet temperature of cold media decreases with higher flow rate, indicating inefficient utilization of cold energy and potential for increased entropy loss.
At the high GHSV-STP of 2300 min-1, although increasing the flow rate of cold media improves heat transfer, Rp remains approximately 0.65, as showing in Figure 15. Simultaneously, Rh stabilizes around 0.35. This suggested that at high GHSV, kinetic limitations predominate, limiting the production of para and rending cooling less impactful. To achieve higher Rp under these conditions, improving the kinetics parameters of current catalyst would be necessary.
The cooling effect studies demonstrate scenarios where increasing the flow rate of cold media enhances the heat transfer but does not have any positive effects on the OPC efficiency.
3.3.3. OPC Kinetic Effects
The performance was further investigated by varying the OPC reaction rate at fixed GHSV-STP of 2300 min-1, where the reaction rate of the original value of Elovich model was increase five and ten times. Figure 16 illustrates the effect of the OPC reaction rate and cold flow rate on overall heat transfer coefficient.
It is evident that increasing the reaction rate significantly enhances the overall heat transfer coefficient. The OPC reaction is exothermic, and higher reaction rate leads to increased heat released from the OPC reaction. The heat release elevates the local temperature within the catalyst channel, creating a stronger driving force for heat transfer between the hot and cold channels. Consequently, this results in a higher overall heat transfer coefficient, which is advantageous from a heat transfer point of view.
Figure 17 shows that as the reaction rate increases, Rp initially increases with increasing cold flow rate, stabilizing at higher values for larger cold flow. This indicates that at lower cold flow rates, increased kinetic parameters may make heat transfer the limiting factor. In such case, enhancing the heat transfer by increasing the cold flow can improve OPC efficiency.
Additionally, Rp increases significantly with higher reaction rate. At the heat exchanger outlet, Rp reaches 0.92 with five times of the original reaction rate and exceeds 0.98 at ten times of reaction rate for large cold flow. The high Rp is favourable from kinetic standpoint.
OPC kinetic studies demonstrates scenarios where increasing OPC reaction rate improves both heat transfer and the OPC efficiency simultaneously.
3.3.4. Effect of Operating Pressure
The effect of operating pressure in the hot channel on OPC performance was investigated at a constant GHSV-STP of 2300 min-1. To achieve this, the inlet velocity of hot media was adjusted accordingly as operating pressure increased. Figure 18 plots the Rp as a function of operating pressure ranging from 1 to 30 bars.
The results indicate that operating pressure positively impacts OPC performance, leading to improved para concentration. The increase in para concentration at higher pressure could be attributed to enhanced physical adsorption of hydrogen on the catalyst surface [26]. Experimental data by Weitzel [27] also support this observation, showing a small but definite increase in conversion over a pressure range of 1.37 to 27.6 bar (20 to 400 psig). The model predictions align with these trends. However, this improvement is relatively minor as indicated by the increase in Rp by a little over 0.015 in the pressure range employed.
3.3.5. Pressure Drop
With the development of catalyst of improved kinetics, achieving a high Rp at large GHSV is feasible. However, incorporating catalysts into the hot channel increases pressure drop, especially at high GHSV, resulting in significant energy loss.
To quantify the pressure drop in the hot channel, a simulated case was set up to derive the pressure drop varying with hot gas velocity (accordingly with the GHSV_STP). The result was given in Figure 19. The simulation results clear indicated that the pressure drop increases linearly with the increase of gas velocity.
The actual frictional pressure drop in the hot channel with catalyst includes contributions from both the catalyst bed and the heat transfer fins. It has been noted that the contribution from the fins can be neglected, as it is one to two orders of magnitude lower than that of the packed bed [10]. Thus, the pressure drop can be estimated using Darcy law as expressed as:
The pressure drop calculated using Darcy law is also plotted in Figure 19 for comparison, showing good agreement with the simulated results. It is evident that increasing GHSV results in high pressure drop, with pressure drop reaching approximately 400 kPa/m at a GHSV of 2300 min-1, which is substantial.
3.4. Discussion
PFHEs are widely utilized in various energy-intensive process industry as compact heat exchanger. However, the incorporation of catalyst into the fin channel to function as both a chemical reactor and a heat exchanger (CPFHE) has been relatively underexplored. CPFHE face two primary constraints when applied to OPC: OPC kinetic limitations and heat transfer considerations. The optimal operation goal for CPFHE is to achieve a high Rp under high GHSV while maintaining a thermally efficient design, necessitating an optimized cooling system inherently coupled with the OPC reaction.
PFHE can achieve a high heat transfer surface area up to 1000 m2/m3. Additionally, small hydraulic diameter of inserted fins enhances the fluid turbulence, thereby boosting local convective heat transfer coefficient. From a chemical reactor point of view, the hot channel side of CPFHE function as micro fix-bed reactor, with reactor size determined by GHSV. The preferred GHSV value for the OPC reactors is not well-documented in the research area. However, for reference, typical steam methane reformers operated with GHSV range of 10,000 h-1 to 30, 000h-1. Our default case operates at GHSV_STP= 465 min-1, which falls in the range.
At GHSV_STP= 465 min-1, it appears that the heat transfer is rarely the limiting factor for CPFHE due to the high heat transfer coefficient inherent to PFHE. Close-to-equilibrium para concentration can also be achieved at this GHSV. Therefore, both heat transfer and kinetic constraint can be effectively managed.
Figure 12 presents an unoptimized scenario with high-capacity cooling, where the hot side cools rapidly, causing excessive temperature declines at the entrance. The rapid cooling enhances the OPC reaction rate but results to unfavourable heat exchange design, as the available heat transfer area is underutilized. Moreover, rapid cooling demands increased coolant supply effort without fully utilizing cold energy [13]. This can be remedied by either increasing the hot side flow rate or decreasing the cold side flow rate to achieve an optimized heat exchanger design.
In the context of a large-scale hydrogen liquefier, high gas throughput often necessitates a large GHSV. At large GHSV, it becomes challenging for the outlet para concentration to reach equilibrium value. Increasing heat transfer does not significantly improve the para concentration, and a slight improvement is observed with increased reaction pressure. This underscores that kinetics are the controlling factor due to the current low catalytic activity.
According to Wilhelmsen et al. [12], doubling the catalytic activity compared to Ionex® can reduce the exergy destruction by 9%. This study investigates catalyst with five to ten times greater activity, highlighting the critical need to reach a high Rp at high GHSV. Those catalysts with improved activity have been reported in the literature [28]. With highly active catalyst, inadequate cooling may necessitate compromising Rp. The fin structure significantly impacts heat transfer performance, a well- studied area beyond the scope of this work. Increasing the flow rate of both cold and heat media can enhance the heat transfer. However, increase the hot flow rate is not advisable as para concentration is limited by GHSV. Simulation suggests that increasing the cold flow rate can satisfy the heat transfer requirements. Importantly, the heat transfer coefficient improves with higher OPC activity, offering a dual advantage for catalysts with improved performance. Firstly, achieving a high Rp under high GHSV allows for a reduction in reactor size. Secondly, improved heat transfer coefficient can potentially decrease the heat exchange size or lower cold media the flow rate.
One additional property may be crucial for the newly developed catalyst is its thermal conductivity. As shown in Figure 8, there is a non-uniform temperature distribution inside the small fin channel packed with catalyst. Increasing the gas velocity enhances convective heat transfer, which can improve the temperature uniformity within the fins. However, as discussed, this approach is unsuitable for enhancing the para conversion due to the resulting high GHSV.
An alternative approach to enhancing heat transfer within the fin channels involves develop a catalyst with high thermal conductivity, thereby promoting the conductive heat transfer. To validate this hypothesis, a simulation was conducted by increasing the thermal conductivity of the catalyst by a factor of 10, while keeping all other parameters consistent with those given Figure 8. Figure 20 presents the temperature distribution across the width of the fin at half fin height for the modified case. A noticeable improvement in temperature uniformity on the hot side is observed compared to the results in Figure 8. Consequently, this enhancement has led to a 2.4% increase in the overall heat transfer coefficient.
Pressure drop is a critical consideration in the design and optimizing of CPFHE. Minimizing pressure drop is essential from energy- saving perspective. Designing the fin type and plate pattern plays a key role in achieving this goal, a topic extensively explored in existing literature [29,30]. This study specifically investigates the influence of catalyst addition on pressure drop.
Given current kinetic constraints, gas velocity within the catalyst bed in hot channel is limited, yet still results in significant pressure drop. The calculated pressure drop is approximately 400 kPa/m at a GHSV of 2300 min-1 when the operation is at atmosphere. Conducting reactions at elevated pressures can help mitigate this issue. Pressure drop in the catalyst channel is directly influenced by superficial gas velocity. Operating at higher pressure, as prescribed by specified GHSV-STP, reduces gas superficial velocity within the catalyst bed, thereby lowering the pressure drop. For instance, at an operating pressure of 20 bar, gas superficial velocity is approximately 1/20th compared to that at atmospheric pressure, resulting in an estimated pressure loss of 20 kPa/m.
A common guideline suggested that the pressure drop should not exceed 20% of the inlet pressure [31]. For a GHSV-STP of 2300 min-1 and an operation pressure is 20 bar, the estimated pressure drop is 20 KPa/m. For the large PFHE with a length of 5 meters, this translates to a pressure loss of approximately one bar, which can meet the pressure drop requirement.
While higher operating pressures positively impact CPFHE performance, the effect is marginal. Therefore, operating at higher pressures is recommended for CPFHE efficiency.
To optimize the CPFHE design under various operating conditions, the exergy destruction analysis of the CPFHE proposed by Wilhelmsen et al. [12] can be employed. This analysis identifies the exergy destruction and lost work in the CPFHE originating from heat transfer, pressure drop and OPC. The existing studies primarily focus on CPFHE performance through the heat transfer and OPC kinetic, with limited exploration on minimizing the exergy destruction during the heat transfer process.
Furthermore, these studies are confined to LN2 temperature at 77K. At temperatures below 40 K, significant changes in thermodynamic properties of ortho-para-hydrogen may render finding less applicable. Further research should thus explore optimizing temperatures, pressures, OPC kinetic parameters and refrigerant compositions. This optimization should be conducted in conjunction with comprehensive process simulation utilizing advanced 3D heat exchanger models developed in this study.
4. Conclusions
A Multiphysics model incorporating the 3D fin structure and the governing equations was developed and applied to assess the performance of a catalyst filled plate fin heat exchanger applied to OPC during hydrogen liquefaction. The conclusions drawn from this study are as follows:
- (1)
- Despite the compact nature of PFHE with fin spacing in millimetre scale, simulations reveal non-uniform temperature distribution within the fin channels. The addition of catalyst improves the temperature uniformity, with catalyst possessing high thermal conductivity further enhancing this uniformity.
- (2)
- Increase the gas velocities of both hot and cold media in the CPFHE channels can enhance the overall heat transfer coefficient. However, higher gas velocities in the hot channel results in large GHSV, thus compromising OPC performance.
- (3)
- In large-scale hydrogen liquefaction systems requiring high GHSV, OPC kinetics predominately dictate the CPFHE performance. Improving heat transfer alone does not enhance OPC performance; instead, developing catalysts with enhanced activity is crucial.
- (4)
- Incorporating catalyst into fin channels increases pressure drop significantly, however, the increase operating pressure will mitigate this, which also positively impact OPC performance.
- (5)
- Optimizing CPFHE operating parameters necessitates minimizing exergy destruction due to heat transfer, pressure loss, and OPC reaction.
These findings underscore the complex interplay between heat transfer, OPC catalytic activity, pressure drop in CPFHE design for hydrogen liquefaction. Future research should focus on further optimizing catalyst properties and operating conditions to maximize overall efficiency and performance.
Author Contributions
Conceptualization, L.T. and D.Y.; methodology, L.T. and J.O.; formal analysis, W.T.; writing—original draft preparation, L.T.; writing—review and editing, D.Y. and W.T. All authors have read and agreed to the published version of the manuscript.
Funding
This research was funded by CSIRO H2 Future Science Platform.
Conflicts of Interest
The authors declare no conflicts of interest.
Nomenclature
A is the total heat transfer area, m2
A(h,c,w) is the heat transfer area of hot /cold channel/ parting sheet, m2
Cp is the specific heat capacity, J/kg-K
CH2 is the molar concentration of hydrogen, mol/m3
Dh is the hydraulic diameter of the fin, m
Ea is the activation energy of OPC reaction, J/mol
is the Fanning friction factor from simulation/ analytical correlation, -
F is the volume force vector, N/m3
FF is viscous force due to Forchheimer and Ergun option, N/m3
ha,(h,c) is the heat transfer coefficient for cold / hot channel, W/m2-K
I is the identity matrix, -
is transport of chemical species (i) due to diffusion, mol/m2-s
j(a) is the Colburn number, -
is the effective thermal conductivity, W/m-K
kp is the permeability of catalyst bed, m2
K is the viscous stress tensor, Pa
and M is the molar mass of species i and mixture, g/mol
Pk is the production of turbulent kinetic energy, m2/s3
Pc is critical pressure of hydrogen, MPa
P is the pressure, Pa
Δp is the pressure loss, Pa
q is the heat flux by conduction, W/m2
is the mass source, kg/m3-s
Q is total heat transferred, W
Qconv is the heat of conversion, J/mol.
is the reaction rate expression for the species i, mol/m3-s.
Re is the Reynolds number, calculated as ,-
Tc is the critical temperature of hydrogen, K
T is the temperature, K
ΔT(A,B): is the temperature difference between the two fluids at end A/B, K
u is the gas velocity, m/s
U(s,a) is the overall heat transfer coefficient calculated from simulation or analytical correlation, W/m2-K
V is the velocity vector, m/s
is the mole fraction of species i and can be calculated as , -
Greek symbols
k represents the turbulent kinetic energy, m2/s2
ɛ represents the turbulent dissipation, m2/s3
is the porosity of catalyst bed, -
is fin temperature effectiveness of the cold /hot channel, -
µ is the fluid dynamic viscosity, Pa-s
is the eddy viscosity and is given as , m2/s
is the mass fraction of species (i), -
ρ is the density, kg/m3
λ(h,c,w) is the thermal conductivity of fluid or hot /cold channel/ parting sheet, W/m-K,
Subscript
a from analytic correlation
c cold side
h hot side
s from numerical simulation
w parting sheet
References
- Al Ghafri, S.Z.S., S. Munro, U. Cardella, T. Funke, W. Notardonato, J.P.M. Trusler, J. Leachman, R. Span, S. Kamiya, G. Pearce, A. Swanger, E.D. Rodriguez, P. Bajada, F.Y. Jiao, K. Peng, A. Siahvashi, M.L. Johns, and E.F. May, Hydrogen liquefaction: a review of the fundamental physics, engineering practice and future opportunities. Energy Environ. Sci., 2022. 15: p. 2690-2731. [CrossRef]
- Aziz, M., Liquid Hydrogen: A Review on Liquefaction, Storage, Transportation, and Safety. Energies, 2021. 14(18): p. 5917. [CrossRef]
- Lipman, M.S., H. Cheung, and O.P. Roberts, Continuous conversion hydrogen liquefaction. Chemical Engineering Progress, 1963. 59(8): p. 49-54.
- Teng, J.J., K. Wang, S.L. Zhu, S.R. Bao, X.Q. Zhi, X.B. Zhang, and L.M. Qiu, Comparative study on thermodynamic performance of hydrogen liquefaction processes with various ortho-para hydrogen conversion methods. Energy, 2023. 271 p. 127016. [CrossRef]
- Krasae-in, S., J.H. Stang, and P. Neksa, Development of large-scale hydrogen liquefaction processes from 1898 to 2009. International Journal of Hydrogen Energy, 2010. 35: p. 4524-4533. [CrossRef]
- Xu, P., J. Wen, K. Li, S.M. Wang, and Y.Z. Li, Review of the continuous catalytic ortho-para hydrogen conversion technology for hydrogen liquefaction. International Journal of Hydrogen Energy, 2024. 62(7): p. 473-487. [CrossRef]
- Popov, D., K. Fikiin, B. Stankov, G. Alvarez, M. Youbi-Idrissi, A. Damas, J. Evans, and T. Brown, Cryogenic heat exchangers for process cooling and renewable energy storage: A review. Applied Thermal Engineering, 2019. 153: p. 275-290. [CrossRef]
- London, A.L. and R.K. shah, Offset Rectangular Plate-Fin Surfaces—Heat Transfer and Flow Friction Characteristics. J. Eng. Gas Turbines Power, 1968. 90(3): p. 218-228. [CrossRef]
- Wang, Z. and Y.Z. Li, Layer pattern thermal design and optimization for multistream plate-fin heat exchangers—A review. Renewable and Sustainable Energy Reviews, 2016. 53: p. 500–514. [CrossRef]
- Meagher, J.P., Modelling of hydrogen liquefiers with kinetic conversion of ortho to para hydrogen in plate-fin heat excahngers, in Department of Chemical and Biological Engineering. 2009, University at Buffalo, State University of New York.
- Hutchinson, H.L., Analysis of Catalytic Ortho-Parahydrogen Reaction Mechanisms., in Department of Chemical Engineering. 1966, University of Colorado.
- Wilhelmsen, Ø., D. Berstad, A. Aasen , P. Neksa° , and G. Skaugen, Reducing the exergy destruction in the cryogenic heat exchangers of hydrogen liquefaction processes. International Journal of Hydrogen Energy, 2018. 43: p. 5033-5047. [CrossRef]
- Donaubauer, P.J., U. Cardella, L. Decker, and H. Klein, Kinetics and Heat Exchanger Design for Catalytic Ortho-Para Hydrogen Conversion during Liquefaction. Chemical Engineering Technology, 2019. 42(3): p. 669-679. [CrossRef]
- Park , J., H. Lim , G.H. Rhee, and S.W. Karng, Catalyst filled heat exchanger for hydrogen liquefaction. International Journal of Heat and Mass Transfer, 2021. 170 p. 121007. [CrossRef]
- O’Neill, K.T., S. Al Ghafri, B. da Silva Falc˜ao, L.G. Tang, K. Kozielski, and M.L. Johns, Hydrogen ortho-para conversion: process sensitivities and optimisation. Chemical Engineering & Processing: Process Intensification, 2023. 184 p. 109272. [CrossRef]
- Xu, P., G. Lei, Y.Y. Xu, J. Wen, S.M. Wang, and Y.Z. Li, Study on continuous cooling process coupled with ortho-para hydrogen conversion in plate-fin heat exchanger filled with catalyst. International Journal of Hydrogen Energy, 2022. 47(7): p. 4690-4703. [CrossRef]
- Zhu, S.L., J.J. Teng, X.Q. Zhi, S.R. Bao, L.M. Qiu, and K. Wang, Numerical study on comprehensive performance of flow and heat transfer coupled with ortho-para hydrogen conversion. International Journal of Heat and Mass Transfer, 2023. 201 p. 123653. [CrossRef]
- COMSOL Multiphysics Reference Manual v. 6.2. 2023, COMSOL, Inc, www.comsol.com: Stockholm, Sweden.
- Molecular products Inc. Ionex® Type OP catalyst. [cited 2024; Available from: https://www.molecularproducts.com/products/ionex-type-op-catalyst.
- Leachman, J.W., R.T. Jacobsen, S.G. Penoncello, and E.W. Lemmon, Fundamental Equations of State for Parahydrogen, Normal Hydrogen, and Orthohydrogen. J. Phys. Chem. Ref. Data, , 2009. 38(3): p. 721-748. [CrossRef]
- Lemmon, E.W., I.H. Bell, M.L. Huber, and M.O. McLinden. NIST Standard Reference Database 23, NIST Reference Fluid Thermodynamic and Transport Properties, version 10.0. 2018; Available from: https://www.nist.gov/srd/refprop.
- van Baten, J. REFPROP CAPE-OPEN Property Package Manager. 2024; Available from: https://www.amsterchem.com/refpropco.html.
- Manglik, R.M. and A.E. Bergles, Heat Transfer and Pressure Drop Correlations for the Rectangular Offset Strip Fin Compact Heat Exchanger. Experimental Thermal and Fluid Science, 1995. 10: p. 171-180. [CrossRef]
- Kays, W.M. and A.L. London, Compact Heat Exchangers. 2018: Vinod Kumar Jain, Scientific International (Pvt.) Ltd.
- Webb, R.L. and N.H. Kim, Principles of Enhanced Heat Transfer (2nd Edition). 2005: Taylor & Francis Group.
- Schmauch, G.E. and A.H. Singleton, Technical aspects of ortho-parahydrogen conversion. Industrial and Engineering Chemistry, 1964. 56(5): p. 20-31. [CrossRef]
- Weitzel, D.H., C.C. Van Valin, and J.W. Draper. Design data for ortho-parahydrogen converters. in Cryogenic Engineering Conference. 1957. Boulder, Colorado.
- Wakao, N., J.M. Smith, and P.W. Selwood, The low-temperature orthohydrogen conversion over supported oxides and metals. Journal of Catalysis, 1962. 1: p. 62-73. [CrossRef]
- Wieting, A.R., Empirical Correlations for Heat Transfer and Flow Friction Characteristics of Rectangular Offset-Fin Plate-Fin Heat Exchangers. Transactions of the ASME, 1975: p. 488-490. [CrossRef]
- Yang, H.Z., Y.Y. Li, Y. Yang, Y.G. Zhu, and J. Wen, Effect of surface efficiency on the thermal design of plate-fin heat exchangers with passages stack arrangement. International Journal of Heat and Mass Transfer, 2019. 143: p. 118494. [CrossRef]
- Pérez-Ramírez, J., R.J. Berger, G. Mul, F. Kapteijn, and J.A. Moulijn, The six-flow reactor technology: a review on fast catalyst screening and kinetic studies. Catal Today, 2000. 60 p. 93-109.
Figure 1.
(a) Primitive serrated fin structure; (b)3D structure of PFHE formed from the primitive serrated fin.
Figure 1.
(a) Primitive serrated fin structure; (b)3D structure of PFHE formed from the primitive serrated fin.
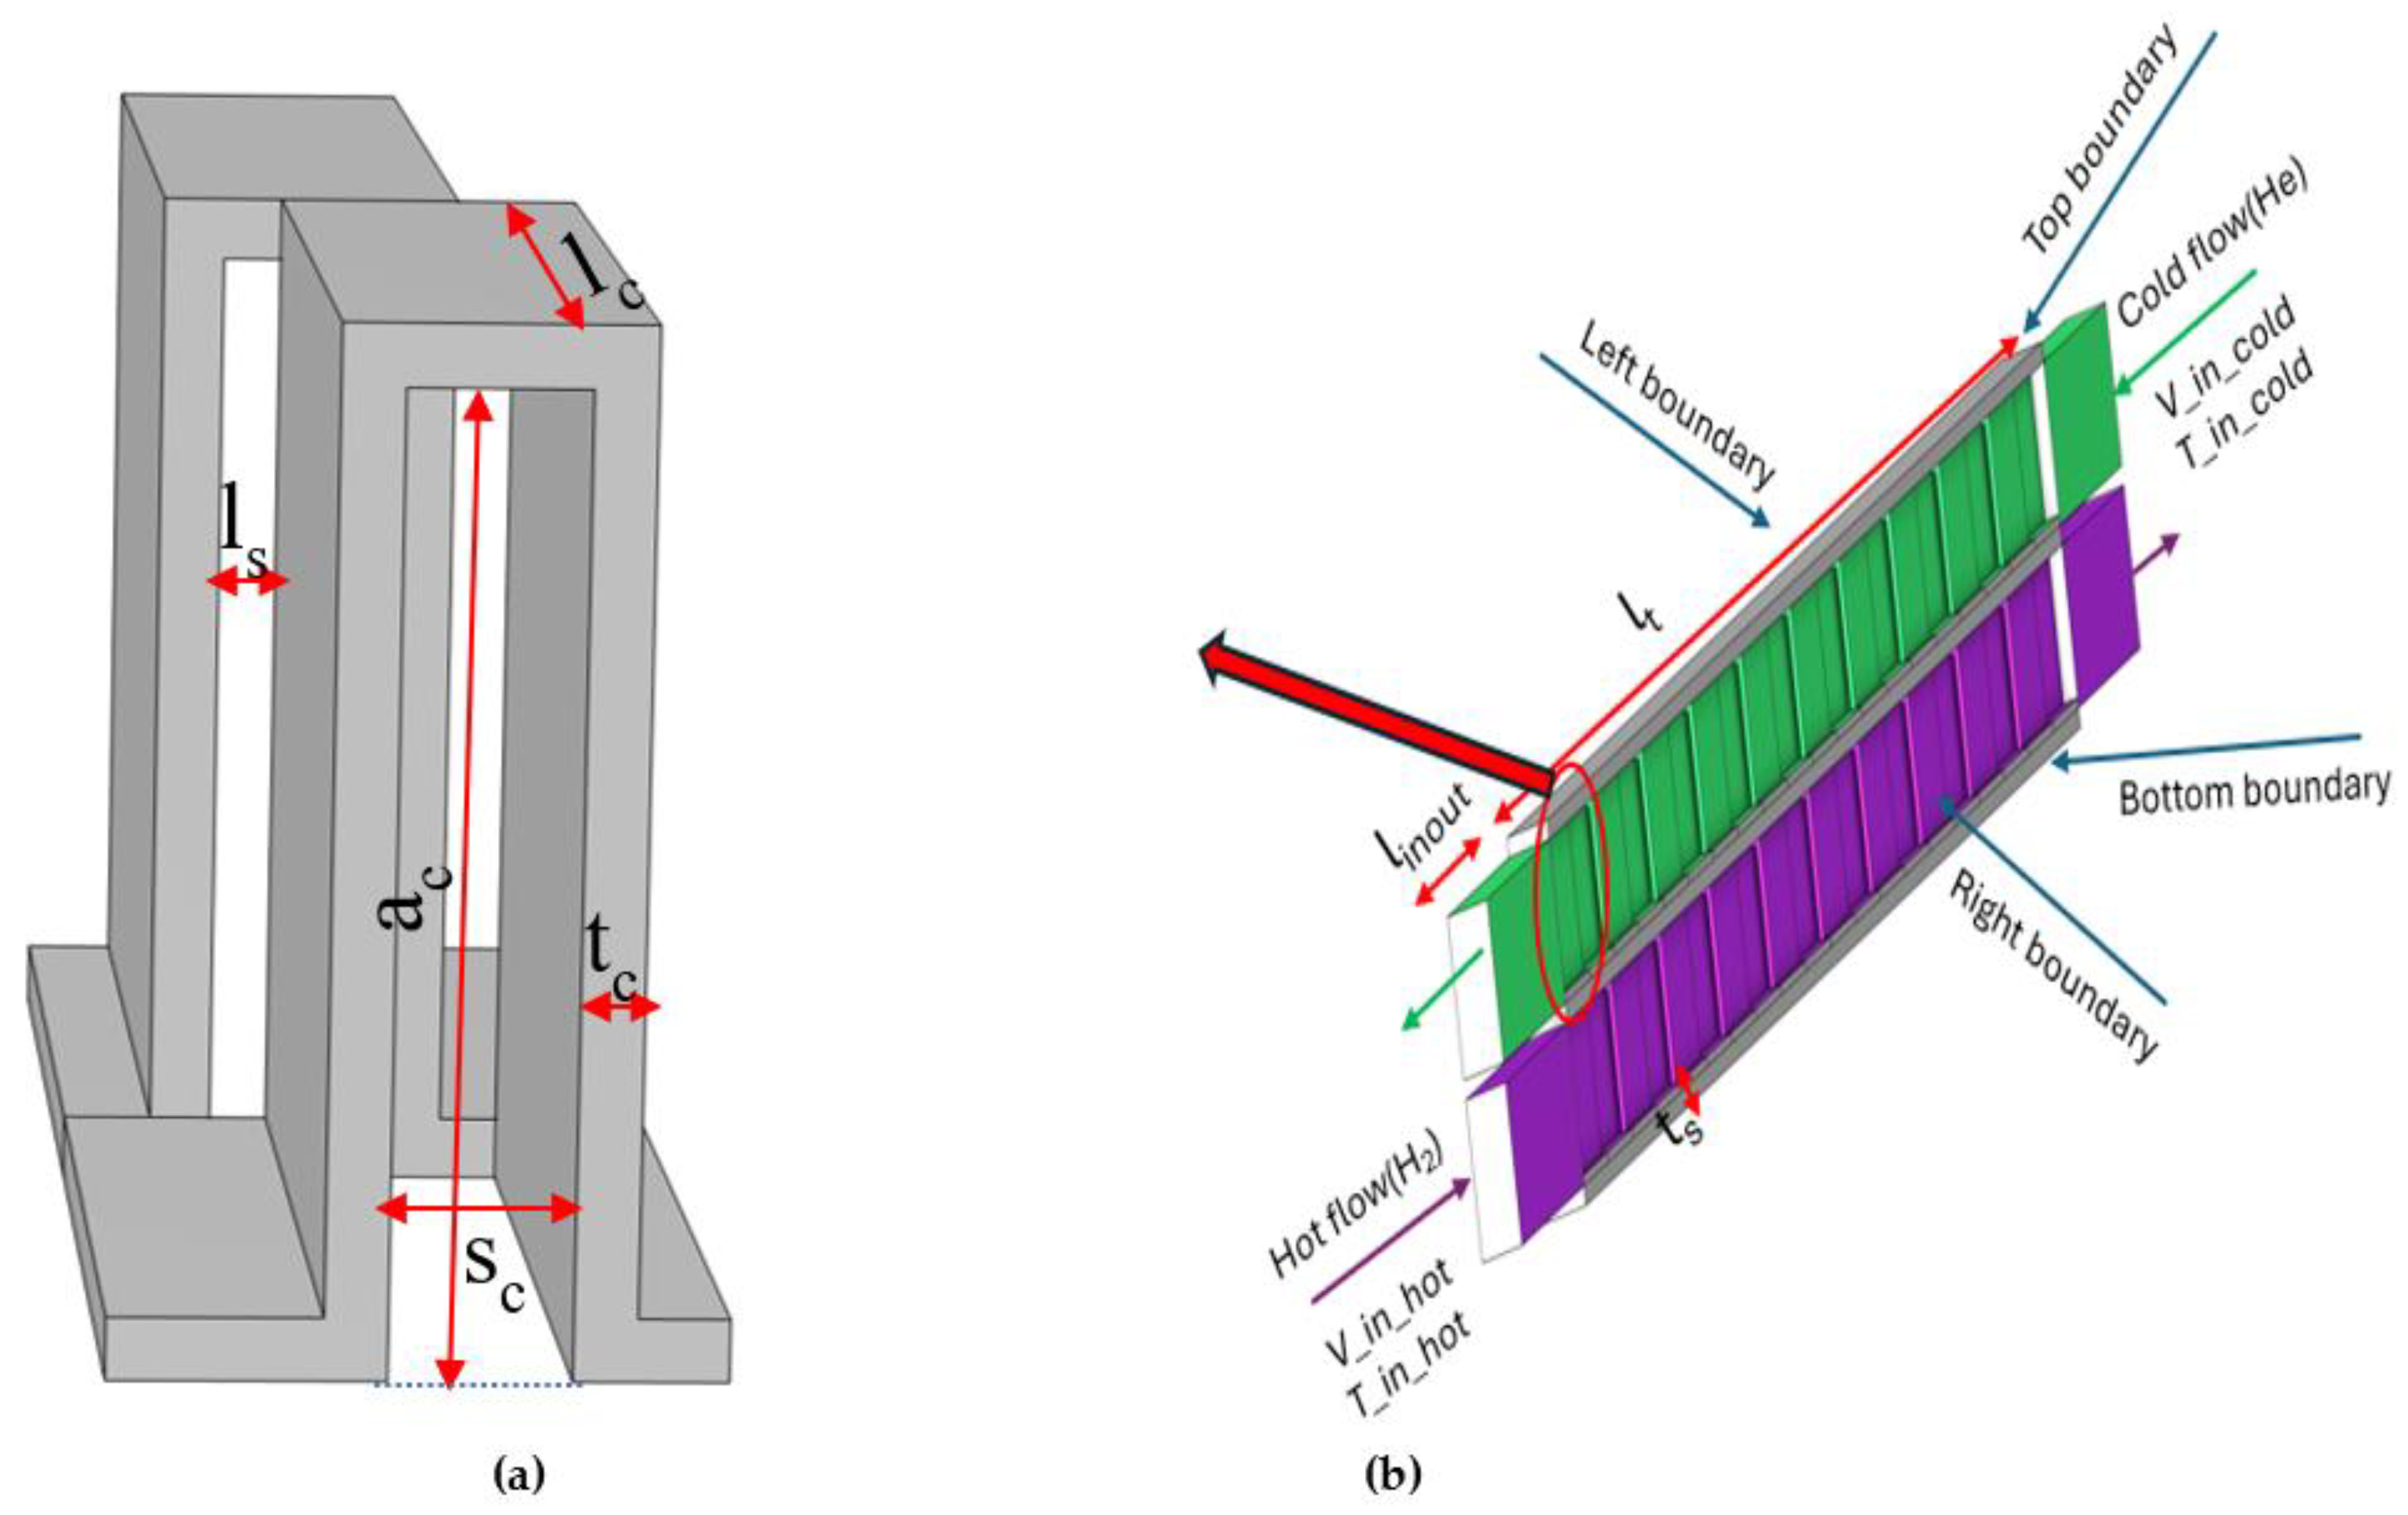
Figure 2.
(a) Temperature profile along the flow path for the hot and cold channels derived from fine mesh; (b) Effect of the mesh size on the logarithmic mean temperature difference.
Figure 2.
(a) Temperature profile along the flow path for the hot and cold channels derived from fine mesh; (b) Effect of the mesh size on the logarithmic mean temperature difference.
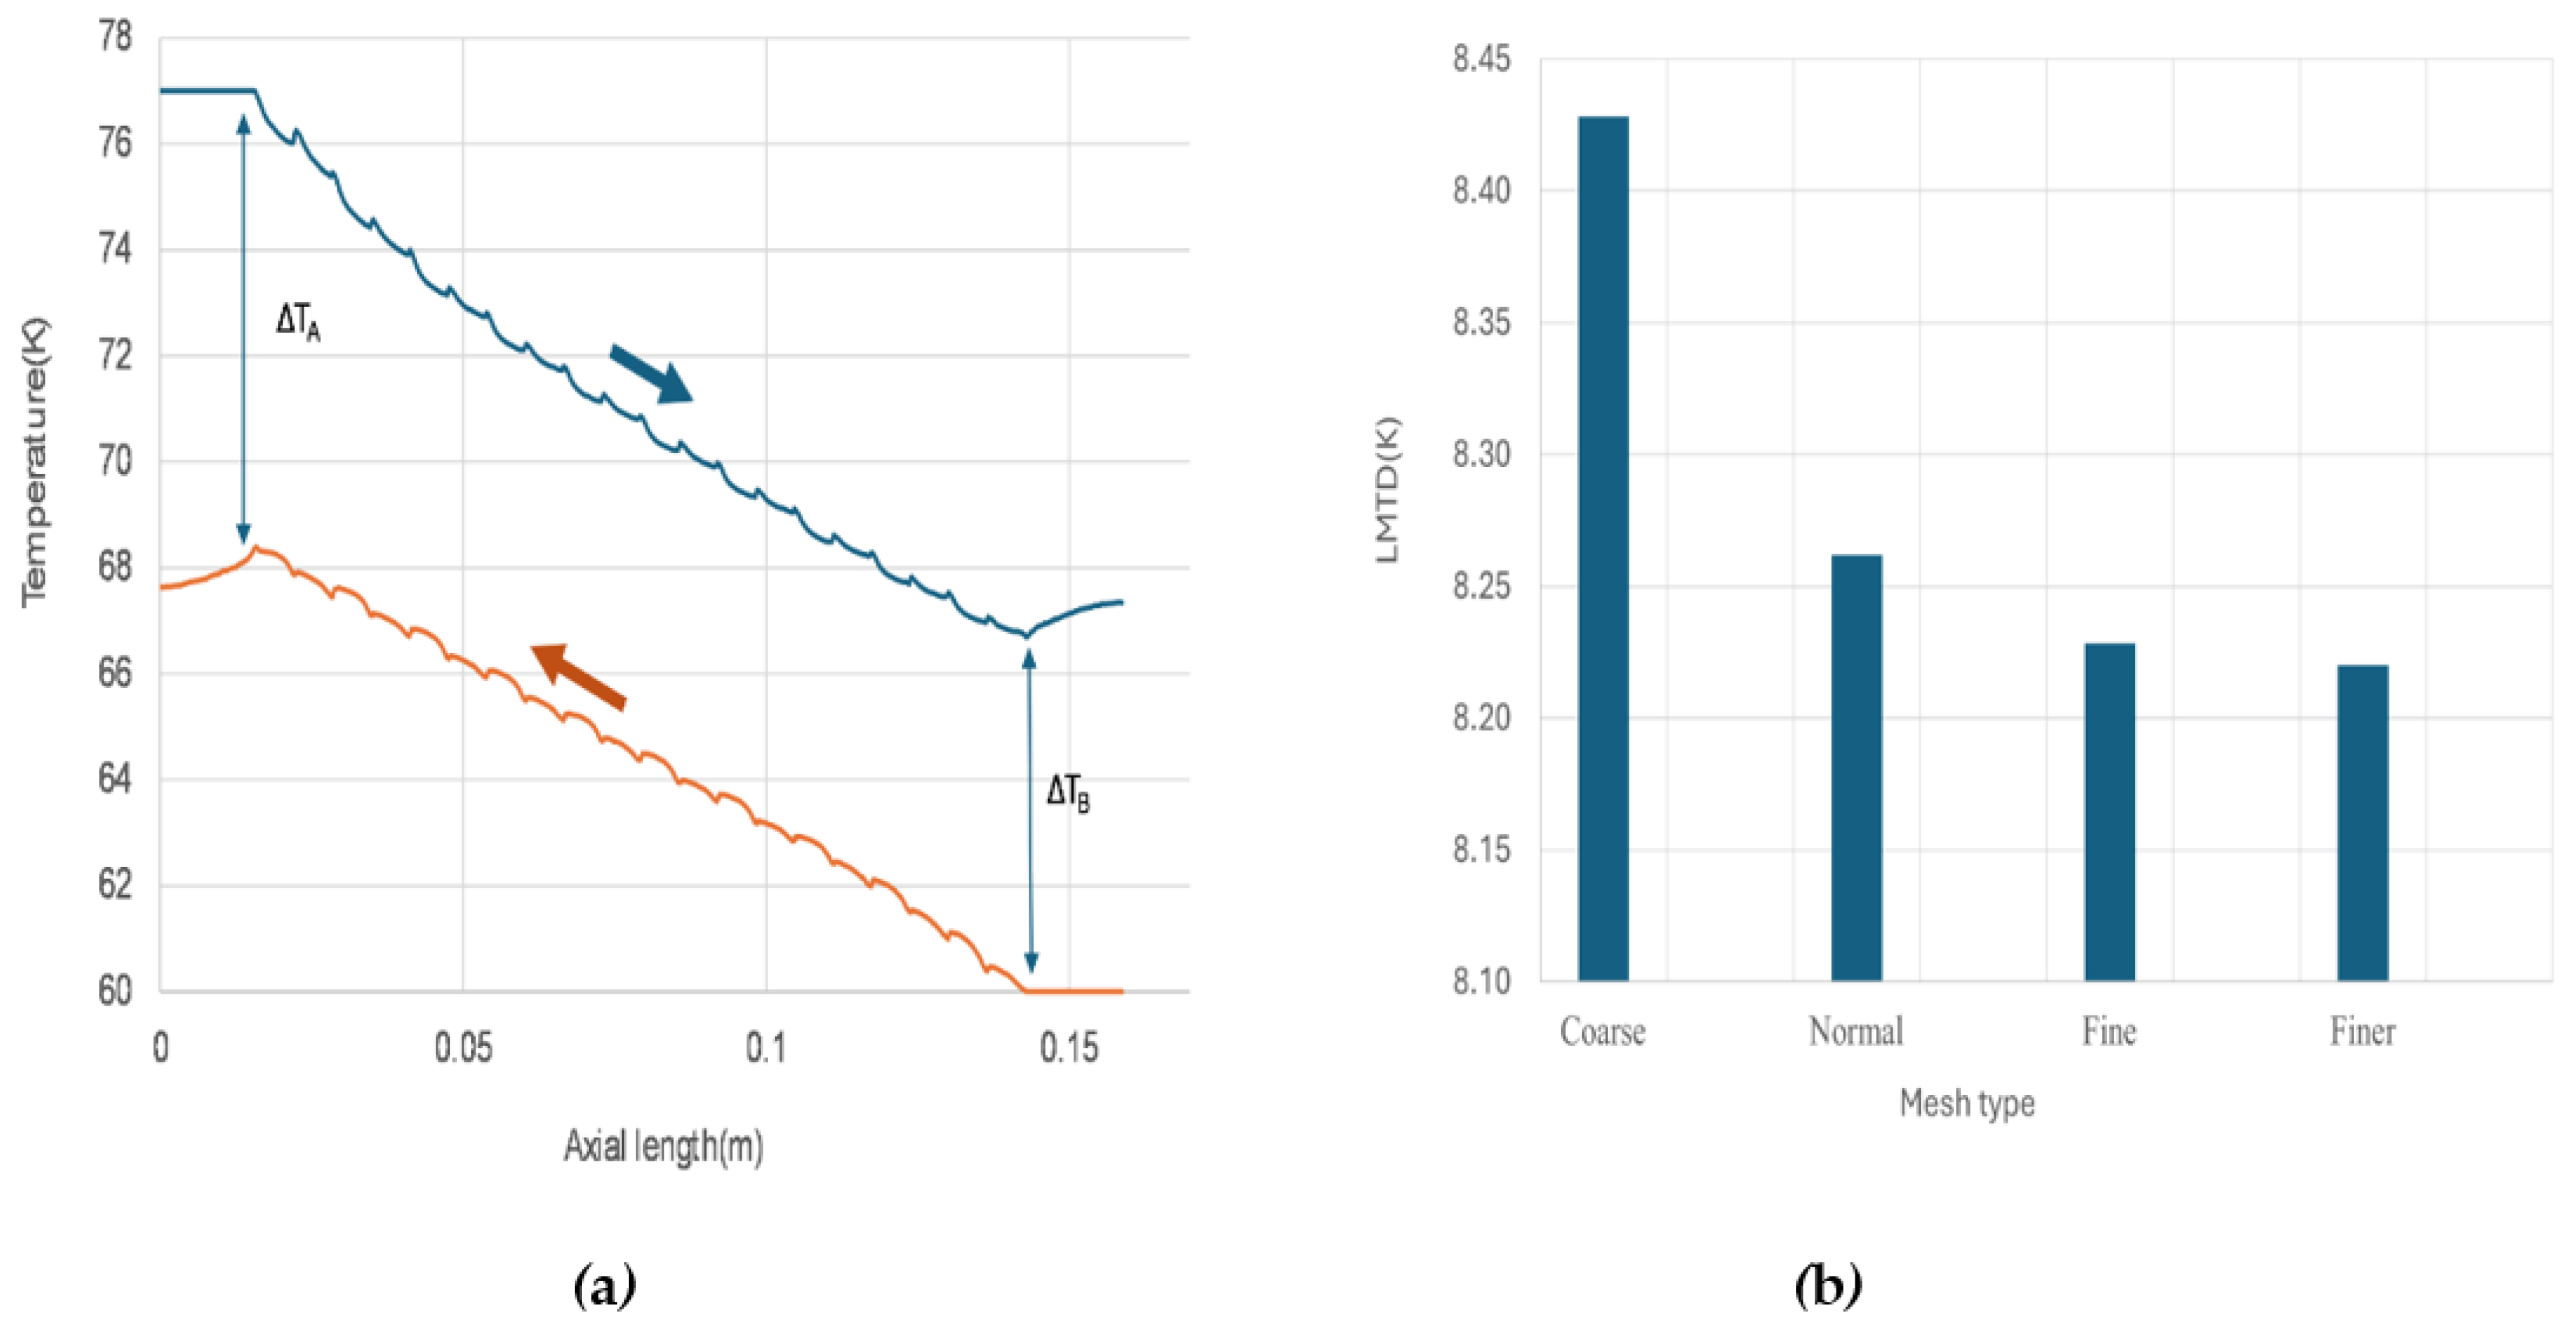
Figure 3.
Fine mesh used for model simulation; * two boundaries have been removed from the top channel to demonstrate the mesh inside the flow channel.
Figure 3.
Fine mesh used for model simulation; * two boundaries have been removed from the top channel to demonstrate the mesh inside the flow channel.
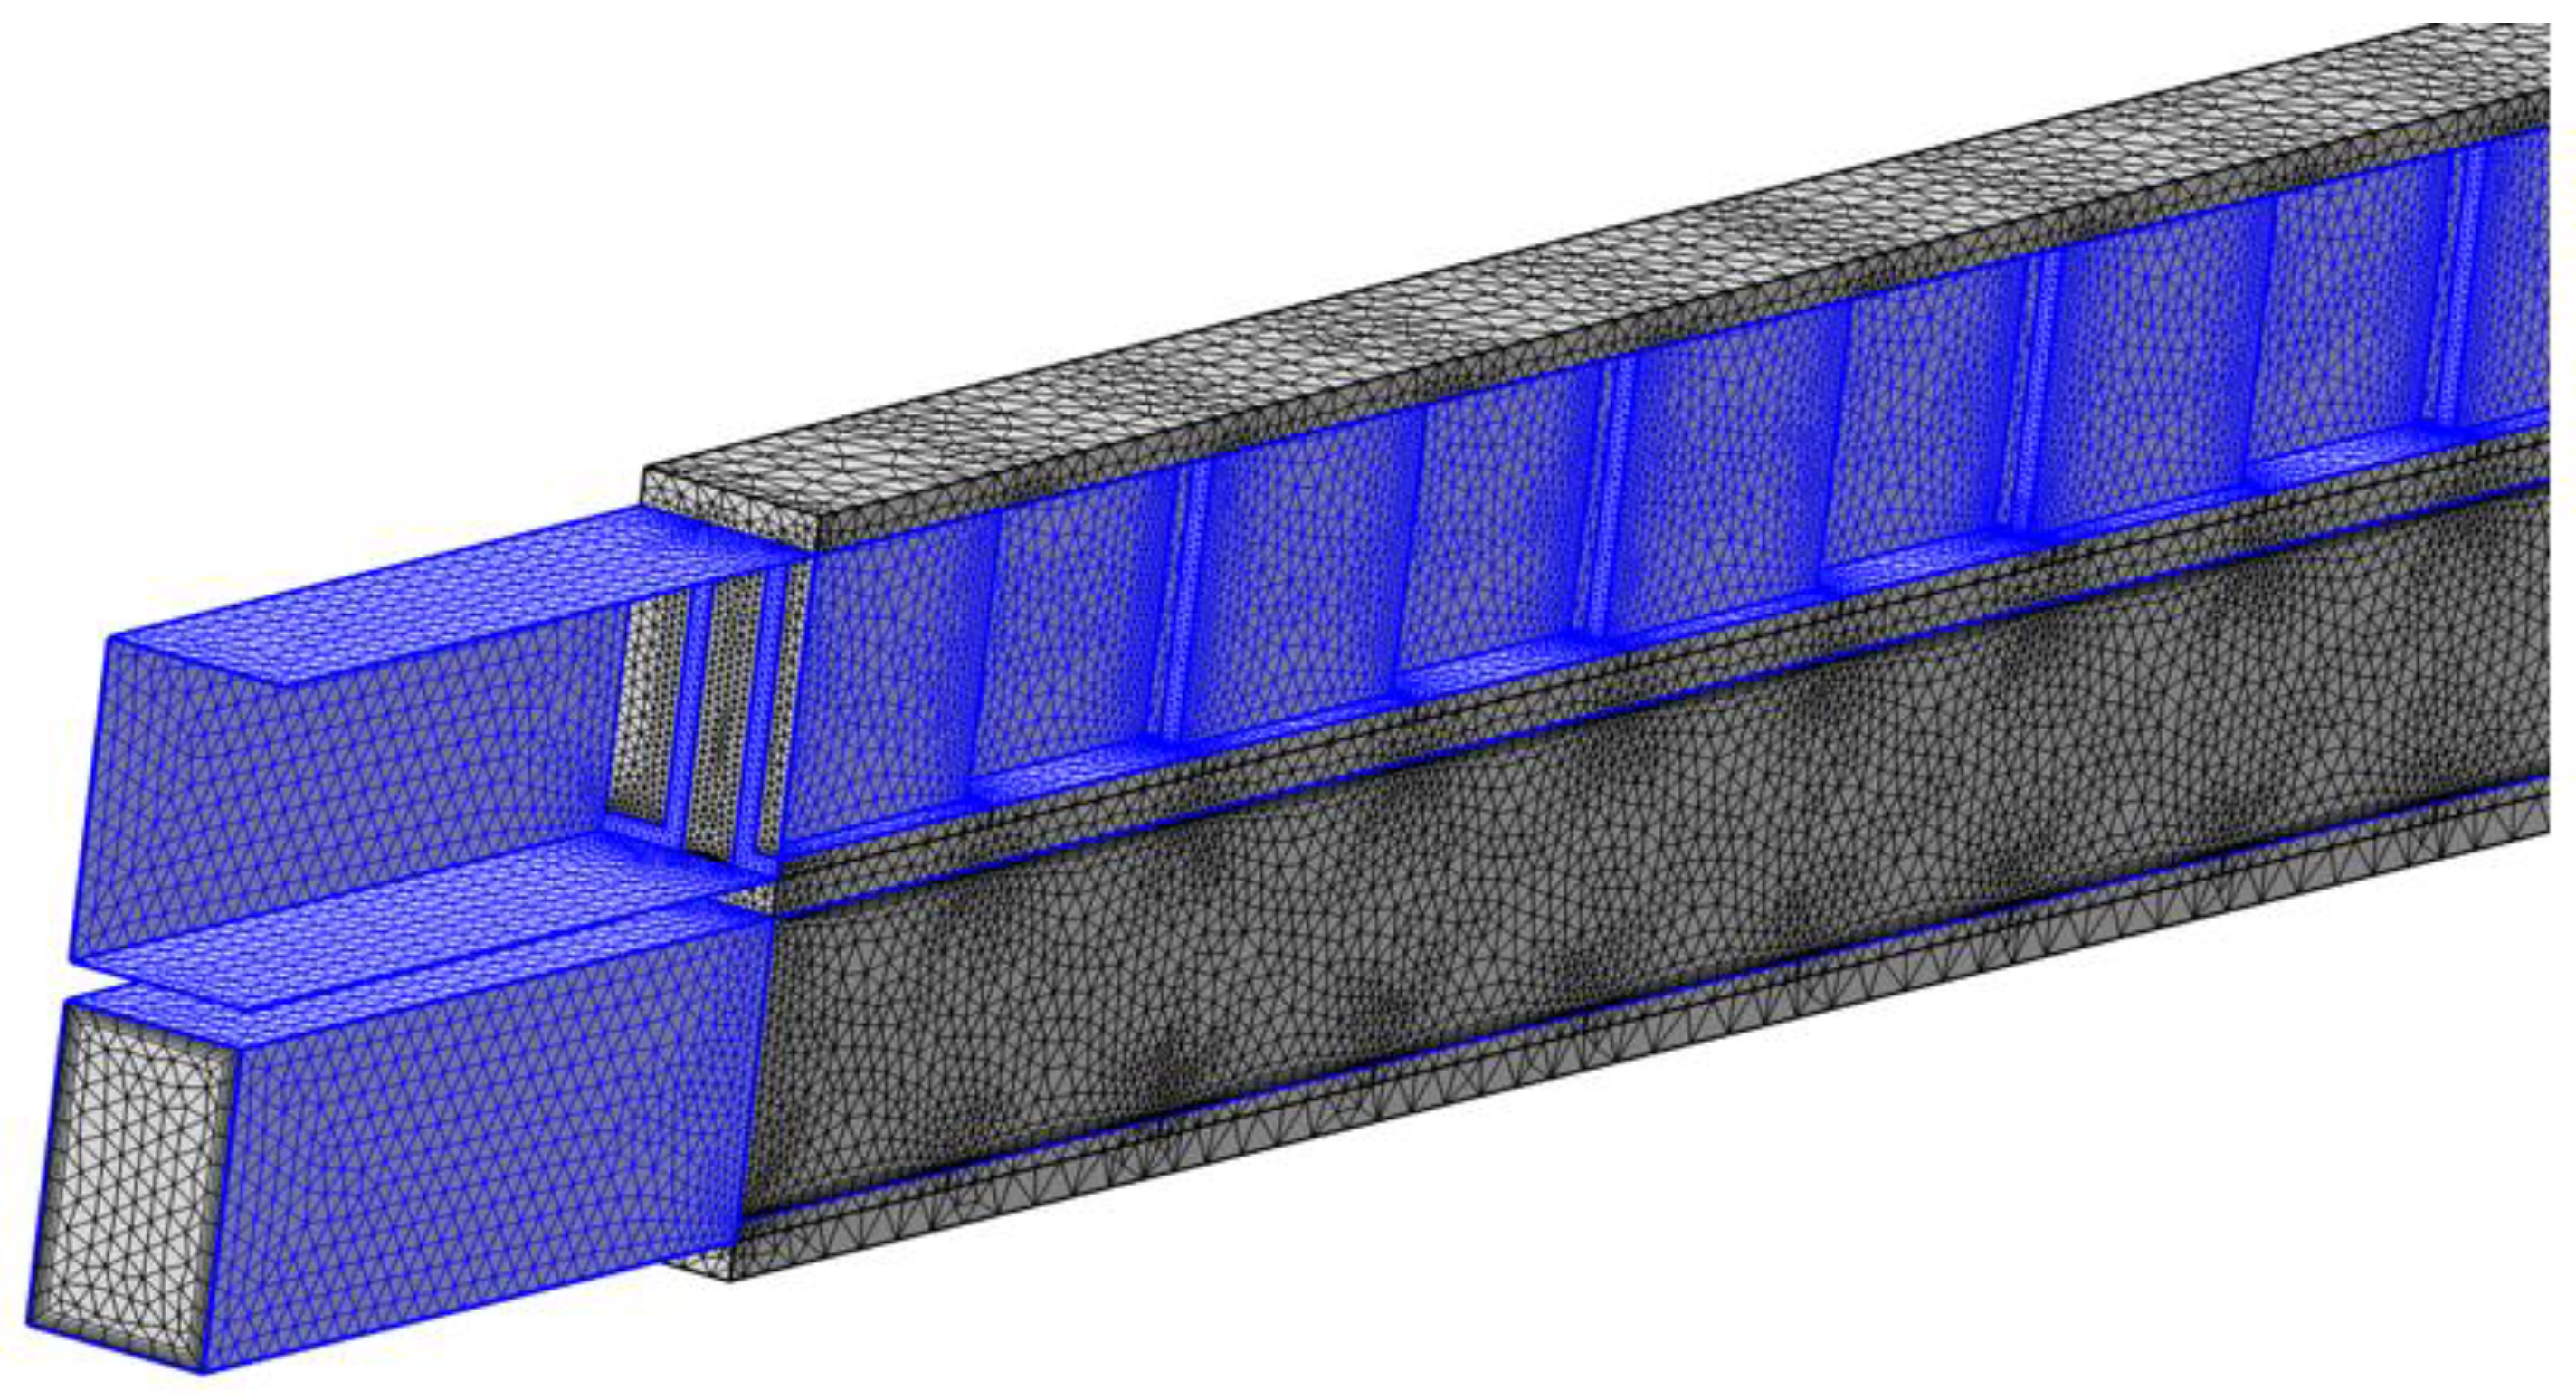
Figure 4.
Comparing the overall heat transfer coefficient derived from the numerical simulation and analytic correlation approach.
Figure 4.
Comparing the overall heat transfer coefficient derived from the numerical simulation and analytic correlation approach.
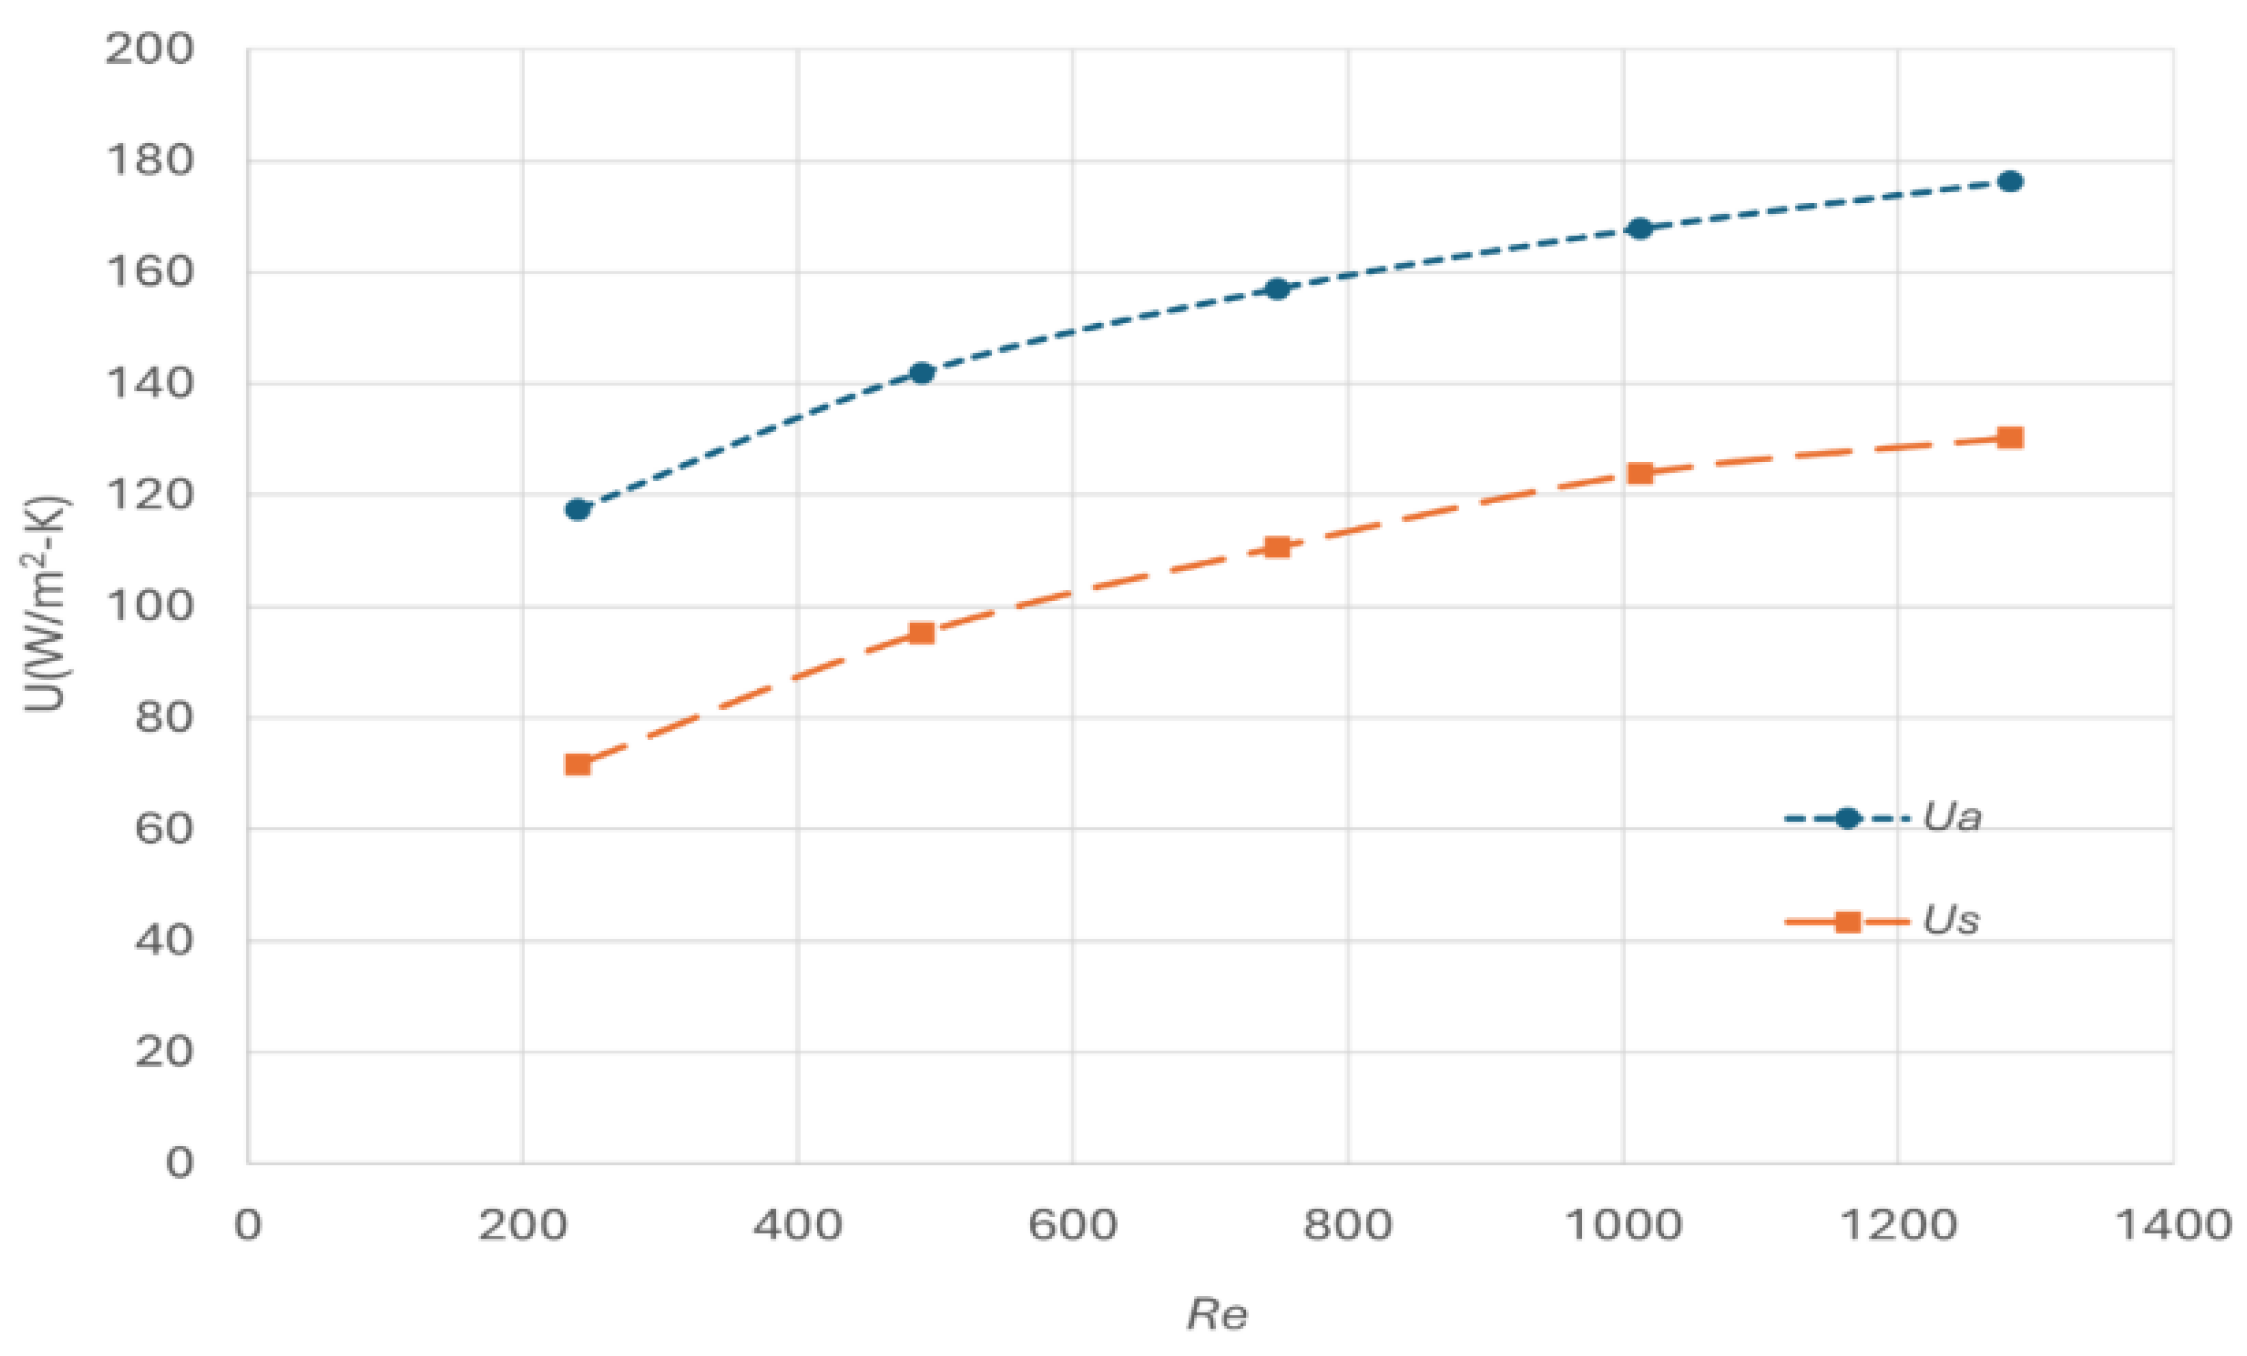
Figure 5.
Comparing the fanning friction factor derived from the simulation and analytical correlation.
Figure 5.
Comparing the fanning friction factor derived from the simulation and analytical correlation.
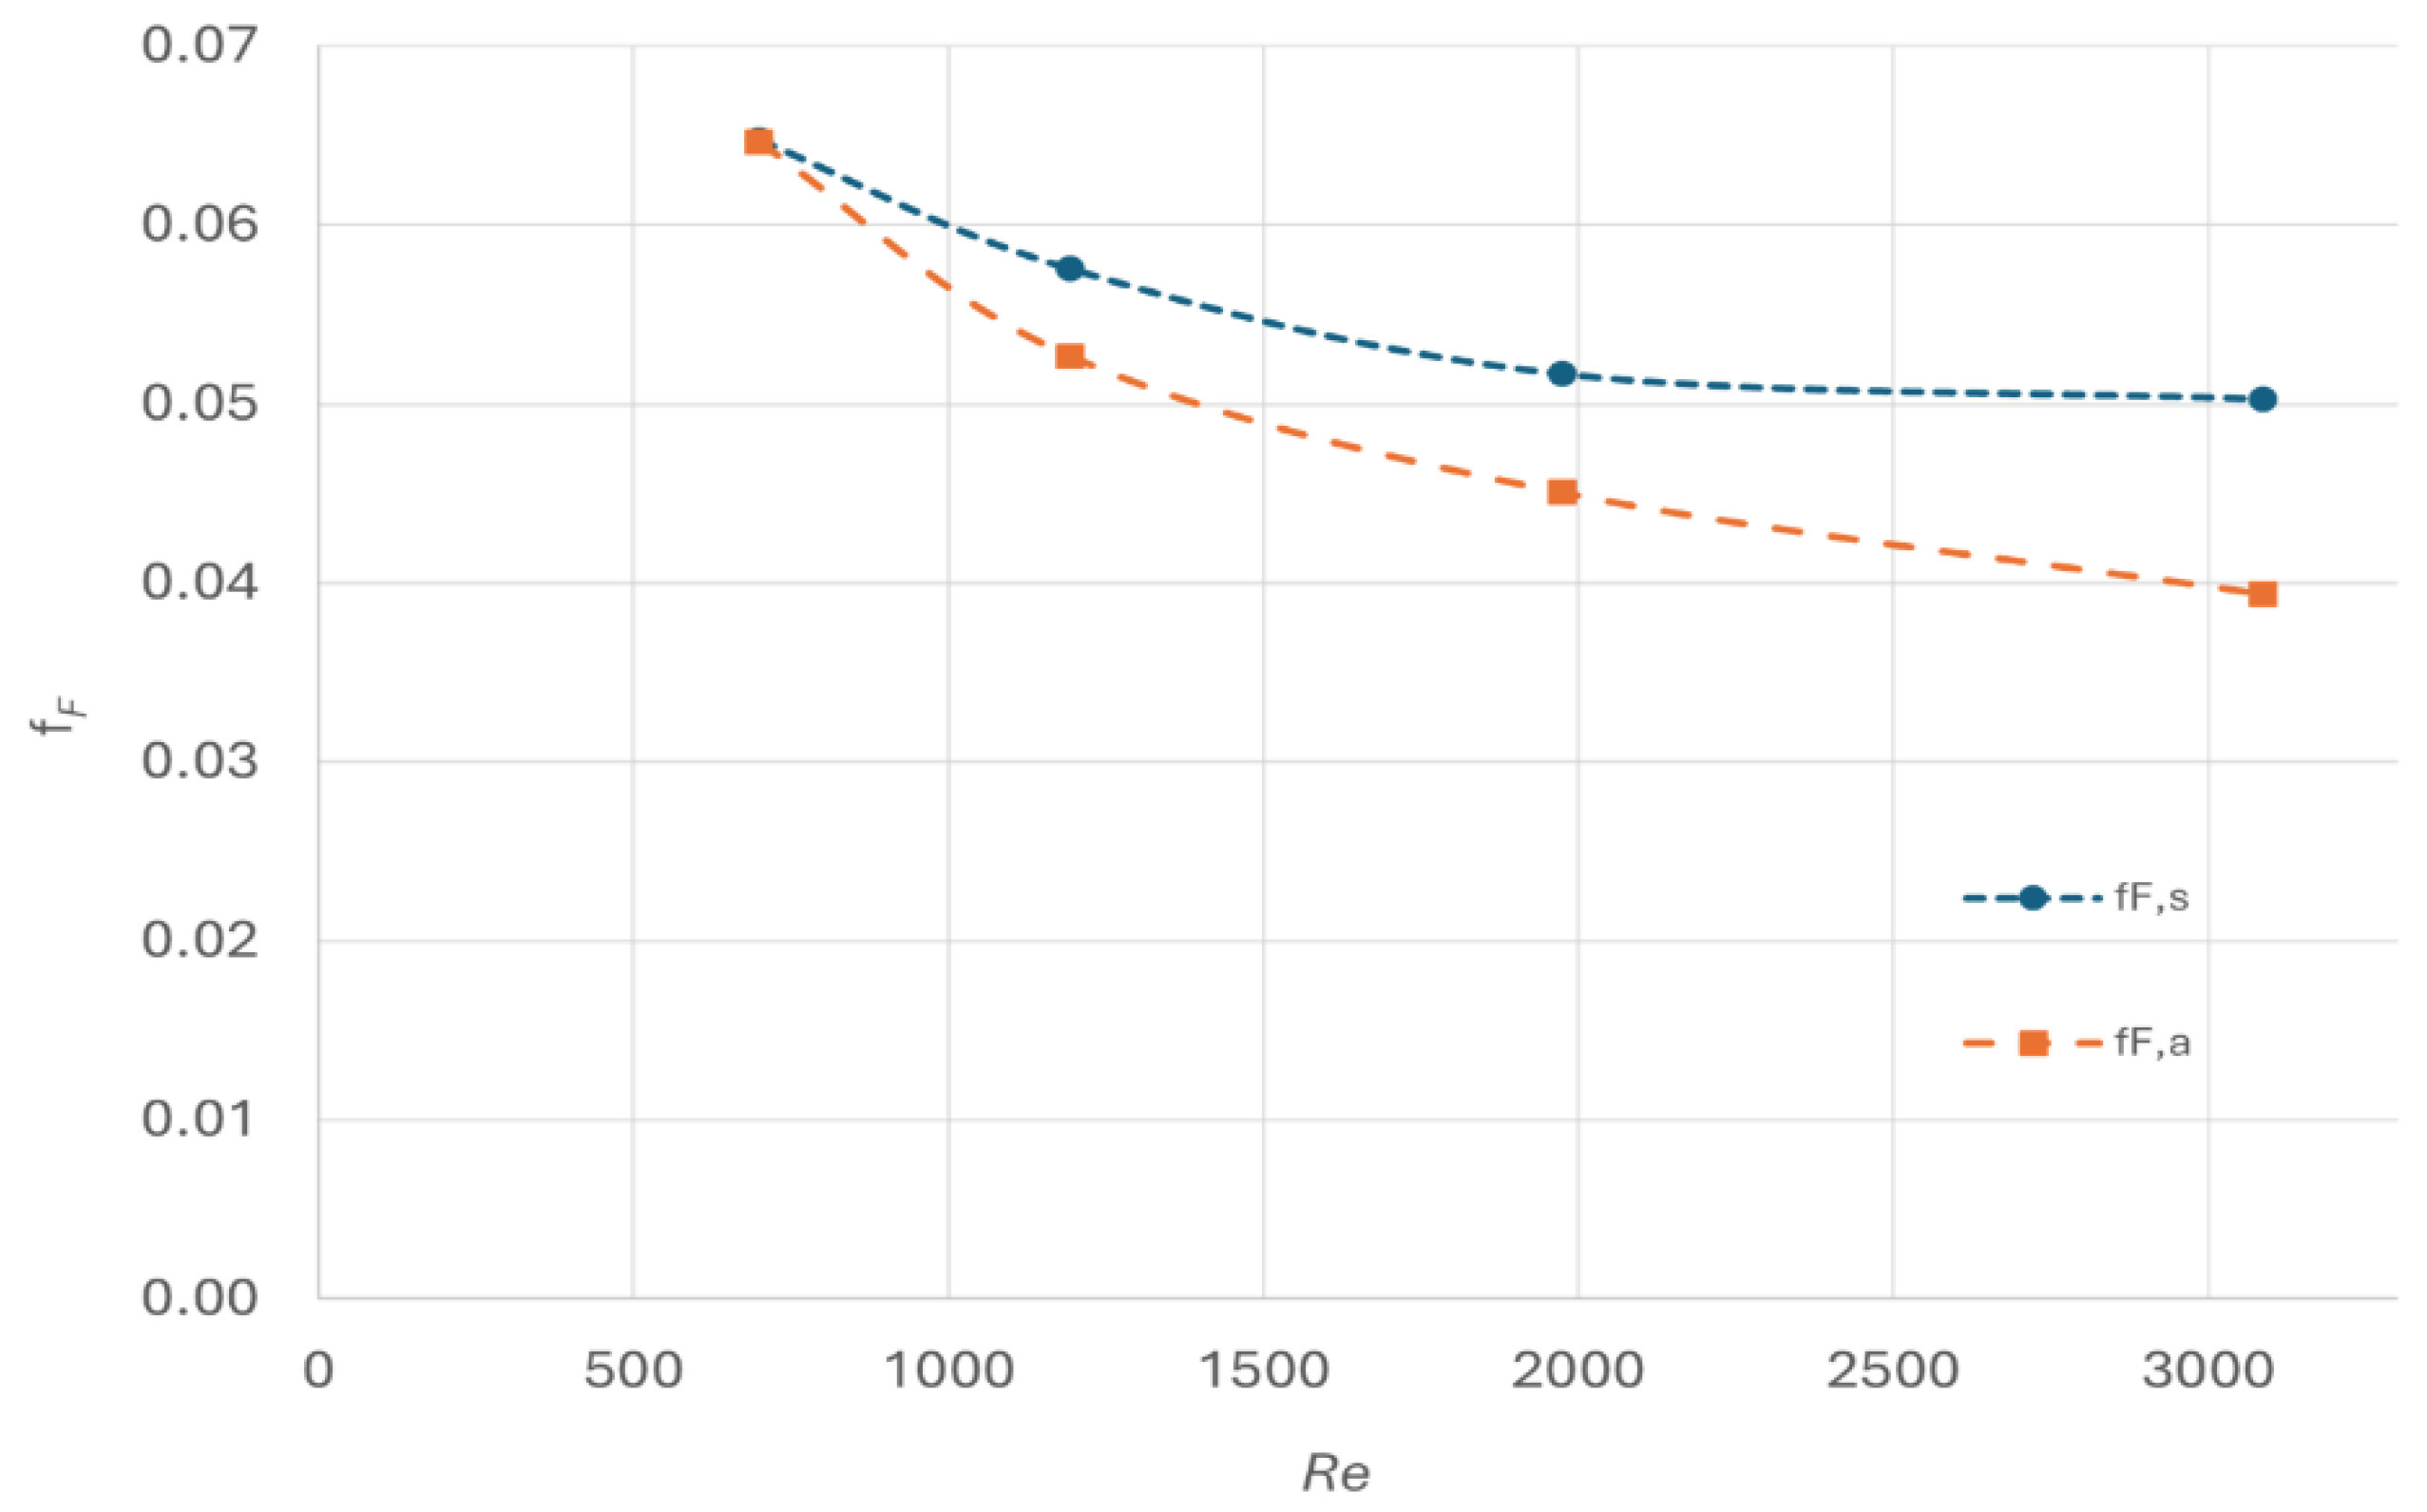
Figure 6.
Comparing the experimental results with simulated results from different kinetic models.
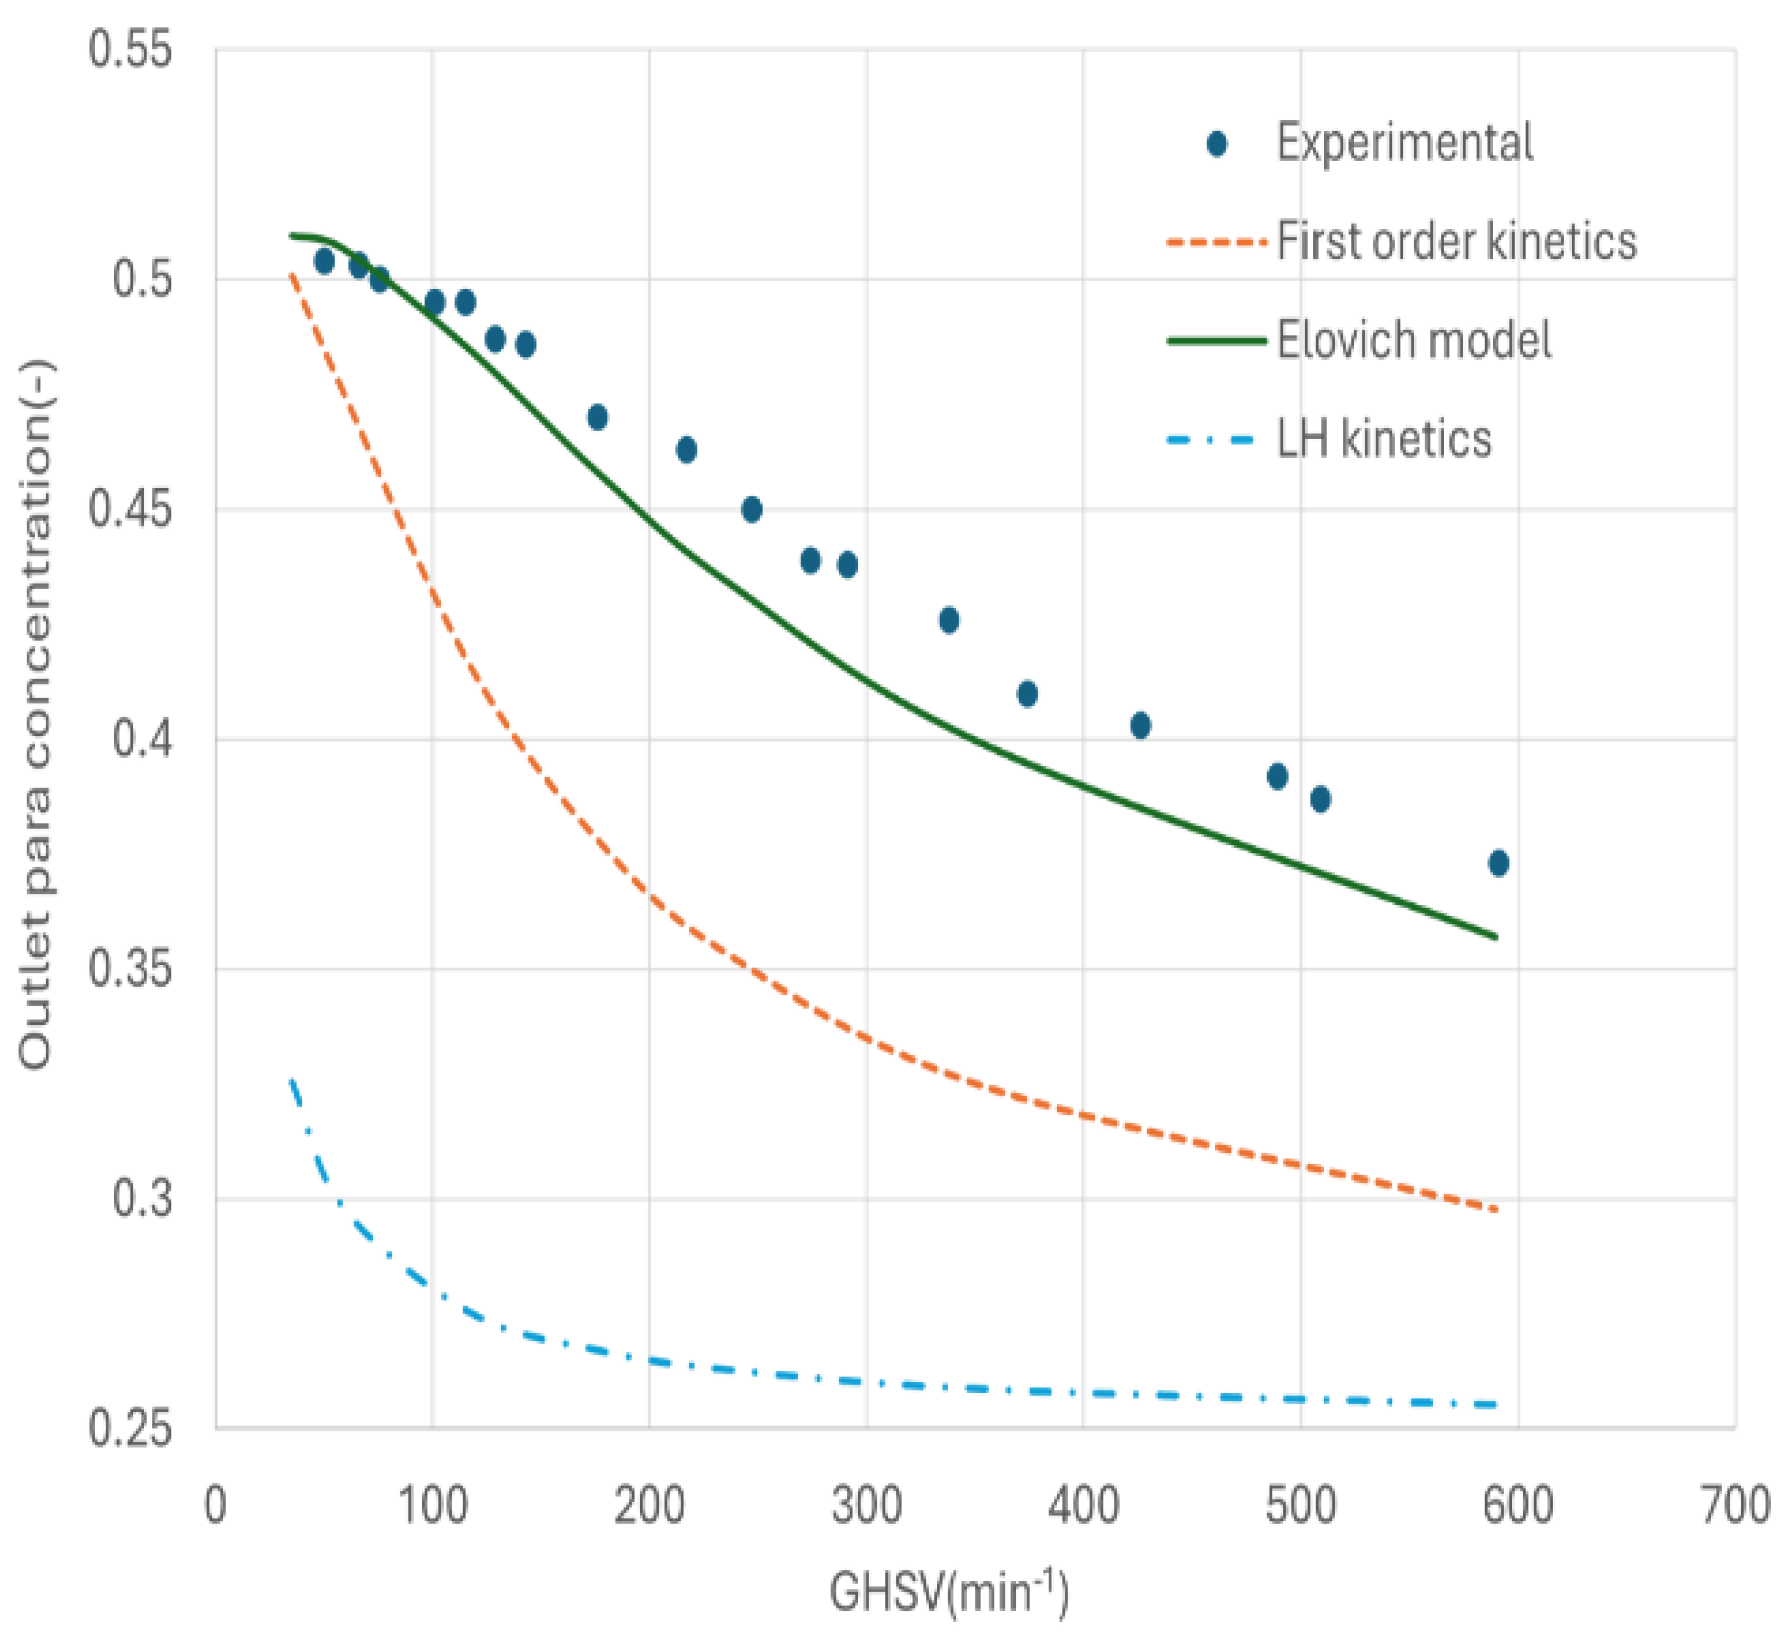
Figure 7.
Velocity profile of the hot channel.
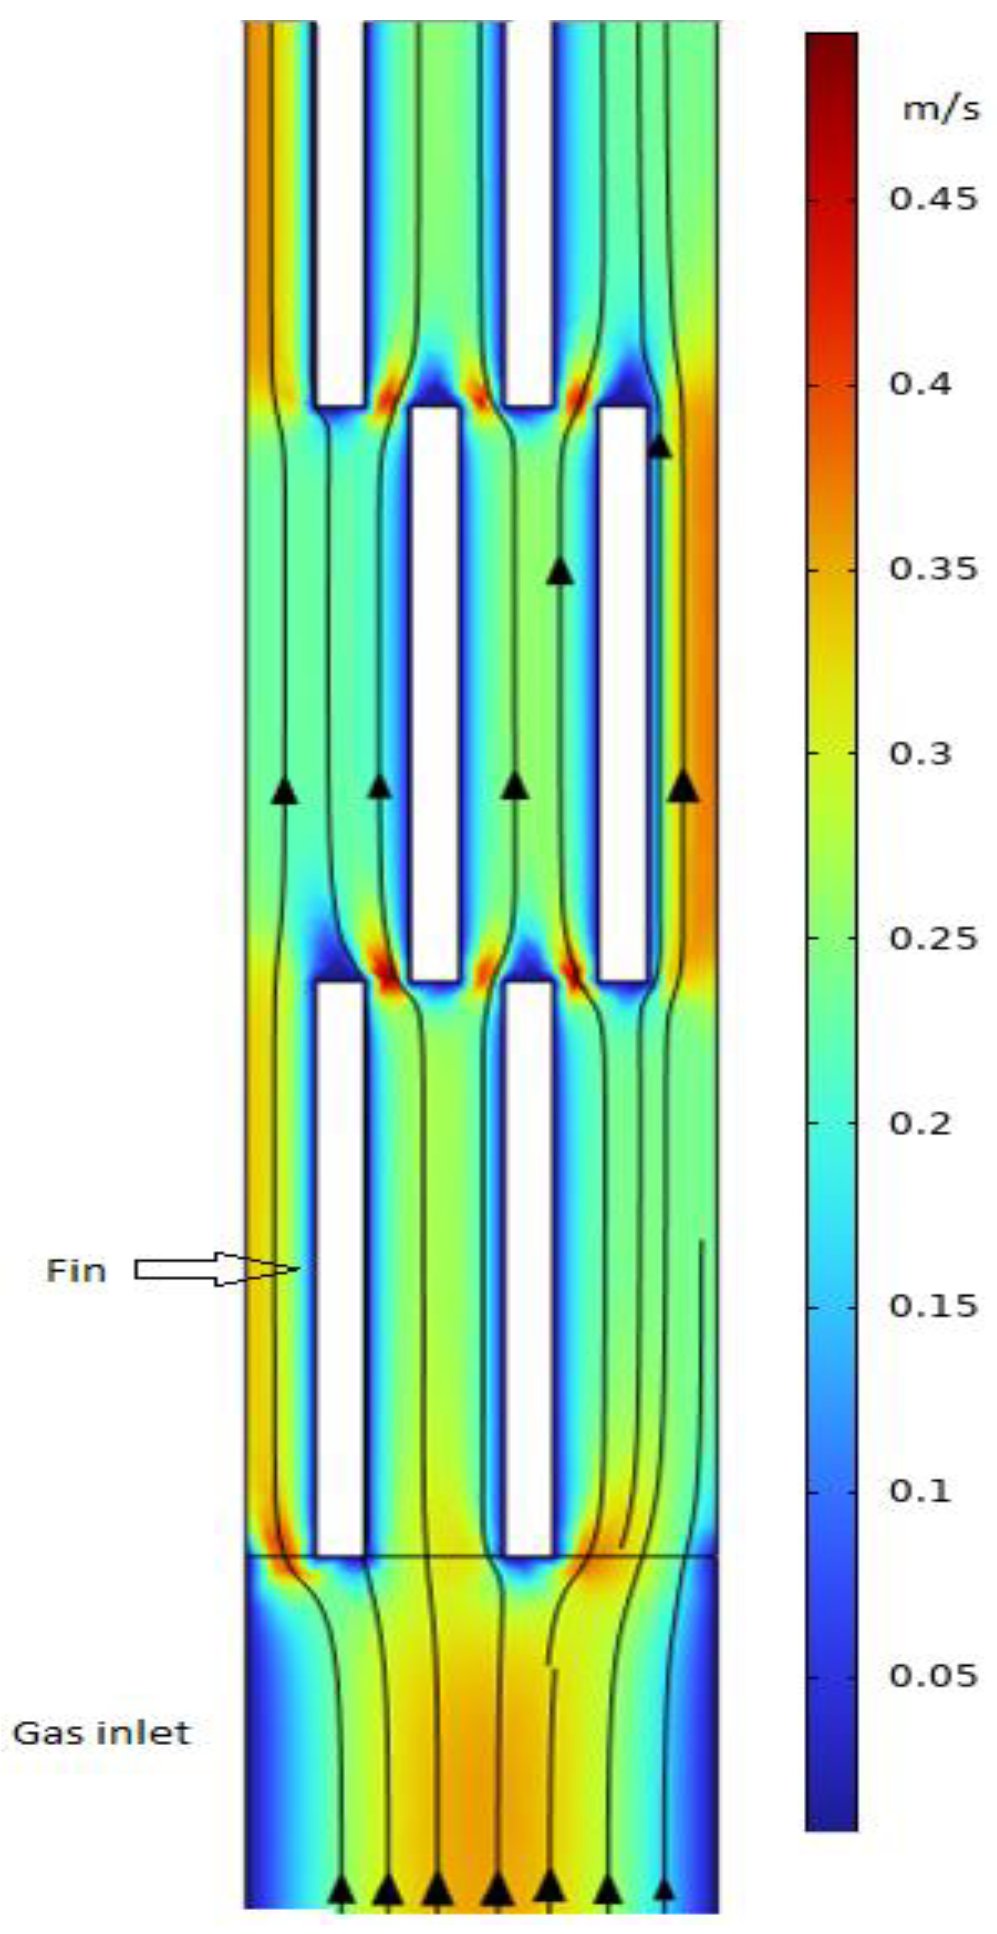
Figure 8.
a) Temperature profile inside the fin channel; b) Temperature distribution along the fin width at half fin height.
Figure 8.
a) Temperature profile inside the fin channel; b) Temperature distribution along the fin width at half fin height.
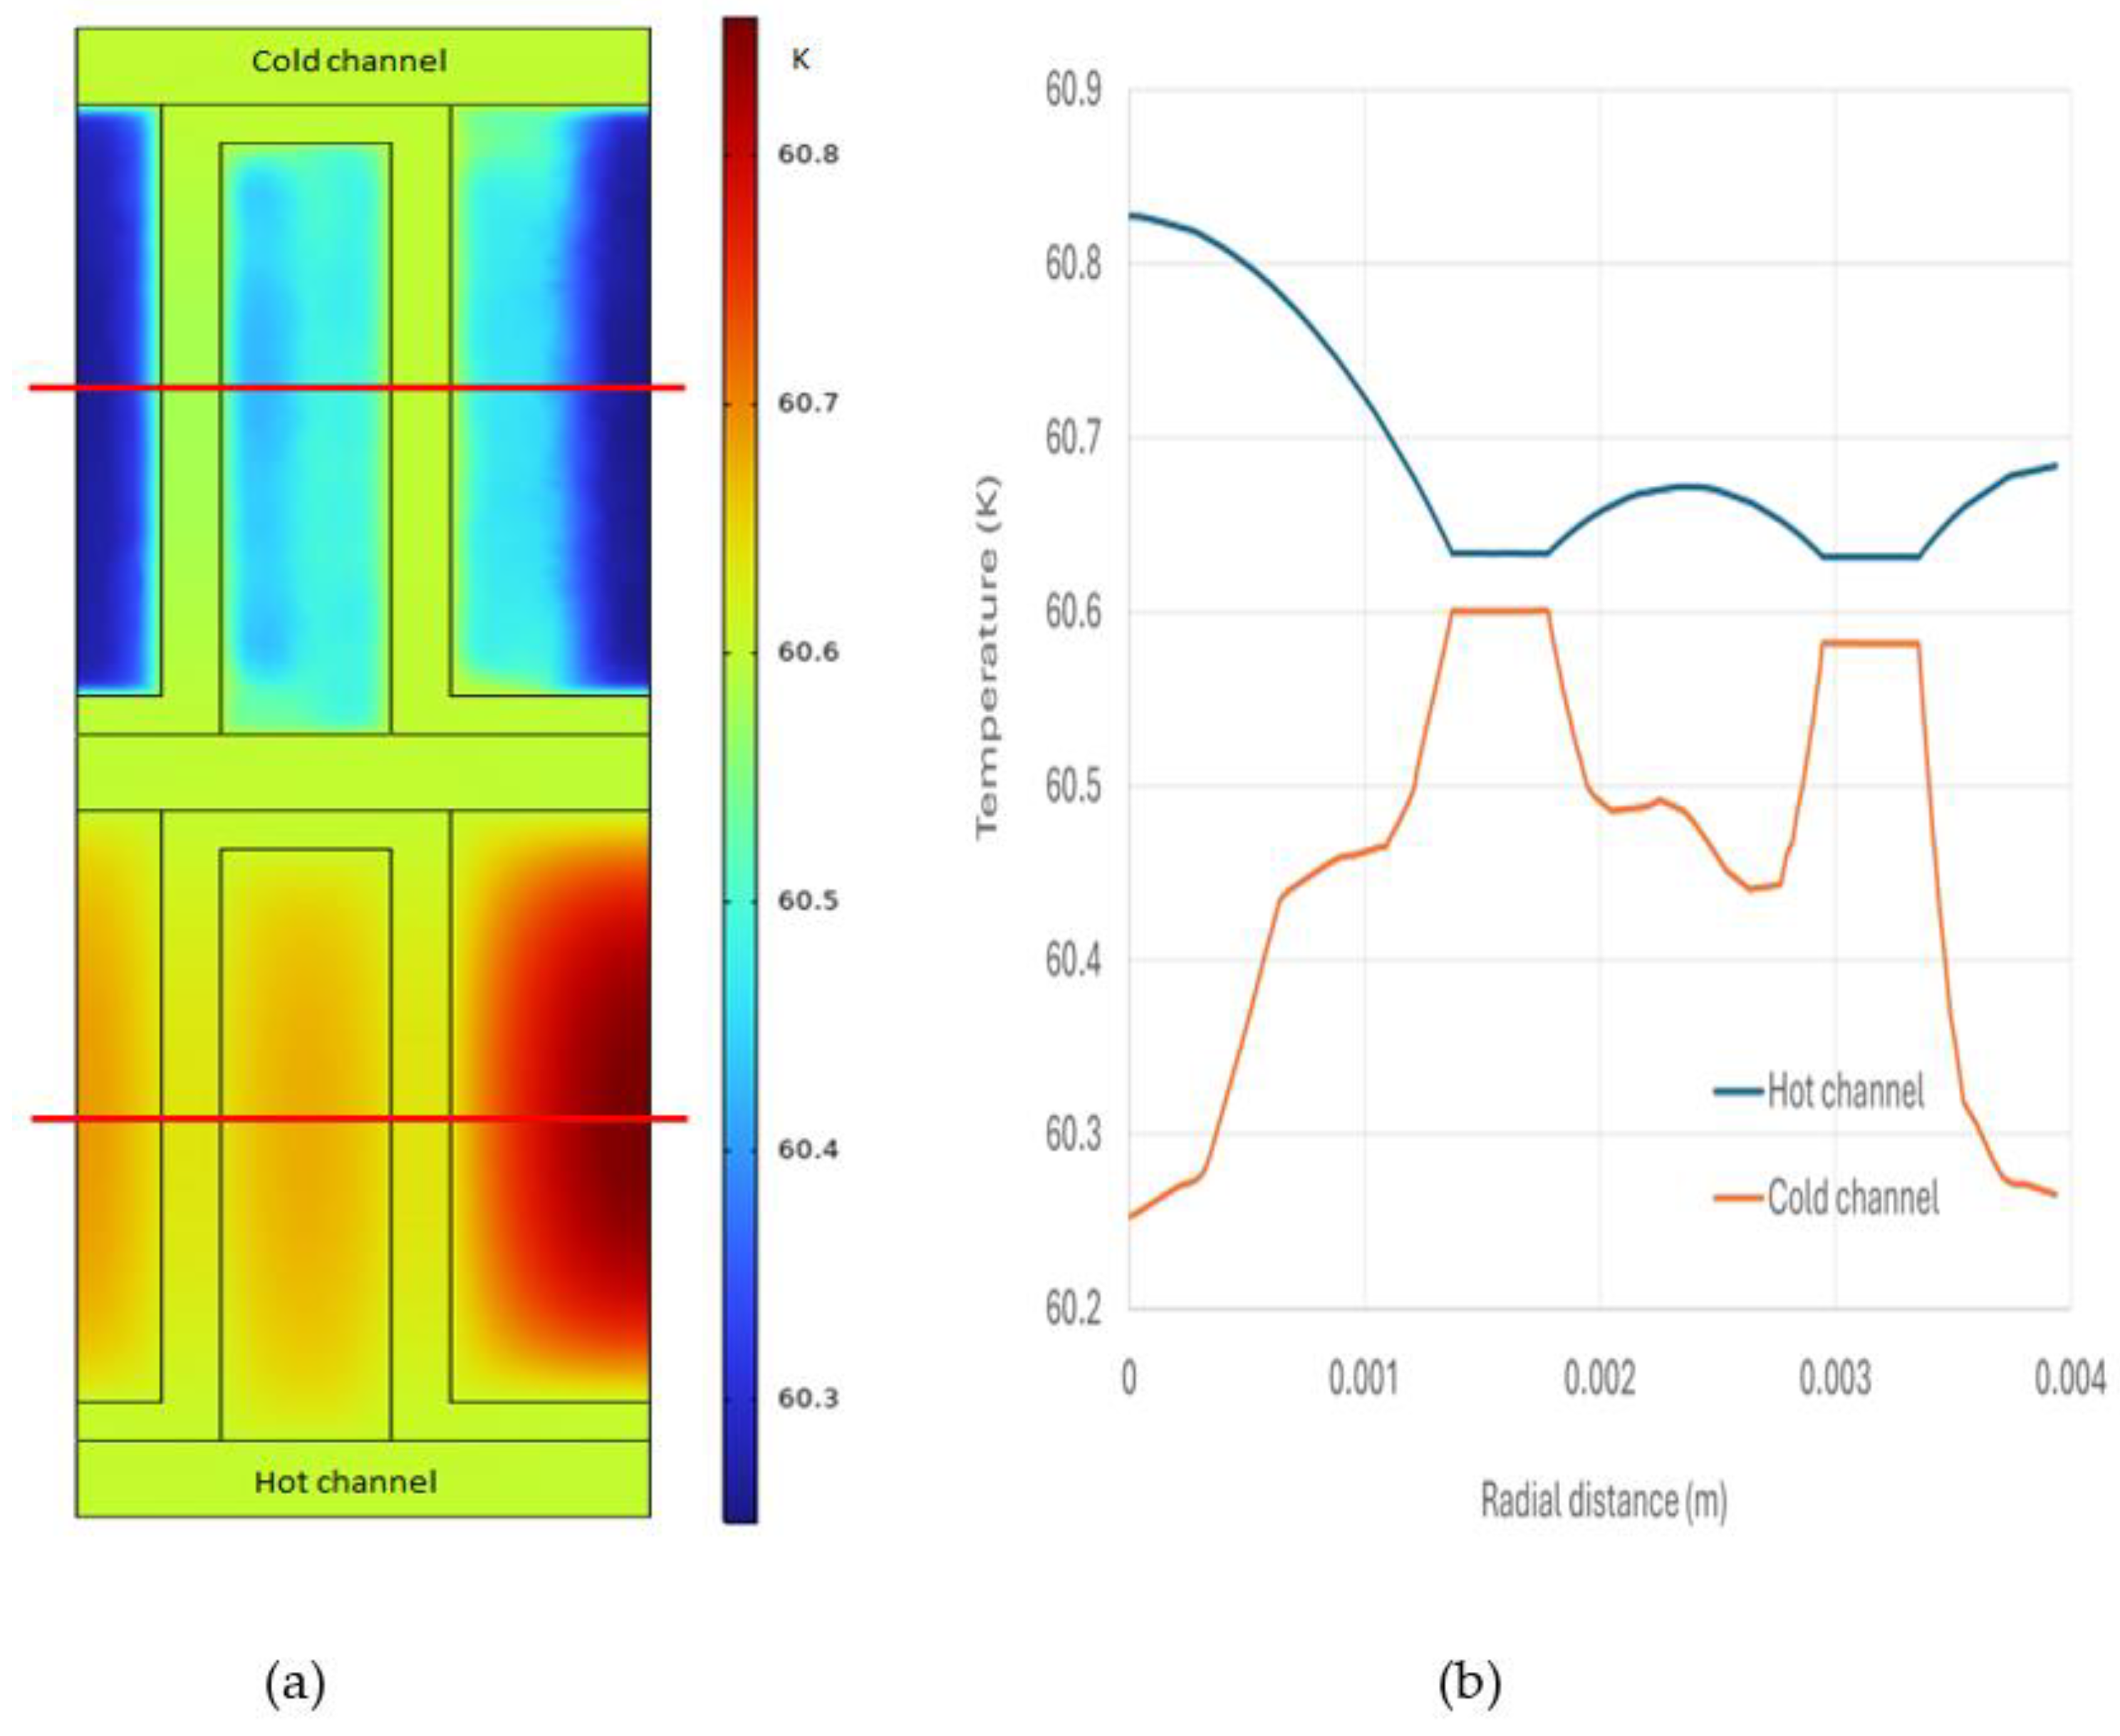
Figure 9.
Parahydrogen concentration profile inside the hot fin channel.
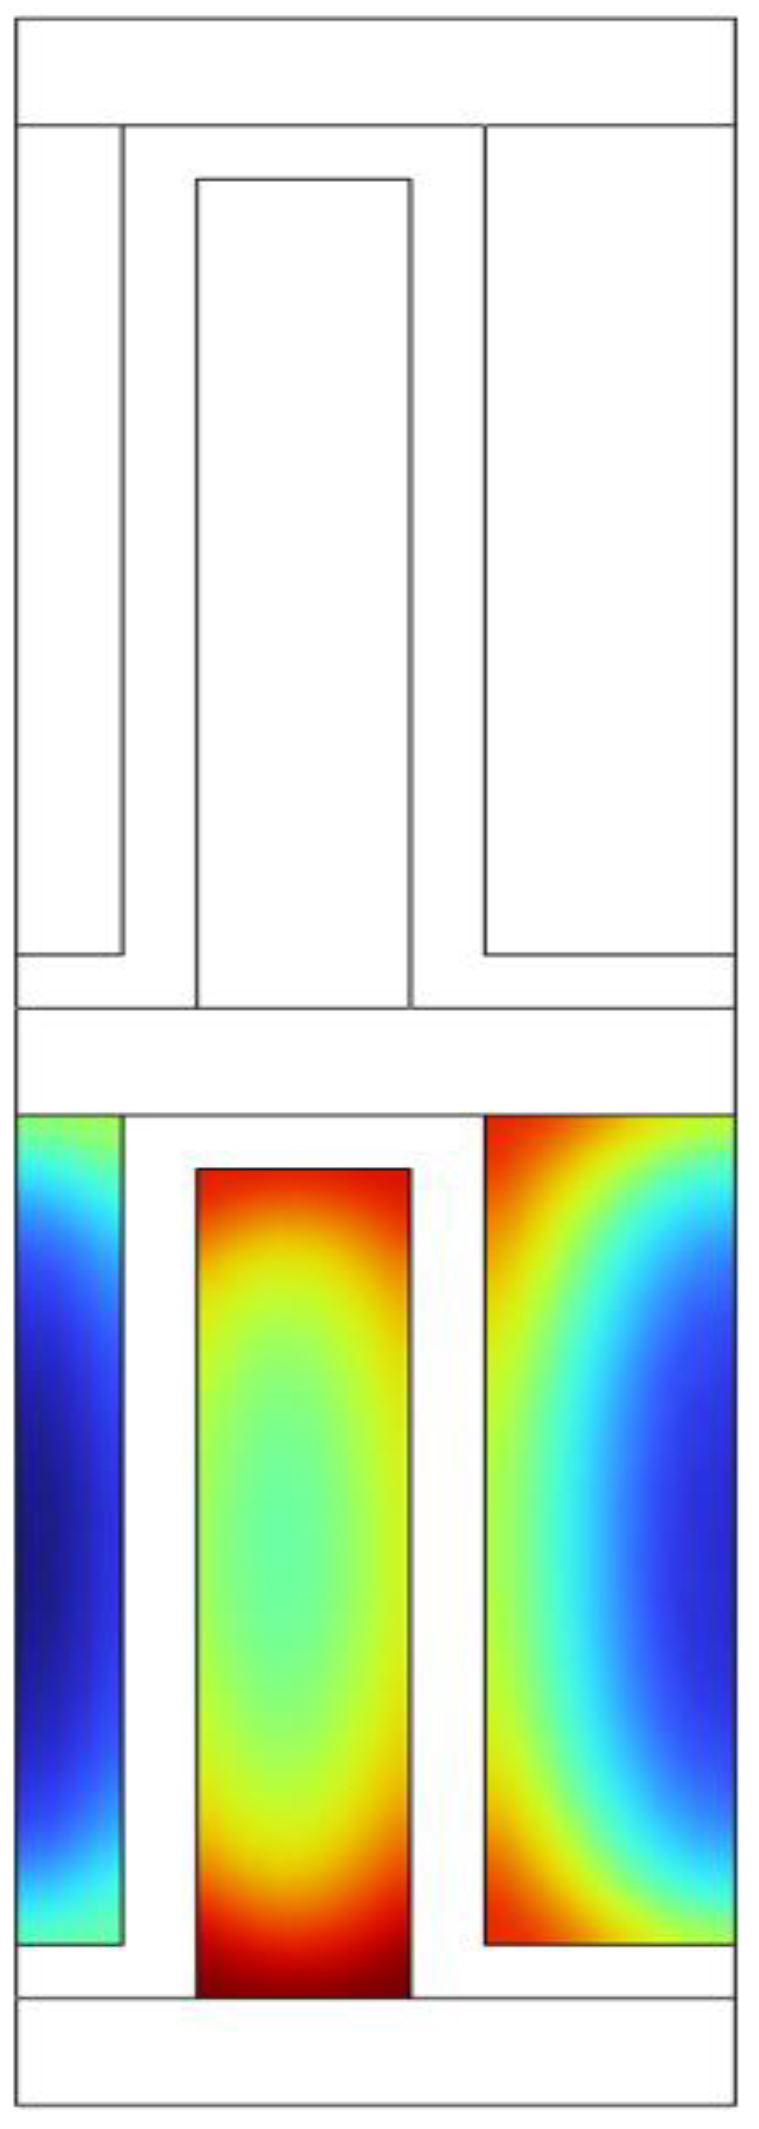
Figure 10.
Temperature profile and OPC reaction rate along the flow axial distance.
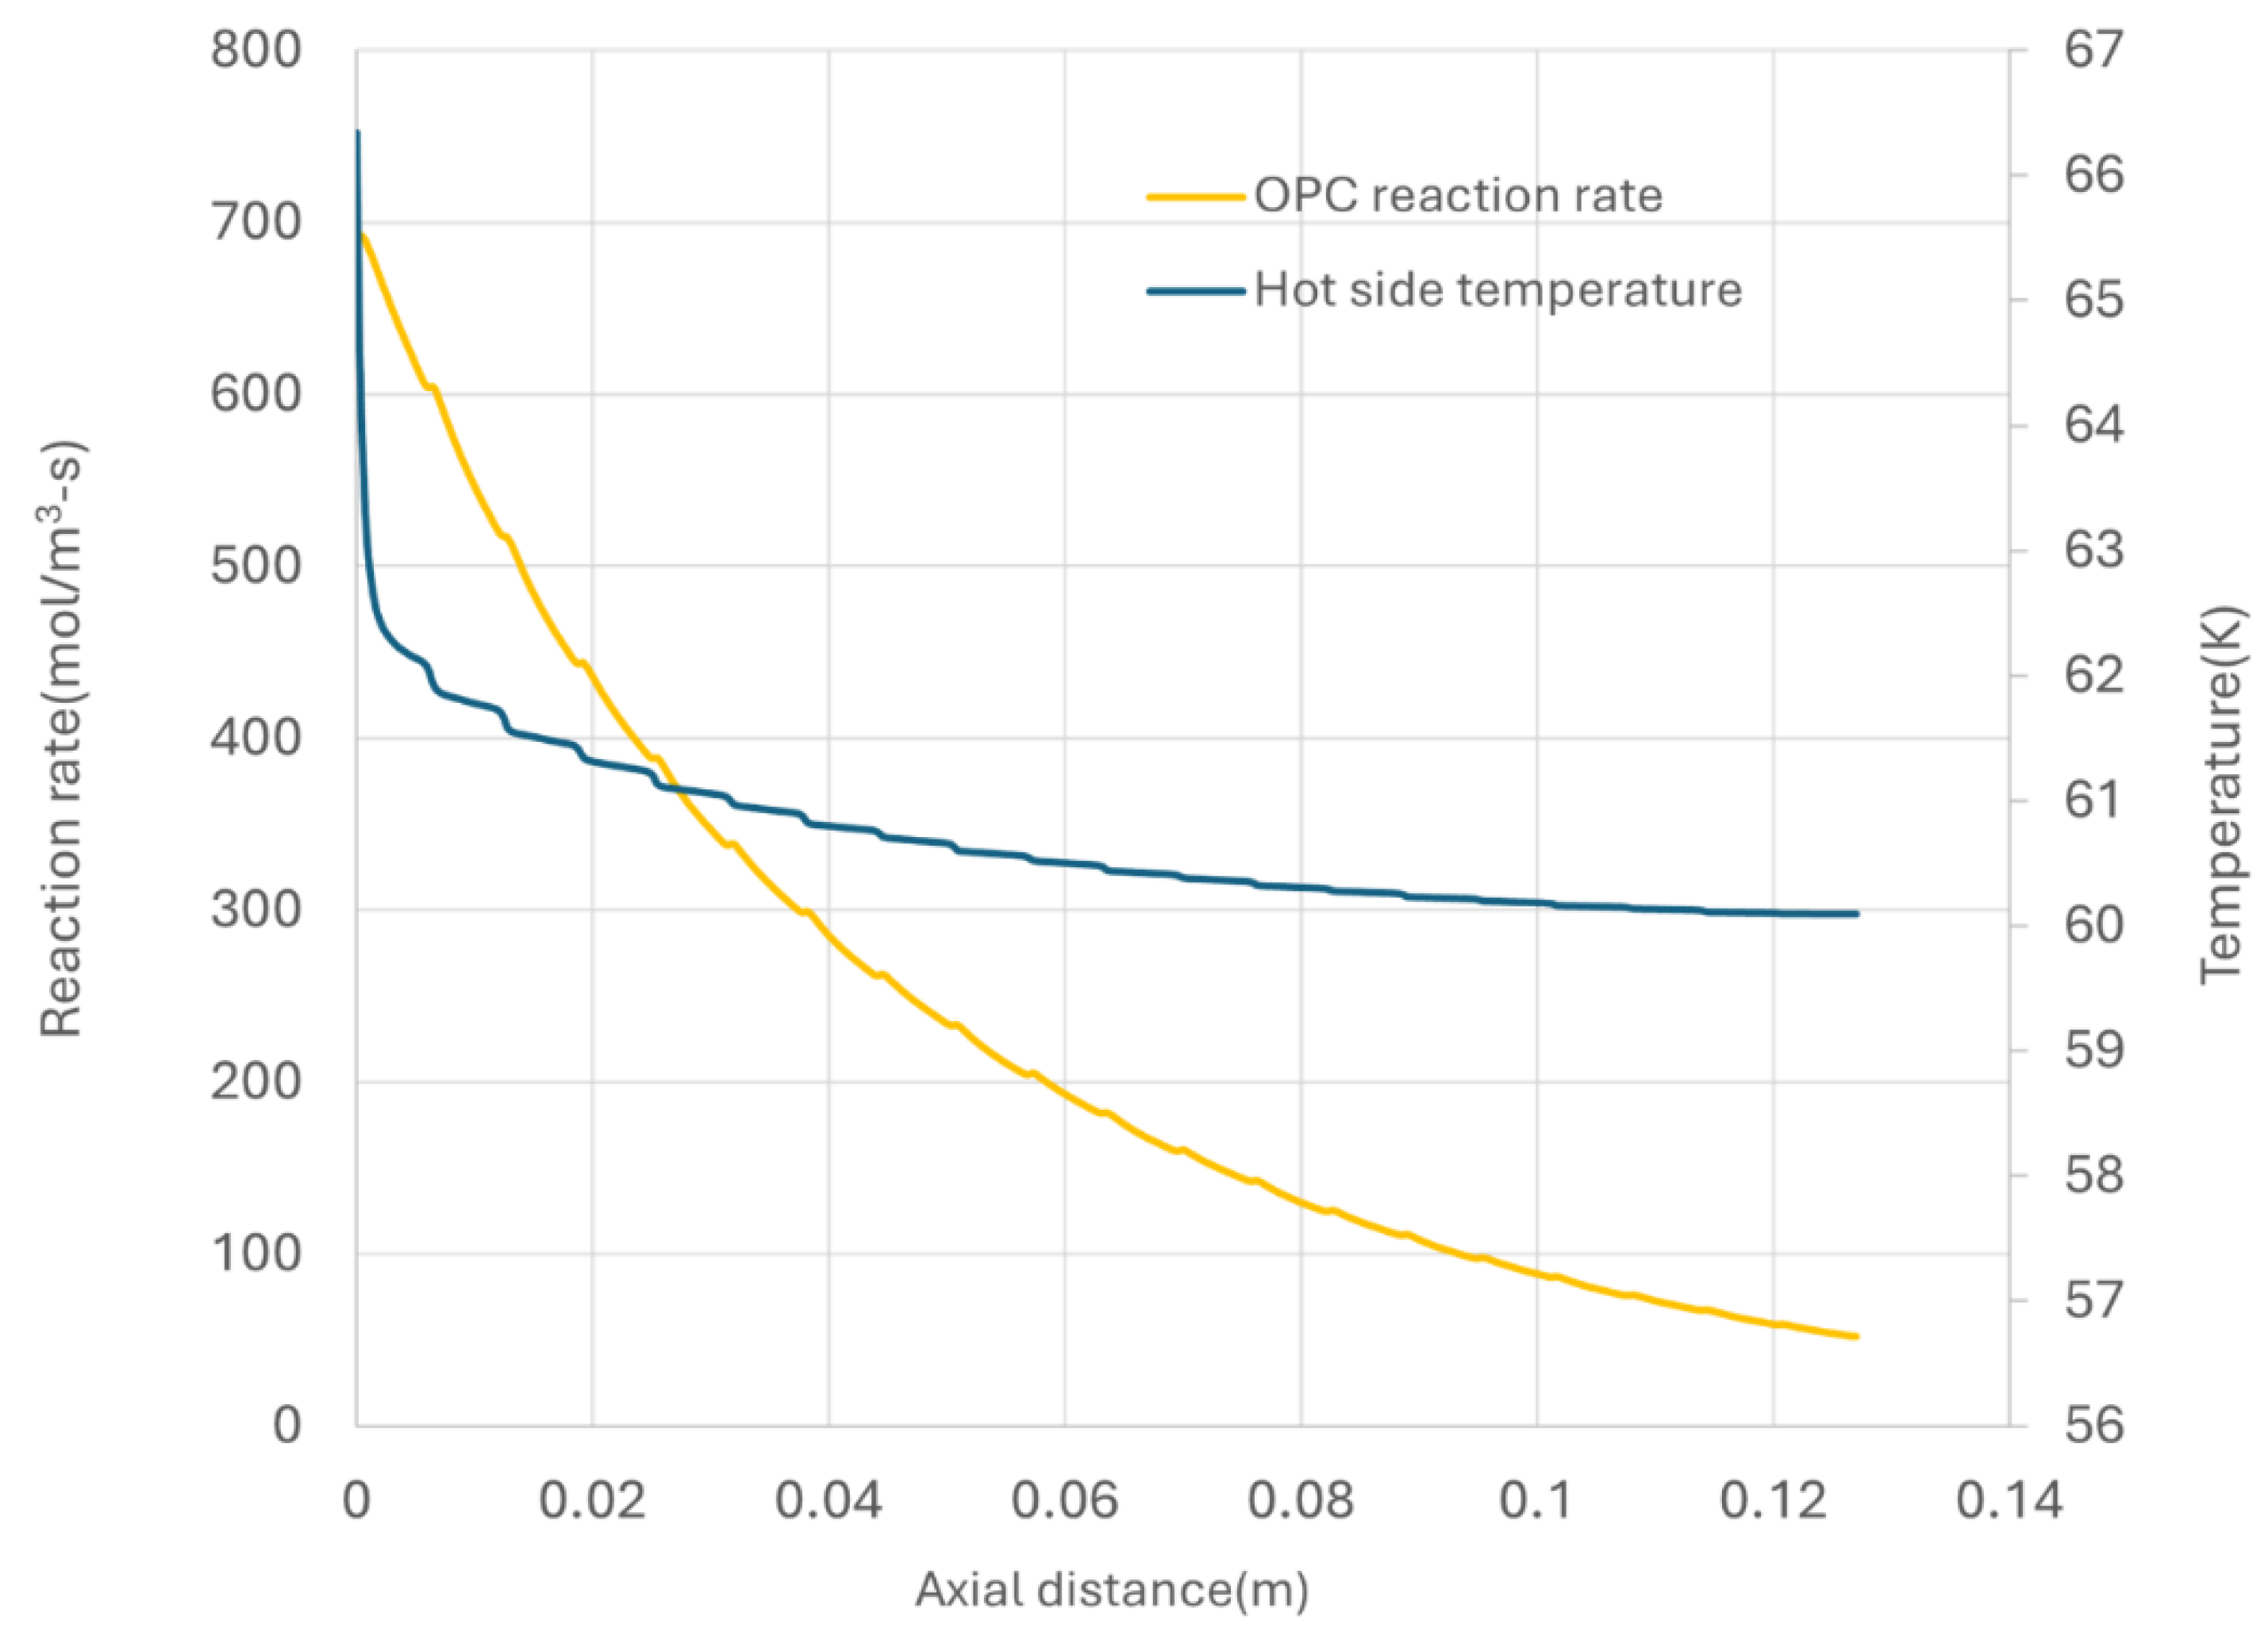
Figure 11.
Para concentration along the flow axial distance.
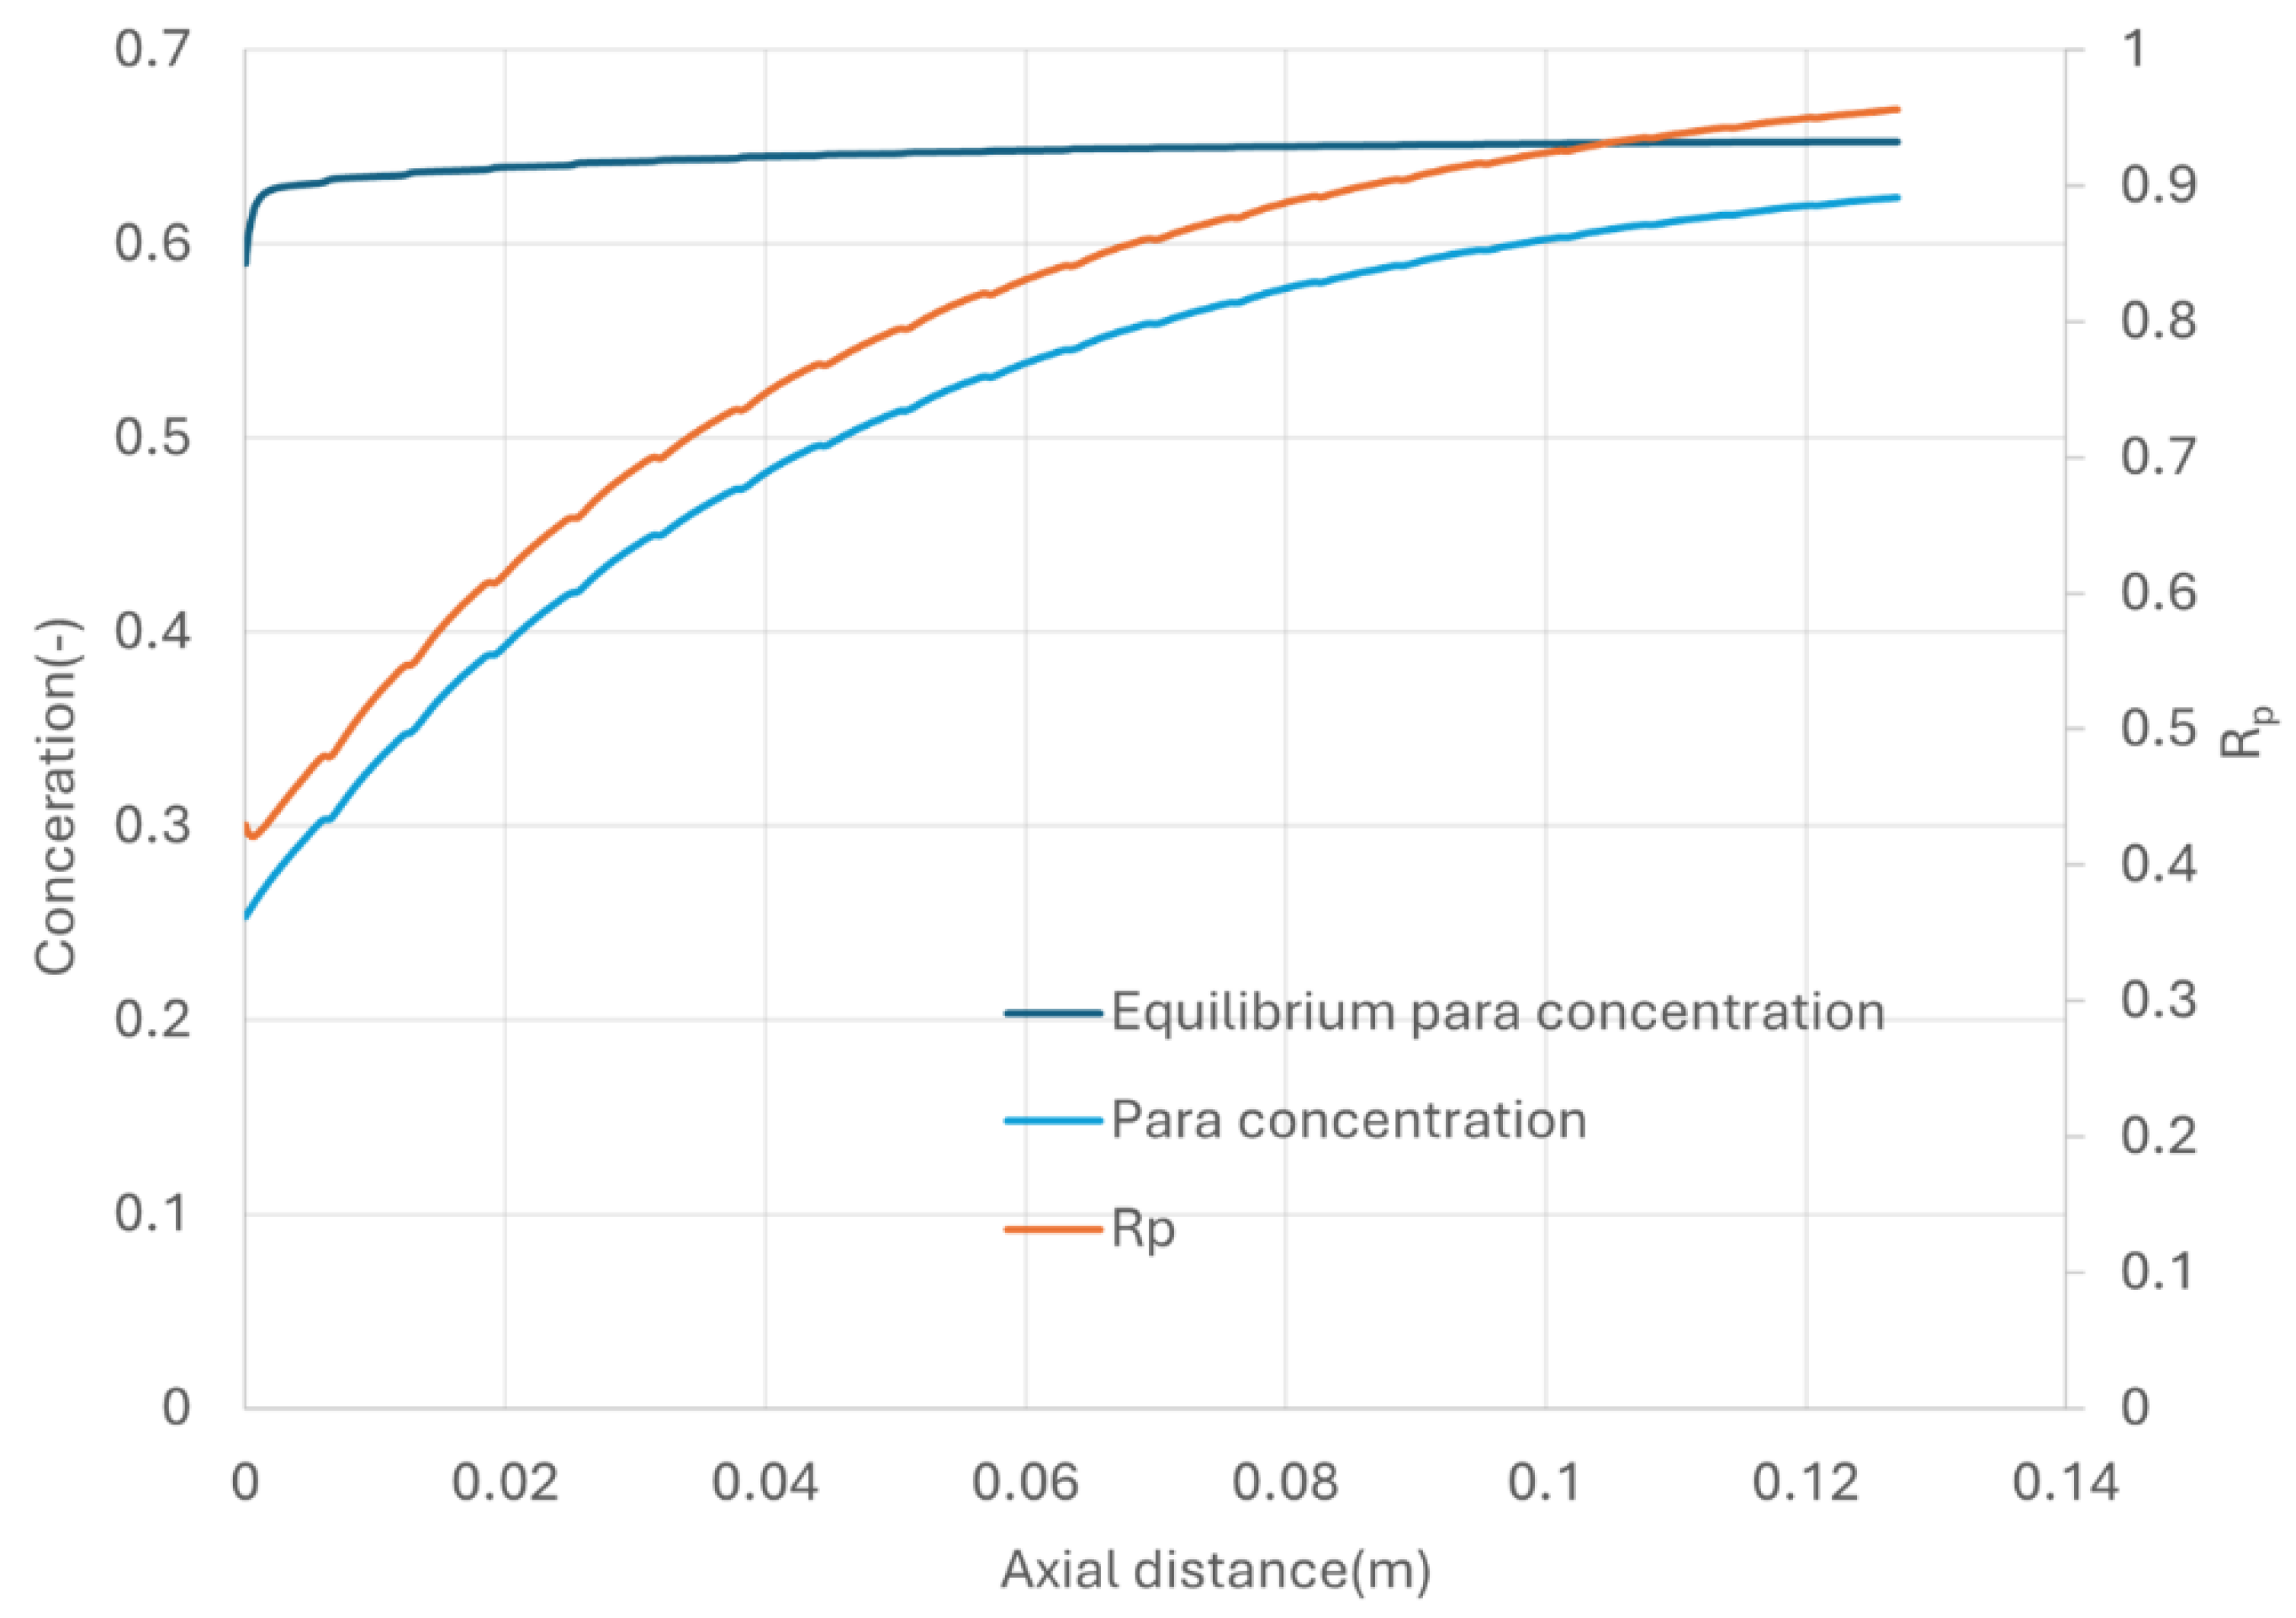
Figure 12.
Effect of GHSV on heat transfer performance.
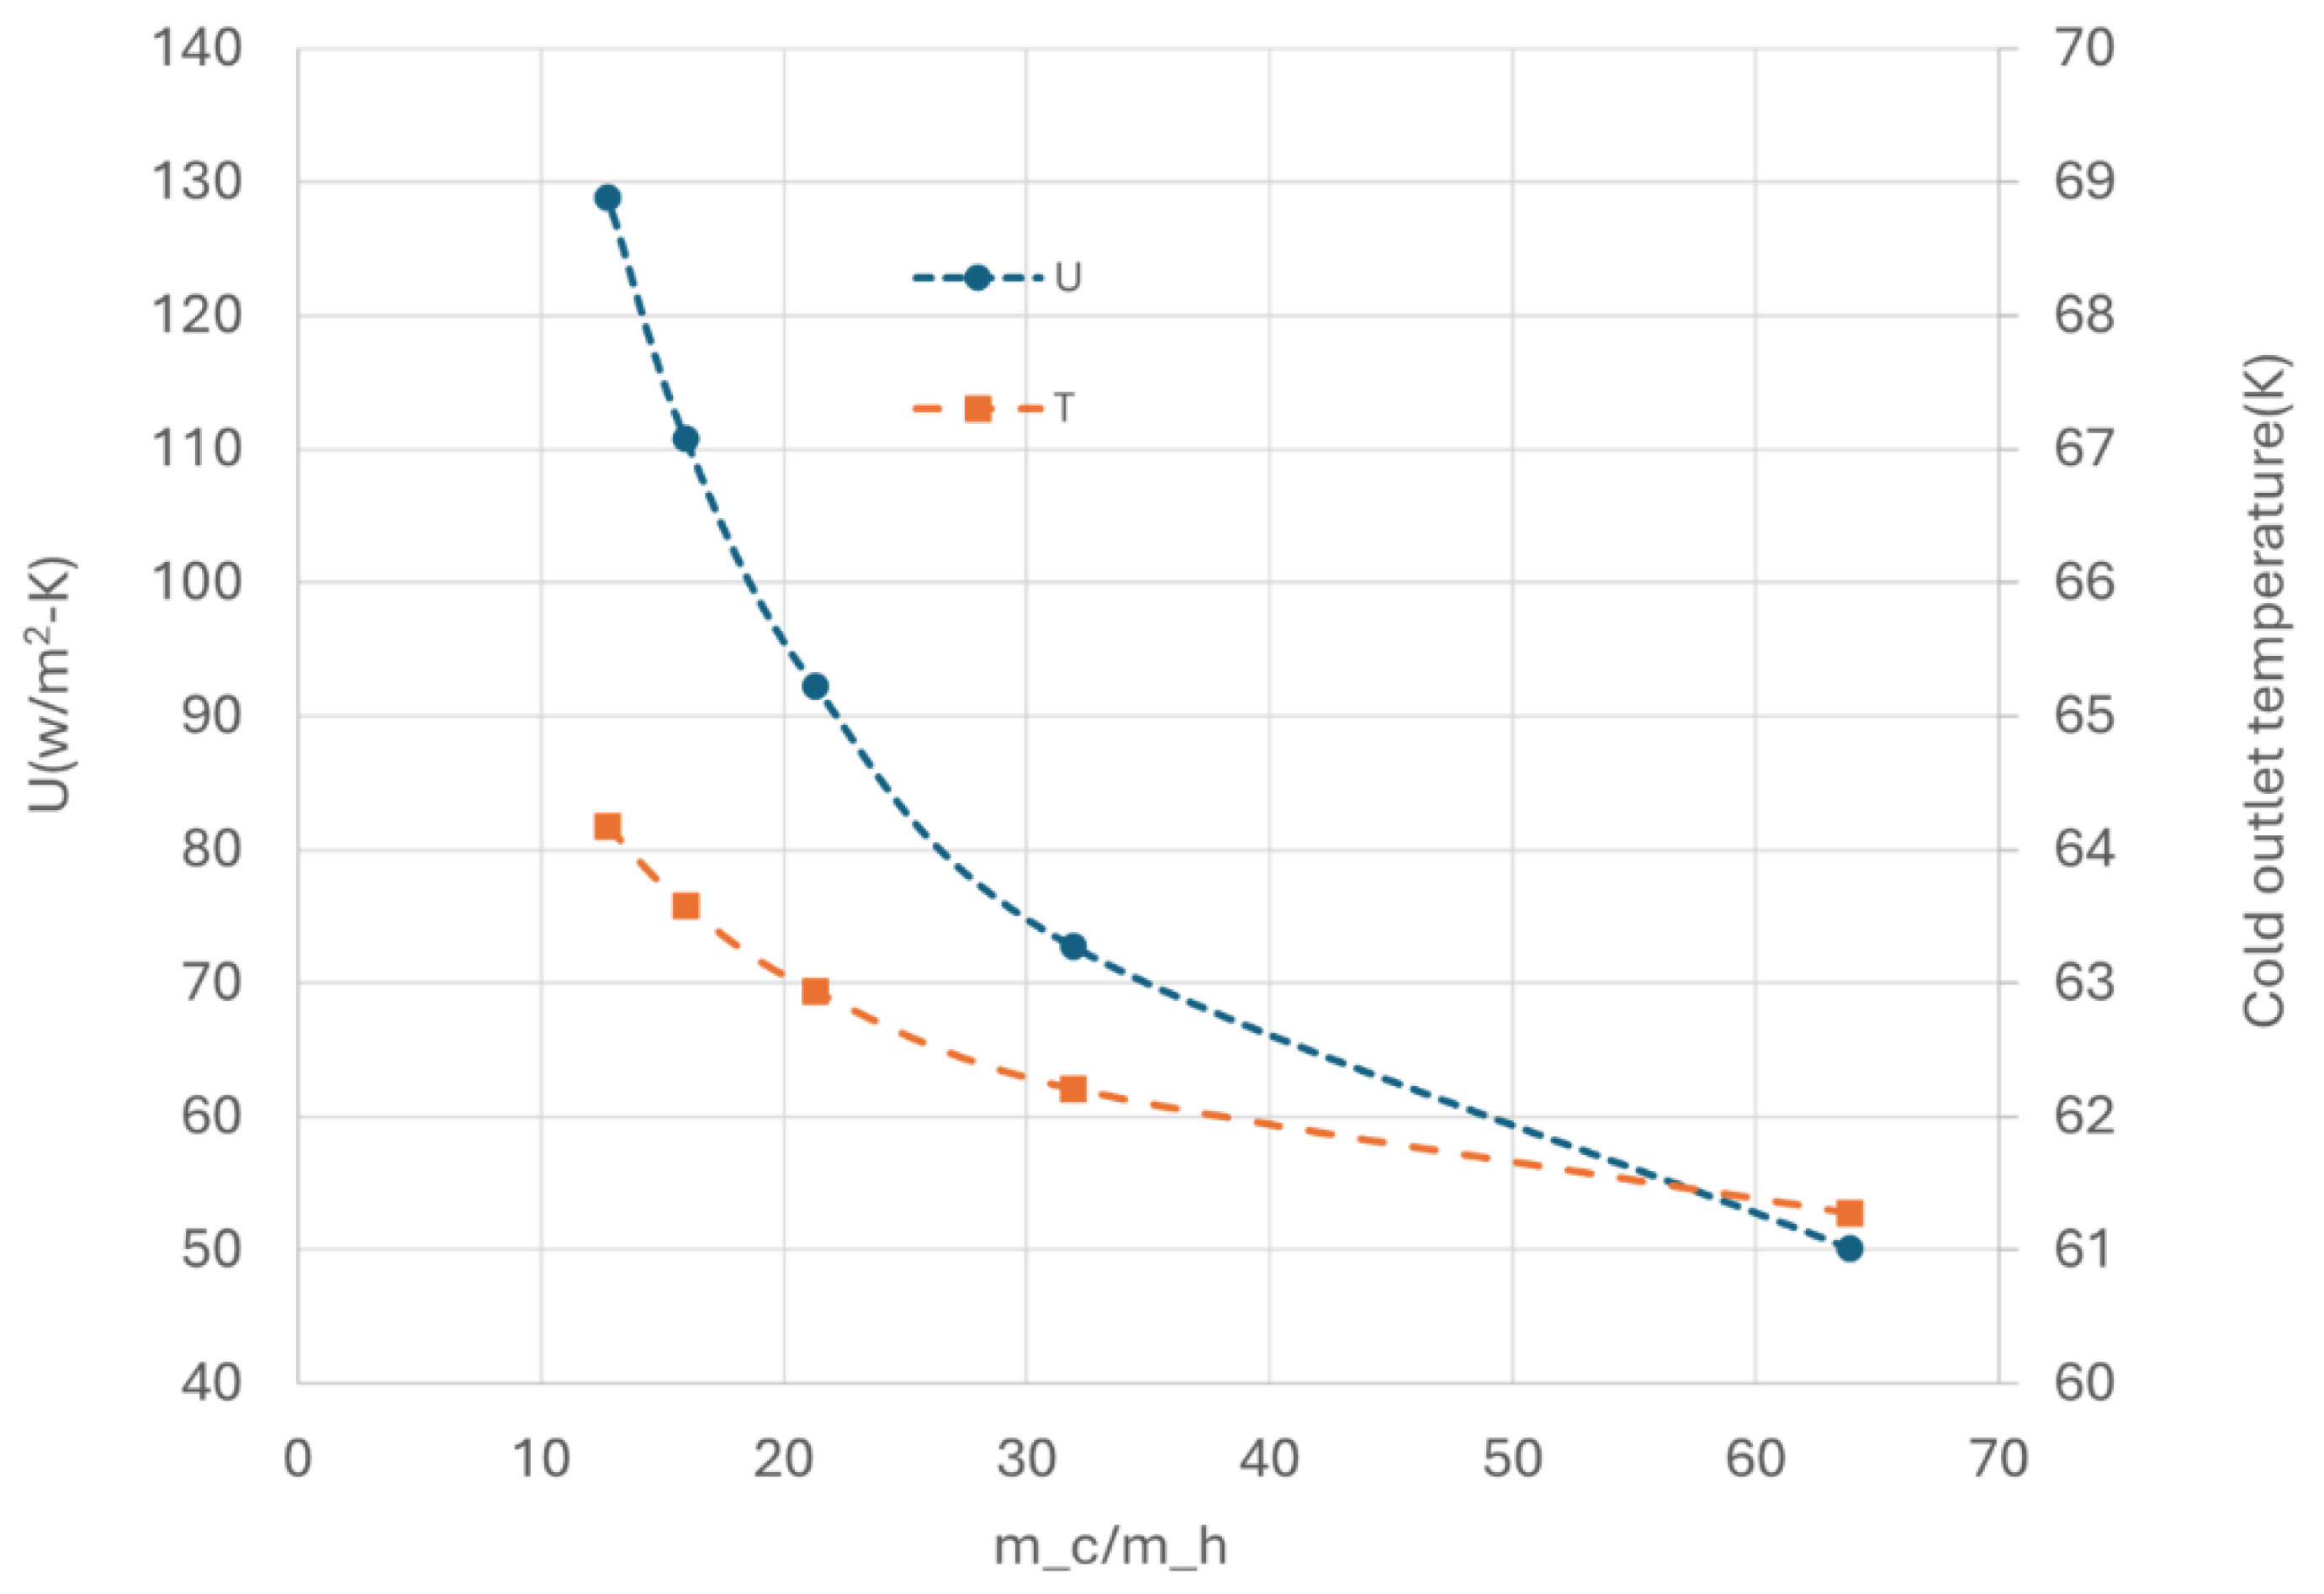
Figure 13.
Effect of GHSV-STP on OPC efficiency.
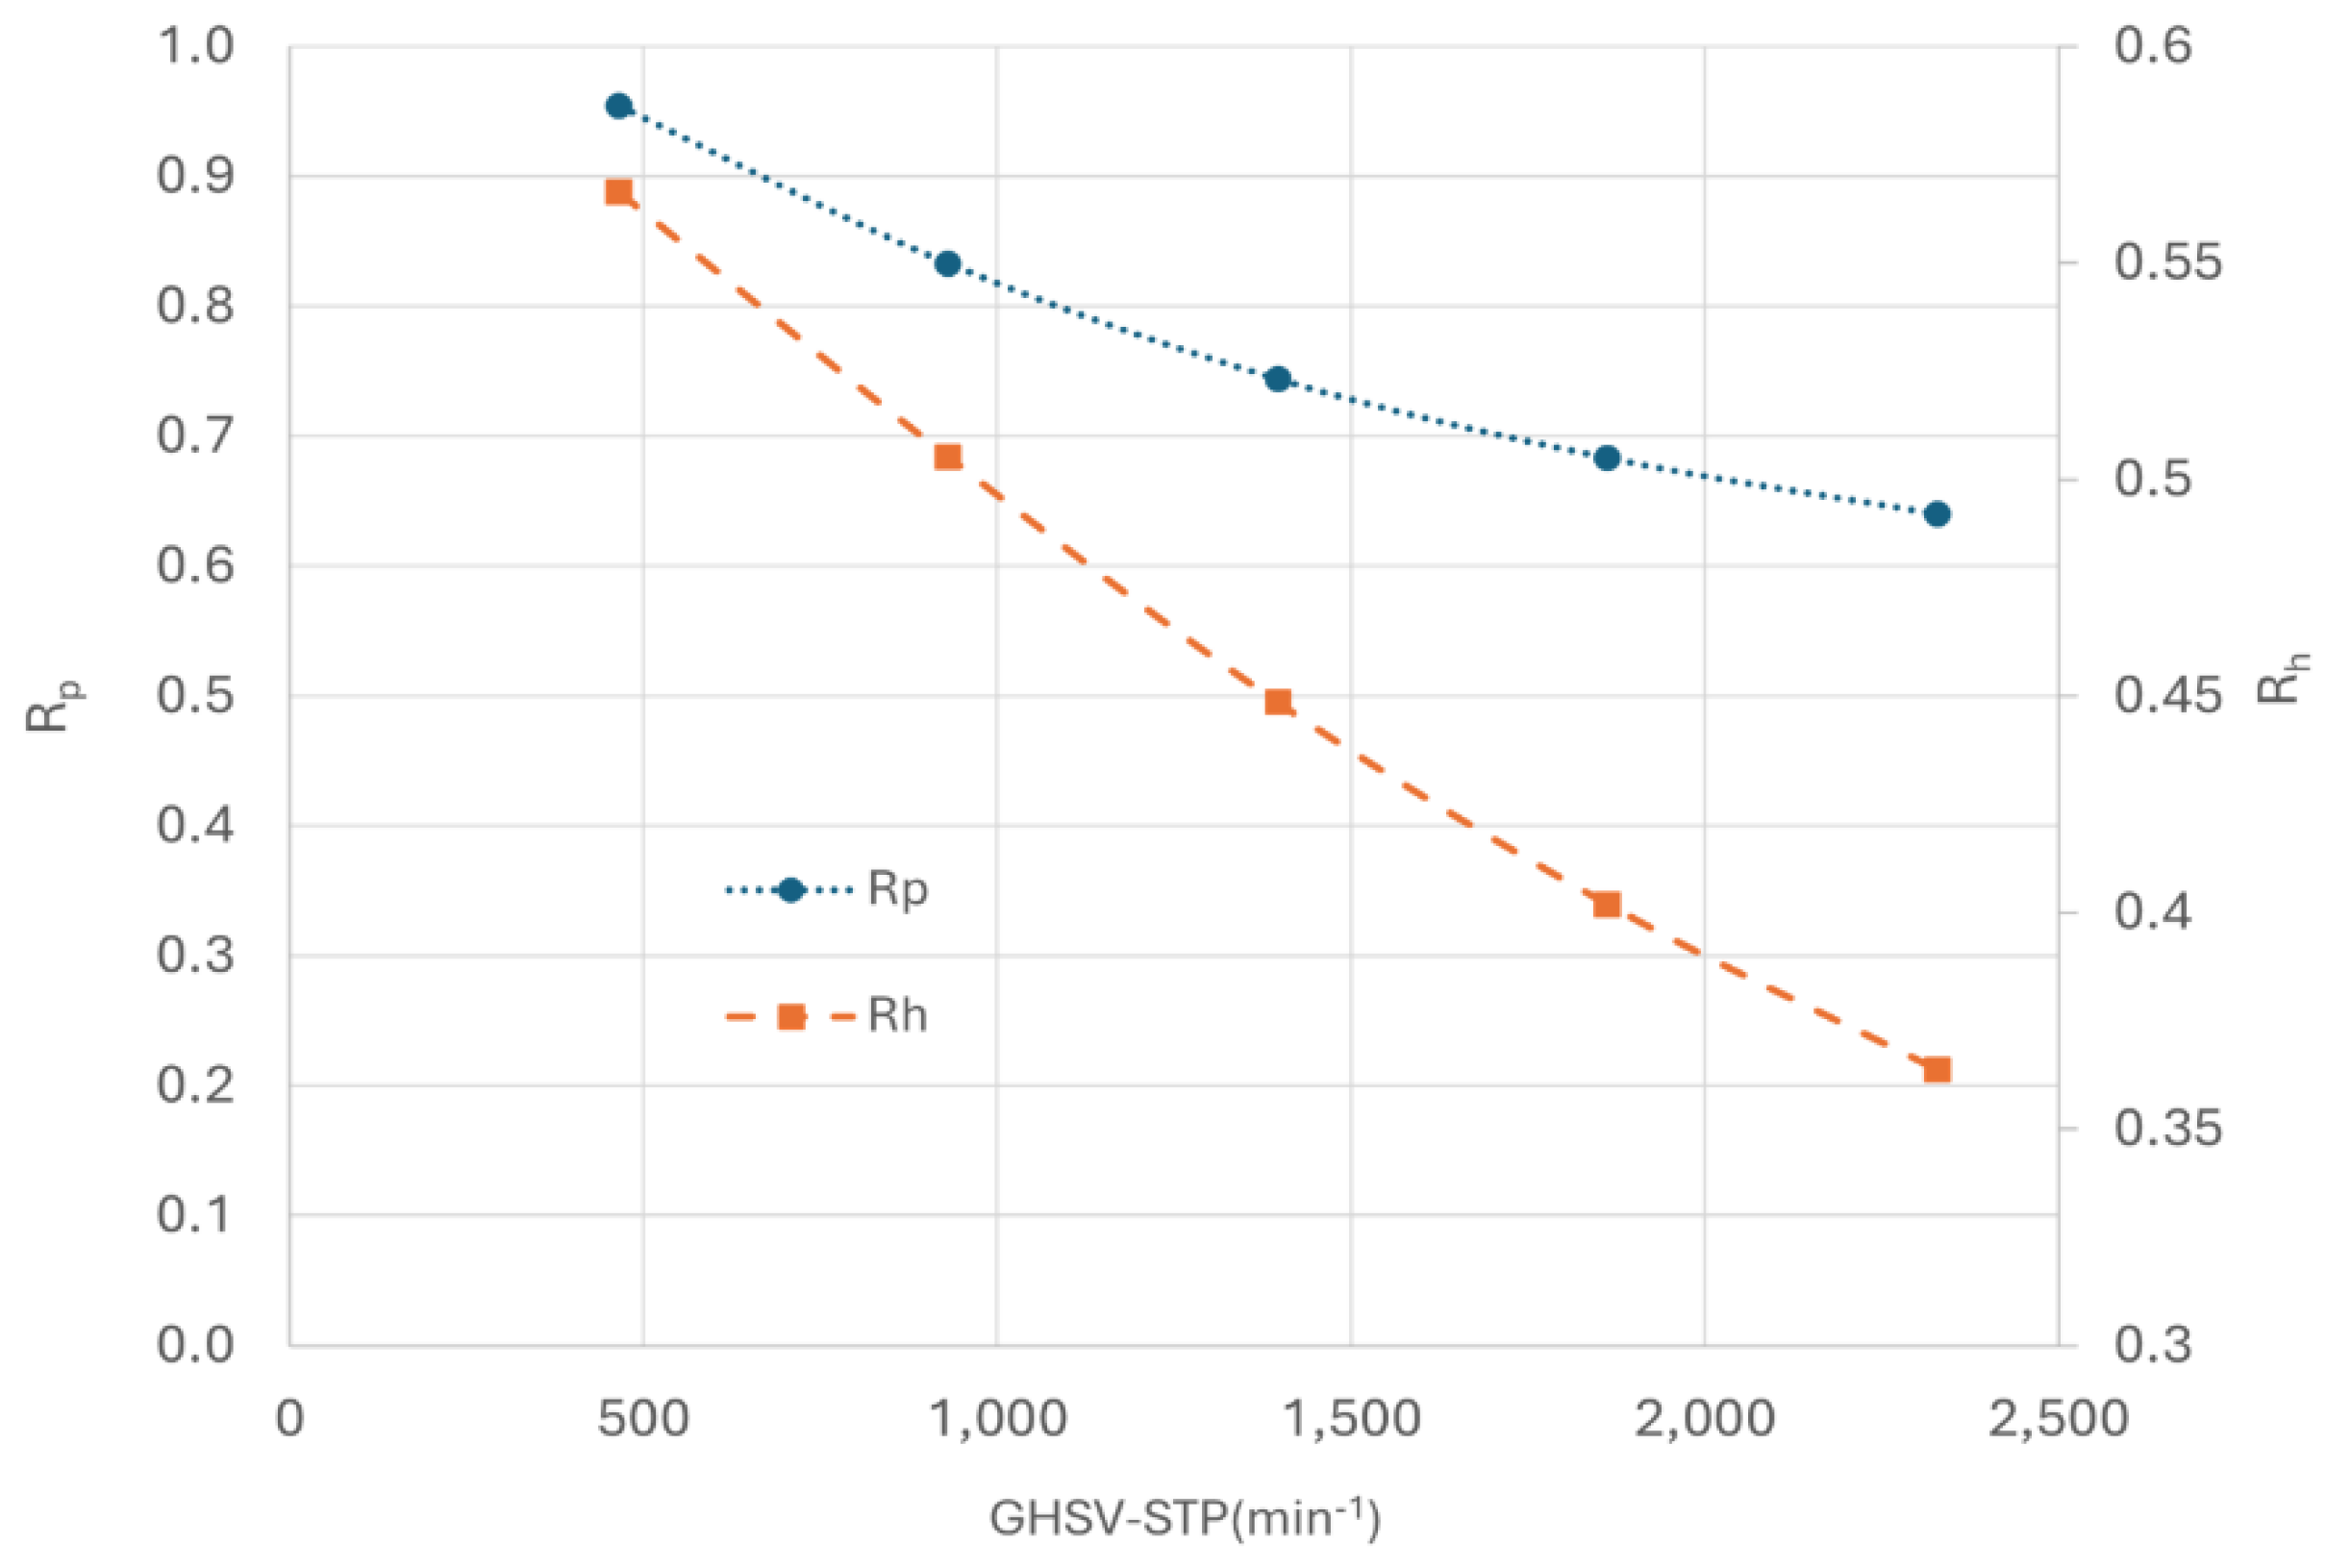
Figure 14.
Effect of cold flow rate on heat transfer performance.
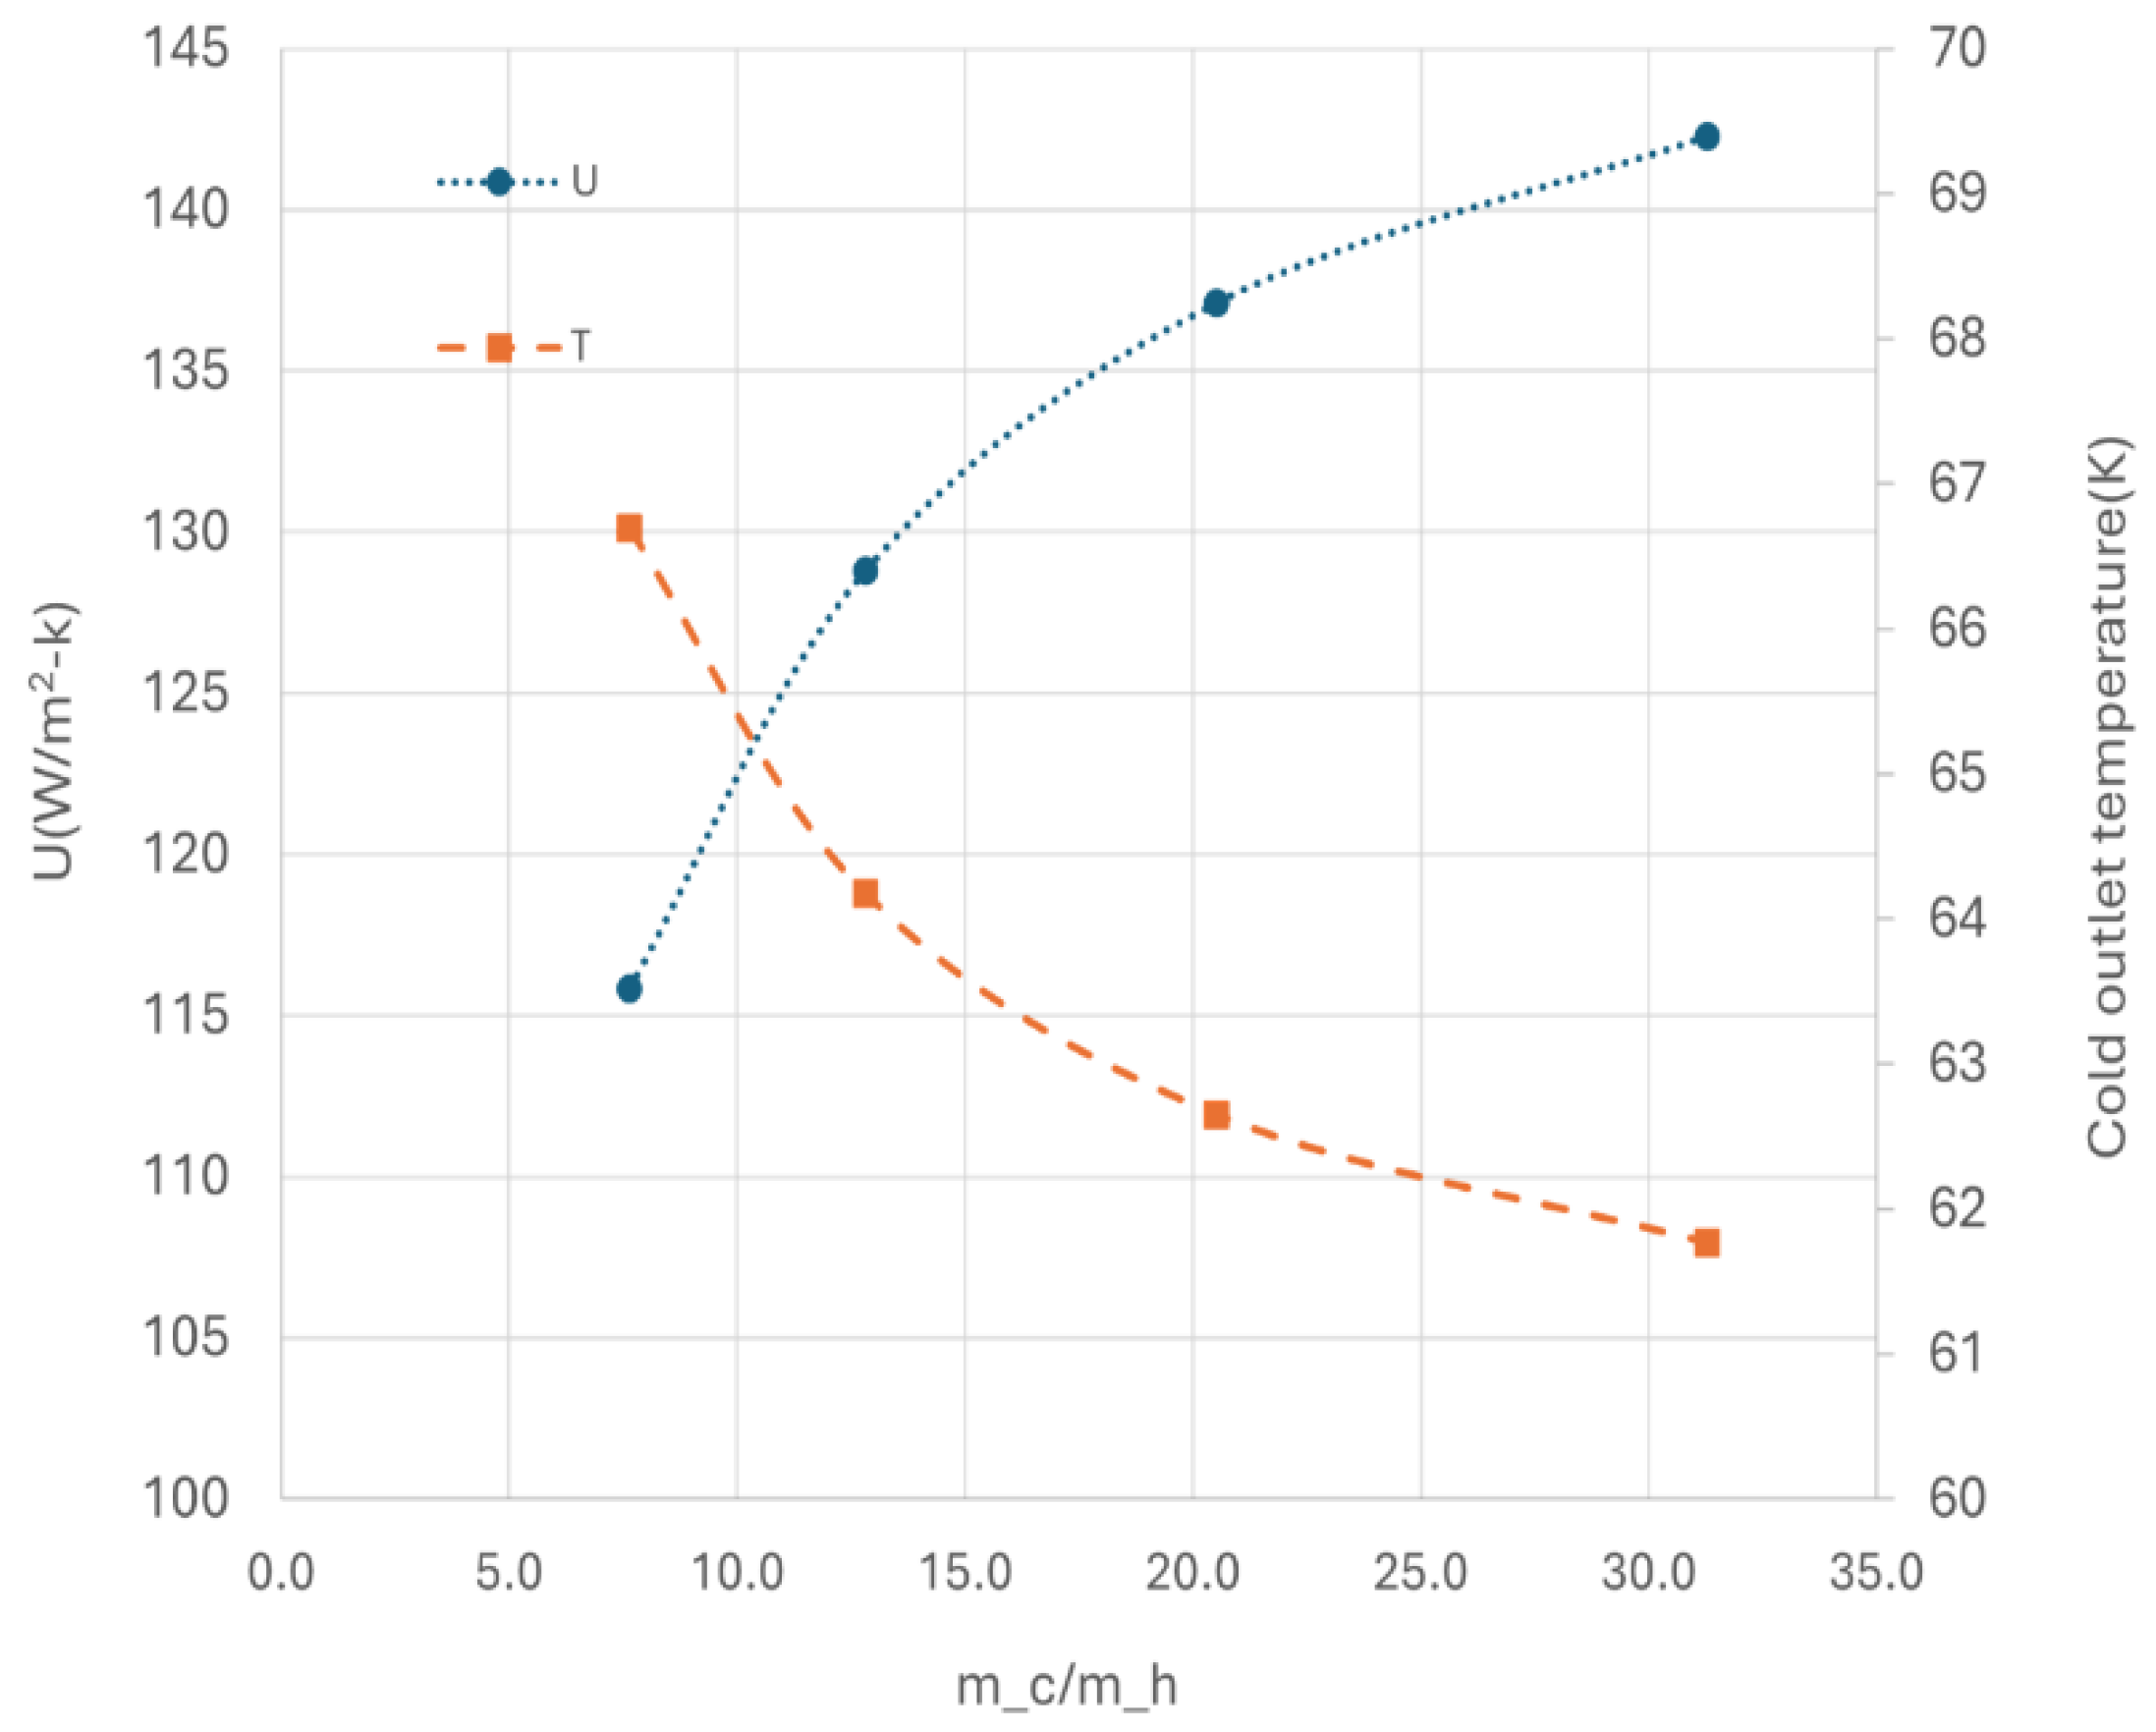
Figure 15.
Effect of cold flow rate on OPC efficiency.
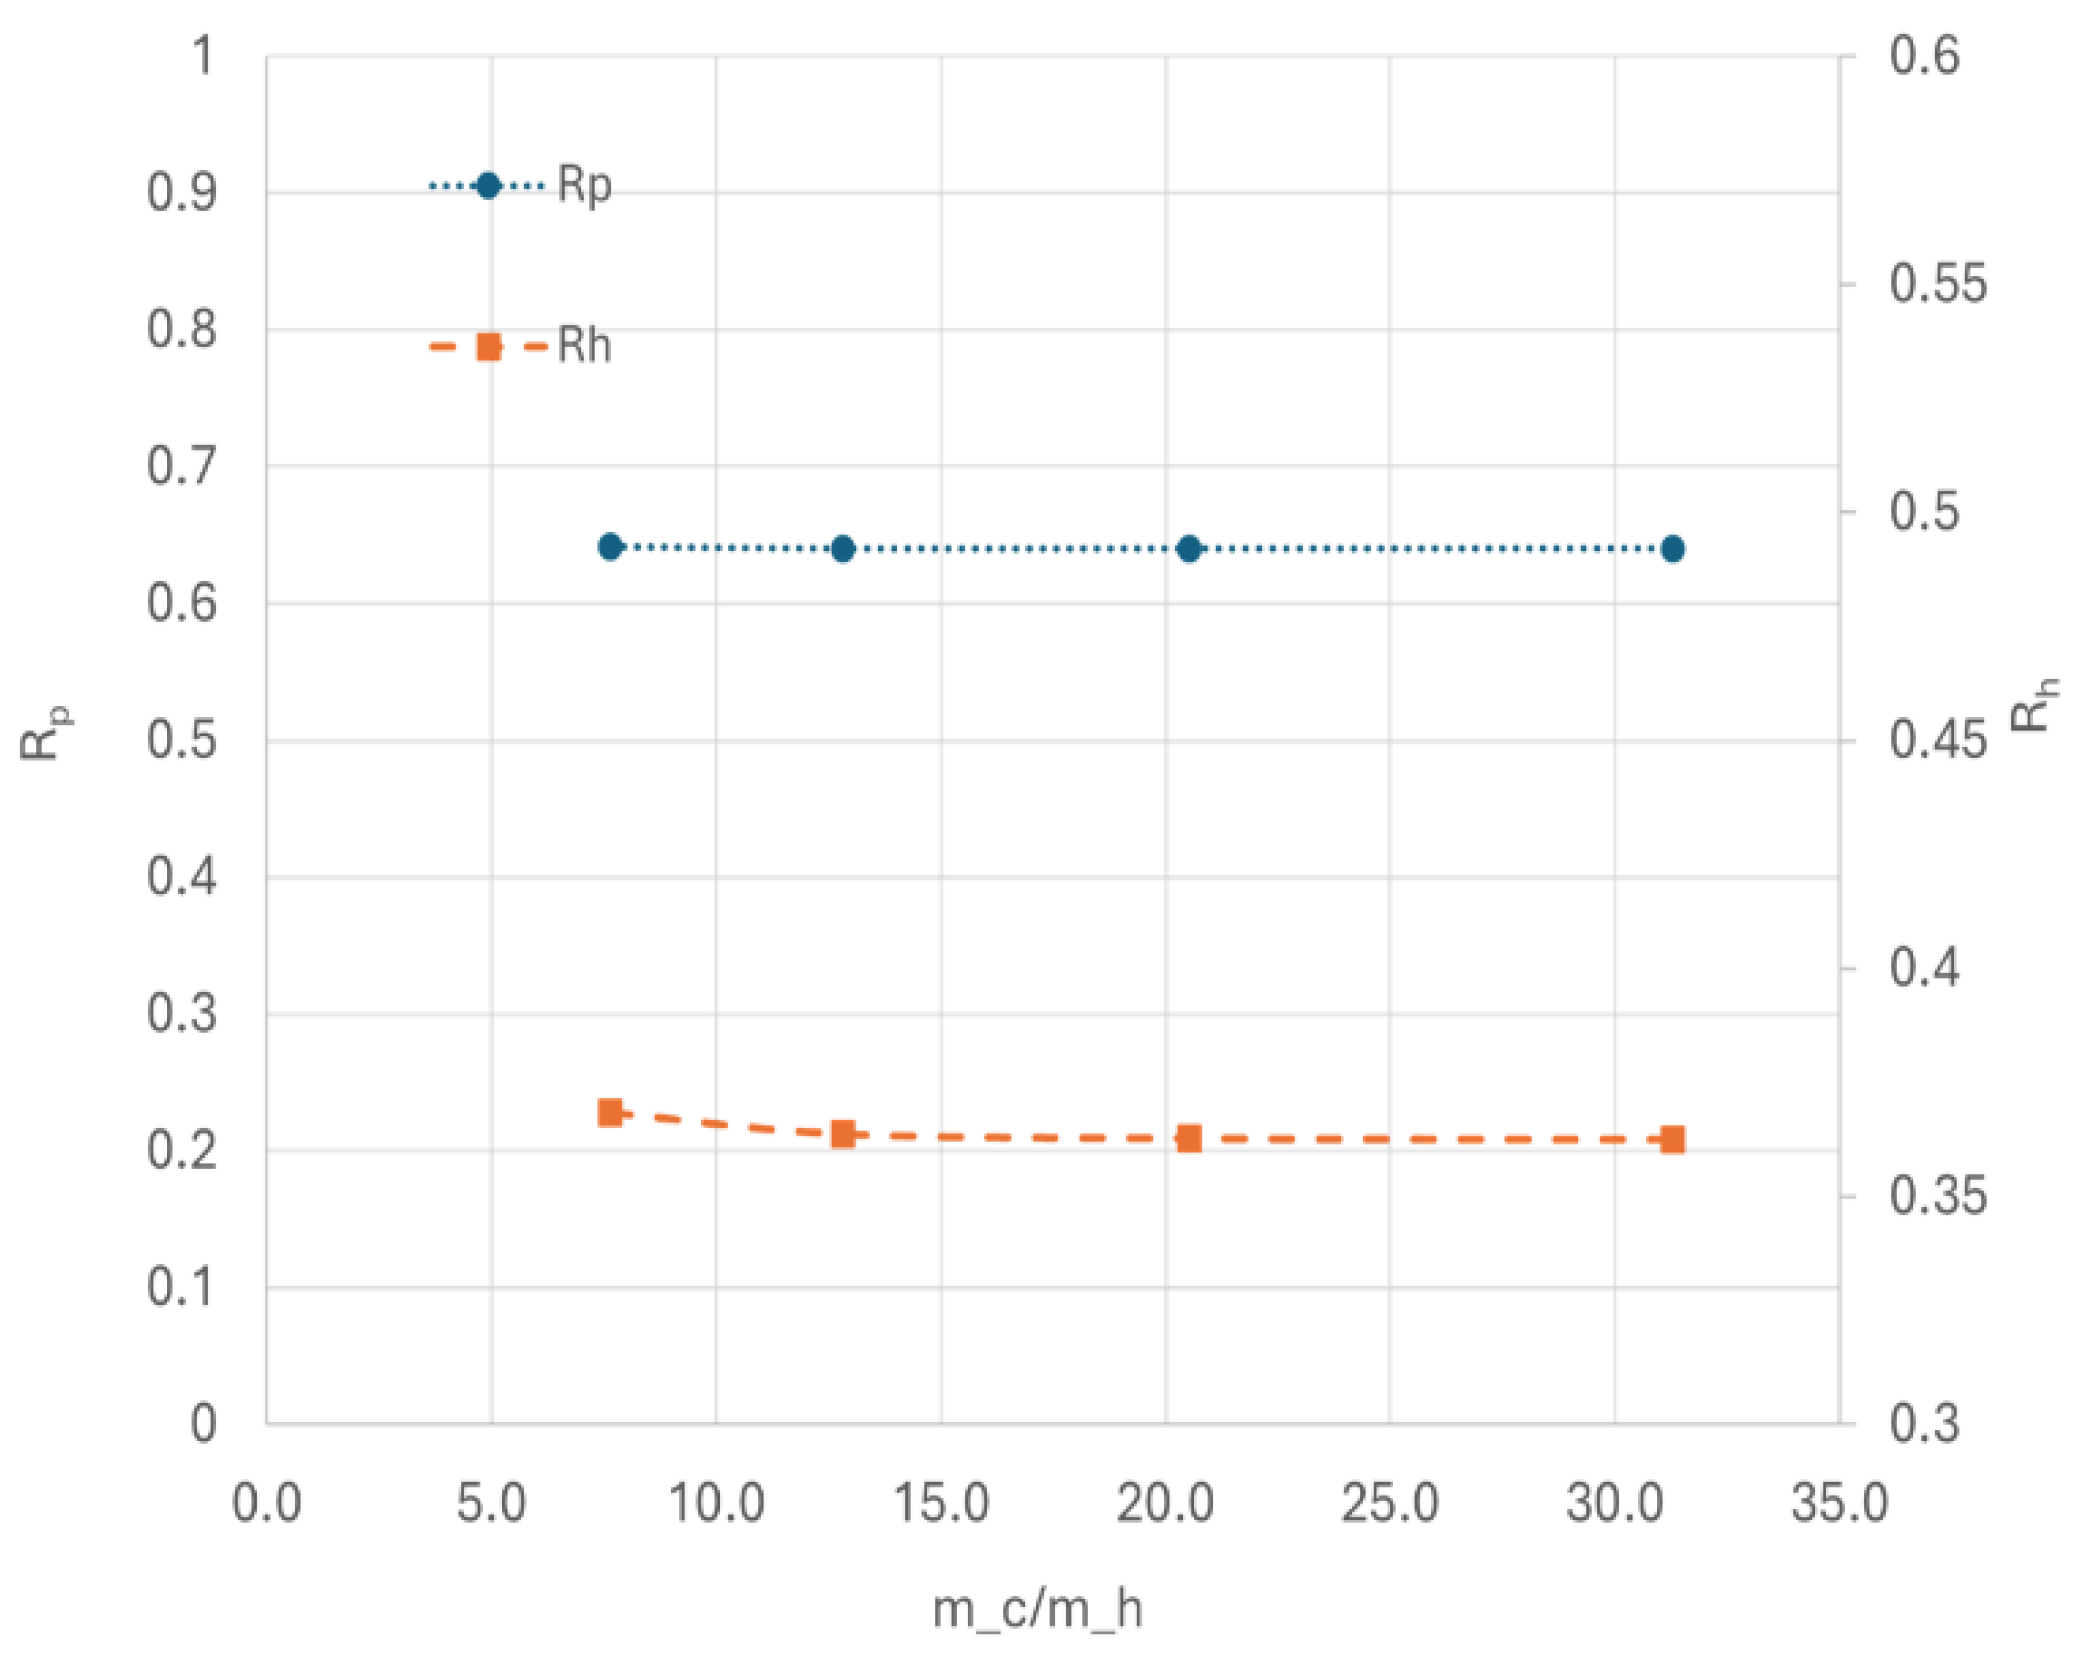
Figure 16.
Effect of OPC reaction rate on the heat transfer performance.
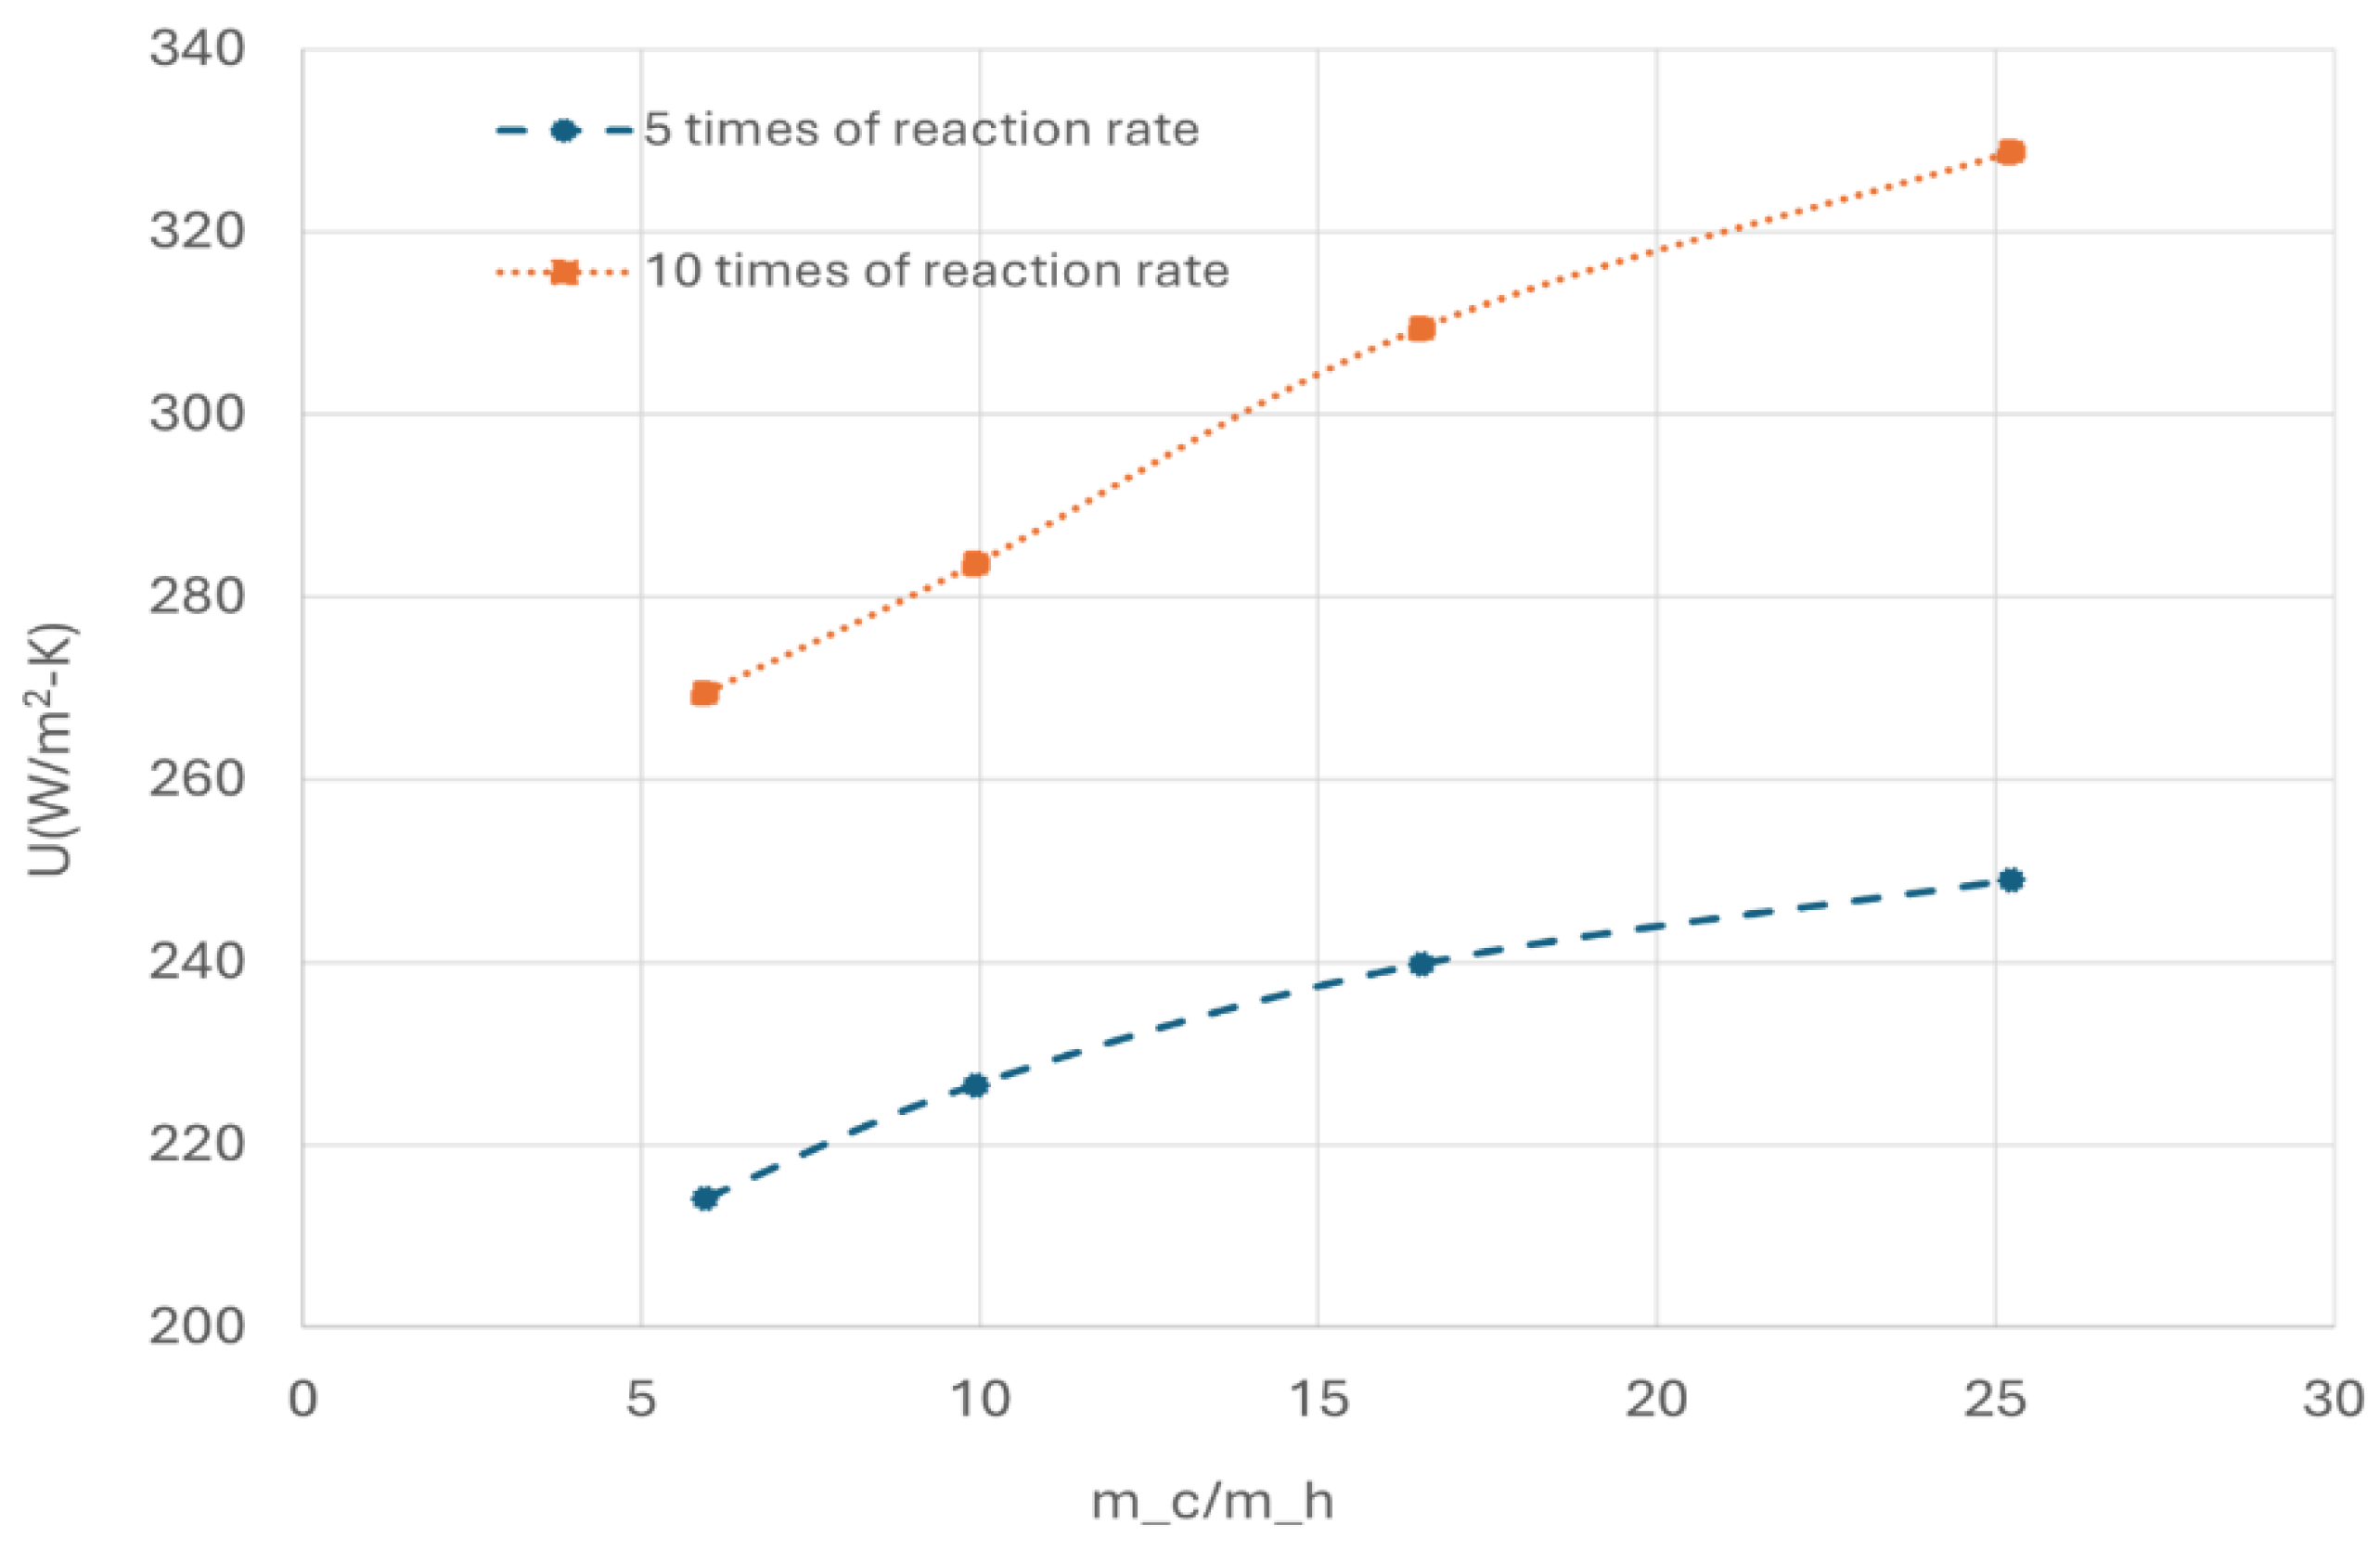
Figure 17.
Effect of kinetic parameters on OPC efficiency.
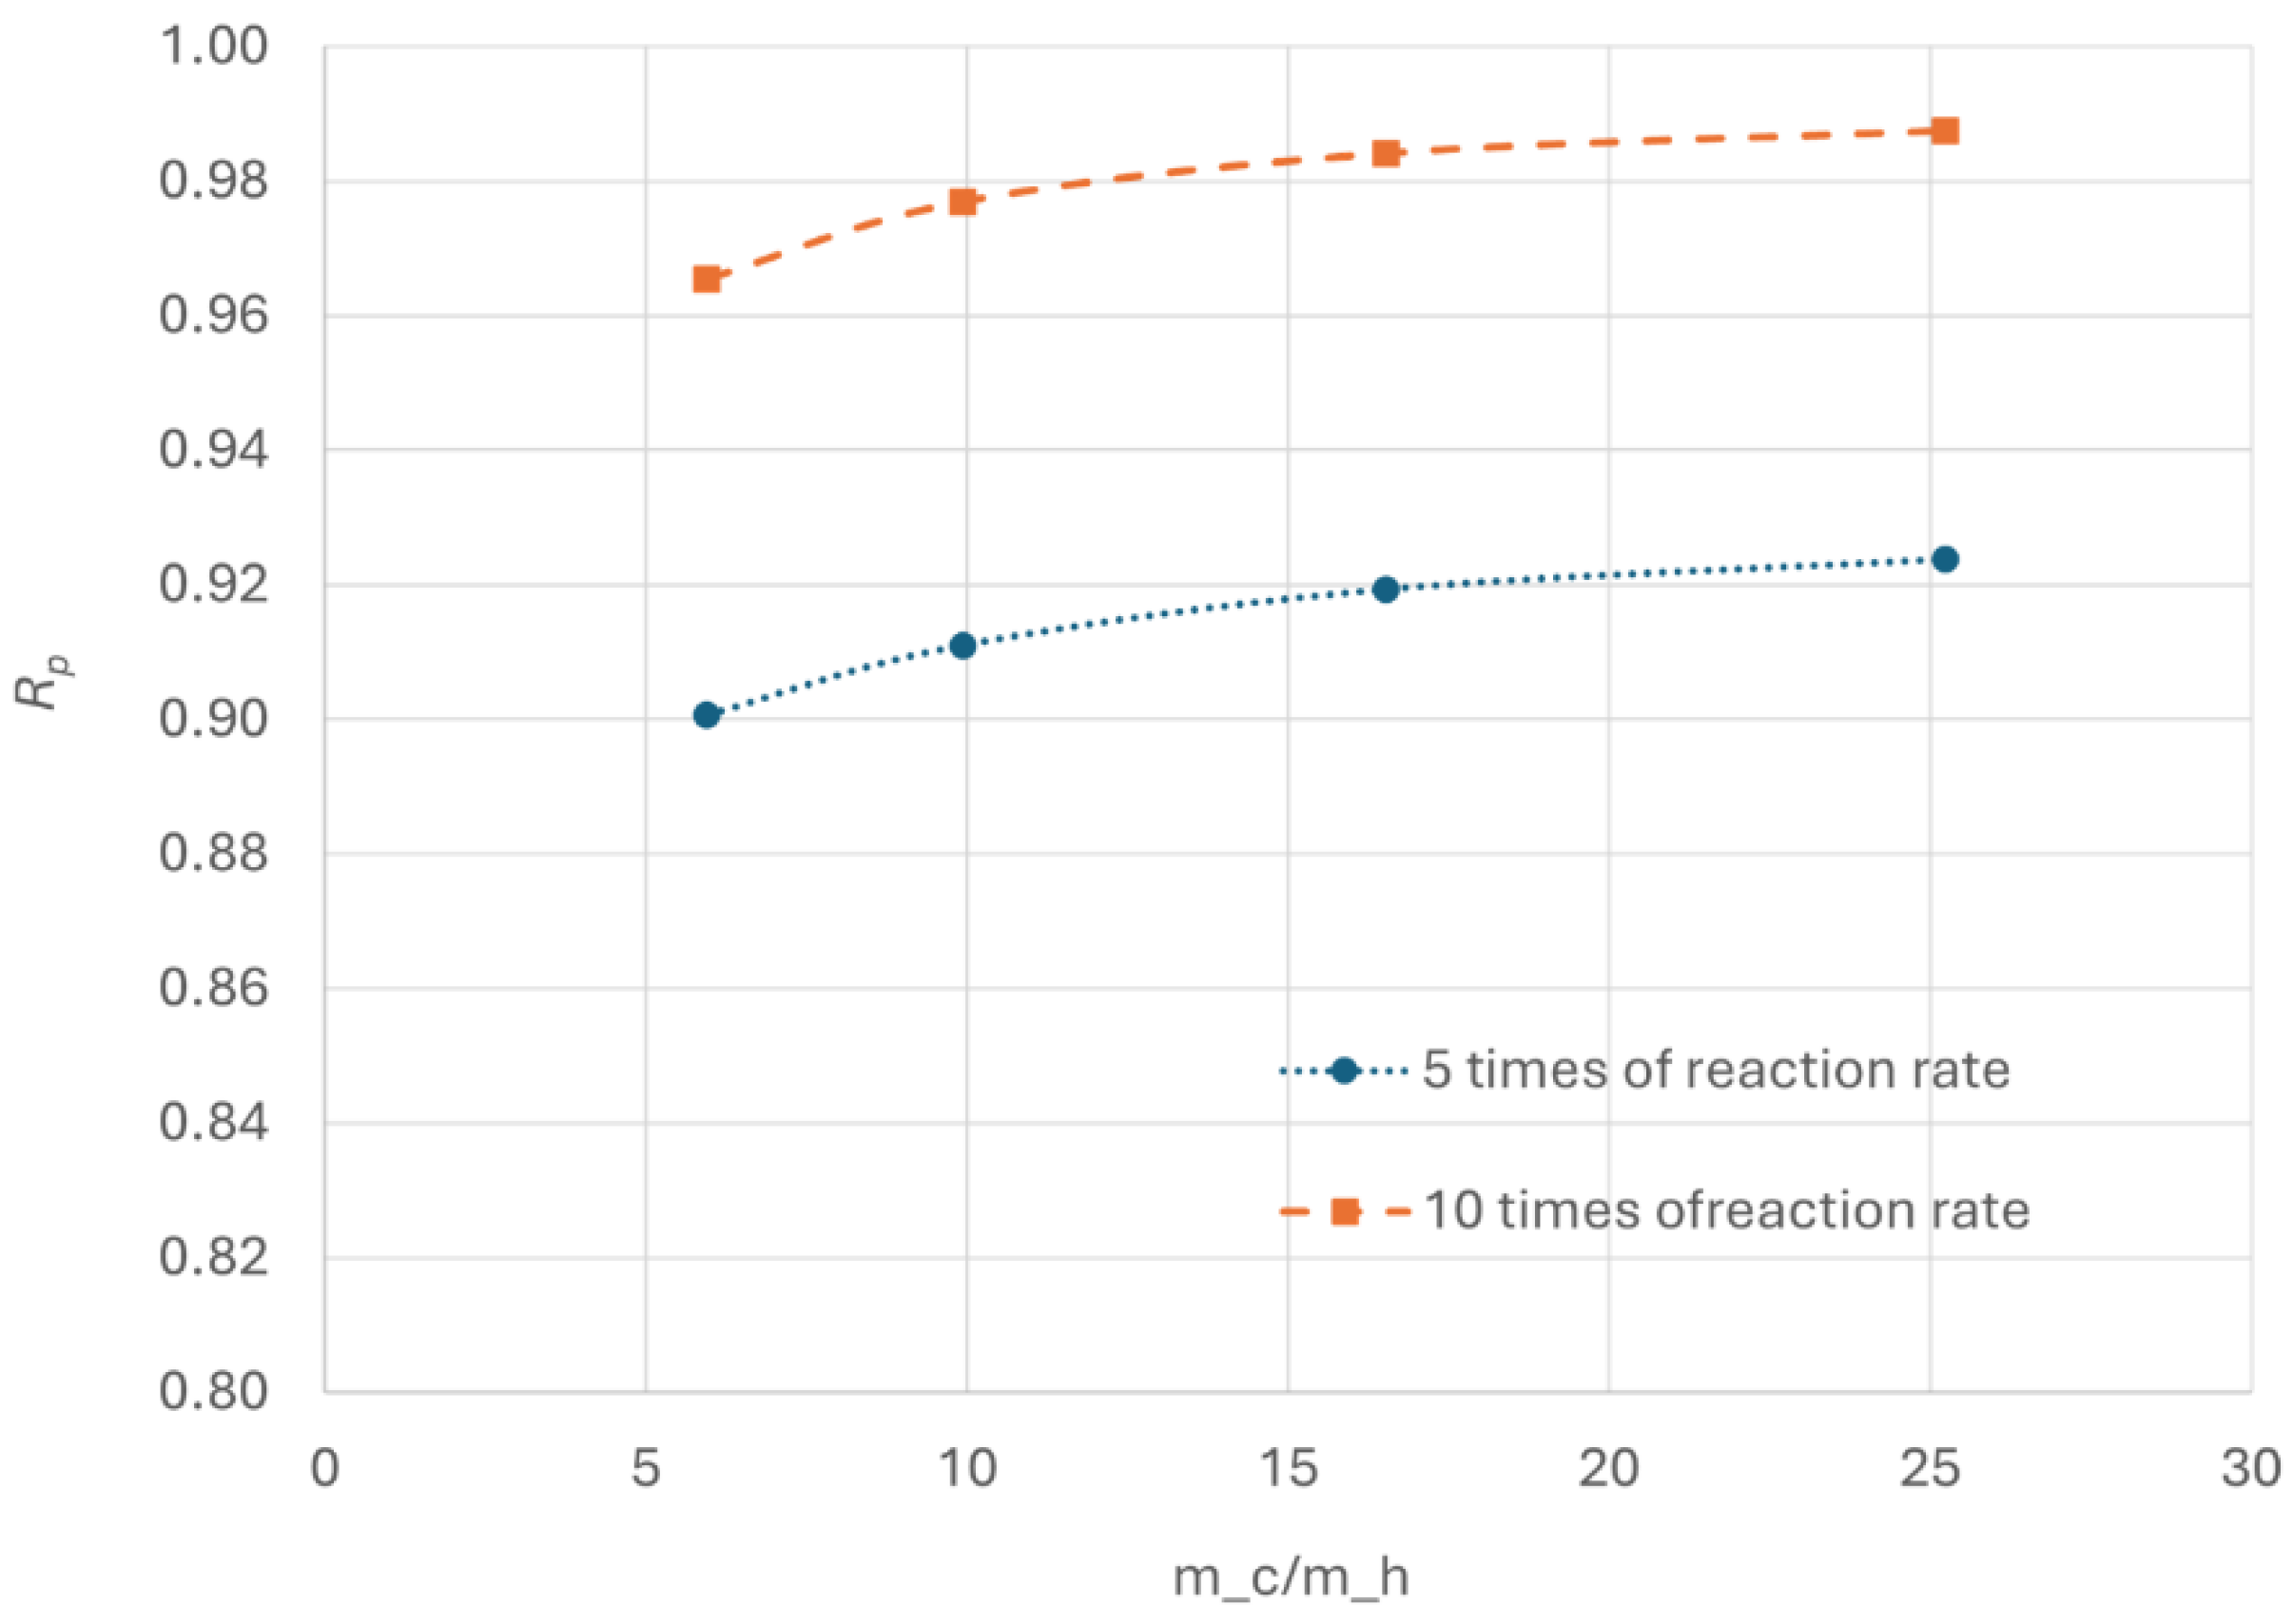
Figure 18.
Effect of operating pressure on OPC efficiency.
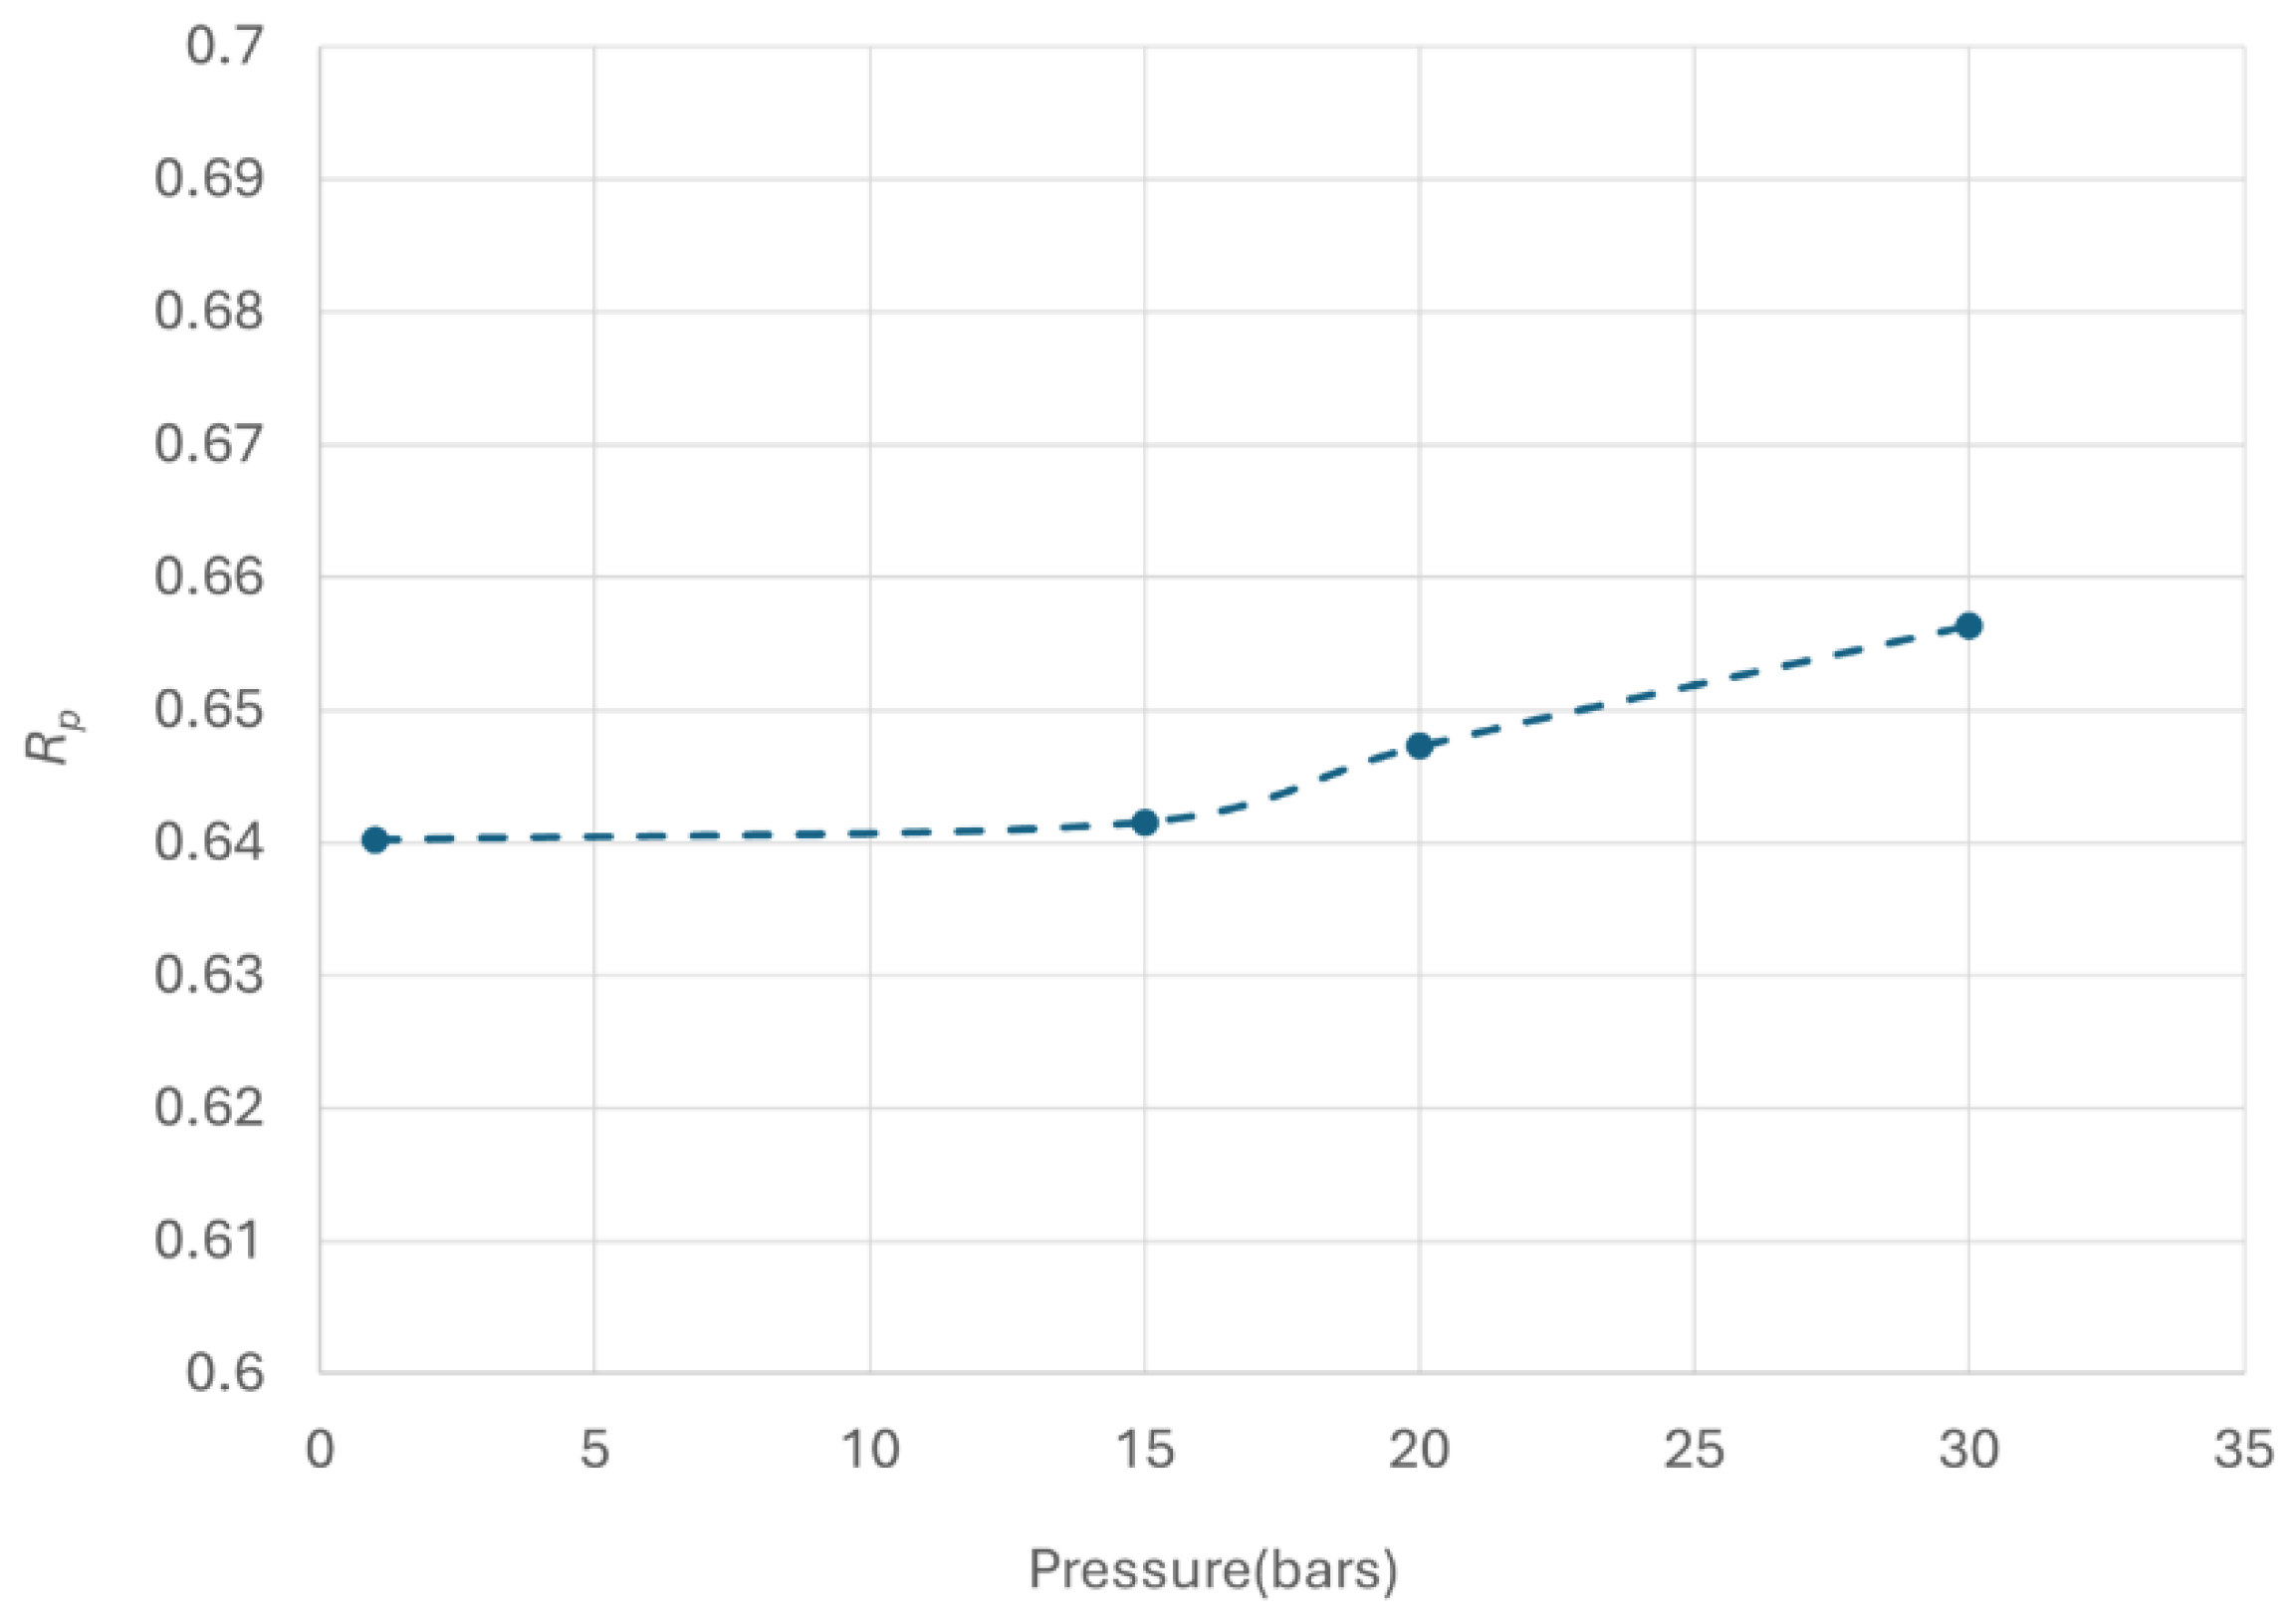
Figure 19.
Effect of gas velocity on the pressure drop of the catalytic bed.
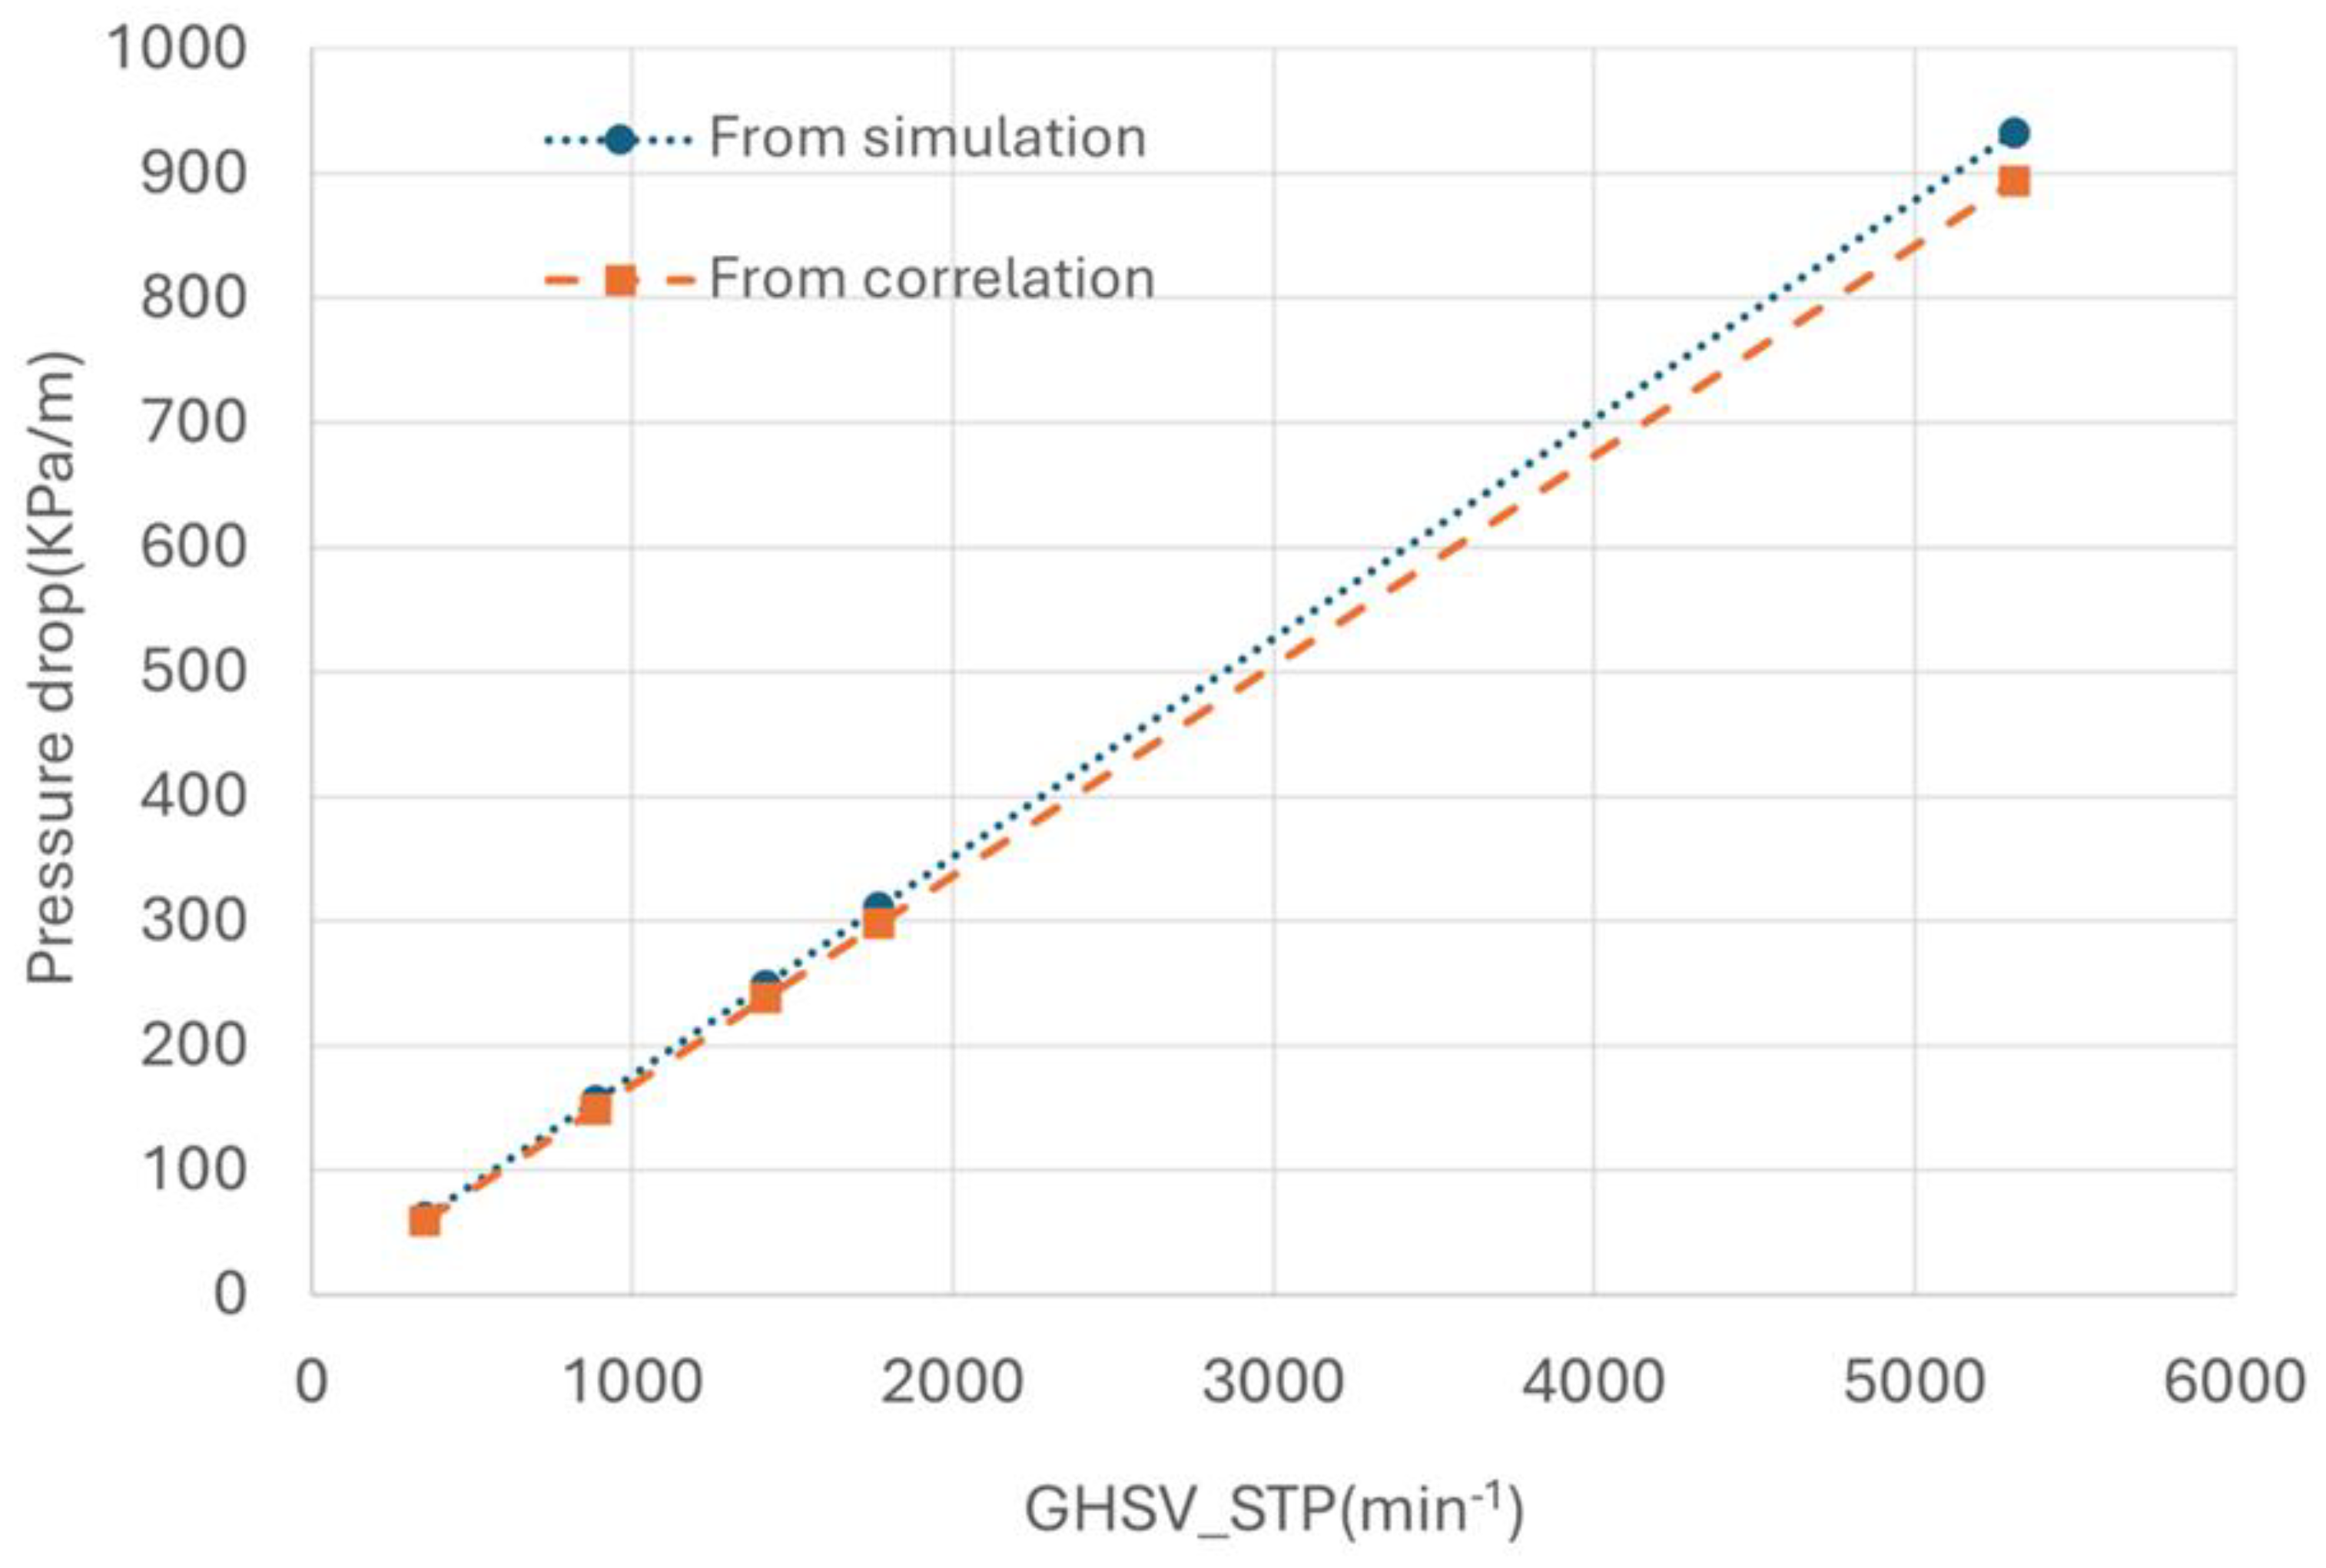
Figure 20.
Temperature distribution along the fin width at half fin height for the case with increase of catalyst thermal conductivity.
Figure 20.
Temperature distribution along the fin width at half fin height for the case with increase of catalyst thermal conductivity.
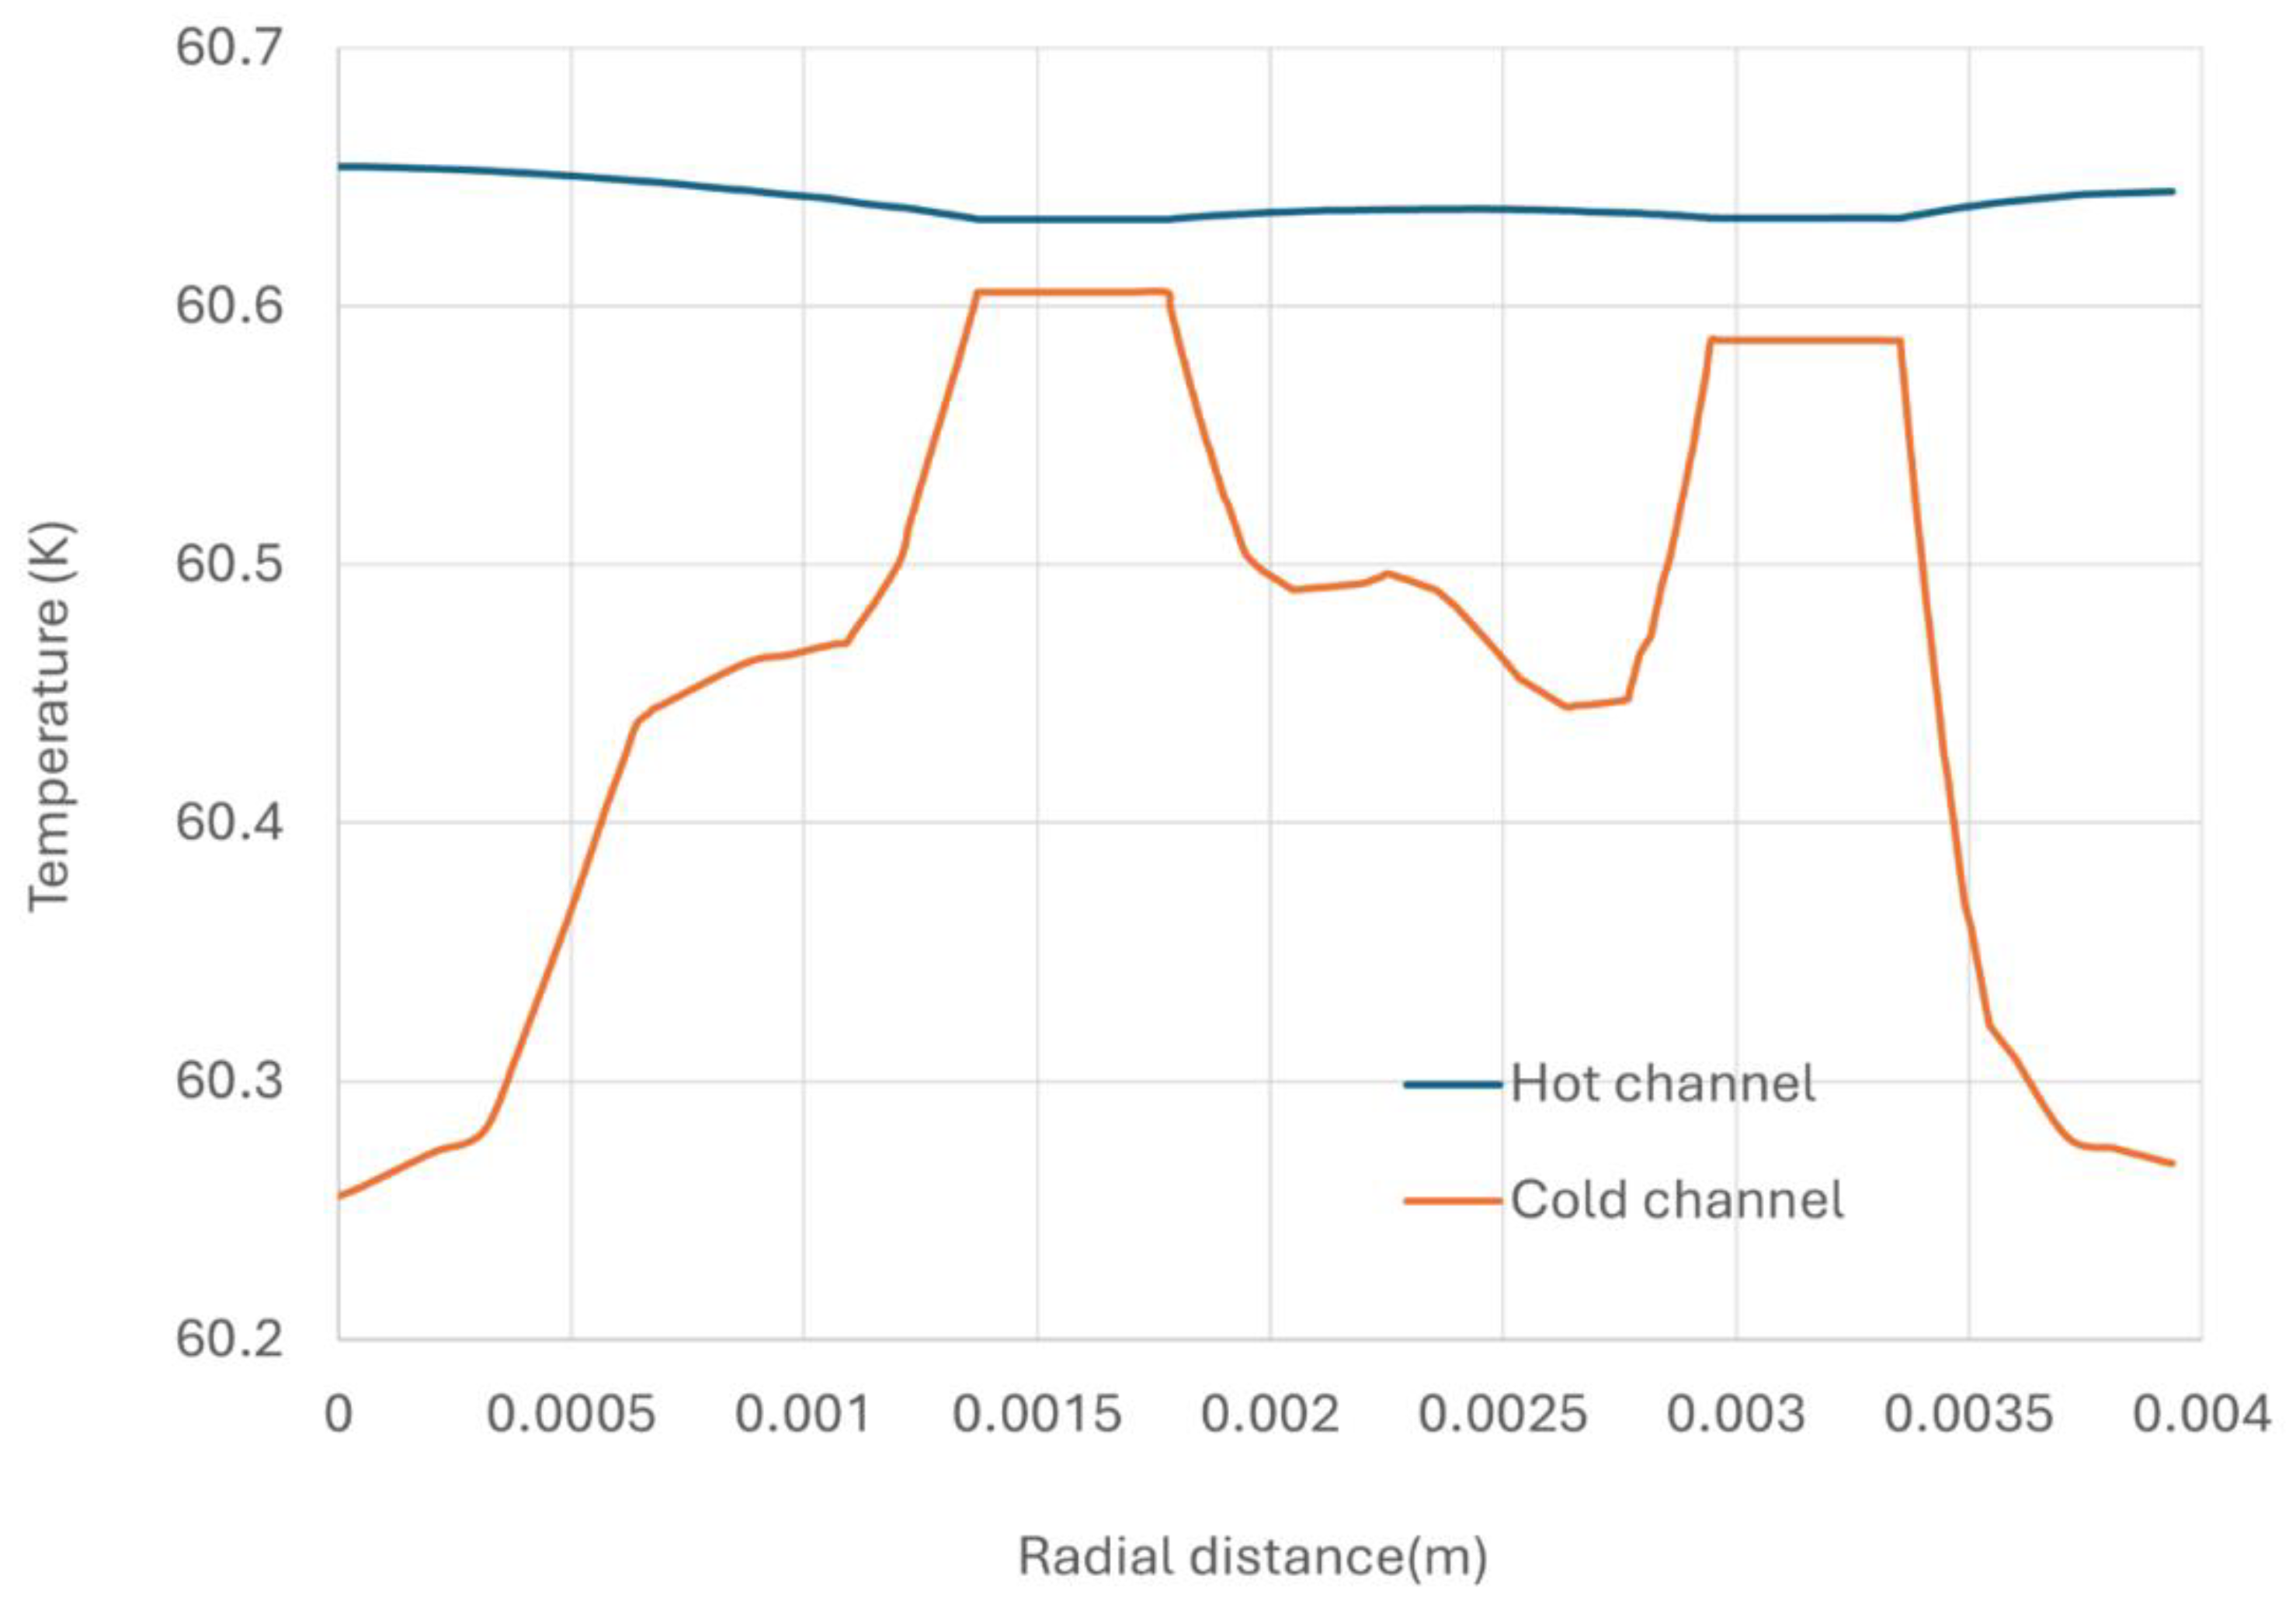

Table 1.
Structure parameters of the PFHE.
| Symbol | Item | Length (mm) | Comments |
|---|---|---|---|
| ac | Fin altitude | 6.7056 | 0.264 inch |
| tc | Fin thickness | 0.4064 | 0.016 inch |
| sc | Fin spacing | 1.1684 | 0.046 inch |
| lc | Fin serration length | 6.35 | 0.25 inch |
| ls | Stagged length | 0.5842 | 0.023 inch |
| ts | Parting sheet thickness | 0.8128 | 0.032 inch |
| lt | PFHE length | 127 | 20*lc |
| linout | Free flow path length | 15.875 | 2.5*lc |
Table 2.
Physical properties of solid material used in the model.
| Material | Density (kg/m3) |
Thermal conductivity (W/m-K) |
Specific heat (J/kg-K) |
Porosity (-) |
Permeability (m2) |
|---|---|---|---|---|---|
| Aluminium | 2700 | 138 | 334 | ||
| Ionex® | 5240 | 0.58 | 700 | ||
| Catalyst bed formed by Ionex® particles | 0.5 | 1.8E-11 |
Table 3.
Parameters for the LH kinetic model.
| Parameter | Unit | Value | Parameter | Unit | Value |
|---|---|---|---|---|---|
| J/mol | -586.28 | J/mol | 20.99 | ||
| a | 9.87 | a' | -1.15 | ||
| b | -144.5 | b' | mol/m3 | 132.28 |
Table 4.
Parameters for the LH kinetic model.
| Parameter | Unit | Value |
|---|---|---|
| J/mol | -336.45 | |
| afirst | 2.2 | |
| bfirst | -35.11 |
Table 5.
Parameters for the Elovich kinetic model.
| Parameters | Unit | value |
|---|---|---|
| 1.0924 | ||
| b | 0.0597 | |
| c | -0.2539 | |
| d | -0.0116 | |
| Tc | K | 32.937 |
| Pc | MPa | 1.28377 |
Disclaimer/Publisher’s Note: The statements, opinions and data contained in all publications are solely those of the individual author(s) and contributor(s) and not of MDPI and/or the editor(s). MDPI and/or the editor(s) disclaim responsibility for any injury to people or property resulting from any ideas, methods, instructions or products referred to in the content. |
© 2024 by the authors. Licensee MDPI, Basel, Switzerland. This article is an open access article distributed under the terms and conditions of the Creative Commons Attribution (CC BY) license (http://creativecommons.org/licenses/by/4.0/).
Copyright: This open access article is published under a Creative Commons CC BY 4.0 license, which permit the free download, distribution, and reuse, provided that the author and preprint are cited in any reuse.


