1. Introduction
Mesenchymal stem cells (MSCs) represent a promising source for cell-based therapies, thanks to their multipotent differentiation capacity [
1], their immunomodulatory properties [
2] and their availability from various tissue sources [
3]. In order to establish more physiologically relevant culture conditions and to better preserve the biological functionalities and characteristics of MSCs in vitro, 3D culture methods are utilized to emulate the microenvironment that cells encounter in vivo [
4].
Incorporating MSCs into hydrogels constitutes a core strategy for recapitulating the native interactions between cells and the extracellular matrix (ECM), thereby preserving the physiological properties of the cells [
5]. Hydrogels are water-swollen natural or synthetic polymeric networks, which are frequently used in research, diagnostics, and therapeutic applications as their adjustable chemical structure, network morphology and mechanical properties entail biocompatibility and, in many cases, resemblance to the cell ECM structure [
5]. Cell culture applications using hydrogels with embedded MSCs encompass tissue engineering [
6], drug testing, and disease modeling [
7] as well as, more recently, platforms for the production [
8] and delivery [
9] of extracellular vesicles (EV) for therapeutic purposes.
Among the various natural biomaterials investigated for hydrogel synthesis, cellulose stands out due to its cost-effectiveness, abundance, sustainability, as well as its demonstrated excellent biocompatibility with various human cell types [
10]. In contrast to widely utilized animal-derived natural biomaterials, including collagen, gelatin, and fibrin, which are commonly employed in the fabrication of biomaterial scaffolds [
11], plant-based biomaterials such as cellulose exhibit reduced immunogenicity [
12] and their synthesis and in vitro applications align with the principles of the 3Rs (Replacement, Reduction, and Refinement) in experimentation [
13]. Moreover, native cellulose offers facile modification opportunities due to its abundant accessible hydroxyl groups [
10].
Hydrogels prepared from anionic cellulose nanofibers (
to-CNFs), the latter obtained by cellulose oxidation using the metastable2,2,6,6-tetramethylpiperidine-1-oxyl (TEMPO) radical and subsequent delamination of the cellulose fibers by shear forces – have been demonstrated to support the in vitro cultivation of human breast cancer cells and mouse embryonic stem cells [
14]. We have recently shown that this type of hydrogel can effectively support the spreading, proliferation, and migration of human adipose-derived primary MSCs (adMSCs) [
15]. Our investigations on
to-CNF hydrogels have confirmed that anionic
to-CNFs besides their well-known nematic self-assembly in dilute aqueous dispersion state and gel formation triggered by acid-induced hydrogen bond formation, also interact with divalent cations present in the culture medium, such as Ca
2+ or Mg
2+ [
16]. Similarly, Ca
2+-induced ionic crosslinking has been explored in wound healing [
17] and osteoblast cultivation [
18] in vitro studies to further enhance the stability and integrity of
to-CNF hydrogels.
In addition to biomimetic materials for 3D cultivation, the optimization of more fundamental in vitro conditions has shown promise in preserving in vivo-like cell behavior. Dynamic cultivation of MSCs has been found to enhance proliferation [
19], differentiation [
20], and EV production capacities [
21] as it mimics the continuous dynamic environment cells experience in vivo. Another critical physiological parameter is oxygen concentration, which has gained significant scientific interest since the discovery of the hypoxia-inducible (HIF)-1 transcription factor. The commonly used 21% O
2 tension in stem cell cultures is considered hyperoxic compared to the average of 5% found in stem cell niches in vivo [
22]. In vitro hypoxia has been shown to affect numerous MSC features, including metabolism, proliferation, differentiation, immunophenotype expression, migration, apoptosis [
23], as well as EV production and functionality [
24]. Therefore, the strategic combination of these physiological parameters and methodologies holds significant potential for enhancing the therapeutic and diagnostic capabilities of in vitro cultured MSCs.
EVs are lipid bilayer-enclosed structures containing proteins, lipids and nucleic acid fragments, which are released by cells into the extracellular environment. They have recently garnered significant interest due to their roles in intercellular communication and potential therapeutic applications [
25]. EVs can be broadly classified into three main types based on their size and biogenesis: exosomes (30-150 nm), microvesicles (100-1000 nm), and apoptotic bodies (500-2000 nm). High-impact studies have demonstrated the role of EVs in various physiological and pathological processes, including cancer progression, immune modulation, and tissue regeneration [
25,
26]. For instance, research has shown that EVs derived from mesenchymal stem cells (MSCs) can promote tissue repair and modulate immune responses, highlighting their potential in regenerative medicine [
27]. Additionally, EVs are being explored as biomarkers for disease diagnosis and as vehicles for targeted drug delivery [
26].
In this study, we sought to improve the in vitro cultivation of human adMSCs within
to-CNF hydrogel spheres. To this end, we investigated different crosslinking strategies for aqueous
to-CNF dispersions and, more importantly, assessed the combinatorial effect of physiological conditions on cellular capabilities like proliferation, differentiation and immunomodulation in vitro. Drawing on existing literature, we explored the effects of an additional Ca
2+-induced crosslinking, in addition to the previously described nematic self-assembly process [
15], focusing on the mechanical properties of the resultant hydrogel spheres and their impact on encapsulated cultured cells. Subsequently, we examined the impact of static versus dynamic and normoxic (21% O
2) versus hypoxic (5% O
2) cultivation conditions on cell growth and differentiation capacities in response to more physiological cues during in vitro culture. This aspect was particularly intriguing as there is a paucity of studies investigating the effects of physiological in vitro culture aspects using cellulose-based hydrogels and MSCs. Finally, we evaluated the potential of
to-CNF hydrogel spheres as platforms for therapeutic EV production from adMSCs in scalable bioreactor systems. Cellulose hydrogels have been studied as cargo-loaded carriers for EVs in a limited number of studies [
28,
29], but, to our knowledge, not as platforms for the production of EVs from encapsulated MSCs. Given that EV production benefits from the use of bioreactors [
21] and large quantities of generated MSC EVs are required for therapeutic doses [
30], we tested the capacity of adMSCs encapsulated in to-CNF hydrogel spheres to produce EVs during cultivation in a scalable vertical wheel bioreactor setup.
Our findings indicate that the addition of CaCl2, intended to improve the mechanical performance of the hydrogel spheres obtained by self-assembly of to-CNF in the MSC cultivation medium, had the opposite effect. The CaCl2 addition, alongside the self-assembly process, reduced the mechanical properties of the material and adversely affected the cultured cells. However, cell proliferation and differentiation improved notably under dynamic and hypoxic conditions. Moreover, when cultured under dynamic and hypoxic conditions, adMSCs encapsulated within to-CNF hydrogel spheres yielded EVs with enhanced surface marker expression and potent immunosuppressive properties. These results further underscore the potential of to-CNF hydrogels and physiological culture conditions to benefit various applications including in vitro modeling, drug testing, and EV production.
2. Materials and Methods
If not stated otherwise, reagents were purchased from Sigma-Aldrich, Vienna, Austria.
2.1. Cells
2.1.1. adMSCs
The use of human tissue was approved by the ethics committee of the University of Lübeck, Germany (AZ 20-333, 4th November 2020), and the donor provided written consent. Human adipose-derived MSCs (adMSCs) were isolated within 24 hours after abdominal plastic surgery of a 29-year-old male donor, as previously described [
31]. Briefly, the fat tissue was minced with scissors and digested with collagenase type IA for 1 h at 37 °C. A series of centrifugation and washing steps were performed to obtain the stromal vascular fraction, which was then transferred into cell culture flasks and cultivated in expansion medium composed of MEM alpha (Minimum Essential Medium; Thermo Fisher Scientific, Waltham, MA, USA), 0.5% gentamicin (Lonza, Basel, Switzerland), 2.5% human platelet lysate (hPL, PL BioScience, Aachen, Germany), and 1 U/mL heparin (PL BioScience, Aachen, Germany) in a humidified incubator at 37 °C and 5% CO
2. When adMSCs reached approximately 80% confluency, they were detached using accutase (GE Healthcare, Little Chalfont, UK) and cryopreserved in MEM alpha, 2.5% hPL, 10% dimethyl sulfoxide (DMSO), and 1 U/mL heparin in liquid nitrogen. For
to-CNF hydrogel sphere encapsulation, cells were thawed, expanded for up to three passages in cell culture flasks (Sarstedt, Nümbrecht, Germany), and harvested by accutase treatment.
2.1.2. PBMCs
Whole blood samples from 5 donors were provided by the Red Cross Austria, Vienna (EK20210506_01). Samples were first diluted in a 1:2 ratio with RPMI 1640 culture medium (Thermo Fisher Scientific) supplemented with 2.5% hPL and 1 U/mL heparin and transferred dropwise into tubes containing Ficoll-Paque PLUS (Cytiva, Marlborough, MA, USA) in a ratio of 2:5. Tubes were then centrifuged twice at 500 G, first for 20 and then for 15 minutes. Subsequently, the supernatant plasma layer was discarded, and the peripheral blood mononuclear cell (PBMC) layer was collected. PBMCs were then washed twice with phosphate-buffer saline solution (PBS) and centrifuged at 350 G for 5 minutes. PBMCs from different donors were pooled together and stained with 5 μM carboxyfluorescein succinimidyl ester (CFSE, Merck, Darmstadt, Germany) for 15 minutes at 37 °C protected from light. Following staining, cells were washed with RPMI 1640 medium at 500 G for 5 minutes and cryopreserved in RPMI 1640, 2.5% hPL, 10% DMSO, and 1 U/mL heparin in liquid nitrogen.
2.2. Preparation of to-CNFs
Aqueous dispersion of negatively charged to-CNFs was prepared following a previously established protocol. At first, 40 g (dry weight) of never-dried bisulfite hardwood dissolving pulp (50% water content) were suspended in 1.8 L of deionized water and disintegrated using a household blender for 1 min. Next, 640 mg of 2,2,6,6-tetramethylpiperidine-1-oxyl (TEMPO) (0.1 mmol/g of cellulose) and 4 g of NaBr (1 mmol/g of cellulose) were added to selectively oxidize the primary hydroxyl groups (C6) of cellulose. 60 mL of NaClO solution (available chlorine 10–15%) was added gradually to the mixture at room temperature, under constant stirring (1000 rpm) and with continuous pH adjustment to 10 accomplished using 0.1 M NaOH. After the addition of NaClO, the oxidized cellulose was given 30 min of reaction time under constant stirring before it was washed with deionized water and filtered multiple times. The oxidized pulp was then postoxidized by suspending the material in 1 L of 0.1 M CH3COOH solution and adding 9.72 g NaClO2 (2.7 mmol/g of cellulose), under constant stirring (1000 rpm) at room temperature overnight, in order to convert remaining intermediary aldehyde groups into carboxyl moieties. Following chlorite oxidation, and multiple washing steps by vacuum-aided filtration, the obtained 6-carboxyl cellulose was disintegrated in water to give a 0.5% w/w suspension. After adjusting pH 8 by addition of diluted NaOH, the aqueous suspension was subjected to repeated (eight passes) mechanical defibrillation at 80 MPa using a benchtop homogenizer (APV 1000, AxFlow GmbH, Premstätten, Austria). Aiming to reduce viscosity (and hence heating during nanofibrillation), the dispersion was diluted to 0.125% during the first three passes. After homogenization, the dispersion of negatively charged cellulose nanofibrils was up-concentrated to a final concentration of 0.7% wt. using a rotary evaporator (40 °C, 4.5 kPa), and the pH was adjusted to 7.
2.3. Cell Encapsulation in to-CNF Hydrogels Spheres for In Vitro Cultivation
adMSCs were thawed and expanded for one passage in cell culture flasks, following the procedure detailed in
Section 2.1. After expansion, the cells were harvested using accutase and resuspended in an appropriate volume of standard expansion medium (composed of MEM alpha, 2.5% ultracentrifuged human platelet lysate, and 1 U/mL heparin) for encapsulation in the hydrogel spheres. The final aqueous
to-CNF dispersion (0.7% wt.) was combined with the cell suspension using a Vortex-Genie 2 vortex mixer to achieve a bulk concentration of 0.5% wt.
to-CNFs in the final hydrogels.
Subsequently, 15 μL of the viscous cell containing material was pipetted until it formed a hanging drop and placed in a 6-well plate (6 hydrogel spheres per well). The CNF hydrogel spheres were allowed to crosslink for 10 minutes, with or without being submerged in a 100 mM CaCl
2 solution in standard expansion medium (pH 7). The concentration of the CaCl
2 crosslinking solution was chosen based on parameters established in other relevant studies. [
17,
18,
32,
33]. After incubation, the samples submerged in the CaCl
2 solution were washed twice with standard expansion medium, and then 4 mL of the same medium were added to all wells. The samples were placed in an incubator at 37°C and 5% CO
2, with oxygen levels set at either 21% or 5%, and were either kept static or placed on a gyroscopic shaker at 70 rpm during cultivation. The well plates were coated with agarose to prevent background noise in the analyses from cells growing on the tissue culture-treated surface of the wells.
Samples were prepared with a cell concentration of 5 × 10⁵ cells/mL of hydrogel spheres, and hydrogel spheres without cells served as controls. Media changes were performed twice per week.
In order to enhance the physiological relevance of the study’s outcomes, all cell culture experiments were performed without the addition of antibiotic supplements. Although antibiotics offer protective effects, their documented detrimental impact on cell culture warranted their exclusion [
34].
2.4. to-CNF Hydrogel Sphere Cultivation in Bioreactors
to-CNF hydrogel spheres were prepared according to the methodology described in
Section 2.3. After preparation, the hydrogel spheres were placed in 6-well plates and cultivated on a gyroscopic shaker at 70 rpm for 24 hours prior to bioreactor inoculation. Subsequently, the PBS-0.1 Mini vertical wheel bioreactors (PBS Biotech, Camarillo, CA, USA) were seeded with 60
to-CNF hydrogel spheres and 100 mL of standard expansion medium. The mixing speed was set at 30 rpm, and the bioreactors were placed in an incubator maintained at 37°C, 5% CO
2, and either 21% or 5% O
2 for 21 days. Medium replacement was performed once per week, replacing half the volume of the culture.
To eliminate xenogenic components and minimize contamination of harvested EV populations with non-MSC EVs, ultracentrifuged hPL was used as a serum supplement in the adMSC EV production cultures [
35].
2.5. Live/Dead Cell Visualization
After the cultivation period, samples were stained with 4 μL/mL calcein acetoxymethyl (calcein AM; Invitrogen, Thermo Fisher Scientific, Waltham, MA, USA) and 4 μL/mL propidium iodide (PI; Invitrogen) in PBS to visualize live and dead cells. The samples were then incubated for 1 hour on a gyroscopic shaker (70 rpm) at 37 °C in the dark, washed twice with PBS, and transferred to fresh standard expansion medium for fluorescence microscopic analysis.
2.6. Cell Metabolic Activity Assessment
The metabolic activity of the to-CNF hydrogel sphere encapsulated adMSCs was assessed using a resazurin-based viability assay (In vitro Toxicology Assay Kit; TOX8) according to the manufacturer’s instructions. After removing the supernatant from the cultures, the same volume of standard expansion medium containing 10% TOX8 was added. The welled plates were then incubated for 3 hours on a gyroscopic shaker (70 rpm) at 37 °C and 5% CO2. Following incubation, the fluorescence intensity of the supernatant was measured at 590 nm at an excitation wavelength of 560 nm using an Infinite M1000 plate reader (Tecan, Männedorf, Switzerland). The measured values were normalized to blank controls.
2.7. DNA Quantification
At the end of the cultivation period in the well plates, the culture medium was removed, and the to-CNF hydrogel sphere samples were washed with PBS. Subsequently, they were individually transferred to 1.5 mL Eppendorf tubes and mechanically disrupted using a spatula. Next, 500 μL of lysis buffer (10 mM Tris HCl pH 8.5 (AppliChem, Darmstadt Germany), 5 mM ethylenediaminetetraacetic acid (EDTA), 0.2% sodium dodecyl sulfate (SDS; AppliChem), 0.2 M NaCl, 0.1 mg/mL proteinase K) were added to each tube and samples were incubated overnight on an Eppendorf Thermomixer comfort (Eppendorf, Hamburg, Germany) at 55°C and 700 rpm. Following the overnight incubation, the temperature was increased to 85°C for 45 minutes for proteinase K inactivation, and then cooled down at 4°C for 20 minutes. The samples were centrifuged at 1000 G for 2 minutes and the supernatant was carefully aspirated without disturbing the hydrogel fragment pellet.
The DNA content in the lysed sample supernatants was determined using a Quant-iT™ PicoGreen™ dsDNA Assay Kit (Thermo Fischer Scientific), according to the manufacturer’s instructions. The fluorescence intensity of the samples was measured at 520 nm with an excitation wavelength at 480 nm, using an Infinite M1000 plate reader (Tecan). The measured values were normalized to blank controls and to the DNA content of known cell numbers using the same kit and cells.
2.8. Isolation of Extracellular Vesicles
Cell culture supernatants collected during media changes were pooled together and consecutively centrifuged at 300 G (10 minutes) and 2000 G (20 minutes) at room temperature to remove cells and debris. These solutions were then transferred into ultracentrifugation tubes (Beckman-Coulter, Brea, CA, USA) and subjected to an additional centrifugation step at 100,000 G, 4°C, for 90 minutes using an Optima LE-80 ultracentrifuge with SW 32 Ti rotor (Beckman Coulter). The resulting pellets were resuspended in 200 μL Ca2+/Mg2+-free PBS (PAN Biotech, Aidenbach, Germany) and stored at −80°C until used for further analysis. The same volume of MEM alpha medium with 2.5% ultracentrifuged hPL and 1 U/mL heparin was processed accordingly for use as blank control.
2.9. Protein Concentration Assay
The protein concentration of the cell culture media supernatants, following clearing and ultracentrifugation, was measured using a BCA protein Assay Kit (Micro BCA™ Protein Assay Kit, Thermo Fischer Scientific), The absorbance of the samples was measured at 562 nm, using an Infinite M1000 plate reader (Tecan). The measured values were normalized to blank controls.
2.10. Nanoparticle Tracking Analysis
The particle concentration and size distribution in the cell culture supernatants were determined using nanoparticle tracking analysis (NTA). To distinguish EVs from non-lipid membrane particles, samples were stained with CellMask™ (Invitrogen). Stained samples were diluted in Ca2+/Mg2+-free PBS and analyzed using a ZetaView x30 Twin (Particle Metrix, Inning, Germany). Data were acquired in one cycle of measurement over 11 laser scattering and fluorescence measurement positions and analyzed using the corresponding instrument software (ZetaView 8.05.16 SP3, Particle Metrix).
2.11. PBMC Co-Culture with adMSCs or adMSC-EVs
The immunomodulatory potential of EVs derived from adMSCs encapsulated within
to-CNF hydrogel spheres during cultivation in the vertical wheel bioreactor was evaluated using a previously described T-cell-based potency assay [
36]. In brief, PBMCs were seeded in 24-well plates at a density of 5 × 10
5 cells/well in RPMI 1640 medium supplemented with 2.5% hPL and 1 U/mL heparin. Following a 24-hour incubation period, either 1 × 10
5 adMSCs or 4 × 10
8 adMSC-derived extracellular vesicles (adMSC-EVs) produced from normoxic and hypoxic cultures in a vertical wheel bioreactor were added to each well. In addition, 5 μg/mL of phytohemagglutinin (PHA) was included in the culture medium to stimulate PBMCs. The cells were co-cultured for a total of five days.
After the culture period, non-adherent PBMCs were collected from the supernatant medium and washed with phosphate-buffered saline (PBS) at 500 G for 5 minutes. The PBMC samples were then stained with a prepared CD3 antibody solution (Thermo Fisher Scientific) at a dilution of 1:200 in PBS, and incubated at 4°C for 30 minutes in the dark. Subsequently, the samples were washed once more with PBS at 500 G for 5 minutes and finally resuspended in PBS supplemented with 2 mM EDTA for flow cytometry analysis. The measured values were normalized to unstimulated controls without PHA.
The concentration of adMSC-EVs added to the PBMC culture was determined based on reported production rates of EVs per MSC in 3D cultivation systems [
37], and was chosen to be in accordance with the reported total number of particles per cell from a different study [
38].
2.12. Flow Cytometry Analysis
Samples for flow cytometry analysis were processed using a Cytoflex 2L cytometer (Beckman-Coulter) equipped with 488 and 638 nm lasers. Data were collected for 105 events at a flow rate of 30 μL/min and analyzed using Kaluza 2.1 software (Beckman-Coulter).
2.13. Extracellular Vesicle Surface Marker Analysis
The analysis of EV surface markers derived from adMSCs encapsulated within to-CNF hydrogel spheres during vertical wheel bioreactor cultivation utilized a microarray-based approach. Initially, 3D-epoxy functionalized polymer slides (PolyAn, Berlin, Germany) were employed for spotting with antibody solutions, each supplemented with 2.5% glycerol. Antibody solutions were individually prepared, each containing either purified anti-human CD9, Ultra-LEAF™ Purified anti-human CD63, Purified anti-human CD81 (TAPA-1), or Purified Mouse IgG1, κ Isotype Ctrl (all Biolegend, San Diego, CA, USA) at a final concentration of 0.1 mg/mL in PBS. Droplets of 2.5 nL of the antibody solutions were dispensed onto the slides using a PDC 70 Piezo Dispensing Capillary (Scienion, Berlin, Germany). Nine spots of each antibody solution were prepared for each sample as replicates. Following spotting, the slides were air-dried for 30 min at room temperature. Subsequently, a 16-well ProPlate® Multi-Array Slide System (Grace Bio-Labs, Bend, OR, USA) was utilized for EV-specific antibody staining on the spotted microarray slides. After assembling the slide system according to the manufacturer’s instructions, each well was filled with 200 μL of PolyAn Blocking Solution (PolyAn) and incubated for 1 hour at room temperature with agitation on an orbital shaker (450 rpm). Following incubation, the wells were washed three times with 100 μL of PBS for 5 minutes under agitation on an orbital shaker (450 rpm). Next, 100 μL of EV samples (containing approximately 3.5 x 10^8 EVs) were added to each well and incubated for 1 hour at room temperature with orbital mixing (450 rpm). Following incubation with the EV samples, the washing step was repeated with PBS. Subsequently, 100 μL of the antibody solution comprising 0.12 μg/mL APC Mouse Anti-Human CD9, 4 μg/mL APC Mouse Anti-Human CD63, and 4 μg/mL APC Mouse Anti-Human CD81 (all Biolegend) in PBS, was added to each well and incubated for 1 hour at room temperature with agitation (450 rpm). After incubation, the washing step was repeated, and the slide was removed and washed with deionized water before being blow-dried with nitrogen. Finally, fluorescence intensity of the sample slides was measured at 635 nm using a GenePix Professional 4200 A microarray scanner (Molecular Devices, San Jose, CA, USA).
2.14. Adipogenic Differentiation
The differentiation potential of adMSCs encapsulated in
to-CNF hydrogel spheres was assessed as follows. Samples were prepared according to
Section 2.3 and incubated at 37 °C with 5% CO
2 and either 21% or 5% O
2 on a gyroscopic shaker set at 70 rpm. After 24 hours, the medium was switched from standard expansion medium to adipogenic differentiation medium (MSCgo™ Adipogenic Differentiation Medium, Sartorius, Göttingen, Germany). Control samples were maintained in standard expansion medium. Cultures were maintained for 21 days with half of the medium replaced twice per weekl.
2.15. Intracellular Lipid Droplet Staining
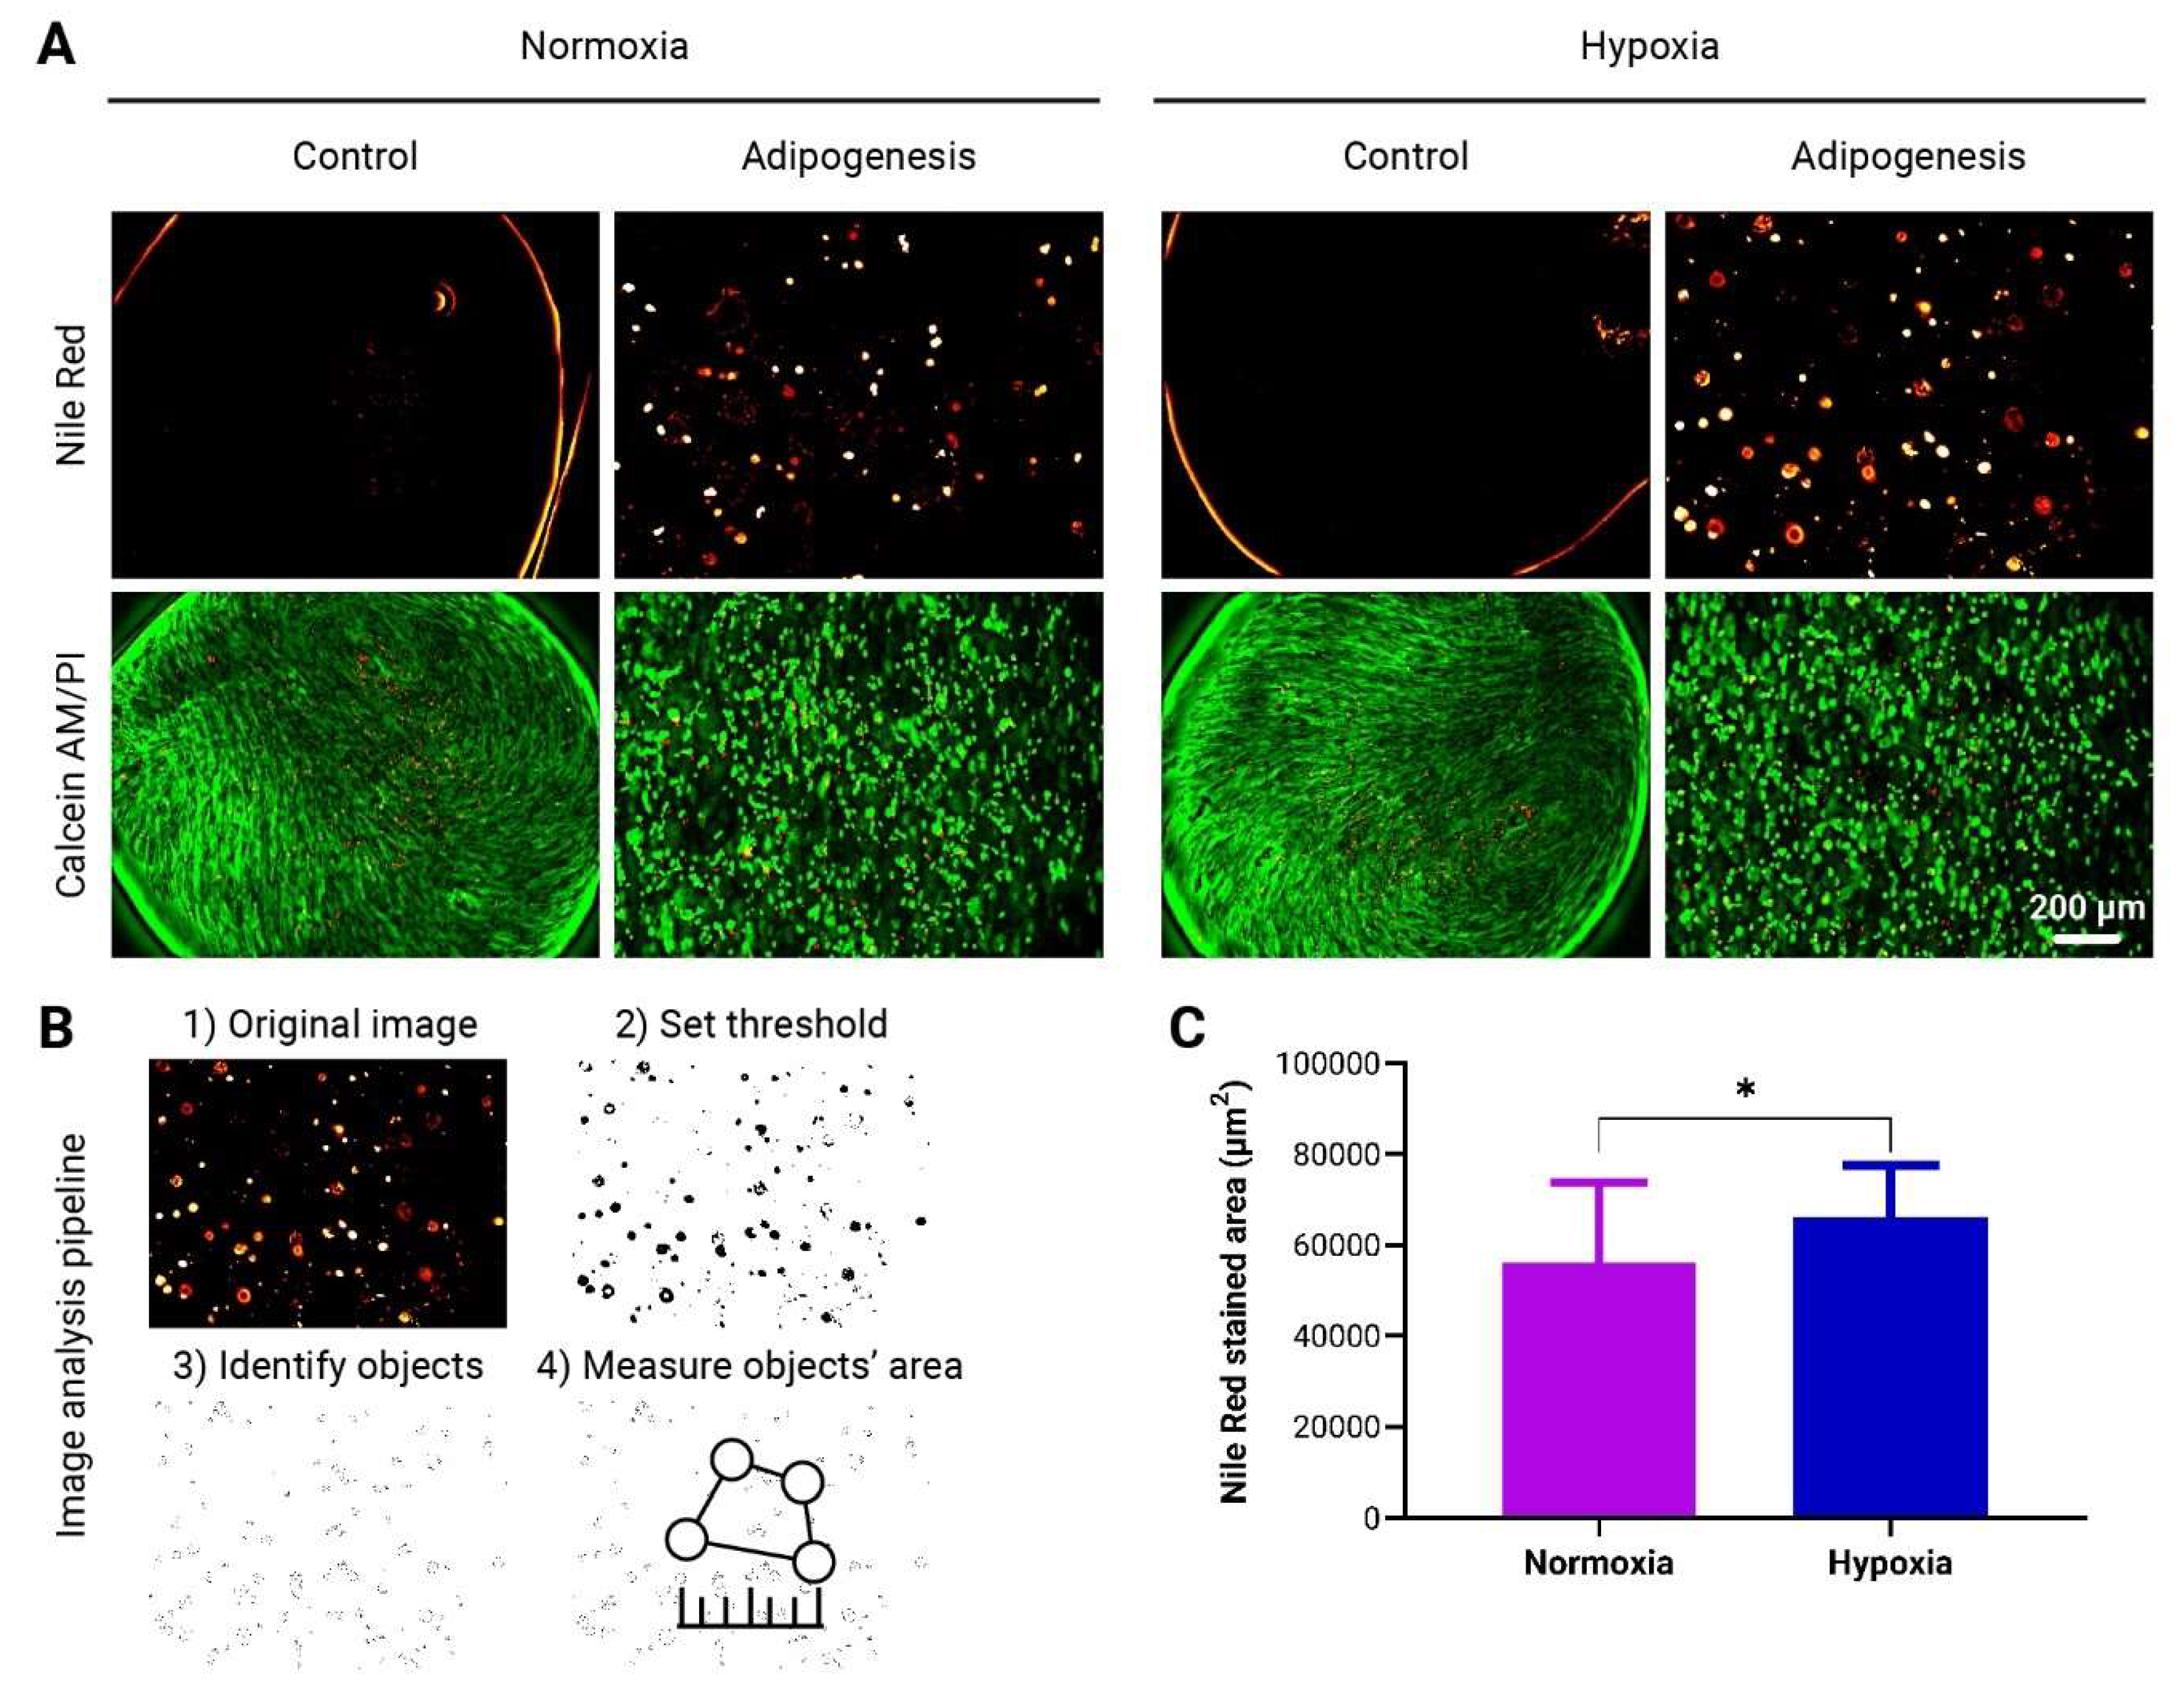
Following 21 days of differentiation within to-CNF hydrogel spheres, adMSCs were stained with Nile Red (lipid vacuole staining). Samples were fixed with 4% paraformaldehyde for 1 hour, washed twice with PBS, and then stained with Nile Red (5 μg/mL in DMSO) for 1 hour on a gyroscopic shaker (70 rpm) at 37 °C in the dark. After incubation, samples were washed twice with PBS and fresh PBS was added for fluorescence microscopic analysis. Quantification of the adipogenic differentiation capacity was based on the Nile Red fluorescence-stained area of the images, utilizing ImageJ 1.53t image processing software.
2.16. Mechanical Characterization of to-CNF Hydrogels
Compression testing was performed using a miniature material testing frame originally designed for in situ synchrotron ultrasonic fatigue testing [
39], as depicted in
Figure 1D. The apparatus featured a 50 N capacity load cell and was equipped with two synchronously stepper motor-driven ball screws, providing a 0.3 µm step resolution for crosshead displacement. Data acquisition and stage control were managed by custom software developed in National Instruments LabVIEW, facilitating precise control over displacement, load, and extension.
Cylindrical hydrogel samples, nominally 5 mm in diameter and 3 mm in height, were transferred into a PEEK cup, submerged in PBS, and subjected to monotonically increasing compression stresses at a rate of 15 µm/s (approximately equivalent to a strain rate of ε = 5 × 10⁻³ s-1) until reaching a final length of l = 250 µm. Raw data were collected at a resolution of 16 bits within a nominal 50 N range, sampled at a rate of 10 s-1. These raw data were then corrected for load offset, stage compliance, and the initial length l0. The initial length l0 was estimated as the intersection point between the load offset and the linear least-squares fit of the compression slope within the range 0 < ε < 0.5, calculated for each sample individually.
2.17. Statistical Analysis
Results were expressed as mean ± standard deviation of at least three independent replicates. Statistical comparisons were performed using unpaired t-tests, 1-way ANOVA and 2-way ANOVA tests followed by Tukey’s multiple comparisons, and data were plotted using GraphPad Prism 8.0.1 for Windows (GraphPad Software, San Diego, CA, USA). Significance was indicated as follows: * p < 0.05, ** p < 0.01, *** p < 0.001, and **** p < 0.0001.
4. Discussion
MSCs have immense potential for various clinical applications due to their regenerative and immunomodulatory properties, rendering them promising candidates for a wide array of therapeutic applications [
3]. Hydrogels based on nanofibrillar cellulose have emerged as compelling 3D cultivation scaffolds for MSCs, fostering their expansion [
41] and differentiation [
42] in vitro. The present study delves into the utilization of hydrogel spheres prepared from TEMPO-oxidized and subsequently nanofibrillated cellulose as a novel strategy to augment the in vitro cultivation of adMSCs, with a particular focus on enhancing their capacity to produce EVs as therapeutic agents.
We first explored the effects of an additional CaCl
2-induced crosslinking, alongside the previously described self-assembly of aqueous dilute dispersions of nematically oriented
to-CNF [
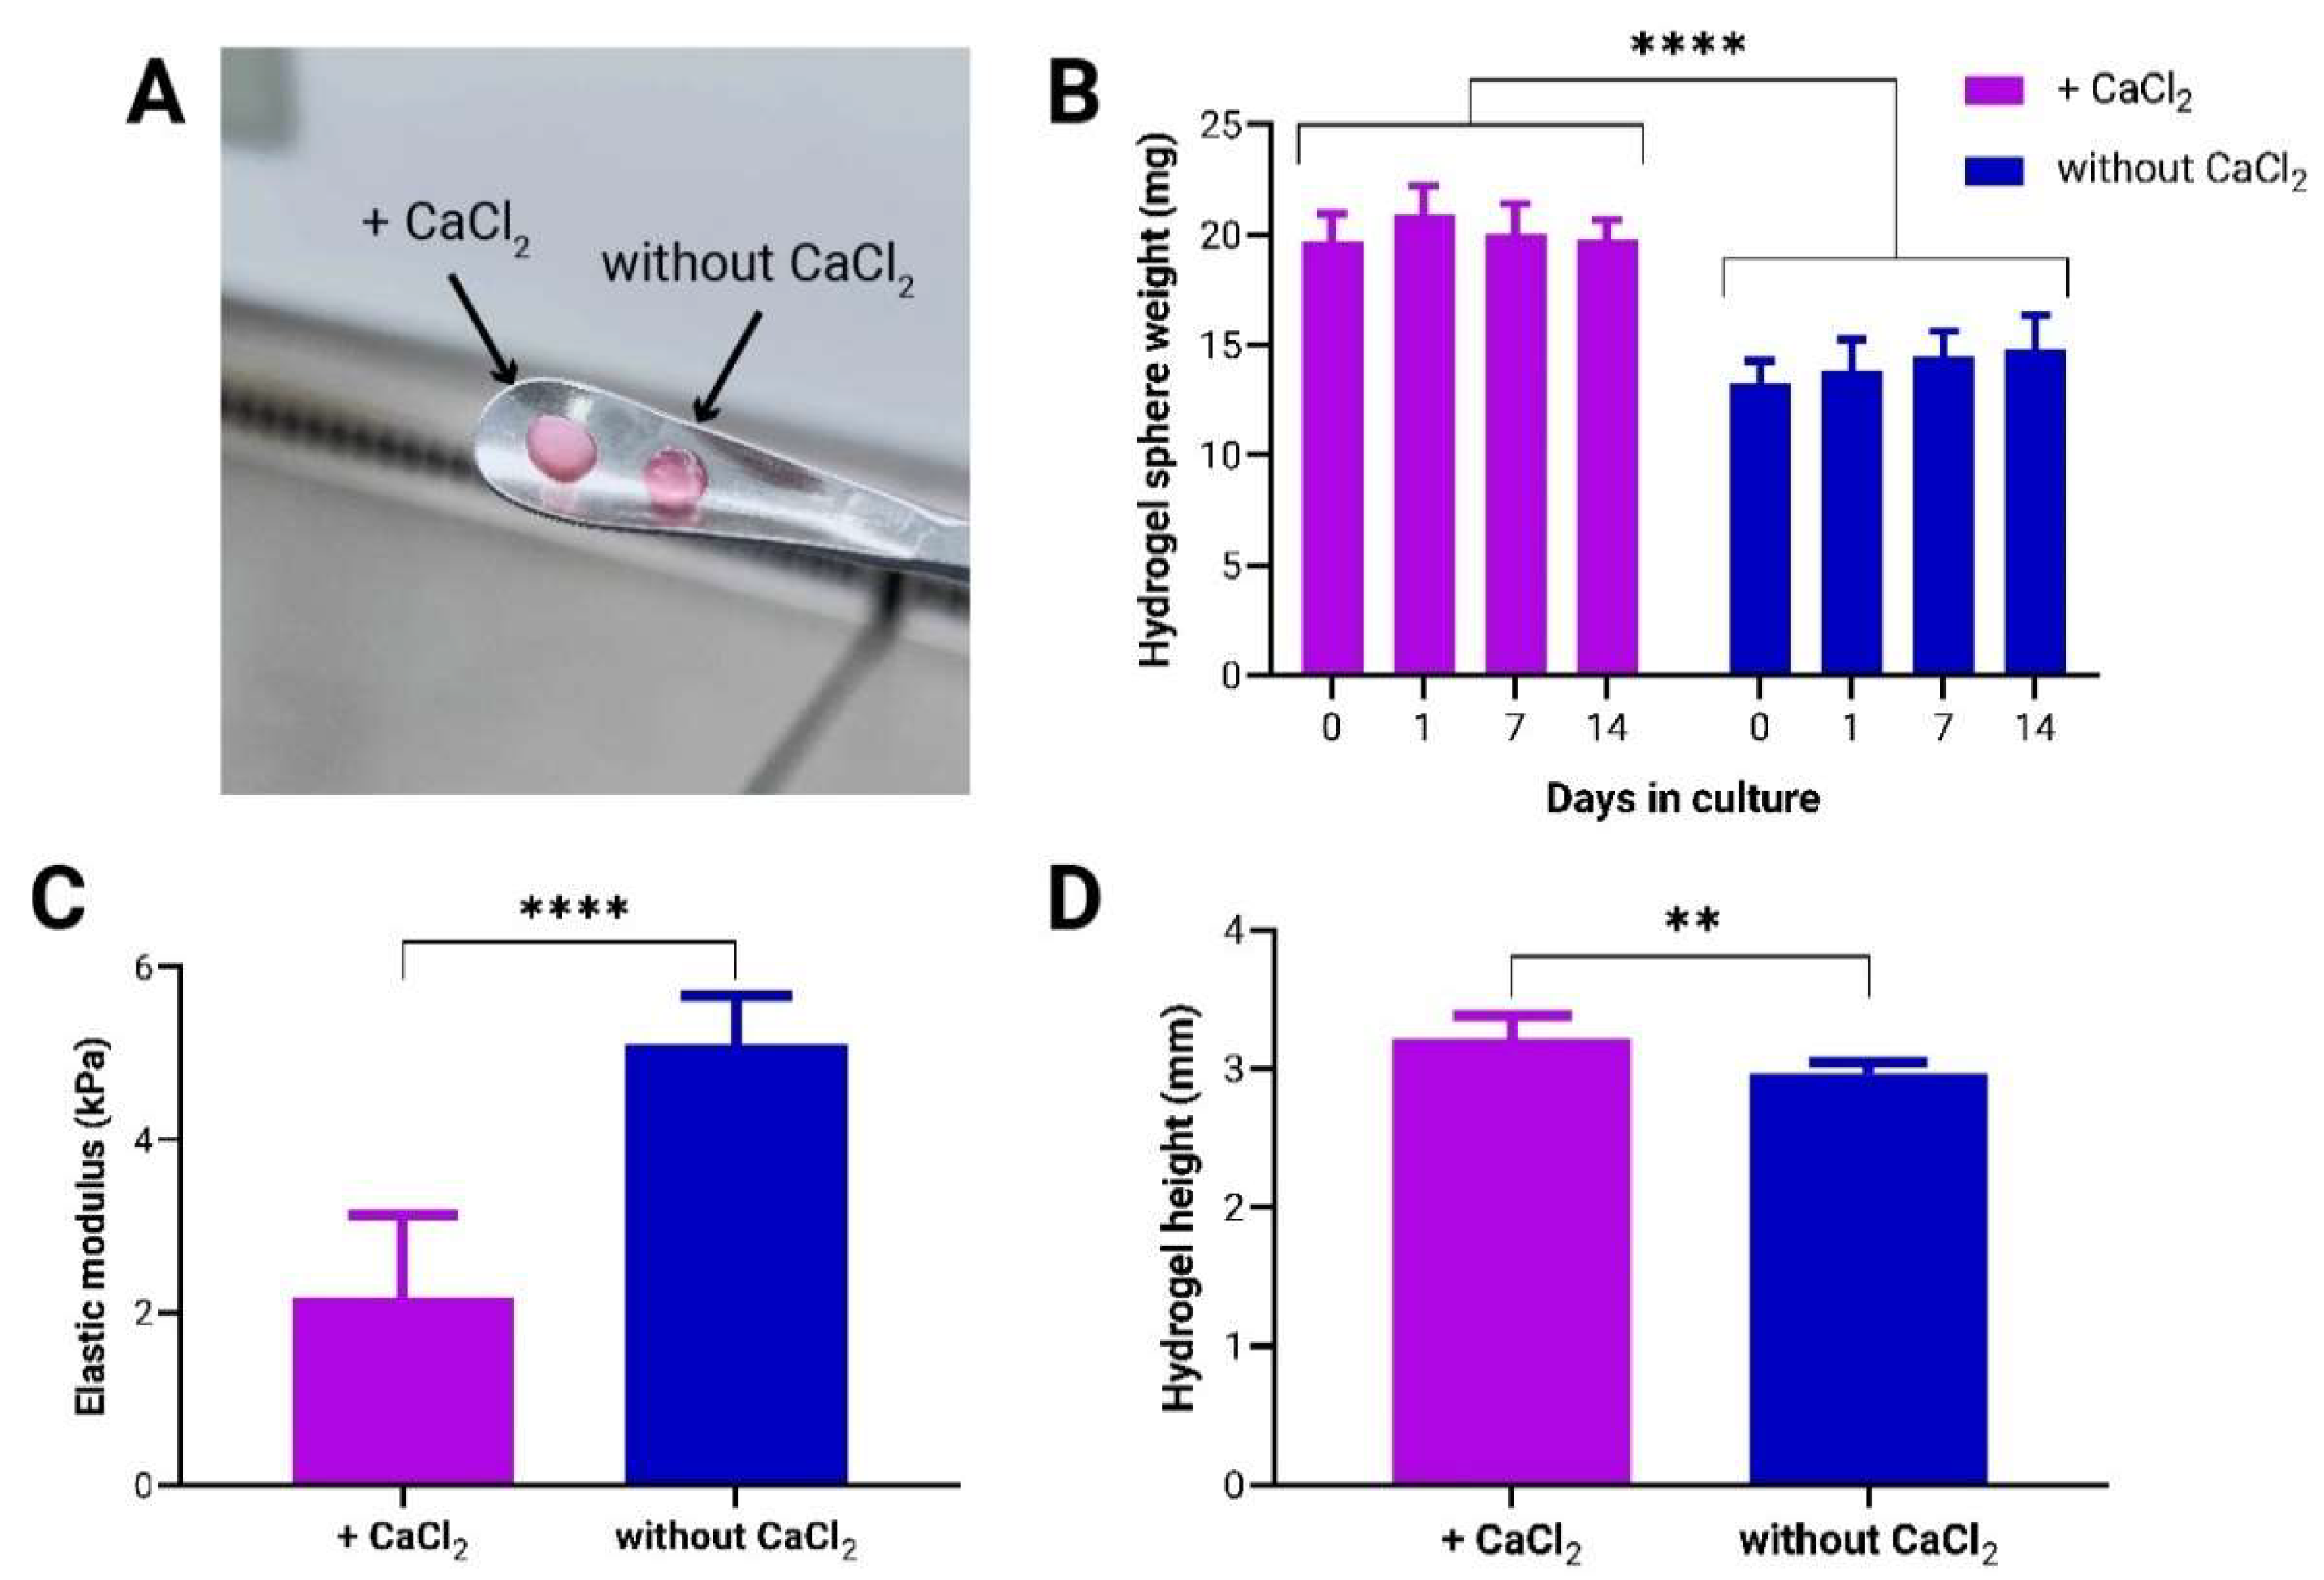
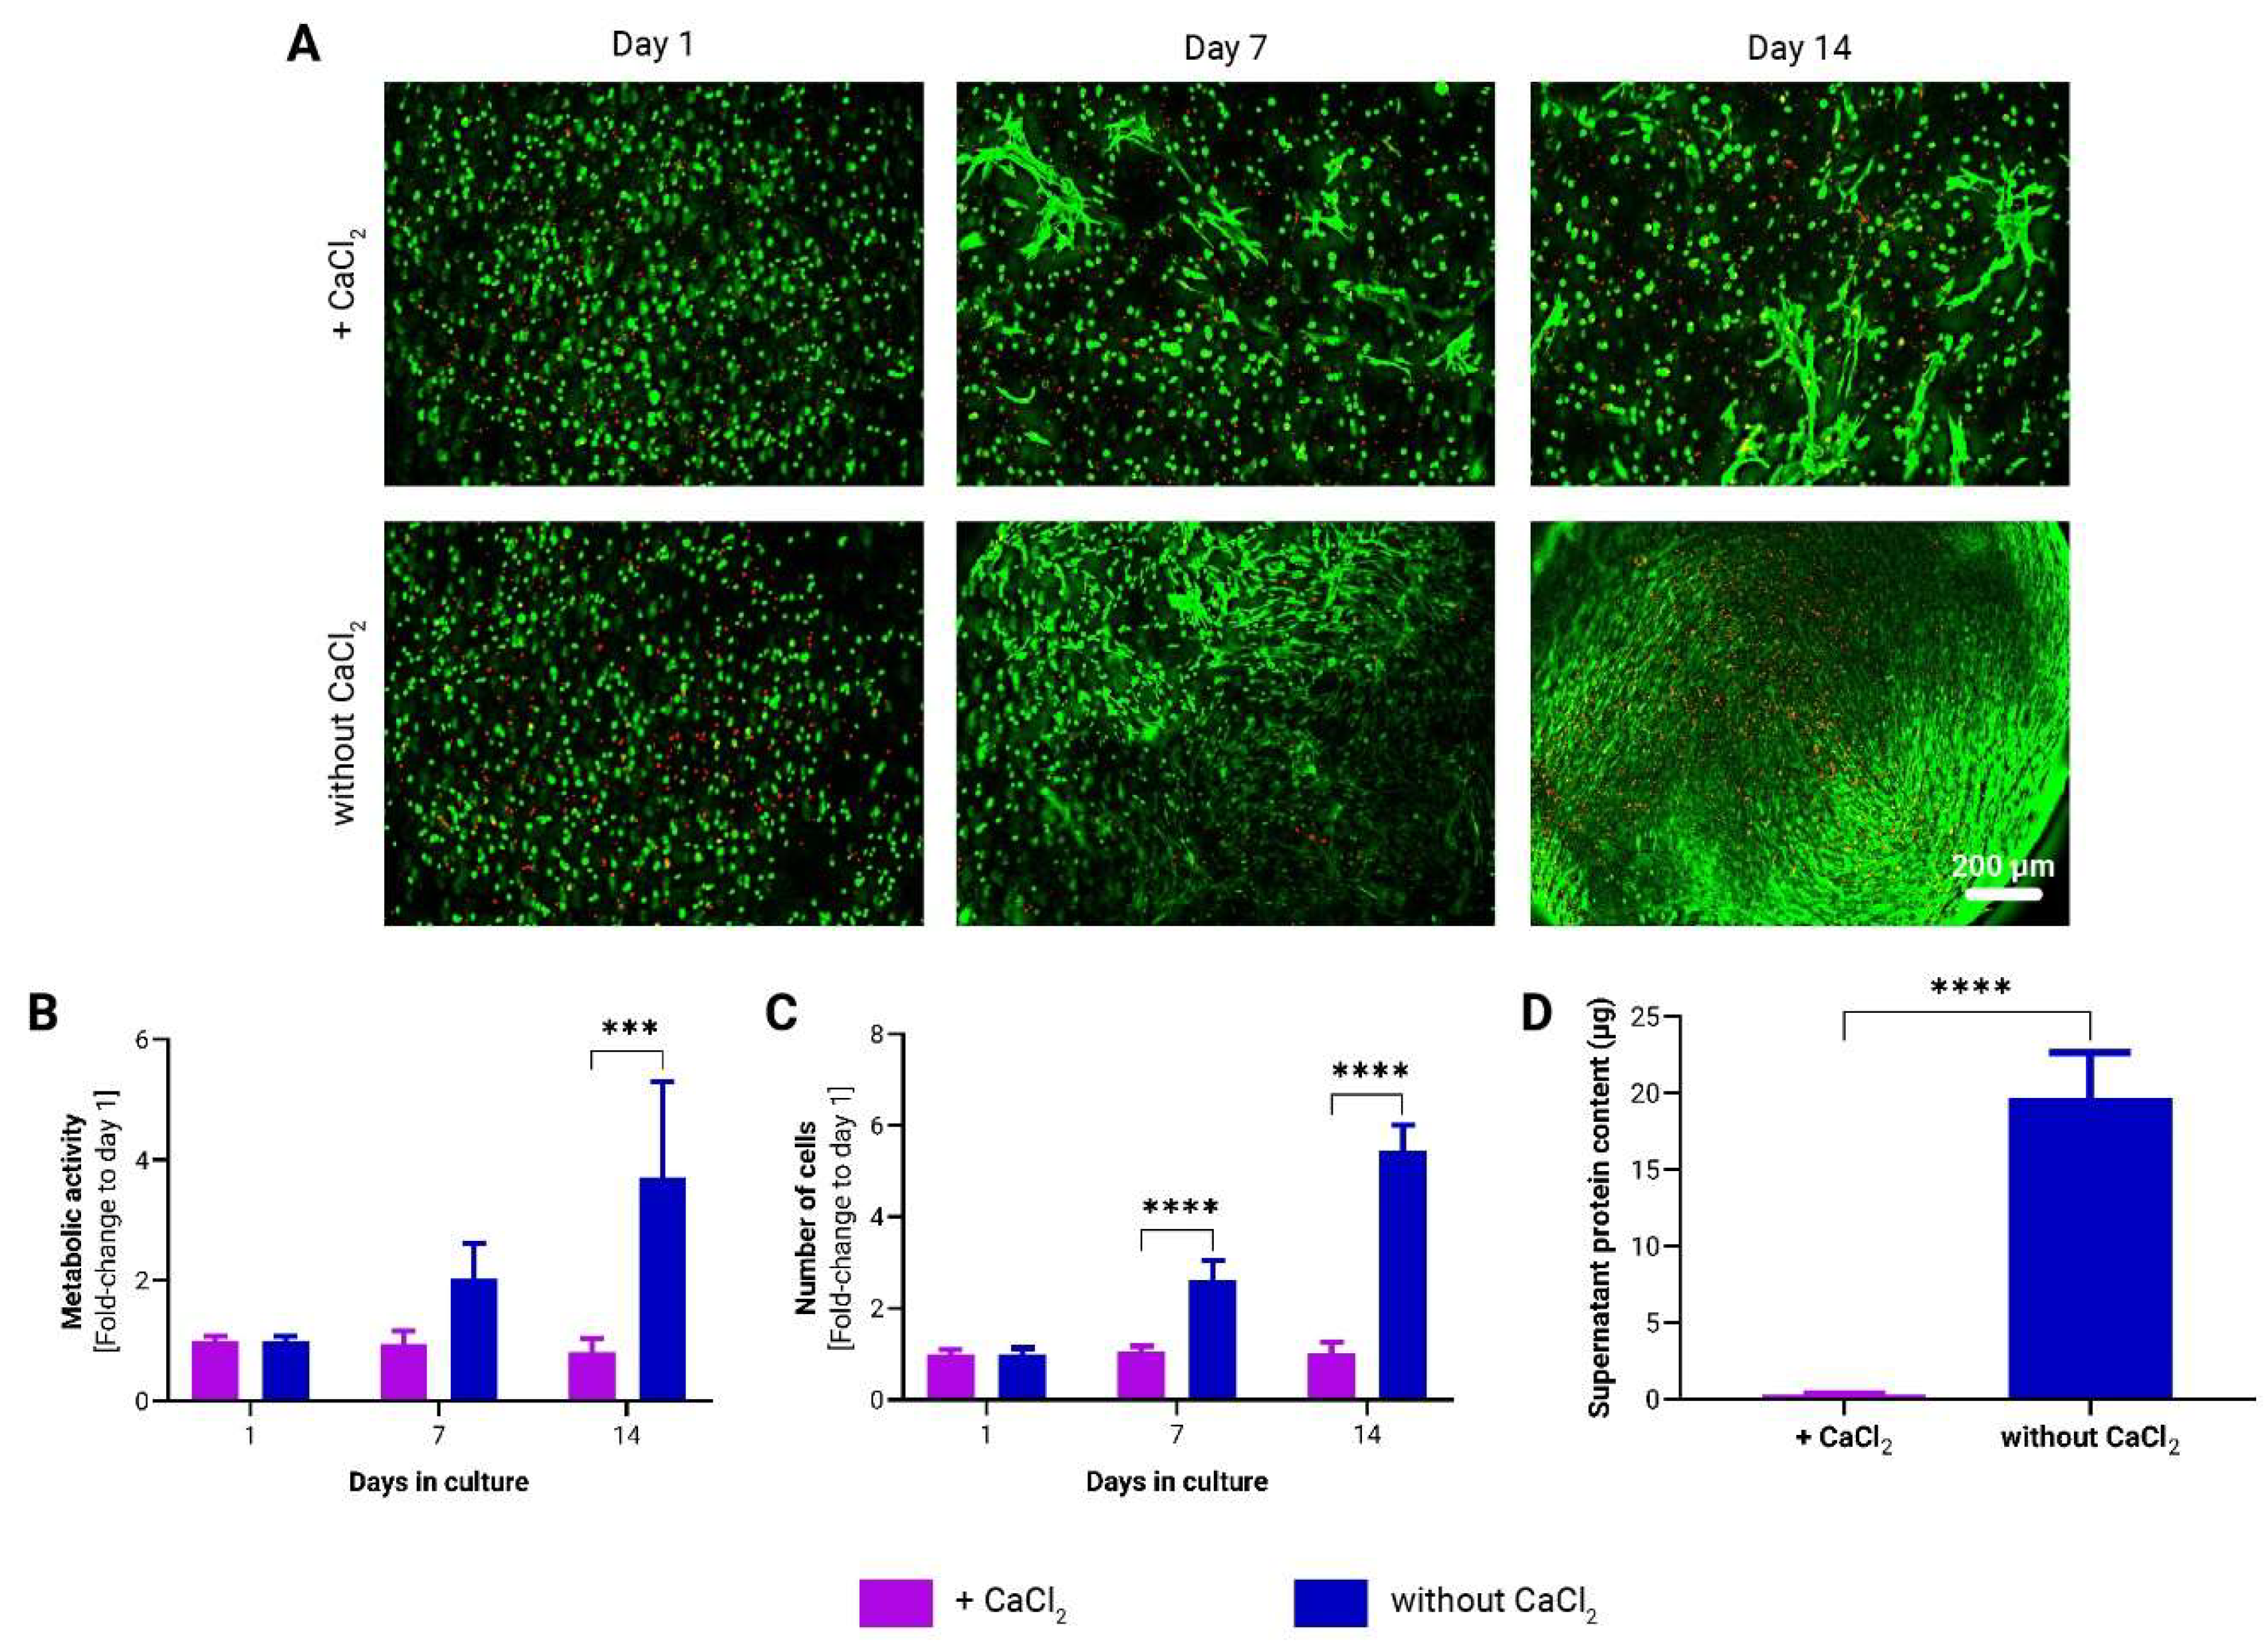
15], on the stability and mechanical properties of the hydrogel spheres, as well as their influence on adMSC growth dynamics. Our findings indicate that while both
to-CNF hydrogel sphere formulations remained stable when exposed to flow shear stresses during dynamic cultivation conditions, the introduction of CaCl
2 crosslinking significantly compromised both the mechanical and biological properties of the hydrogels. Contrary to expectations based on previous studies involving CaCl
2 crosslinked cellulose hydrogels where such crosslinking was anticipated to enhance mechanical properties [
32] without detrimentally affecting cell growth and spreading [
33], our results present a different outcome. We hypothesize that the surplus of Ca
2+ ions, introduced by the addition of CaCl
2, reacted with hydrogen phosphate ions present in the cell culture medium (for MEM alpha: [NaH
2PO
4-H
2O] =140 mg/L, pH=7) to form poorly soluble calcium phosphates. The latter are likely CaHPO
4, as HPO
42- and H
2PO
4- are present in fairly equimolar concentrations at pH 7. Only CaHPO
4 is poorly water-soluble (< 0.1 g/L) while the solubility of Ca(H
2PO
4)
2 in H
2O is about 20 g/L at room temperature (according to the GESTIS substance database). This reaction likely contributed to the observed white coloration, increased opaqueness and weight of the to-CNF hydrogel spheres [
43]. Several studies suggest that tertiary calcium phosphates, such as Ca
3(PO
4)
2, can precipitate at higher pH to form crystal lattices inside hydrogels, thereby enhancing their mechanical properties and biostability [
44]. Our findings on calcium phosphate-modified
to-CNF hydrogel spheres, however, report a decrease in the elastic modulus and, consequently, mechanical properties due to the deposition of amorphous and likely heterogeneous phosphate particles. Another reason for decreased hydrogel mechanical properties could be acidification caused by the addition of CaCl
2. This can not only lead to enhanced hydrogen bonding but also to the formation of CO
2 from the bicarbonate (NaHCO₃) buffer used in the culture medium. The formed microbubbles are assumed to remain partially entrapped within the
to-CNF hydrogels, which may account for the slight swelling and reduced mechanical performance of these samples compared to the hydrogels not subjected to additional CaCl
2 treatment. These insights underscore the critical importance of refining crosslinking strategies to strike a delicate balance between maintaining structural integrity and facilitating favorable cellular interactions.
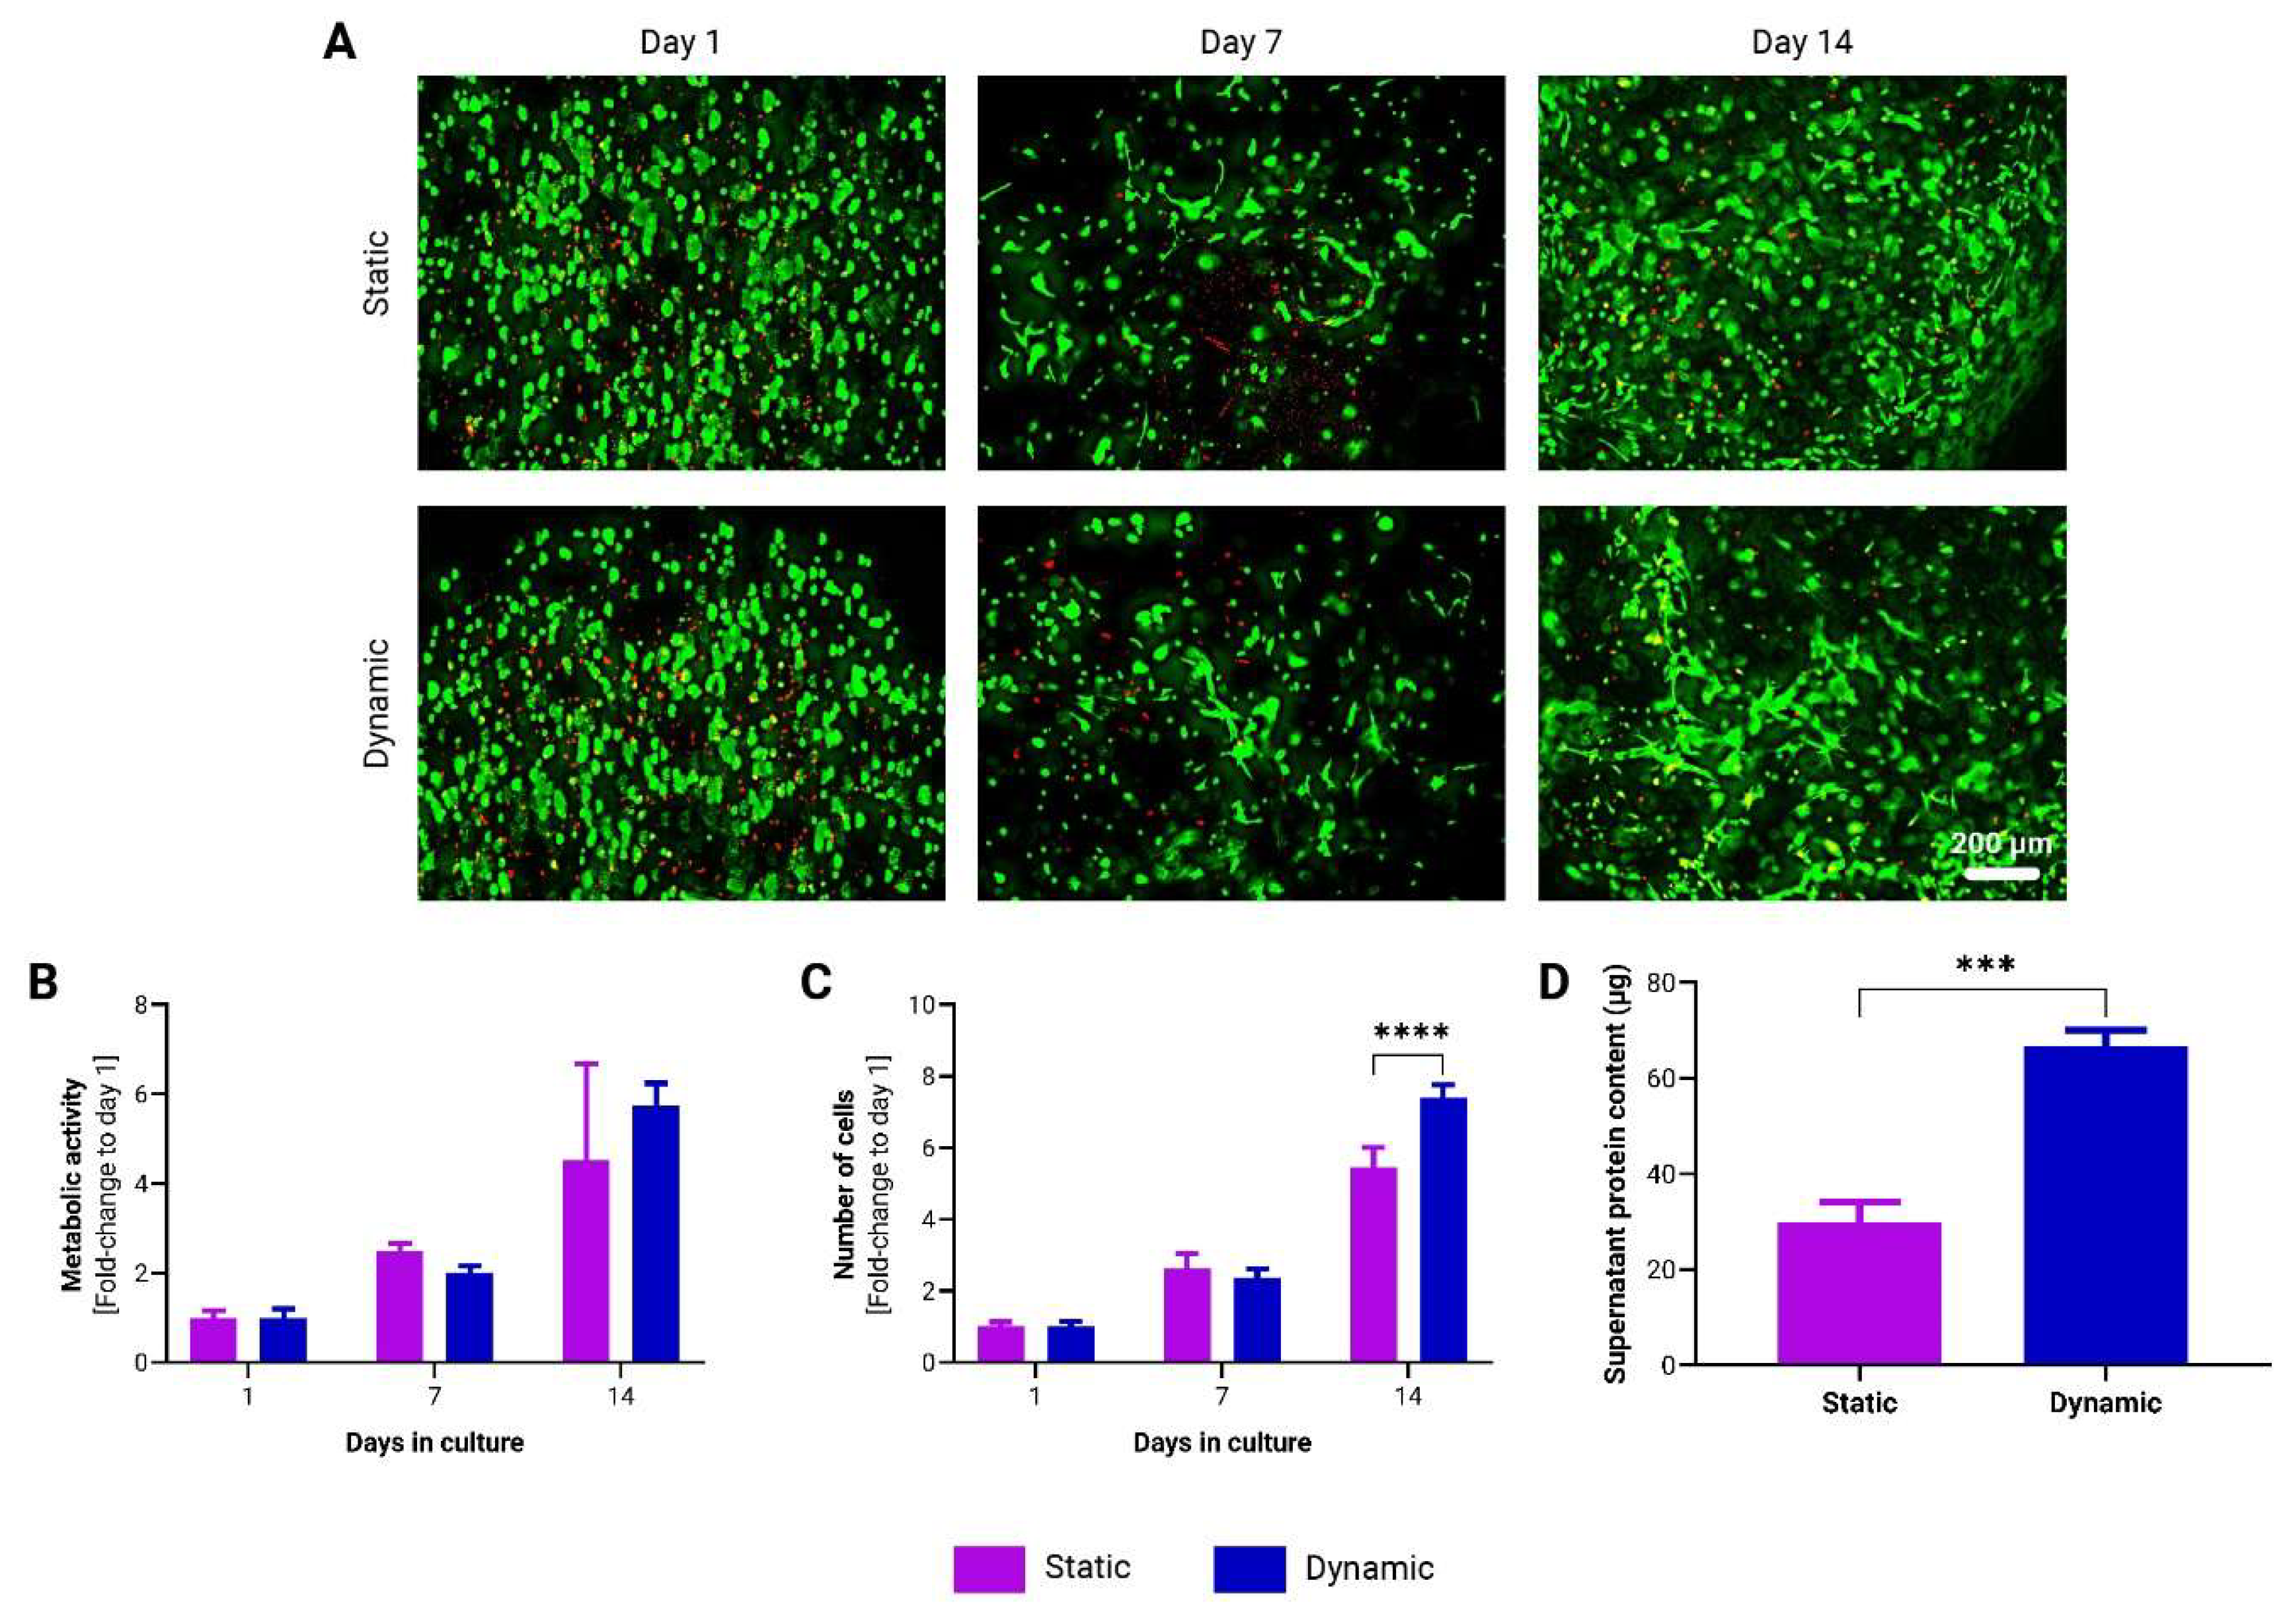
We demonstrated that dynamic cultivation conditions, replicating the perpetual motion encountered by cells in their natural environment, enhance the proliferation of adMSCs and promote protein secretion within
to-CNF hydrogel spheres. The dynamic culture system may promote nutrient and oxygen transport within the hydrogel matrix, facilitating adMSC growth and metabolism [
45]. The observed increase in cellular activity under dynamic cultivation conditions highlights the importance of simultaneous exposure to external forces, material properties, and cellular microenvironment characteristics in fostering cell growth and functionality, as elucidated in existing literature [
46,
47]. These findings align with prior research illustrating the advantages of incorporating dynamic culture systems alongside hydrogel scaffolds to enhance cell proliferation [
48] and protein secretion [
49]. Despite being recommended, there has been limited exploration into the influence of combining multiple mechanical signals (e.g., hydrogel stiffness, flow shear stress, surface topography, cyclic strain etc.) on the proper functioning of cells in vitro [
47].
Hypoxic culture conditions have emerged as a critical factor influencing MSC behavior and function [
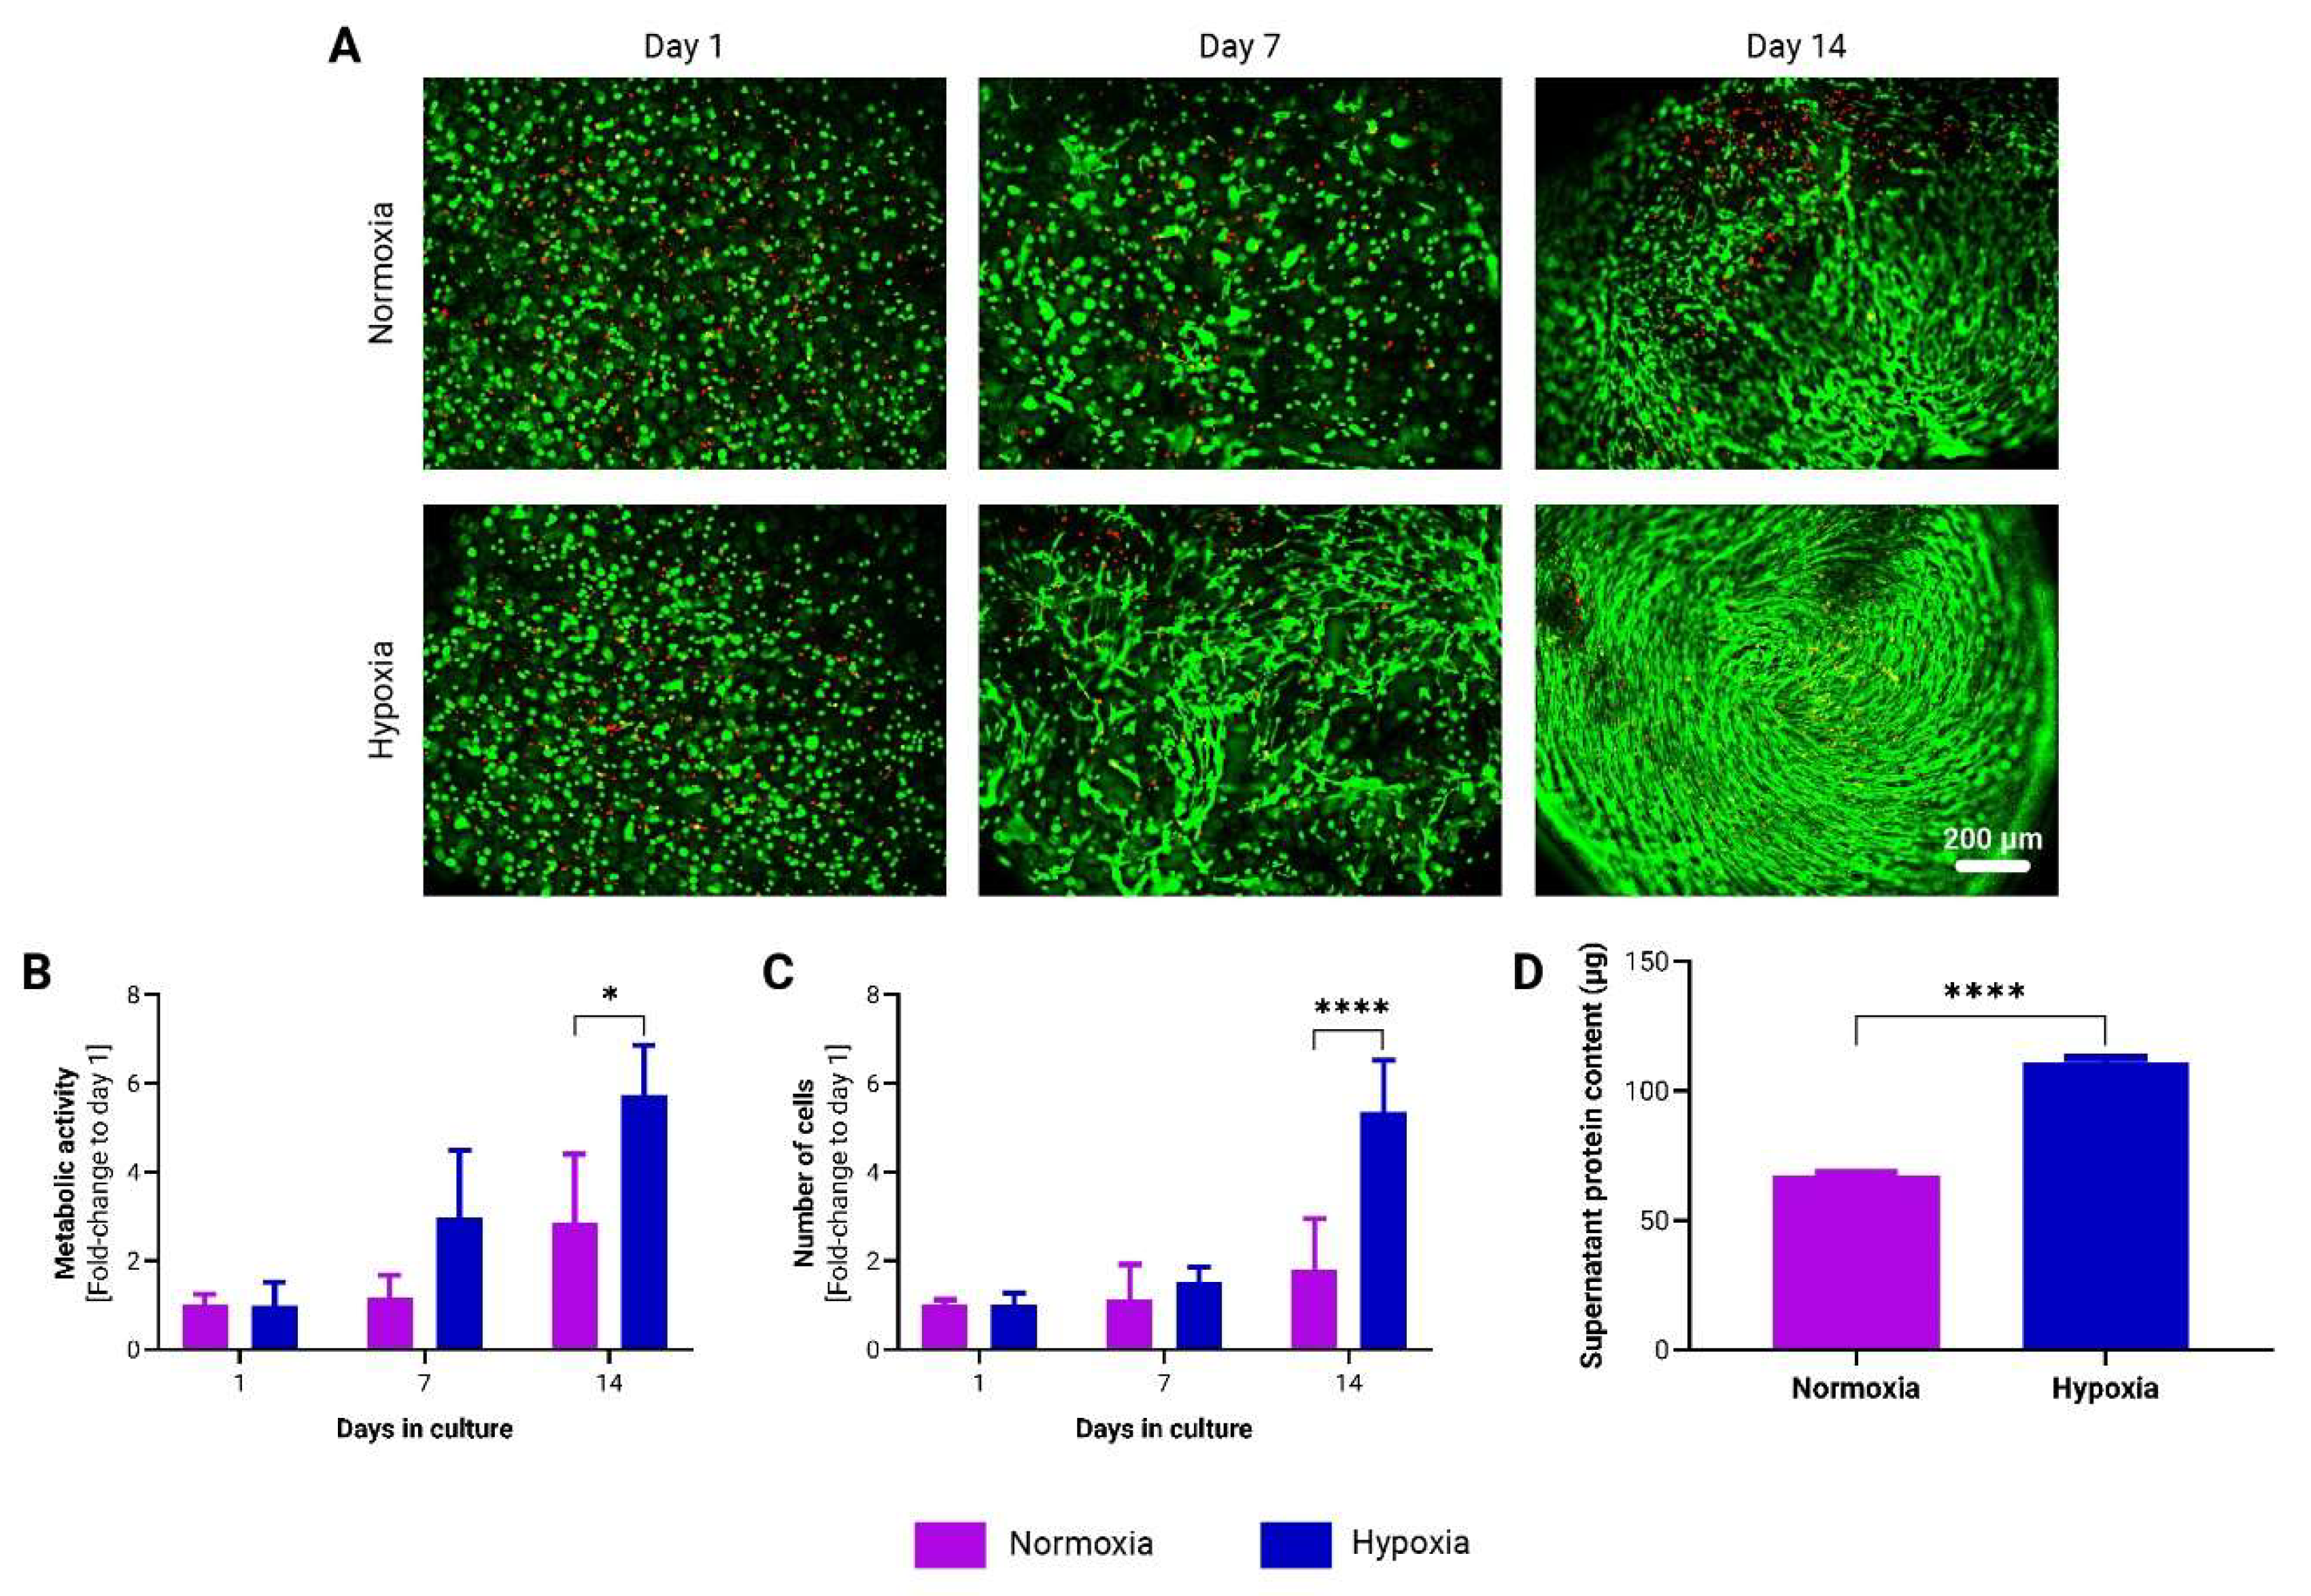
23]. Our results demonstrate that hypoxic cultivation significantly enhances adMSC proliferation and protein secretion, within
to-CNF hydrogel spheres. Furthermore,
the hypoxic environment appears to create an optimal microenvironment that promotes the MSCs’ commitment towards adipogenic lineage, potentially enhancing the regenerative capacity of these cells in therapeutic applications. These findings are consistent with previous studies showing that hypoxia promotes MSC proliferation [
50], differentiation [
51] and immunomodulation [
52] by activating hypoxia-inducible factors (HIFs) and downstream signaling pathways. Moreover, hypoxic culture conditions have been shown to enhance EV production and functionality [
53,
54], further highlighting the potential therapeutic benefits of hypoxic culture for MSC-based therapies [
24,
55].
Our study also investigated the production of EVs by adMSCs encapsulated within
to-CNF hydrogel spheres in a scalable bioreactor system. While bioreactor systems have been employed for MSC expansion, their effects on EV production and functionality remain subjects of ongoing research. Transferring cell growth conditions from conventional 2D static culture to advanced 3D cultivation systems necessitates adaptation and optimization. Nonetheless, opting for 3D bioreactor systems offers advantages such as improved control and monitoring of culture parameters, scalability, and provision of more physiologically relevant conditions. Given the existing discrepancies [
56] in the literature concerning quantitation methods for EV production, no standardized procedures for the isolation and purification of MSC EVs have been established [
35]. Emerging evidence suggests that many particles in various EV preparations may not actually be EVs [
35]. Furthermore, recently discovered nonvesicular extracellular nanoparticles, such as exomeres and supermeres, contain many of the biomolecules—including proteins, RNA, and DNA—that were previously attributed to exosomes [
57]. This presents a significant challenge due to the heterogeneity of EVs and nonvesicular extracellular nanoparticles and the complexities involved in isolating and purifying distinct populations [
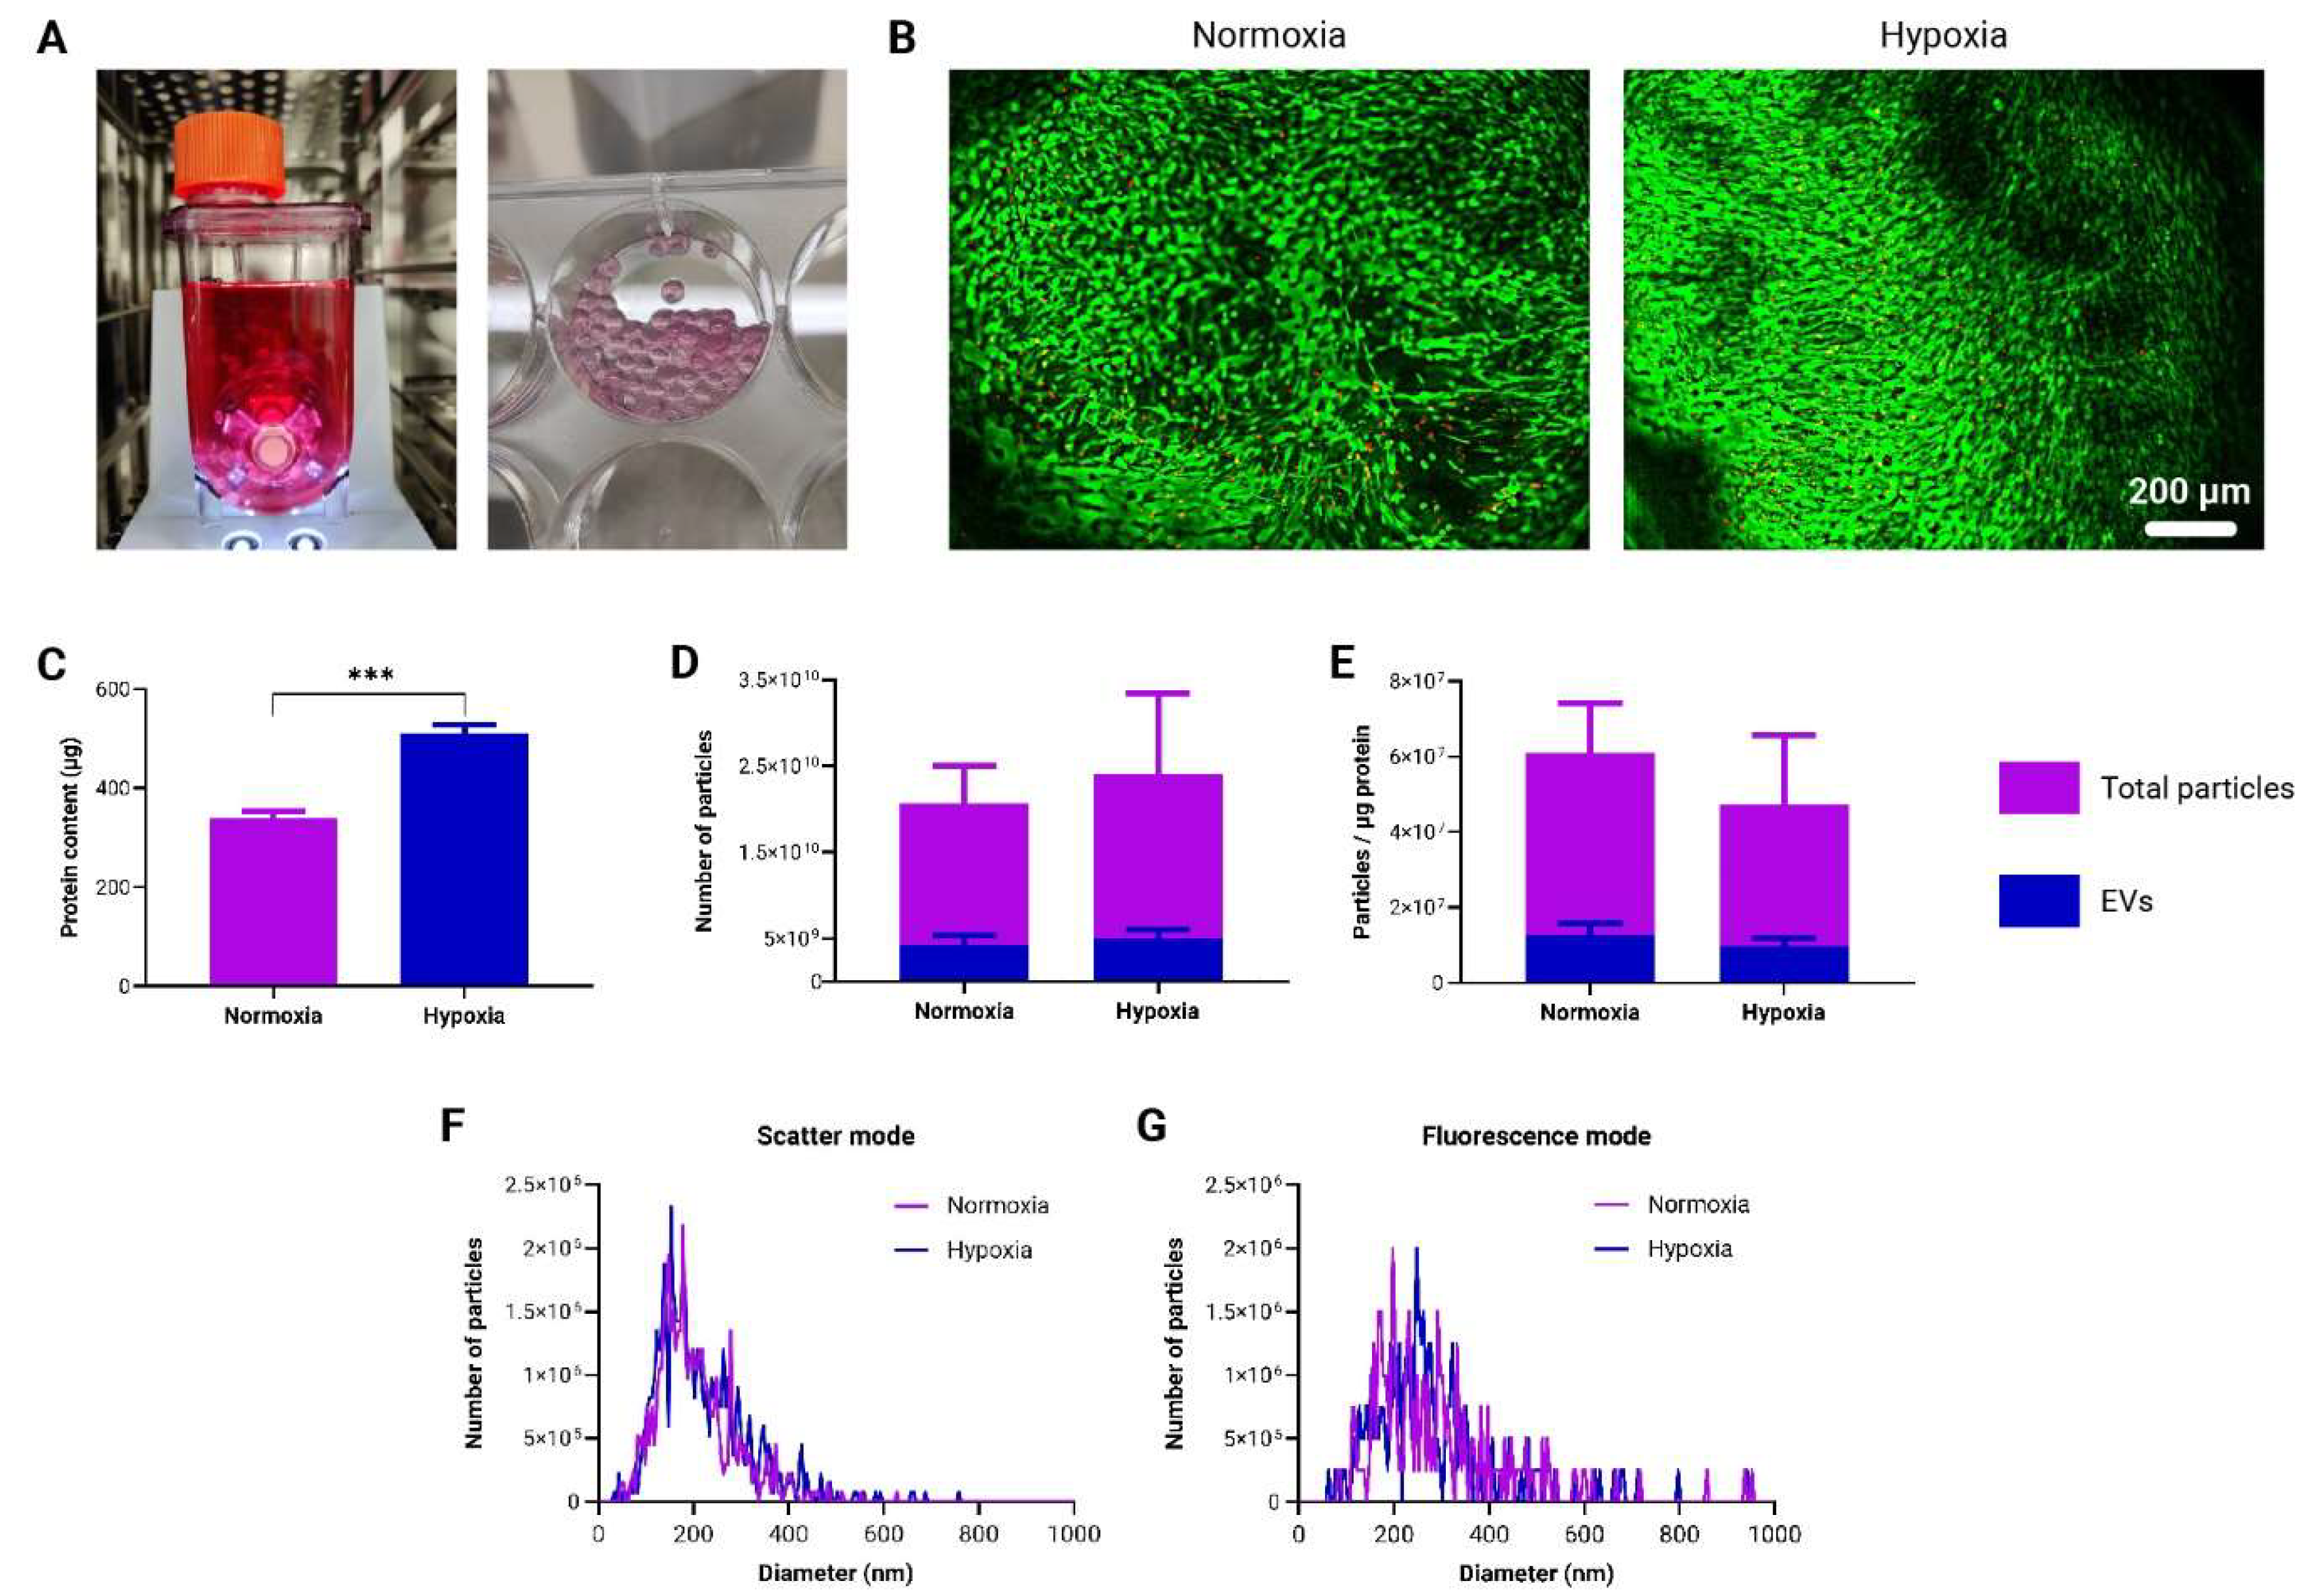
57]. Therefore, we opted to present our findings in terms of the total number of pure EVs, alongside their purity ratio relative to protein content [
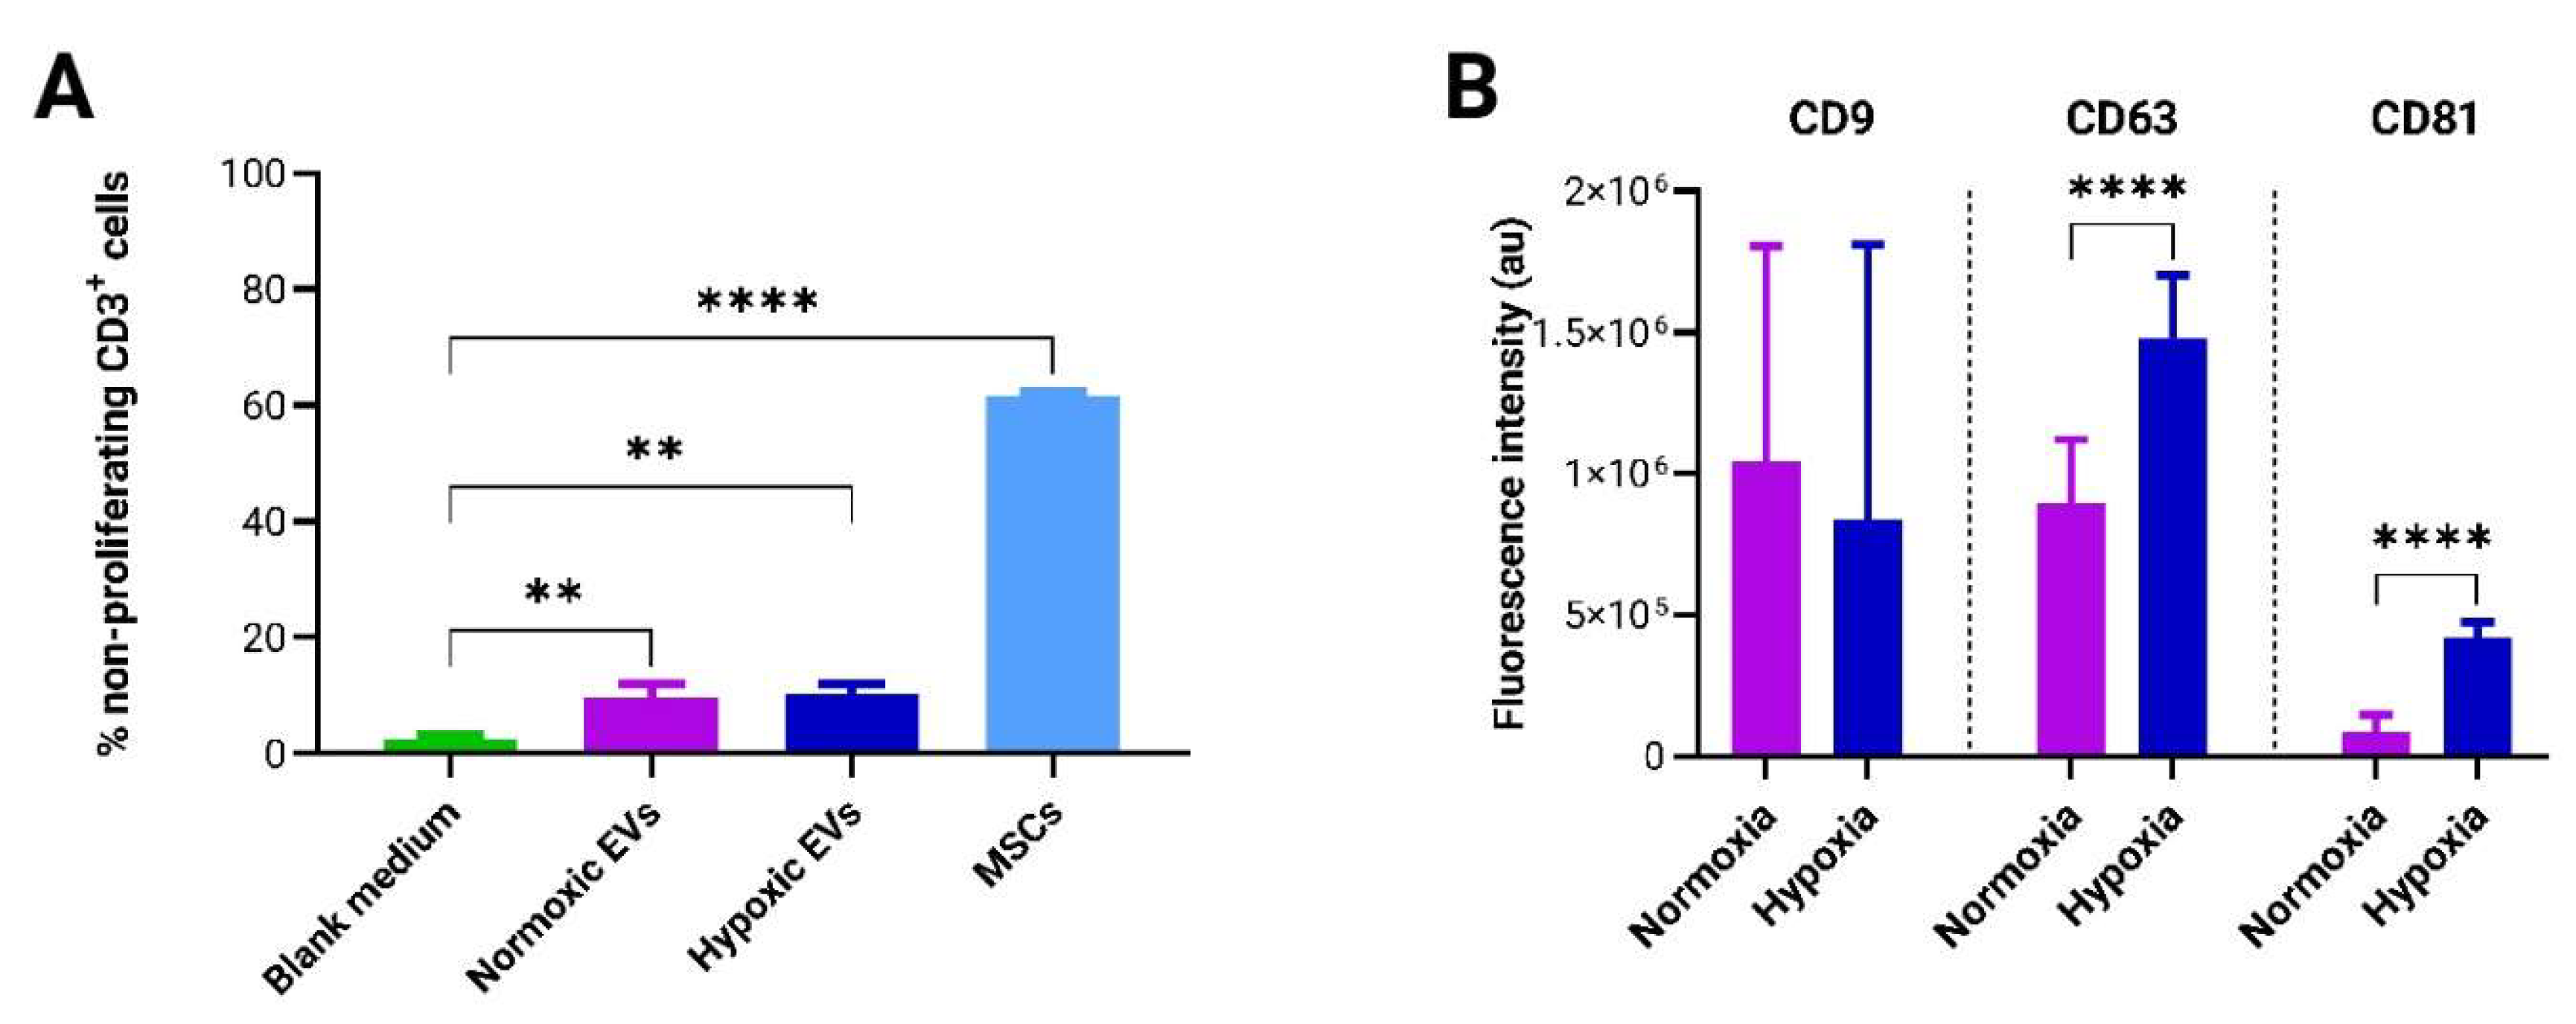
40] and the total nanoparticle count. This approach facilitates comparisons with both current and forthcoming study outcomes. While no significant differences were observed in EV production between normoxic and hypoxic conditions, both conditions exhibited potent immunosuppressive properties. Moreover, our observations regarding the immunosuppressive efficacy of adMSCs and adMSC EVs align with findings from previous studies utilizing the same T-cell-based immunopotency assay [
36,
38]. These findings suggest that
to-CNF hydrogel spheres may serve as an effective platform for scalable production of therapeutic EVs for immunomodulatory therapies. Additionally, microarray analysis revealed differences in EV surface marker expression between normoxic and hypoxic conditions, with hypoxic conditions showing elevated expression of CD63 and CD81 markers. These biomarkers, established by the International Society for Extracellular Vesicles as minimal biophysical standards, are pivotal for defining EVs and assessing their functionality. Although the precise functional roles of these tetraspanins in EVs remain unclear, and no studies have directly linked their expression to oxygen tension and immunomodulation, a few studies have associated their expression with EV biogenesis [
58,
59] and with binding and uptake by target cells [
60,
61]. These findings suggest that hypoxic conditions during culture may enhance the generation and therapeutic efficacy of MSC-derived EVs by influencing mechanisms other than immunomodulation. However, further studies are warranted to elucidate the underlying mechanisms and validate the therapeutic potential of hypoxic EVs in preclinical models.
Figure 1.
Mechanical stability and characterization of to-CNF hydrogel spheres with and without additional CaCl2-induced crosslinking. (A) to-CNF hydrogel spheres with (left) and without (right) CaCl2 crosslinking. (B) Stability assessment of hydrogel spheres over 14 days under dynamic conditions (n=6, 2-way ANOVA, t-test). (C) Elastic modulus measurements of to-CNF hydrogels with and without CaCl2 crosslinking (n=8, t-test). (D) Measurement of hydrogel sample height, prepared with and without CaCl2 crosslinking, for compression testing (n=8, t-test)..
Figure 2.
Growth dynamics of adMSCs encapsulated in to-CNF hydrogel spheres with and without CaCl2 crosslinking. (A) Live/dead staining of encapsulated adMSCs at 1, 7, and 14 days post-encapsulation in to-CNF hydrogel spheres. Corresponding changes in metabolic activity (B) and cell number (C) over time in the to-CNF hydrogel spheres (n=3, 2-way ANOVA). (D) Analysis of supernatant protein concentration (n=3, t-test)..
Figure 3.
Growth kinetics of adMSCs encapsulated in CNF hydrogel spheres under static and dynamic cultivation conditions. (A) Representative images of live/dead staining of encapsulated adMSCs after 1, 7, and 14 days following encapsulation in CNF hydrogel spheres. Over time changes in the metabolic activity (B) and in the number of adMSCs (C) encapsulated in CNF hydrogel spheres. (n=3, 2-way ANOVA). (D) Analysis of supernatant protein concentration (n=3, t-test).
Figure 4.
Growth dynamics of adMSCs encapsulated in to-CNF hydrogel spheres and cultivated under normoxic (21% O2) and hypoxic (5% O2) dynamic conditions. (A) Representative images of live/dead staining of encapsulated adMSCs after 1, 7, and 14 days following encapsulation in to-CNF hydrogel spheres. Changes in the metabolic activity (B) and in the number of adMSCs (C) encapsulated in to-CNF hydrogel spheres (n=3, 2-way ANOVA). (D) Analysis of supernatant protein concentration (n=3, t-test).
Figure 5.
Evaluation of adMSCs Adipogenic Differentiation within to-CNF hydrogel spheres. (A) Representative images showing lipid vacuole formation and live/dead staining of encapsulated adMSCs after 21 days of adipogenic differentiation. (B) Image analysis pipeline using ImageJ software to quantify the fluorescence-stained area of the images. (C) Quantification of the adipogenic differentiation capacity of the to-CNF hydrogel sphere-encapsulated cells under normoxia and hypoxia, based on image analysis data (n=20, t-test).
Figure 6.
Production and characterization of EVs derived from to-CNF hydrogel sphere-encapsulated adMSCs in the vertical wheel bioreactor. (A) Depictions of the vertical wheel bioreactor and to-CNF hydrogel spheres post-21 days of cultivation. (B) Fluorescence images showing live/dead staining outcomes of encapsulated adMSCs after 21 days of cultivation in the bioreactor within to-CNF hydrogel spheres. (C) Quantitative analysis of supernatant protein concentration (n=3, multiple t-tests). (D) Nanoparticle Tracking Analysis (NTA) results depicting the total particle and EV-only numbers under hypoxia and normoxia (n=11, multiple t-tests). (E) Assessment of vesicle solution purity for both “total particles” and “EVs only” under normoxic and hypoxic bioreactor cultivation conditions (n=11, multiple t-tests). (F) NTA results in scatter (total particles) and fluorescence (EVs) mode, presenting nanoparticle size distribution (Kolmogorov-Smirnov test).
Figure 7.
Assessment of the immunomodulatory potential and surface marker analysis of EVs produced in differential culture conditions. (A) Evaluation of T-cell proliferation inhibition potency exhibited by both adMSCs and adMSC EVs co-cultured with pooled CFSE pre-labeled PBMCs for a duration of 4 days (n=3, 1-way ANOVA). (B) Microarray-based quantification of EV surface marker expression profiles (n=9, multiple t-tests).

