1. Introduction
Knee osteoarthritis (KOA) is a common joint disease, and it is estimated that the prevalence of KOA among adults aged 45 years and over is around 19% [
1]. The disease usually progresses slowly with aging [
2,
3]. Therefore, the first symptoms, such as joint pain and tenderness, are ignored until they alter normal gait or decrease quality of life [
4,
5,
6]. Usually, the cause of the pain is not clinically confirmed until the pain is unbearable. For this reason, patients often seek medical attention too late, and the only treatment available is pain relief. This usually only prolongs the decision to have joint replacement surgery, which in many cases is unavoidable due to excessive joint pain. Since joint replacement surgery due to KOA has a significant social cost of billions of euros each year [
7], new and novel preventative methods for KOA management are needed.
Although some modifiable risk factors are well known, such as weight or lifestyle (active vs inactive) [
8,
9], only few people are willing to make lifestyle changes to reduce their risk factors. One explanation is that there are no clinically validated methods to quantify the impact of a change on the future condition of the joint, e.g., risk for development of KOA. Current research on the prevention of osteoarthritis mainly focuses on developing quantitative methods and models to classify patients between healthy and osteoarthritic patients [
10,
11,
12]. They are mainly based on the machine learning (ML) and/or deep learning (DL) algorithms, where the models are trained to classify radiographically healthy patients into different degrees of KOA over a given time period with different prognostic variables. However, the major problem is that many classifiers need inputs from various predictor variables that are either difficult, time consuming, or too unpractical to collect from patients (e.g., a certain MRI sequence, or blood or urine samples).
Finite element analysis (FEA) can be used to estimate internal forces within the knee joint tissues during certain physical activities [
13,
14]. Thus, these models are capable to offer personalized information from stresses and strains inside cartilage and/or bone and the effect of alterations in subject weight or gait [
15,
16]. Recent studies on KOA prediction using FEA workflow [
17,
18] have shown promising results, which could be translated into a future tool to assess the future risk of KOA, and further, how different interventions would reduce the risk. The FEA workflow has some important limitations that cannot be tolerated in a clinical tool. First, model generation in FEA usually takes days per subject that can be considered as bottleneck for subject-specific predictions in clinical use. However, this can be avoided by using an atlas-based FEA workflow, where the existing atlas FEA model is scaled to the anatomical dimensions of the knee [
19]. Second, the computational time needed to generate a quantitative output from FEA can take several hours. This is unfeasible when simulating the effects of different interventions when every modification of the model input and rerun takes several hours. A final limitation associated with both the ML/DL models and the FEA method is the need for a clinical image [
14]. The clinical image typically reveals structural changes associated with KOA or damage inflicted by an injury that explains pain in the joint [
6]. However, optimally the prediction should be provided before any significant advance of or symptoms of KOA, but asymptomatic, painless knees are rarely imaged. This means that, the clinical examination and imaging are usually performed too late for a KOA prediction to be beneficial. Therefore, a clinical method not requiring samples or clinical imaging would be a great asset, for example in screening and identifying the KOA risk of the population.
FEA simulation of a knee requires extensive knowledge of knee anatomy, tissue properties, biomechanics, and computational modeling. Whereas many researchers are experts in some of these fields, to master this combination usually requires working on the topic for many years. Many researchers may be interested in estimating the tissue mechanical responses of the knee joints as part of their research, e.g., for complementing their results or testing their hypotheses. However, currently this requires either to get well acquainted with the listed fields, or collaboration with FEA experts. In many cases, the outcome would be, or is expected to be, unworthy of the required effort. In contrast, a simple tool that would provide, even rough, estimations of the tissue mechanical responses based on simple inputs could be of interest for many researchers.
There are two aims in this study. The first aim was to translate the subject-specific atlas-based FEA workflow into real-time ML-based analysis using Gaussian Process Regression (GPR) algorithm. We hypothesized that a
GPR model can be trained to generate simulated cartilage degeneration and tissue mechanical responses of cartilage during gait loading similar to the atlas-based FEA workflow when using age, weight, and anatomical joint dimensions as a set of predictor variables. The second aim was to generalize the model by removing the requirement of a clinical image by estimating the anatomical joint dimensions using another ML-based analysis using also GPR algorithm. We hypothesized that a
ML model can be trained to generate realistic joint dimensions by using age, weight, height, and gender as a set of predictor variables. If the hypotheses can be fully confirmed, it may in the future lead to a method to easily identify individuals at high risk of developing KOA and target preventive measures to this population. As existing research evidence [
20] suggests that visual data on the effects of interventions help to improve patients' adherence to preventive treatment (e.g. weight loss), this novel method based on the GPR models can be seen as a major leap forward in the KOA management. Moreover, tools based on the developed method could be used for research purposes by practically anyone without extensive prior knowledge of FEA to complement studies with estimated tissue mechanical responses.
2. Materials and Methods
2.1. Workflow
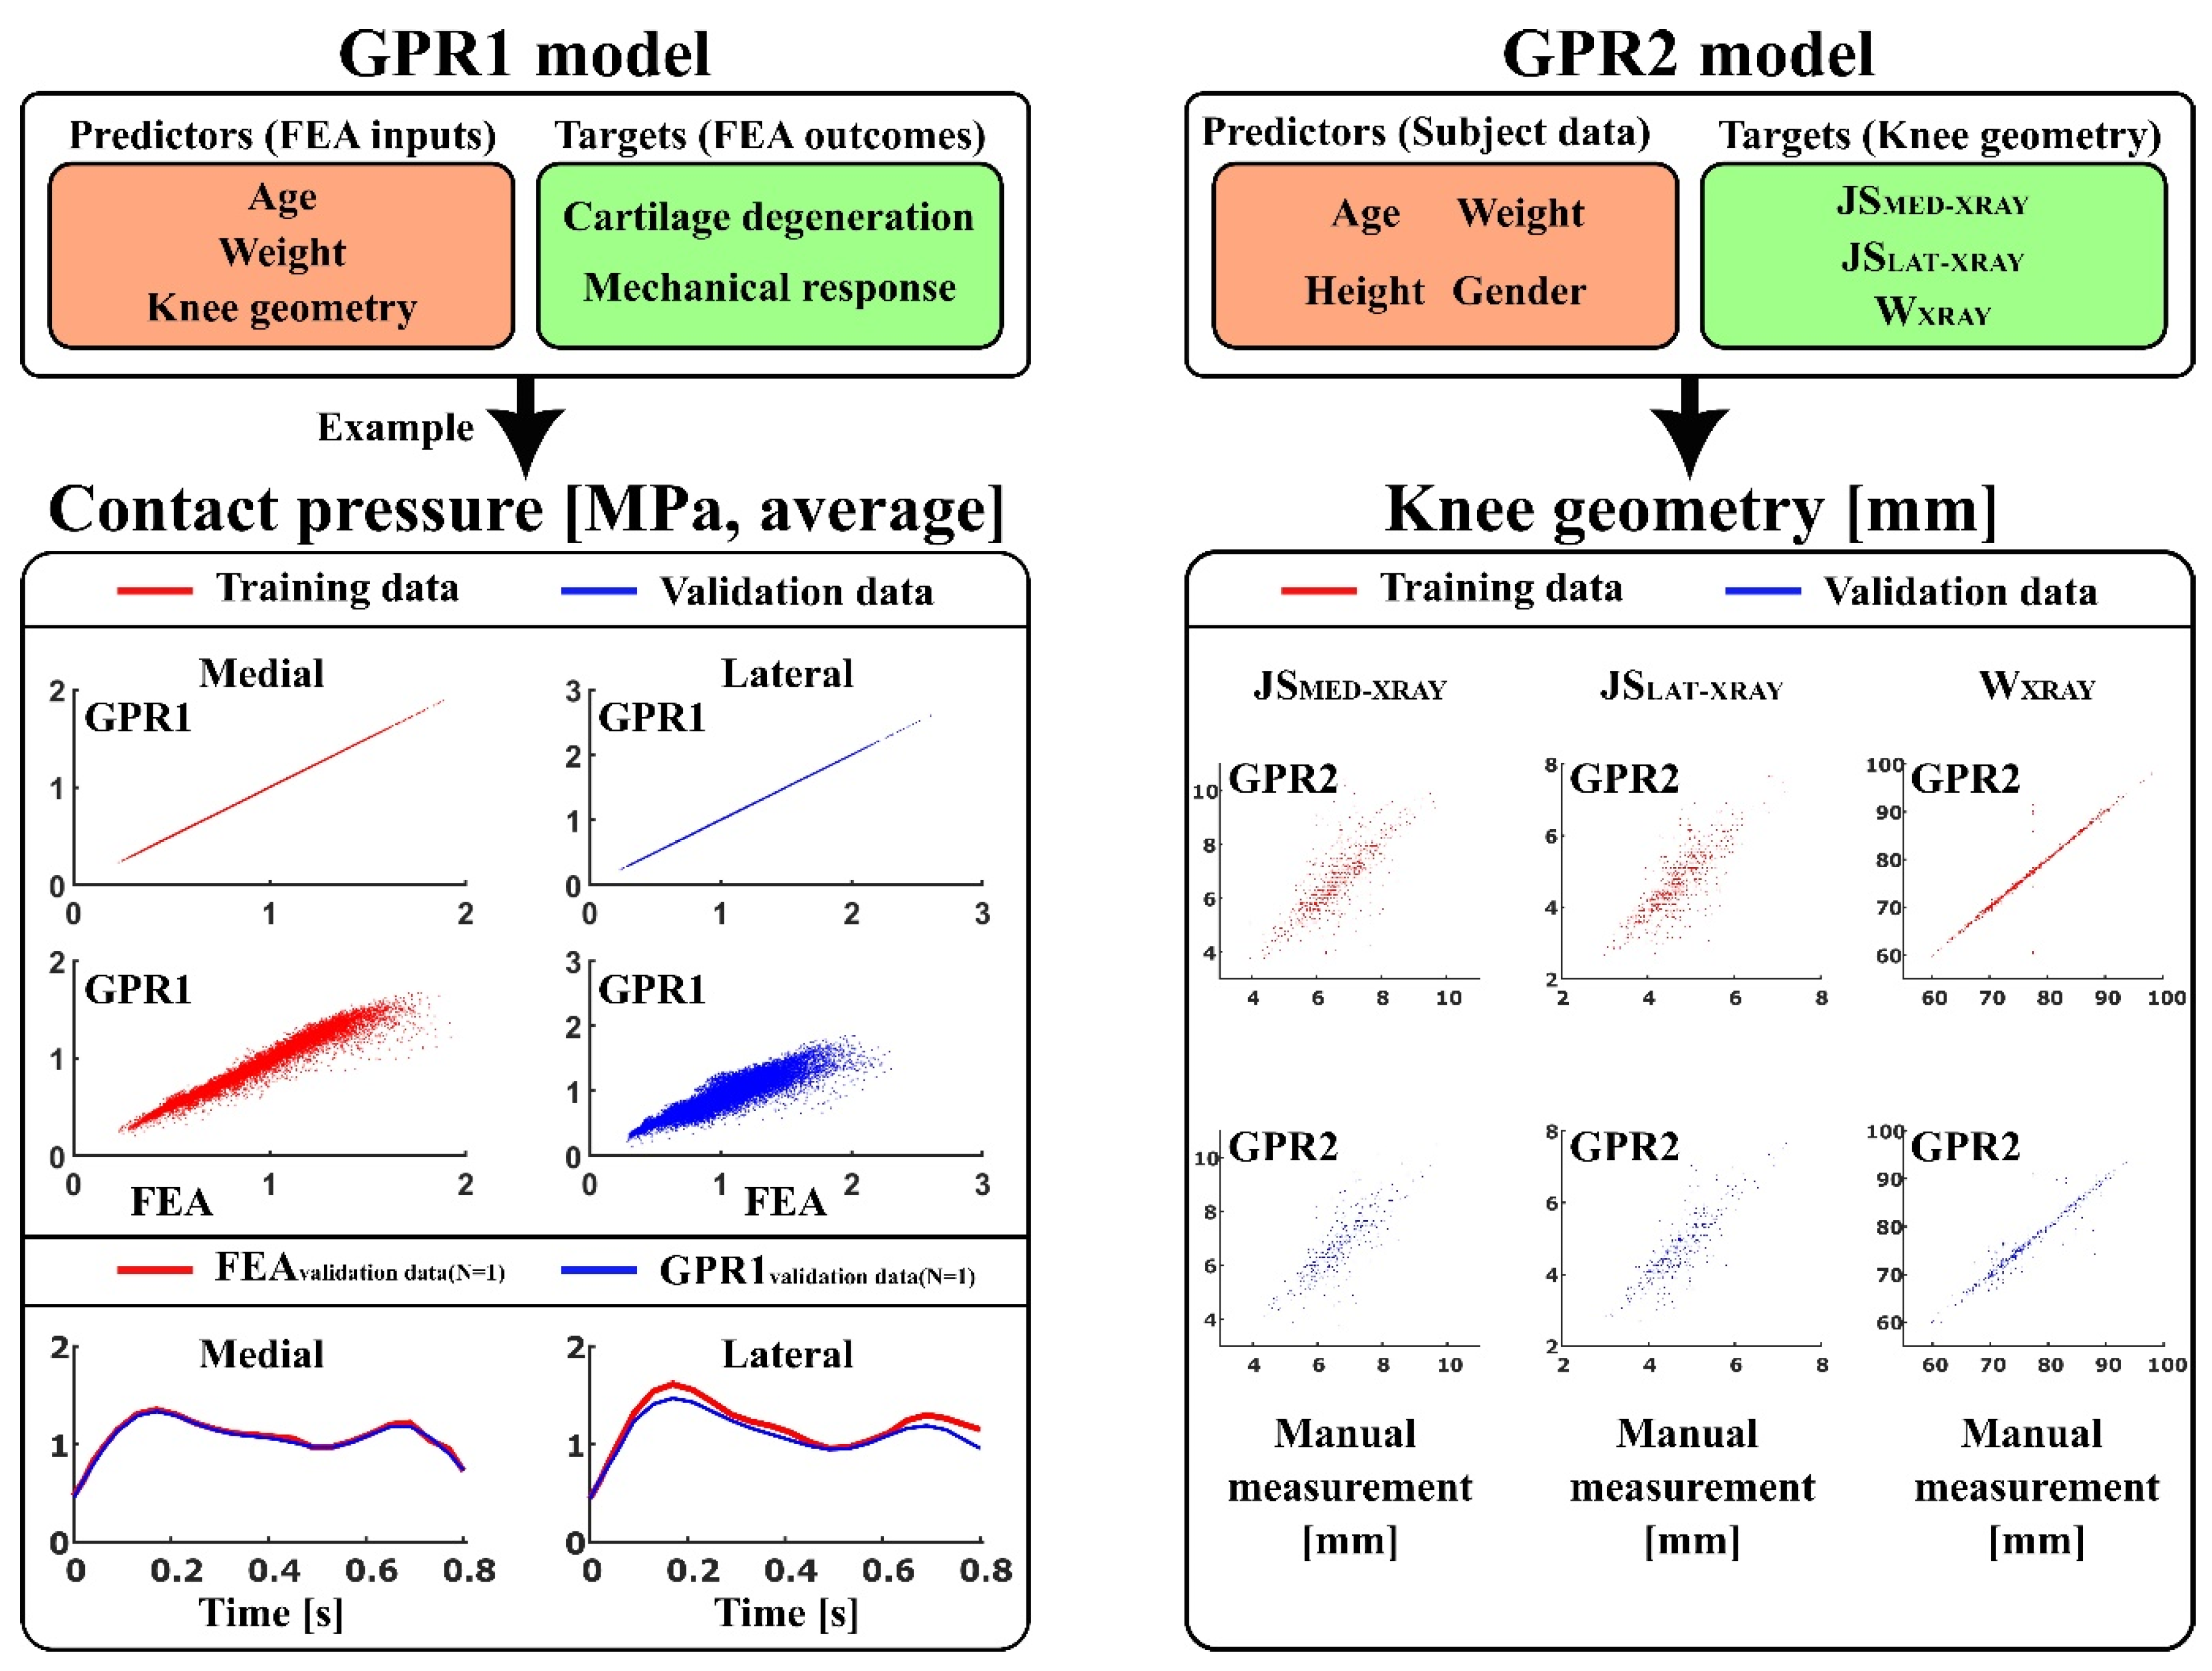
Two types of ML models were trained using exponential kernel-based GPR algorithm (
Figure 1):
GPR1 - to predict atlas-based FEA method [
17] outcomes: contact area, contact pressure, tensile stress, tensile strain, shear stress, shear strain, and pore pressure (peaks and averages over the tibiofemoral contact area), as well as simulated cartilage degeneration using age, weight, and anatomical knee joint dimensions: lateral joint space (JS
LAT-MRI), medial joint space (JS
MED-MRI), maximum lateral anterior-posterior dimension (AP
LAT-MRI), maximum medial anterior-posterior dimensions (AP
MED-MRI), and condyle distance (CD
MRI), as a set of predictor variables.
GPR2 - to predict anatomical knee joint dimensions: lateral joint space (JSLAT-XRAY), medial joint space (JSMED-XRAY), and full medial-lateral width of the distal femur (WXRAY) using age, weight, height, and gender as a set of predictor variables.
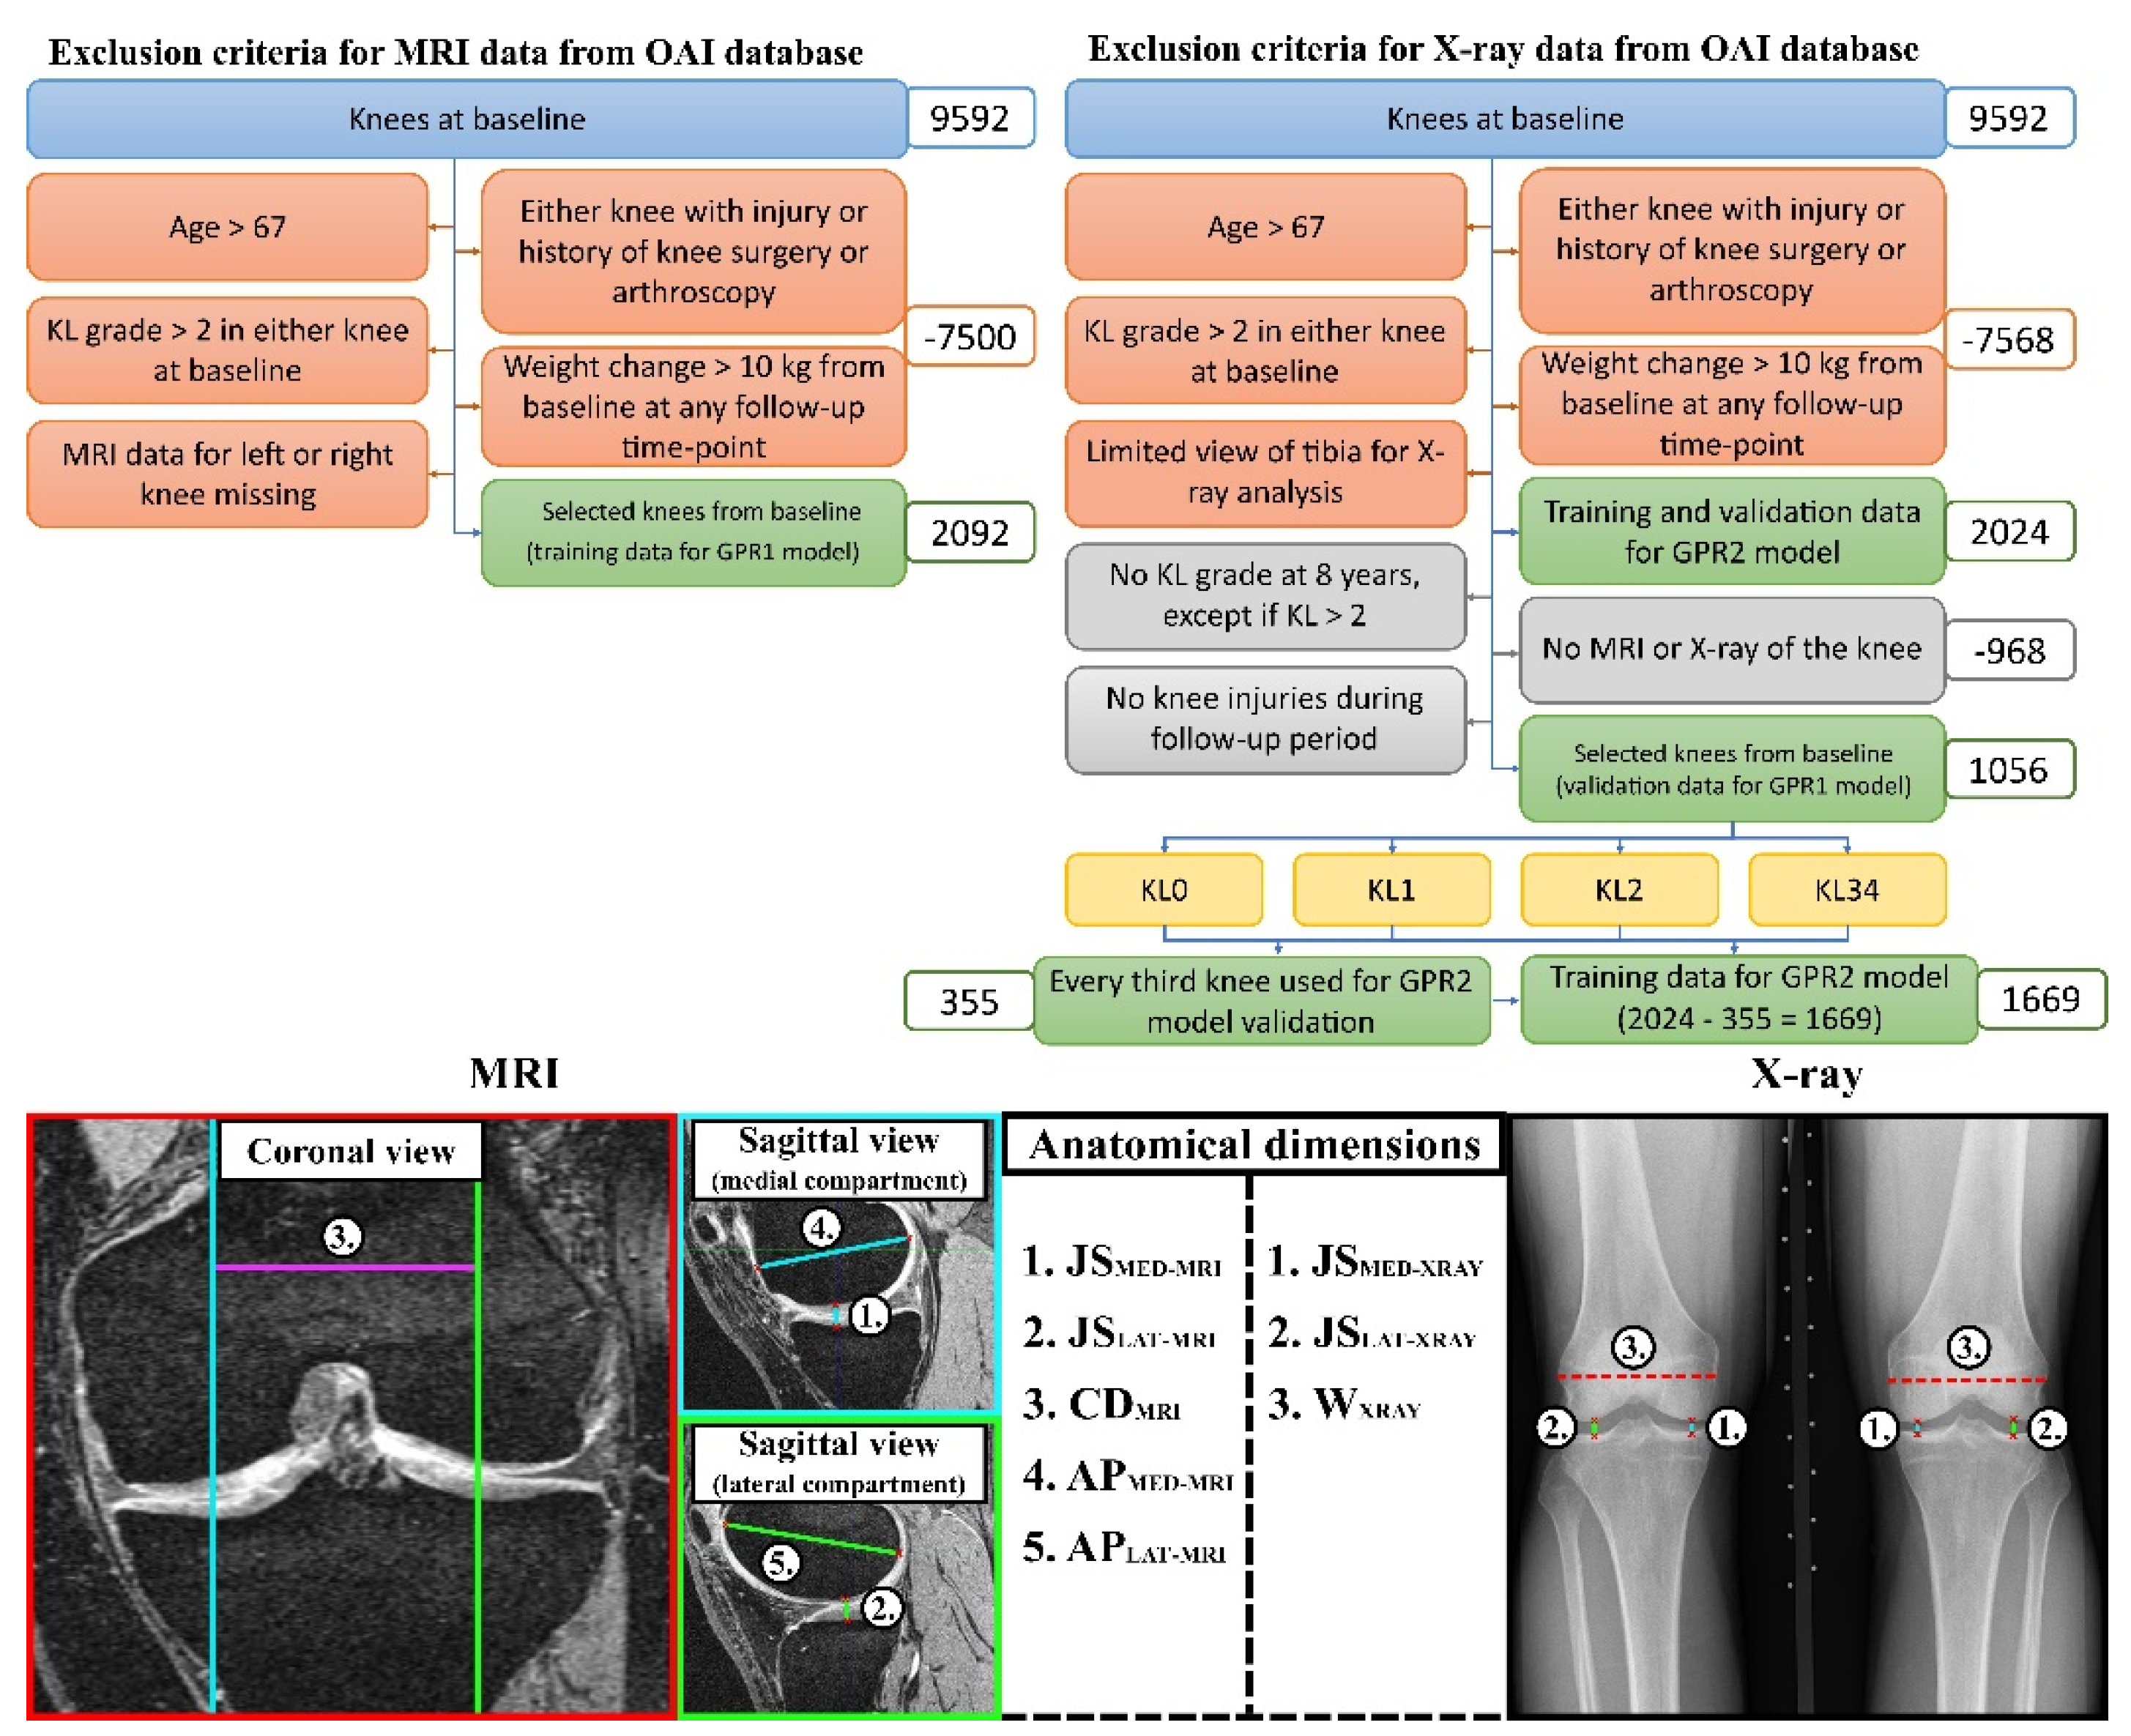
For the first aim of this study, in the GPR1 models (trained separately for each output variable), knee joint dimensions were measured from MRI images of the knees. The trained GPR1 models were validated against the atlas-based FEA method using knee joint dimensions measured from X-ray images as a test set. It should be noted that different knee shapes (knee dimensions) in atlas-based FEA produces different simulation outcomes. In previous studies [
17,
21], it was shown that JS dimensions and other dimensions measured from X-ray and MRI images are not correlated and thus the division between training and testing data can be considered feasible despite overlap of the subjects in training and validating data (
Figure 2-top). It must therefore be taken into account that this approach produces completely different shapes of knee for training and test data, which is crucial to avoid overfitting in ML model training.
For the second aim of this study, the knee joint dimensions were predicted using the GPR2 models (trained separately for each output variable), and these outcomes were used in the GPR1 models providing a less subject-specific outcome suitable for population screening and general KOA risk estimation without clinical (image) data (GPR1+GPR2). For GPR2 models, ~80% and ~20% of the data from eligible subjects were utilized as training and testing data (
Figure 2-top), respectively. Measurements for different anatomical knee dimensions (MRI and X-ray) are presented in detail in section 2.4. All knee dimension measurements were conducted using in-house Matlab scripts (v. R2022b, MathWorks Inc.).
2.2. Data
Separate sets of exclusion criteria (
Figure 2-top) for MRI and X-ray images were applied to the Osteoarthritis Initiative (OAI) database (
https://nda.nih.gov/oai/) to obtain age, height, weight, and gender, and knee MRI and X-ray images at baseline, and the Kellgren-Lawrence (KL)-grades [
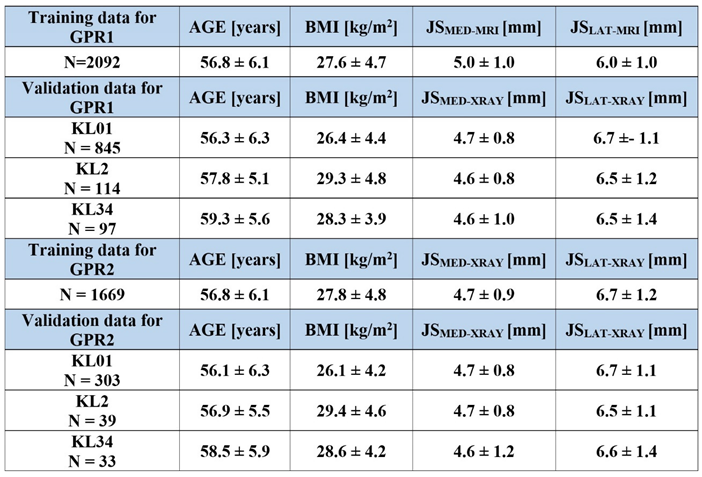
22] at 8-year follow-up timepoint of eligible subjects (
Table 1). Ethical approval for collecting subject information was granted by the OAI. Knee MRI scans were carried out in accordance with FDA guidelines, while knee radiographs (X-rays) were acquired by typical guidelines for annual and total radiation dosage to research subjects. Written consent was obtained from all subjects prior to each clinic visit. The OAI study was approved by the Institutional Review Board (IRB) for the University of California, San Francisco (UCSF) and its affiliates. The IRB approval was also obtained from all the four clinical sites located at Brown University in Rhode Island, Ohio State University in Columbus, Ohio, University of Maryland/Johns Hopkins University joint center in Baltimore, Maryland, and at the University of Pittsburgh in Pennsylvania. Further details about the OAI data are accessible on the OAI website (
https://nda.nih.gov/oai/).
2.3. Training Data in GPR1 and GPR2 Models
The GPR1 models were trained against atlas-based FEA-based simulations of cartilage degeneration and cartilage mechanical response (see 2.1. Workflow). For cartilage degeneration of each subject, the training data included multiple sets of predictor values varying the baseline age to 75 years of age while similarly changing the target variable (degeneration) and keeping other predictor values as constant. Due to different loading conditions between medial and lateral compartments (different load transfer through medial and lateral meniscus) [
19], training data was composed separately for medial and lateral compartments of tibial and femoral cartilage. This produced four different GPR1 models (medial tibial, medial femoral, lateral tibial, and lateral medial) with 40259 different sets of predictor-target variable pairs.
For cartilage mechanical responses of each subject, the training data included multiple sets of predictor values varying the discrete gait time points (FEA converged solutions) while similarly altering the target variable (mechanical response parameters, see 2.1. Workflow) and keeping other predictor values as constant. Average and peak mechanical responses on the tibial cartilage surface through the tibiofemoral joint were simulated (medial and lateral compartments considered separately due to differences in loading conditions), this produced a set of four different GPR1 models (medial mean, medial peak, lateral mean, and lateral peak) with 48136 different sets of predictor-target variable pairs.
The GPR2 models were trained against the subject characteristics (see 2.1. Workflow). Based on the exclusion criteria (
Figure 2-top), to ensure covering the whole span of predictions, a stratified selection of 33% of subjects (based on KL grade) from eligible subjects used for the validation of the GPR1 model was performed (N = 355, ~18%). This ensured a similar prediction accuracy across the KL groups also for the training data (N = 2024 – 355 = 1669, ~78%). This produced three GPR2 models with 1669 different sets of predictor-target variable pairs when training GPR2 models to predict different anatomical knee dimensions (
Figure 1).
2.4. Atlas-Based FEA Method
The utilized atlas-based FEA workflow has been described in detail in previous studies [
17,
19,
23]. Here is a summary of the main points in the workflow. Subject-specific knee joint geometries for FEA models were generated using an atlas-based workflow for all eligible knees using MRI and X-ray data (N = 2092 MRI-based models + 1117 X-ray based models = 3209 FEA models). To scale the existing atlas model based on the MRI image data, the following anatomical dimensions of the knee were measured (
Figure 2-bottom):
the tibiofemoral joint spaces (total cartilage thickness) at the medial compartment (JSMED-MRI)
the tibiofemoral joint spaces (total cartilage thickness) at the lateral compartment (JSLAT-MRI)
the maximum anterior-posterior dimensions at medial femoral condyles (APMED-MRI)
the maximum anterior-posterior dimensions at lateral femoral condyles (APLAT-MRI)
the medial-lateral condyle distance measured as a distance between the medial and lateral contact area (CDMRI)
Similarly, the following anatomical dimensions were measured from the X-ray images (
Figure 2-bottom):
the tibiofemoral joint spaces at the medial compartment (JSMED-Xray)
the tibiofemoral joint spaces at the lateral compartment (JSLAT-Xray)
full medial-lateral width of the distal femur (WXray)
Based on the measured anatomical dimensions, 3D subject specific knee FEA geometries for medial and lateral compartments were generated and simulated under gait loading conditions. See the
supplementary material for a more detailed description of the template scaling and the material model used.
2.5. Simulation of Cartilage Degeneration
The algorithm for cartilage degeneration was based on the previous study. See the
supplementary material for a more details.
2.6. Statistical Analysis
The relations between the GPR1 model and FEA outputs, as well as between GPR2 model outputs and measured anatomical dimensions were evaluated using Pearson correlation. The goodness of the correlations was assessed in terms of coefficient of determination R2 and root mean square error (RMSE). For comparison of cartilage degeneration volumes based on OA severity and between the different approaches, the knees were divided into groups based on the KL-grading at 8-year follow-up: KL0 and KL1 (healthy), KL2 (doubtful OA), combined KL3 and KL4 (severe OA). Non-parametric Mann-Whitney U-test (two independent samples) was used to evaluate KL-group-wise differences in the predicted degenerations based on GPR1, GPR1+GPR2 models, and atlas-based FEA workflows. To evaluate differences within each KL group between GPR1 and FEA workflows, and GPR1+GPR2 and FEA workflows, a non-parametric Wilcoxon signed rank test (two related samples) was used. For all statistical tests, p < 0.05 was considered as the level of significance.
To evaluate the suitability of the GPR1 and GPR1+GPR2 models for simulating the progression of KOA, ROC (receiver operating characteristic) curves and AUC (area under ROC curve) were calculated. Instead of presenting confusion matrices between atlas-based FEA and GPR models for the accuracies of the classifiers, ROC curves are reported since they allow the evaluation of the performance of the classifier at all possible classification thresholds [
24]. In the ROC analysis, we focused only on demonstrating classification power against those KL groups that were statistically different from the severe OA KL34 group. Therefore, KL0 and KL1 groups, which can be considered healthy, were merged (KL01) in the ROC analysis.
Results
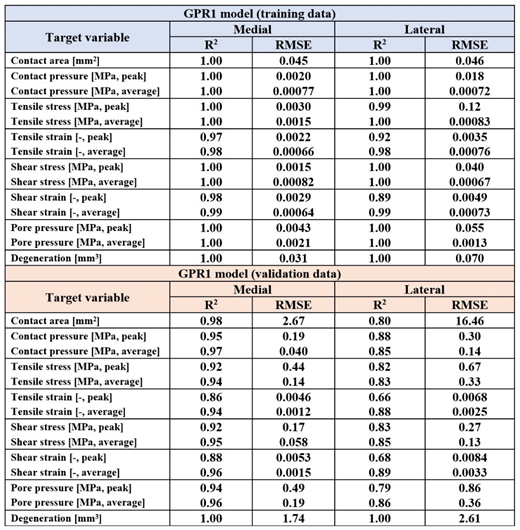
The trained GPR1-based predictions of mechanical responses and cartilage degeneration were highly correlated with the outputs based on the FEA workflow (p <0.001,
Table 2). The Pearson correlation coefficients of determination (R
2) for mechanical responses over tibiofemoral contact area varied between 0.89 - 1 with the training data, whereas for the testing data, they varied between 0.66 - 0.98, except for predicted cartilage degeneration (R
2 = 1.0). The correlations were stronger in the medial compartment (R
2 = 0.86 - 0.98) compared to the lateral compartment (R
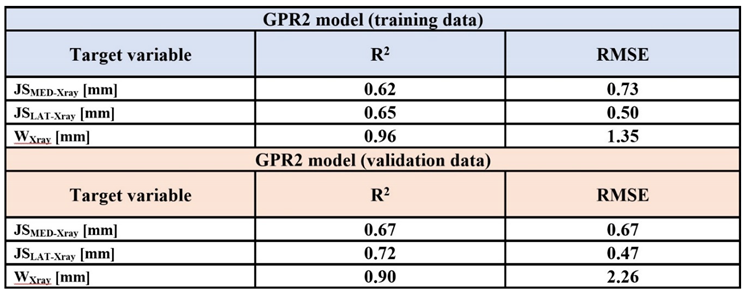
2 = 0.66 - 0.89) when predicting mechanical responses of cartilage. The trained GPR2-based predictions of knee joint dimensions were correlated with the dimensions measured manually from the X-ray images (p <0.001,
Table 3). The Pearson correlation coefficients of determination (R
2) in the training and validation data were in a similar range. The strongest correlation was found in the full medial-lateral width of the distal femur.
There were no differences in the simulated volumetric cartilage degenerations between the atlas-based FEA workflow and GPR1-based predictions in any KL groups (
Figure 3-top). Both atlas-based FEA workflow and GPR1-based predictions showed significantly larger simulated cartilage degeneration in the KL34 group compared to the KL0 and KL1 groups (p<0.001). Additionally, simulated cartilage degeneration significantly increased with advancing KL grade. When comparing GPR1+GPR2-based predictions with the atlas-based FEA workflow-based predictions, the simulated degeneration was significantly higher in the KL34 group compared to the KL0 and KL1 groups (p<0.001 & p<0.01,
Figure 3-bottom). In contrast to GPR1-based predictions, GPR1+GPR2-based predictions failed to show statistically significant differences between consecutive KL groups. Furthermore, in the KL2 group, the atlas-based FEA workflow and GPR2-based predictions differed (p < 0.05). Based on the ROC curves for classification between the KL01 and KL34 groups, predictions for the onset and progression of KOA were very similar between atlas-based FEA workflow and both GPR-based models (AUC = 0.73 - 0.74,
Figure 4).
3. Discussion
In this study, atlas-based FEA workflow based GPR models were extensively evaluated to determine their capabilities of simulating/predicting the FEA outputs and anatomical dimensions from knee X-rays. The first set of ML models (GPR1) were trained to estimate cartilage mechanical responses and cartilage degeneration against atlas-based FEA based workflow, based on age, weight, and anatomical knee joint dimensions. The second set of ML models (GPR2) was trained to predict personalized knee joint geometries based on age, weight, height, and gender. The GPR models had good (GPR2) to excellent (GPR1) prediction accuracies. Moreover, to investigate a more generalized approach to predicting cartilage degeneration, i.e., the development of OA, at a population level, GPR1 and GPR2 models were combined. Surprisingly, also the combined model, which did not include any clinical image data, was able to classify the osteoarthritic and healthy knees.
During recent years, a trend to develop ML/DL-based models to predict the onset and progression of KOA has emerged [
10,
11,
12]. In these studies, various sets of predictor variables have been tested providing different capabilities to offer predictions for cartilage degeneration. The superiority of the models is assessed by AUC values, but AUC value comparison is insufficient for judging whether one model is better than another, since the target variables and time periods for prediction may differ a lot in those models. For example, in one study [
25] progressive OA is defined when cartilage thickness is decreased more than 0.7mm, whereas other studies usually define progressive/severe OA as KL-grade increase to 2-4 [
10,
11,
12]. Therefore, it is extremely crucial to adjust the data properly to avoid uncertainty when interpreting the usefulness of the developed models. For example, a 1 mm reduction in cartilage thickness in patients with initially thick cartilage (JS > 1cm) would probably be diagnosed as healthy. Cartilage thinning, or joint space narrowing, is natural during ageing, and it may be faster during certain ages [
26,
27]. It would therefore be preferable to use threshold values that are somehow linked to the severity of KOA, like KL grades. This is precisely why in this study the KL-grades were used as the target variable to classify the severity of KOA.
The prediction accuracy of the GPR2 models for the knee shape was surprisingly high. The results indicate that in addition to knee size, cartilage thickness (in a healthy knee) can be estimated with high accuracy based on only age, weight, height, and gender. Similar findings have been presented in earlier studies [
26,
28]. This further underline that instead of predicting cartilage thinning, a more appropriate approach would be to predict different levels of OA severity based on commonly agreed criteria, because cartilage thinning occurs naturally during ageing, and therefore possesses no need for computational methods to predict it. Instead of cartilage thinning, the ability to predict the necessity of joint replacement surgery would be of higher importance. This would help targeting preventative conservative treatment options to those who would actually benefit from them. It has been shown that subjects with KL grade 3 or 4 have an increased risk for knee joint replacements and a decrease in quality of life compared to those having KL grade 0,1, or 2 [
4,
29]. Thus, future studies should prioritize the ability to predict individuals at high risk of developing KL3 or 4 knees.
Prediction accuracies for the KOA progression for atlas-based FEA workflow, GPR1, and GPR1+GPR2 models were very similar with AUC values varying between 0.73 and 0.74 for each. This can be considered puzzling especially as the GPR1+GPR2 model provides such comparative prediction accuracy without the need of any clinical image data input parameters from subjects, whereas FEA and GPR1 require that subject-specific information. The reason for this can be found in the inclusion criteria for selecting suitable subjects for this study. In the current study, knee dimensions were collected from radiographically healthy knees without a visually detectable signs of KOA. As the results of the GPR2 model have already shown, the joint geometry and cartilage thickness can be predicted with reasonable accuracy from this patient population. This led to surprisingly good results in predicting the risk of osteoarthritis onset with GPR1+GPR2 models.
As AUC values of 0.7-0.8 can be considered as acceptable discrimination accuracy, this study emphasizes that FEA is not necessarily needed to offer personalized predictions for the onset and progression of KOA, as it can be replaced with well-trained ML models using GPR algorithms. However, it should be considered that when developing a ML-based classifier based only on those inputs (predictor variables) needed in the GPR1+GPR2 model, the output is a binary classifier (KL01 vs KL34) that is not capable of showing the effect of different interventions (such as weight loss) on the predicted risk for the onset and progression of KOA. Therefore, a switch from regression-based ML models to ML classifications is not recommended. In GPR1- and GPR1+GPR2-based approaches, the influence of the change in the input parameters (weight) on the prediction can be quantified. In terms of patient engagement with conservative interventions, e.g. weight loss, it is important to show how individual lifestyle changes may make a difference in disease progression [
20]. Because the GPR models in this study were trained on a large patient dataset including healthy knees with a variety of subject characteristics, they will perform reasonably well for a wide range of patients in terms of age, height, weight, and gender. However, it must be considered that the cartilage in the tibiofemoral joint must be intact without signs of excessive thinning or cartilage injuries.
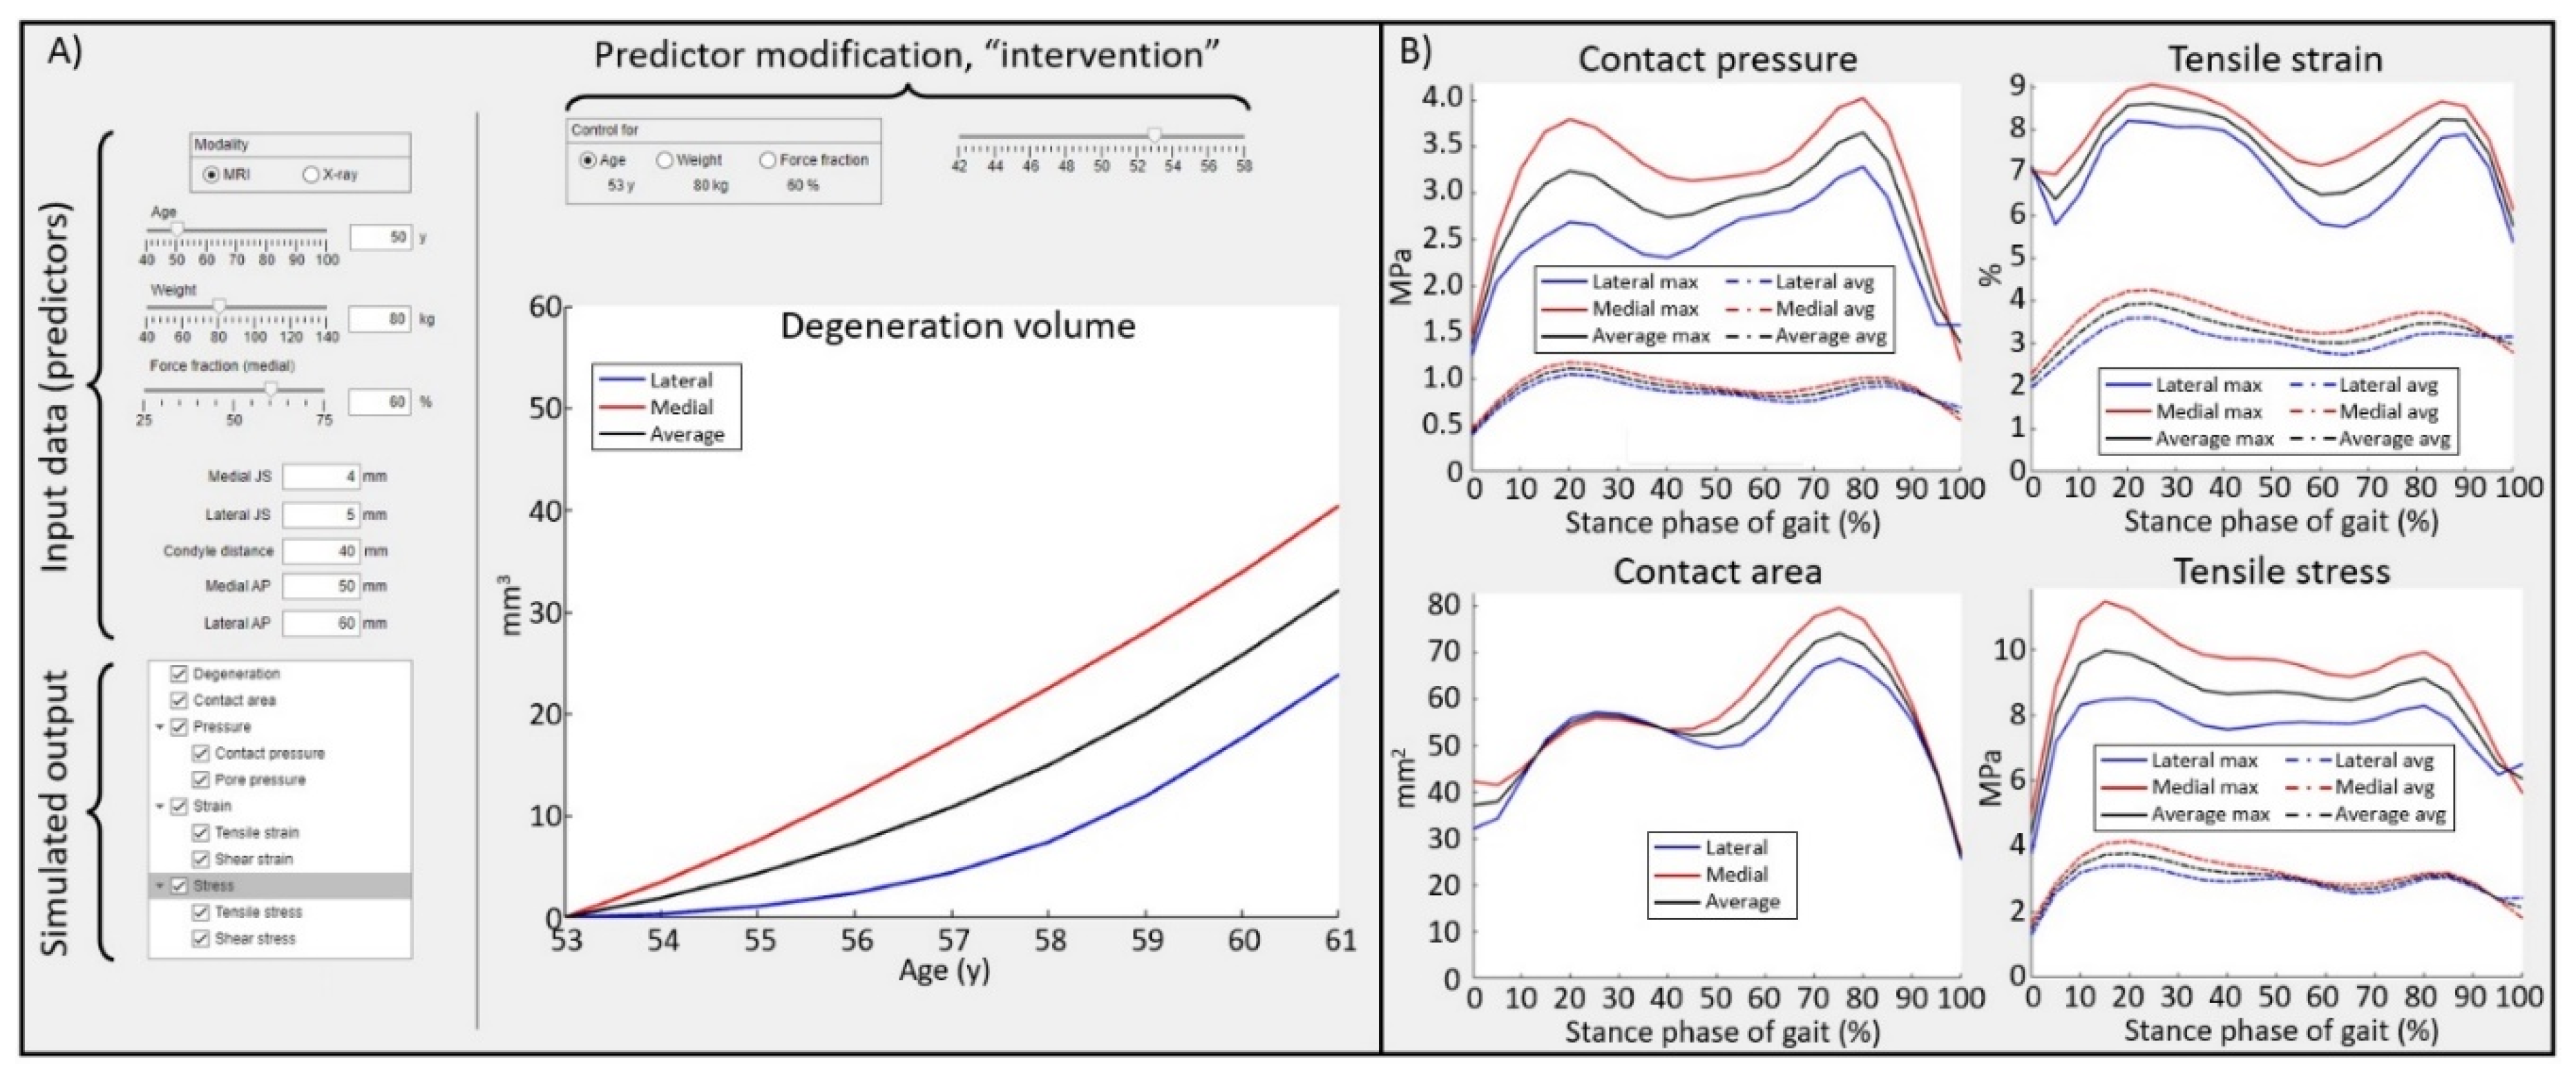
The best thing about the GPR models developed in this study is that they work in real-time. This is a great asset, as the atlas-based FEA workflow utilized in this study requires approximately two hours of simulation time per knee joint. The trained ML models based on the GPR algorithms will provide a novel technology to evaluate mechanical responses within knee for researchers or clinicians who have no former knowledge from FEA (
Figure 5). Furthermore, the introduced GPR models will enable the development of new types of exploitable technologies. In the current approaches the gait loading in atlas-based FEA workflow that was used for training (GPR1) was based on the generic loading conditions based on the body weight of the subject [
19,
23]. In future, generic loading conditions could be replaced with personalized knee joint loading data based on the IMU sensors or video data, e.g. from smartphones [
30,
31]. This would then allow new conservative non-clinical interventions for the prevention of osteoarthritis. For instance, such technology could be used for selecting a shoe or an insole for optimized joint health, or for gait re-training.
The presented results suggest that trained GPR models can be considered as a viable alternative or even replacement to FEA when making predictions for the mechanical responses or the future joint condition (
Figure 5), specifically KOA, when predictions are offered for individuals who have no history of a severe knee injury. GPR models provide a quick and easy tool to assess the risk for the onset and progression of osteoarthritis without previous knowledge of FEA methods. Real-time GPR models provide a rapid tool for planning preventive care and the technology to engage patients in preventive interventions.
Supplementary Materials
The following supporting information can be downloaded at the website of this paper posted on Preprints.org.
CRediT authorship contribution statement
M.E.M.: Conceptualization, Methodology, Software, Validation, Formal analysis, Investigation, Writing - review & editing, Visualization, Project administration, Funding acquisition. M.K.L.: Methodology, Software, Validation, Investigation, Formal analysis, Writing - review & editing M.J.T.: Methodology, Software, Validation, Investigation, Formal analysis, Writing - review & editing
Funding Sources
The research leading to these results has received funding from the Research Council of Finland (grants 324994, 328920, 352666), Research Committee of the Kuopio University Hospital Catchment Area for the State Research Funding (Grant Number: 5654242) and the Sigrid Juselius Foundation (Grant Number: 230123).
Role of the Funding Sources
The funding sources had no role in the study design, collection, analysis, or interpretation of data; in the writing of the manuscript; or in the decision to submit the manuscript for publication.
Data availability
The data created and analyzed during the current study are available from the corresponding author upon reasonable request.
Acknowledgements
The authors wish to thank the patients and staff of all the hospitals who have contributed data to the Osteoarthritis Initiative. The OAI is a public-private partnership comprised of five contracts (N01-AR-2-2258; N01-AR-2-2259; N01- AR-2-2260; N01-AR-2-2261; N01-AR-2-2262) funded by the National Institutes of Health, a branch of the Department of Health and Human Services, and conducted by the OAI Study Investigators. Private funding partners include Merck Research Laboratories; Novartis Pharmaceuticals Corporation, GlaxoSmithKline; and Pfizer, Inc. Private sector funding for the OAI is managed by the Foundation for the National Institutes of Health. This manuscript was prepared using an OAI public use data set and does not reflect the opinions or views of the OAI investigators, the NIH, or the private funding partners.
Conflict of Interest Statement
Mika E. Mononen and Mikael J. Turunen own shares in Aikoa Technologies Oy.
Ethical approval
Not applicable
References
- Lawrence RC, Felson DT, Helmick CG, et al. Estimates of the prevalence of arthritis and other rheumatic conditions in the United States: Part II. Arthritis Rheum. 2008;58(1):26-35. [CrossRef]
- Shane Anderson A, Loeser RF. Why is osteoarthritis an age-related disease? Best Pract Res Clin Rheumatol. 2010;24(1):15-26. [CrossRef]
- Theis KA, Murphy LB, Guglielmo D, et al. Prevalence of Arthritis and Arthritis-Attributable Activity Limitation — United States, 2016–2018. MMWR Morb Mortal Wkly Rep. 2021;70(40):1401-1407. [CrossRef]
- Törmälehto S, Mononen ME, Aarnio E, Arokoski JPA, Korhonen RK, Martikainen J. Health-related quality of life in relation to symptomatic and radiographic definitions of knee osteoarthritis: data from Osteoarthritis Initiative (OAI) 4-year follow-up study. Health Qual Life Outcomes. 2018;16(1):154. [CrossRef]
- Duffell LD, Southgate DFL, Gulati V, McGregor AH. Balance and gait adaptations in patients with early knee osteoarthritis. Gait Posture. 2014;39(4):1057-1061. [CrossRef]
- Felson DT, Hodgson R. Identifying and Treating Preclinical and Early Osteoarthritis. Rheumatic Disease Clinics of North America. 2014;40(4):699-710. [CrossRef]
- Murphy LB, Cisternas MG, Pasta DJ, Helmick CG, Yelin EH. Medical Expenditures and Earnings Losses Among US Adults With Arthritis in 2013. Arthritis Care Res (Hoboken). 2018;70(6):869-876. [CrossRef]
- Musumeci G, Aiello F, Szychlinska M, Di Rosa M, Castrogiovanni P, Mobasheri A. Osteoarthritis in the XXIst Century: Risk Factors and Behaviours that Influence Disease Onset and Progression. Int J Mol Sci. 2015;16(12):6093-6112. [CrossRef]
- Bliddal H, Leeds AR, Christensen R. Osteoarthritis, obesity and weight loss: evidence, hypotheses and horizons – a scoping review. Obesity Reviews. 2014;15(7):578-586. [CrossRef]
- Hirvasniemi J, Runhaar J, van der Heijden RA, et al. The KNee OsteoArthritis Prediction (KNOAP2020) challenge: An image analysis challenge to predict incident symptomatic radiographic knee osteoarthritis from MRI and X-ray images. Osteoarthritis Cartilage. 2023;31(1):115-125. [CrossRef]
- Ramazanian T, Fu S, Sohn S, Taunton MJ, Kremers HM. Prediction Models for Knee Osteoarthritis: Review of Current Models and Future Directions. Arch Bone Jt Surg. 2023;11(1):1-11. [CrossRef]
- Appleyard T, Thomas MJ, Antcliff D, Peat G. Prediction Models to Estimate the Future Risk of Osteoarthritis in the General Population: A Systematic Review. Arthritis Care Res (Hoboken). 2023;75(7):1481-1493. [CrossRef]
- Cooper RJ, Wilcox RK, Jones AC. Finite element models of the tibiofemoral joint: A review of validation approaches and modelling challenges. Med Eng Phys. 2019;74:1-12. [CrossRef]
- Paz A, Orozco GA, Korhonen RK, García JJ, Mononen ME. Expediting Finite Element Analyses for Subject-Specific Studies of Knee Osteoarthritis: A Literature Review. Applied Sciences. 2021;11(23):11440. [CrossRef]
- Halonen KS, Dzialo CM, Mannisi M, Venäläinen MS, de Zee M, Andersen MS. Workflow assessing the effect of gait alterations on stresses in the medial tibial cartilage - combined musculoskeletal modelling and finite element analysis. Sci Rep. 2017;7(1):17396. [CrossRef]
- Liukkonen MK, Mononen ME, Vartiainen P, et al. Evaluation of the Effect of Bariatric Surgery-Induced Weight Loss on Knee Gait and Cartilage Degeneration. J Biomech Eng. 2018;140(4). [CrossRef]
- Mononen ME, Liukkonen MK, Turunen MJ. X-ray with finite element analysis is a viable alternative for MRI to predict knee osteoarthritis: Data from the Osteoarthritis Initiative. Journal of Orthopaedic Research. Published online April 22, 2024. [CrossRef]
- Paz A, García J, Korhonen R, Mononen M. Towards a Transferable Modeling Method of the Knee to Distinguish Between Future Healthy Joints from Osteoarthritic Joints: Data from the Osteoarthritis Initiative. Ann Biomed Eng. 2023; [CrossRef]
- Mononen ME, Liukkonen MK, Korhonen RK. Utilizing Atlas-Based Modeling to Predict Knee Joint Cartilage Degeneration: Data from the Osteoarthritis Initiative. Ann Biomed Eng. 2019;47(3). [CrossRef]
- Widén E, Junna N, Ruotsalainen S, et al. How Communicating Polygenic and Clinical Risk for Atherosclerotic Cardiovascular Disease Impacts Health Behavior: an Observational Follow-up Study. Circ Genom Precis Med. 2022;15(2). [CrossRef]
- Mortensen JF, Mongelard KBG, Radev DI, et al. MRi of the knee compared to specialized radiography for measurements of articular cartilage height in knees with osteoarthritis. J Orthop. 2021;25:191-198. [CrossRef]
- Kellgren JH, Lawrence JS. Radiological Assessment of Osteo-Arthrosis. Ann Rheum Dis. 1957;16(4):494-502. [CrossRef]
- Mononen ME, Paz A, Liukkonen MK, Turunen MJ. Atlas-based finite element analyses with simpler constitutive models predict personalized progression of knee osteoarthritis: data from the osteoarthritis initiative. Sci Rep. 2023;13(1):8888. [CrossRef]
- Martínez-Camblor P, Pérez-Fernández S, Díaz-Coto S. The area under the generalized receiver-operating characteristic curve. Int J Biostat. 2021;18(1):293-306. [CrossRef]
- Chan LC, Li HHT, Chan PK, Wen C. A machine learning-based approach to decipher multi-etiology of knee osteoarthritis onset and deterioration. Osteoarthr Cartil Open. 2021;3(1):100135. [CrossRef]
- Cai G, Jiang M, Cicuttini F, Jones G. Association of age, sex and BMI with the rate of change in tibial cartilage volume: a 10.7-year longitudinal cohort study. Arthritis Res Ther. 2019;21(1):273. [CrossRef]
- Si L, Xuan K, Zhong J, et al. Knee Cartilage Thickness Differs Alongside Ages: A 3-T Magnetic Resonance Research Upon 2,481 Subjects via Deep Learning. Front Med (Lausanne). 2021;7. [CrossRef]
- Karvonen RL, Negendank WG, Teitge RA, Reed AH, Miller PR, Fernandez-Madrid F. Factors affecting articular cartilage thickness in osteoarthritis and aging. J Rheumatol. 1994;21(7):1310-1318.
- Gwynne-Jones JH, Wilson RA, Wong JMY, Abbott JH, Gwynne-Jones DP. The Outcomes of Nonoperative Management of Patients With Hip and Knee Osteoarthritis Triaged to a Physiotherapy-Led Clinic at Minimum 5-Year Follow-Up and Factors Associated With Progression to Surgery. J Arthroplasty. 2020;35(6):1497-1503. [CrossRef]
- Pagnon D, Domalain M, Reveret L. Pose2Sim: An End-to-End Workflow for 3D Markerless Sports Kinematics—Part 1: Robustness. Sensors. 2021;21(19):6530. [CrossRef]
- Di Raimondo G, Willems M, Killen BA, et al. Peak Tibiofemoral Contact Forces Estimated Using IMU-Based Approaches Are Not Significantly Different from Motion Capture-Based Estimations in Patients with Knee Osteoarthritis. Sensors. 2023;23(9):4484. [CrossRef]
|
Disclaimer/Publisher’s Note: The statements, opinions and data contained in all publications are solely those of the individual author(s) and contributor(s) and not of MDPI and/or the editor(s). MDPI and/or the editor(s) disclaim responsibility for any injury to people or property resulting from any ideas, methods, instructions or products referred to in the content. |
© 2024 by the authors. Licensee MDPI, Basel, Switzerland. This article is an open access article distributed under the terms and conditions of the Creative Commons Attribution (CC BY) license (http://creativecommons.org/licenses/by/4.0/).
