
Submitted:
12 September 2024
Posted:
13 September 2024
You are already at the latest version
Abstract
Search for the new non-invasive methods of investigating the functioning of human internal organs is an urgent task. One of these methods for assessing the functioning of the human res-piratory system is electromagnetic sensing, based on a significant difference in the dielectric permittivity of muscle tissue and air. During breathing, when the lungs are filled with air, the dielectric permittivity of the lungs decreases, which leads to a change in the level of the elec-tromagnetic signal passing through the body.
Results of experiments on recording changes in the level of electromagnetic radiation passing through the human body, performed on an experimental device consisting of eight transmitting and receiving antennas located on opposite sides of the chest have been presented in the article. The possibility of visualizing the measured “pulmonograms” in the form of dynamic two-dimensional images showing the process of filling various parts of the lungs with air has been demonstrated.
Keywords:
medical imaging
; image reconstruction algorithms
; electromagnetic sensors for physiological monitoring
; respiratory system
; disease localization
; microwave imaging techniques
; electro-magnetic medical imaging and sensing (EMIS)
1. Introduction
Existing directions for the use of microwaves in medical tasks and methods of obtaining images which are convenient for interpreting of obtained results can be classified according to the object of investigation, the method of obtaining information and the method of visualizing information.
In the article, the object of investigation is the human respiratory system. Investigation is carried out by the method of microwave spatial end-to-end scanning of the lungs during breathing, by measuring the attenuation of signals transmitted through the chest, followed by their conversion into pulmonograms. Visualization of obtained information is carried out by converting individual pulmonograms measured in different areas of the lungs into dynamically changing two-dimensional color images.
The possibility of obtaining information about the human respiratory system by the chosen investigation method is based on the physical property that dielectric permittivity of the lungs changes during breathing. Literature review revealed the fundamental differences between the chosen research method and existing methods of investigating the human respiratory system using microwave method. The presented method:
1) is based on end–to-end microwave scanning of the object of investigation - the lungs and on measuring of electromagnetic signal levels during breathing;
2) does not depend on the specific values of the dielectric permittivity of the scanning medium;
3) is aimed at obtaining information about dynamic changes in the object of investigation, which allows to see the air motion in the lungs;
4) allows to scan the entire volume of the lungs at almost in the same time, which allows to carry out the investigation on the task of air distribution in different areas of lungs in dynamics;
5) uses noncoherent integration by synchronizing breathing cycles, which allows to increase the signal-to-noise ratio and reliability of measurement results.
To implement the human respiratory investigation system based on these methods in practice, complex device was developed [1,2] and a series of numerous experiments were carried out on humans at the safe radiation power of the generator: from -30 dBm to -10 dBm at the frequency of 1220 MHz.
The investigation of the human respiratory system using microwaves can be carried out in various ways [3,4,5,6,7,8,9,10,11,12,13].
In [3], the authors described a designed system for obtaining an image of the chest at human respiration monitoring. An array of 16 compact symmetrical dipole antennas with a low profile was installed in a belt fixed around the chest. During the measurement, one of the 16 antennas successively transmits the signal, and the rest receive it. During respiratory monitoring, S-parameters are measured. The Jacobian Weighted One-step Supervised Descent Method (SDM) is used to reconstruct synthesized and measured data. As a result of tomography, the distribution of the dielectric properties of the chest is reconstructed. The measurements were carried out at frequencies of 433MHz and 915 MHz.
In [4], the authors proposed electromagnetic tomography based on microwave monitoring of lung parameters (depth profiles of relative air and blood content) in the near zone by measuring variations in the shape of a scattered pulse for pulmonary and cardiovascular activity. The proposed tomography is based on solving the inverse scattering problem and allows to obtain a quantitative distribution of the physical parameters of the lungs. Experimental results showed that the variations in the profile of the air content associated with breathing turned out to be quite small and could only be detected by the experimental device in some places of the chest.
In [5], a device for diagnosing diseases of the bronchopulmonary system was proposed. The disadvantage of this system is that in order to examine the patient, it is necessary to tightly press the receiving antenna applicators to the body and manually move the transmitting antenna of the applicator along the patient's chest, which makes it difficult to obtain stable results.
In [6], the authors described a method for diagnosing and monitoring pathological cardiopulmonary conditions, such as pulmonary edema by microwave penetrating radiation. Pulmonary edema causes changes in the electromagnetic characteristics in the lung tissues, which in turn causes changes in reflected and penetrating radiation. The experiments were carried out using the applicator antenna. The disadvantage is the inability to study the entire volume of the lungs in dynamics.
In the review [7], the authors showed that measuring a penetrating electromagnetic wave provides more information than measuring a reflected wave. The scan was performed at a frequency of 915 MHz. In [8], the authors also compared reflection and transmission methods for use in detecting pathological changes in the lungs. The authors argue that the method based on a transmitting wave has the advantage that absorption does not depend on the path of propagation of the signal. It is noted in [9] that an electromagnetic signal with a wavelength shorter than 3 cm does not penetrate far into tissues, and it is recommended to use frequencies below 10 GHz.
In [10], author constructed power values projection image of microwave signal that passed through the human chest at the frequency of 2 GHz, moving one pair of antennas of the transmitter and receiver. Author notes that diffraction and interference effects make it difficult to reconstruct the internal structure of the human body.
Works [11,12,13] are devoted to the use of radar to monitor human breathing using information about the movement of the chest. Radar data, based on chest movement does not allow visualization of the internal structure of the lungs and has a different purpose.
COVID-19 pandemic stimulated the development of new methods for obtaining information about the functioning of the human bronchopulmonary system. One of these methods was microwave chest scanning [1], based on the fact that human tissues have a dielectric permittivity significantly greater than the dielectric permittivity of air. This made it possible to obtain dependences on the experimental device of changes in the levels of microwave radiation passing through various parts of the chest during respiration, called pulmonograms. However, the interpretation of the obtained pulmonograms presented certain difficulties, which led to the need to look for ways to simplify the interpretation of the results obtained by microwave sensing.
The purpose of this article is to solve the problem of converting pulmonograms into dynamically changing images of the filling process of various parts of the human lungs with air. To achieve this goal, the following tasks were set:
1) carrying out a series of experiments on the microwave scanning device and obtain the results – pulmonograms;
2) preprocessing of pulmonograms to increase their informativeness by noncoherent integration of data over several breathing cycles;
3) development of an algorithm for converting pulmonograms into dynamically changing images;
4) software implementation of the algorithm and visualization of the results.
2. Materials and Methods
Model for Medium and the Choice of Scanning Approach
There are two main electromagnetic methods for investigating the medium: obtaining information from a backscattered wave or from an attenuated “transmitted through” wave. For the elongated spheroidal lung model, it was found that the backscattered microwave energy at the frequency of 2450 MHz is less than one tenth of the “transmitted through” component, and the backscattered microwave energy at a frequency of 915 MHz is of the same order of magnitude as the “transmitted through” component [14]. Frequency of the generator in the experiments was 1220 MHz. The choice of frequency based on the results obtained in [15,16], which showed the frequency dependence of the attenuation of microwave radiation that passed through the lungs of healthy and asthmatic people during respiration.
An electrical circuit consisting of three capacitors connected in series can serve as a model of the medium for an electromagnetic signal propagating through the human chest. Figure 1 shows a graphical representation of the medium model. The first capacitor simulates biological human tissues of the anterior part of the chest, in which the dielectric permittivity of the medium and the volume of these tissues do not change during respiration. The second capacitor simulates the lungs, which change their volume during respiration (the distance between the capacitor plates) and reduce the average value of the dielectric permittivity during inhalation due to an increase in the proportion of air in the lungs. The third capacitor, similarly to the first one, simulates the dorsal part of the chest. Changing the amount of air in the lungs changes the reactance of the second capacitor, leaving virtually unchanged the resistance of the first and third capacitors, which changes the total impedance of the circuit of three capacitors. In pulmonograms, air increasing in the lungs at the moment of inhalation is accompanied by a decrease in the level of microwave signal passing through the chest compared to the signal level at the moment of total exhalation, when the amount of air in the lungs is small.
Capacitance of parallel plate capacitor is defined as:
where – dielectric permittivity, – permittivity of free space (constant), – relative dielectric permittivity (dimensionless), – area of each plate, – distance between plates.
Relative dielectric permittivity of the air is approximately equal to 1. Relative dielectric permittivity of the lungs for the scanning frequency of 915 MHz at air filled condition is 21.9722, in the absence of air is 51.3728 [17].
During inhalation, increasing of air in lungs decrease the dielectric permittivity and increase the distance between the plates of the second capacitor (lungs), thereby decrease the total capacitance of the medium and increase the total impedance of the medium:
During exhalation, the lungs, releasing air, increase the dielectric permittivity and decrease the distance between the plates of the second capacitor (lungs), thereby decrease the total impedance of the medium.
So, during inhalation the impedance of the medium increases, which leads to a decrease in the signal level on the pulmonogram, during exhalation the impedance of the medium decreases, which leads to an increase in the signal level on the pulmonogram.
The chosen model is consistent with the data obtained in [17]: for the scanning frequency of 915 MHz lung conductivity at air filled condition and in the absence of air .
Device Block Diagram and the Principle of Its Operation
Figure 2 shows a block diagram of the device. The device consists of a “processing unit – PC”, an “interface unit – Hub” connected to a “microwave generator USB-TG44A” and a “Controller” that controls the operation of “Commutator-1”, “Commutator-2”, as well as “LED sync indicator-1” and “LED sync indicator-2”. Signals from “microwave generator USB-TG44A” are fed to the input of “Commutator-1”, which is connected to an array of transmitting antennas “Tx antenna matrix”. An array of receiving antennas “Rx antenna matrix” is connected to “Commutator-2”, the signals from which are fed to a “receiver USB-SA44B” and through the “interface unit - Hub” go to the “processing unit – PC” for processing.
The developed device for the investigation of bronchopulmonary system, in particular the human respiration by microwave scanning uses safe scanning frequency and radiation power. Technical characteristics of the “microwave generator USB-TG44A” and the “receiver USB-SA44B” are shown in Table 1.
Figure 3 shows the dimensions of the array of transmitting antennas “Tx antenna matrix” and the array of receiving antennas “Rx antenna matrix” before the beginning of a series of experiments. Distance between the racks correspond to the far-field propagation zone of the electromagnetic wave for the frequency of 1220 MHz.
The process of examining a patient with the microwave device to investigate bronchopulmonary system, in particular the breathing, is shown in Figure 4 and proceeds as follows.
The examined patient stands between racks of the array of transmitting antennas “Tx antenna matrix” and the array of receiving antennas “Rx antenna matrix”, while the matrices are installed at the level of the patient's lungs, and the LED synchronization indicators are within sight of the patient. By the operator's command on “processing unit – PC” communication with the “Controller”, the “microwave generator USB-TG44A” and the “receiver USB-SA44B” is initialized via the “interface unit - Hub”. After initialization of communication, control commands are sent to the “Controller”, to the “microwave generator USB-TG44A”, setting the signal power, its frequency and the sensitivity level of the “receiver USB-SA44B”. According to the signals of the “Controller”, the first and second LED synchronization indicators are turned on, in accordance with the breathing rate set by the operator and the number of breathing cycles for the procedure of obtaining pulmonograms. Guided by the LED light signals, the patient inhales and exhales. By the commands of the “Controller”, the antennas are simultaneously switched in the matrix of transmitting antennas by means of the “Commutator-1” and in the matrix of receiving antennas by means of the “Commutator-2” in order to measure different sections of the bronchopulmonary system (lung).
The signals passed through the lungs of the examined patient, through the matrix of receiving antennas and “Commutator-2”, enter the “receiver USB-SA44B”, then through the “interface unit – Hub” go into the “processing unit – PC”, in which signals, received in different breathing cycles accumulate (noncoherent integration).
Accumulated (noncoherent integration) and averaged measurement results are converted into graphs of the patient's breathing process, which represents pulmonograms.
Carrying Out Experiments
The device allows to carry out measurements of the bronchopulmonary system of a person at calm breathing or at different rates and depths of breathing. Level and form variations of pulmonograms can provide different information about pathological changes in the lungs, about the types of respiratory disorders to identify the corresponding diseases. Coverage of the entire lung volume allows to explore the features of the work of various parts of the lungs.
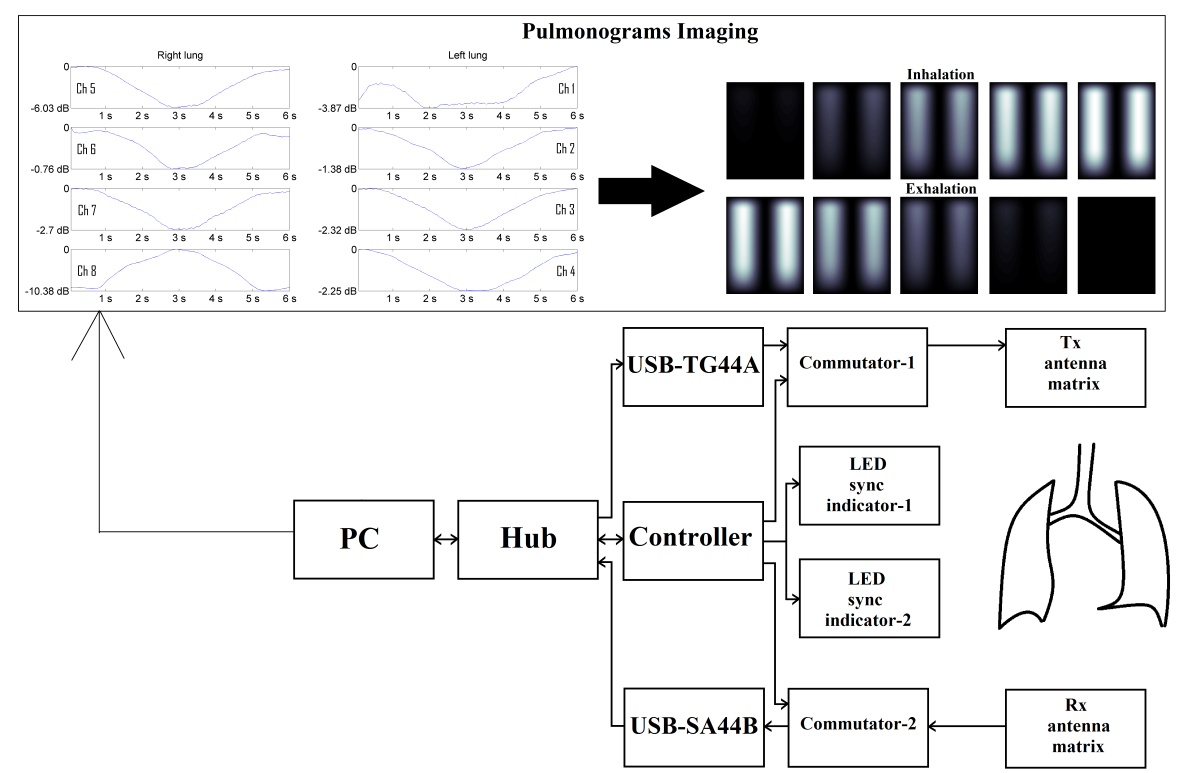
Experiments were carried out on men and women. A series of experiments for the purpose of imaging of pulmonograms was carried out at calm breathing of patients. Figure 5 shows the pulmonograms of a man, and Figure 6 shows the pulmonograms of a woman. All pulmonograms are displayed at the same scale. Number of breathing cycles is shown along the abscissa axis. Along the ordinate axis, values are given in microvolts of the received microwave signal level. The channels of the matrix of transmitting and receiving antennas from 1 to 4 cover the left part of the lung. The channels of the matrix of transmitting and receiving antennas from 5 to 8 cover the right side of the lung. The upper antennas were installed on height at the level of the clavicles.
Increasing the Informativeness of Pulmonograms
A significant limitation for the implementation of the method based on measuring the level of the signal transmitted through the human lungs is that the signal experiences numerous reflections inside and around the person. Minor changes in human position during measurement also affect the level of recorded signals. Multipath propagation of the signal distorts the signal-to-noise ratio and thereby reduces the reliability, stability and informativeness of pulmonograms.
To solve this problem, a method of accumulating of measurement results (noncoherent integration) is proposed to increase the signal-to-noise ratio and increase the reliability, stability and informativeness of measurement results [18]. Noncoherent integration improves the signal-to-noise ratio. Signals with an amplitude equal to 1 after - fold summation will have an amplitude of: . Noise with a standard deviation equal to 1 before accumulation after - fold summation will have a standard deviation of: . Thus, the expected improvement in the signal-to-noise ratio of voltage:
To implement the method of accumulation of measurement results (noncoherent integration), it is necessary to add up the measurement results of the same duration corresponding to one complete breathing cycle. The beginning of inhalation and the end of exhalation of individual measurement results on the pulmonogram do not always coincide in duration. A person cannot exactly repeat the duration of the breathing cycle on his own. To overcome this difficulty, a method of light synchronization of human breathing cycles has been proposed. Two LEDs have been added to the device for each rack. When the LED lights up, it signals to the person about the time of the beginning of inhalation, and turning off the light signals to the person about the time of exhalation. Setting the time for turning on and off of the LED corresponds to the duration of a full human breathing cycle. The software allows to change the duration of cycles for the convenience of the patient.
Figure 7 and Figure 8 show the average pulmonograms of a man and a woman after noncoherent integration.
Accumulated and averaged pulmonograms are represented in single scale, which allows to see the level of attenuation in different parts of the lungs and compare them. This article presents the results of the accumulation (noncoherent integration) of 16 breathing cycles. In [19], it was mathematically proved that the necessary and sufficient number of breathing cycles for noncoherent integration is 8.
A less distinct change in the signal level on pulmonograms on the second row from above on the woman’s, compared with the man’s, is obviously due to the relatively large size of the mammary glands, which should lead to a decrease in the capacity of the first capacitor in the model (Figure 1). The lower graphs of woman’s pulmonograms are also less informative, since the dimensions of the antenna array in the experiments were unchanged, and the lung size in women is smaller than in men.
Imaging of Pulmonograms
Increasing the visibility of pulmonograms facilitates the interpretability of measurement results. The representation of signal levels in microvolts is uninformative. It is more natural to represent information in relative logarithmic units. Figure 9 shows the result of presenting a man's pulmonogram, and Figure 10 shows a woman's pulmonogram in decibels. The maximum signal received by each antenna after the process of noncoherent integration was selected as a reference signal for conversion to decibels in each of the pulmonograms.
Pulmonograms converted into logarithmic units are the initial data for visualizing them as a color two-dimensional dynamically changing image.
The device for measuring bronchopulmonary system, in particular the human respiration, due to the use of electronic switched antennas in the matrix, allows to cover the entire volume of the lungs simultaneously and measure the dynamics of air filling over time. To solve this problem, a conversion algorithm was developed, which was implemented in the Matlab language.
The algorithm for converting spatially distributed pulmonograms into two-dimensional color dynamically changing images is performed in several stages. The size of the matrix for visualization was chosen pixels, which should approximately correspond to the proportions of the human chest. Since the measurements were carried out only at 8 points of the matrix, the missing elements between the 8 measurement results and data from the a priori geometric model (boundary conditions) of the lungs were interpolated. Figure 11 schematically shows the lungs, the location of the emitter matrix and their numbering, as well as the size of the image matrix with pixel numbering. Since, according to the a priori lung model, changes in the level of the signal associated with breathing should not occur outside and between the lungs, the edge elements of the image matrix and the elements of column 577 are assigned zero values.
The spatial measurement points correspond to the following elements in the image matrix: Ch1 (193, 897); Ch2 (449, 897); Ch3 (705, 897); Ch4 (961, 897); Ch5 (193, 257); Ch6 (449, 257); Ch7 (705, 257), Ch8 (961, 257).
At the first stage of imaging, 8 pulmonograms obtained over 16 breathing cycles were preprocessed. Noncoherent integration of signals over 16 breathing cycles was performed. Since, at measuring pulmonograms, the time of the beginning of inhalation and exhalation was carried out according to light signals generated by the program, the number of measurement samples in each breathing cycle is the same. To implement noncoherent integration, the pulmonogram data array was divided into 16 identical fragments, which were averaged among themselves. At the end of the first stage, 8 pulmonograms are obtained, corresponding to 8 measuring channels (Ch1...Ch8), with 1 breathing cycle in each.
At the second stage, the normalization of pulmonograms to the maximum signal level and the logarithm of the obtained results is performed. In Matlab operators, the operations performed are written as:
Ch1max=max(Ch1);
…
Ch8max=max(Ch8);
for i=1:1:n
…
At the third stage, spatial interpolation was performed. For this, the Piecewise Cubic Hermite Interpolating Polynomial (PCHIP) method was used. To perform interpolation, normalized signal values were entered into the image matrix for each breath cycle, at points with coordinates Ch1...Ch8. Interpolation fills in the missing values in columns 257 and 897. Then, the missing elements of the matrix were filled successively in all rows. For a sampling rate of 15 samples per second and a breathing cycle time of 6 seconds, 90 two-dimensional images were generated for one breathing cycle.
At the fourth stage, the obtained two-dimensional arrays were transformed into one three-dimensional array, each layer of which (the third coordinate) corresponds to one sample of measurements.
At the fifth stage, the display intensity scale was adjusted. To do this, the maximum signal (by level) was searched in the resulting three-dimensional array and the maximum signal on the brightness scale was equated to this value. Later, at displaying of each slide corresponding to the sample time of breathing, the pixels of the slide were assigned with value corresponding to the brightness scale.
At the final stage, the slides were displayed successively at a given pace of viewing (according to sampling frequency), with the possibility of cyclical repetition of the slides. The color scheme of the display can be changed for the convenience of the doctor.
3. Results
To demonstrate the implementation of the algorithm, Figure 12 and Figure 13 show the result of converting the spatial matrix of pulmonograms into dynamically changing two-dimensional color images. A gradation of one color was taken as a demonstration example. By choosing more colors to display, a comparative analysis of the filling of different sections of the lungs can be carried out. For the convenience of presenting the material, out of 90 sample slides of pulmonograms, only 10 are shown, obtained at regular intervals. The first 5 pulmonograms correspond to inhalation, and pulmonograms from 6 to 10 correspond to exhalation.
Figure 12 shows the imaging result for a man. Intensity of the color allows to evaluate and compare the degree of filling of the lungs with air in different areas during breathing.
Figure 13 shows the imaging result for a woman.
Analysis of Figure 12 and Figure 13 allows to clearly demonstrate that the air occupancy of the left and right lungs is uneven in both men and women. At the same time, it can be seen that the woman who took part in the examination has a noticeable distinct thoracic breathing pattern, while the man's lower lung is also filled, which indicates an abdominal type of breathing. At the same time, if a man's lungs are filled with air by the middle of the inhalation period, and the removal of air by the middle of the exhalation period (uniform breathing), then a woman clearly has a faster rate of filling with air during inhalation and the same abrupt removal of air.
Obtained results cannot be generalized to all men and women, but they show the possibility of visualizing the process of filling the lungs with air even with a small number of measurement points.
4. Discussion
The use of various imaging techniques in medical research largely depends on the goals of these investigations. If a diagnosis is required for the patient, then the detail of the visualized representations of the state of the organs should be as high as possible. When the question is about the preliminary diagnosis, typical for preventive examinations, in order to identify early signs of the appearance of diseases, image detail is less important compared to the simplicity and cheapness of the examination procedure.
Widespread use of software-defined radio receivers and transmitting devices makes it possible to create inexpensive devices for preventive examination. The problem of using such devices in practical medicine is the difficulty of doctors interpreting of a large amount of data obtained as a result of the examination. Conversion of tabular data or graphs into two-dimensional images makes it possible to simplify the procedure for interpreting the data obtained by general diagnostic doctors who do not have special technical education, but who have knowledge of the principles of the human respiratory system.
The proposed imaging method, according to its principle, approximates the result obtained during the examination to an X-ray image, by the difference that contrast agent here is the air filling the lungs. Unlike the X-ray imaging method, which uses a single radiation source and a spatially distributed radiation receiver (X-ray film), the method uses eight emitters and 8 radiation receivers. It would be possible to use one emitter and 8 receivers, while obtaining similar imaging results, but the device was designed so that, in the future, it would be possible to obtain pulmonograms between each emitter with each of the receivers. The existing device is potentially capable of obtaining not 8, but 64 pulmonograms, the combination of which will allow to detail the resulting image of lung air occupancy.
Obviously, the use of antennas that could be attached to the human body at standard points will eliminate or significantly reduce the distortion of the results caused by the influence of human body vibrations during the examination. It will also make it possible to physiologically more accurately compare obtained results with the real geometry of the chest of the examined person.
5. Conclusions
Method of converting pulmonograms obtained by microwave scanning into color dynamically changing images has been proposed in the article. Despite the small number of measurement points, after imaging of pulmonograms by the proposed algorithm, it is possible to effectively observe the filling of various parts of the lungs with air during breathing.
Obtained preliminary results made it possible to interest practicing pulmonologists and scientists. Currently, permission has been obtained to carry out preclinical tests using the proposed device. Further tests will be carried out on the basis of the Pulmonology Department of the Kazakh National Medical University named after S.D. Asfendiyarov.
Author Contributions
Conceptualization, I.V. and Zh.M.; methodology, I.V. and Zh.M.; software, Zh.M.; validation, I.V.; formal analysis, I.V.; investigation, I.V. and Zh.M.; resources, Zh.M.; data curation, Zh.M.; writing—original draft preparation, Zh.M.; writing—review and editing, I.V.; visualization, Zh.M.; supervision, Zh.M.; project administration, Zh.M.; funding acquisition, Zh.M. All authors have read and agreed to the published version of the manuscript.
Funding
This research is funded by the Science Committee of the Ministry of Science and Higher Education of the Republic of Kazakhstan (Grant No. AP23488582)
Informed Consent Statement
Human respiration pulmonograms were represented as “men’s and women’s” without personalizing and the only person represented on the Figure 4. is the correspondence author of this article who agree to publish his photo.
Data Availability Statement
The Matlab code which implements the imaging of pulmonograms is available on request from the corresponding author [21].
Conflicts of Interest
The authors declare no conflicts of interest.
References
- Vassilyev, I.V.; Nikitin, V.V.; Mendakulov, Zh.K.; Troitskaya, N.I. ; (2021); A microwave system for diagnosing diseases of the bronchopulmonary system; KZ Patent No.: 35720; IPC A61B 5/08, A61B 5/0205, G01N 22/00; Assignee SDTB «Granit» (KZ) No. 2021/0348.1; Filed on Jun. 2, 2021; Patented on Jun. 24, 2022. [Google Scholar]
- Vassilyev, I.V.; Mendakulov, Zh.K.; Adamov, T.N.; Berdimuratova, L.B.; Nikitin, V.V.; Abdullayev, T.K.; Troitskaya, N.I. ; (2023); A microwave system for monitoring of the bronchopulmonary system functioning; KZ Patent No.: 36832; IPC A61B 5/0205, A61B 5/08, G01N 22/00; Assignee SDTB «Granit» (KZ) No. 2023/0374.1; Filed on May 31, 2023; Patented on Jul. 5, 2024. [Google Scholar]
- Zhang, H.; et al. , "Study on Microwave Thorax Imaging for Human Respiration Monitoring," in IEEE Journal of Electromagnetics, RF and Microwaves in Medicine and Biology, vol. 8, no. 2, pp. 190-197, June 2024. [CrossRef]
- Gaikovich, K.P.; Maksimovitch, Y.S.; Badeev, V.A.; Bockeria, L.A.; Djitava, T.G.; Kakuchaya, T.T.; Kuular, A.M. Microwave Near-Field Dynamical Tomography of Thorax at Pulmonary and Cardiovascular Activity. Diagnostics 2023, 13, 1051. [Google Scholar] [CrossRef] [PubMed]
- Lebedenko, A.A.; Semernik, O.E.; Demyanenko, A.V.; Semernik, I.V.; Topalov, F.S. ; (2016); Device for bronchopulmonary system diseases diagnosis; RU Patent No.: 2631629C2; IPC A61B 5/08, G01N 22/00; Assignee Lebedenko, A.A.; Semernik, O.E.; Demyanenko, A.V.; Semernik, I.V. (RU) No. 2016105140; Filed on Feb 16, 2016; Patented on Sep. 25, 2017; Appl. No. 27.
- Pedersen, P.C.; Johnson, C.C.; Durney, C.H.; Bragg, D.G. An Investigation of the Use of Microwave Radiation for Pulmonary Diagnostics. in IEEE Transactions on Biomedical Engineering, vol. BME-23, no. 5, pp. 410–412, Sept. 1976. [Google Scholar] [CrossRef]
- Iskander, M.F.; Durney, C.H. Electromagnetic techniques for medical diagnosis: A review. In Proceedings of the IEEE, no. 1, vol. 68; pp. 126–132, Jan. 1980. [CrossRef]
- Pedersen, P.C.; Johnson, C.C.; Durney, C.H.; Bragg, D.G. Microwave Reflection and Transmission Measurements for Pulmonary Diagnosis and Monitoring. in IEEE Transactions on Biomedical Engineering, vol. BME-25, no. 1, pp. 40–48, Jan. 1978. [Google Scholar] [CrossRef]
- Susskind, C. Possible use of microwaves in the management of lung disease. In Proceedings of the IEEE, no. 5, vol. 61; pp. 673–674, May 1973. [CrossRef]
- Yamaura, I. , "Mapping of microwave power transmitted through the human thorax," in Proceedings of the IEEE, vol. 67, no. 8; pp. 1170–1171, Aug. 1979. [CrossRef]
- Tanaka, H.; Yokose, M.; Takaki, S.; et al. Evaluation of respiratory rate monitoring using a microwave Doppler sensor mounted on the ceiling of an intensive care unit: a prospective observational study. J Clin Monit Comput, 36, 71–79. 2022. [Google Scholar] [CrossRef]
- Czyżewski, A.; Kostek, B.; Kurowski, A.; et al. Algoritmically improved microwave radar monitors breathing more acurrate than sensorized belt. Sci Rep, 12, 14412. 2022. [Google Scholar] [CrossRef]
- Gleichauf, J.; Herrmann, S.; Hennemann, L.; Krauss, H.; Nitschke, J.; Renner, P.; Niebler, C.; Koelpin, A. Automated Non-Contact Respiratory Rate Monitoring of Neonates Based on Synchronous Evaluation of a 3D Time-of-Flight Camera and a Microwave Interferometric Radar Sensor. Sensors 2021, 21, 2959. [Google Scholar] [CrossRef] [PubMed]
- Lin, J.C. Microwave Propagation in Biological Dielectrics with Application to Cardiopulmonary Interrogation // Medical Applications of Microwave Imaging. 1986. PP. 47-58.
- Semernik, I.V.; Dem’yanenko, A.V.; Semernik, O.E.; Lebedenko, A.A. Non-Invasive Method for Bronchopulmonary Diseases Diagnosis in Patients of All Ages Based on the Microwave Technologies // IEEE Conference of Russian Young Researchers in Electrical and Electronic Engineering. 2017. PP. 78–81. /: https. [CrossRef]
- Semernik, I.V.; Dem’yanenko, A.V.; Topalov, F.S.; Semernik, O.E.; Lebedenko, A.A. Complex System for Monitoring the Patient’s Condition and Diagnosis of Bronchial Asthma // Journal of Biomedical Physics and Engineering. 2020. Vol. 10. № 3. PP. 367–374. /: https. [CrossRef]
- Zhang, H.; Li, M.; Yang, F.; Xu, S. feasibility study of microwave respiration monitoring. 2017 Sixth Asia-Pacific Conference on Antennas and Propagation (APCAP), Xi'an, China, 2017, pp. 1-3. [Google Scholar] [CrossRef]
- Mendakulov, Z.K.; Vassilyev, I.V.; Berdimuratova, L.B.; Aitmagambetov, A.Z. «Increasing the Reliability of Human Respiration Pulmonograms Measured by Radio Wave Method», CEUR Workshop Proceedings, Vol. 3680, 2024. https://ceur-ws.org/Vol-3680/S4Paper10.pdf.
- Vassilyev, I.V.; Mendakulov, Z.K. Increasing the informativeness of pulmonograms. Biomed Eng, 58, 45–49. 2024. [Google Scholar] [CrossRef]
- Albertine, K.H.; Ramirez, M.I.; Morty, R.E. Anatomy and development of the respiratory tract // Murray and Nadel’s Textbook of Respiratory Medicine. Philadelphia, PA, USA. Elsevier. 2022. Chapter 1.
- Certificate of entry of information into the state register of rights to objects protected by copyright № 37128 of the Republic of Kazakhstan. Program for visualizing the results of microwave monitoring of the bronchopulmonary system / Mendakulov, Zh.K.; Vassilyev, I.V. Certificate of entry of information into the state register of rights to objects protected by copyright № 37128 of the Republic of Kazakhstan. Program for visualizing the results of microwave monitoring of the bronchopulmonary system / Mendakulov Zh.K.; Vassilyev, I.V.; reg. 14.06.2023. https://copyright.kazpatent.kz/?!.iD=JjPA.
Figure 1.
Model of the electromagnetic wave propagation medium. Breathing process is accompanied by a change in the dielectric permittivity and the distance of the second capacitor, changing the impedance of the medium.
Figure 1.
Model of the electromagnetic wave propagation medium. Breathing process is accompanied by a change in the dielectric permittivity and the distance of the second capacitor, changing the impedance of the medium.

Figure 2.
Block diagram of the device for microwave investigation of bronchopulmonary system, in particular the human respiration [2].
Figure 2.
Block diagram of the device for microwave investigation of bronchopulmonary system, in particular the human respiration [2].
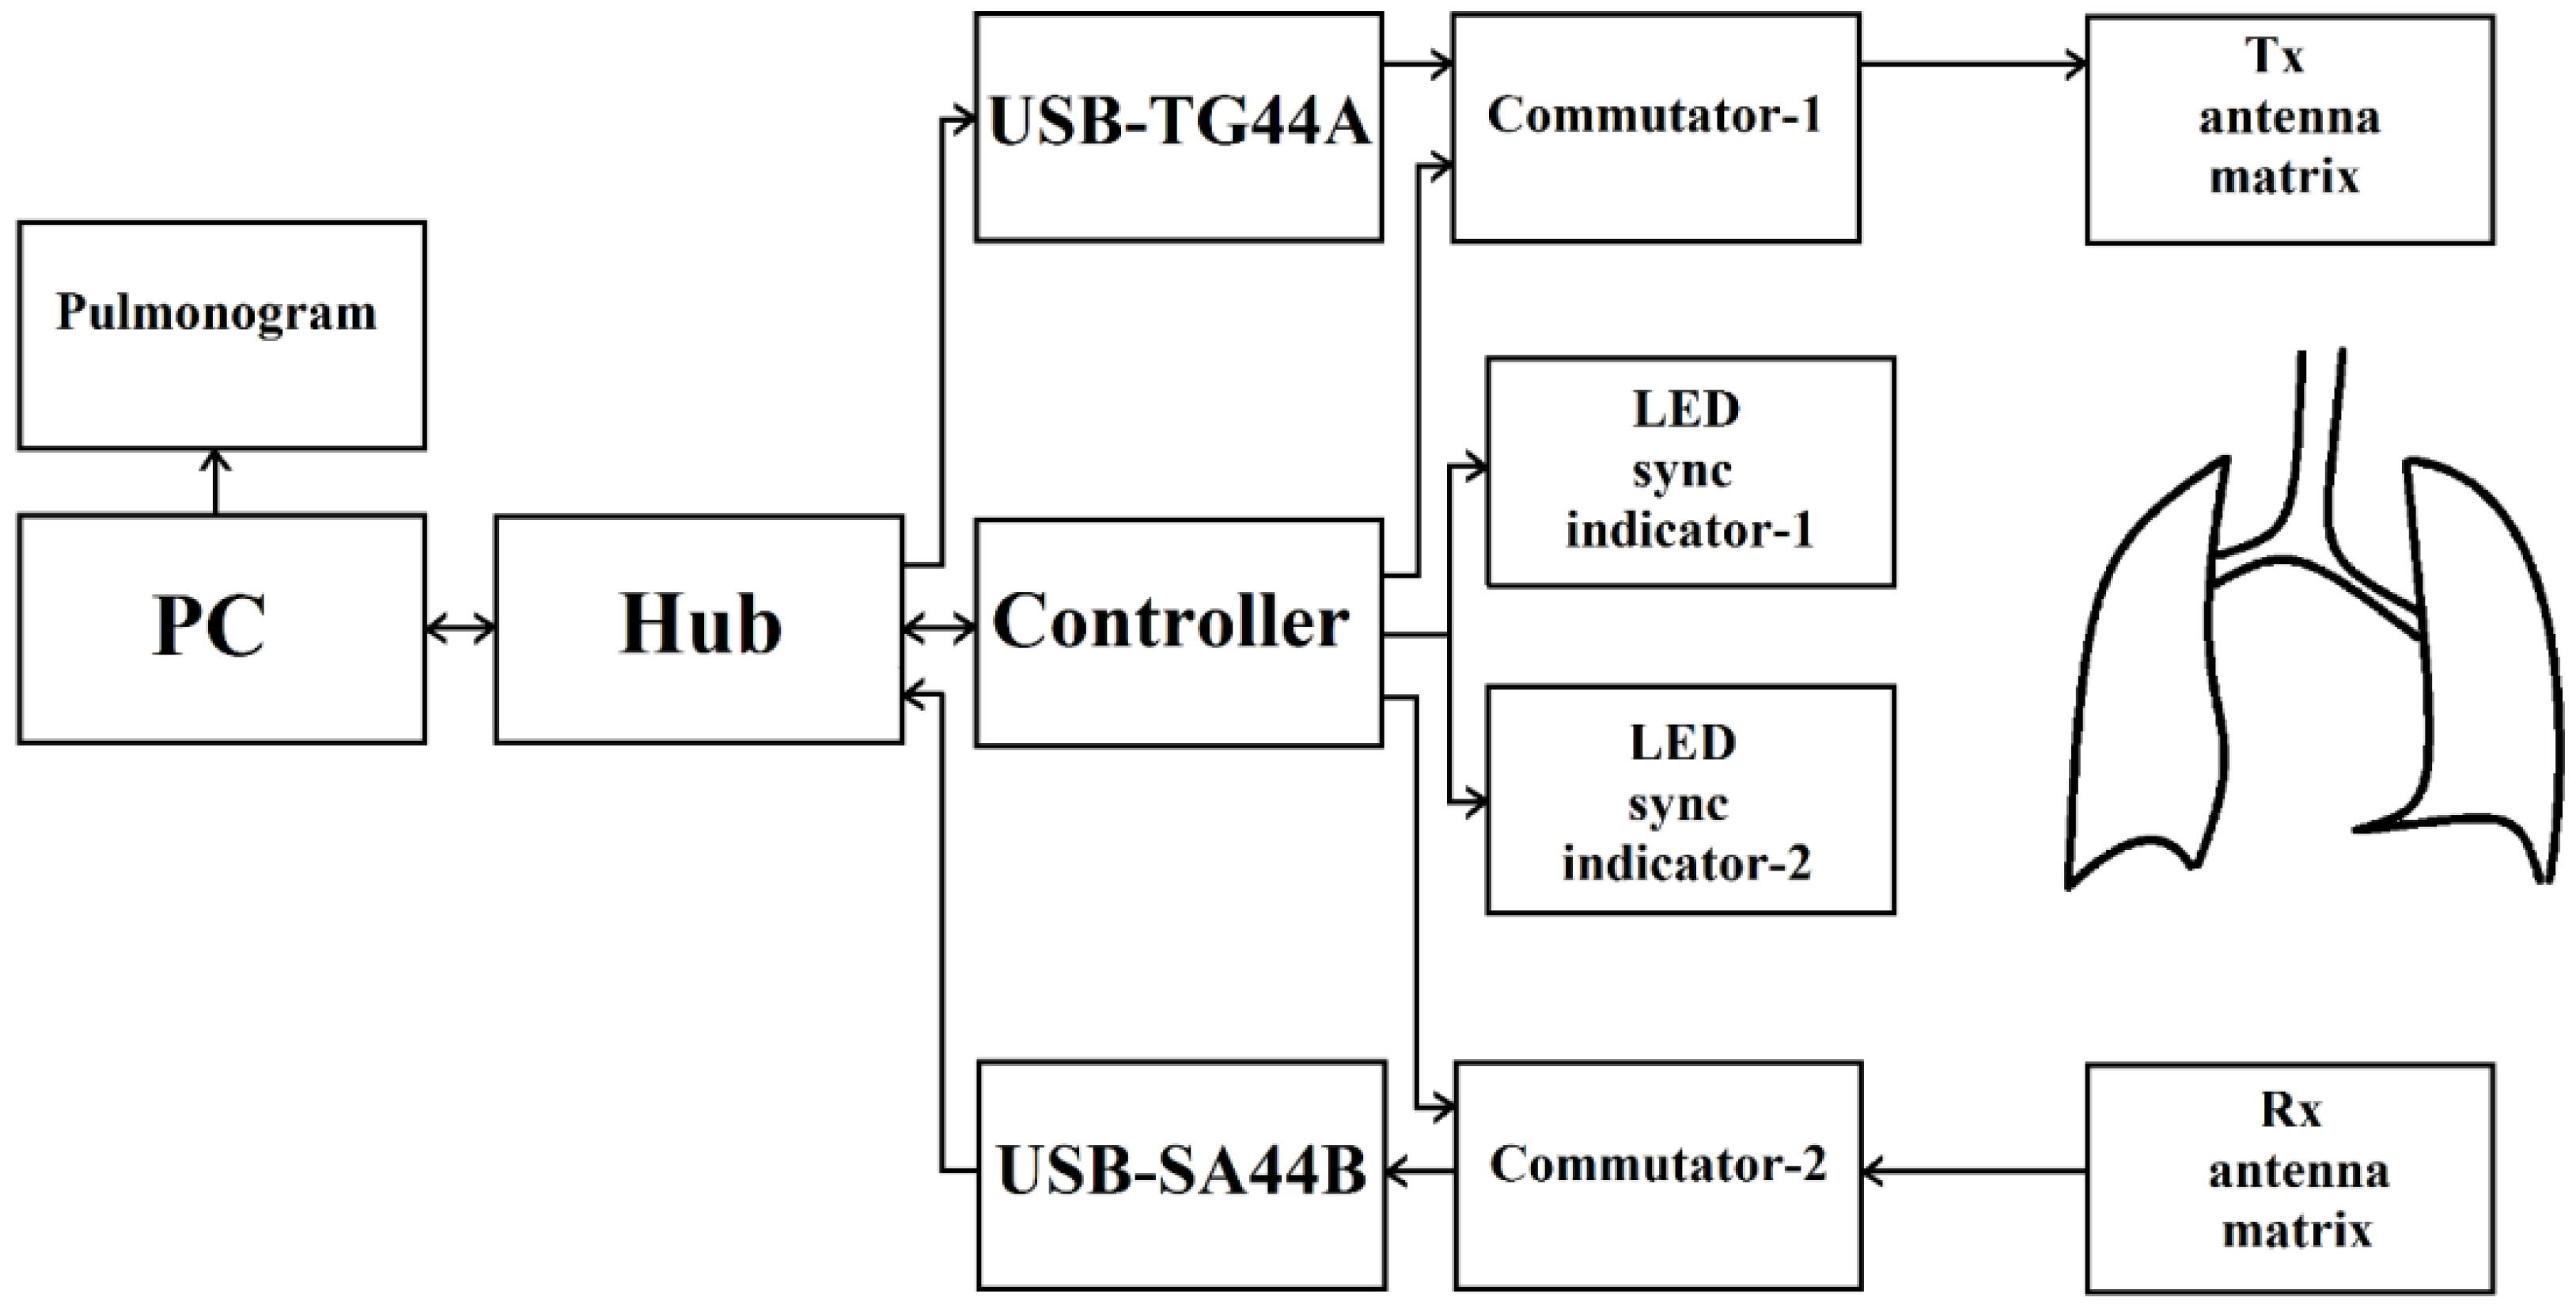
Figure 3.
Dimensions of the array of transmitting antennas “Tx antenna matrix” and the array of receiving antennas “Rx antenna matrix” before the beginning of a series of experiments.
Figure 3.
Dimensions of the array of transmitting antennas “Tx antenna matrix” and the array of receiving antennas “Rx antenna matrix” before the beginning of a series of experiments.
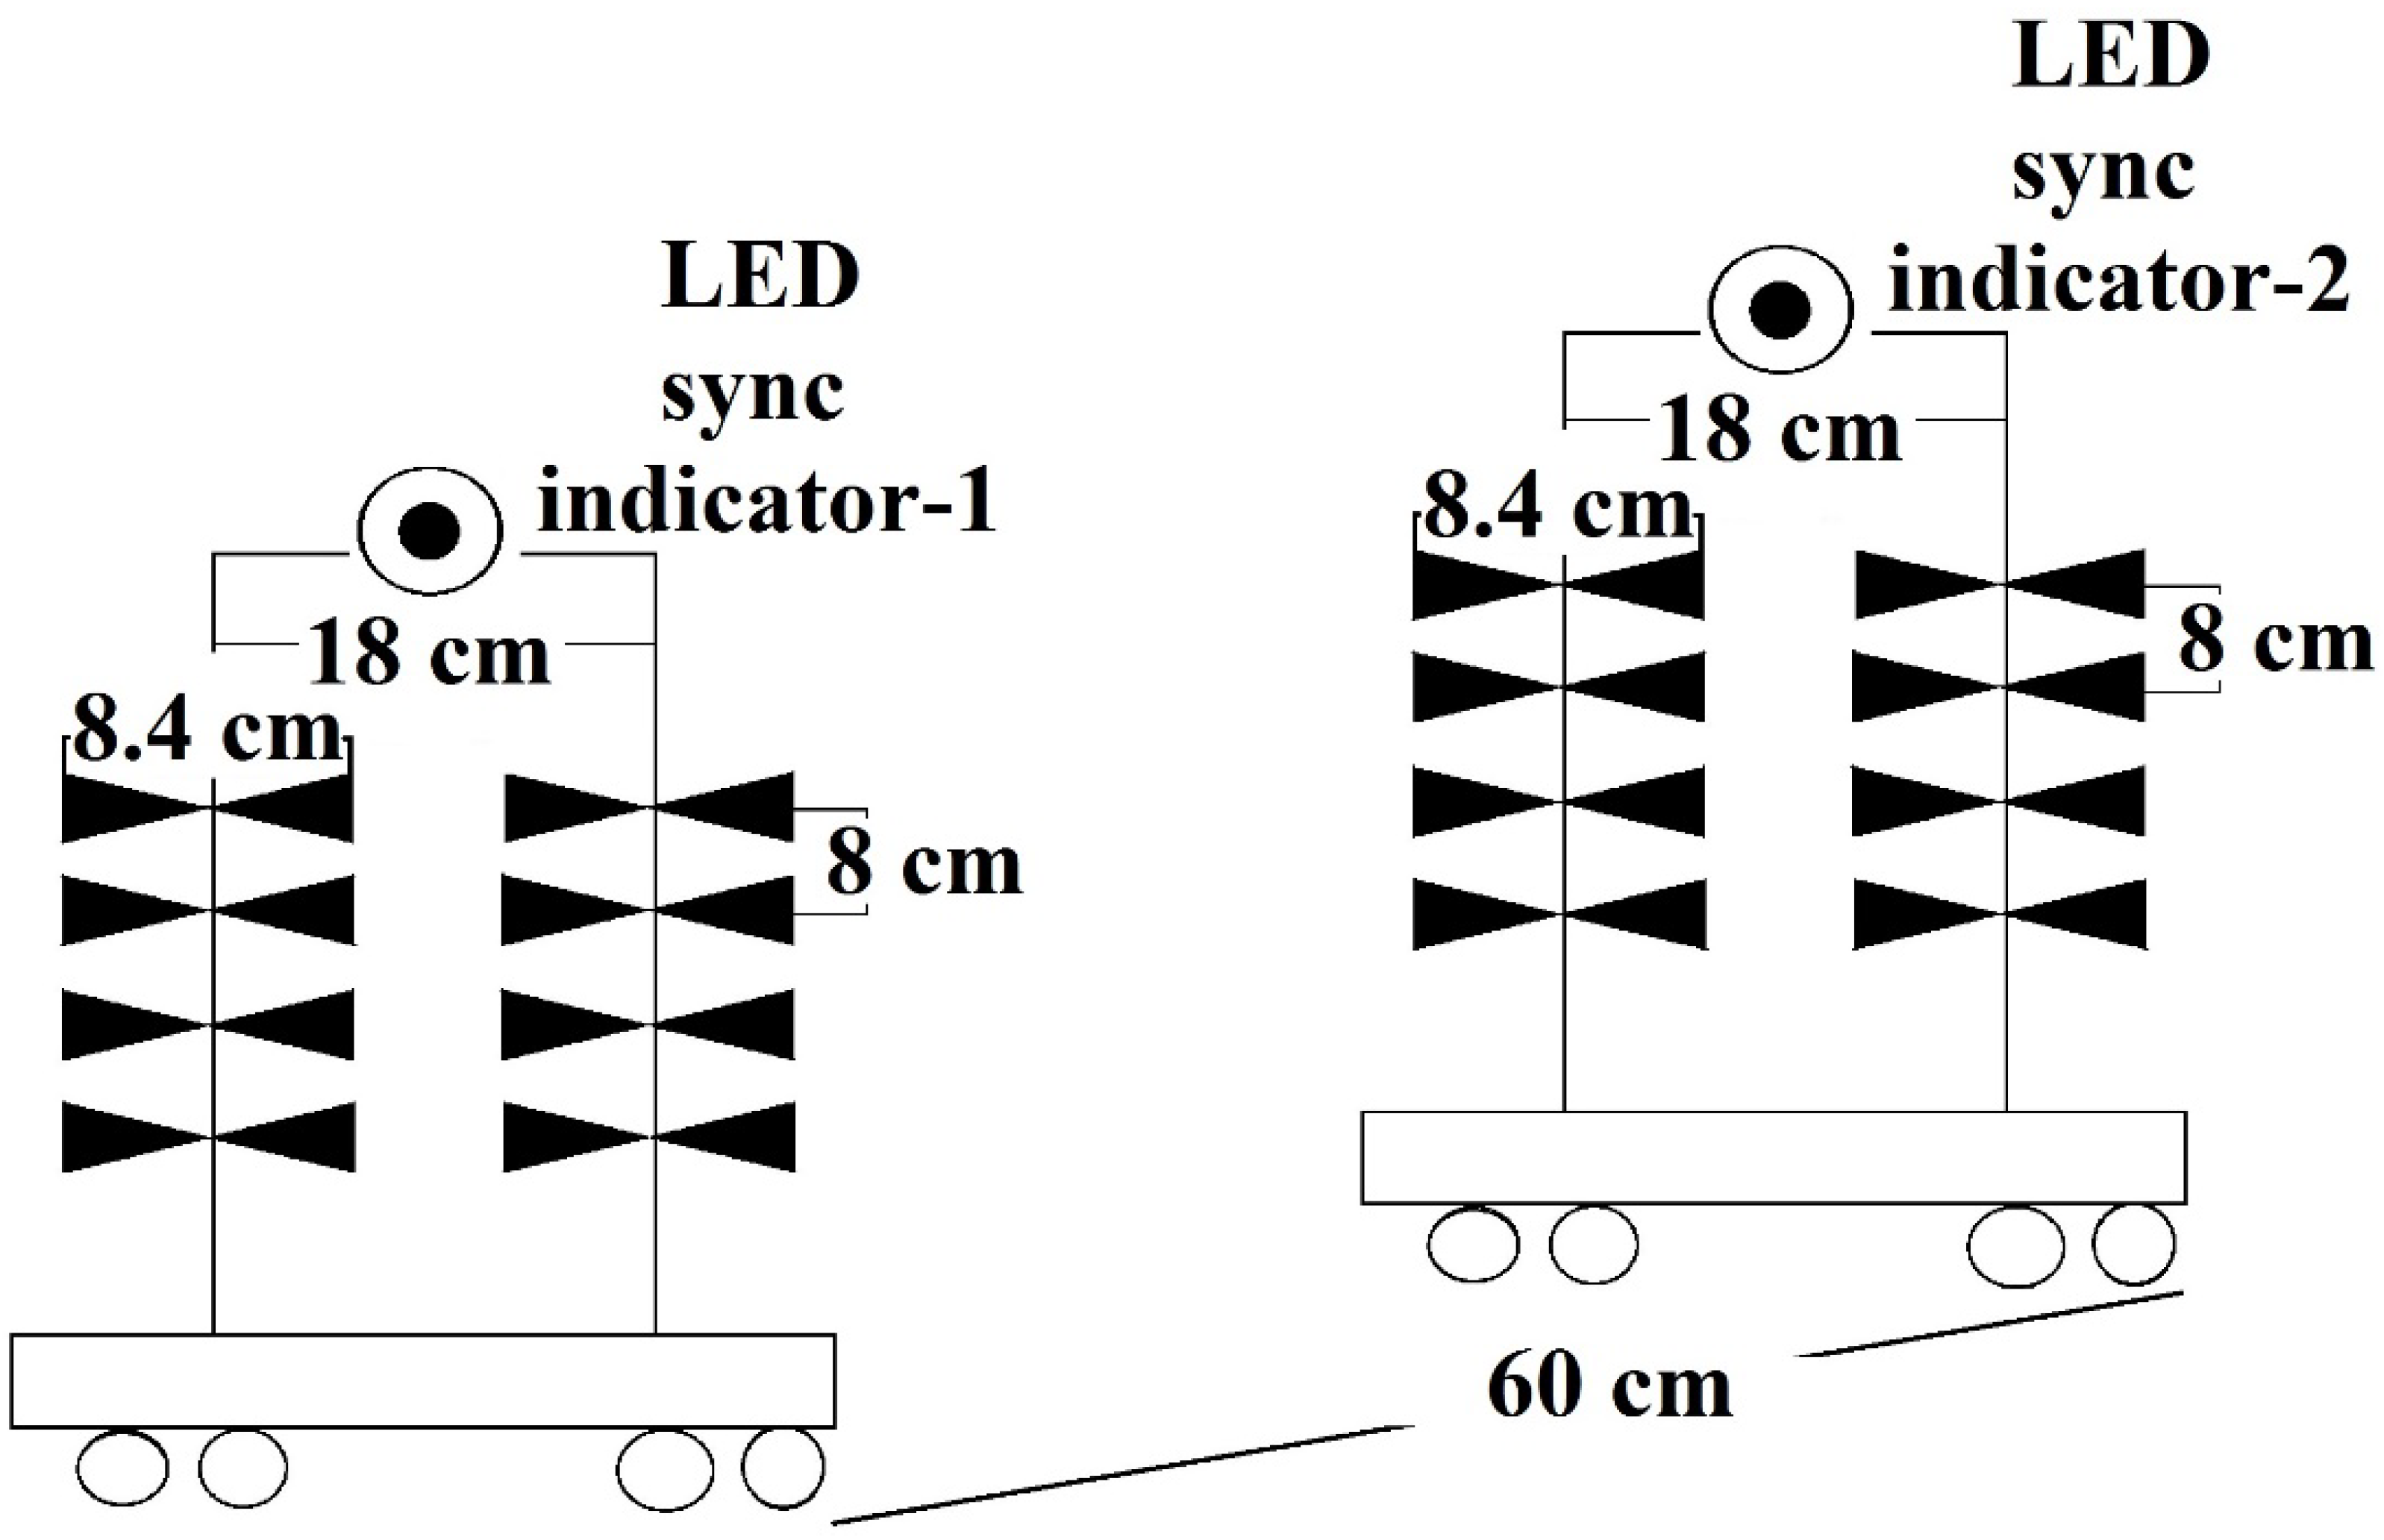
Figure 4.
The patient examination process.
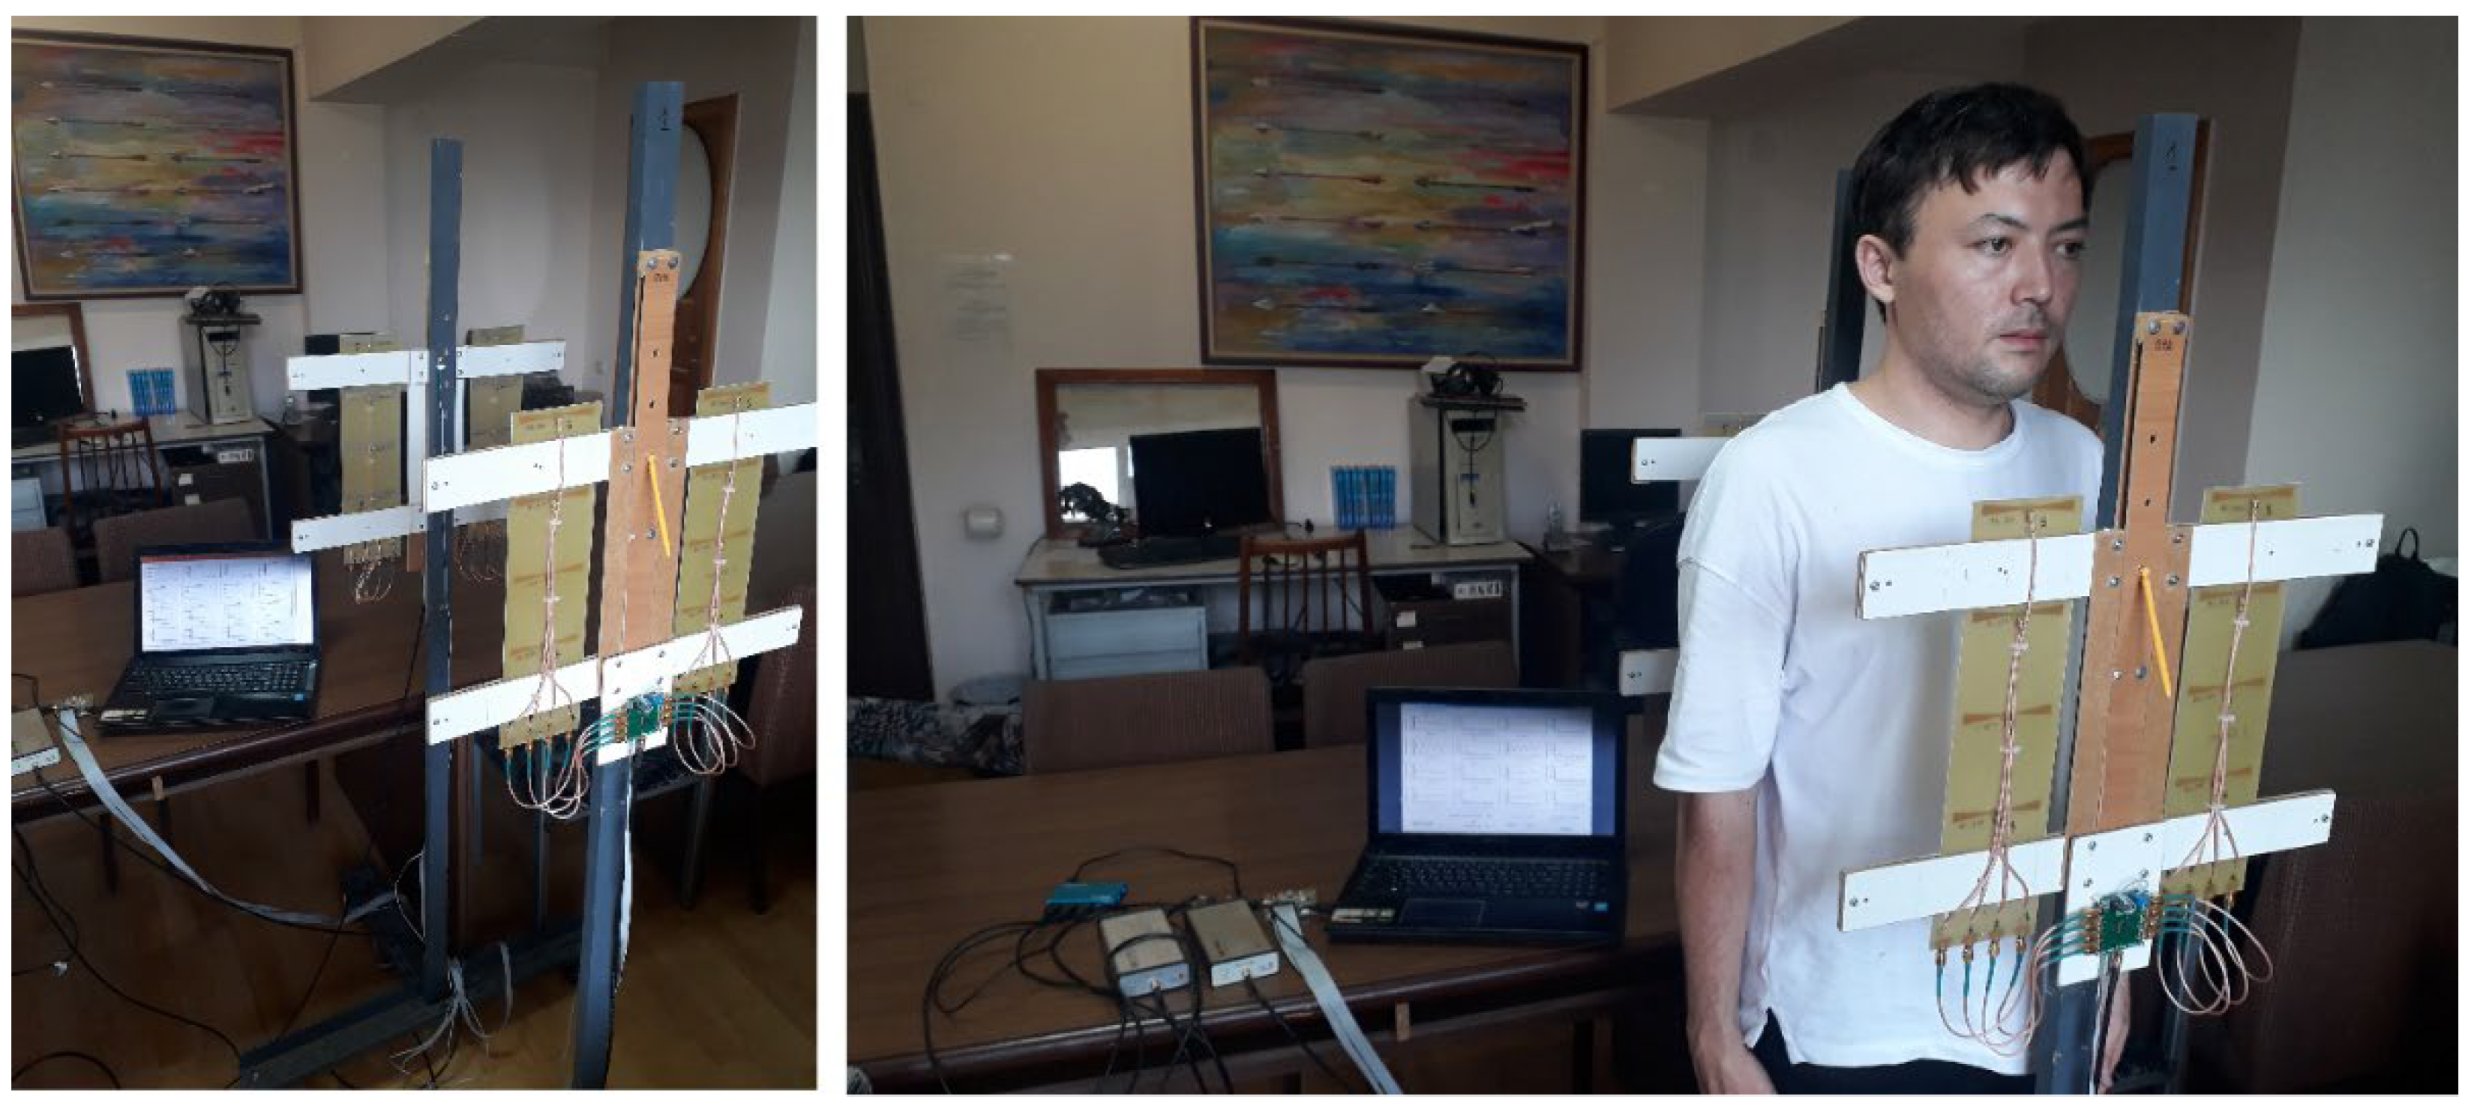
Figure 5.
Pulmonograms of man.
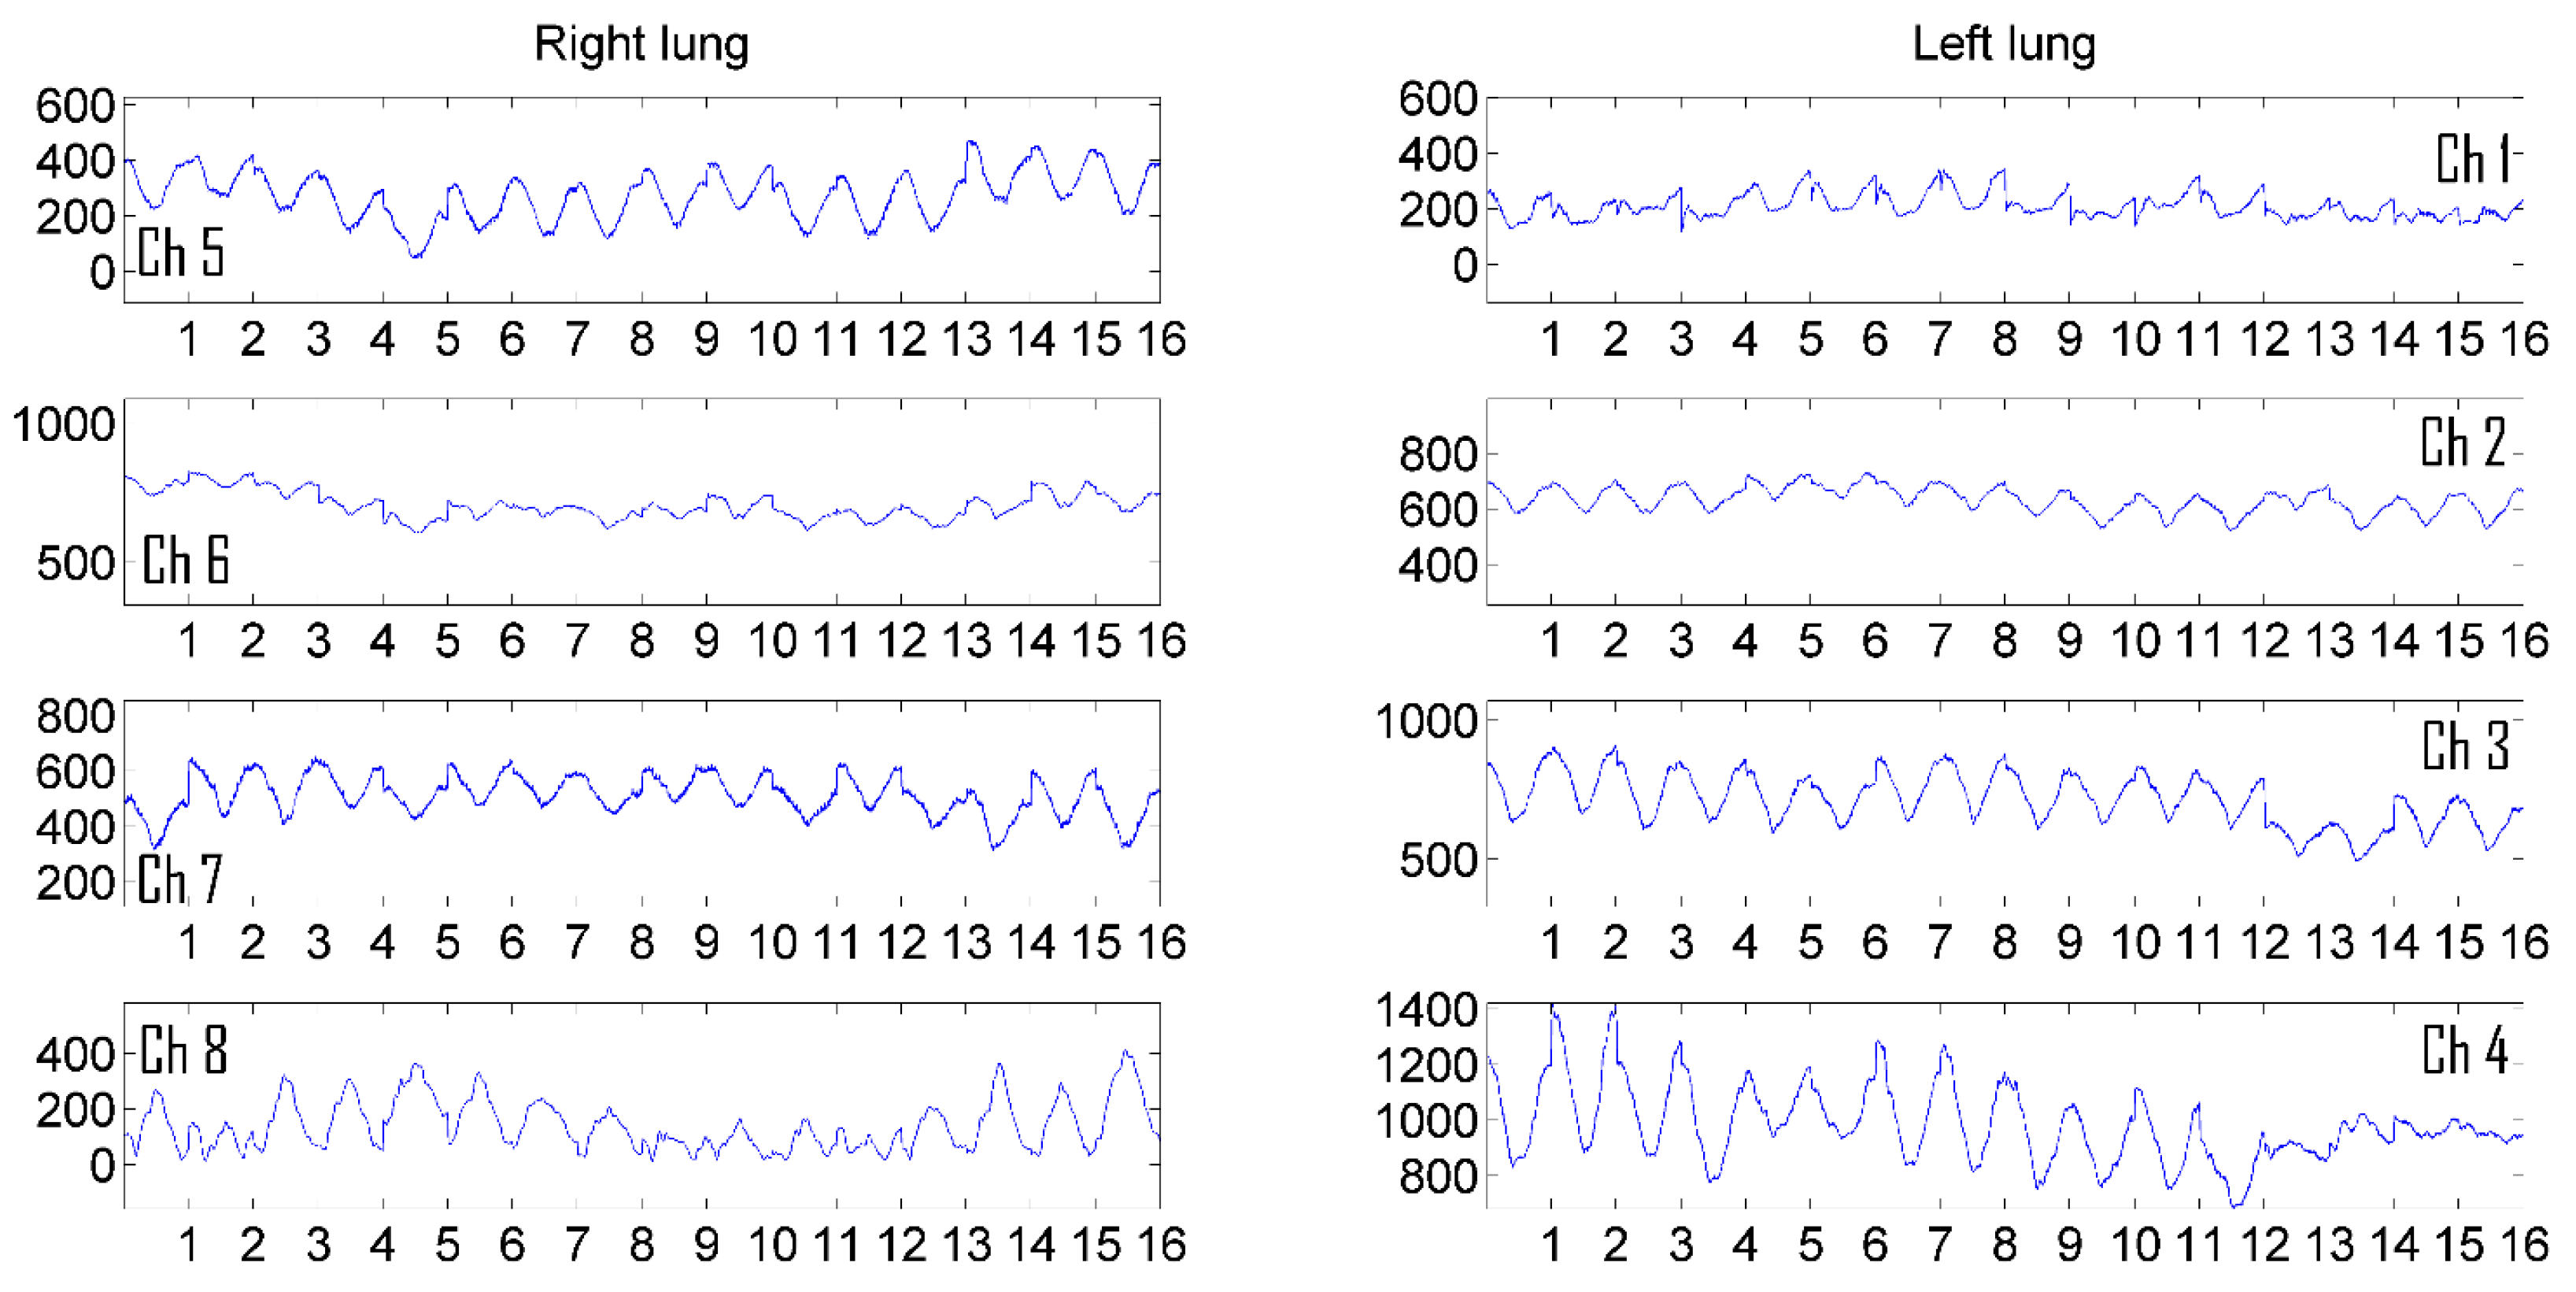
Figure 6.
Pulmonograms of woman.

Figure 7.
The result of accumulation and averaging of a man's pulmonogram.
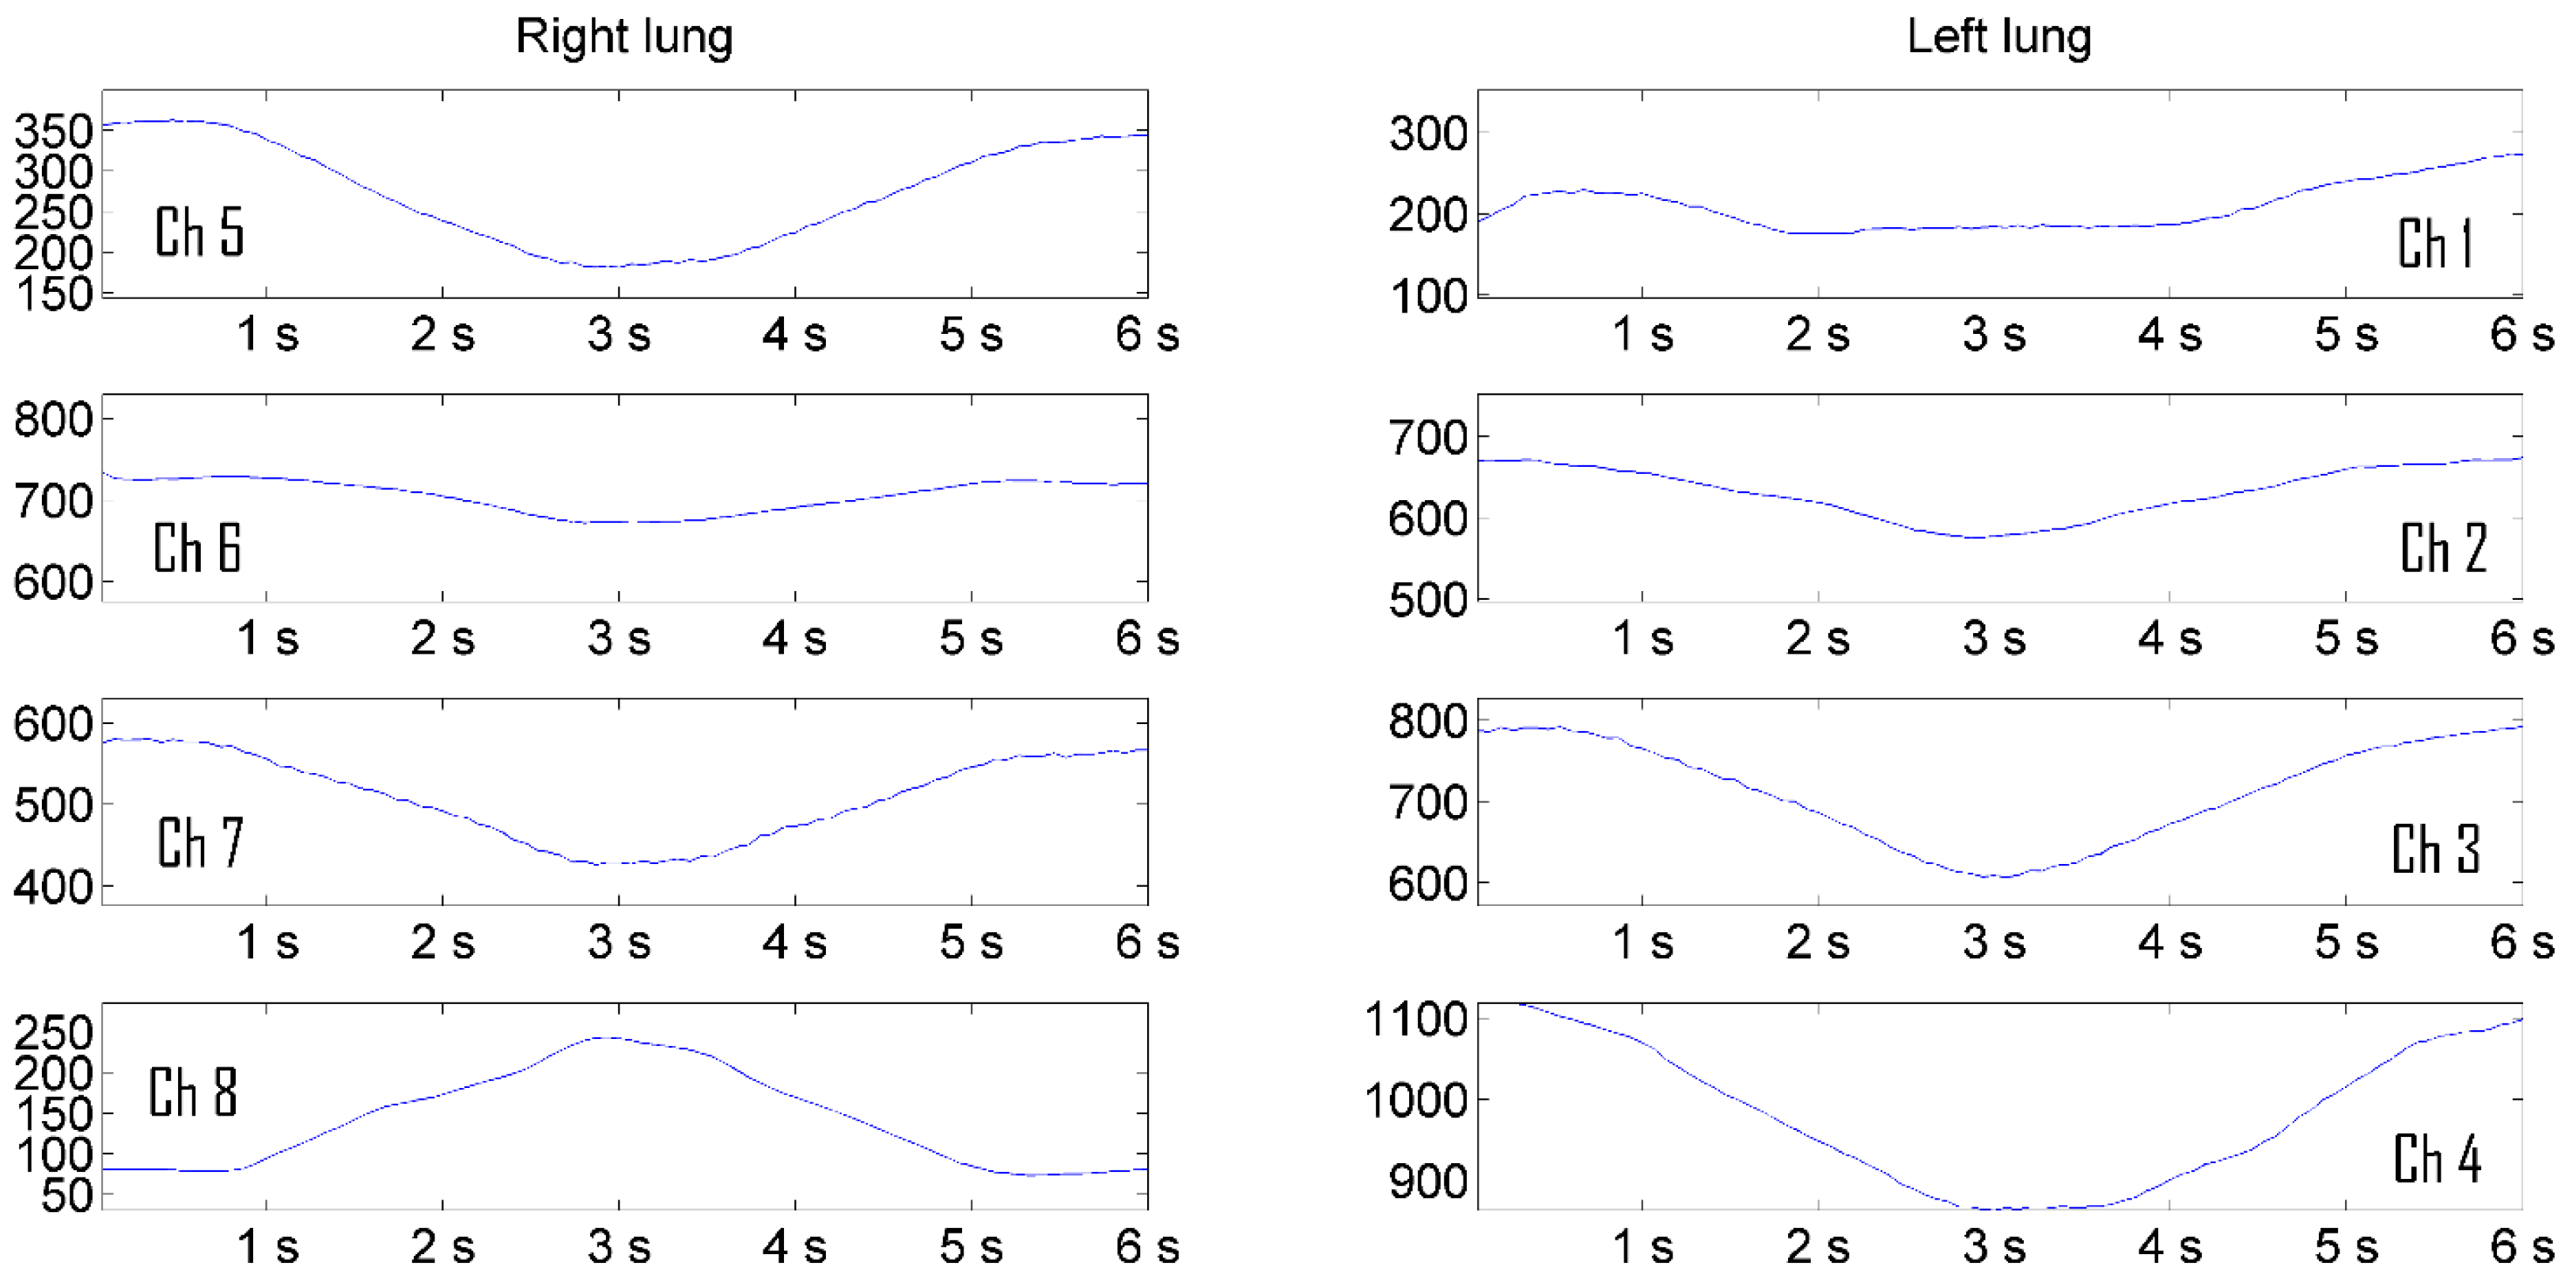
Figure 8.
The result of accumulation and averaging of a woman's pulmonogram.
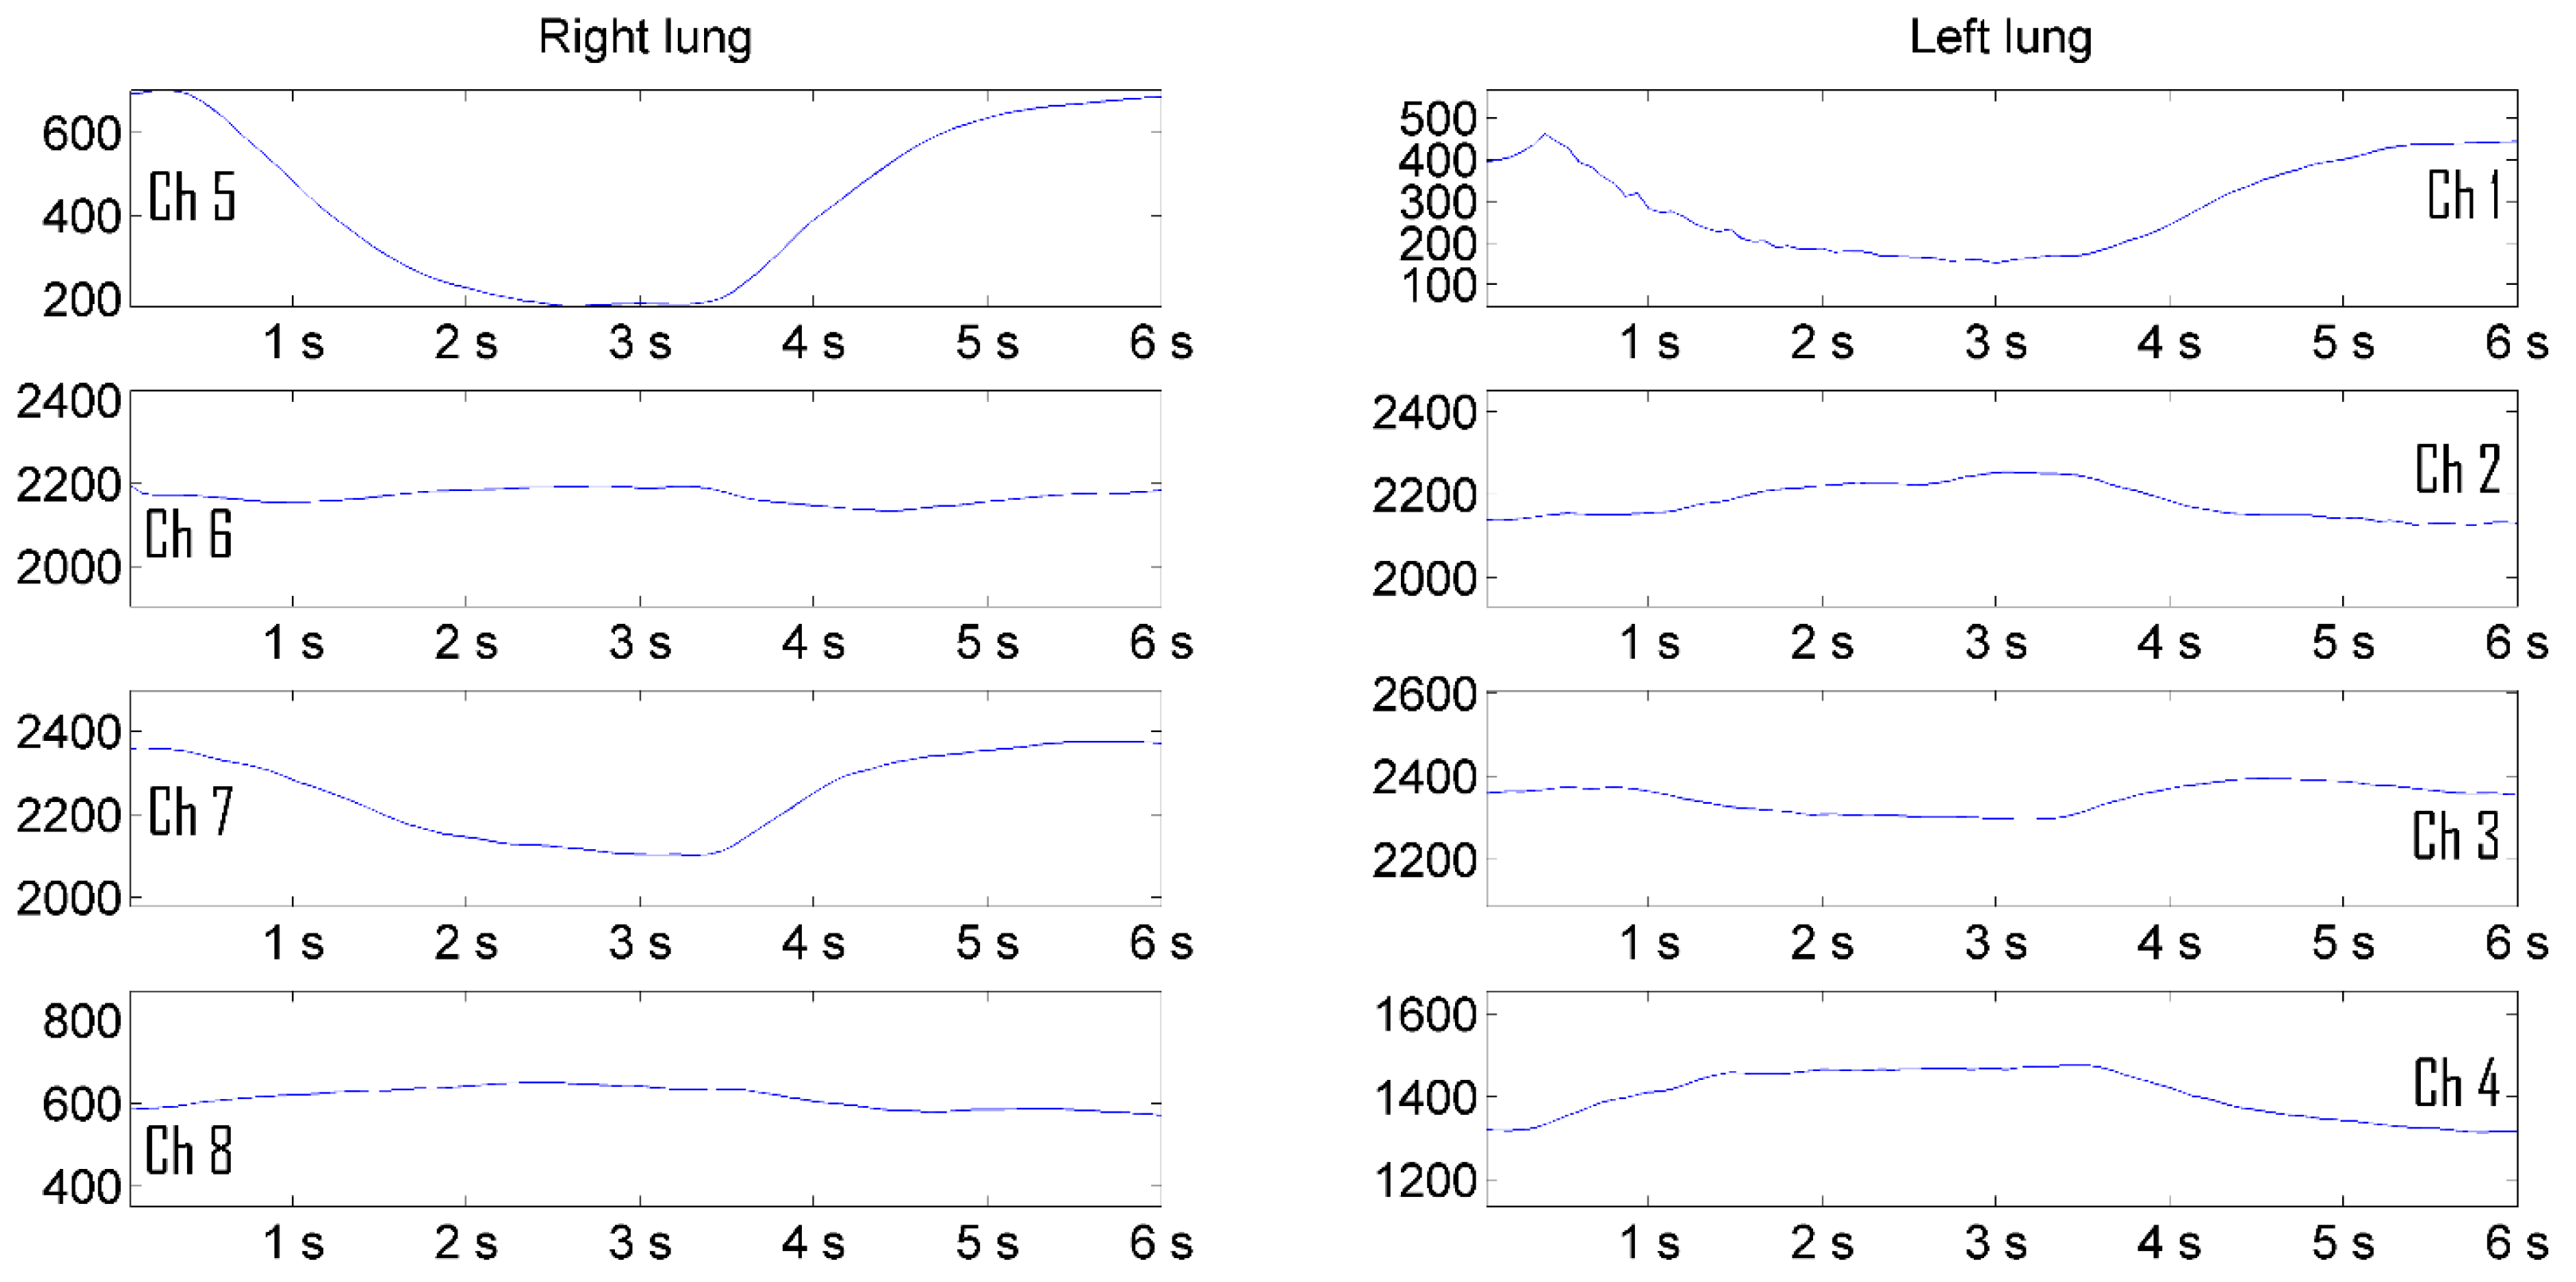
Figure 9.
Representation of a man's pulmonogram in decibels.
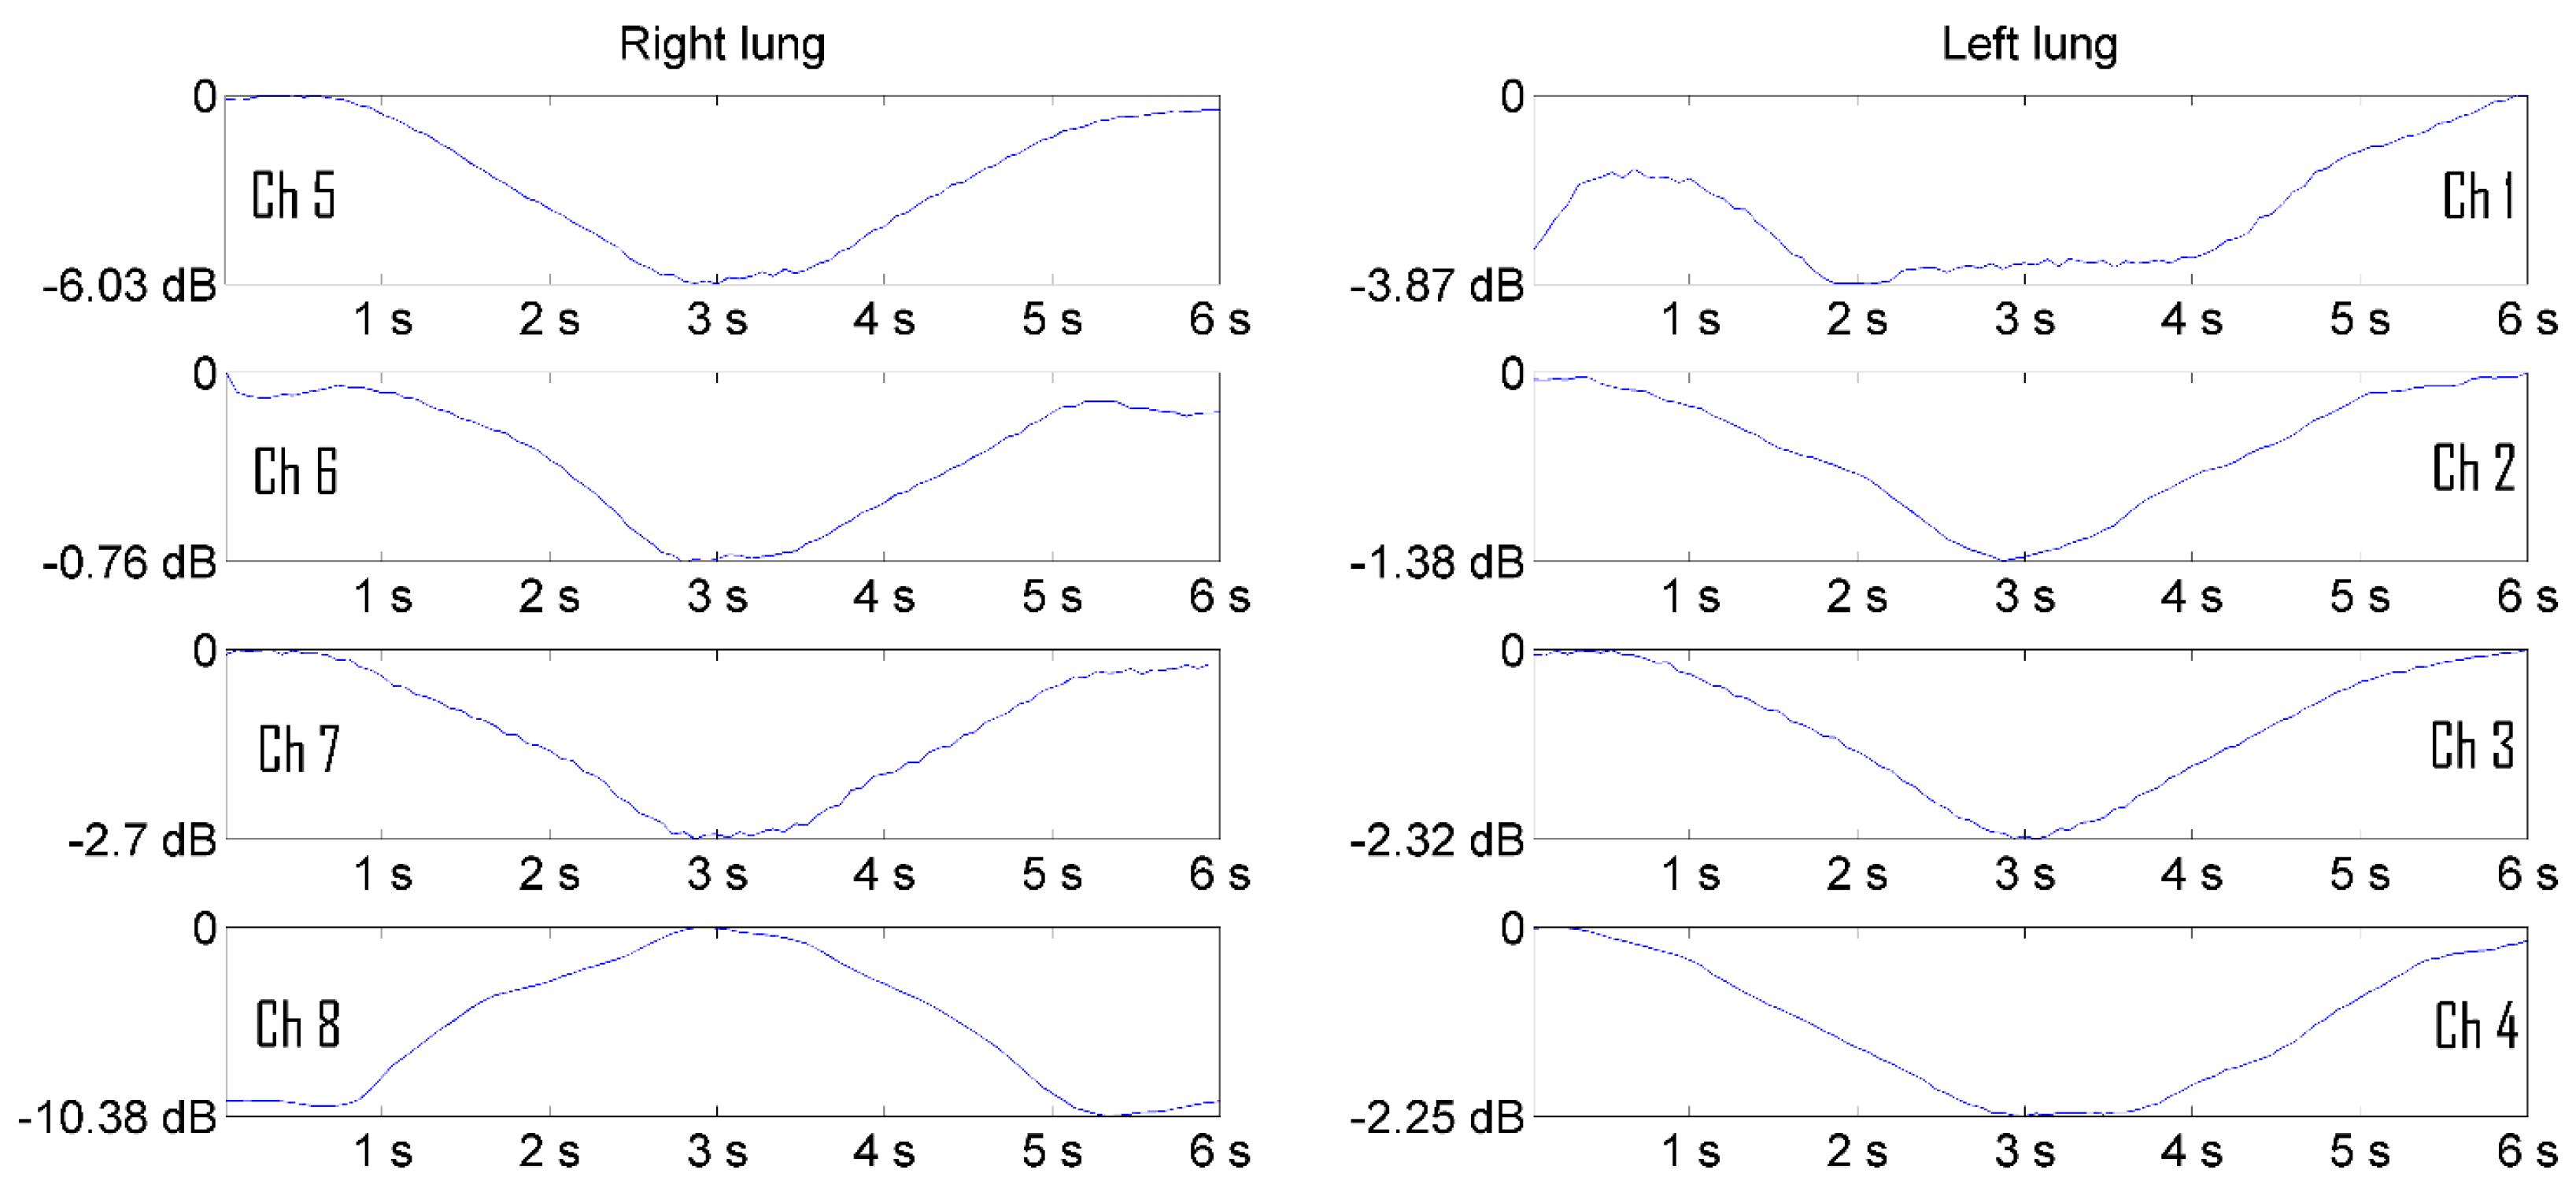
Figure 10.
Representation of a woman's pulmonogram in decibels.
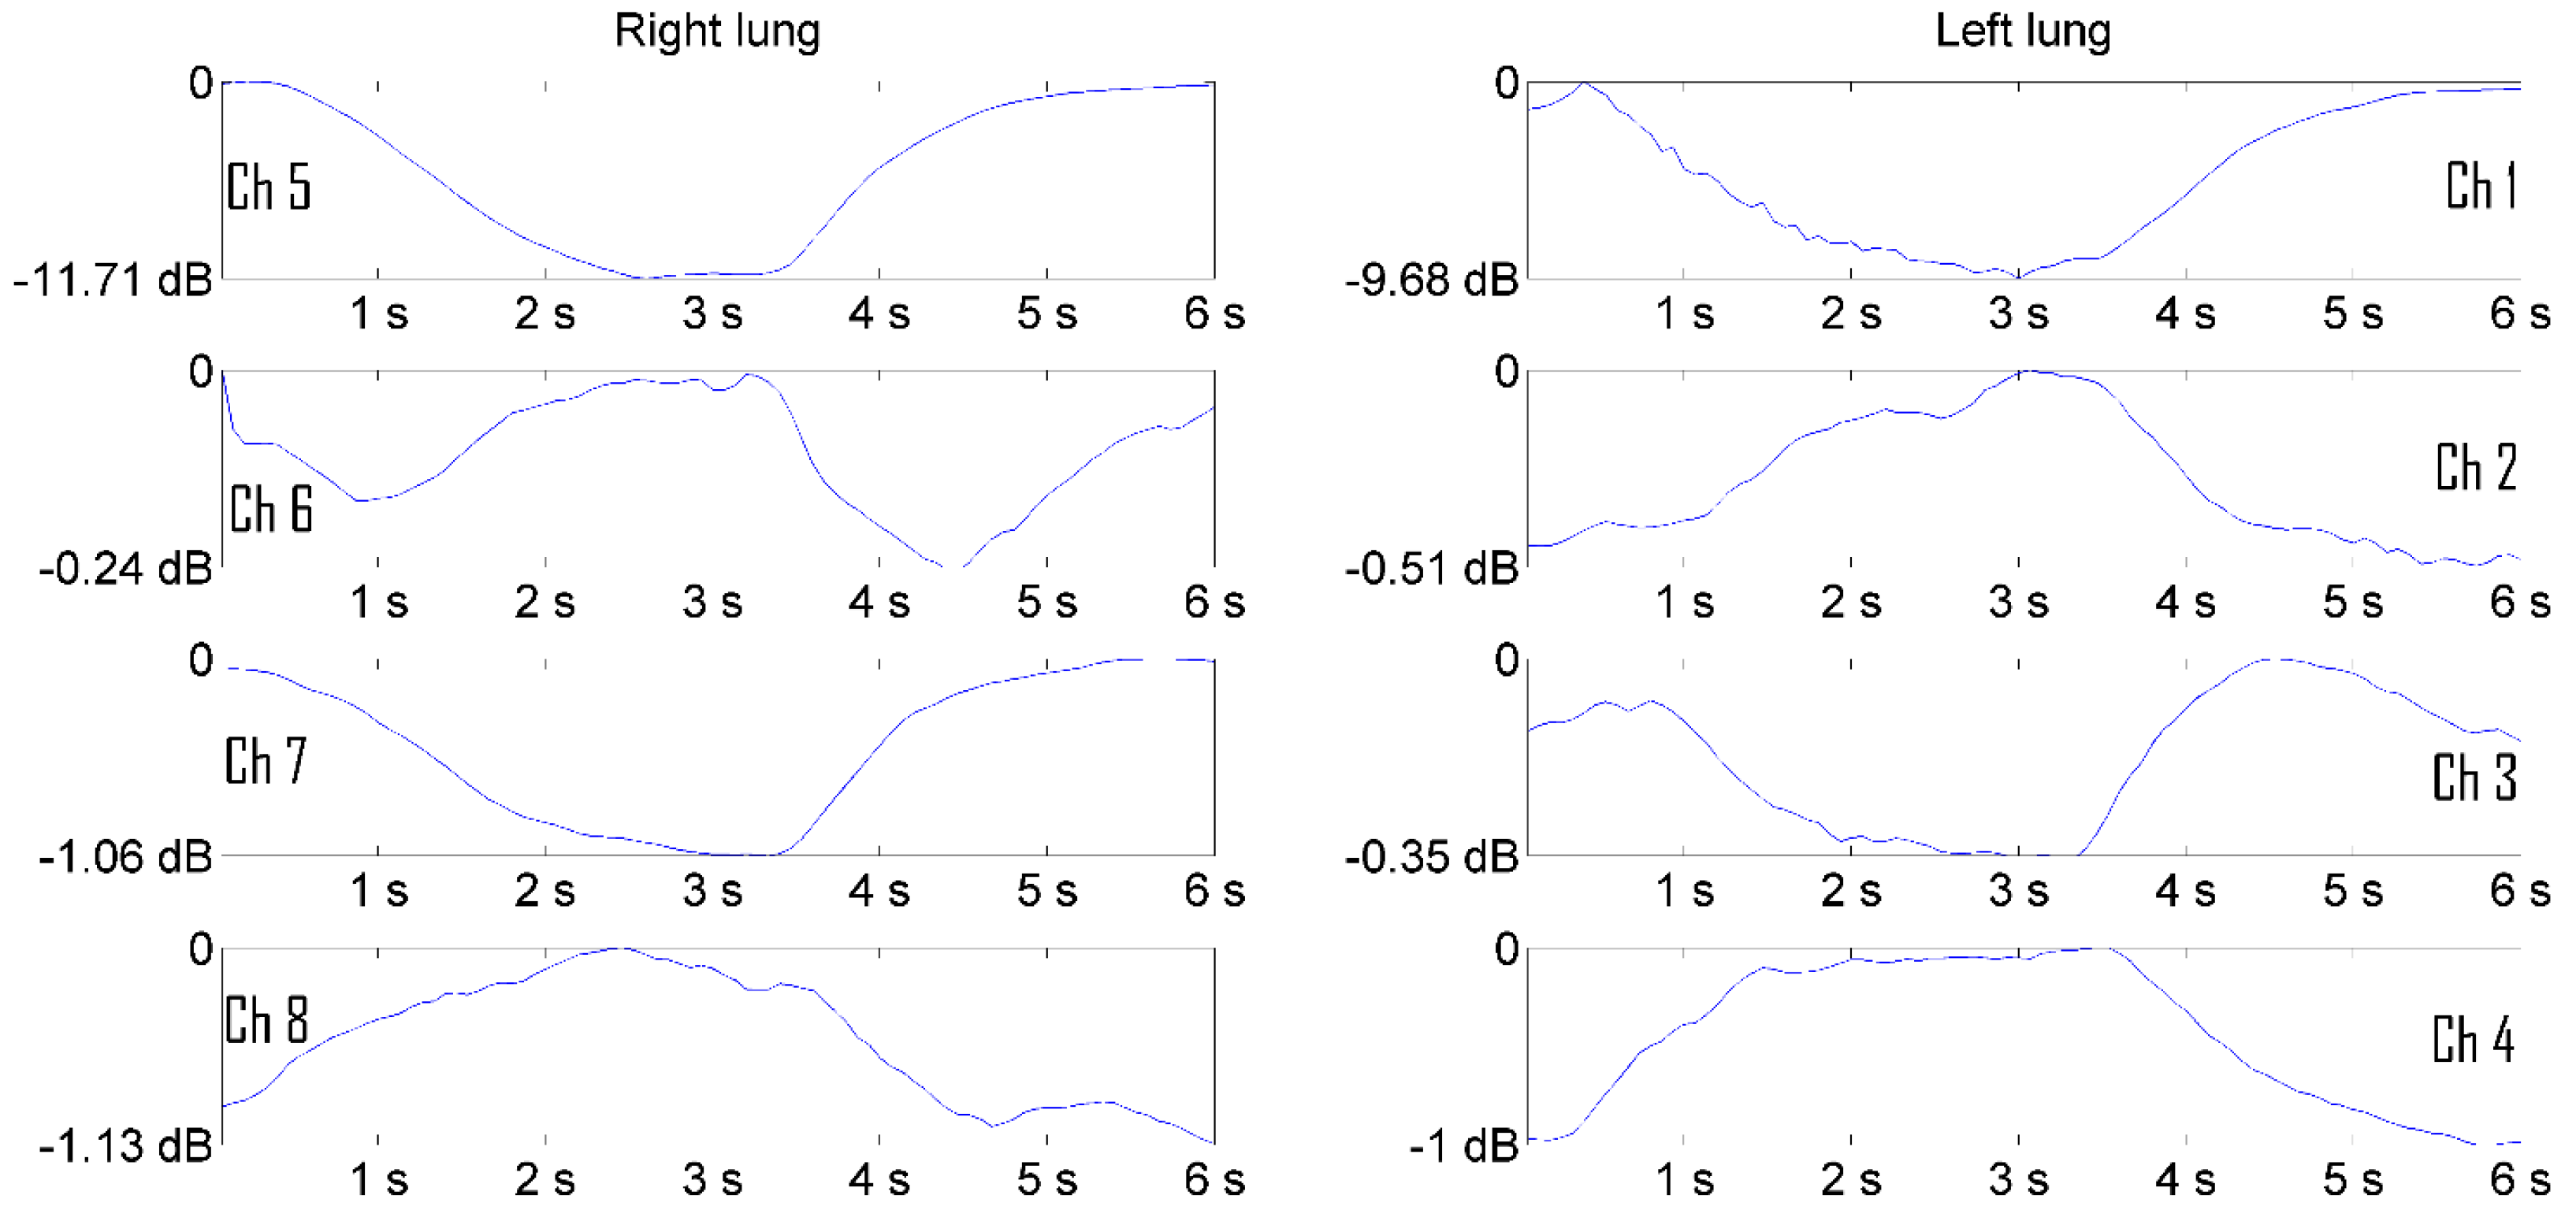
Figure 11.
Setting the boundary values of the image matrix. The size of the display area is pixels. The background image was taken from [20].
Figure 11.
Setting the boundary values of the image matrix. The size of the display area is pixels. The background image was taken from [20].
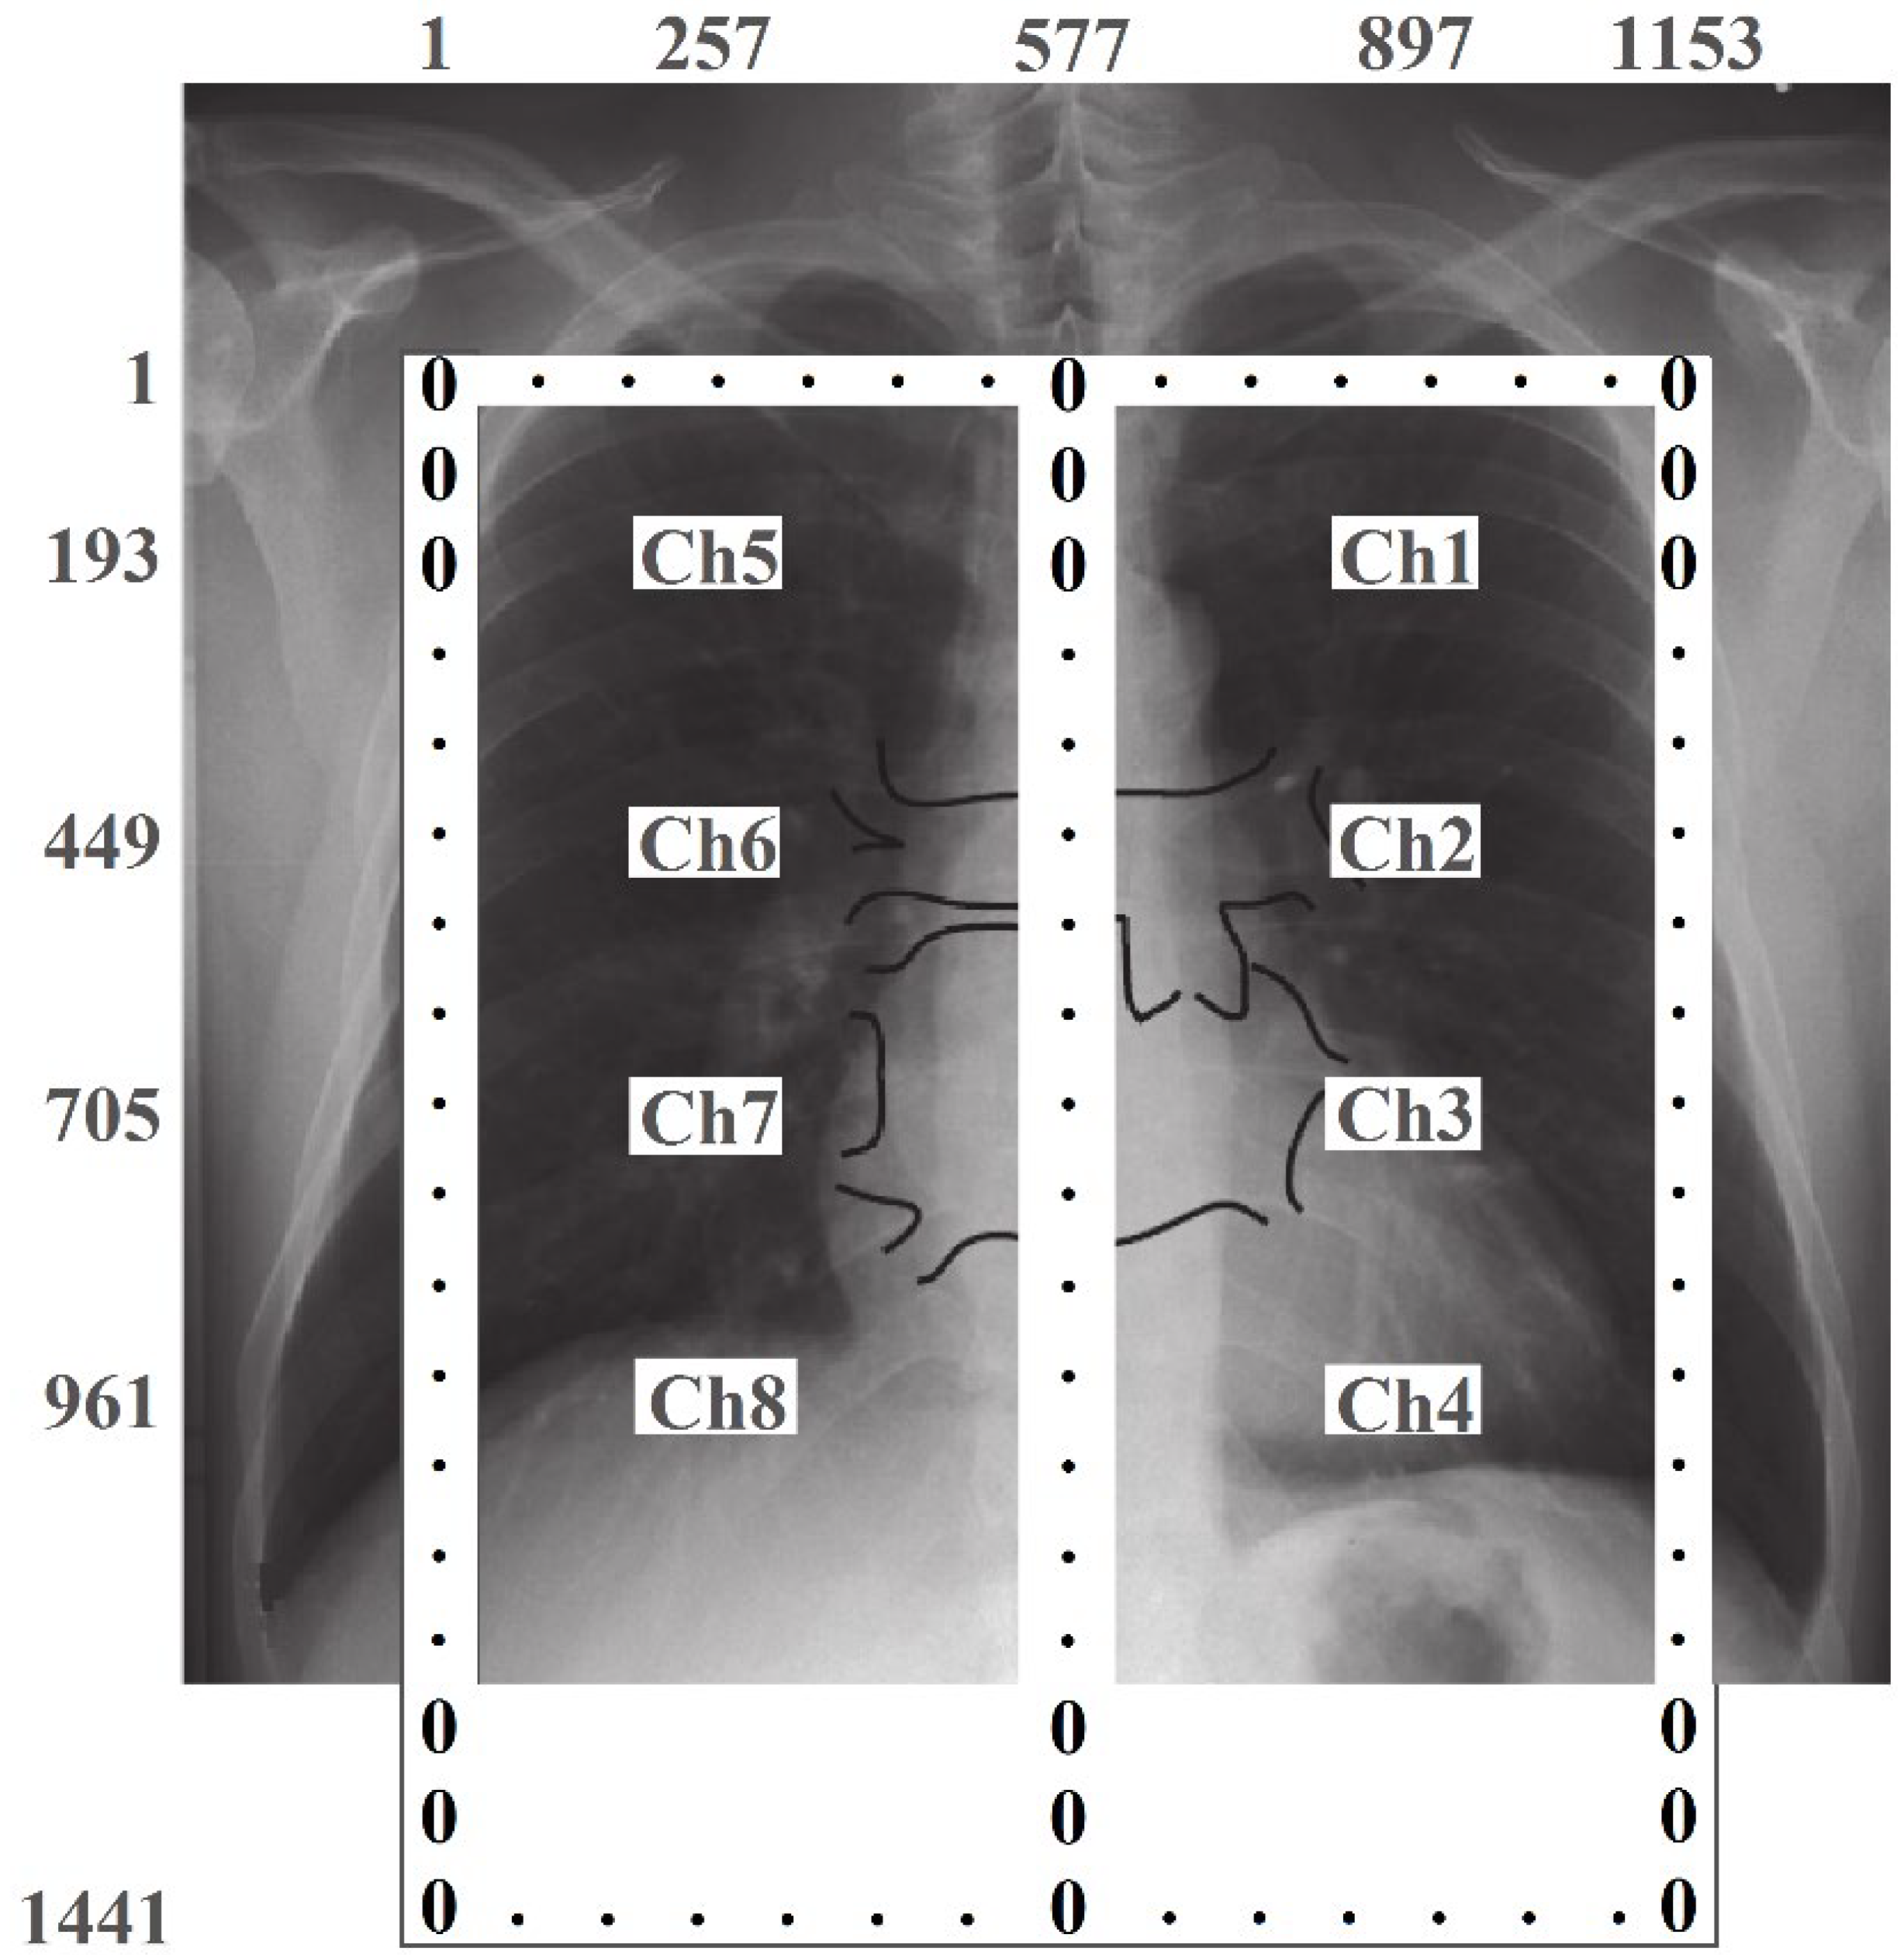
Figure 12.
The result of imaging of a man's pulmonograms.
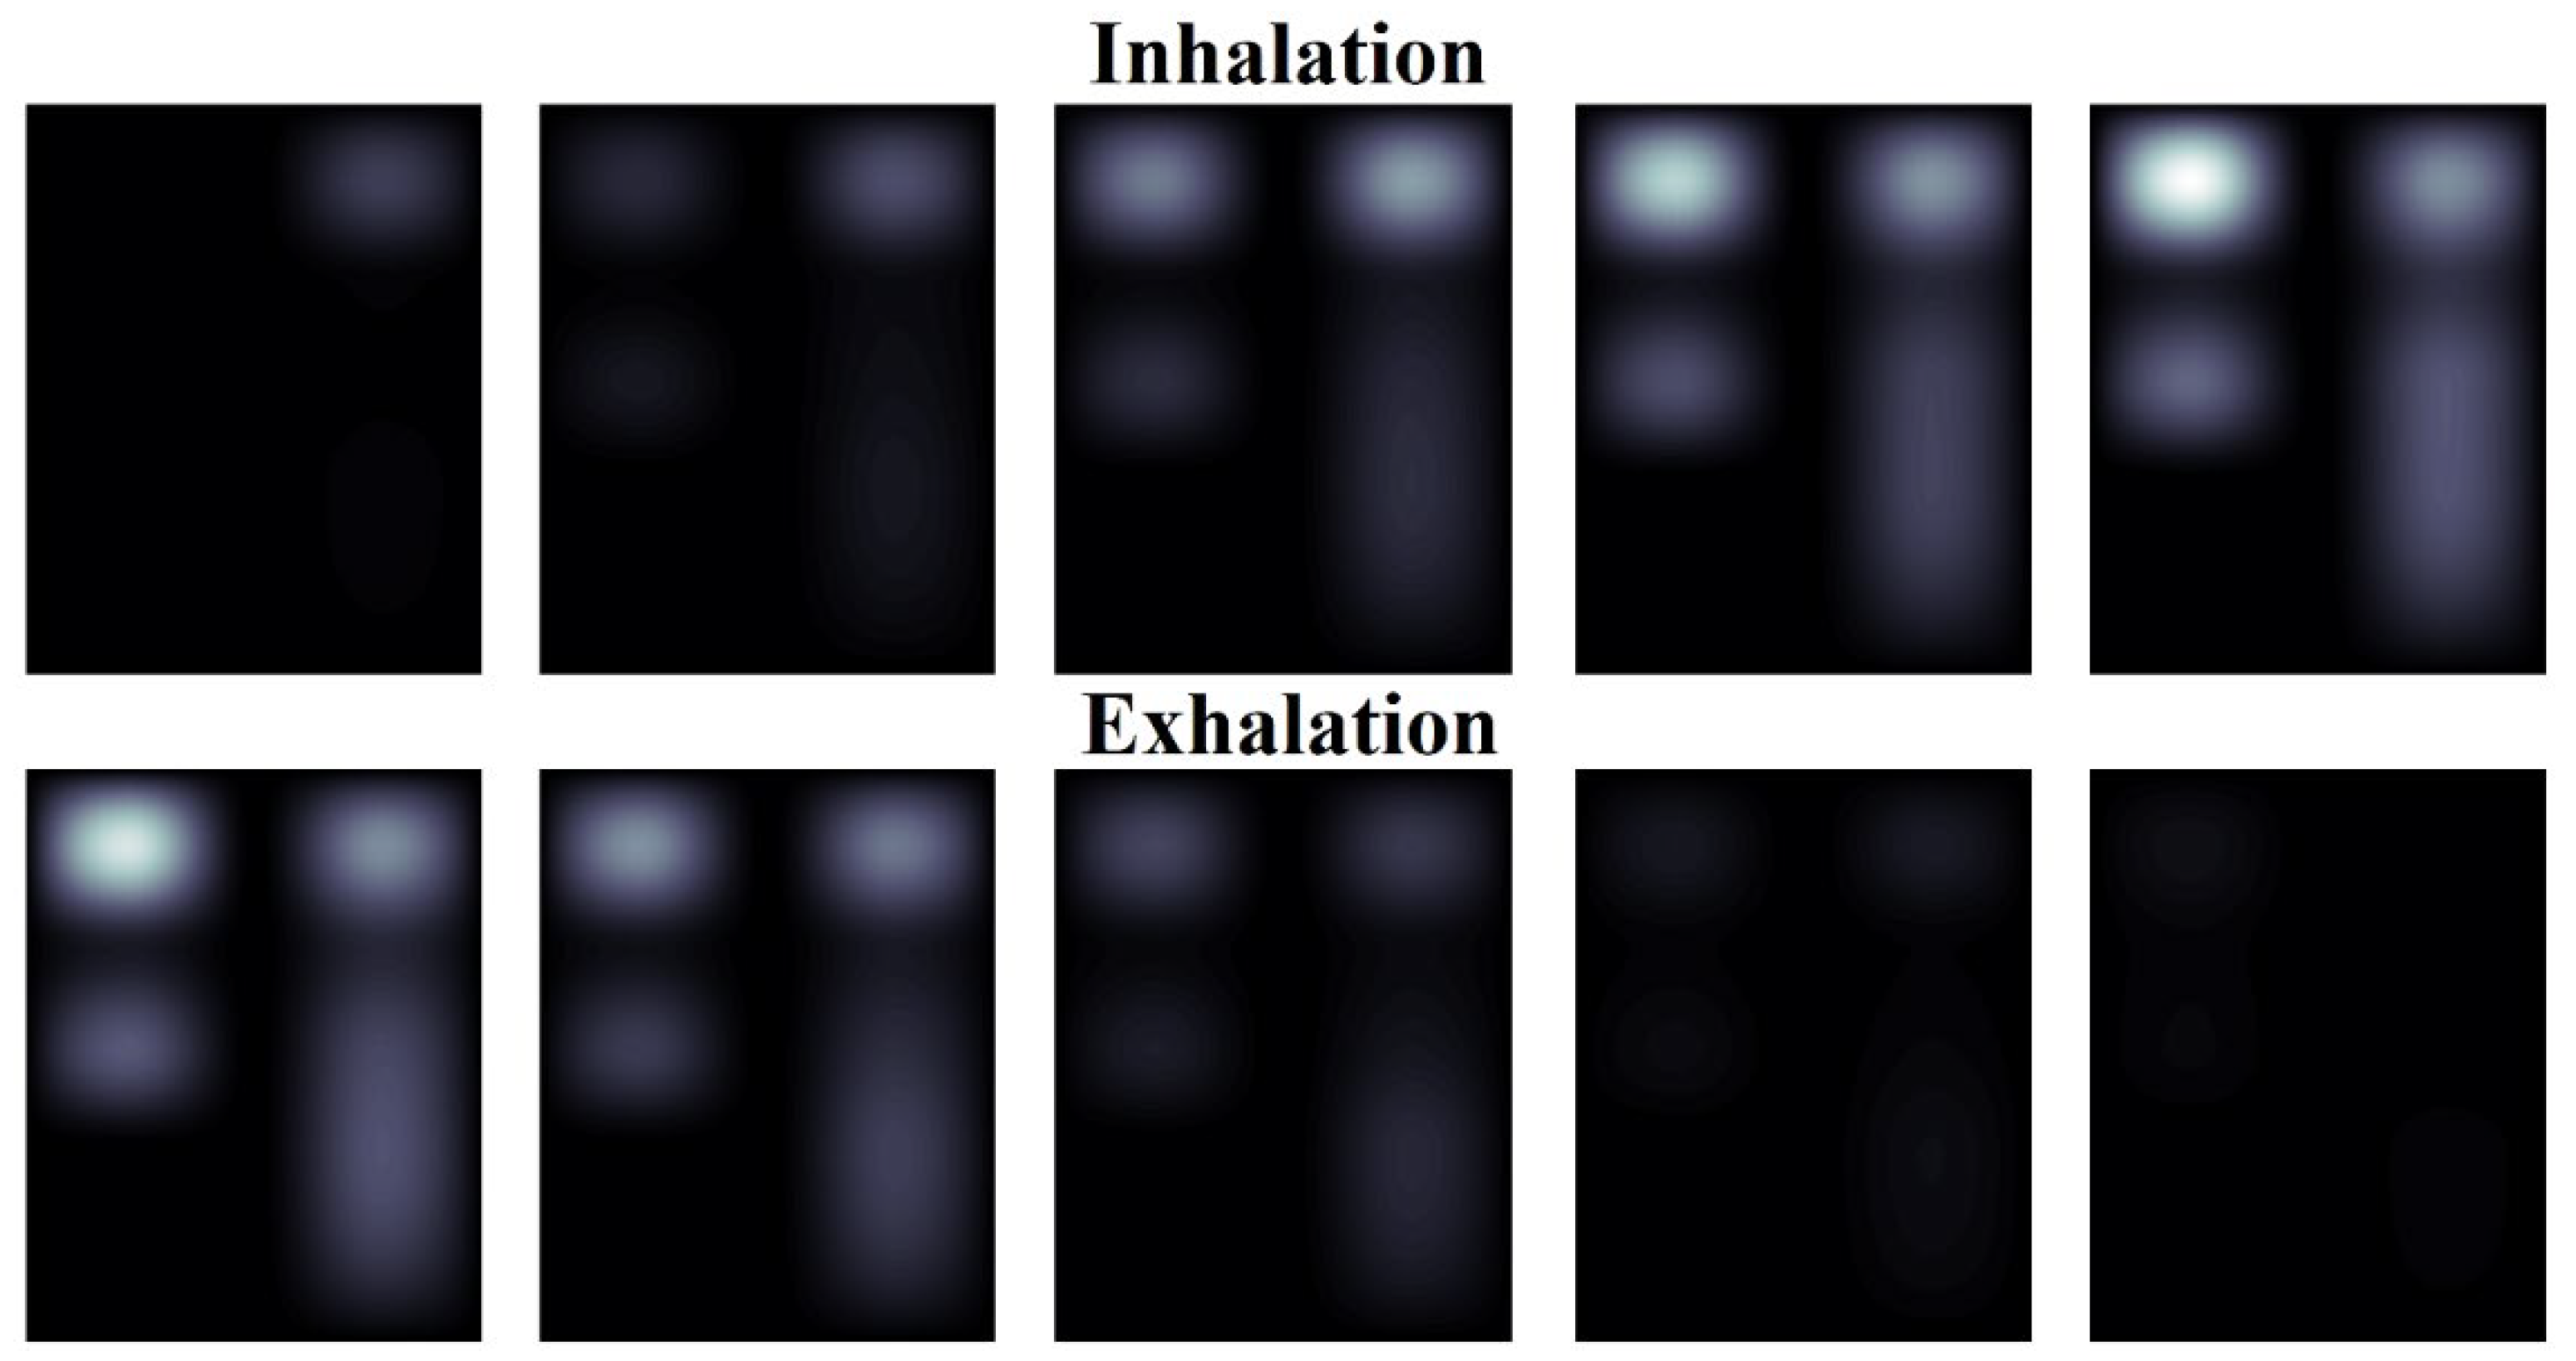
Figure 13.
The result of imaging of a woman's pulmonograms.
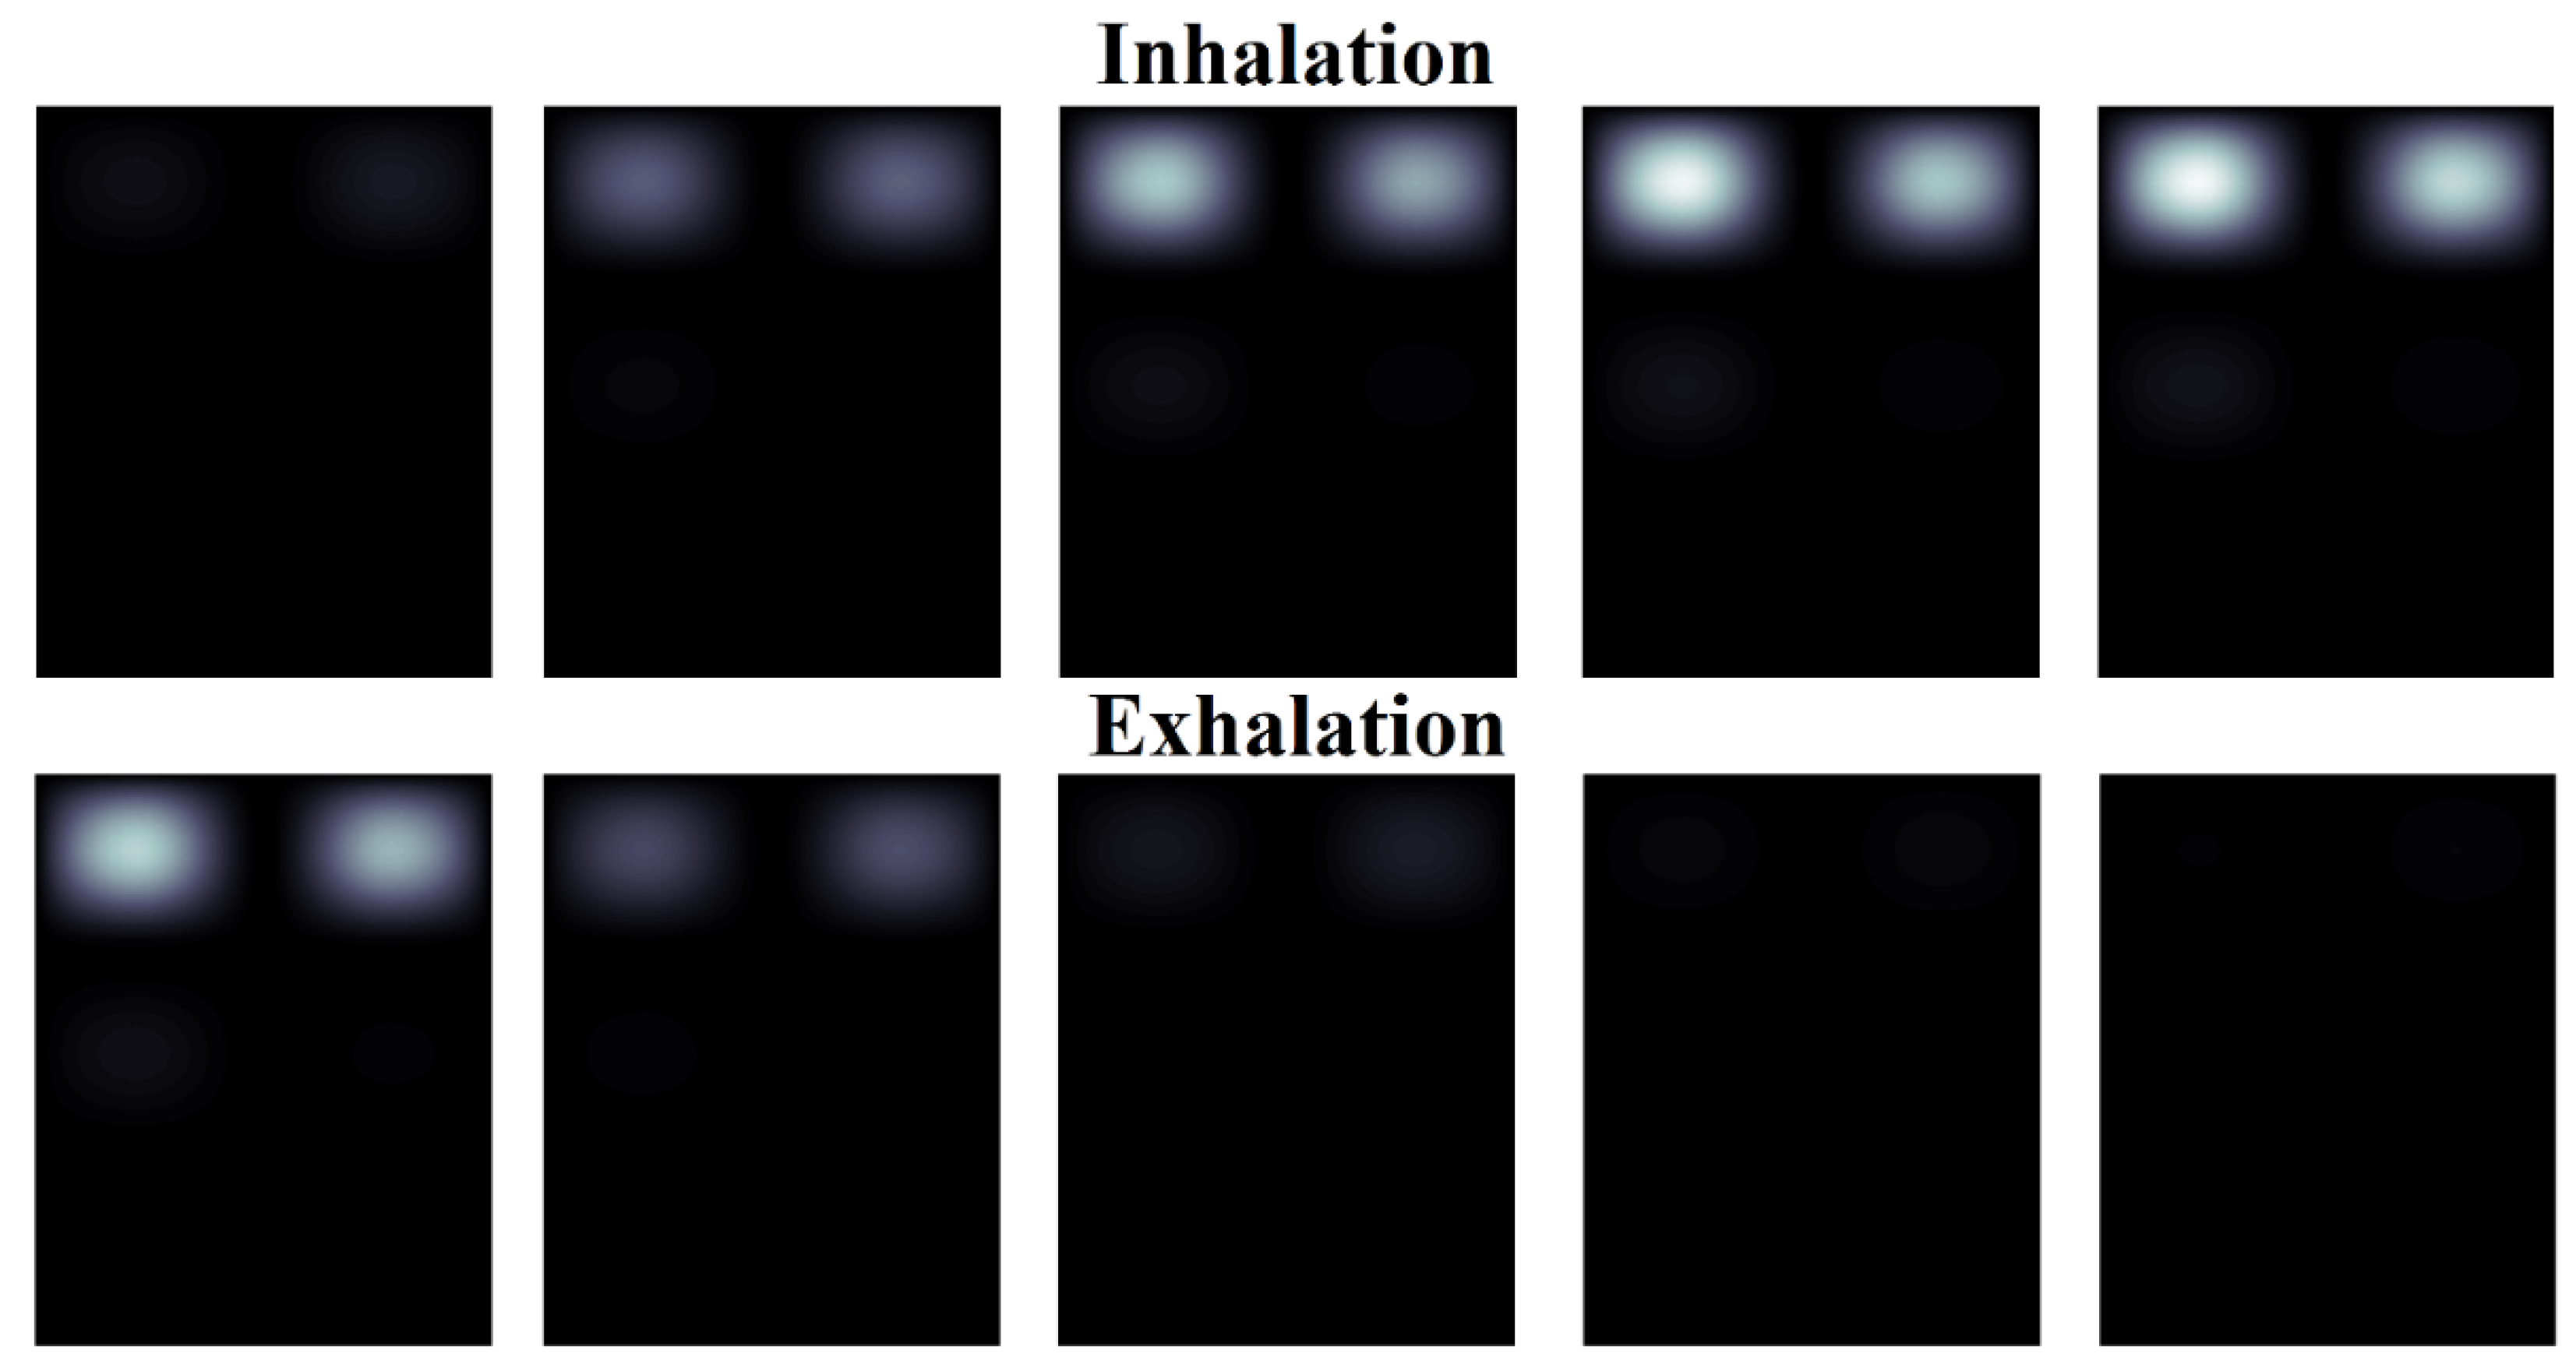

Table 1.
Technical characteristics of the “microwave generator USB-TG44A” and the “receiver USB-SA44B”.
Table 1.
Technical characteristics of the “microwave generator USB-TG44A” and the “receiver USB-SA44B”.
| USB-TG44A | |
|---|---|
| Frequency range | from 10 Hz to 4.4 GHz |
| Radiating signal level | from -30 dBm to -10 dBm |
| USB-SA44B | |
| Frequency range | from 150 kHz to 4.4 GHz |
| Mean noise level for frequencies from 1 GHz to 2.6 GHz |
-139 dBm |
| Dynamical range | from +10 dBm to mean noise level |
| Relative accuracy | ±0.25 dB |
Disclaimer/Publisher’s Note: The statements, opinions and data contained in all publications are solely those of the individual author(s) and contributor(s) and not of MDPI and/or the editor(s). MDPI and/or the editor(s) disclaim responsibility for any injury to people or property resulting from any ideas, methods, instructions or products referred to in the content. |
© 2024 by the authors. Licensee MDPI, Basel, Switzerland. This article is an open access article distributed under the terms and conditions of the Creative Commons Attribution (CC BY) license (http://creativecommons.org/licenses/by/4.0/).
Copyright: This open access article is published under a Creative Commons CC BY 4.0 license, which permit the free download, distribution, and reuse, provided that the author and preprint are cited in any reuse.


