Submitted:
11 September 2024
Posted:
14 September 2024
You are already at the latest version
Abstract

Keywords:
1. Introduction
2. Literature review
2.1 Classification of Meta-heuristic Algorithms
2.2 Analyzing the Process of Stock Yard Layout PC Components Produced on Site
3. Modeling Layout Optimization
3.1 Objective Function
3.2 Constraint
4. Solving Algorithms
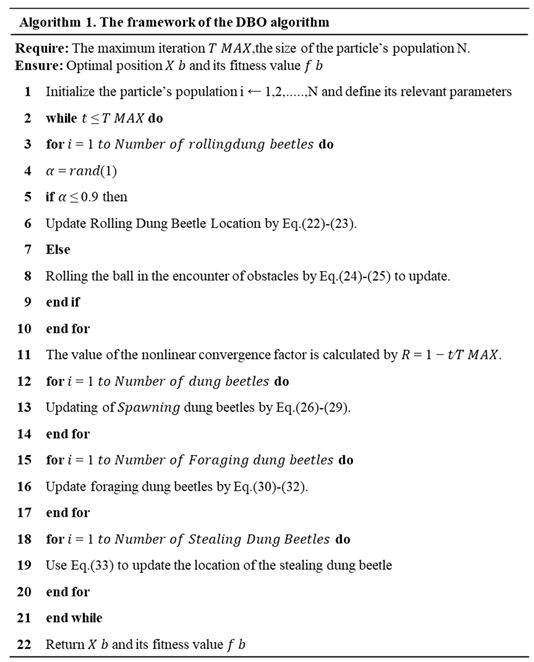
3.1. Standard DBO Algorithm
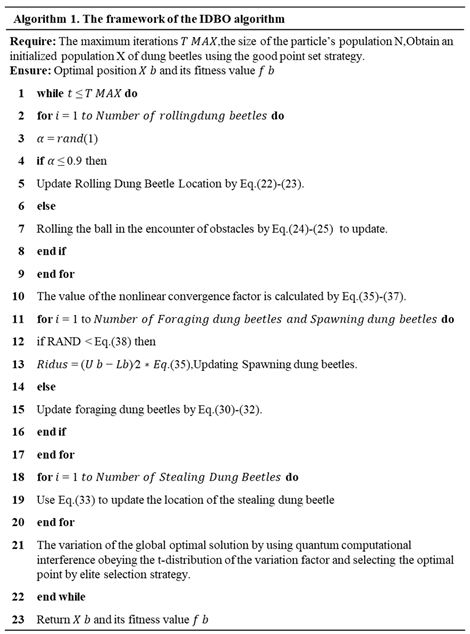
3.2. IDBO Algorithm
5. Case Project Application
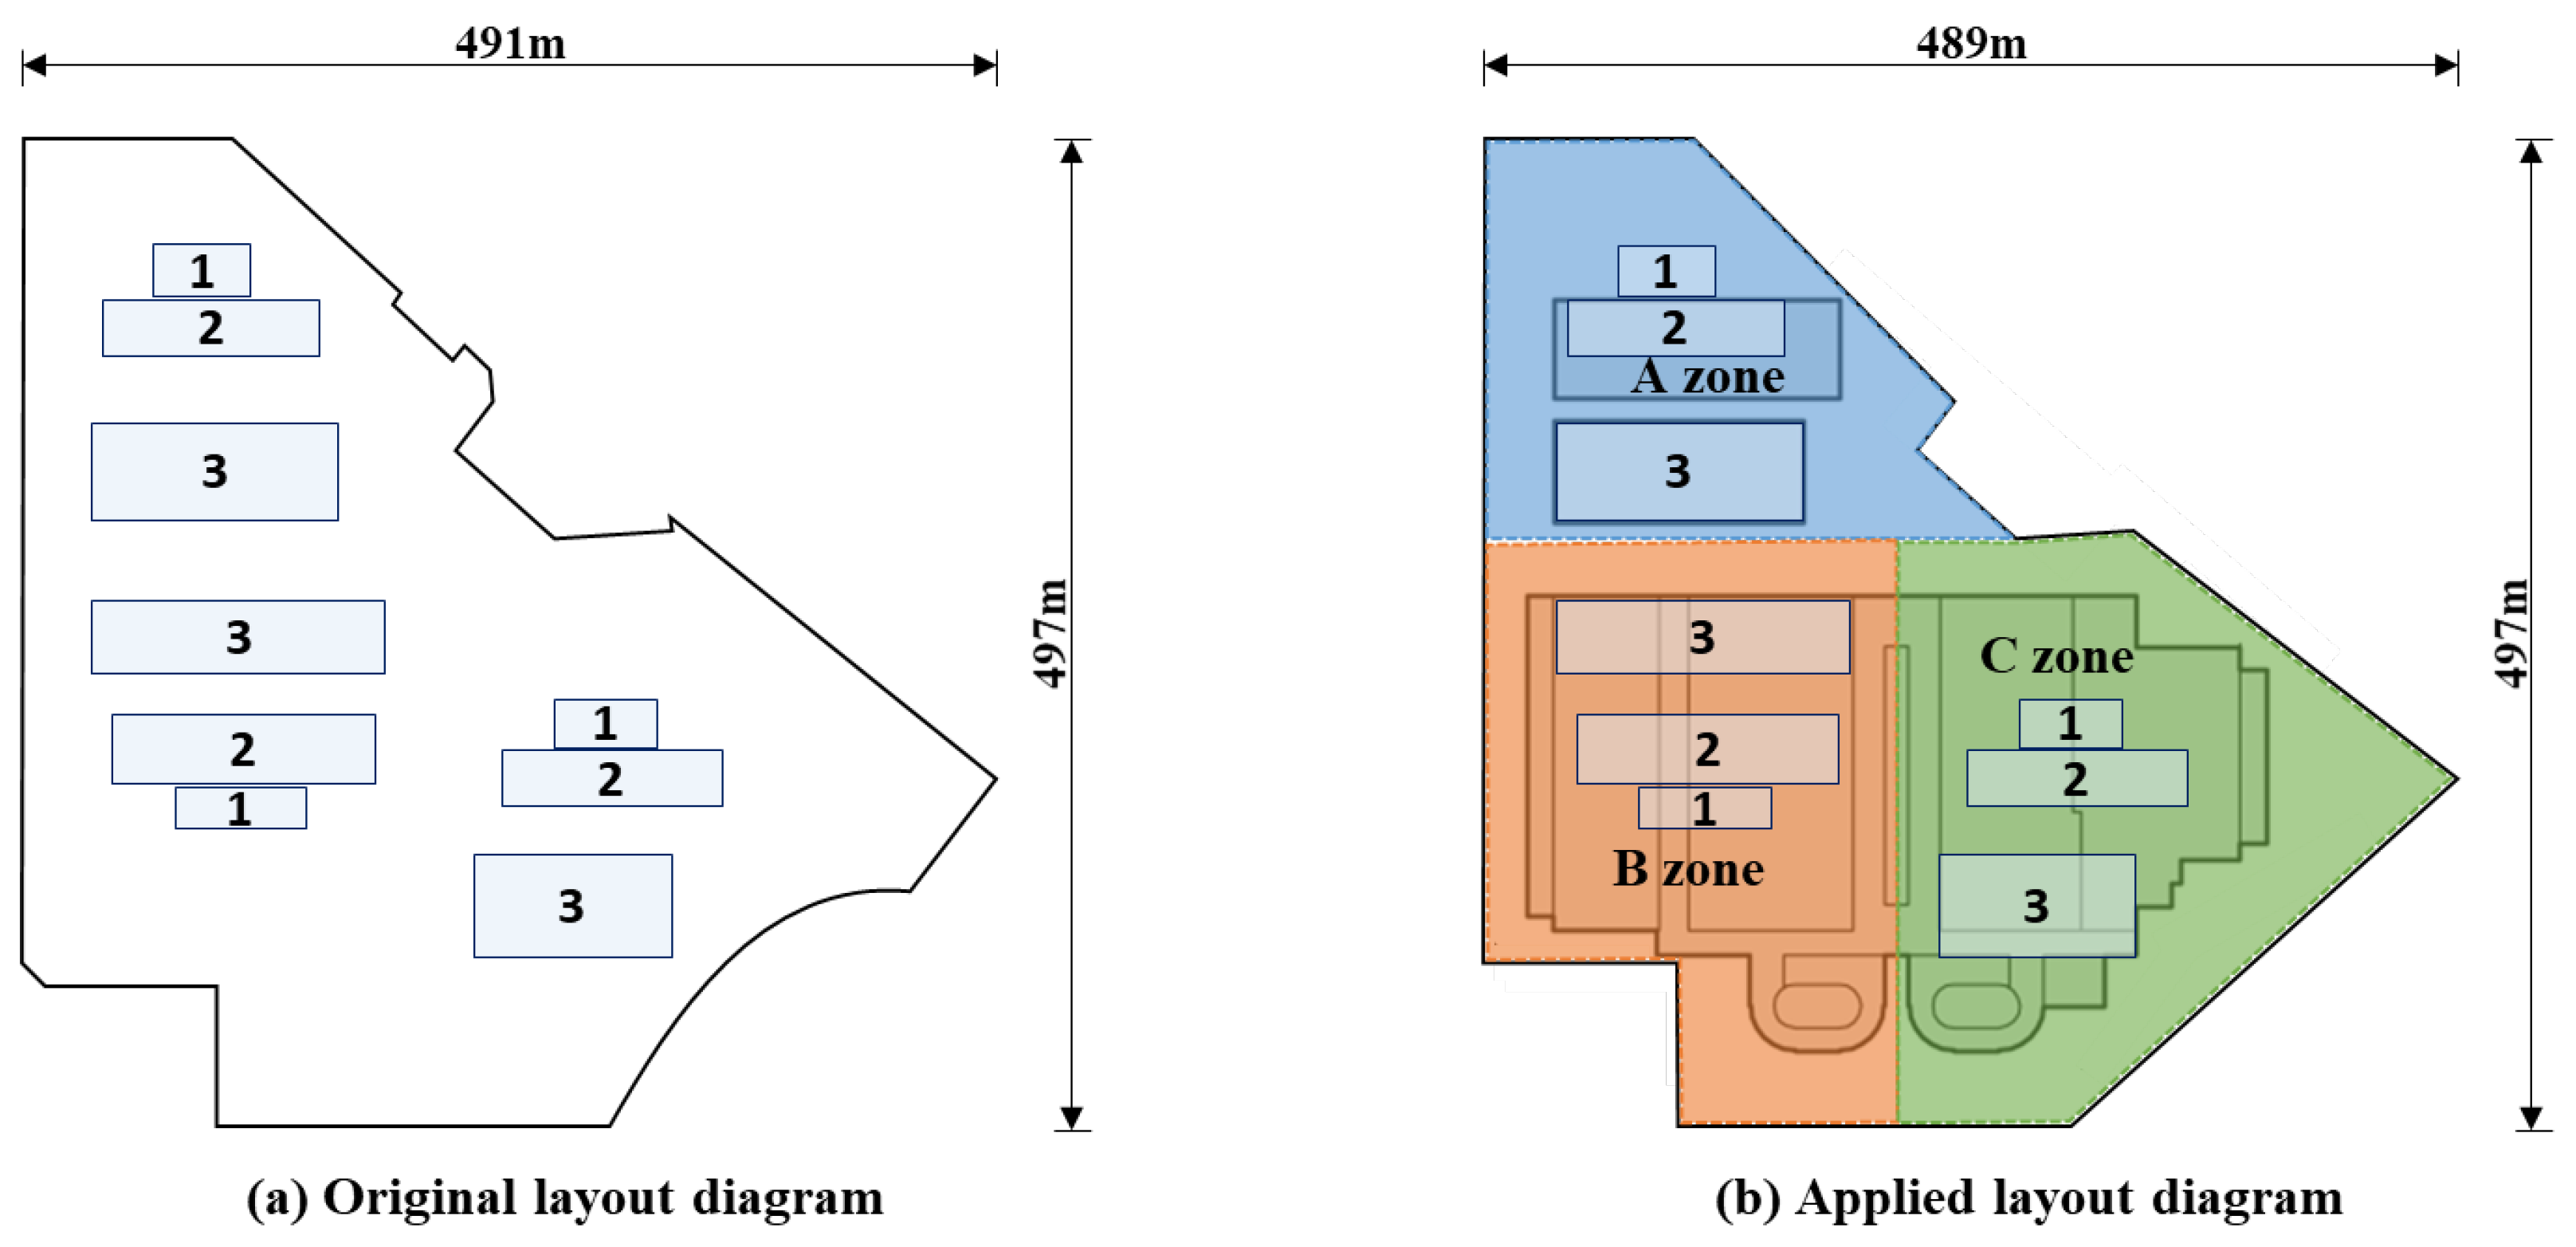
5.1. Case Overview
5.2. Optimization Result
5.3 Result Comparison
6. Discussion
7. Conclusion
Author Contributions
Funding
Conflicts of Interest
References
- Na Y, Han B, Son S. Analysis of CO2 Emission Reduction Effect of On-Site Production Precast Concrete Member according to Factory Production Environment. Advances in Civil Engineering. 2021;2021(1):4569651. [CrossRef]
- Lim J, Kim DY. Integrated management model of production and yard stock for in-situ precast concrete production. Journal of Asian Architecture and Building Engineering. 2023 Jan 2;22(1):286-302. [CrossRef]
- Lim J, Kim JJ. Dynamic optimization model for estimating in-situ production quantity of PC members to minimize environmental loads. Sustainability. 2020 Oct 5;12(19):8202. [CrossRef]
- Lim J, Son CB, Kim S. Scenario-based 4D dynamic simulation model for in-situ production and yard stock of precast concrete members. Journal of Asian Architecture and Building Engineering. 2023 Jul 4;22(4):2320-34. [CrossRef]
- Hong WK, Lee G, Lee S, Kim S. Algorithms for in-situ production layout of composite precast concrete members. Automation in Construction. 2014 May 1;41:50-9. [CrossRef]
- Na YJ, Kim SK. A process for the efficient in-situ production of precast concrete members. Journal of the Regional Association of Architectural Institute of Korea. 2017 Oct;19(4):153-61.
- Lim, C. 2016. “Construction Planning Model for In-situ Production and Installation of Composite Precast Concrete Frame.” PhD diss., Kyung Hee University.
- Lim, C, Joo, J. K., Lee, G. J., and Kim, S. K. 2011a. “Basic Analysis for Form System of In-situ Production of Precast Concrete Members.” In Proceeding of the 2011 Autumn Annual Conference of Construction Engineering and Management, 12(1), 137-138. Seoul, Korea.
- Lim, C. Y., Joo, J. K., Lee, G. J., and Kim, S. K. 2011b. “In-Situ Production Analysis of Composite Precast Concrete Members of Green Frame.” Journal of the Korea Institute of Building Construction 11 (5): 501–514. [CrossRef]
- Lee, G. J., Lee, S. H., Joo, J. K., and Kim, S. K. 2011a. “A Basic Study of In-Situ Production Process of PC Members.” In Proceeding of the 2011 Autumn Annual Conference of the Architectural Institute of Korea, 31(2), 263-264. Seoul, Korea.
- Lee, G. J., Joo, J. K., Lee, S. H., and Kim, S. K. 2011b. “A Basic Study on the Arrangement of In-situ Production Module of the Composite PC Members.” In Proceeding of the 2011 Autumn Annual Conference of the Korea Institute of Building Construction, 11(2), 29-30. Seoul, Korea.
- Jung, H. T., and Lee, M. S. 1992. “A Study on the Site-production Possibility of the Prefabricated PC Components.” In Proceeding of the 1992 Autumn Annual Conference of the Architectural Institute of Korea, 12(2), 629-636. Seoul, Korea.
- Li H, Love PE. Genetic search for solving construction site-level unequal-area facility layout problems. Automation in construction. 2000 Mar 1;9(2):217-26. [CrossRef]
- Osman HM, Georgy ME, Ibrahim ME. A hybrid CAD-based construction site layout planning system using genetic algorithms. Automation in construction. 2003 Nov 1;12(6):749-64. [CrossRef]
- Ning X, Lam KC, Lam MC. Dynamic construction site layout planning using max-min ant system. Automation in construction. 2010 Jan 1;19(1):55-65. [CrossRef]
- Abdul-Rahman H, Wang C, Eng KS. Repertory grid technique in the development of Tacit-based Decision Support System (TDSS) for sustainable site layout planning. Automation in Construction. 2011 Nov 1;20(7):818-29. 829, . [CrossRef]
- Lee, G. J. 2012. “A Study of In-situ Production Management Model of Composite Precast Concrete Members.” PhD diss., Kyung Hee University.
- Won I, Na Y, Kim JT, Kim S. Energy-efficient algorithms of the steam curing for the in situ production of precast concrete members. Energy and buildings. 2013 Sep 1;64:275-84. [CrossRef]
- Lim J, Park K, Son S, Kim S. Cost reduction effects of in-situ PC production for heavily loaded long-span buildings. Journal of Asian Architecture and Building Engineering. 2020 May 3;19(3):242-53. [CrossRef]
- Kim SH, Kim GH, Kang KI. A study on the effective inventory management by optimizing lot size in building construction. Journal of the Korea Institute of Building Construction. 2004;4(2):73-80. [CrossRef]
- Lee JM, Yu JH, Kim CD. A Economic Order Quantity (EOQ) Determination Method considering Stock Yard Size. InProceedings of the Korean Institute Of Construction Engineering and Management 2007 (pp. 549-552). Korea Institute of Construction Engineering and Management.
- Lee JM, Yu JH, Kim CD, Lee KJ, Lim BS. Order Point Determination Method considering Materials Demand Variation of Construction Site. Journal of the Architectural Institute of Korea. 2008;24(10):117-25.
- Thomas HR, Horman MJ, Minchin Jr RE, Chen D. Improving labor flow reliability for better productivity as lean construction principle. Journal of construction engineering and management. 2003 Jun;129(3):251-61. [CrossRef]
- Yun JS, Yu JH, Kim CD. Economic Order Quantity (EOQ) Determination Process for Construction Material considering Demand Variation and Stockyard Availability. Korean Journal of Construction Engineering and Management. 2011;12(1):33-42. [CrossRef]
- Lim, J., and Kim, S. 2020a. “Evaluation of CO2 Emission Reduction Effect Using In-situ Production of Precast Concrete Components.” Journal of Asian Architecture and Building Engineering 19: 176–186. [CrossRef]
- Lim, J., Kim, S., and Kim, J. J. 2020a. “Dynamic Simulation Model for Estimating In-situ Production Quantity of PC Members.” International Journal of Civil Engineering 18: 935–950. [CrossRef]
- Yang, B.; Han, J.W.; Yang, L.; Ren, Q.S.; Yang, X.T. Evaluation system of China’s low-carbon cold chain logistics development level. Smart Agric. 2023, 5(01), 44-51. [CrossRef]
- Bai J, Li Y, Zheng M, Khatir S, Benaissa B, Abualigah L, Wahab MA. A sinh cosh optimizer. Knowledge-Based Systems. 2023 Dec 20;282:111081. [CrossRef]
- Wehrens R, Buydens LM. Classical and nonclassical optimization methods. Encyclopedia of analytical chemistry. 2000:9678-89.
- YiFei L, MaoSen C, Tran-Ngoc H, Khatir S, Wahab MA. Multi-parameter identification of concrete dam using polynomial chaos expansion and slime mould algorithm. Computers & Structures. 2023 Jun 1;281:107018. [CrossRef]
- Khishe M, Mosavi MR. Chimp optimization algorithm. Expert systems with applications. 2020 Jul 1;149:113338. [CrossRef]
- Minh HL, Sang-To T, Theraulaz G, Wahab MA, Cuong-Le T. Termite life cycle optimizer. Expert Systems with Applications. 2023 Mar 1;213:119211. [CrossRef]
- Jiang, F.; Li, L.; Tang, Y.M.; Zhang, H.L.; Liu, X.P. A Facility Layout Algorithm for Logistics Scenarios Driven by Transport Lines. Appl. Sci. 2023, 13(12), 7215. [CrossRef]
- Geng, Q.Q.; Jia, Y.H.; Wu, J.; Sun, D.Y. Research on layout optimization of logistics parks considering impact of carbon emissions. J. Beijing Jiaotong. Univ. 2023, 47(01), 115-125.
- Hu, X.; Chuang, Y.F. E-commerce warehouse layout optimization: systematic layout planning using a genetic algorithm. Electron. Comm. Res. 2023, 23(1), 97-114. [CrossRef]
- Nanda SJ, Panda G. A survey on nature inspired metaheuristic algorithms for partitional clustering. Swarm and Evolutionary computation. 2014 Jun 1;16:1-8. [CrossRef]
- Amaral, A.R.S. On the exact solution of a facility layout problem. Eur. J. Oper. Res. 2006, 173(2), 508-518. [CrossRef]
- Wang, N.A. Planning and layout of intelligent logistics park based on improved genetic algorithm. Mobi. Informa. Syst. 2022, 2022. [CrossRef]
- Eswaran, M.; Inkulu, A.K.; Tamilarasan, K.; Bahubalendruni, M.V.A.R.; Jaideep, R. Faris, M.S.; Jacob, N. Optimal layout planning for human robot collaborative assembly systems and visualization through immersive technologies. Expert Syst. Appl.2024, 241, 122465. [CrossRef]
- Zhang, M.Y.; Zhu, Y.J.; Zhang, X.Y.L. Layout optimization of forging plant based on systematic layout planning and mixed algorithm. Sci. Technol. Eng. 2024, 24(01), 170-176.
- Xue, J.; Shen, B. Dung beetle optimizer: A new meta-heuristic algorithm for global optimization. J. Supercomput. 2023, 79(7), 7305-7336. [CrossRef]
- Zhu, F.; Li, G.; Tang, H.; Li, Y.B.; Lv, X.M.; Wang, X. Dung beetle optimization algorithm based on quantum computing and multi-strategy fusion for solving engineering problems. Expert Syst. Appl. 2024, 236, 121219. [CrossRef]
- Li, Y.; Sun, K.; Yao, Q.; Wang, L. A dual-optimization wind speed forecasting model based on deep learning and improved dung beetle optimization algorithm. Energy. 2024, 286, 129604. [CrossRef]
- Rajakumar R, Dhavachelvan P, Vengattaraman T. A survey on nature inspired meta-heuristic algorithms with its domain specifications. In2016 international conference on communication and electronics systems (ICCES) 2016 Oct 21 (pp. 1-6). IEEE.
- YiFei L, Minh HL, Khatir S, Sang-To T, Cuong-Le T, MaoSen C, Wahab MA. Structure damage identification in dams using sparse polynomial chaos expansion combined with hybrid K-means clustering optimizer and genetic algorithm. Engineering Structures. 2023 May 15;283:115891. [CrossRef]
- De Jong K. Learning with genetic algorithms: An overview. Machine learning. 1988 Oct;3:121-38. [CrossRef]
- Storn R, Price K. Differential evolution–a simple and efficient heuristic for global optimization over continuous spaces. Journal of global optimization. 1997 Dec;11:341-59. [CrossRef]
- Juste KA, Kita H, Tanaka E, Hasegawa J. An evolutionary programming solution to the unit commitment problem. IEEE Transactions on Power systems. 1999 Nov;14(4):1452-9. [CrossRef]
- Koza JR. On the programming of computers by means of natural selection. Genetic programming. 1992.
- Beyer HG, Schwefel HP. Evolution strategies–a comprehensive introduction. Natural computing. 2002 Mar;1:3-52. [CrossRef]
- Simon D. Biogeography-based optimization. IEEE transactions on evolutionary computation. 2008 Mar 21;12(6):702-13. [CrossRef]
- Kirkpatrick S, Gelatt Jr CD, Vecchi MP. Optimization by simulated annealing. science. 1983 May 13;220(4598):671-80. [CrossRef]
- Zhao W, Wang L, Zhang Z. Atom search optimization and its application to solve a hydrogeologic parameter estimation problem. Knowledge-Based Systems. 2019 Jan 1;163:283-304. [CrossRef]
- Zhao W, Wang L, Zhang Z. Atom search optimization and its application to solve a hydrogeologic parameter estimation problem. Knowledge-Based Systems. 2019 Jan 1;163:283-304. [CrossRef]
- Karami H, Anaraki MV, Farzin S, Mirjalili S. Flow direction algorithm (FDA): a novel optimization approach for solving optimization problems. Computers & Industrial Engineering. 2021 Jun 1;156:107224. [CrossRef]
- Hashim FA, Mostafa RR, Hussien AG, Mirjalili S, Sallam KM. Fick’s Law Algorithm: A physical law-based algorithm for numerical optimization. Knowledge-Based Systems. 2023 Jan 25;260:110146. [CrossRef]
- Rashedi E, Nezamabadi-Pour H, Saryazdi S. GSA: a gravitational search algorithm. Information sciences. 2009 Jun 13;179(13):2232-48. [CrossRef]
- Pereira JL, Francisco MB, Diniz CA, Oliver GA, Cunha Jr SS, Gomes GF. Lichtenberg algorithm: A novel hybrid physics-based meta-heuristic for global optimization. Expert Systems with Applications. 2021 May 15;170:114522. [CrossRef]
- Abdel-Basset M, Mohamed R, Sallam KM, Chakrabortty RK. Light spectrum optimizer: a novel physics-inspired metaheuristic optimization algorithm. Mathematics. 2022 Sep 23;10(19):3466. [CrossRef]
- Mirjalili S, Mirjalili SM, Hatamlou A. Multi-verse optimizer: a nature-inspired algorithm for global optimization. Neural Computing and Applications. 2016 Feb;27:495-513. [CrossRef]
- Wei Z, Huang C, Wang X, Han T, Li Y. Nuclear reaction optimization: A novel and powerful physics-based algorithm for global optimization. IEEE Access. 2019 May 22;7:66084-109. [CrossRef]
- Abdel-Basset M, Mohamed R, Azeem SA, Jameel M, Abouhawwash M. Kepler optimization algorithm: A new metaheuristic algorithm inspired by Kepler’s laws of planetary motion. Knowledge-based systems. 2023 May 23;268:110454. [CrossRef]
- Deng L, Liu S. Snow ablation optimizer: A novel metaheuristic technique for numerical optimization and engineering design. Expert Systems with Applications. 2023 Sep 1;225:120069. [CrossRef]
- Rao RV, Savsani VJ, Vakharia DP. Teaching–learning-based optimization: a novel method for constrained mechanical design optimization problems. Computer-aided design. 2011 Mar 1;43(3):303-15. [CrossRef]
- Xu Y, Peng Y, Su X, Yang Z, Ding C, Yang X. Improving teaching–learning-based-optimization algorithm by a distance-fitness learning strategy. Knowledge-Based Systems. 2022 Dec 5;257:108271. [CrossRef]
- Kumar S, Tejani GG, Pholdee N, Bureerat S, Jangir P. Multi-objective teaching-learning-based optimization for structure optimization. Smart Science. 2022 Jan 2;10(1):56-67. [CrossRef]
- Kaveh A, Mahdavi VR. Colliding bodies optimization: a novel meta-heuristic method. Computers & Structures. 2014 Jul 15;139:18-27. [CrossRef]
- Trojovská E, Dehghani M. A new human-based metahurestic optimization method based on mimicking cooking training. Scientific Reports. 2022 Sep 1;12(1):14861. [CrossRef]
- Zhang Q, Wang R, Yang J, Ding K, Li Y, Hu J. Collective decision optimization algorithm: A new heuristic optimization method. Neurocomputing. 2017 Jan 19;221:123-37. [CrossRef]
- Faramarzi A, Heidarinejad M, Stephens B, Mirjalili S. Equilibrium optimizer: A novel optimization algorithm. Knowledge-based systems. 2020 Mar 5;191:105190. [CrossRef]
- Mohamed AW, Hadi AA, Mohamed AK. Gaining-sharing knowledge based algorithm for solving optimization problems: a novel nature-inspired algorithm. International Journal of Machine Learning and Cybernetics. 2020 Jul;11(7):1501-29. [CrossRef]
- Kashan AH. League championship algorithm: a new algorithm for numerical function optimization. In2009 international conference of soft computing and pattern recognition 2009 Dec 4 (pp. 43-48). IEEE.
- Faridmehr I, Nehdi ML, Davoudkhani IF, Poolad A. Mountaineering team-based optimization: A novel human-based metaheuristic algorithm. Mathematics. 2023 Mar 6;11(5):1273. [CrossRef]
- Moosavi SH, Bardsiri VK. Poor and rich optimization algorithm: A new human-based and multi populations algorithm. Engineering applications of artificial intelligence. 2019 Nov 1;86:165-81. [CrossRef]
- Naik A, Satapathy SC. Past present future: a new human-based algorithm for stochastic optimization. Soft Computing. 2021 Oct;25(20):12915-76. [CrossRef]
- Veysari EF. A new optimization algorithm inspired by the quest for the evolution of human society: human felicity algorithm. Expert Systems with Applications. 2022 May 1;193:116468. [CrossRef]
- Abualigah L, Yousri D, Abd Elaziz M, Ewees AA, Al-Qaness MA, Gandomi AH. Aquila optimizer: a novel meta-heuristic optimization algorithm. Computers & Industrial Engineering. 2021 Jul 1;157:107250. [CrossRef]
- Wang L, Cao Q, Zhang Z, Mirjalili S, Zhao W. Artificial rabbits optimization: A new bio-inspired meta-heuristic algorithm for solving engineering optimization problems. Engineering Applications of Artificial Intelligence. 2022 Sep 1;114:105082. [CrossRef]
- Abdel-Basset M, Mohamed R, Jameel M, Abouhawwash M. Nutcracker optimizer: A novel nature-inspired metaheuristic algorithm for global optimization and engineering design problems. Knowledge-Based Systems. 2023 Feb 28;262:110248. [CrossRef]
- Sang-To T, Le-Minh H, Wahab MA, Thanh CL. A new metaheuristic algorithm: Shrimp and Goby association search algorithm and its application for damage identification in large-scale and complex structures. Advances in Engineering Software. 2023 Feb 1;176:103363. [CrossRef]
- Hashim FA, Hussien AG. Snake Optimizer: A novel meta-heuristic optimization algorithm. Knowledge-Based Systems. 2022 Apr 22;242:108320. [CrossRef]
- Lim, J.; Kim, S. Evaluation of CO2 emission reduction effect using in-situ production of precast concrete components. J. Asian Archit. Build. Eng. 2020, 19, 176–186. [CrossRef]
- Lim, J.; Kim, S.; Kim, J.J. Dynamic simulation model for estimating in-situ production quantity of PC members. Int. J. Civ. Eng. 2020, 18, 935–950. [CrossRef]
- Lee H, Lee C, Han H, Lee J. A Study on Development of Construction Standard Production Rates and Cost Analysis for Off-Site Construction (OSC)-Based PC Structure Construction Costs: Comparison with RC Method. Korean Journal of Construction Engineering and Management. 2024 Mar 31;25(2):56–68. [CrossRef]
- Park J, Choa S. A Study on Variation of Economic Value of Overseas Carbon Reduction Projects with Risk Factors. Korean Journal of Construction Engineering and Management. 2023 Nov 30;24(6):45–52. [CrossRef]
- Jiang X.H.; Chen, S.; Zhang, Y. Calculation method of total carbon emission and efficiency of logistics enterprises. Journal of Transp. Syst. Eng. Informa. Technol. 2022, 22(02), 313-321.
- Chen, X.R.; Wu, L.F. Yang, X.Z. Fractional order PID parameter tuning based on improved sparrow search algorithm. Contro.Decis. 2024, 39(04),1177-1184.
- Zhang, C.; Liang, Y.; Tavares, A.; Wang, L.D. Gomes, T.; Pinto, S. An Improved Public Key Cryptographic Algorithm Based on Chebyshev Polynomials and RSA. Symmetry, 2024, 16(3), 263. [CrossRef]
- Pan, G.; Xu, Y. Chaotic glowworm swarm optimization algorithm based on Gauss mutation. Proceedings of the 2016 12th International Conference on Natural Computation, Changsha, China, 30, 11, 2016.
- Chen, Y.; Li, X.; Zhao, S. A Novel Photovoltaic Power Prediction Method Based on a Long Short-Term Memory Network Optimized by an Improved Sparrow Search Algorithm. Electronics. 2024, 13(5). 993. [CrossRef]
- Kim S, Oh J, Lim J. Development of an Algorithm for Crane Trajectory Distance Calculation for Erection of Precast Concrete Members. Buildings. 2023 Dec 20;14(1):11. [CrossRef]
- Yoon, S. 1997. Inventory Management Methods and Applications, Sigongsa, 25-29.
- Kim, K. Y. 2005. Inventory Management for Logistics Bases. Hyomin.

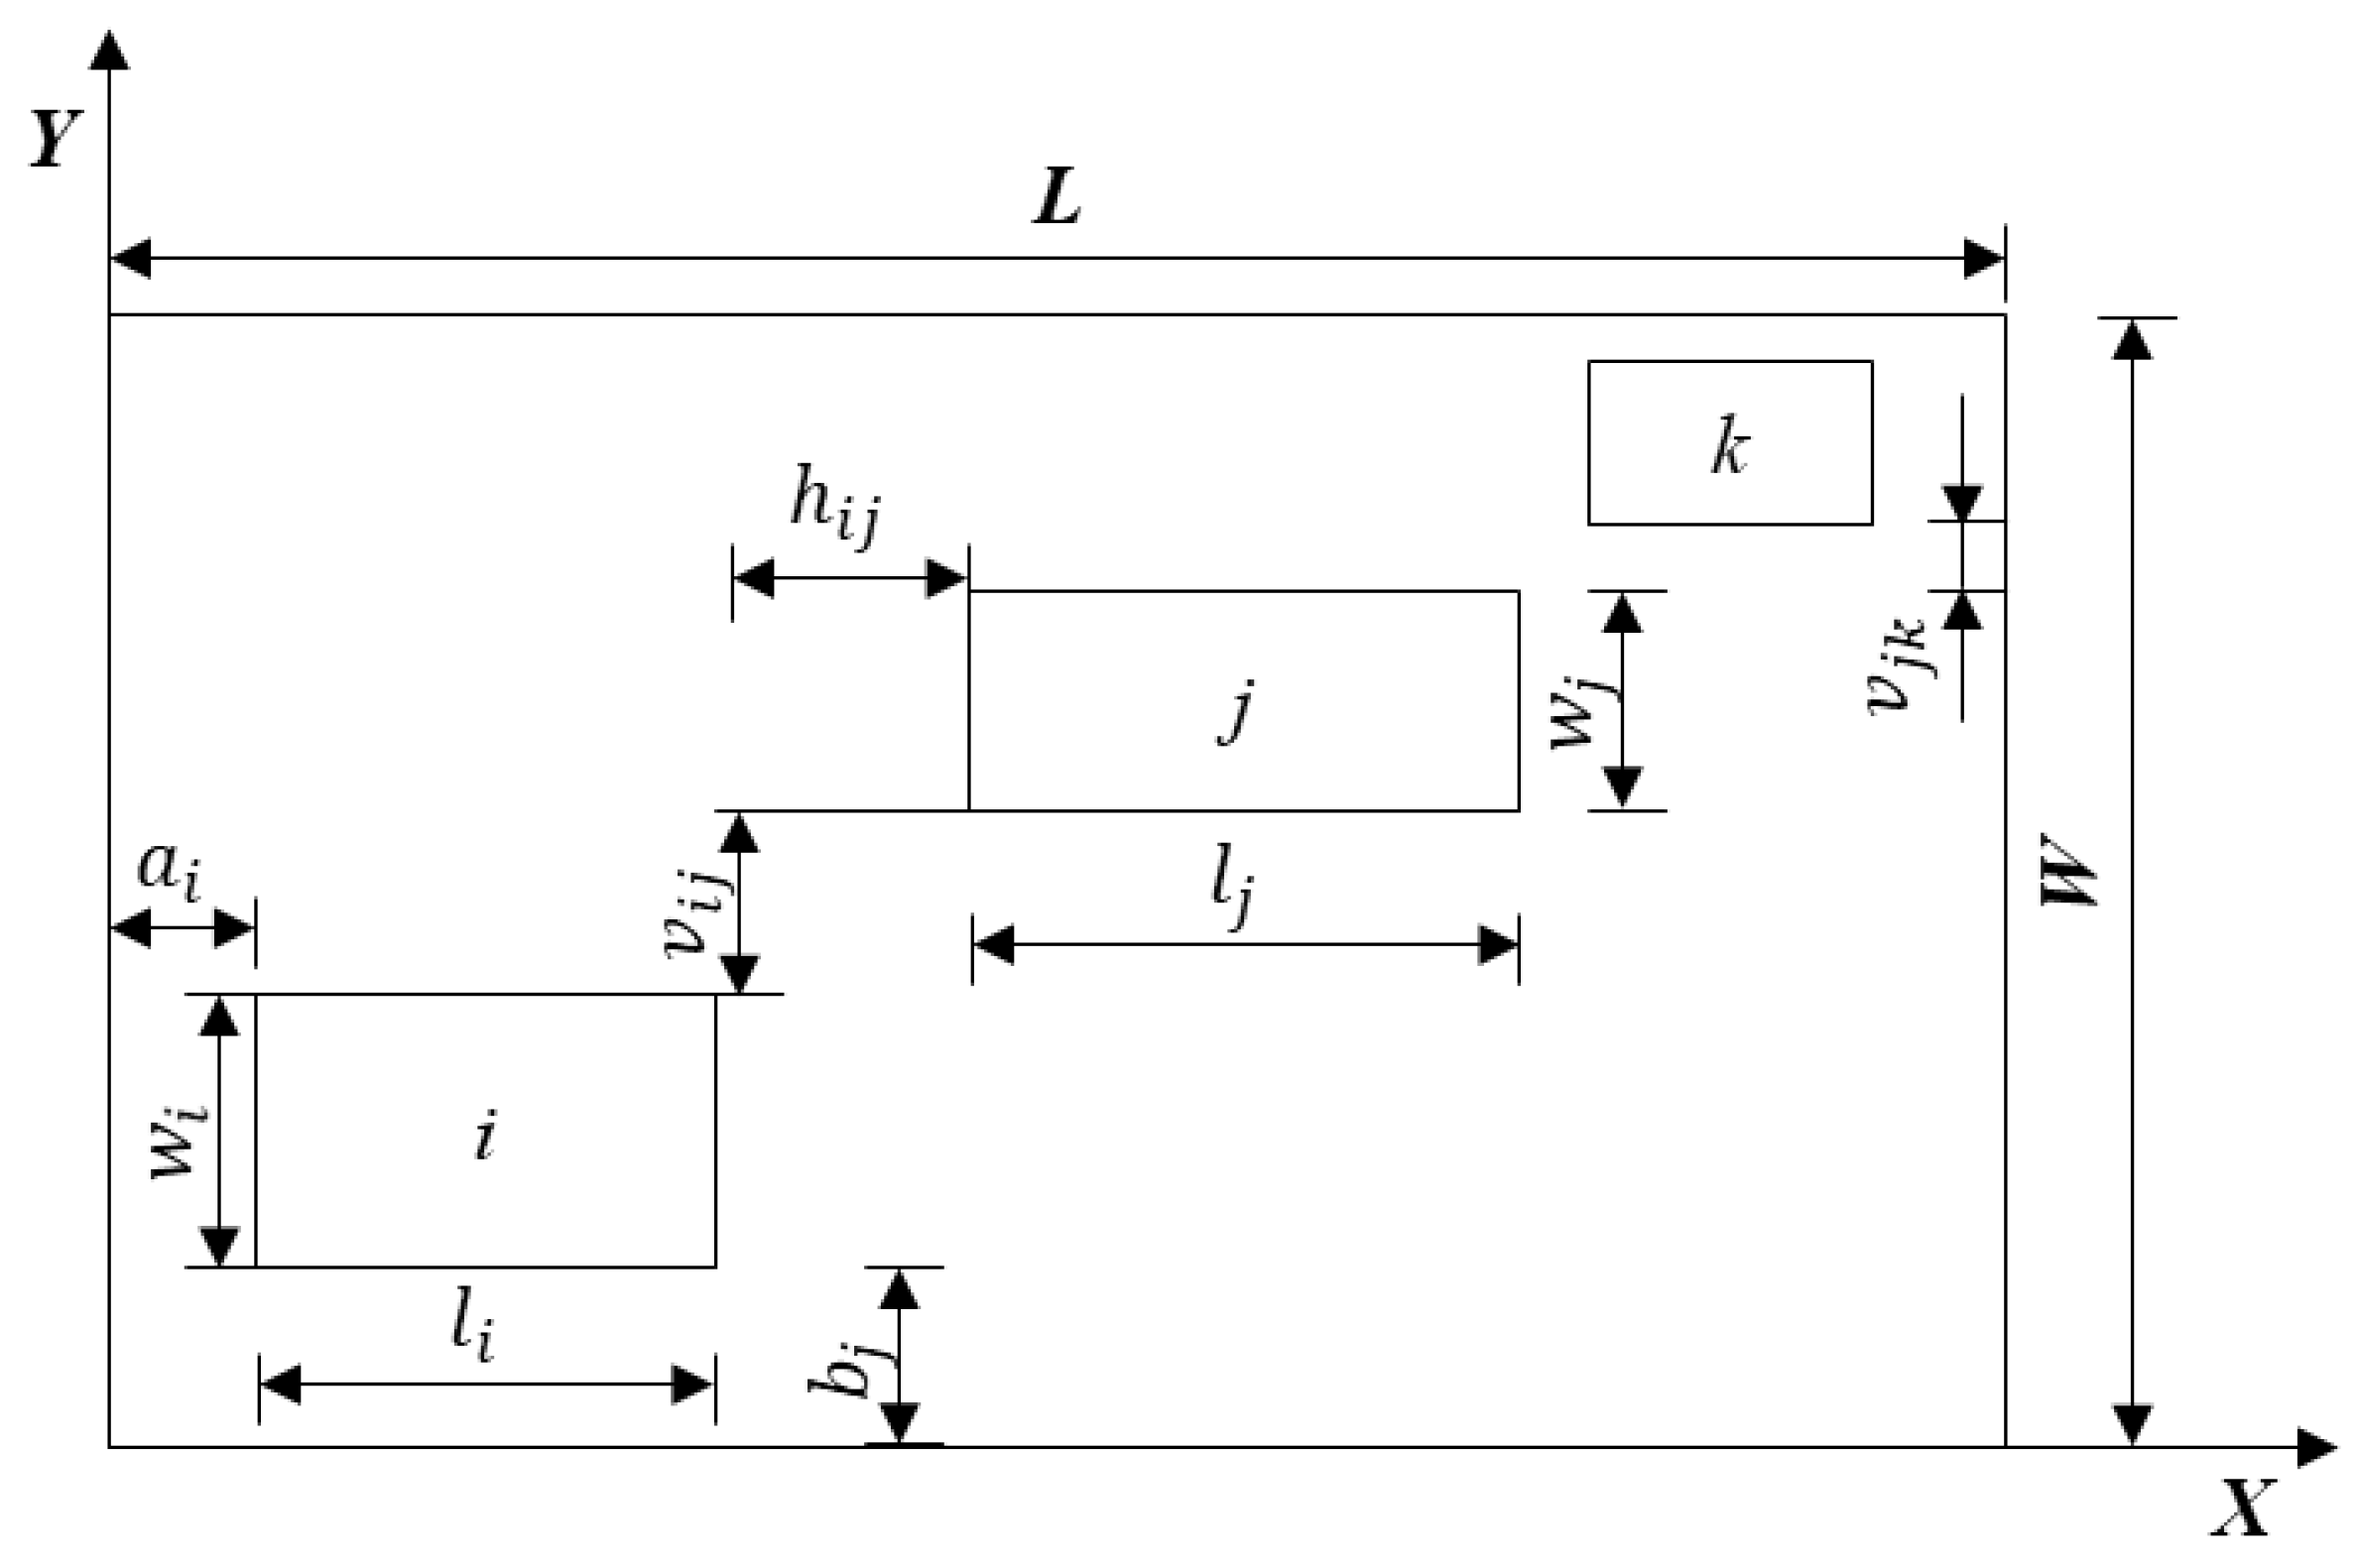
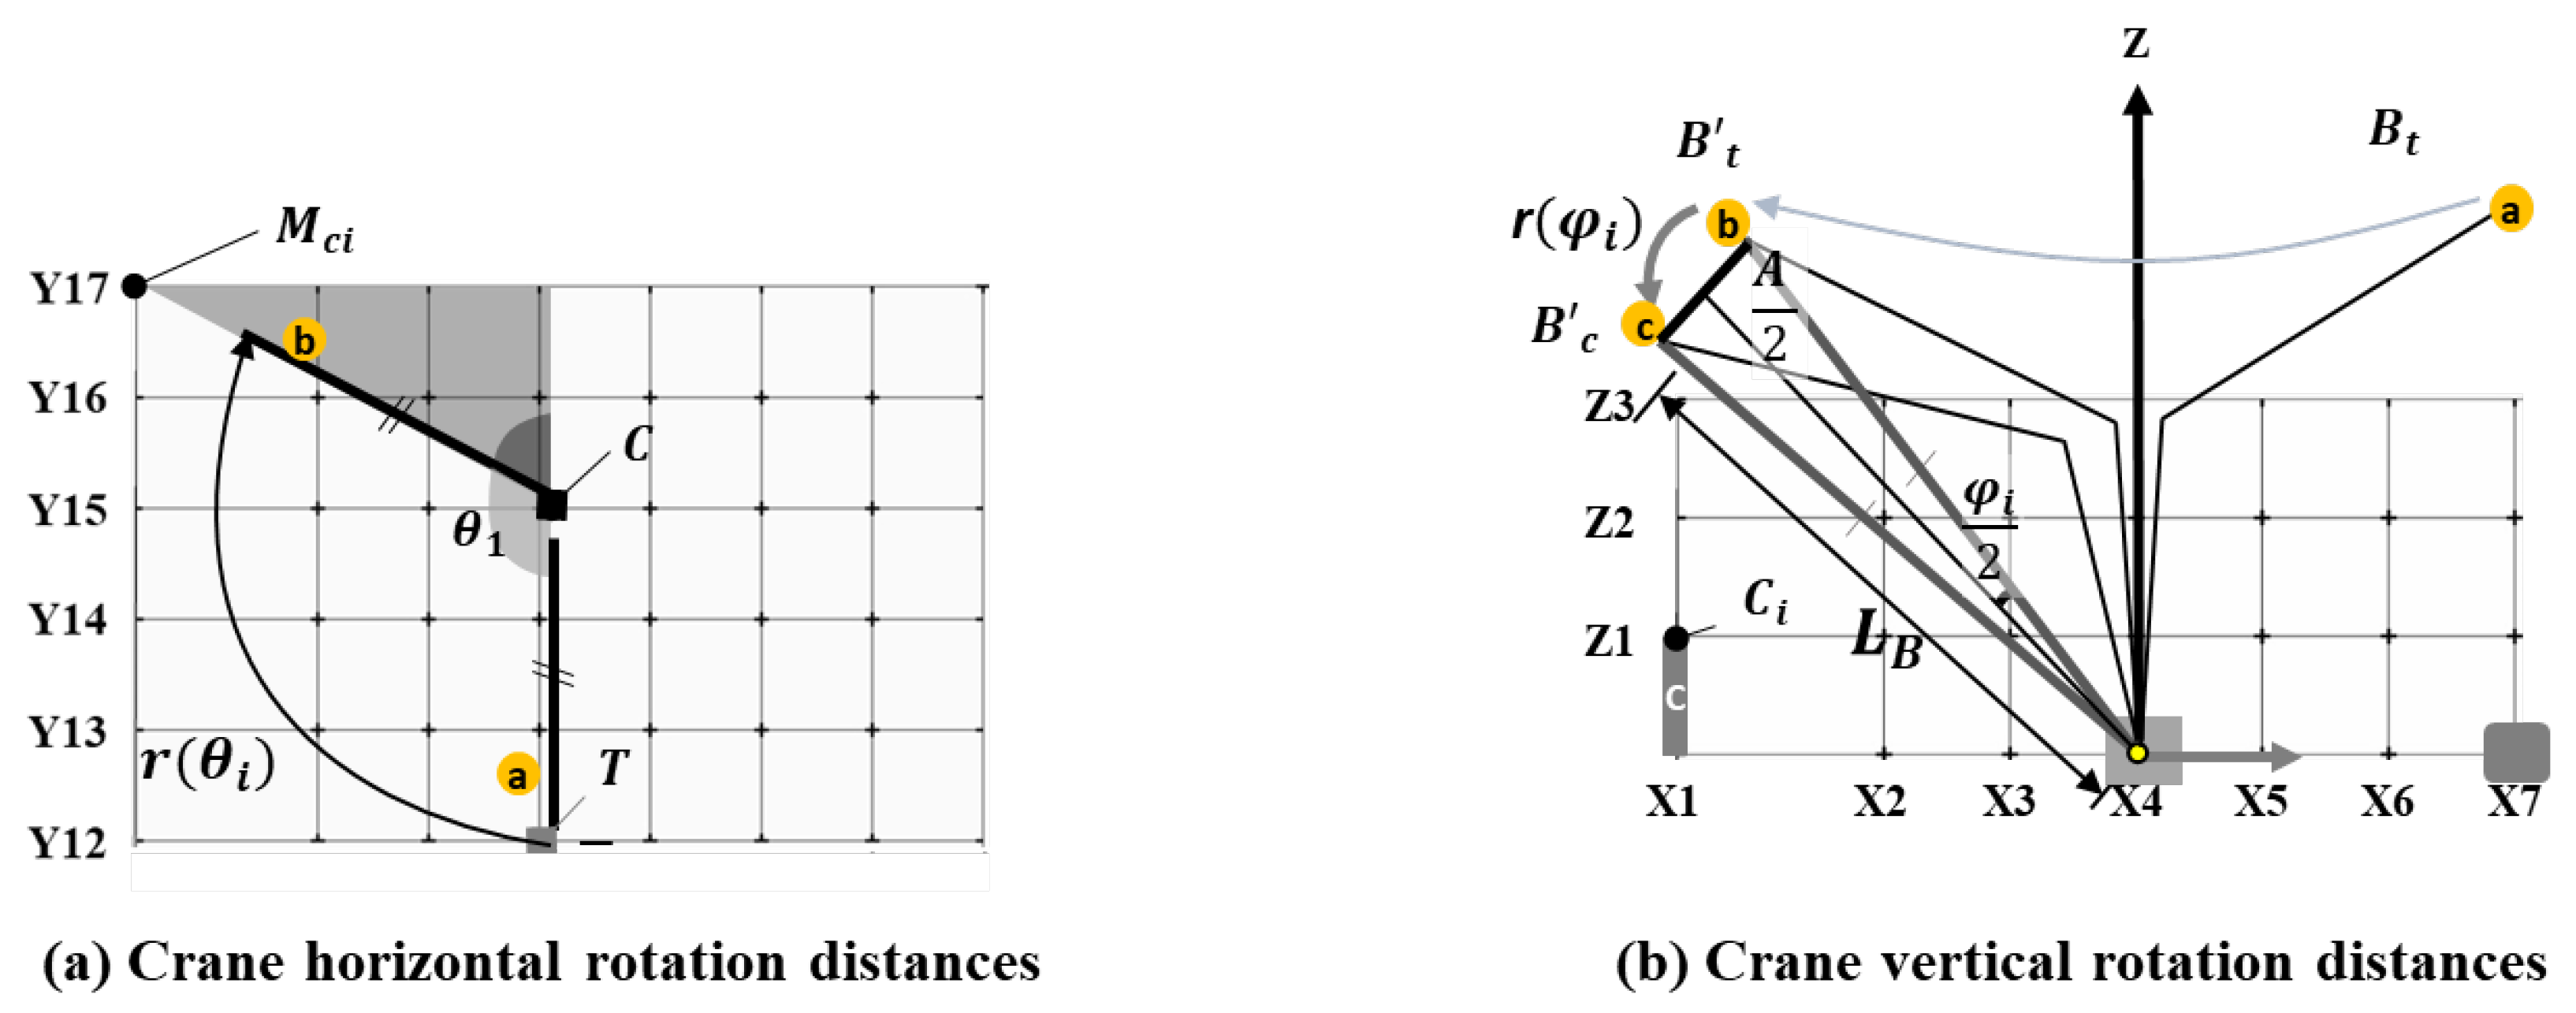

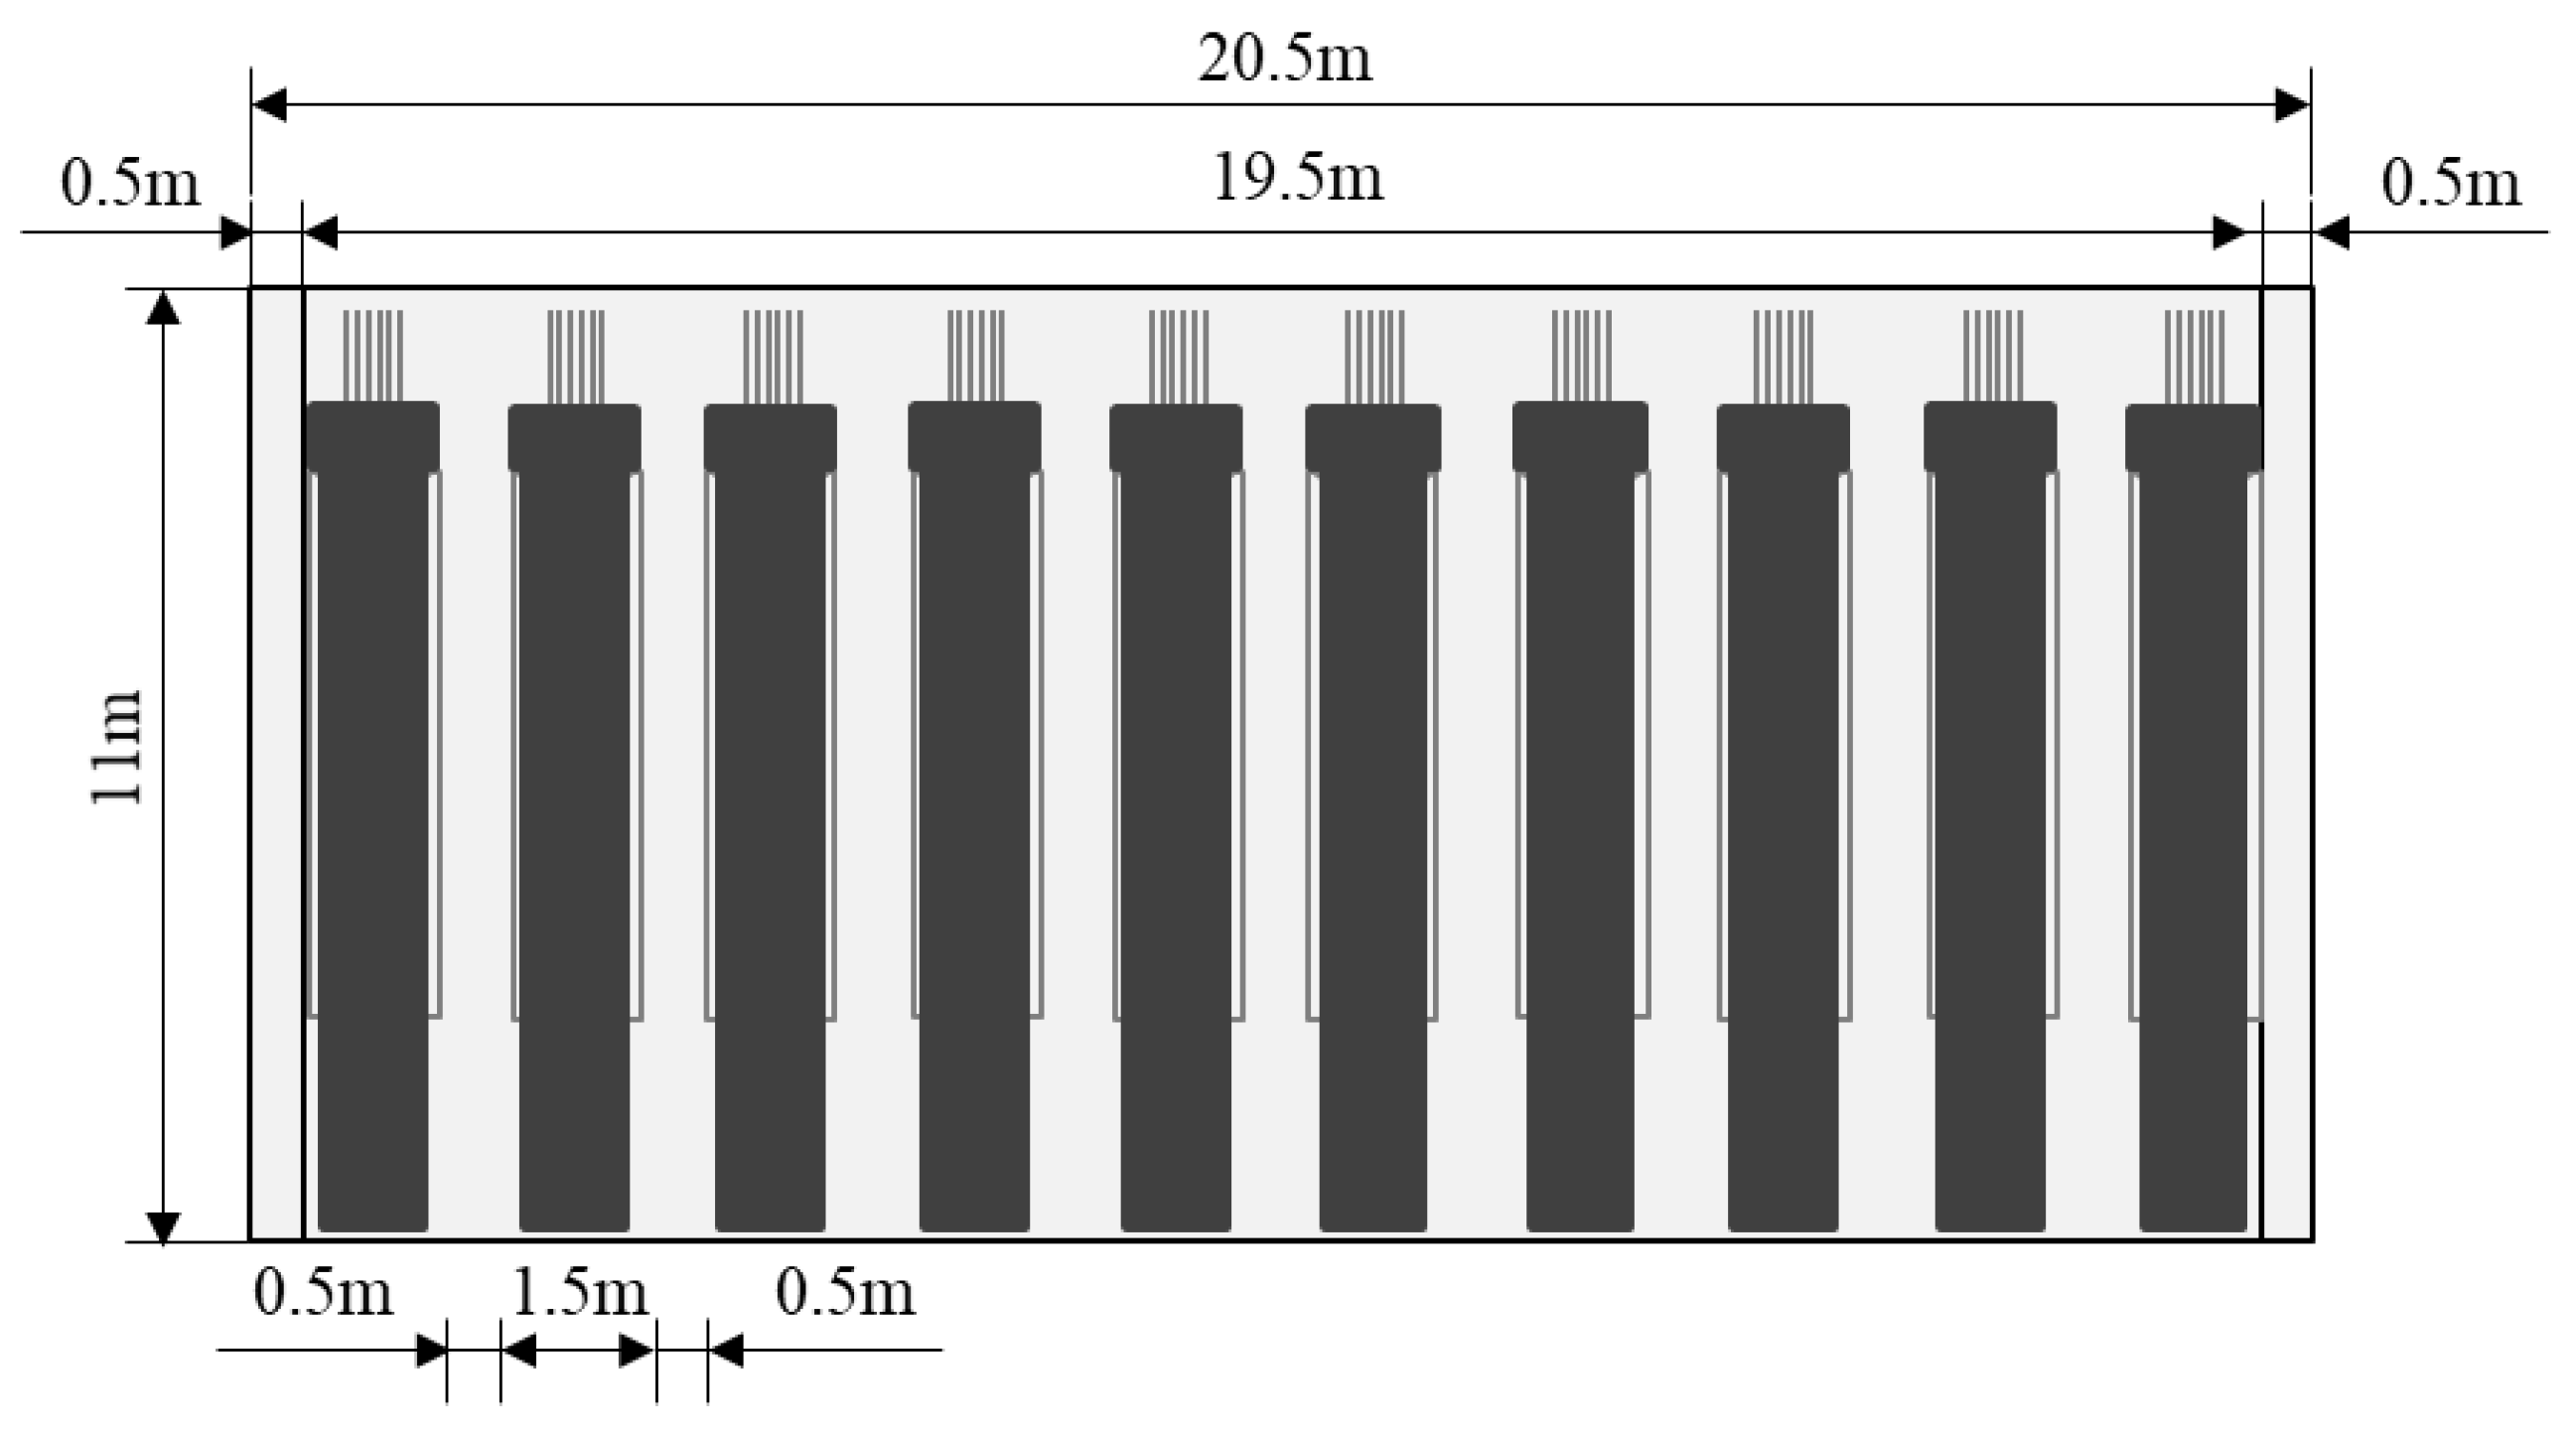
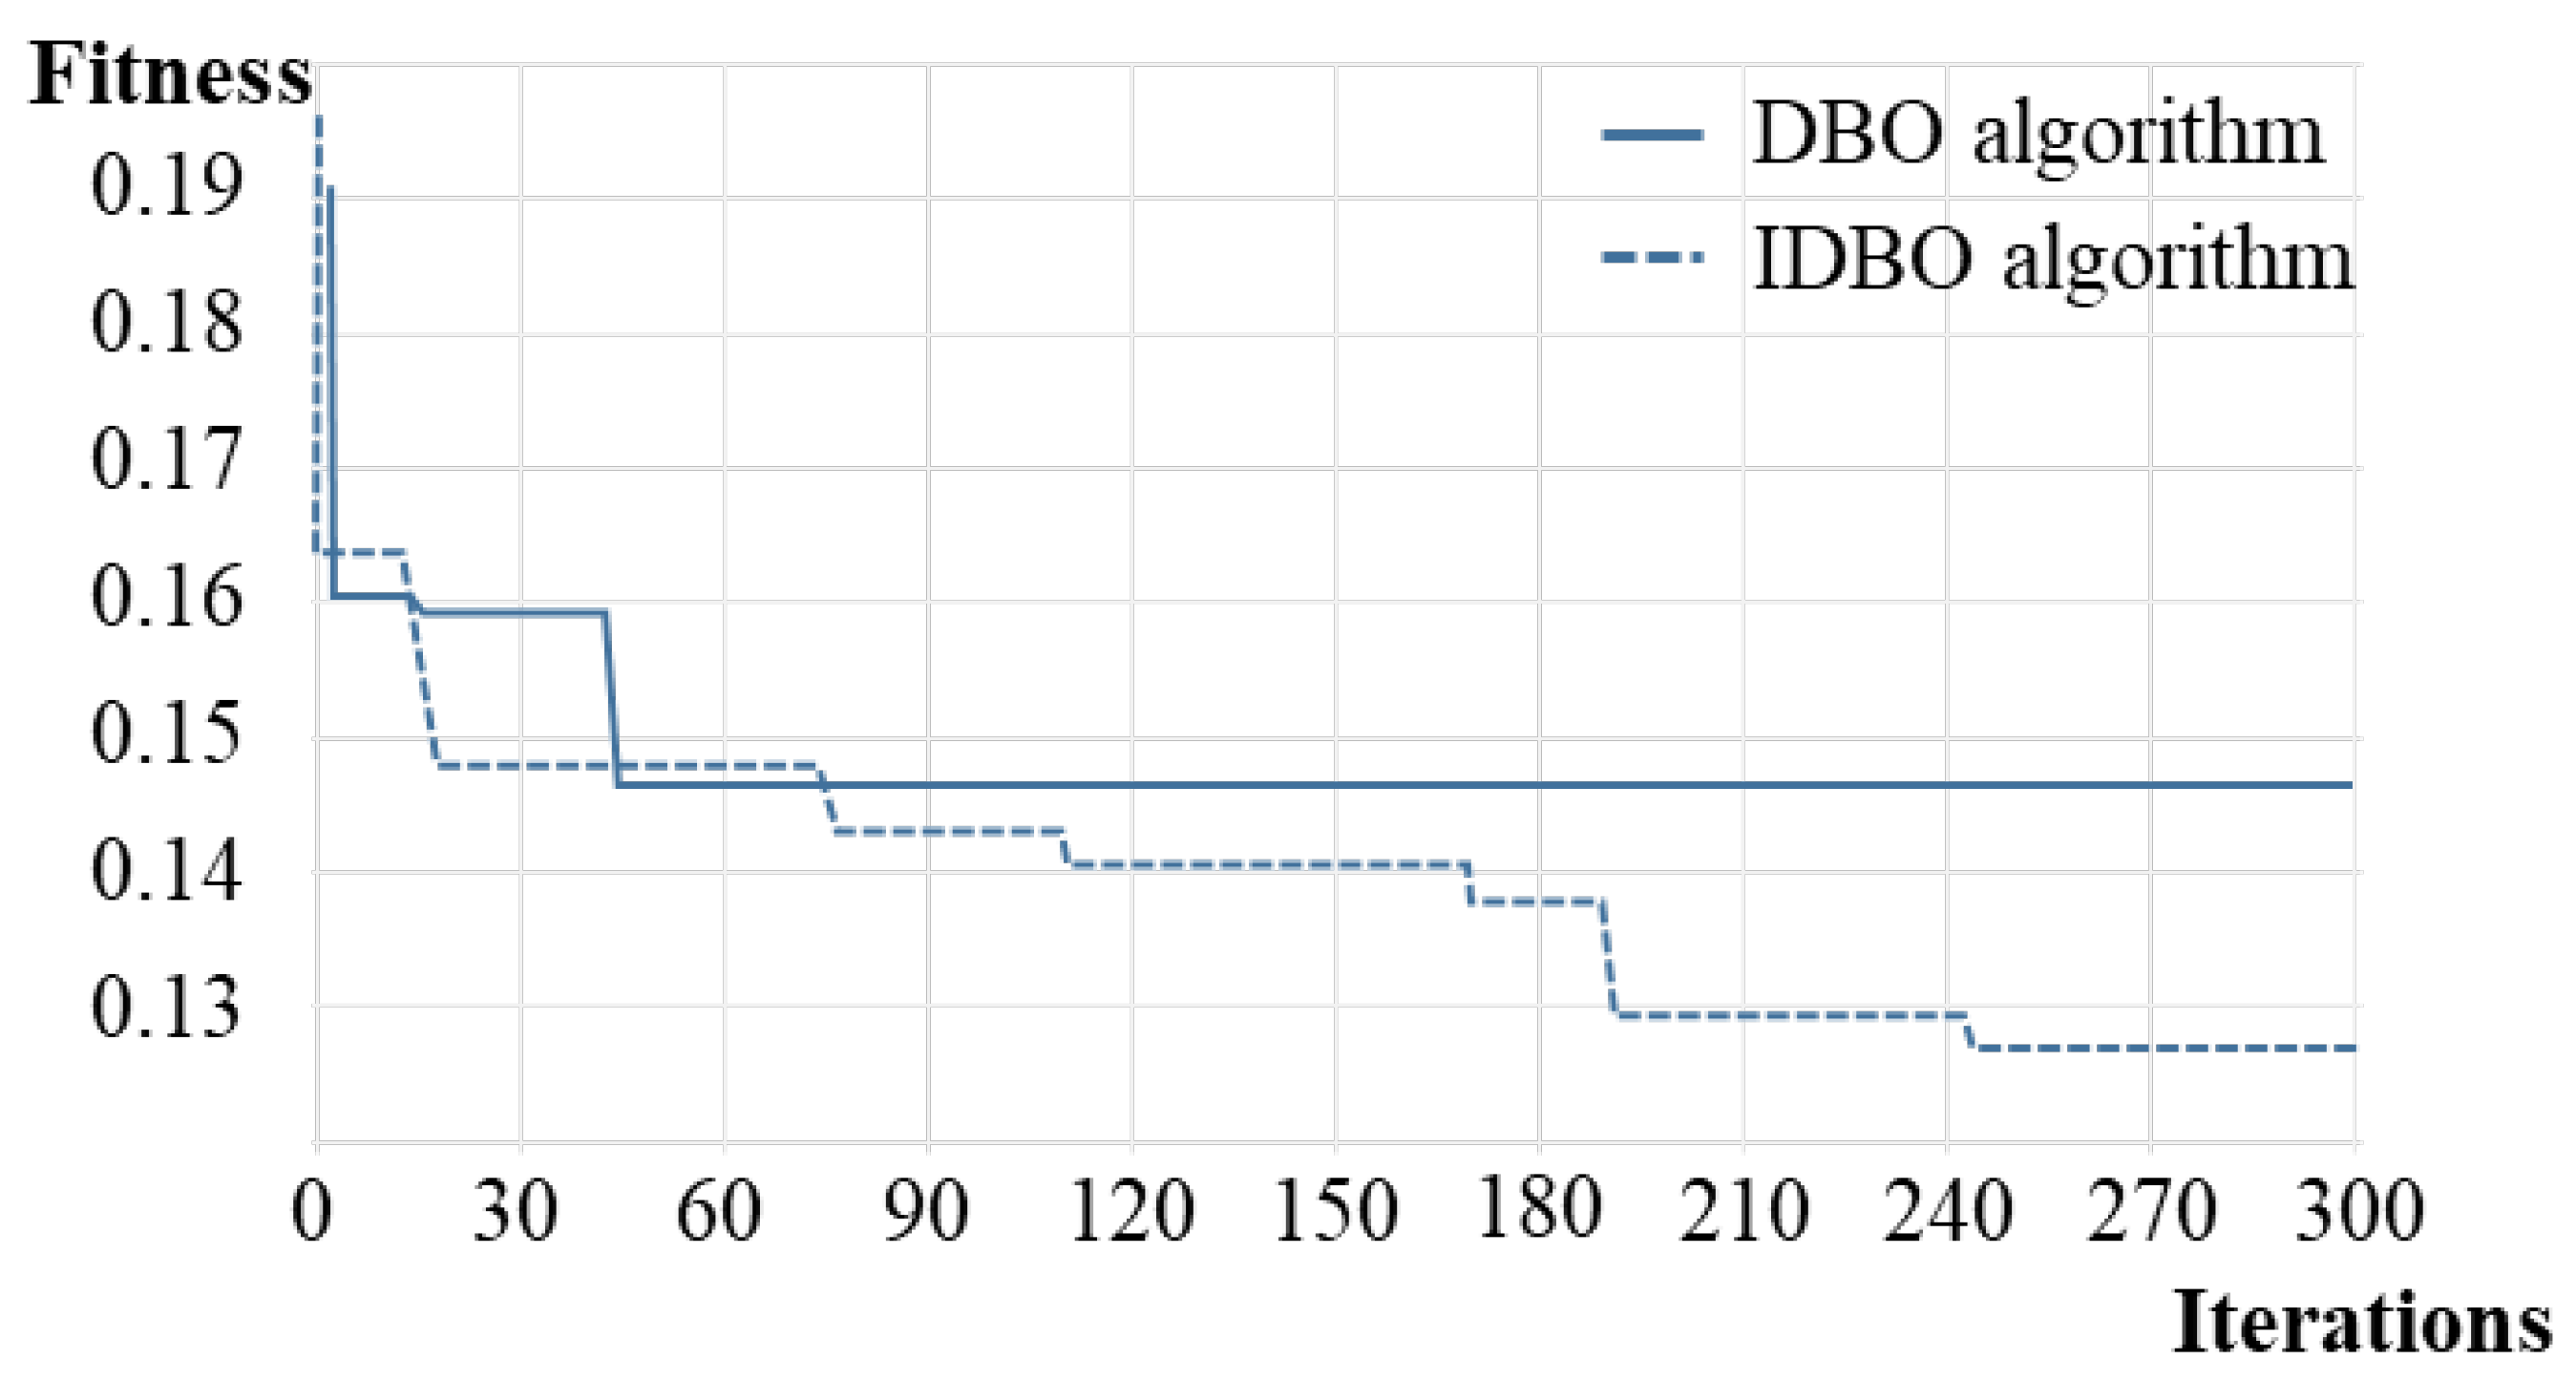
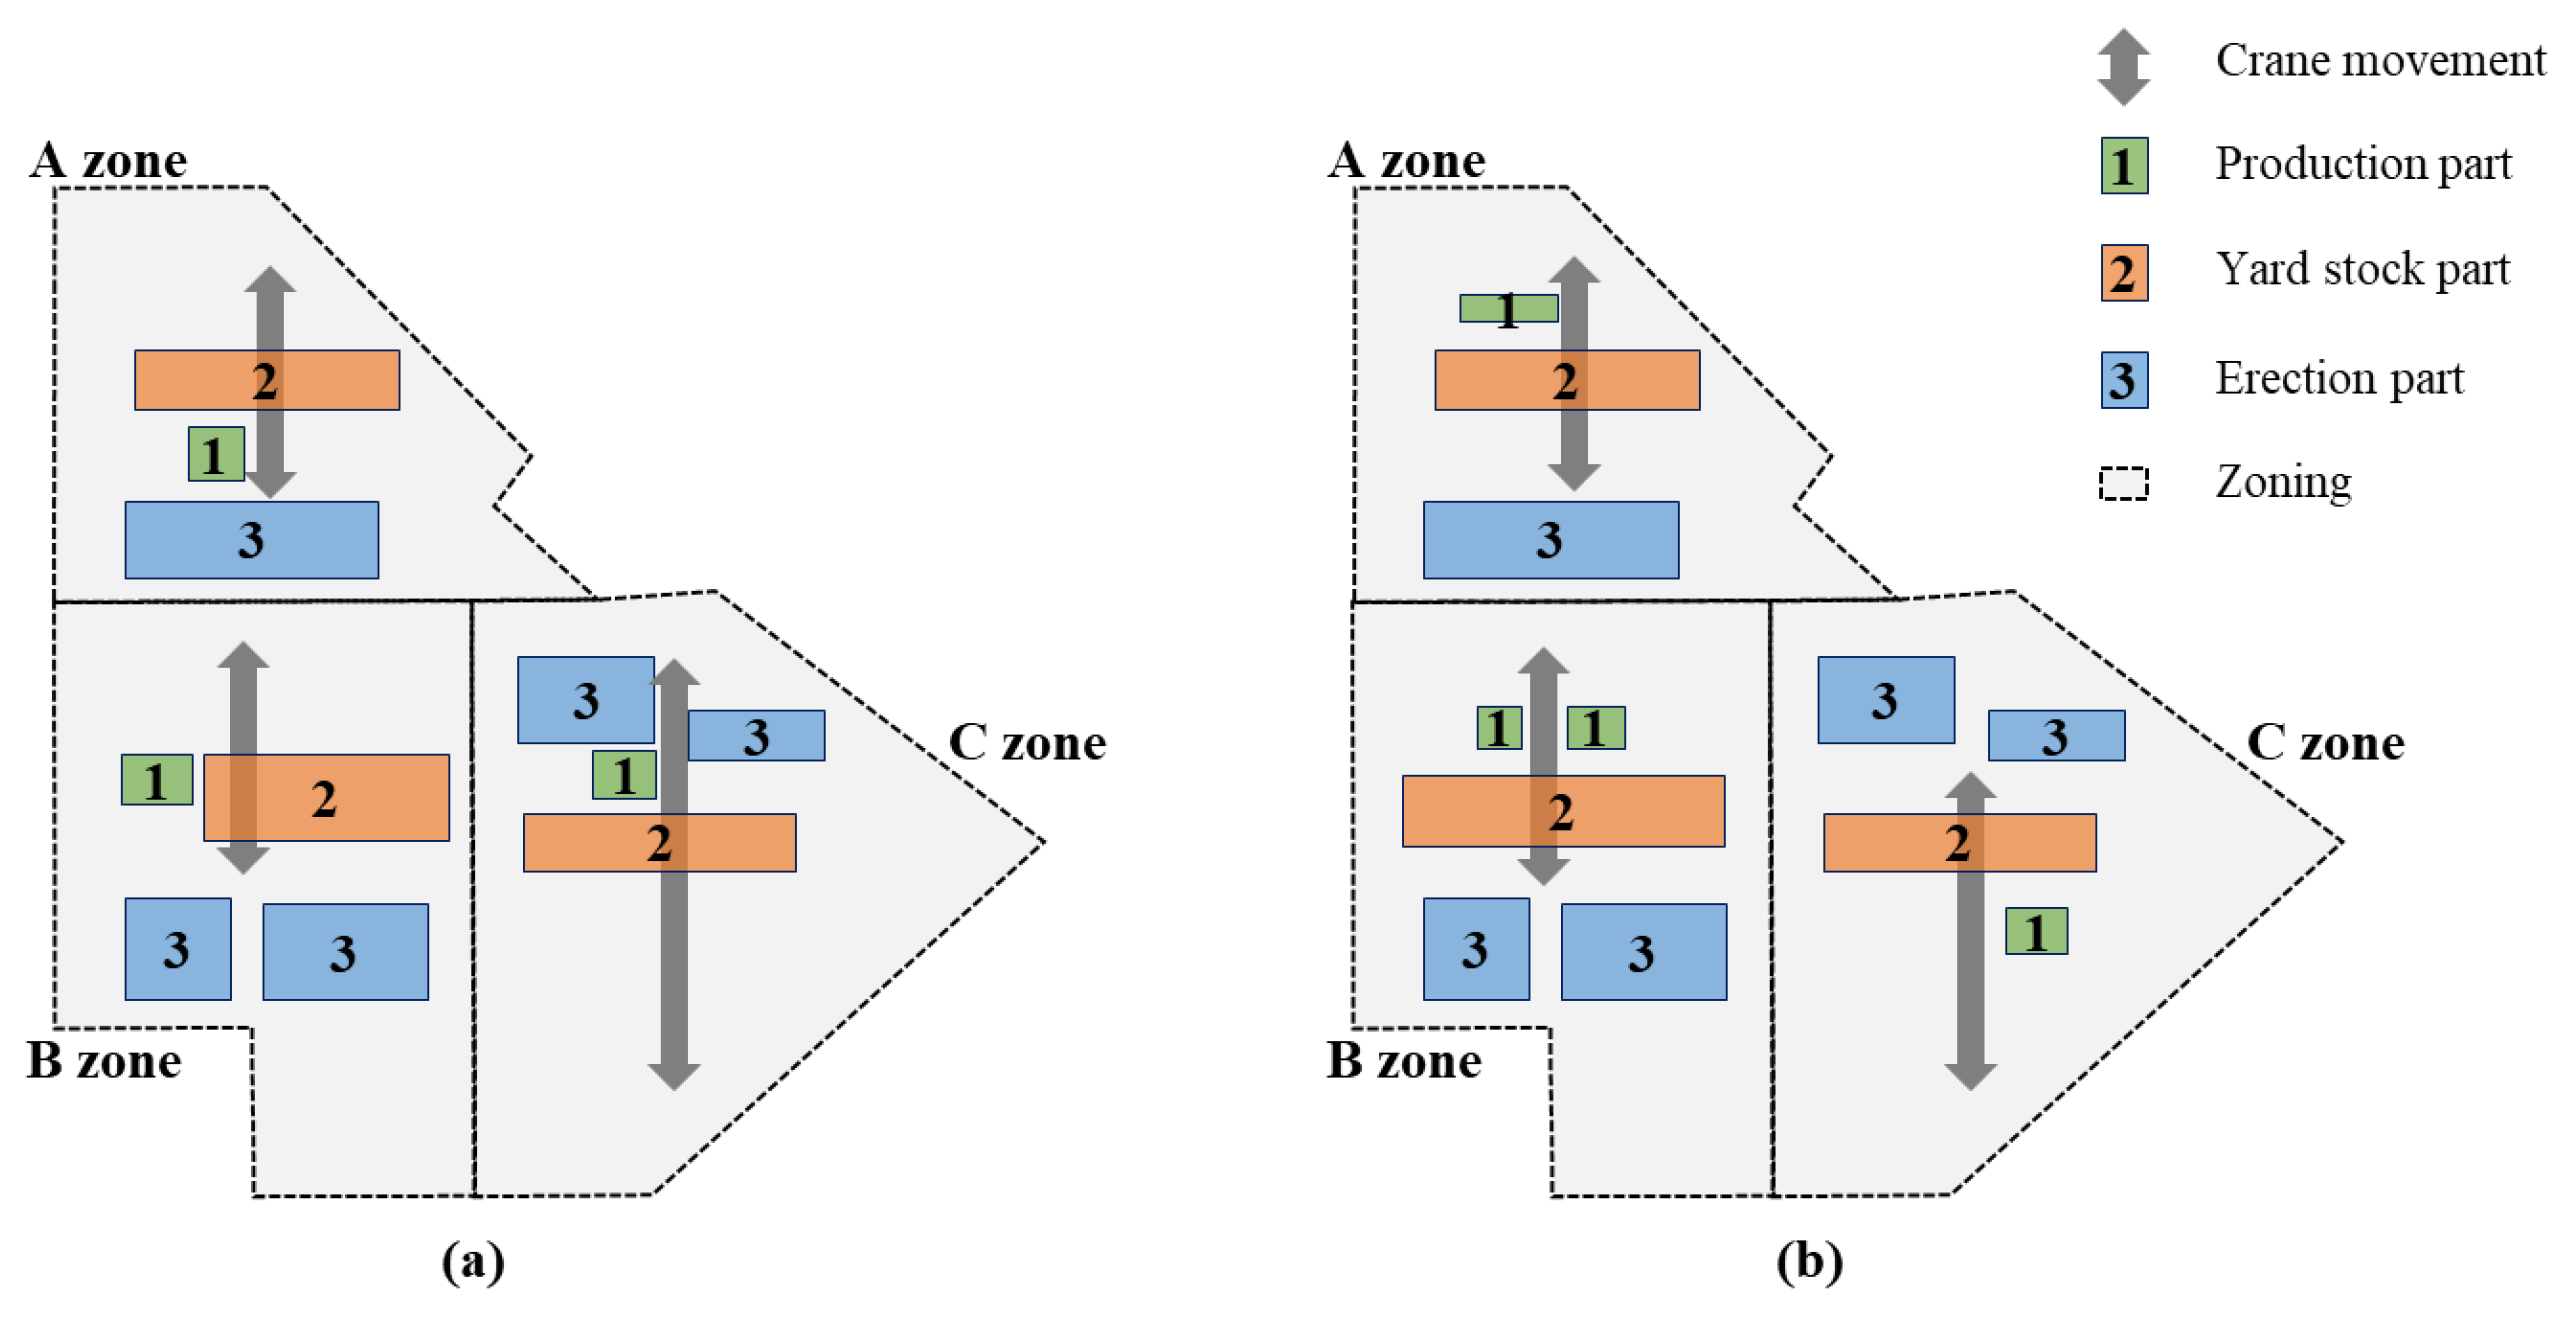
| No. | Assumption |
|---|---|
| 1 | The entire area and each stock yard are simplified as rectangles with boundaries parallel to the X and Y axes. |
| 2 | The orientation of the function zone is categorized into four types: up, down, left and right, and they cannot be placed at an inclined angle. |
| 3 | The sum of the areas of all stock yards must be less than the total site area. |
| 4 | A safe distance must be maintained between stock yards and PC components. |
| 5 | Transportation lines are restricted to extend only in the horizontal or vertical direction. |
| 6 | Transportation efficiency and unit costs are available for material transportation routes and each individual transportation line. |
| 7 | The entrances and exits within the logistics facility are not considered, but only the actual PC component loading and erection. |
| Description | Contents |
|---|---|
| Location | Seoul-si, Republic of Korea |
| Site area | 147,112m2 |
| Building area | 84,413m2 (491m long x 497m width) |
| Total floor area | 420,991m2 |
| No. of floors | B2 – 5F (6 buildings, floor height 8.7-12.2m) |
| Structure | Columns, Girders, Slabs: Precast concrete structure, Cores: Reinforced concrete structure One building: Steel reinforced concrete structure |
| No. | Assumption |
|---|---|
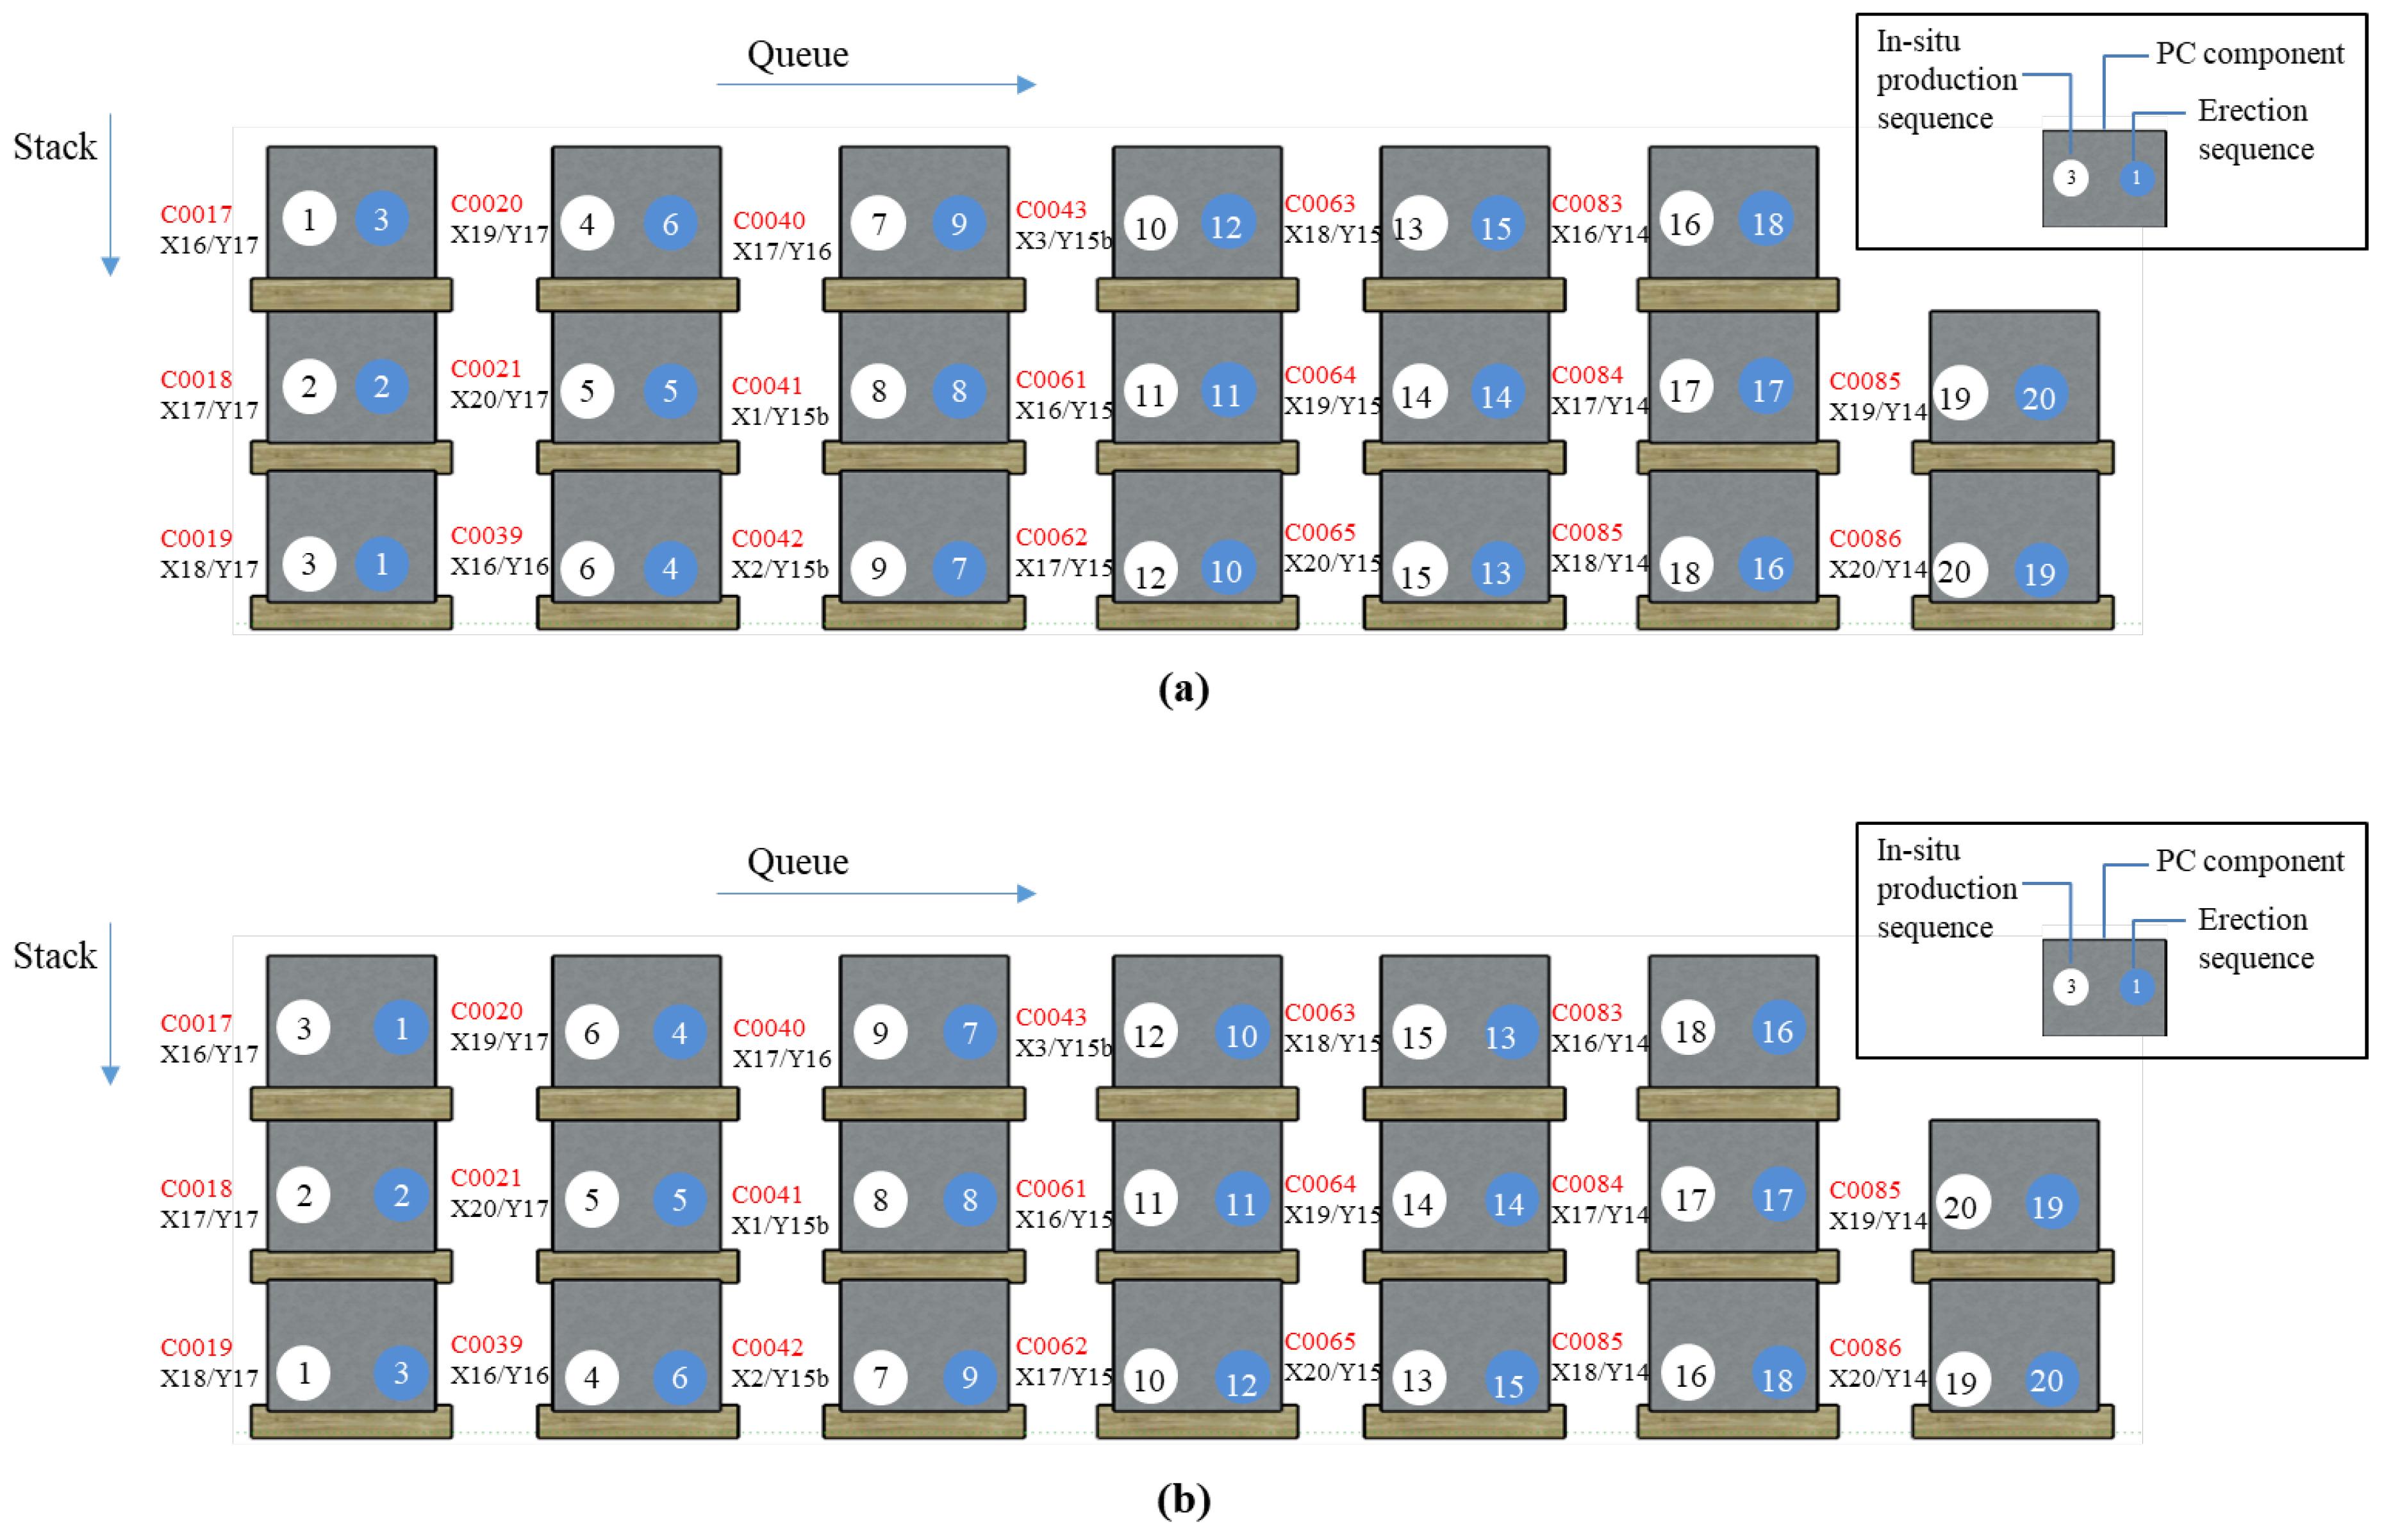
| 1 | In-situ produced components in each zone are basically stacked outside the building of each zone. |
| 2 | PC components are stacked within the crane working radius. |
| 3 | When the construction of the 5th floor is completed, the 5th floor is prioritized as the stock yard space. |
| 4 | In-situ produced components are based on the erection of steel plates at + GL (Ground Level) and then stacked in 3 columns and 2 beams. |
| 5 | As the load of the building is designed to be 2.4 tons/㎡, the PC components are stacked in 1-layer on the 2nd, 3rd, 4th, and 5th floors. |
| 6 | i-th storage yard is divided by zone and member. |
| 7 | i-th storage yard is based on sequential loading. |
| 8 | Each storage yard is based on stacking 30 components. |
| Area | M+1 | M+2 | M+3 | M+4 | M+5 | M+6 | M+7 | M+8 | M+9 | M+10 | M+11 | M+12 |
|---|---|---|---|---|---|---|---|---|---|---|---|---|
| Erection | 36603 | 35574 | 36058 | 37994 | 30976 | 15972 | 19844 | 12100 | 7502 | 2420 | 2420 | 2178 |
| Other work | 4350 | 4682 | 3025 | 3120 | 2925 | 2543 | 2432 | 2210 | 2100 | 1468 | 1055 | 831 |
| Production | 3220 | 3220 | 3220 | 2240 | 2240 | 1120 | 1120 | 1120 | 0 | 0 | 0 | 0 |
| Stock | 49581 | 49168 | 43454 | 37626 | 33421 | 29660 | 16915 | 10753 | 9702 | 9580 | 8883 | 0 |
| Layout plan | Adjacent correlation | Carbon dioxide emissions (T-CO2) |
|---|---|---|
| DBO optimization layout | 29.93 | 2,765 |
| IDBO optimization layout | 36.75 | 2,258 |
Disclaimer/Publisher’s Note: The statements, opinions and data contained in all publications are solely those of the individual author(s) and contributor(s) and not of MDPI and/or the editor(s). MDPI and/or the editor(s) disclaim responsibility for any injury to people or property resulting from any ideas, methods, instructions or products referred to in the content. |
© 2024 by the authors. Licensee MDPI, Basel, Switzerland. This article is an open access article distributed under the terms and conditions of the Creative Commons Attribution (CC BY) license (http://creativecommons.org/licenses/by/4.0/).


