Submitted:
12 September 2024
Posted:
12 September 2024
You are already at the latest version
Abstract
Keywords:
1. Introduction
2. Materials and Methods
2.1. Theoretical Approach
2.2. Data Extraction
2.3. Procedural Steps for Establishing Nutrient Signatures in Corn Kernels
2.3.1. Identifying the High-Yielding Corn Subpopulation
- Data Organization: Arrange the dataset by descending grain yield.
- Transformation Application: Implement the centered log-ratios (CLR) transformation on the six-element fractions of the simplex S5, namely CLRN, CLRP, CLRK, CLRCa, CLRMg, and CLRR5.
- Transformation Verification: Confirm that the total of the transformed fractions equals zero.
- Variance Ratio Calculation: Compute the log-centered variance ratio values for each CLRx.
- Cumulative Variance Function Derivation: Develop the cumulative variance ratio functions FCi for each CLRx.
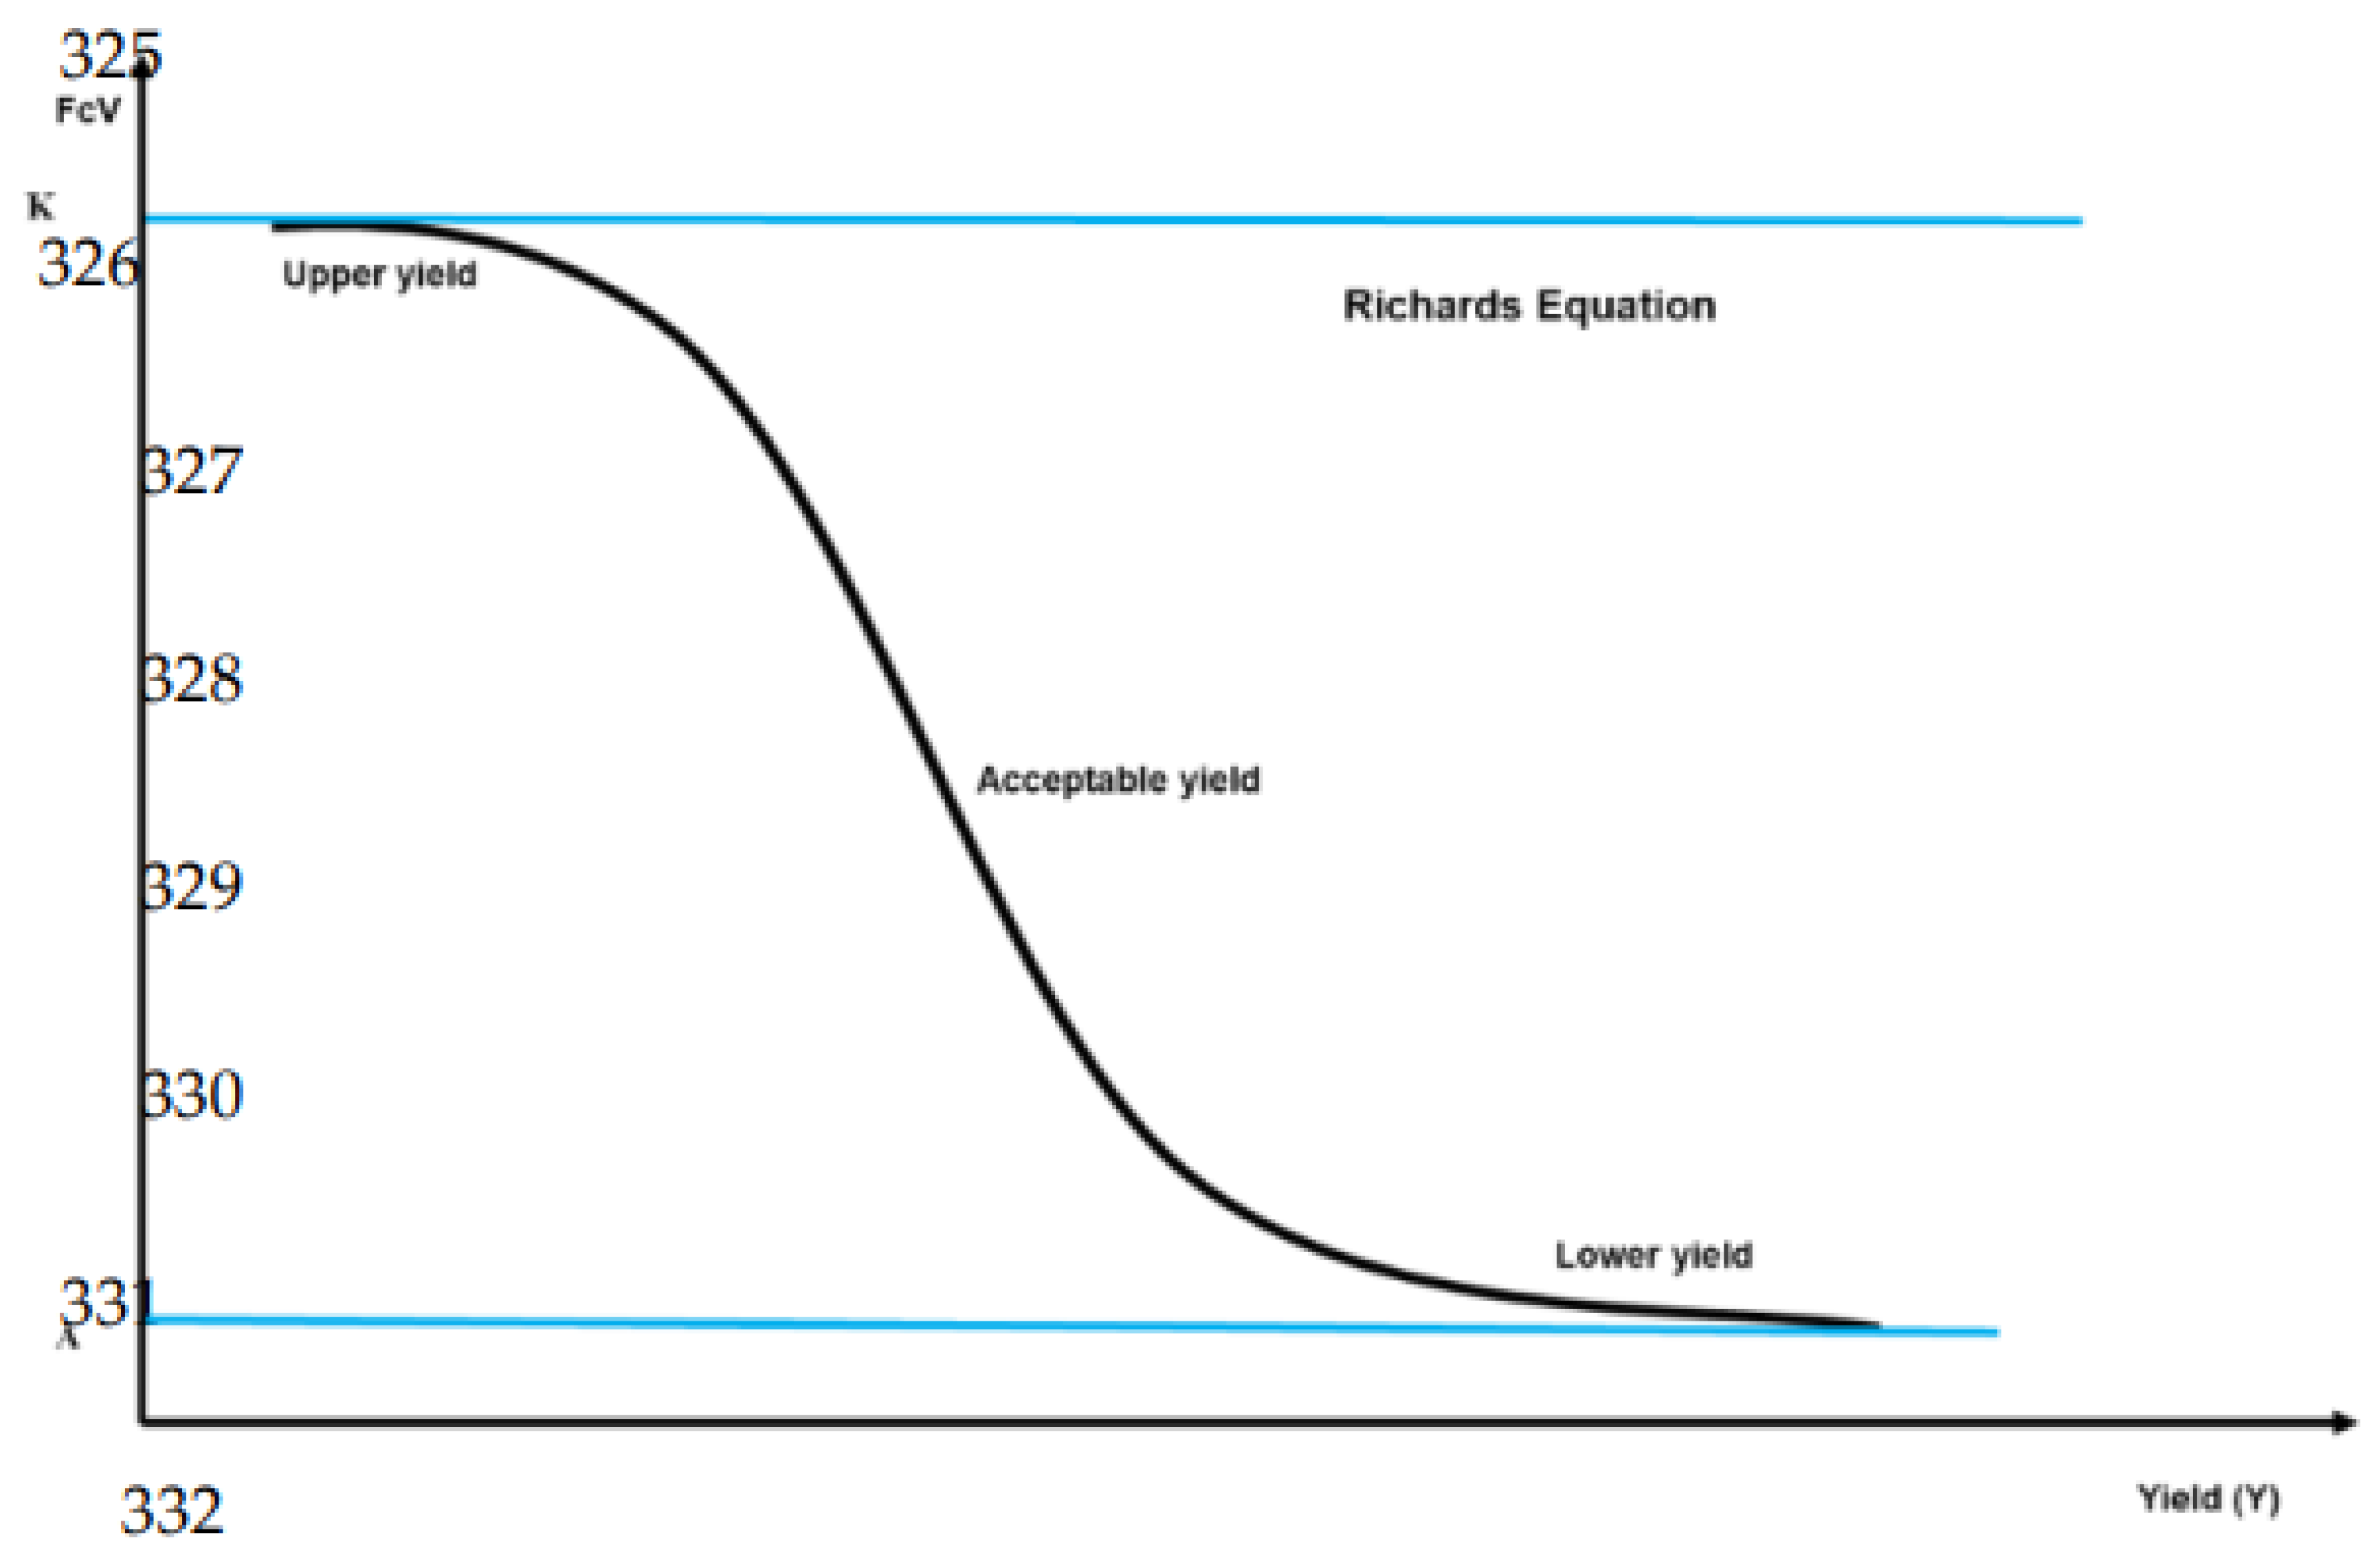
- Yield-Variance Correlation: Establish the correlation between the cumulative variance functions and grain yield, utilizing Richards' equation.
- Inflection Point Identification: Determine the inflection point for each element within the simplex. The mean of these inflection points across all macronutrients sets the yield threshold differentiating Pop+ from Pop-.
2.3.2. Calculating the Theoretical Global Nutrient Imbalance Index
2.3.3. Validation of the Global Nutrient Imbalance Index threshold
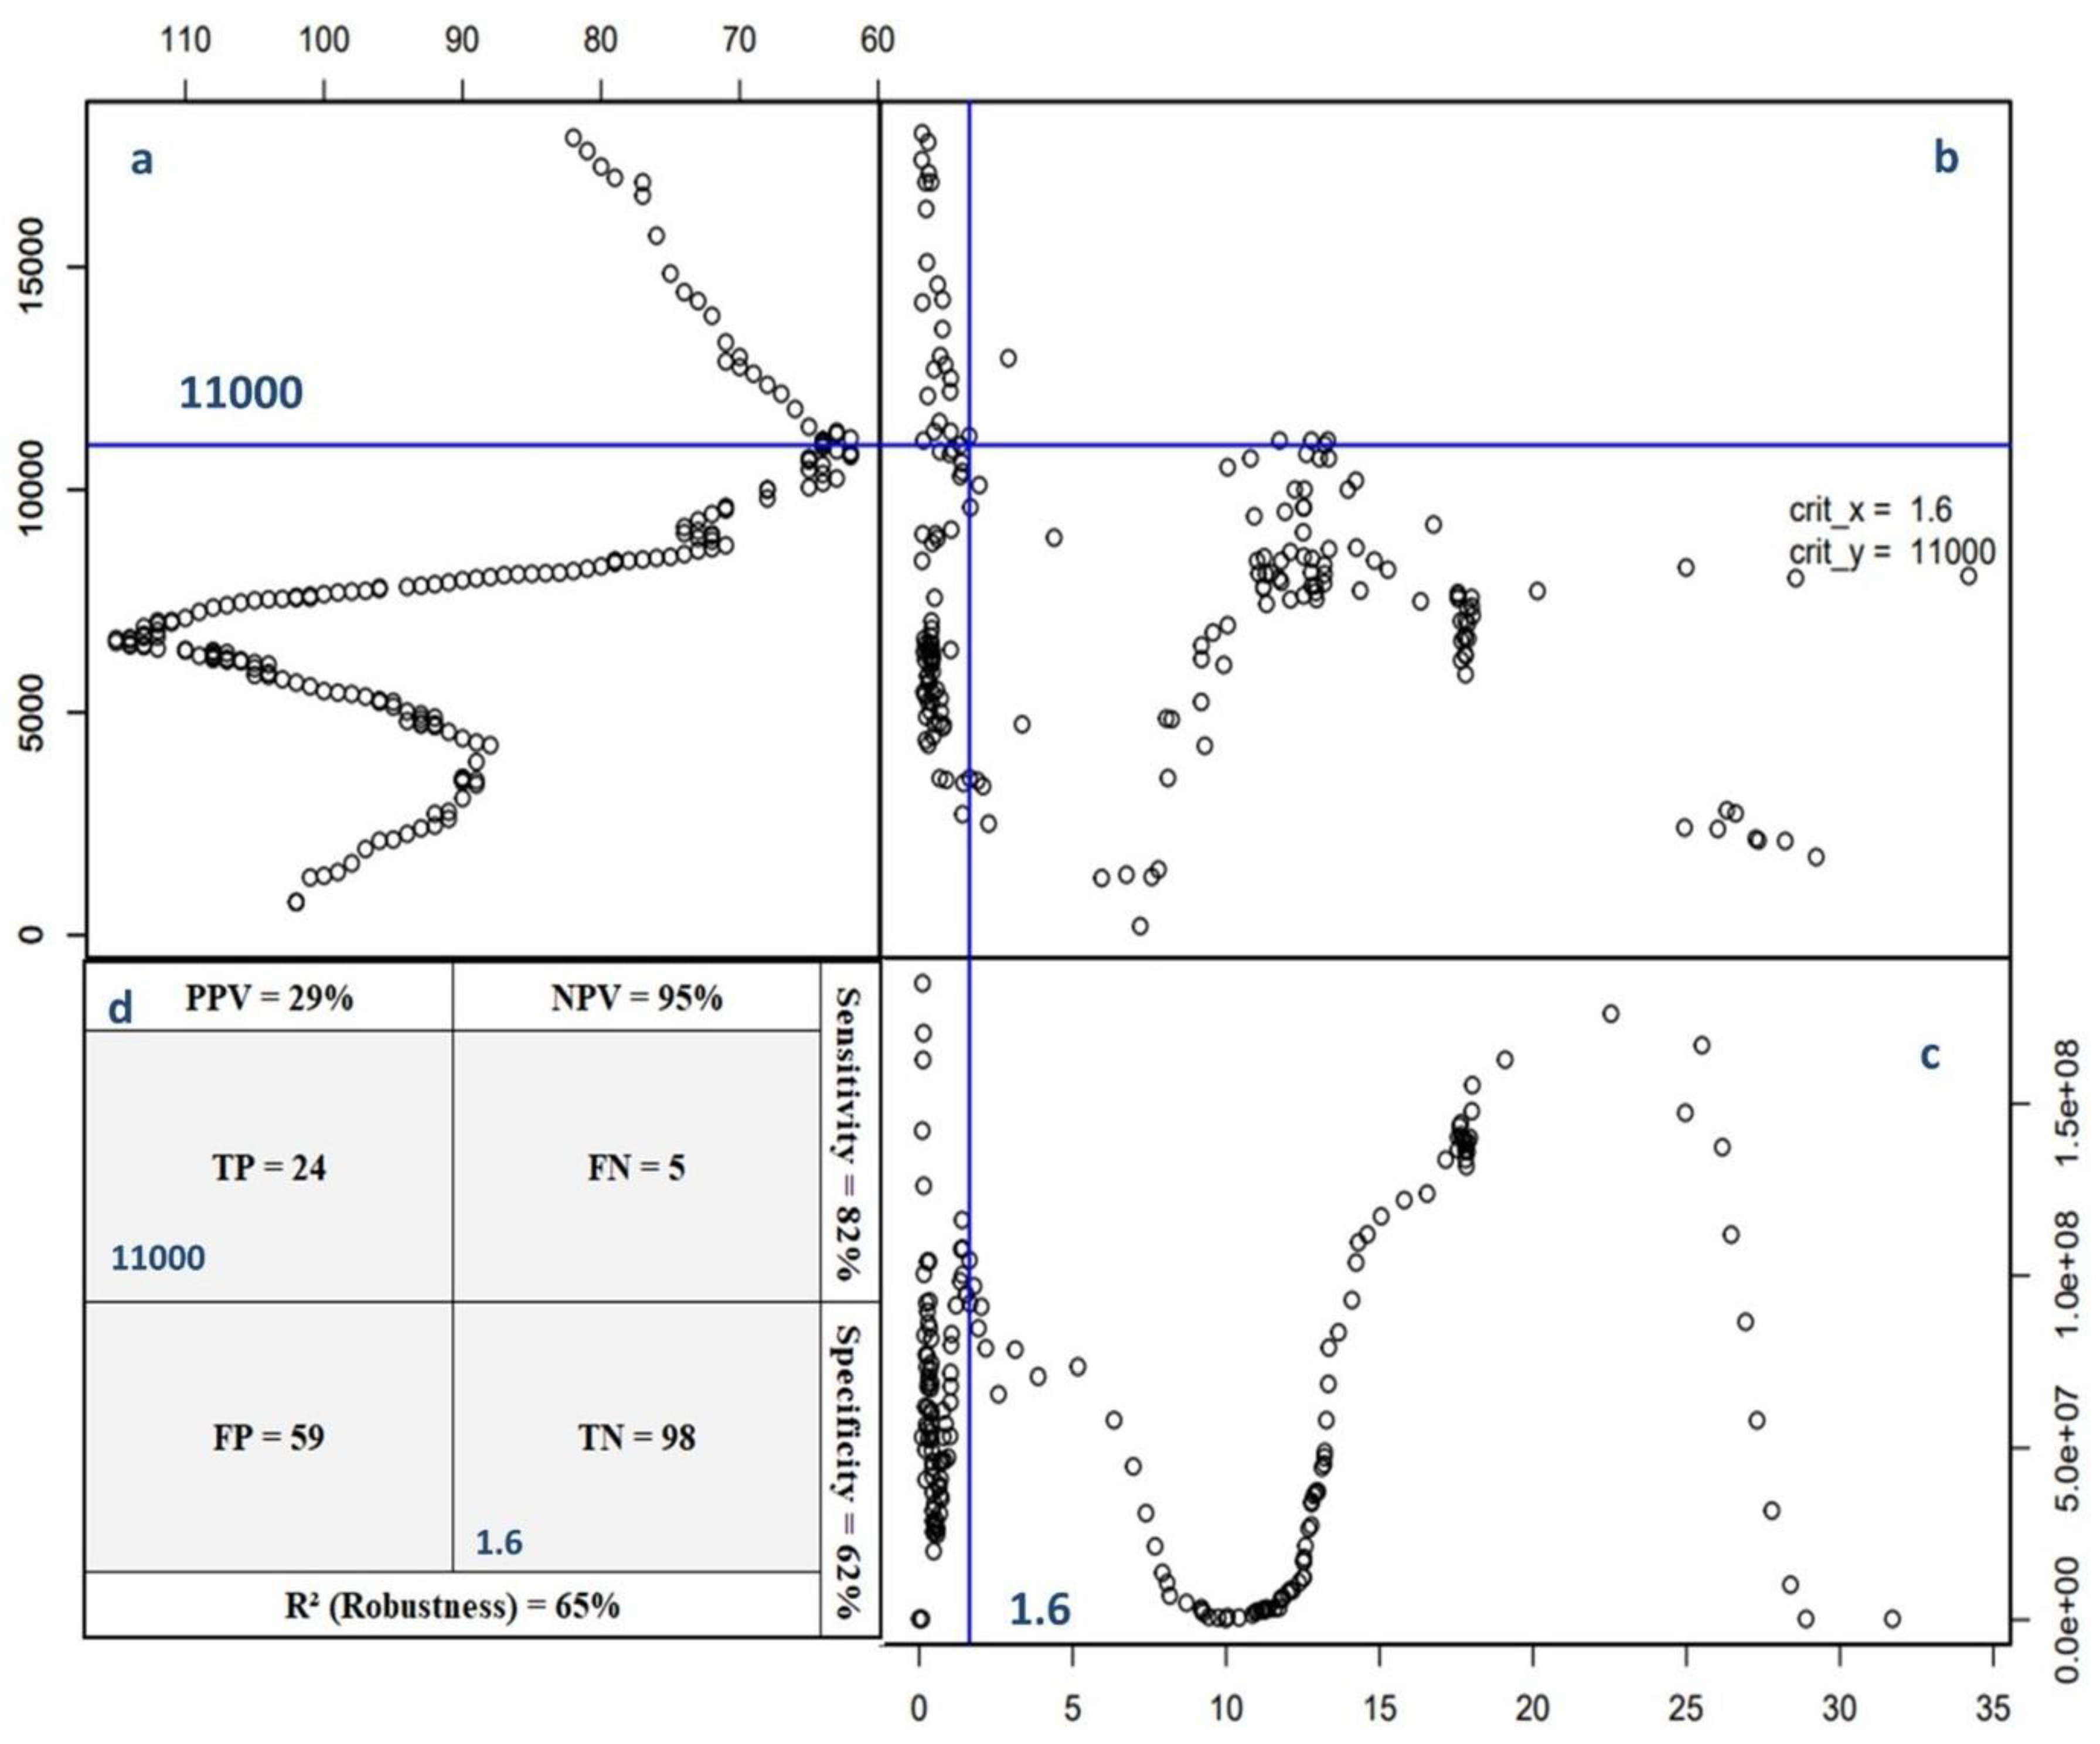
- Robustness (R²): Defined as R2 = , it measures the model’s overall accuracy in correctly identifying nutrient signatures. This represents the probability of making a correct diagnosis regarding the nutrient status.
- Specificity: Calculated as , specificity indicates the model’s ability to correctly identify cases of low yield potential when nutrient signatures exceed the critical threshold. It reflects the likelihood of accurately declaring a nutrient imbalance under conditions of poor yield.
- Sensitivity: Given by , this parameter represents the probability of correctly identifying high yield potential when nutrient signatures are below the critical threshold. It assesses the model’s effectiveness in detecting cases where the nutrient balance is favorable for high yields.
- Positive Predictive Value (PPV): Defined as PPV = , this metric estimates the likelihood of achieving good yield potential when the nutrient signature falls below the critical threshold.
- Negative Predictive Value (NPV): Calculated as NPV = , NPV denotes the probability of encountering lower yield potential when the nutrient signature exceeds the critical threshold.
2.4. Statistical Analysis
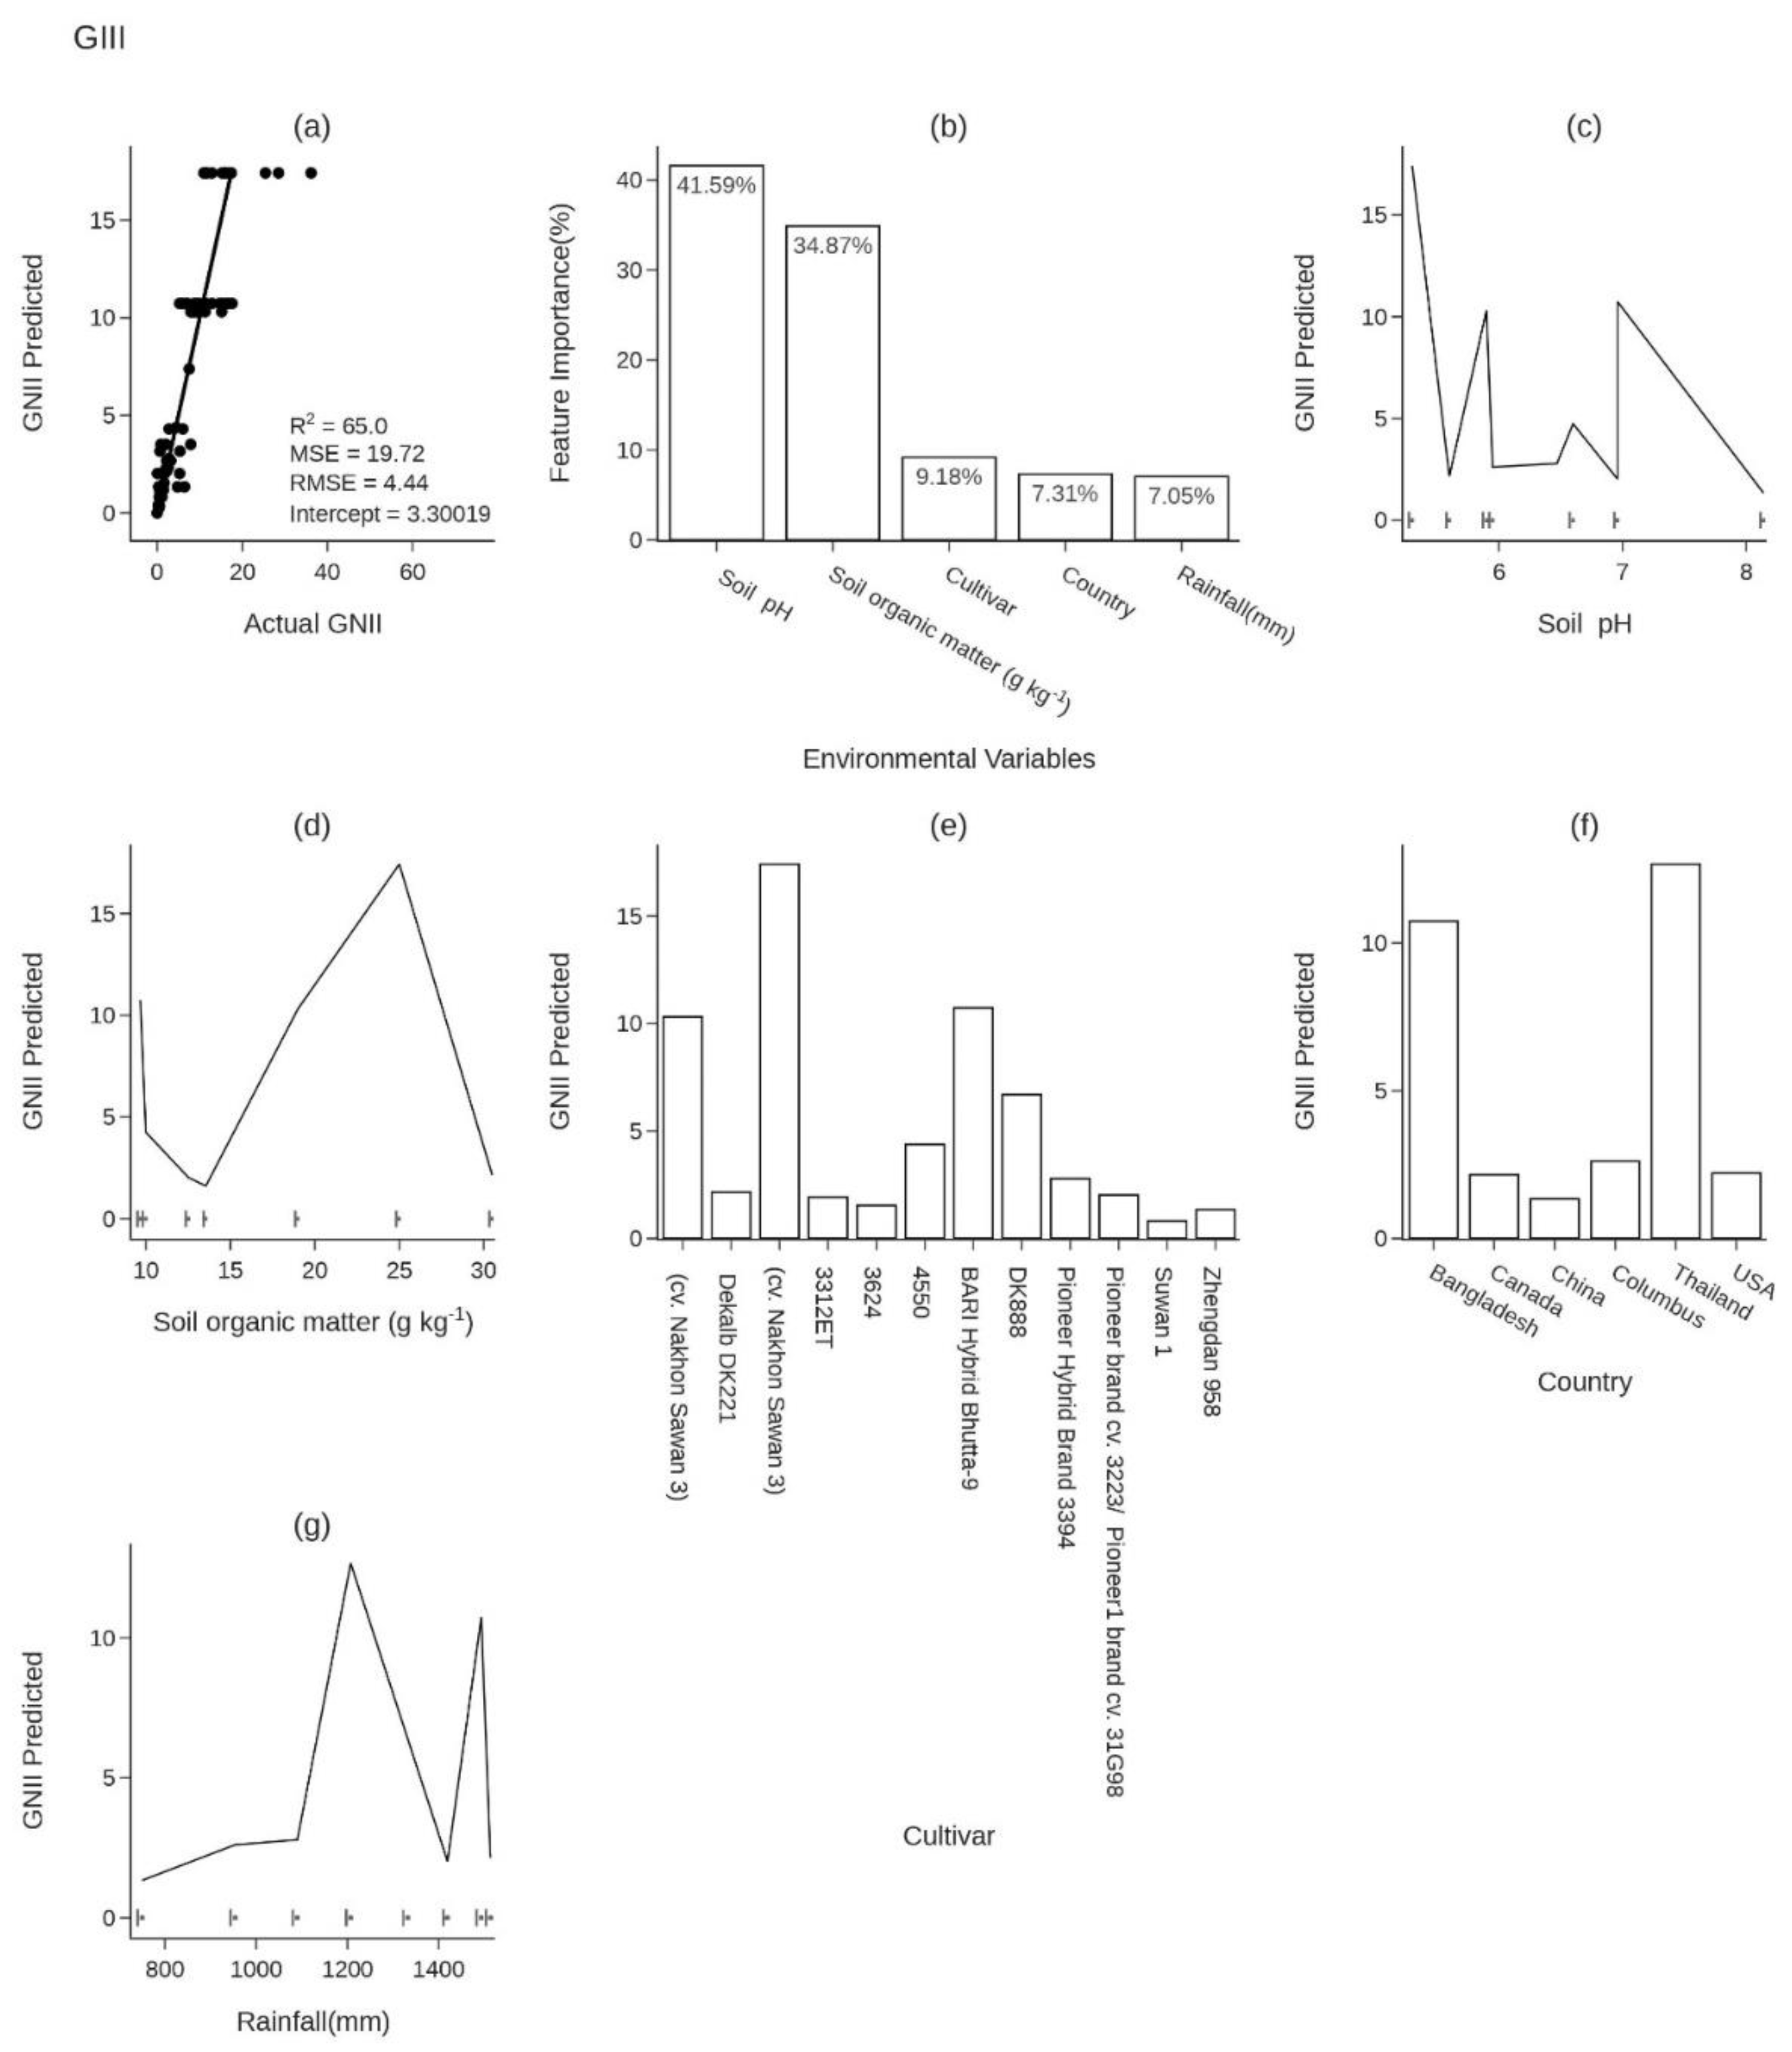
- Robustness (R²): This metric, also known as the coefficient of determination, gauges the models' ability to explain the variability in the GNII values. A higher R² indicates a model with a greater explanatory power.
- Accuracy (Slope): We used the slope of the regression line between observed and predicted GNII values as a measure of model accuracy. An ideal model would have a slope of 1, indicating perfect predictions.
- Sensitivity (Intercept): The intercept of the regression line provides insights into the model's sensitivity and reflects the inherent bias in the models, with an ideal intercept value being zero.
- Root-Mean-Square Error (RMSE): RMSE offers a clear indication of the prediction error magnitude. Lower RMSE values signify greater accuracy, as they indicate smaller deviations between predicted and actual GNII values.
3. Results
3.1. Selecting the High-Yielding Subpopulation from the datasets

3.2. Determining the Theoretical Threshold of the Global Nutrient Imbalance Index
3.2.1. Nutrient Imbalance Index Threshold Validation
3.2.2. Environmental Variables Affecting the Determination And Forecasting of the GNII Value
4. Discussion
4.1. Selecting the High-Yielding Population from the Datasets
4.2. Determining the Theoretical Threshold of the Global Nutrient Imbalance Index
4.2.1. Theoretical Global Nutrient Imbalance Index (GNIITheoretical)
4.2.2. Nutrient Imbalance Index Threshold Validation
4.2.3. Environmental Variables Affecting the Determination And Forecasting of the GNII value
5. Conclusions
Author Contributions
Funding
Acknowledgments
Conflicts of Interest
References
- Willby, N.J.; Pulford, I.D.; Flowers, T.H. Tissue Nutrient Signatures Predict Herbaceous-Wetland Community Responses to Nutrient Availability. New Phytol. 2001, 152, 463–481. [Google Scholar] [CrossRef] [PubMed]
- Baxter, I. Should We Treat the Ionome as a Combination of Individual Elements, or Should We Be Deriving Novel Combined Traits? J. Exp. Bot. 2015, 66, 2127–2131. [Google Scholar] [CrossRef] [PubMed]
- Conn, S.; Gilliham, M. Comparative Physiology of Elemental Distributions in Plants. Ann. Bot. 2010, 105, 1081–1102. [Google Scholar] [CrossRef]
- Aerts, R.; Chapin, F.S. The Mineral Nutrition of Wild Plants Revisited: A Re-Evaluation of Processes and Patterns. In Advances in Ecological Reaserch; Academic Press, 1999; Vol. 30, pp. 1–67.
- Stein, R.J.; Höreth, S.; de Melo, J.R.F.; Syllwasschy, L.; Lee, G.; Garbin, M.L.; Clemens, S.; Krämer, U. Relationships between Soil and Leaf Mineral Composition Are Element-Specific, Environment-Dependent and Geographically Structured in the Emerging Model Arabidopsis Halleri. New Phytol. 2016, 213, 1274–1286. [Google Scholar] [CrossRef]
- Debbarma, N.; Manivannan, S.; Muddarsu, V.R.; Umadevi, P.; Upadhyay, S. Ionome Signatures Discriminates the Geographical Origin of Jackfruits (Artocarpus Heterophyllus Lam.). Food Chem. 2021, 339. [Google Scholar] [CrossRef]
- Asaro, A.; Ziegler, G.; Ziyomo, C.; Hoekenga, O.A.; Dilkes, B.P.; Baxter, I. The Interaction of Genotype and Environment Determines Variation in the Maize Kernel Ionome. G3 Genes, Genomes, Genet. 2016, 6, 4175–4183. [Google Scholar] [CrossRef]
- Baxter, I.R.; Vitek, O.; Lahner, B.; Muthukumar, B.; Borghi, M.; Morrissey, J.; Guerinot, M. Lou; Salt, D.E. The Leaf Ionome as a Multivariable System to Detect a Plant’s Physiological Status. Proc. Natl. Acad. Sci. 2008, 105, 12081–12086. [Google Scholar] [CrossRef] [PubMed]
- White, P.J.; Brown, P.H. Plant Nutrition for Sustainable Development and Global Health. Ann. Bot. 2010, 105, 1073–1080. [Google Scholar] [CrossRef]
- Jaradat, A.A.; Goldstein, W. Diversity of Maize Kernels from a Breeding Program for Protein Quality III: Ionome Profiling. Agronomy 2018, 8, 2–31. [Google Scholar] [CrossRef]
- Parent, S.É.; Parent, L.E.; Egozcue, J.J.; Rozane, D.E.; Hernandes, A.; Lapointe, L.; Hébert-Gentile, V.; Naess, K.; Marchand, S.; Lafond, J.; et al. The Plant Ionome Revisited by the Nutrient Balance Concept. Front. Plant Sci. 2013, 4, 1–10. [Google Scholar] [CrossRef]
- Nicolas, O.; Charles, M.T.; Jenni, S.; Toussaint, V.; Parent, S.É.; Beaulieu, C. The Ionomics of Lettuce Infected by Xanthomonas Campestris Pv. Vitians. Front. Plant Sci. 2019, 10, 351. [Google Scholar] [CrossRef] [PubMed]
- Labaied, M.B.; Khiari, L.; Gallichand, J.; Kebede, F.; Kadri, N.; Ammar, N. Ben; Hmida, F. Ben; Mimoun, M. Ben Nutrient Diagnosis Norms for Date Palm (Phoenix Dactylifera L.) in Tunisian Oases. Agronomy 2020, 10. [Google Scholar] [CrossRef]
- Khiari, L.; On-E ´ Tienne Parent, L.; Tremblay, N.; Khiari, L.; Parent, L.E. Critical Compositional Nutrient Indexes for Sweet Corn at Early Growth Stage. Agron. J. 2001, 93, 809–814. [Google Scholar] [CrossRef]
- Felton, A.M.; Felton, A.; Raubenheimer, D.; Simpson, S.J.; Krizsan, S.J.; Hedwall, P.-O.; Stolter, C. The Nutritional Balancing Act of a Large Herbivore: An Experiment with Captive Moose (Alces Alces L). PLoS One 2016, 11, e0150870. [Google Scholar] [CrossRef] [PubMed]
- Robbins, C.T.; Fortin, J.K.; Rode, K.D.; Farley, S.D.; Shipley, L.A.; Felicetti, L.A. Optimizing Protein Intake as a Foraging Strategy to Maximize Mass Gain in an Omnivore. Oikos 2007, 116, 1675–1682. [Google Scholar] [CrossRef]
- Dussutour, A.; Latty, T.; Beekman, M.; Simpson, S.J. Amoeboid Organism Solves Complex Nutritional Challenges. Proc. Natl. Acad. Sci. U. S. A. 2010, 107, 4607–4611. [Google Scholar] [CrossRef]
- Congze, J.; et al. Maximizing Food Equivalent Unit Yield for Forage Maize Production without Notably Compromising Dry Matter Yield and Feed Quality in a Semi-Arid Region. Ind. Crops Prod. 2024, 218. [Google Scholar] [CrossRef]
- Awata, L.A.; Tongoona, P.; Danquah, E.; Ifie, B.E.; Suresh, L.M.; Jumbo, M.B.; Marchelo-D, P.W.; Sitonik, A. Understanding Tropical Maize (Zea Mays L.): The Major Monocot in Modernization and Sustainability of Agriculture in Sub-Saharan Africa. Ijaar 2019, 7, 32–77. [Google Scholar] [CrossRef]
- Khiari, L.; Parent, L.E.; Tremblay, N. The Phosphorus Compositional Nutrient Diagnosis Range for Potato. Agron. J. 2001, 93, 815–819. [Google Scholar] [CrossRef]
- Parent, L.; Gagné, G. Guide de Référence En Fertilisation; Québec, 2010.
- Sirisuntornlak, N.; Ullah, H.; Sonjaroon, W.; Arirob, W.; Anusontpornperm, S.; Datta, A. Effect of Seed Priming with Silicon on Growth, Yield and Nutrient Uptake of Maize under Water-Deficit Stress. J. Plant Nutr. 2021, 44, 1869–1885. [Google Scholar] [CrossRef]
- Sirisuntornlak, N.; Ullah, H.; Sonjaroon, W.; Anusontpornperm, S.; Arirob, W.; Datta, A. Interactive Effects of Silicon and Soil PH on Growth, Yield and Nutrient Uptake of Maize. Silicon 2020, 13, 289–299. [Google Scholar] [CrossRef]
- Feil, B.; Moser, S.B.; Jampatong, S.; Stamp, P. Mineral Composition of the Grains of Tropical Maize Varieties as Affected by Pre-Anthesis Drought and Rate of Nitrogen Fertilization. Crop Sci. Soc. Am. 2005, 45, 516–523. [Google Scholar] [CrossRef]
- Sarker, K.K.; Hossain, A.; Timsina, J.; Biswas, S.K.; Malone, S.L.; Alam, M.K.; Loescher, H.W.; Bazzaz, M. Alternate Furrow Irrigation Can Maintain Grain Yield and Nutrient Content, and Increase Crop Water Productivity in Dry Season Maize in Sub-Tropical Climate of South Asia. Agric. Water Manag. 2020, 238, 1–11. [Google Scholar] [CrossRef]
- Warman, P.R.; Havard, K.A. Yield, Vitamin and Mineral Contents of Organically and Conventionally Grown Potatoes and Sweet Corn. Ecosyst. Environ. 1998, 68, 207–216. [Google Scholar] [CrossRef]
- Tweddell, R.J.; Pelerin, S.; Chabot, R. A Two-Year Field Study of a Commercial Biostimulant Applied on Maize as Seed Coating. Can. J. Plant Sci. 2000, 80, 805–807. [Google Scholar] [CrossRef]
- Bruns, H.A.; Ebelhar, M.W. Nutrient Uptake of Maize Affected by Nitrogen and Potassium Fertility in a Humid Subtropical Environment. Commun. Soil Sci. Plant Anal. 2006, 37, 275–293. [Google Scholar] [CrossRef]
- Heckman, J.R.; Sims, J.T.; Beegle, D.B.; Coale, F.J.; Herbert, S.J.; Bruulsema, T.W.; Bamka, W.J. Nutrient Removal by Corn Grain Harvest. Agron. J. 2003, 95, 587–591. [Google Scholar] [CrossRef]
- Wang, J.; Wang, Z.; Mao, H.; Zhao, H.; Huang, D. Increasing Se Concentration in Maize Grain with Soil- or Foliar-Applied Selenite on the Loess Plateau in China. F. Crop. Res. 2013, 150, 83–90. [Google Scholar] [CrossRef]
- Chen, Q.; Mu, X.; Chen, F.; Yuan, L.; Mi, G. Dynamic Change of Mineral Nutrient Content in Different Plant Organs during the Grain Filling Stage in Maize Grown under Contrasting Nitrogen Supply. Eur. J. Agron. 2016, 80, 137–153. [Google Scholar] [CrossRef]
- Khiari, L.; On-E ´ Tienne Parent, L.; Tremblay, N. Selecting the High-Yield Subpopulation for Diagnosing Nutrient Imbalance in Crops. Agron. J. 2001, 93, 802–808. [Google Scholar] [CrossRef]
- Of, J.; Education, A.; Learning, O.; Hampshire, N. Summary and Analysis of Extension Program Evaluation in R; 2016; Vol. 10.
- Van Rossum G, D.F. Python/C Api Manual-Python 3 2009.
- Westerveld, J.J.L.; van den Homberg, M.J.C.; Nobre, G.G.; van den Berg, D.L.J.; Teklesadik, A.D.; Stuit, S.M. Forecasting Transitions in the State of Food Security with Machine Learning Using Transferable Features. Sci. Total Environ. 2021, 786, 147366. [Google Scholar] [CrossRef] [PubMed]
- Svetnik, V.; Liaw, A.; Tong, C.; Christopher Culberson, J.; Sheridan, R.P.; Feuston, B.P. Random Forest: A Classification and Regression Tool for Compound Classification and QSAR Modeling. J. Chem. Inf. Comput. Sci. 2003, 43, 1947–1958. [Google Scholar] [CrossRef] [PubMed]
- Steinfeld, H.; Wassenaar, T.; Jutzi, S. Livestock Production Systems in Developing Countries: Status, Drivers, Trends. Rev. sci. tech. Off. int. Epiz 2006, 25, 505–516. [Google Scholar] [CrossRef] [PubMed]
- Supasri, T.; Itsubo, N.; Gheewala, S.H.; Sampattagul, S. Life Cycle Assessment of Maize Cultivation and Biomass Utilization in Northern Thailand. Sci. Rep. 2020, 10, 1–14. [Google Scholar] [CrossRef]
- Magallanes-Quintanar, R.; Valdez-Cepeda, R.D.; Olivares-Sáenz, E.; Pérez-Veyna, O.; García-Hernández, J.L.; López-Martínez, J.D. Compositional Nutrient Diagnosis in Maize Grown in a Calcareous Soil. J. Plant Nutr. 2006, 29, 2019–2033. [Google Scholar] [CrossRef]
- Bawa, A. Yield and Growth Response of Maize (Zea Mays L.) to Varietal and Nitrogen Application in the Guinea Savanna Agro-Ecology of Ghana. Adv. Agric. 2021, 2021. [Google Scholar] [CrossRef]
- Cescas, M.P. Interpretative Table of the Measurement of Hydrogen-Ion Concentration in Soils of Quebec Using Four Different Methods. Nat. Can. 1978, 105, 259–603. [Google Scholar]
- Pernes-Debuyser, A.; Tessier, D. Soil Physical Properties Affected by Long-Term Fertilization. Eur. J. Soil Sci. 2004, 55, 505–512. [Google Scholar] [CrossRef]
- Duque-Vargas, J.; Pandey, S.; Granados, G.; Ceballos, H.; Knapp, E. (1994) Inheritance of Tolerance to Soil Acidity in Tropical Maize. Crop Sci. 1994, 34, 50–54. [Google Scholar] [CrossRef]
- Pandey’, S.; Gardner’, C. 0 RECURRENT SELECTION FOR POPUTION, VARIETY, AND HYBRID IMPROVEMENT IN TROPICAL MAIZE. In Advances in Agronomy; 1992; Vol. 48, pp. 1–87.
- Bennet, R.J.; Breen, C.M.; Fey, M. V Aluminium Toxicity and Induced Nutrient Disorders Involving the Uptake and Transport of P, K, Ca and Mg in Zea Mays L. South African J. Plant Soil 1986, 3, 11–17. [Google Scholar] [CrossRef]
- Kane, D.A.; Bradford, M.A.; Fuller, E.; Oldfield, E.E.; Wood, S.A. Soil Organic Matter Protects US Maize Yields and Lowers Crop Insurance Payouts under Drought. Environ. Res. Lett. 2021, 16. [Google Scholar] [CrossRef]
- Williams, A.; Hunter, M.C.; Kammerer, M.; Kane, D.A.; Jordan, N.R.; Mortensen, D.A.; Smith, R.G.; Snapp, S.; Davis, A.S. Soil Water Holding Capacity Mitigates Downside Risk and Volatility in US Rainfed Maize: Time to Invest in Soil Organic Matter? PLoS One 2016, 11. [Google Scholar] [CrossRef] [PubMed]
- Ritchie, I. Precipitation Impact on Crop Yield, University of Nebraska - Lincoln: Lincoln, Nebraska, 2021.
- Rusinamhodzi, L.; Corbeels, M.; Van Wijk, M.T.; Rufino, M.C.; Nyamangara, J.; Giller, K.E. A Meta-Analysis of Long-Term Effects of Conservation Agriculture on Maize Grain Yield under Rain-Fed Conditions. Agron. Sustain. Dev. 2011, 31, 657–673. [Google Scholar] [CrossRef]


| Country | Location | Georeferenced location | Rainfall (mm) | Cultivar | n | References |
|---|---|---|---|---|---|---|
| Thailand | Bangkok | 14°04'52.5"N 100°36'52.8"E | 1207 | Nakhon Sawan 3 | 90 | [22] |
| Bangkok | 14.0785°N,00.6140° E | 1207 | Kakhon Sawan 3 | 114 | [23] | |
| Pakchong | 14.5 N lat, 101 E | 1207 | Suwan1/Laposta Sequia/ KTX2602/DK888 | 162 | [24] | |
| Bangladesh | Gazipur-Joydebpur | 24°30'0"N and 92°3'0"E | 1493 | BARIHybrid Bhutta-9 | 162 | [25] |
| Canada | Lower Onslow | 45°22'56.4"N 63°23'25.1"W | 1513 | CV.Sunnyvee/ CV. Pride and joy | 36 | [26] |
| Québec | 46°46'43.3"N 71°16'06.5"W | 1513 | Pionneer 3893/Dekalb DK221 | 72 | [27] | |
| USA | Mississippi State University | 33°27'19.5"N 88°47'39.7"W | 1419 | Pioneer brand cv. 3223/ Pioneer1 brand cv. 31G98 | 48 | [28] |
| Delaware, Massachusetts, Maryland, New Jersey, and Pennsylvania | 40°53'10.0"N 73°54'37.0"W | 1090 | Pioneer Hybrid Brand 3394 | 12 | [29] | |
| Columbus | 39°51'48.4"N 83°40'19.6"W | 954 | 3312 Et | 72 | [24] | |
| 3377 | ||||||
| 3422 | ||||||
| 3624 | ||||||
| 3750 | ||||||
| 4550 | ||||||
| China | Shaanxi | 34-49 N 108 11 E | 750 | Zhengdan 958 | 132 | [30] |
| Beijing | 116°11N,40-8E | 24 | [31] | |||
| Total points | 924 | |||||
| Characterizing the Sigmoidal Curve: Five Parameters of the Richards Equation | FCi (CLRX) -IP | Yield-IP | |||||
|---|---|---|---|---|---|---|---|
| FCi (CLRX) | K | A | M | B | V | % | kg ha-1 |
| FCi (CLRN) | 101 | 6.02 | 10772 | 0.000376 | 0.492 | 58.6 | 12659 |
| FCi (CLRP) | 100 | 6.45 | 10904 | 0.000299 | 0.64 | 57.1 | 12395.5 |
| FCi (CLRK) | 93.6 | 6.19 | 10471 | 0.000373 | 0.636 | 53.3 | 11684.5 |
| FCi (CLRCa) | 105 | -2.15 | 12000 | 0.000186 | 0.554 | 56.6 | 15172 |
| FCi (CLRMg) | 89.5 | 10.7 | 4702 | 0.00048 | 0.299 | 56.6 | 6563.5 |
| FCi (CLRR5) | 101 | -7.04 | 16698 | 0.000294 | 0.471 | 53.5 | 13261.5 |
Disclaimer/Publisher’s Note: The statements, opinions and data contained in all publications are solely those of the individual author(s) and contributor(s) and not of MDPI and/or the editor(s). MDPI and/or the editor(s) disclaim responsibility for any injury to people or property resulting from any ideas, methods, instructions or products referred to in the content. |
© 2024 by the authors. Licensee MDPI, Basel, Switzerland. This article is an open access article distributed under the terms and conditions of the Creative Commons Attribution (CC BY) license (http://creativecommons.org/licenses/by/4.0/).


