Submitted:
12 September 2024
Posted:
13 September 2024
You are already at the latest version
Abstract
Keywords:
1. Introduction
2. Materials and Methods
2.1. Crop Management
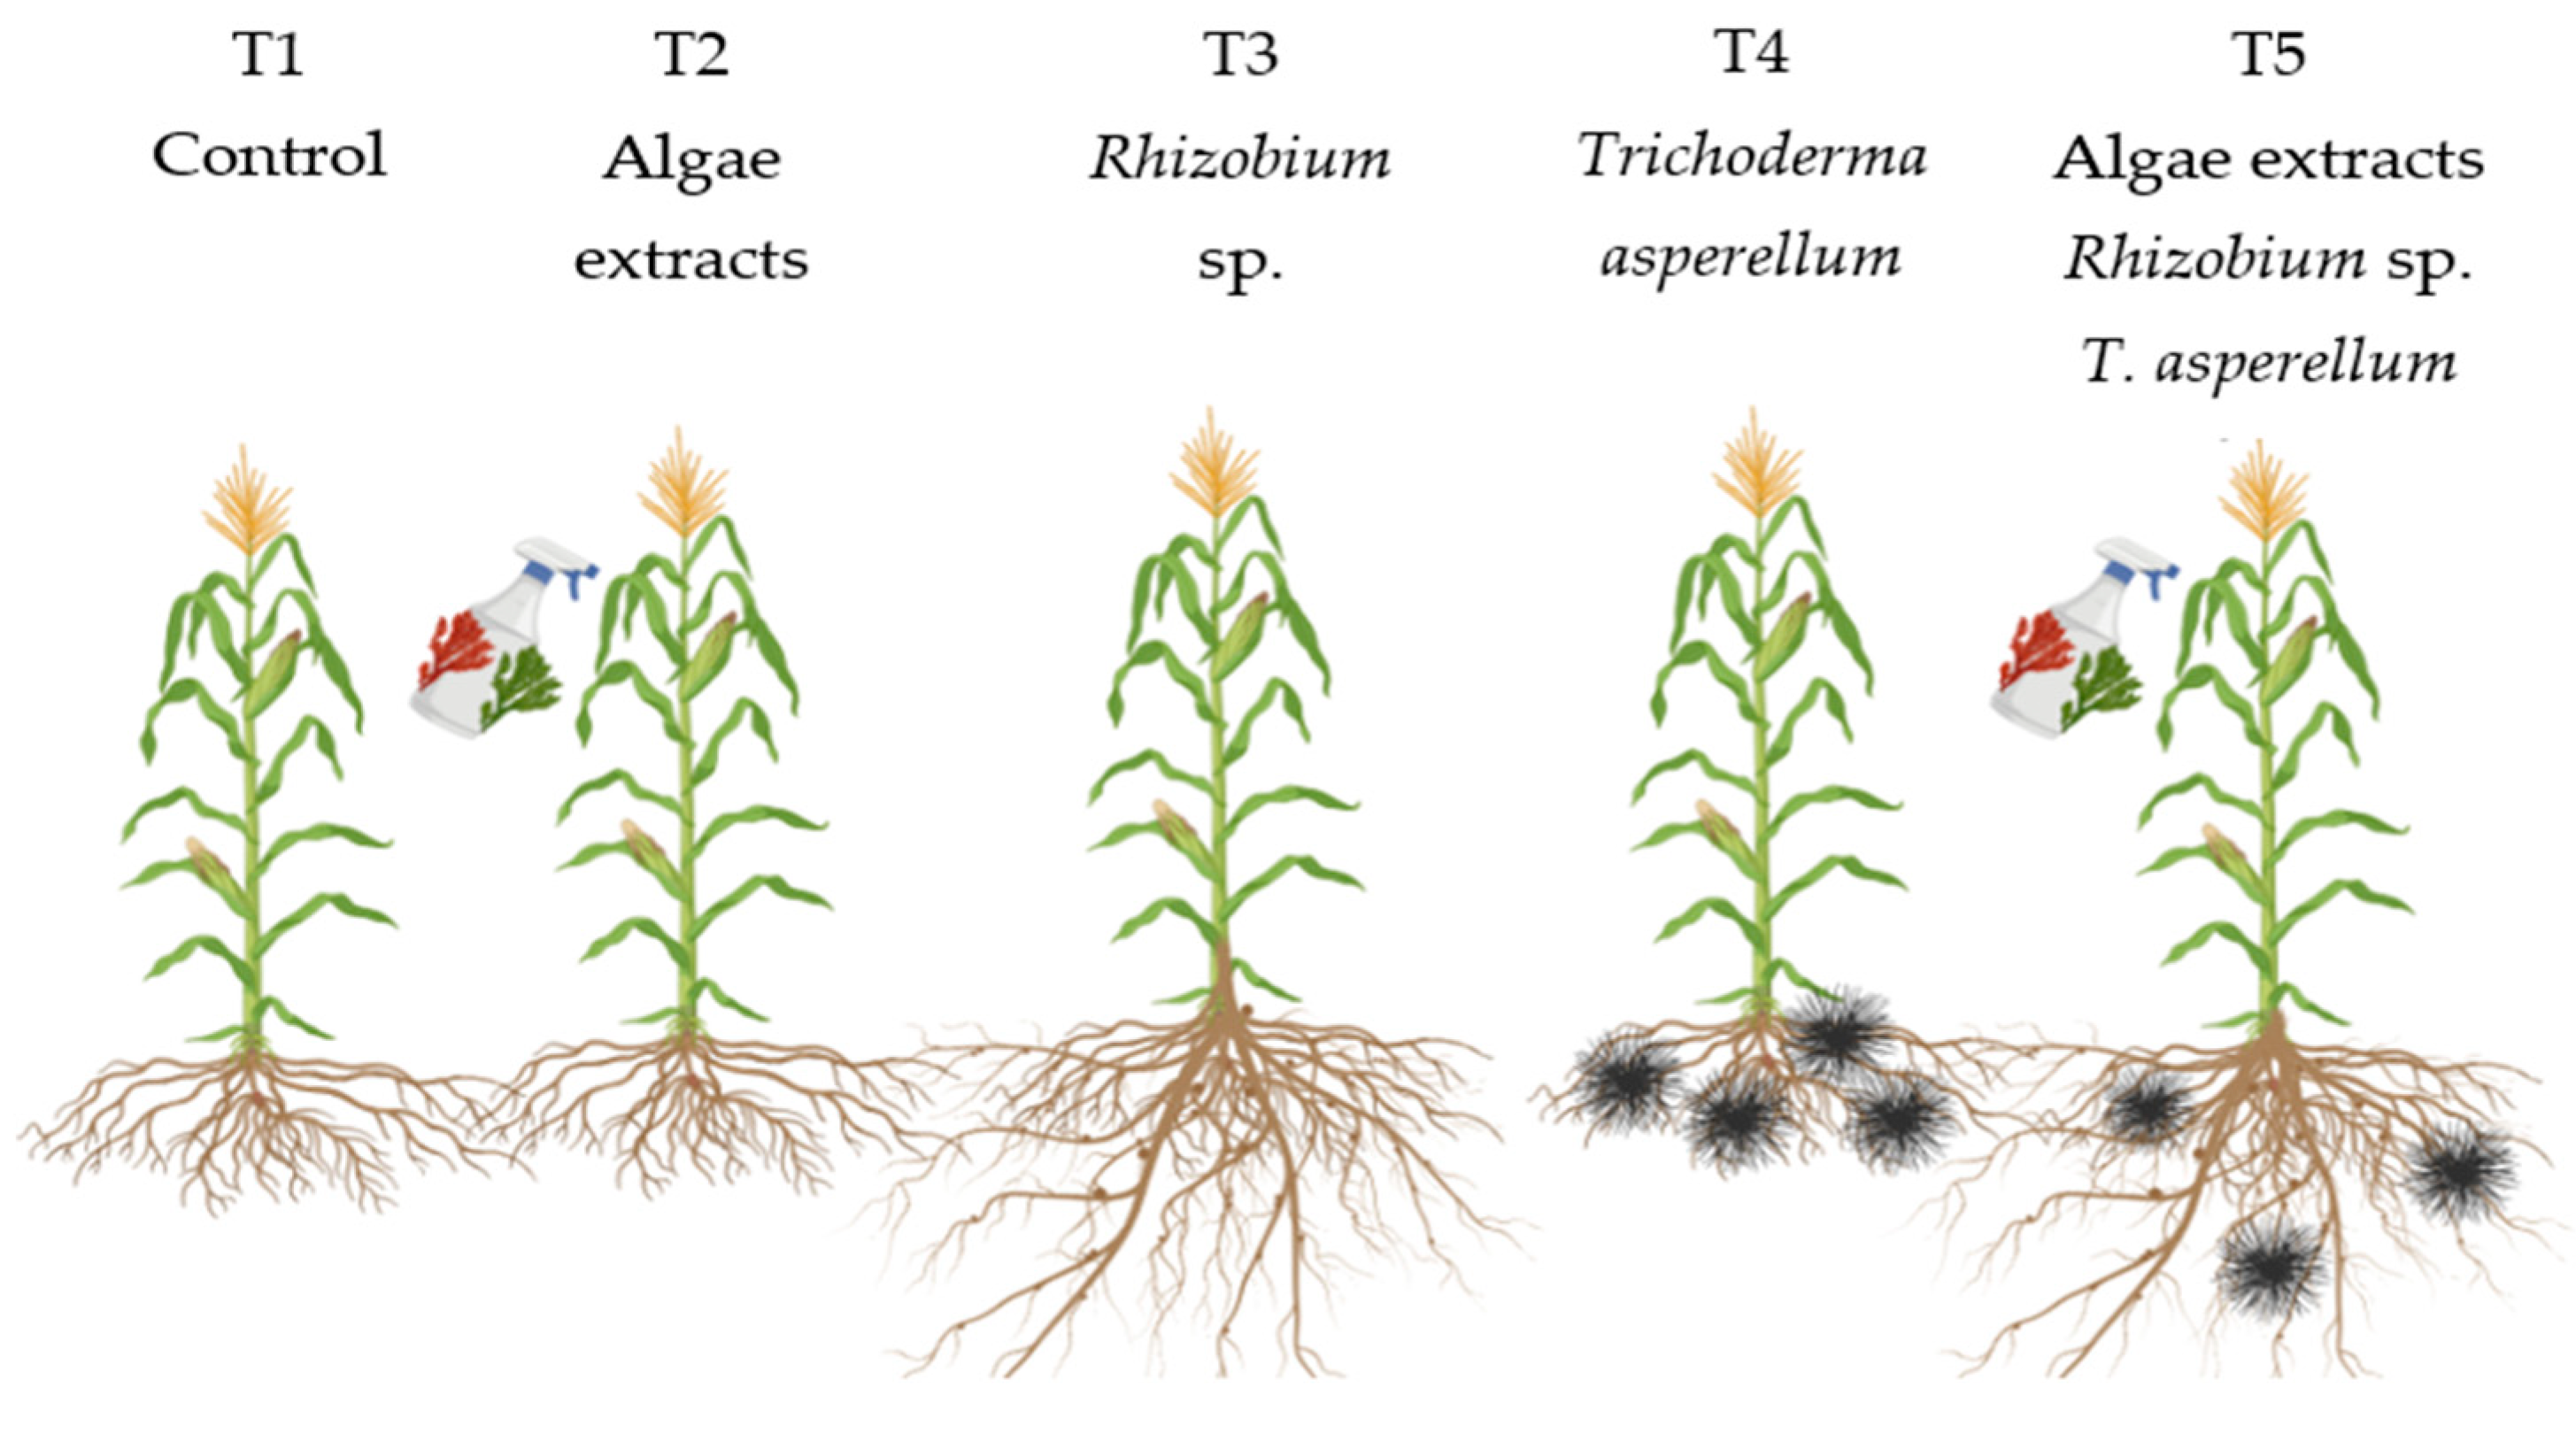
2.2. Experimental Design and Treatments
2.3. Plant Sampling
2.4. Plant Analysis
2.4.1. Total Biomass and Yield
2.4.2. Nitrate Reductase Enzyme Activity (NR Activity) “In Vivo”
2.4.3. SPAD Values
2.4.4. Photosynthetic Pigments
Chl a = (Chl a* x Vf x W1)/(W2 x π x r2 x n)
Chl b = (Chl b* x Vf x W1)/(W2 x π x r2 x n)
Carotenoids = (Carotenoids* x V x W1)/(W2 x π x r2 x n)
2.4.5. Number of Leaves and Plant Height
2.5. Statistical Analysis
3. Results and Discussion
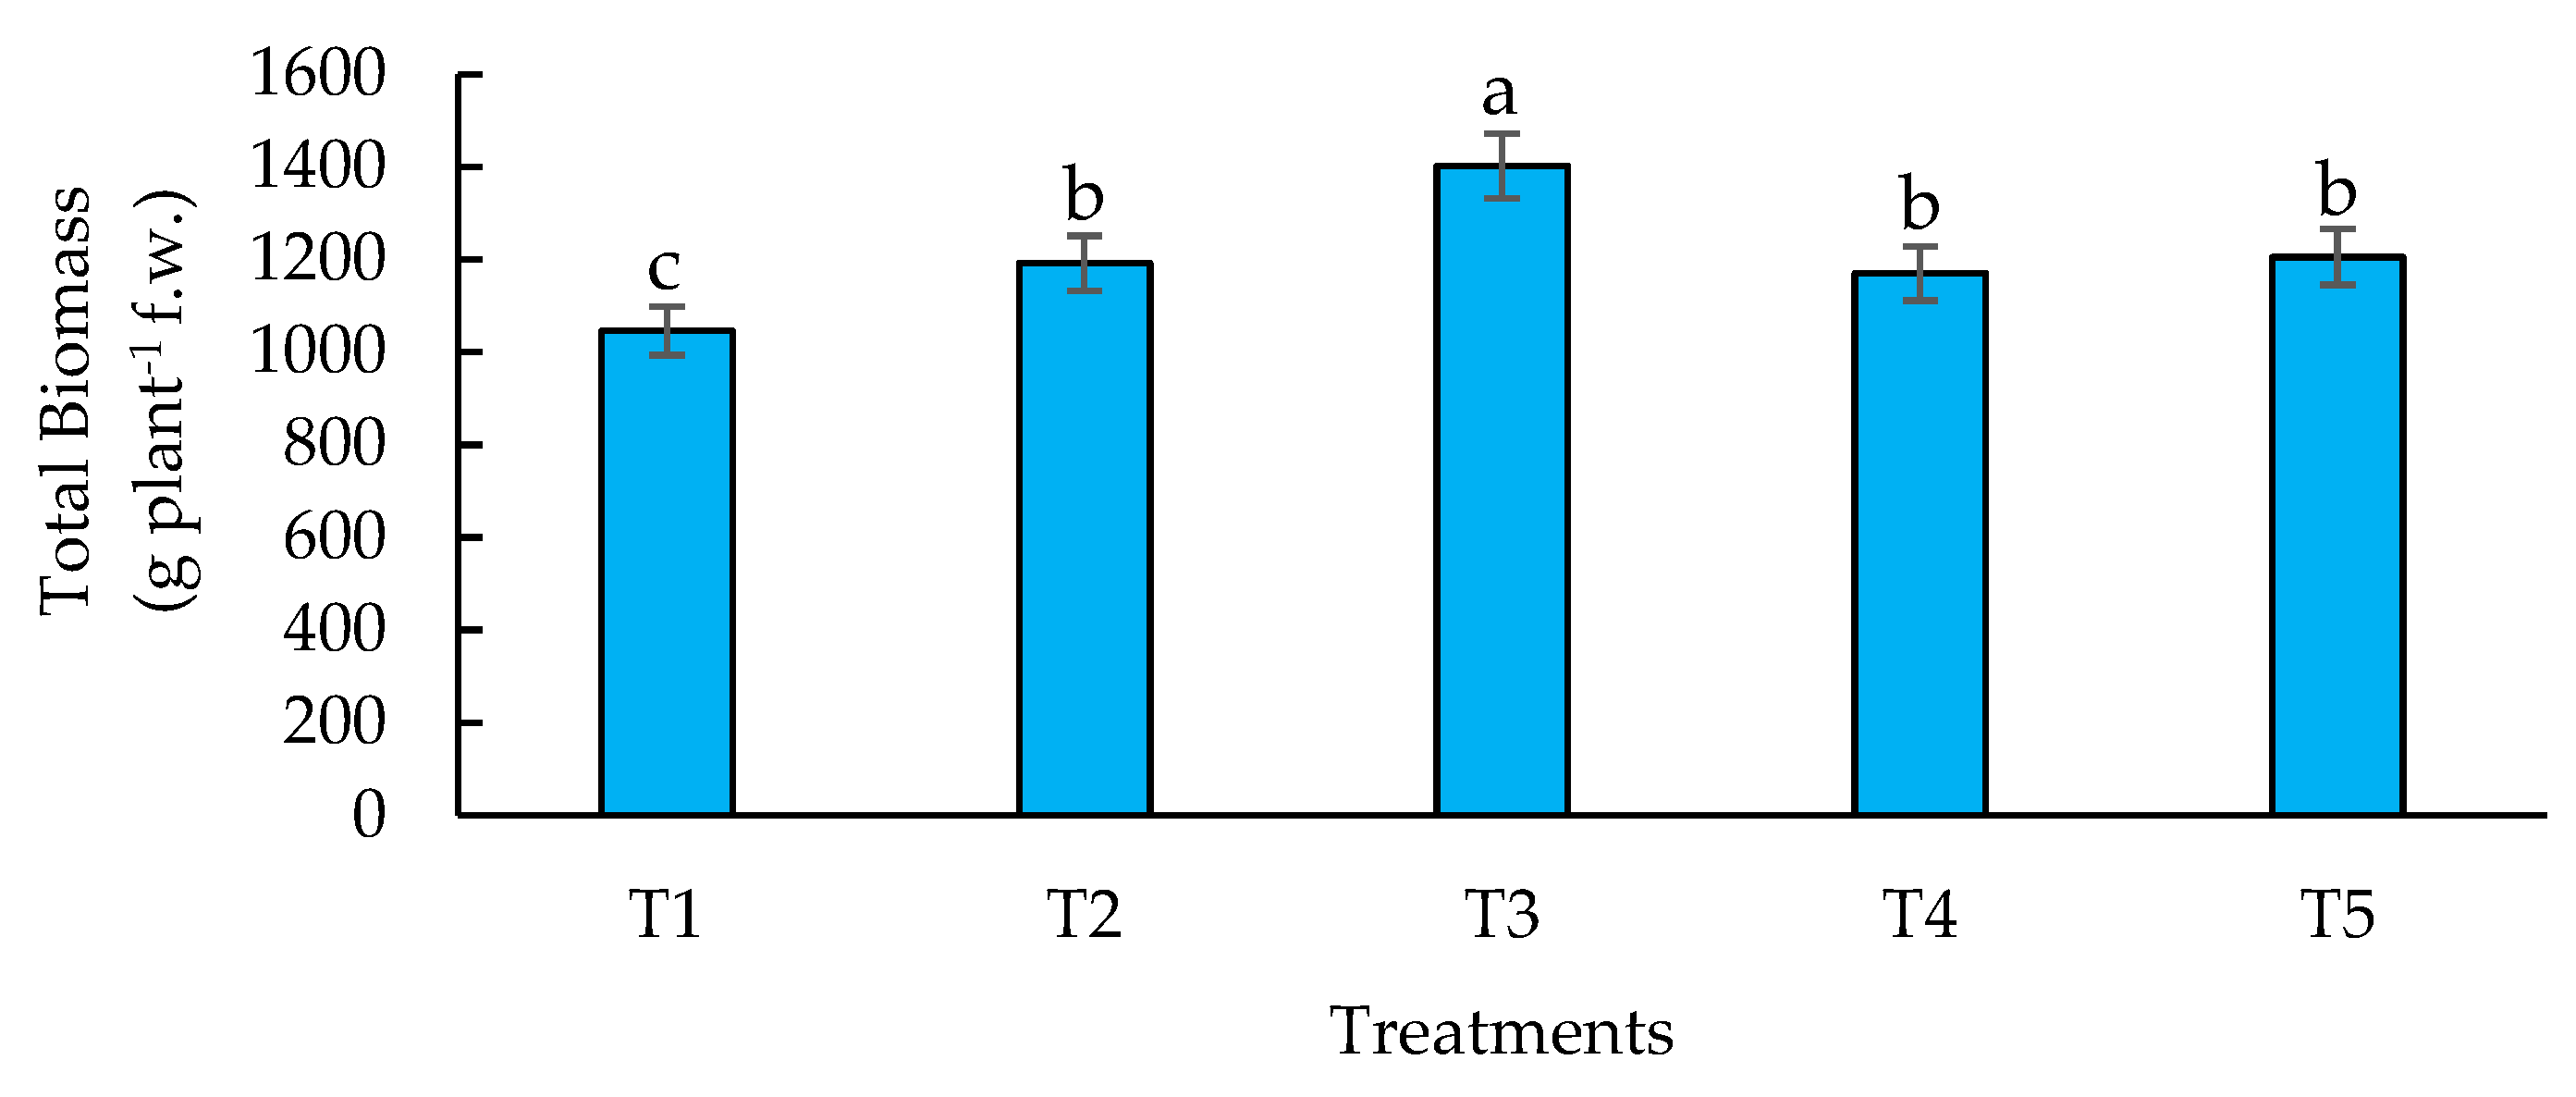
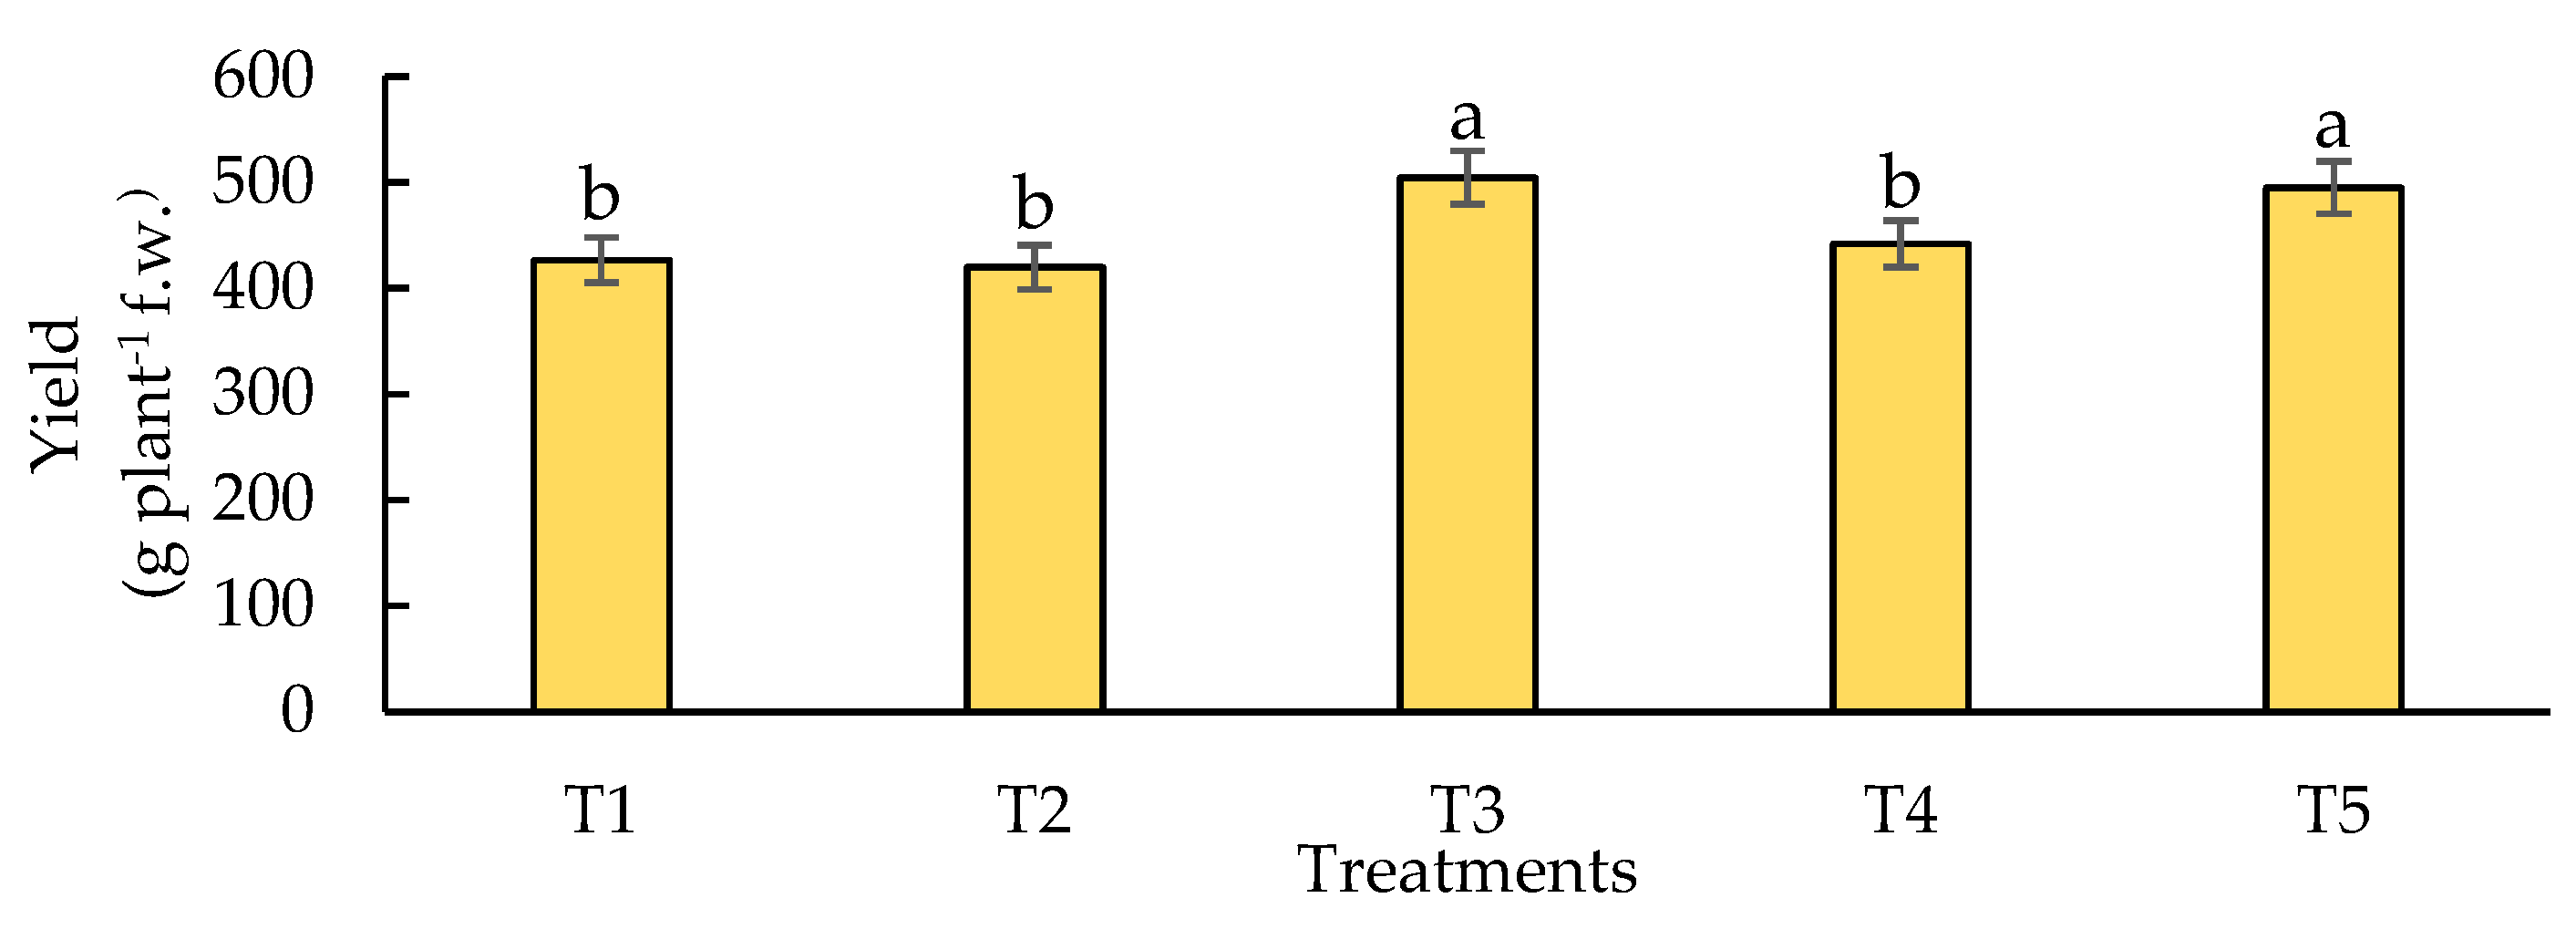
3.1. Biomass and Yield
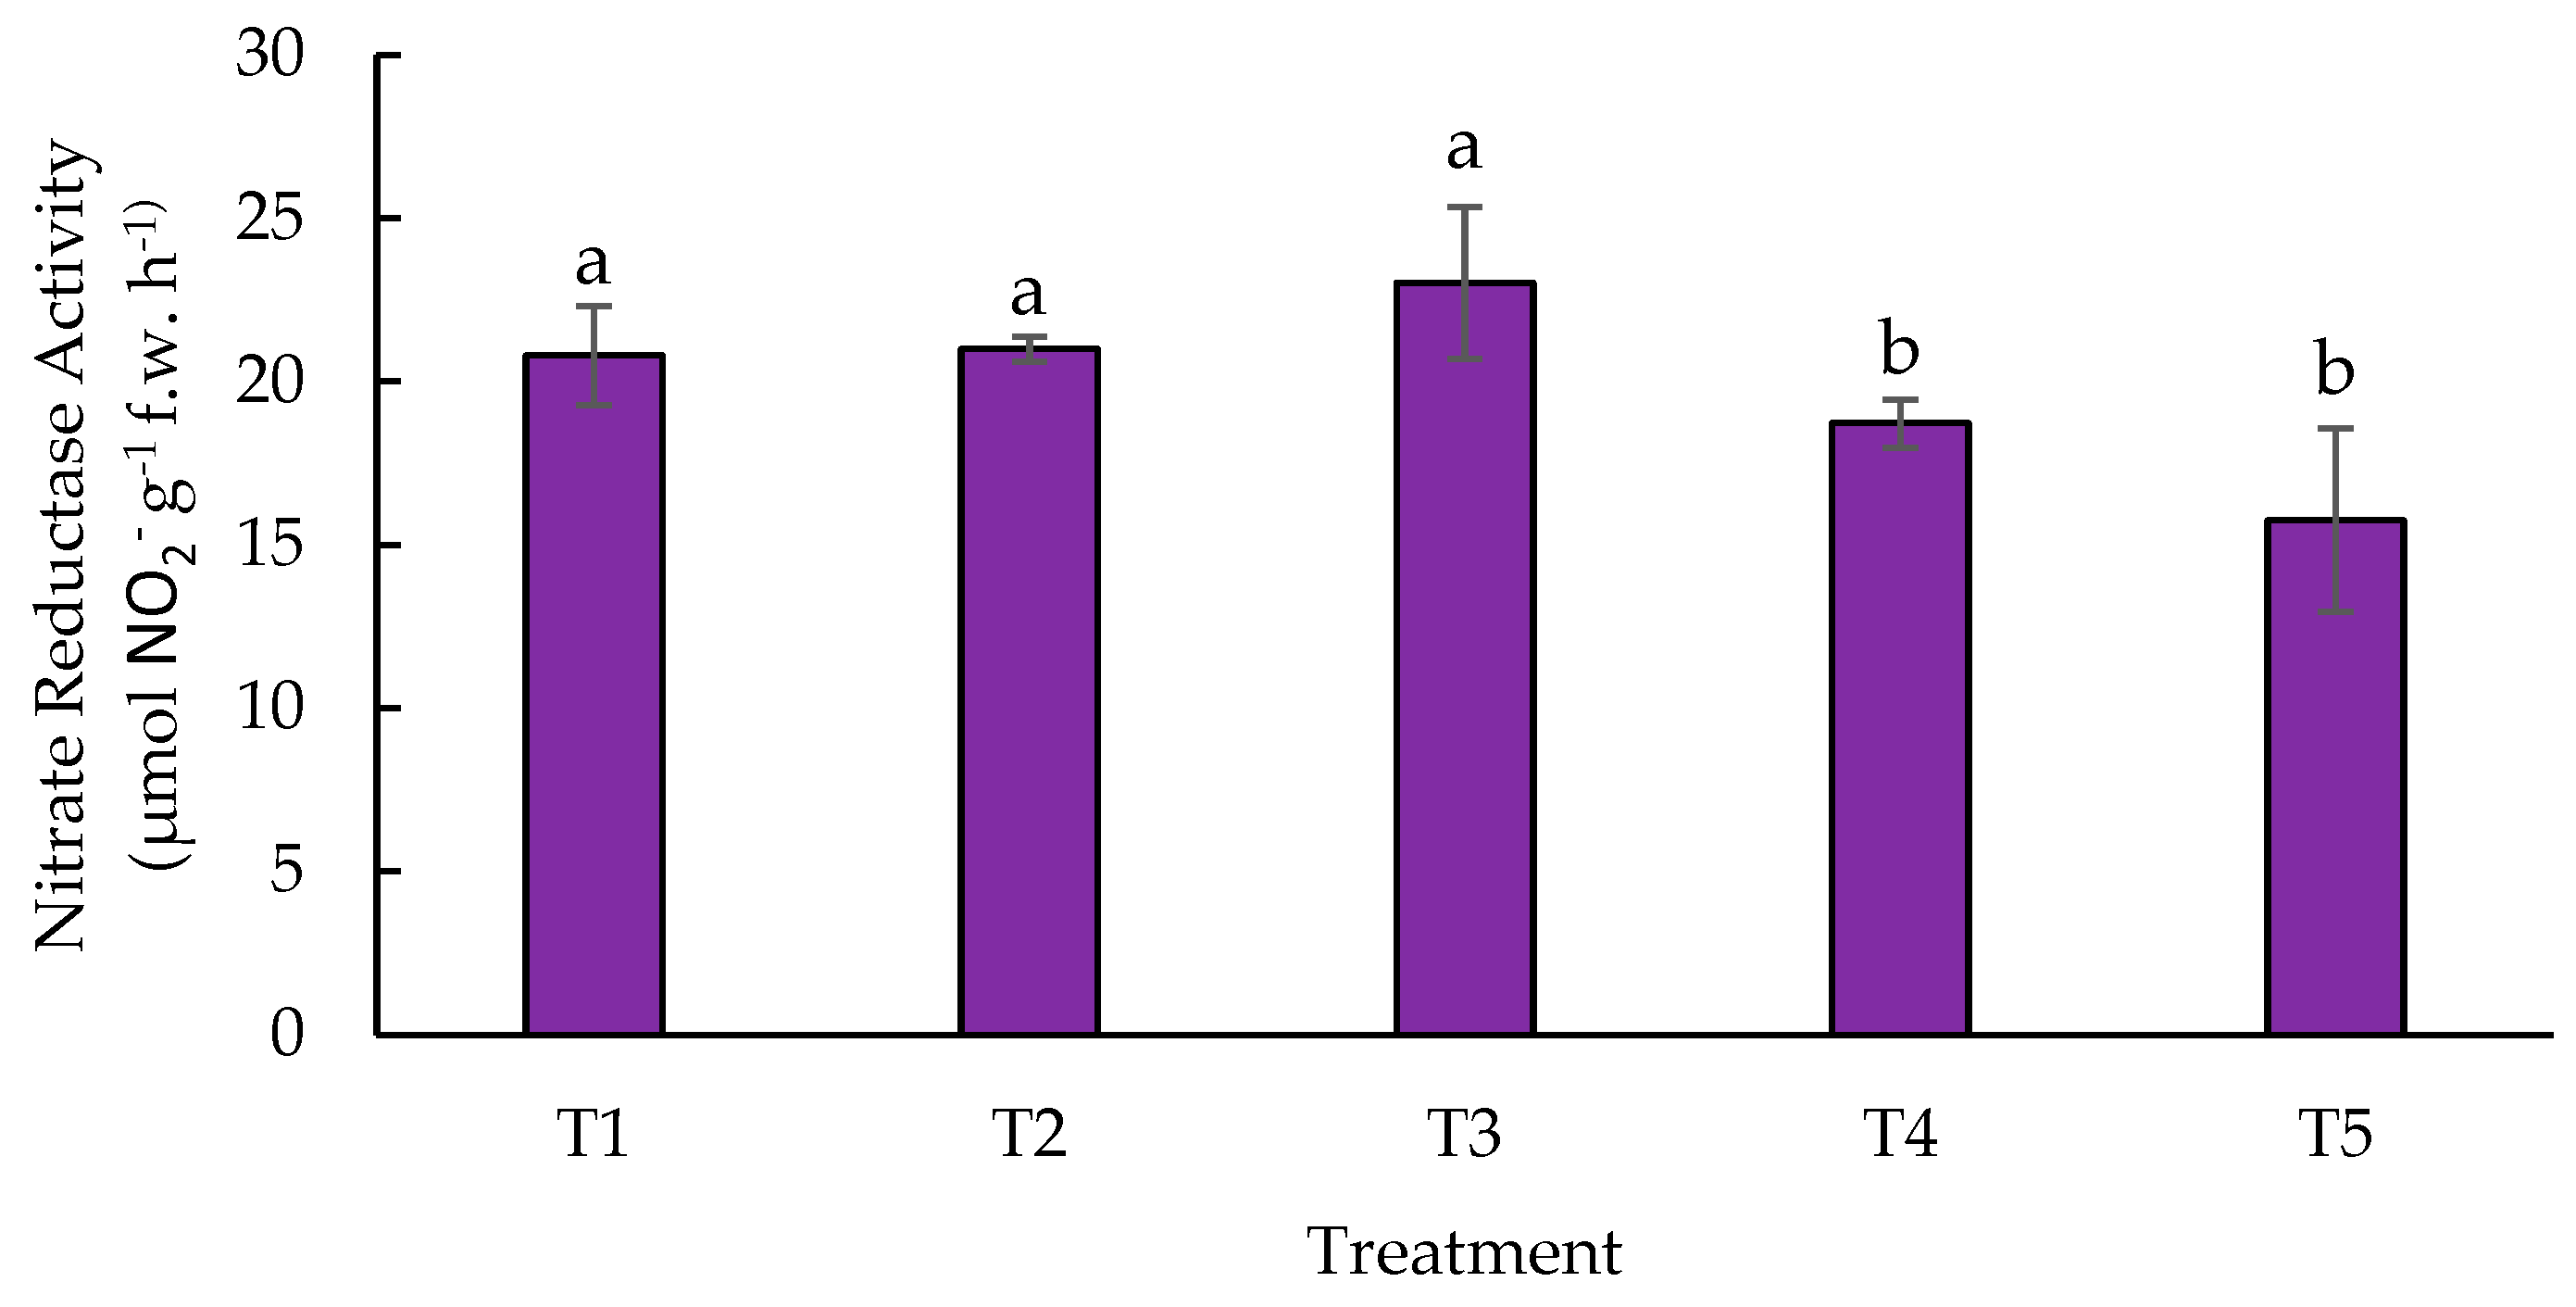
3.2. Nitrate Reductase Enzyme Activity (NR Activity) “In Vivo”
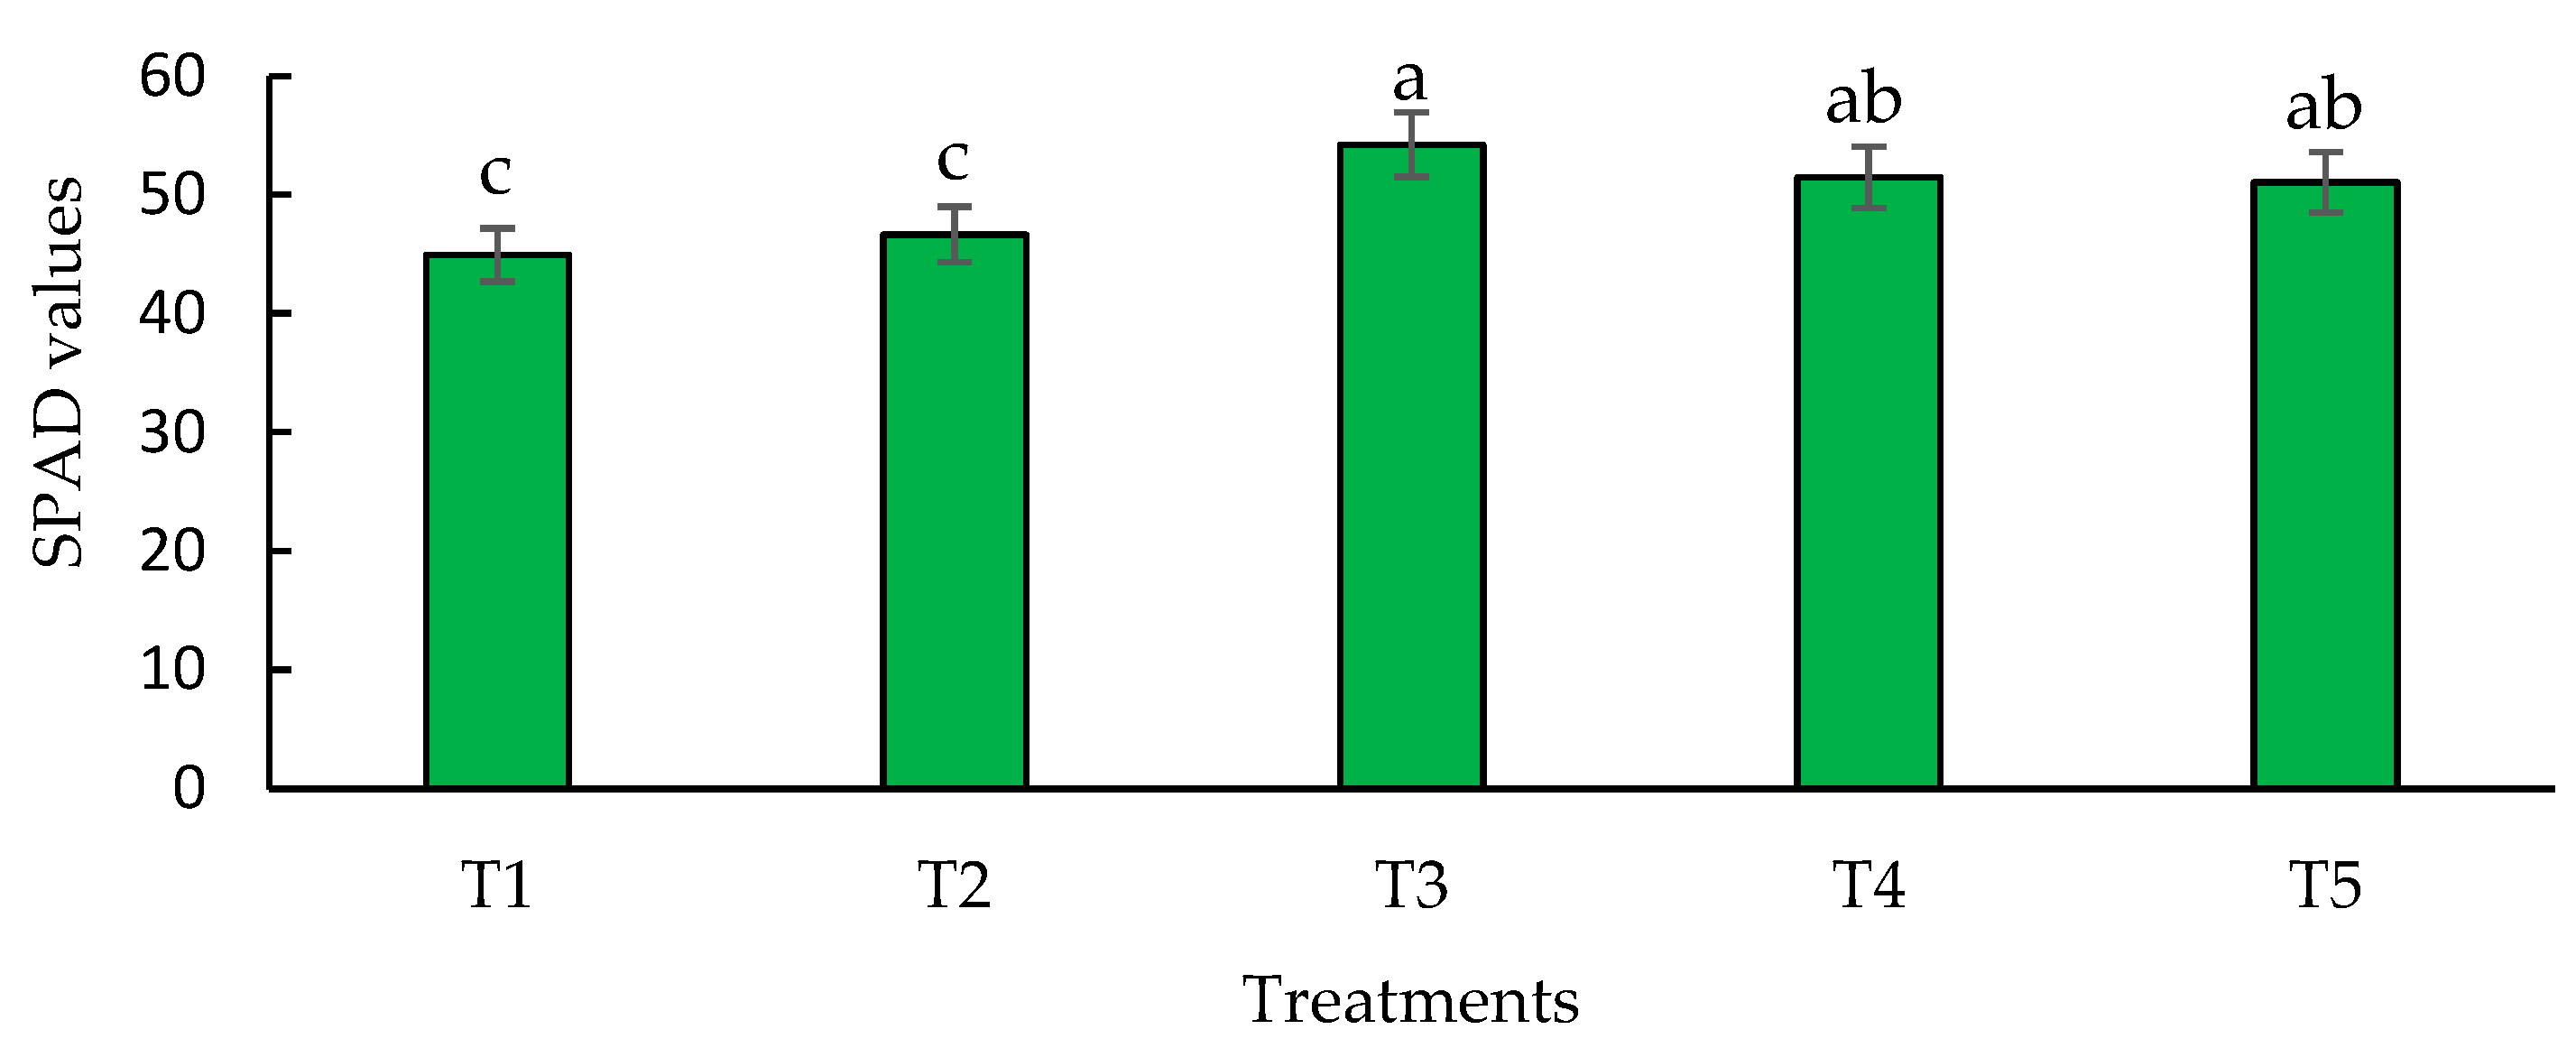
3.3. SPAD Values
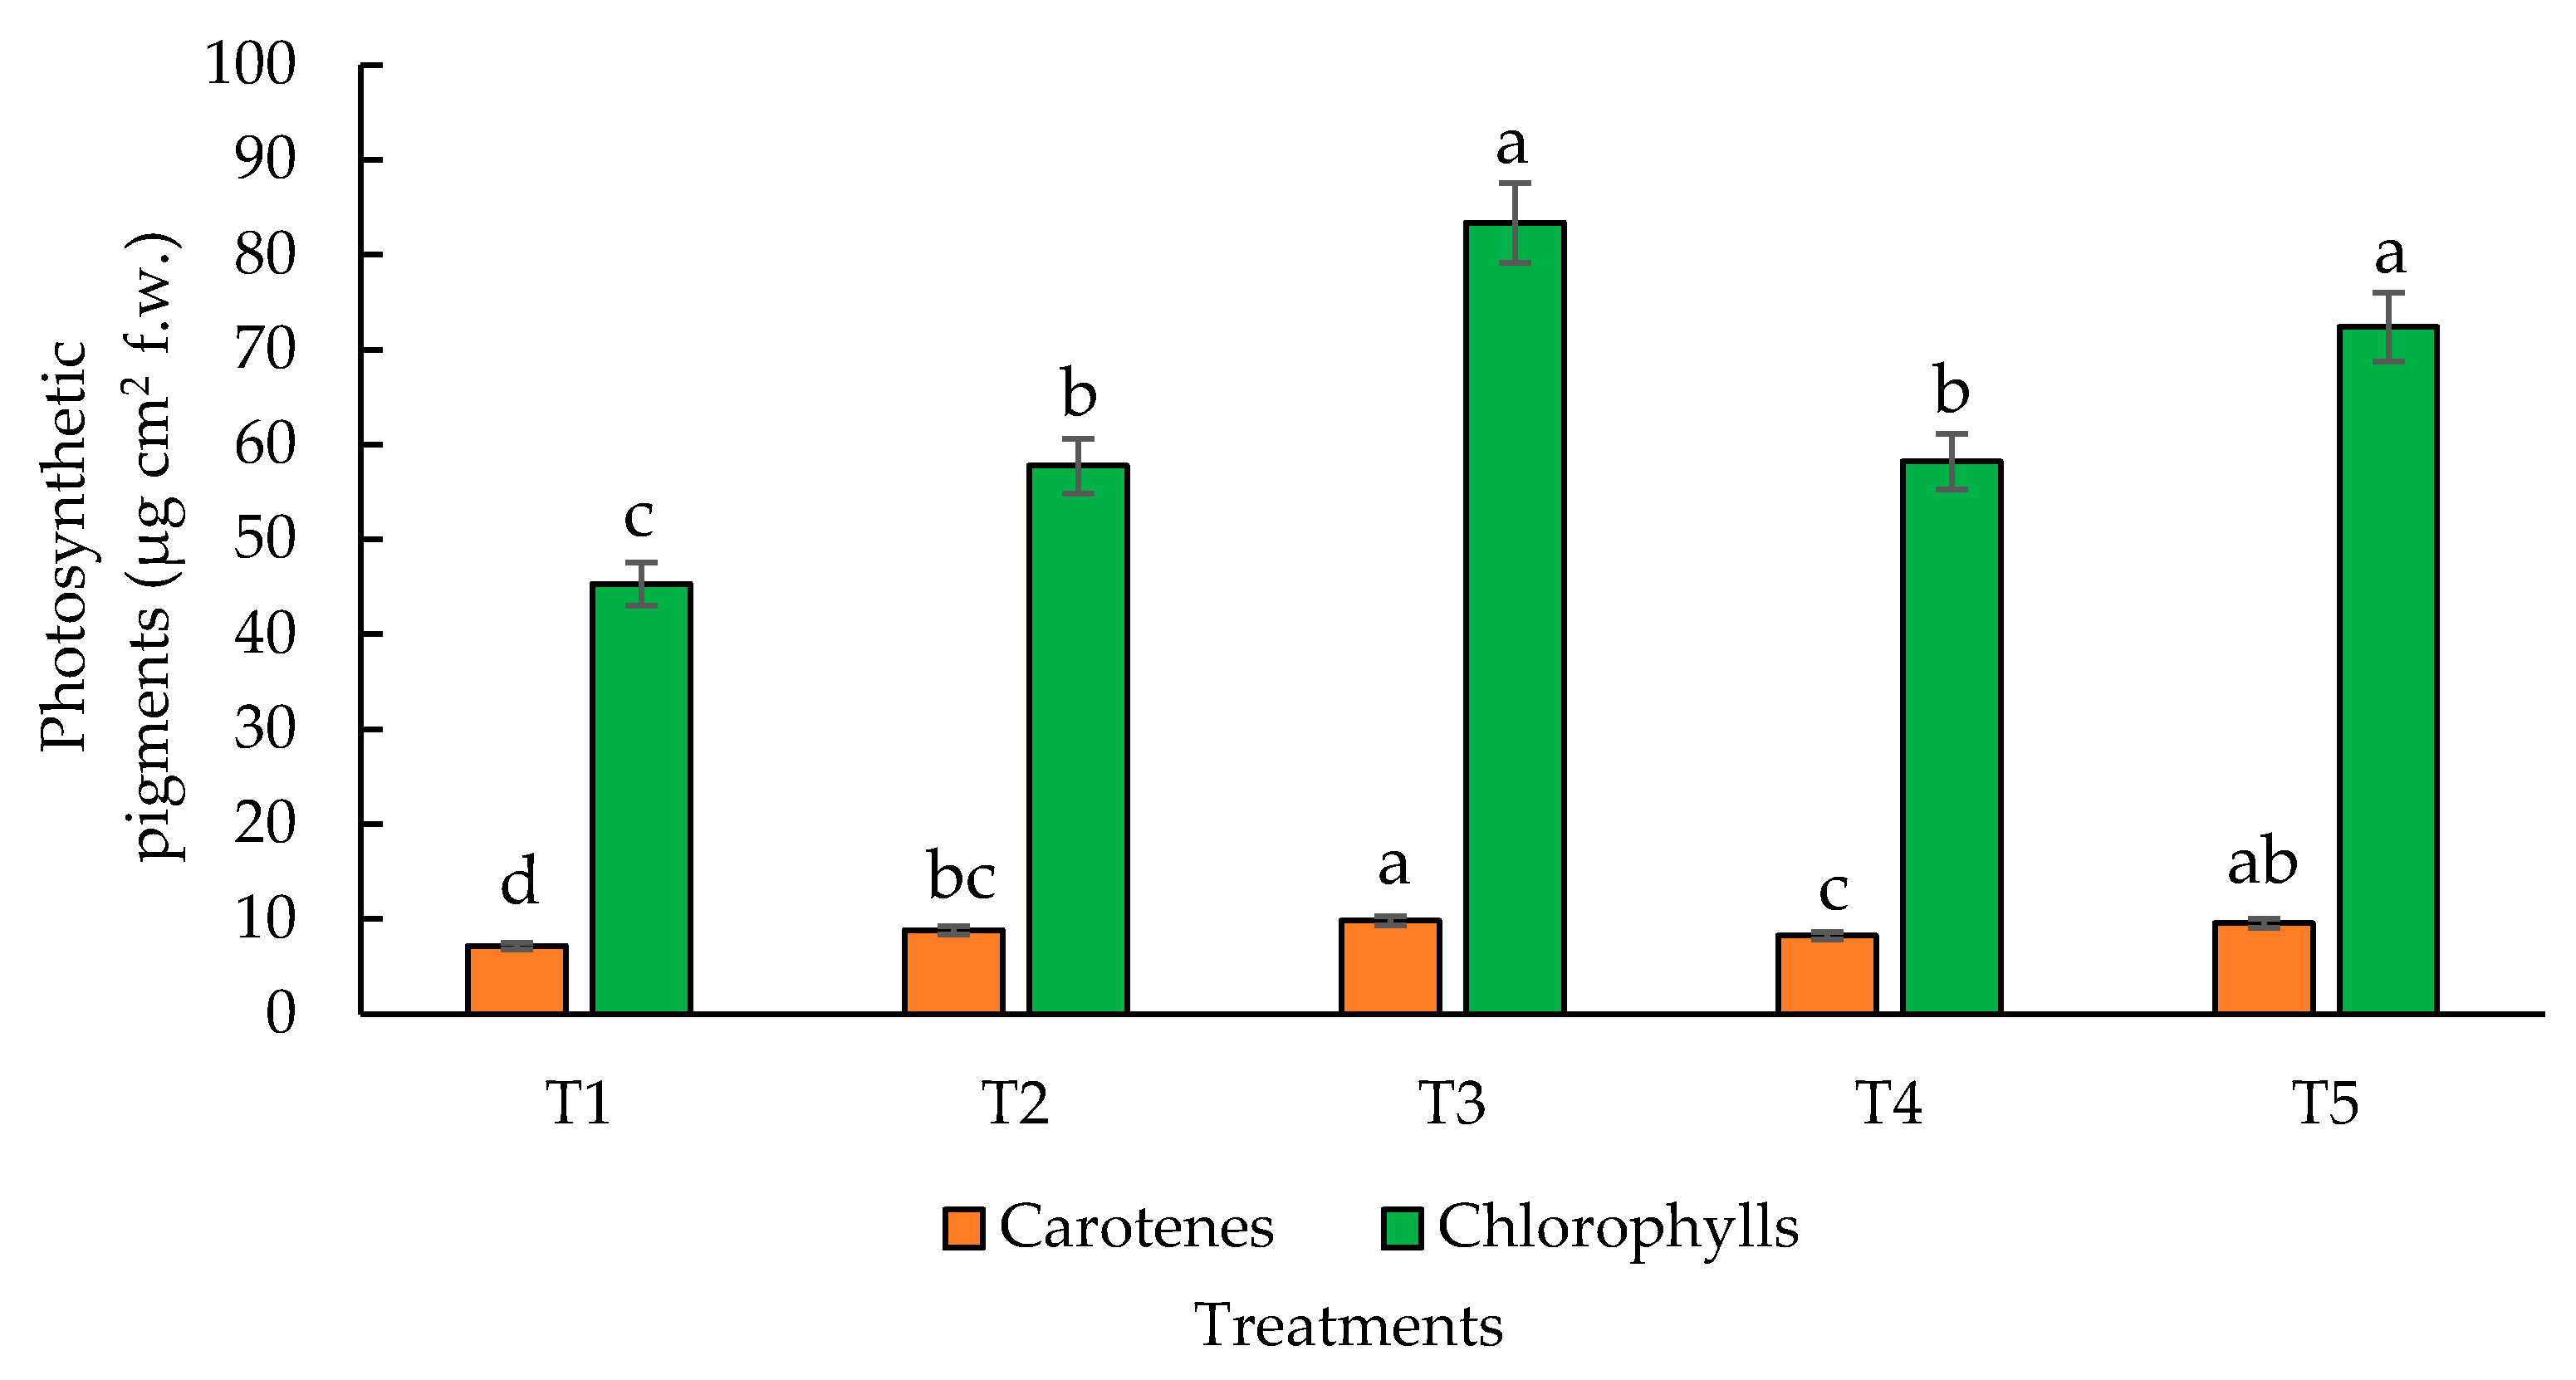
3.4. Photosynthetic Pigments
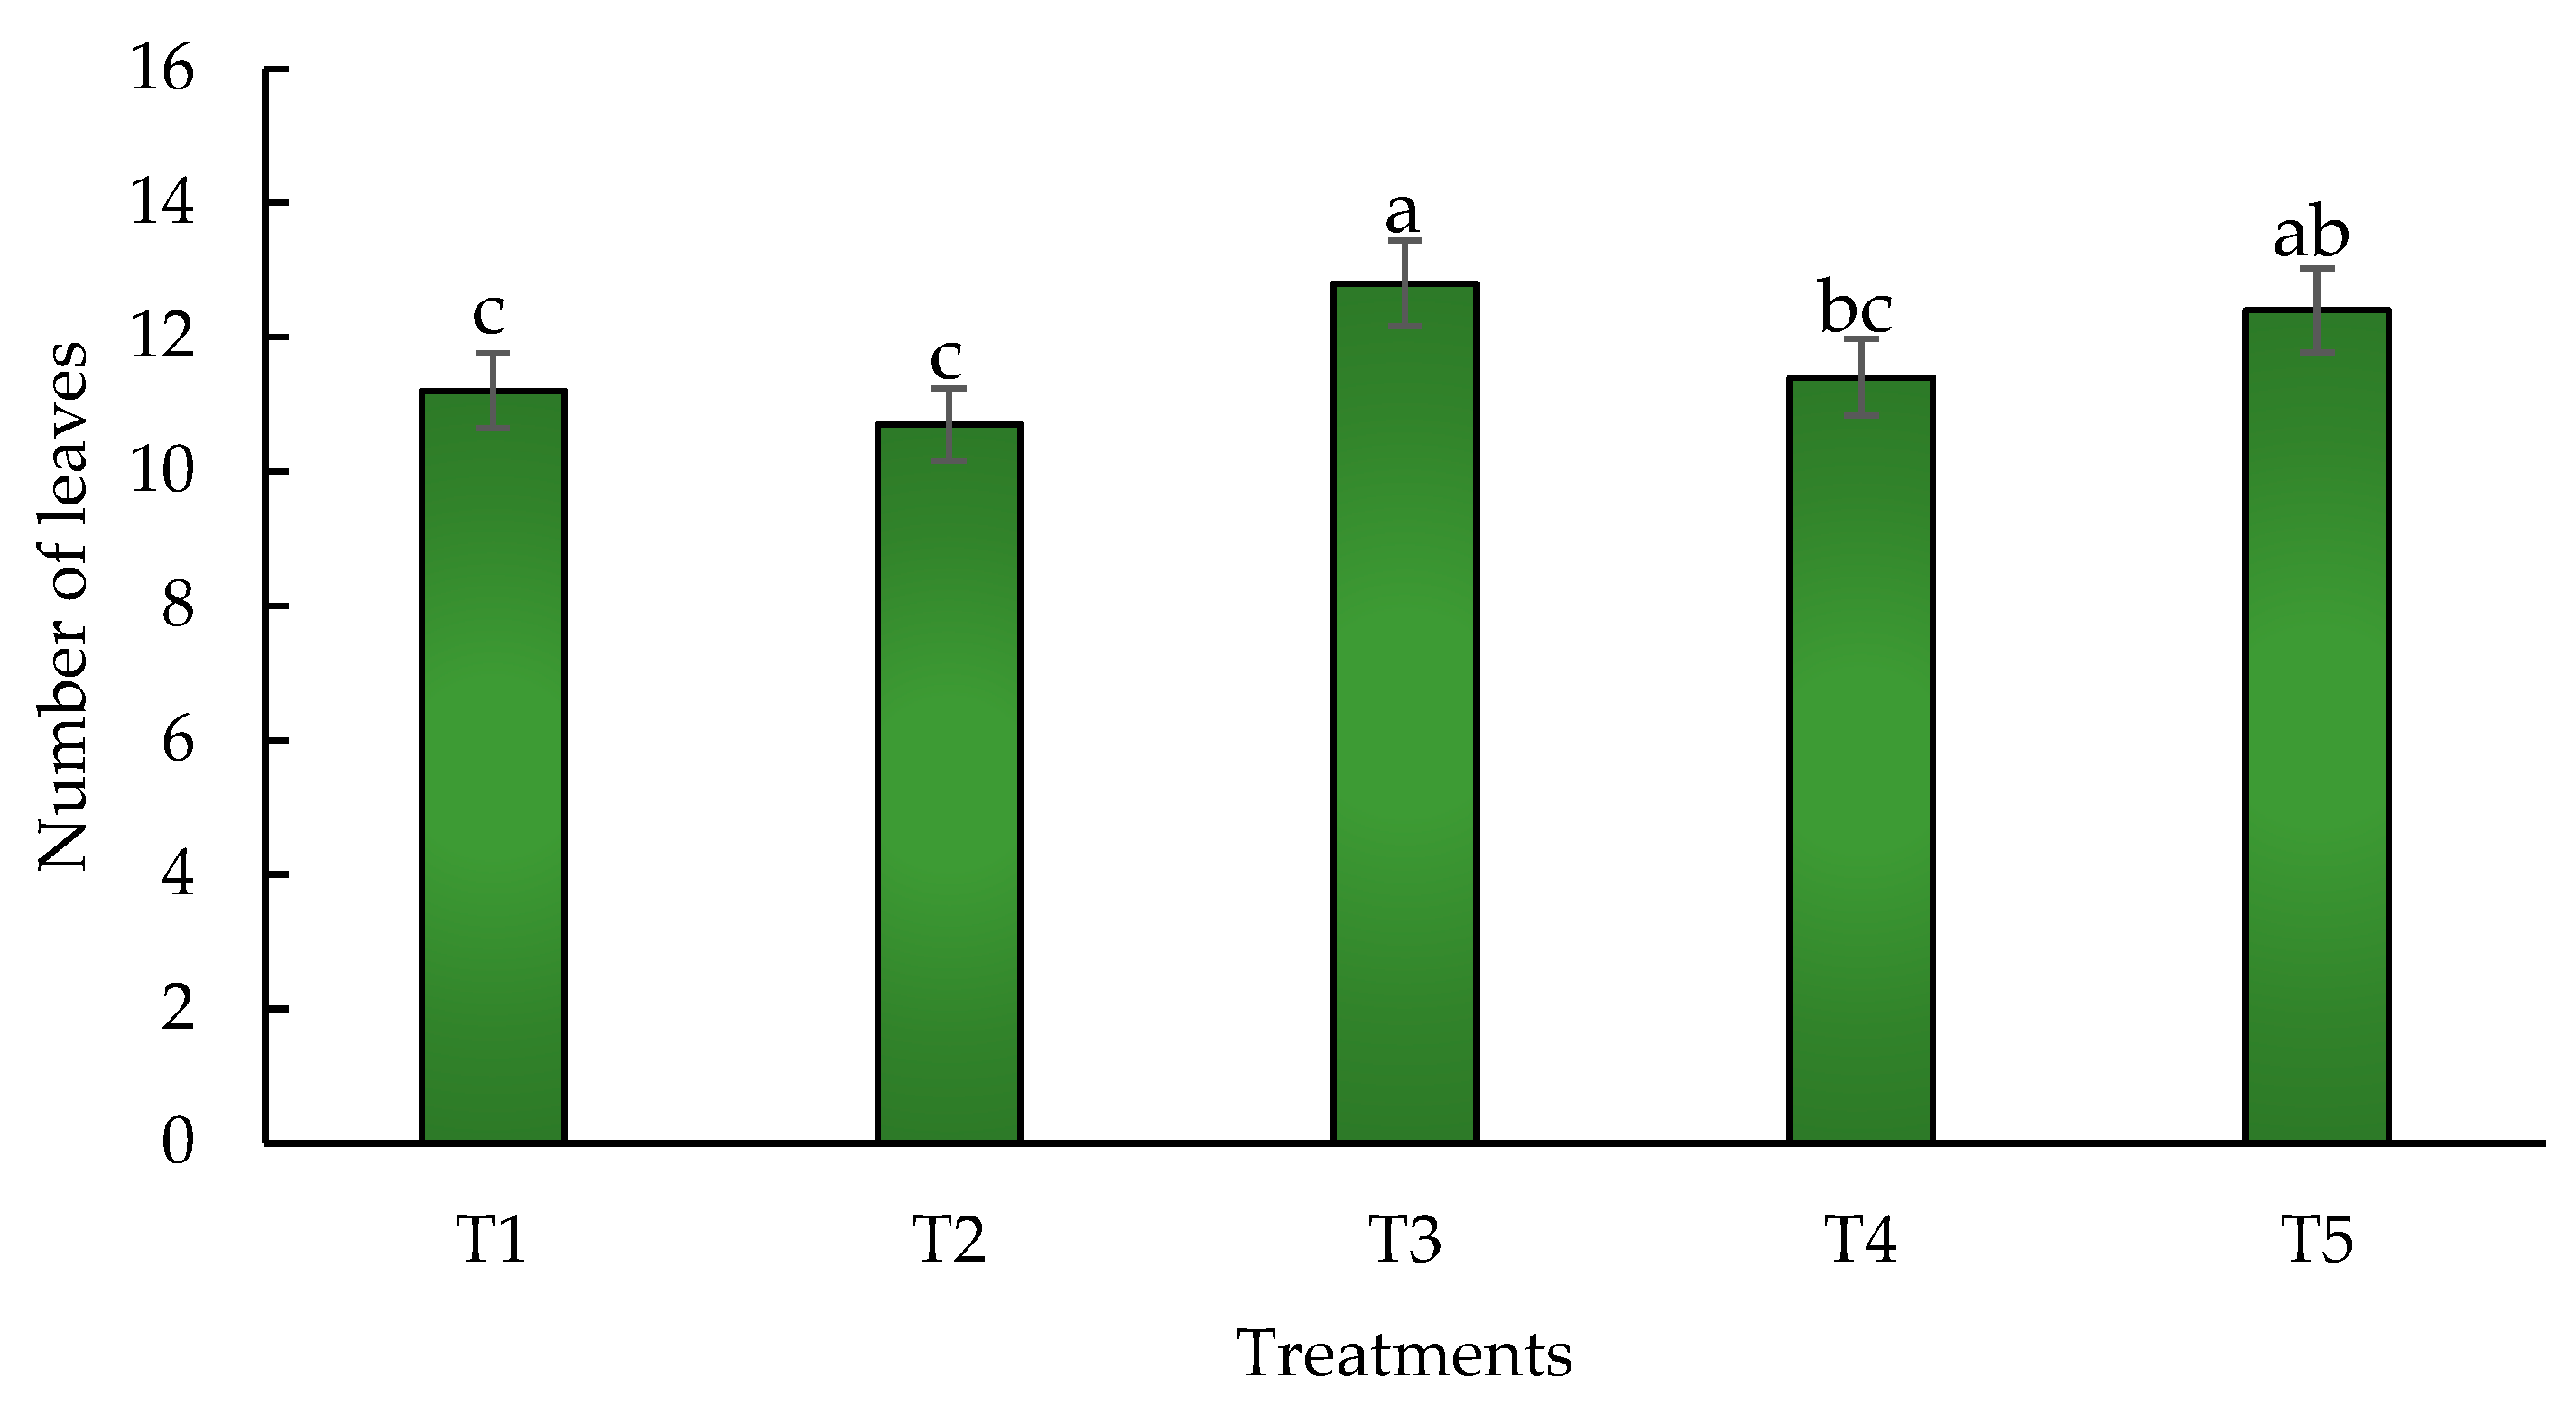
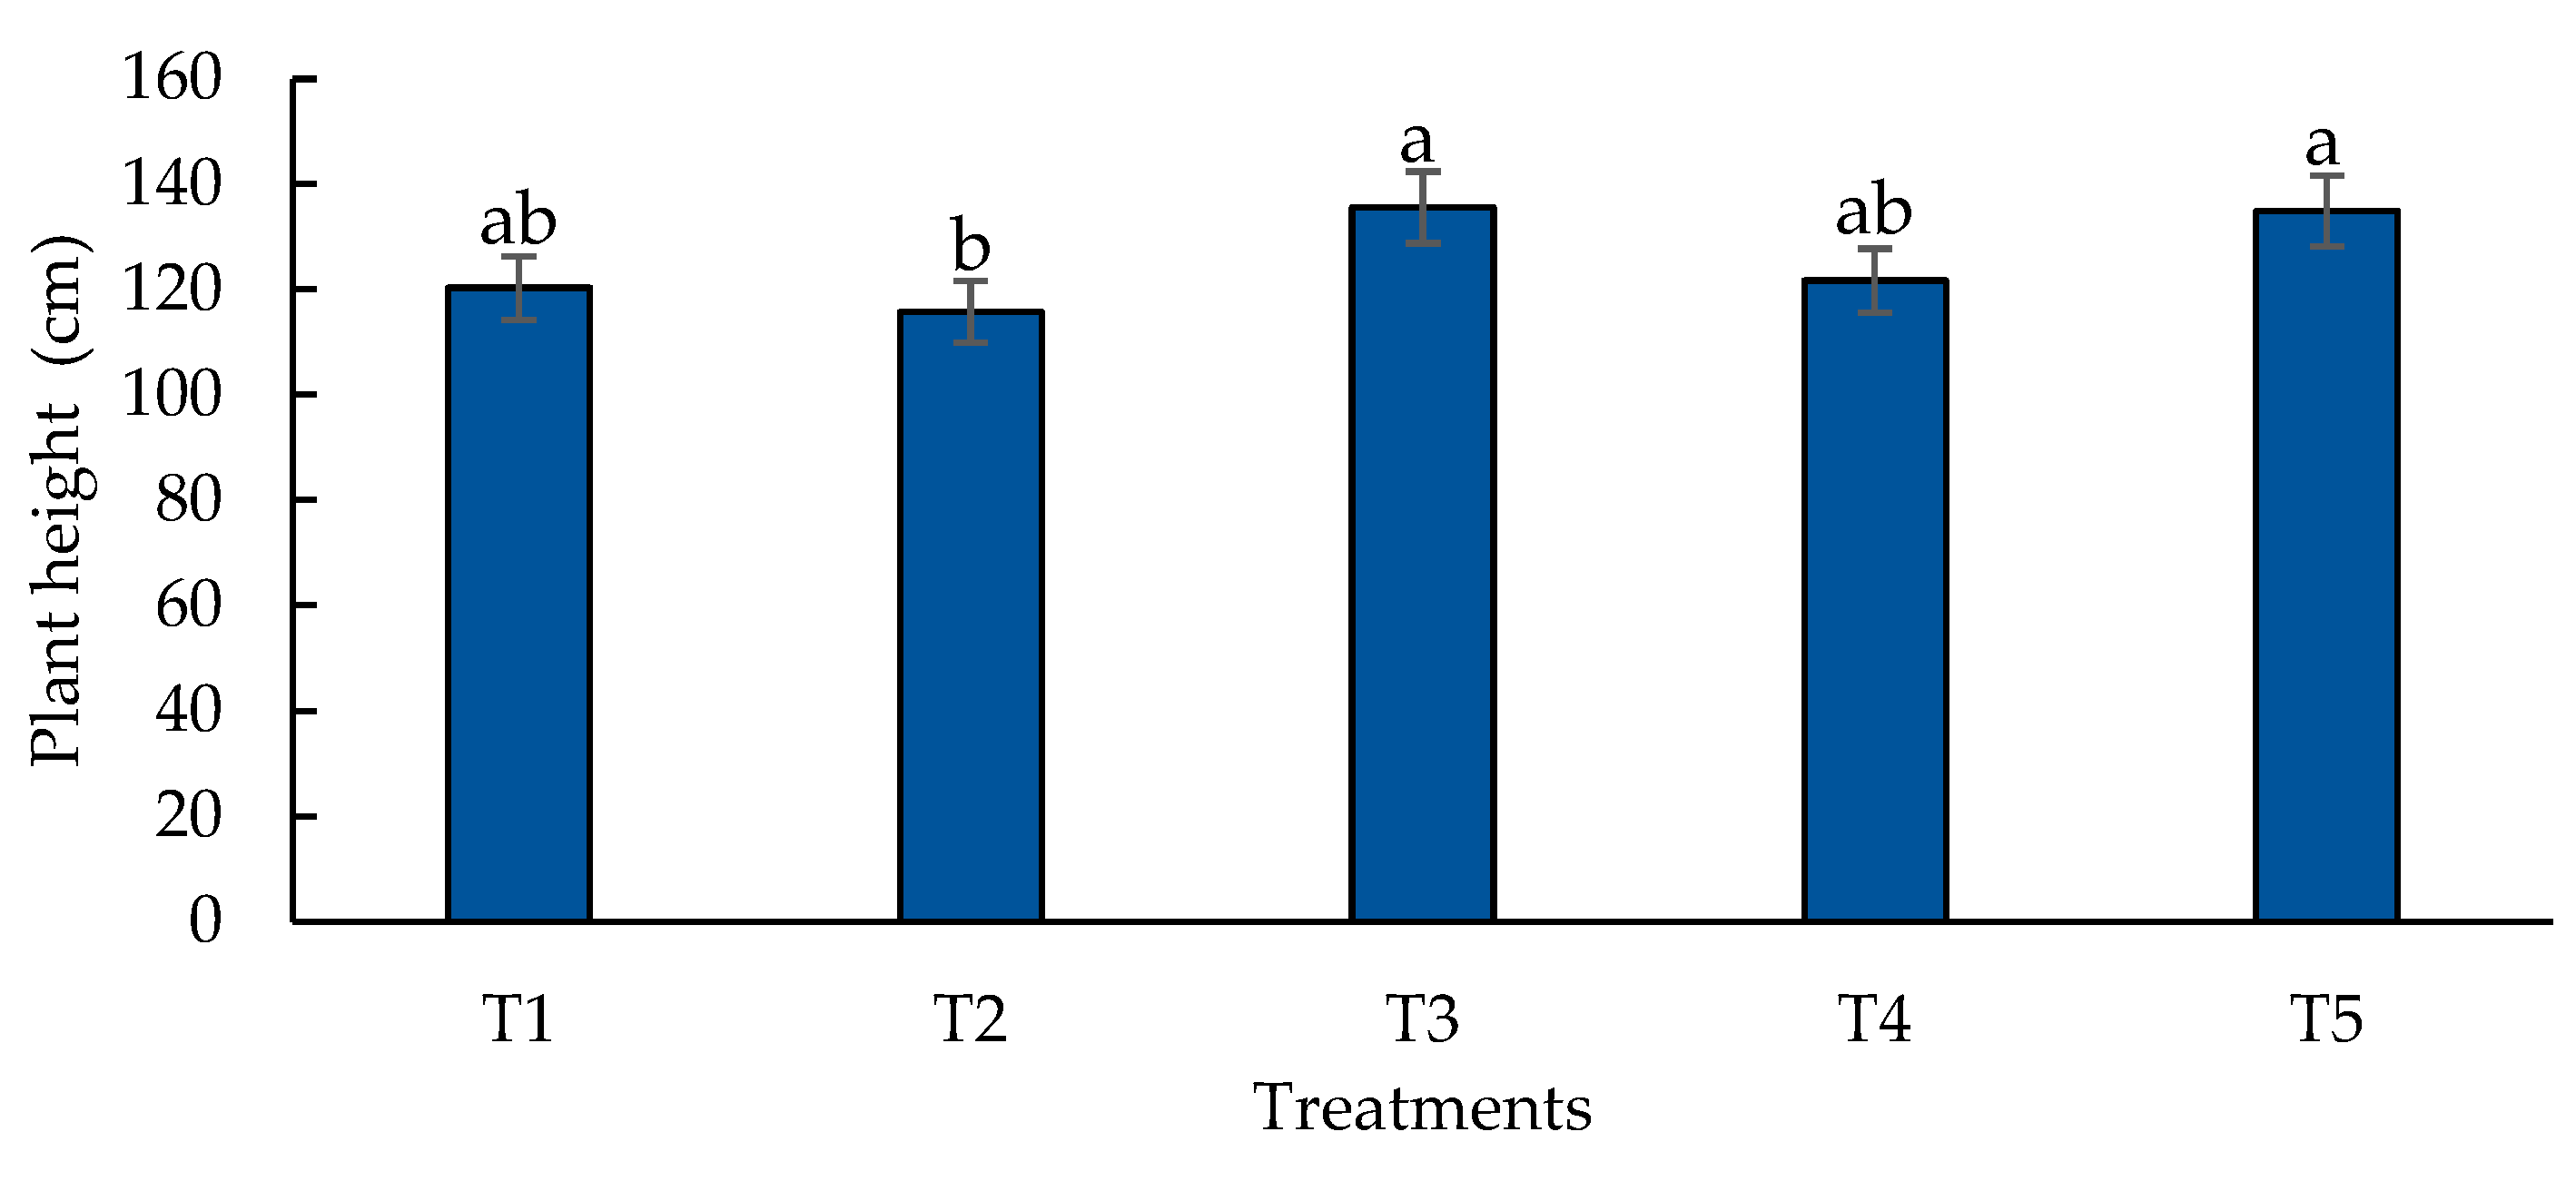
3.5. Number of Leaves and Plant Height
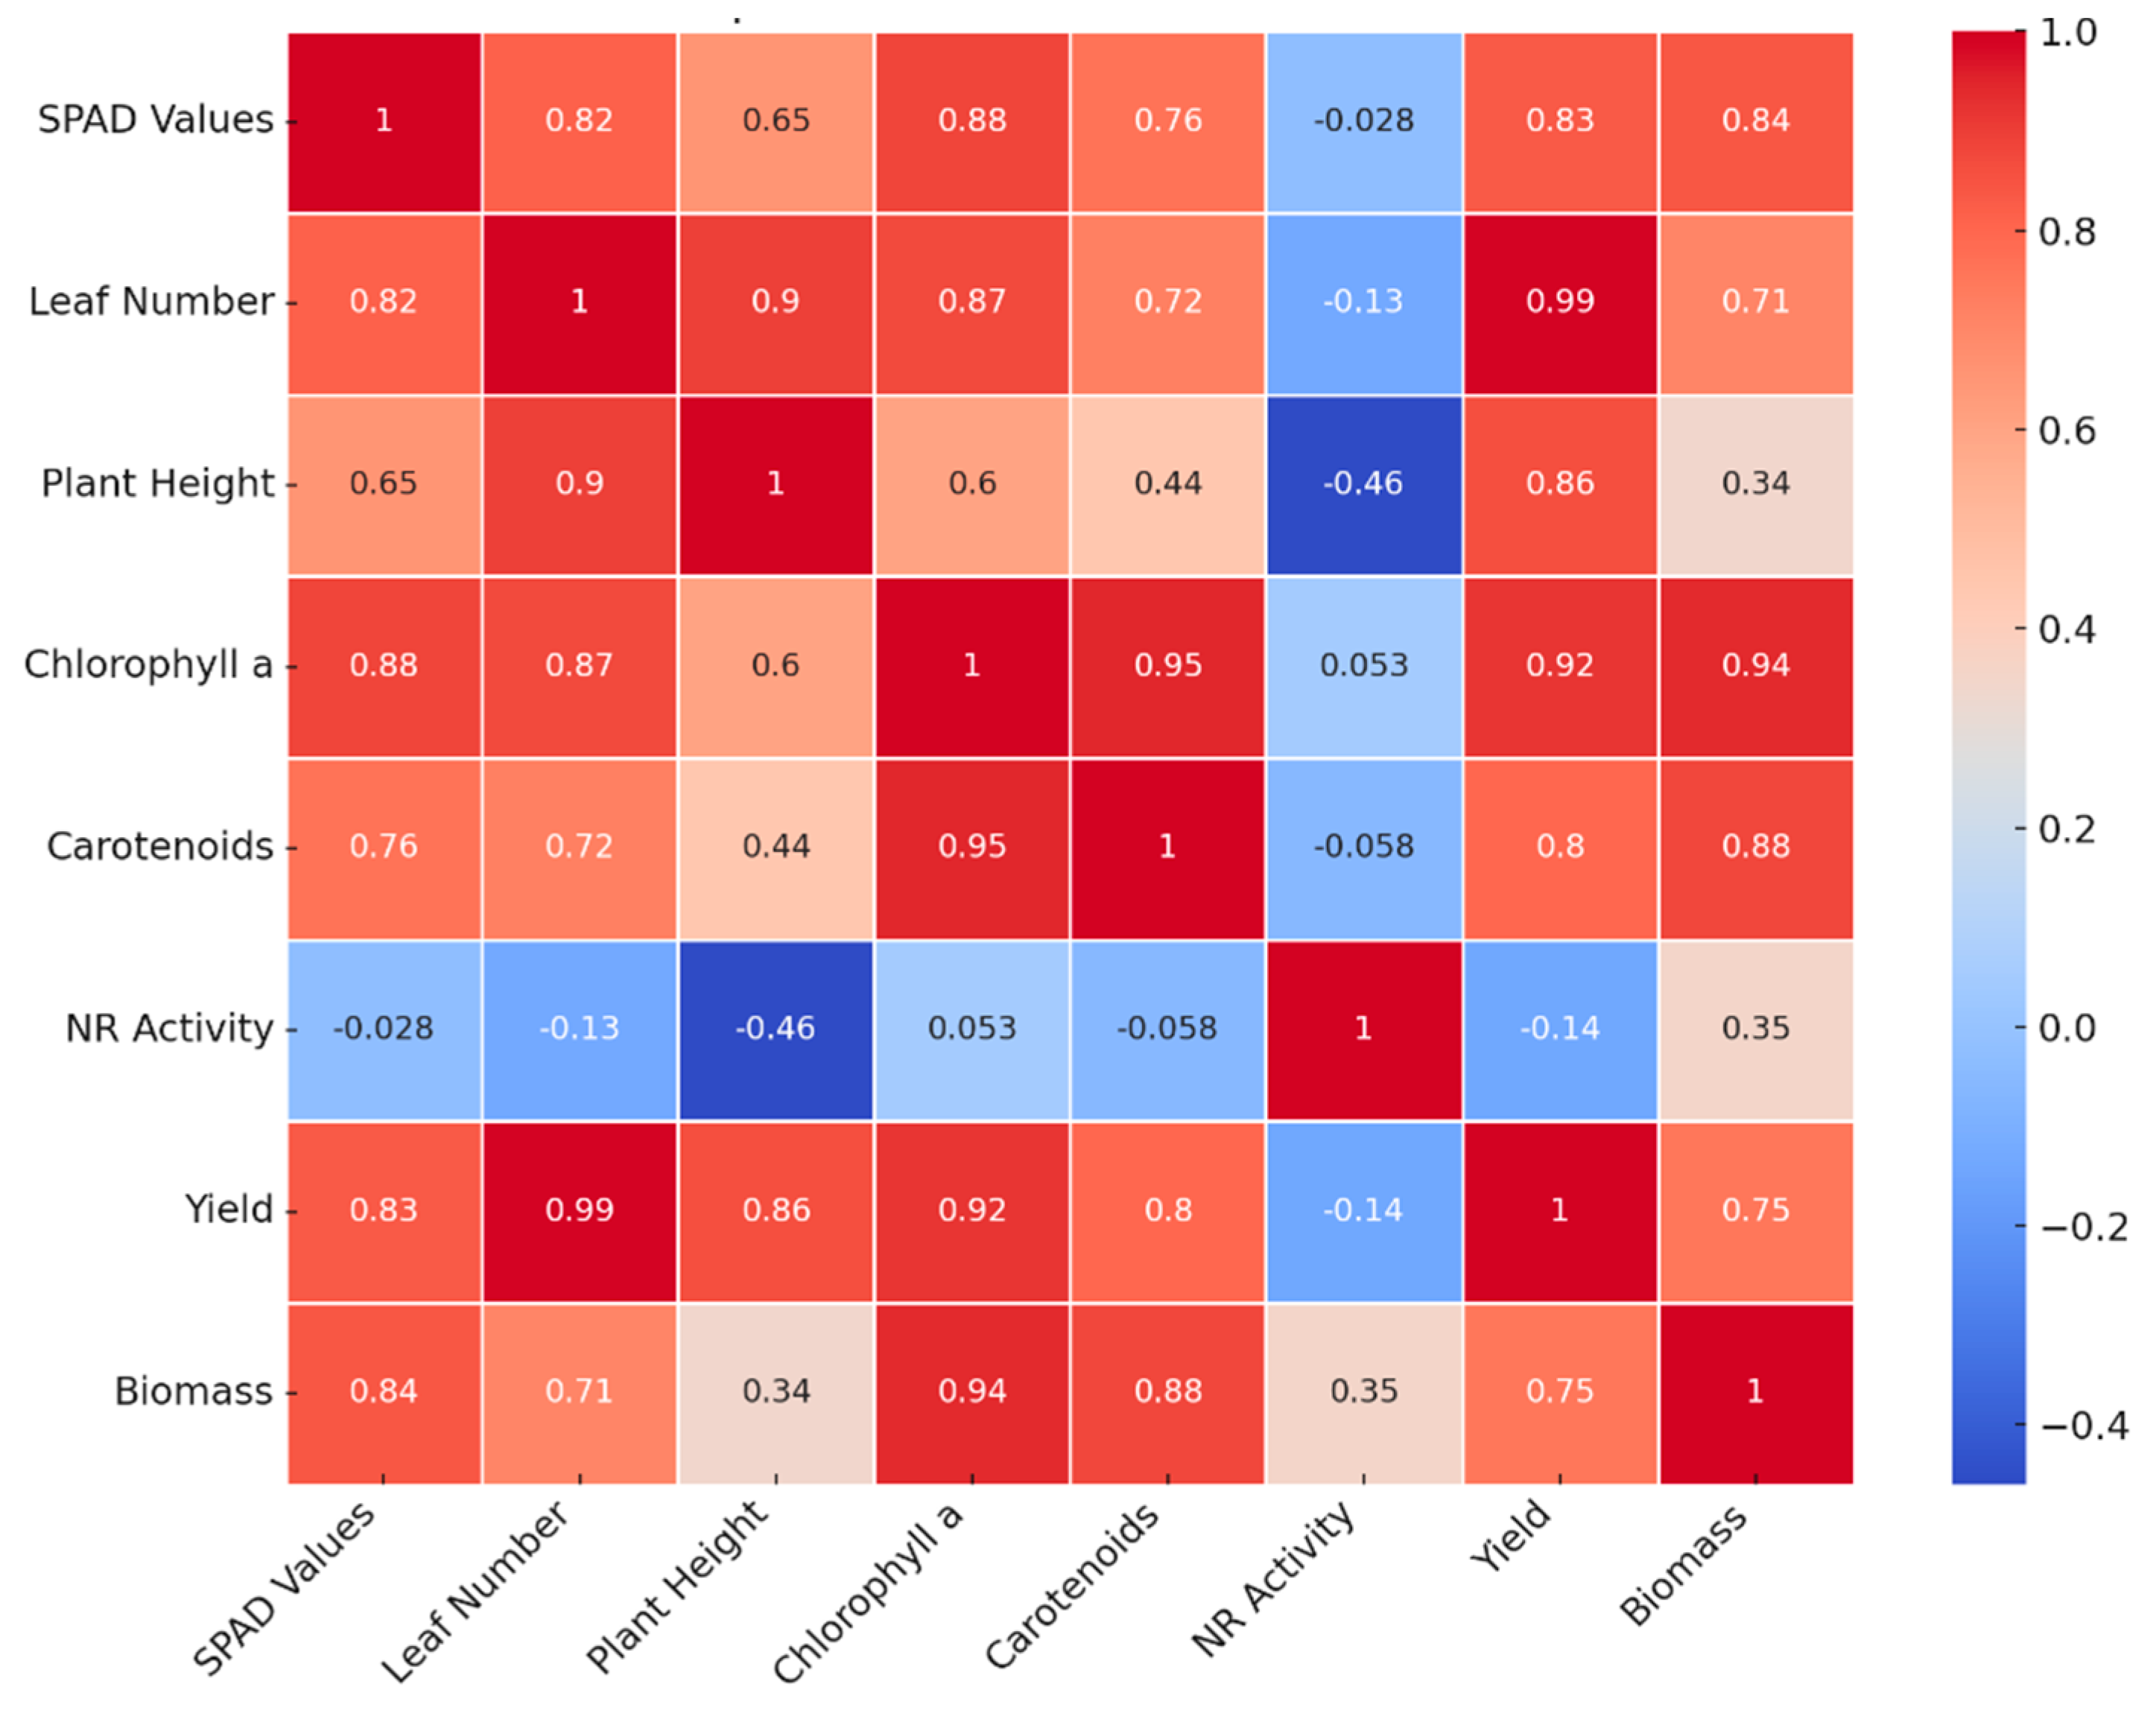
3.6. Correlation Analysis and Heat Map
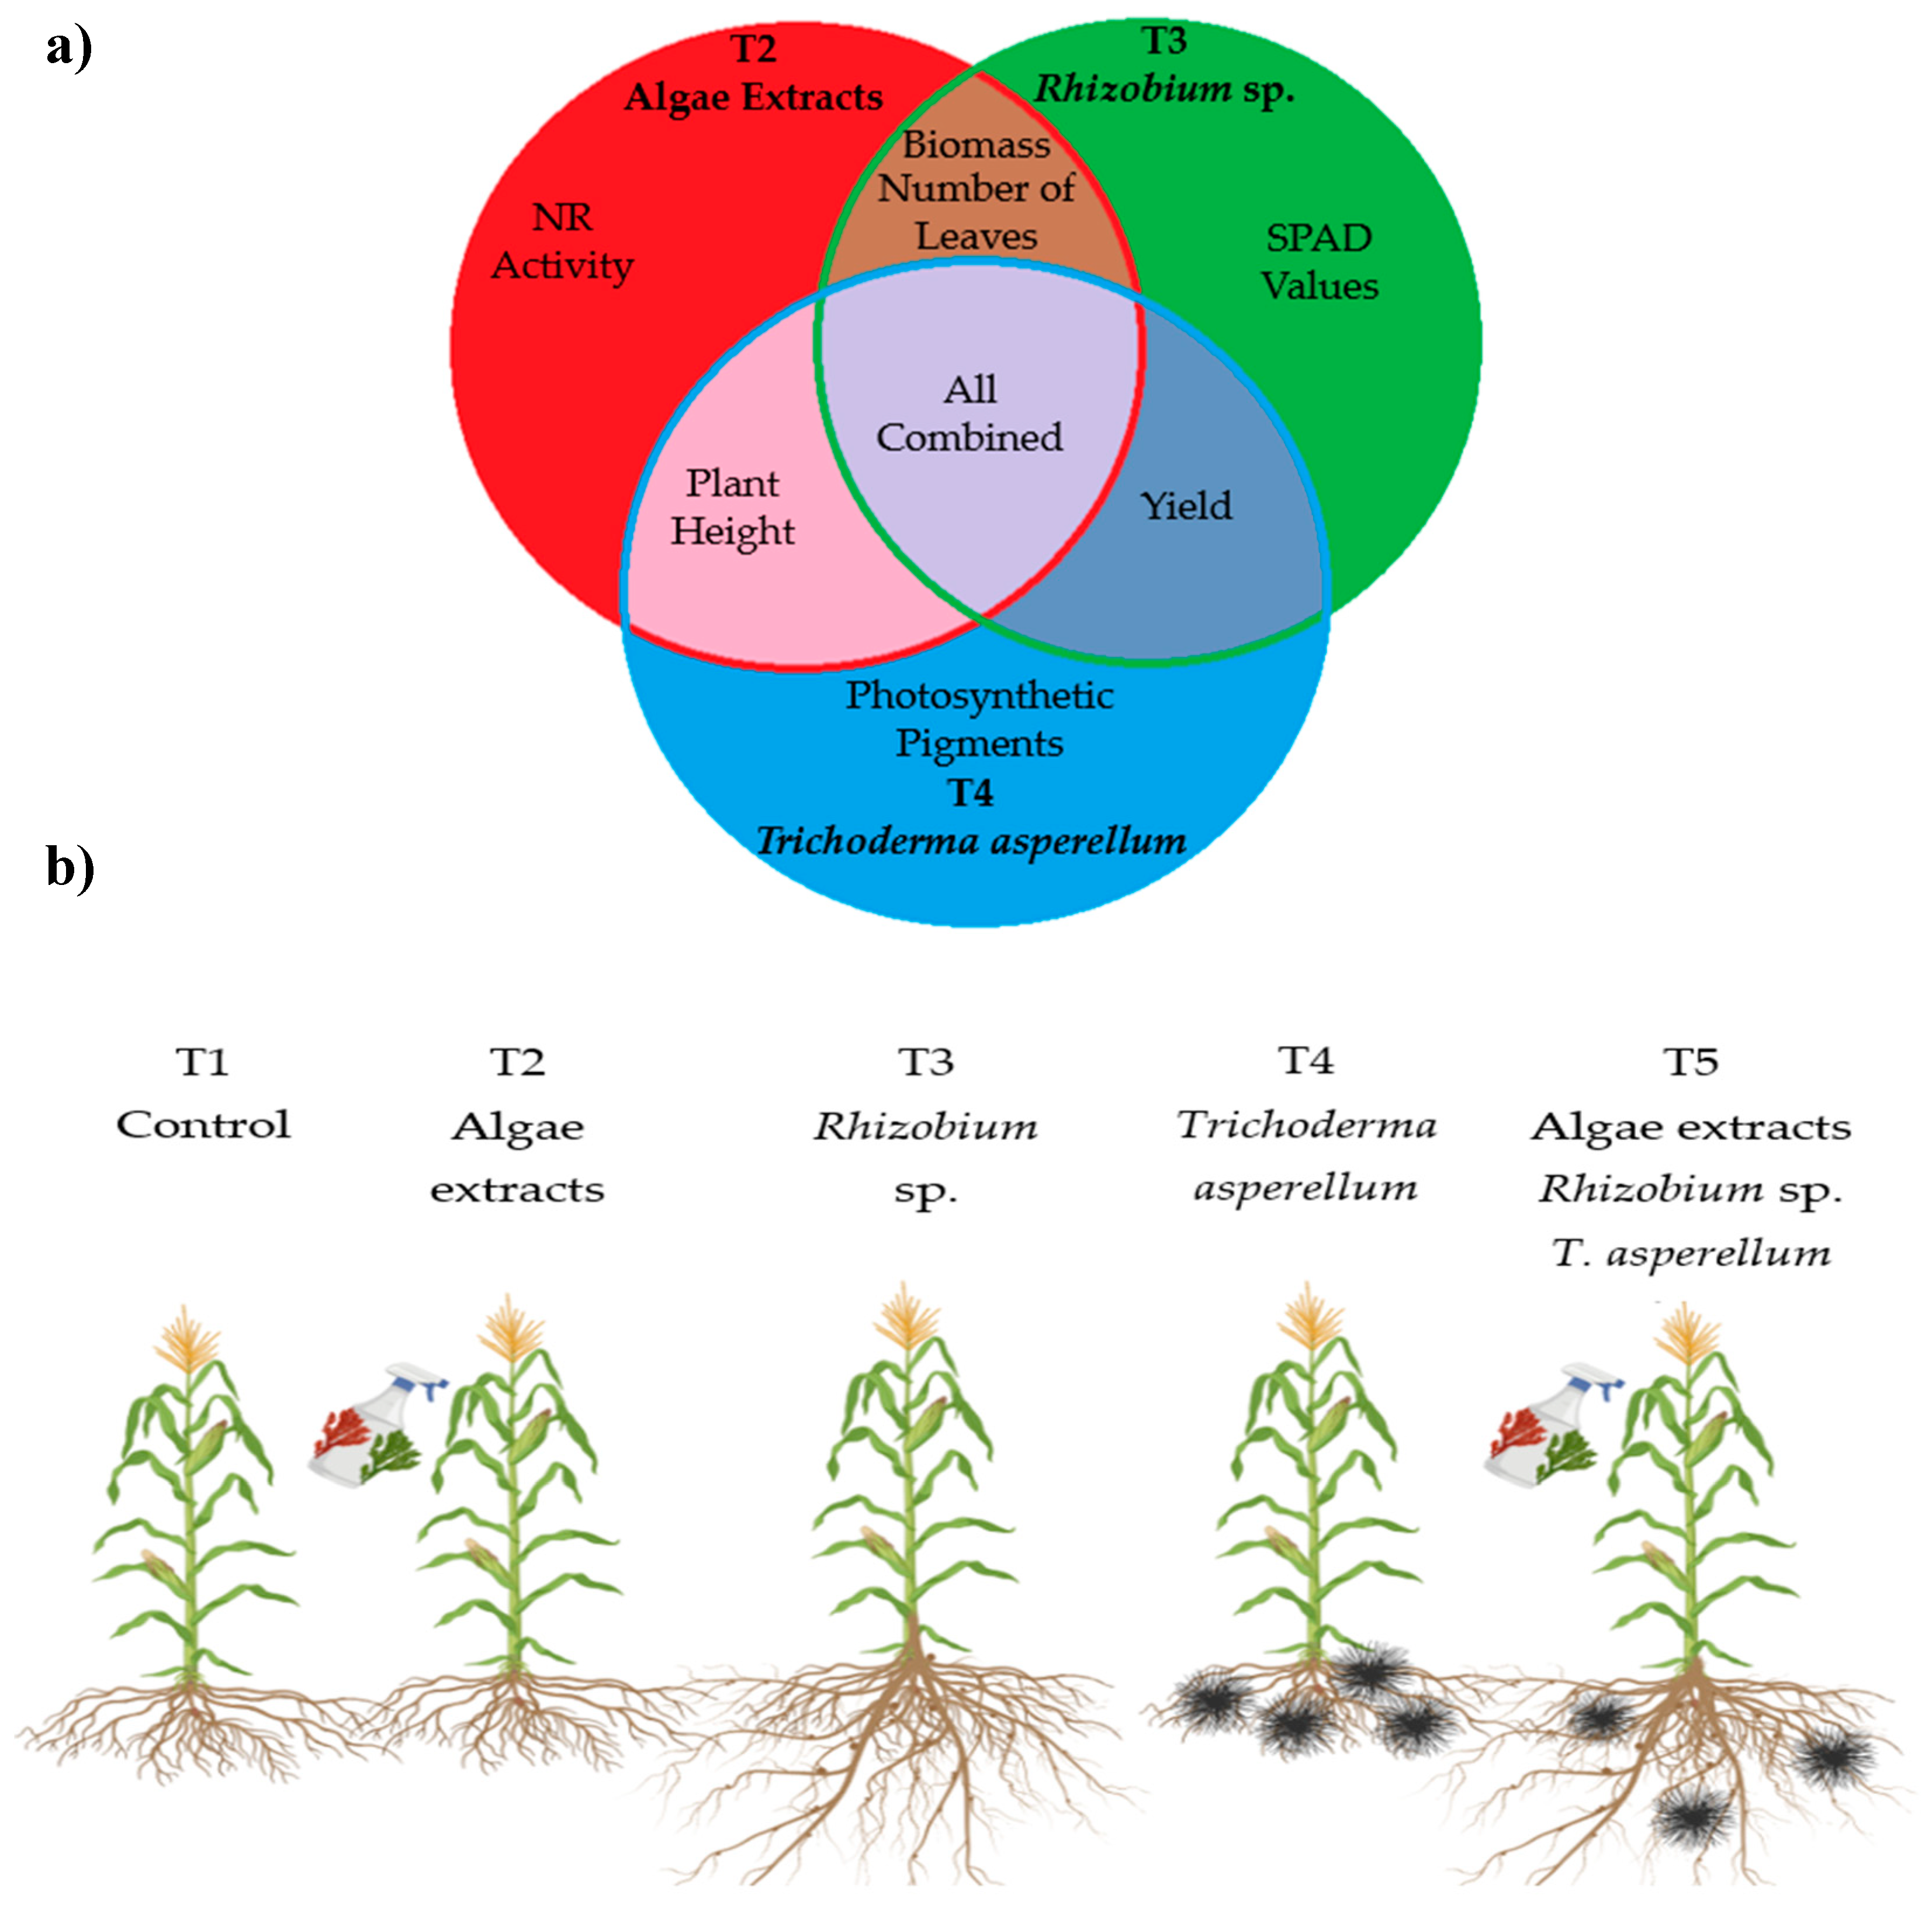
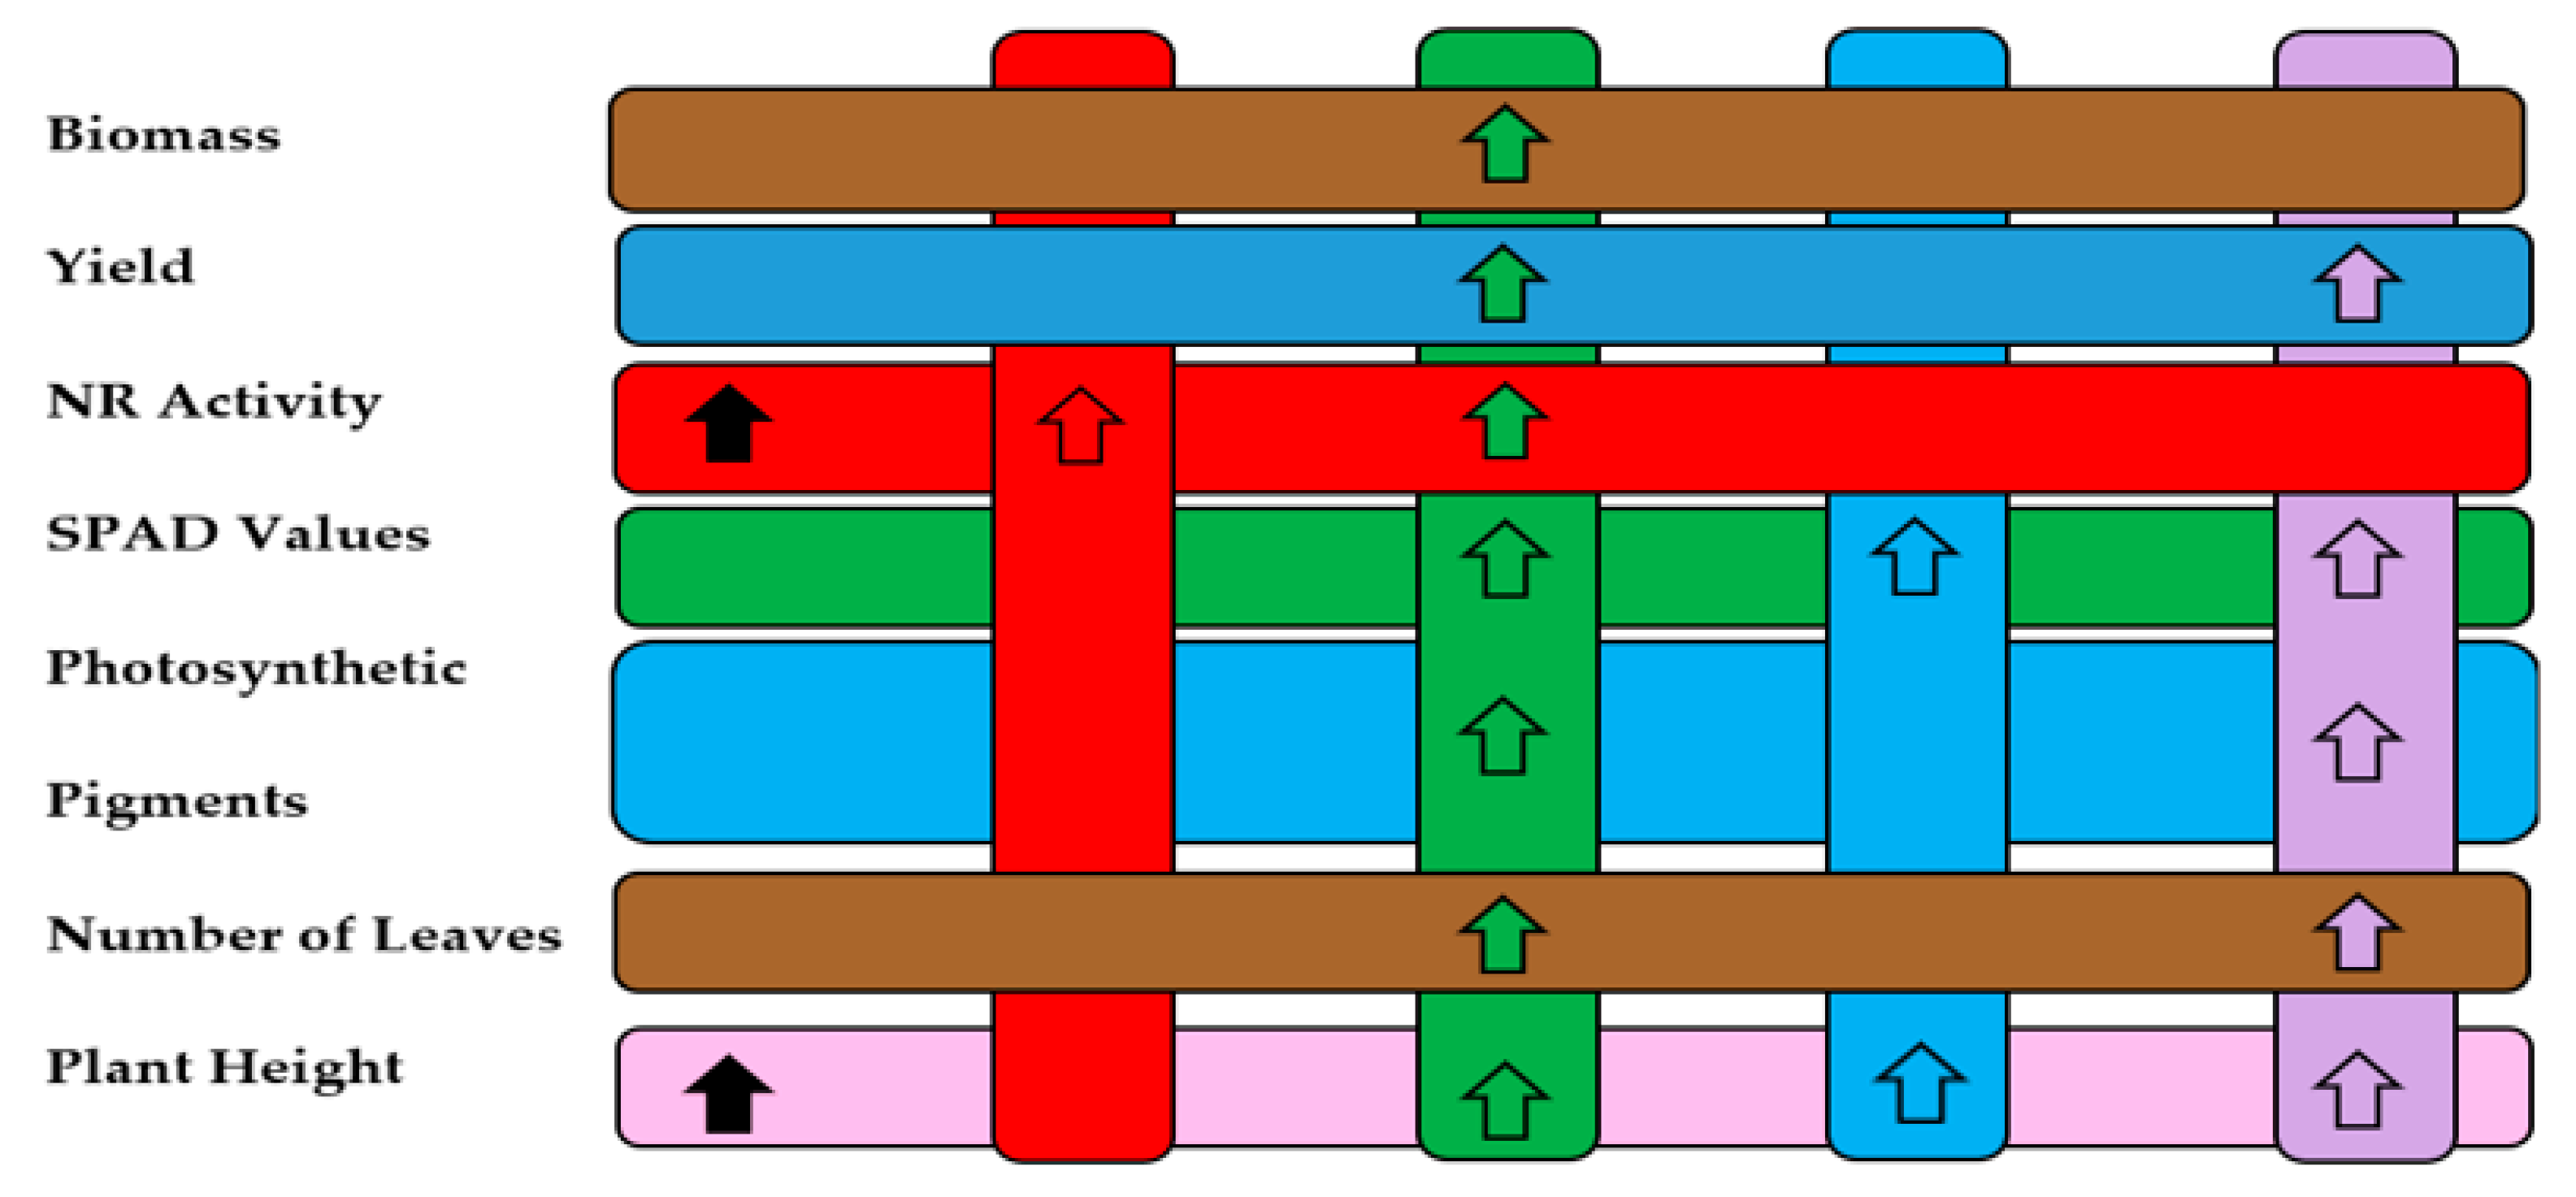
3.7. Venn and Interaction Diagram
4. Conclusions
Author Contributions
Funding
Data Availability Statement
Acknowledgments
Conflicts of Interest
References
- Rosas-Castor, J.M.; Guzmán-Mar, J.L.; Hernández-Ramírez, A.; Garza-González, M.T.; Hinojosa-Reyes, L. Arsenic Accumulation in Maize Crop (Zea mays): A Review. Sci. Total Environ. 2014, 488–489, 176–187. [Google Scholar] [CrossRef] [PubMed]
- Statista. Available online: https://es.statista.com/estadisticas/613419/prinicpales-productores-de-maiz-en-el-mundo/ (accessed on 30 May 2024).
- Hou, P.; Gao, Q.; Xie, R.; Li, S.; Meng, Q.; Kirkby, E.A.; Chen, X. Grain yields in relation to N requirement: Optimizing nitrogen management for spring maize grown in China. Field Crops Res. 2012, 129, 1–6. [Google Scholar] [CrossRef]
- Lai, Z.; Zhang, H.; Ding, X.; Liao, Z.; Zhang, C.; Yu, J.; Fan, J. Ridge-furrow film mulch with nitrogen fertilization improves grain yield of dryland maize by promoting root growth, plant nitrogen uptake and remobilization. Soil Tillage Res. 2024, 241, 106118. [Google Scholar] [CrossRef]
- Mejías, J.H.; Salazar, F.; Pérez Amaro, L.; Hube, S.; Rodriguez, M.; Alfaro, M. Nanofertilizers: A cutting-edge approach to increase nitrogen use efficiency in grasslands. Front. Environ. Sci. 2021, 9, 635114. [Google Scholar] [CrossRef]
- Bai, F.; Qi, X.; Li, P.; Du, Z.; Guo, W. Groundwater depth and nitrogen application amount jointly regulate the water and residual soil nitrate accumulation in agricultural soil profile. Agronomy 2023, 13, 1163. [Google Scholar] [CrossRef]
- Wang, Y. Effect of NPK on NR and NiR activity of sugar beet. J. Nucl. Agric. Sci. 2012, 26, 0803–0808. [Google Scholar]
- Liu, X.; Hu, B.; Chu, C. Nitrogen assimilation in plants: current status and futurs prospects. J. Genet. Genomics 2022, 49, 394–404. [Google Scholar] [CrossRef]
- Zhang, W.; Ni, K.; Long, L.; Ruan, J. Nitrogen transport and assimilation in tea plant (Camellia sinensis): A review. Front. Plant Sci. 2023, 14, 1249202. [Google Scholar] [CrossRef]
- Yadav, M.R.; Kumar, S.; Lal, M.K.; Kumar, D.; Kumar, R.; Yadav, R.K.; Kumar, S.; Nanda, G.; Singh, J.; Udawat, P.; et al. Mechanistic Understanding of Leakage and Consequences and Recent Technological Advances in Improving Nitrogen Use Efficiency in Cereals. Agronomy 2023, 13, 527. [Google Scholar] [CrossRef]
- Nosheen, S.; Ajmal, I.; Song, Y. Microbes as Biofertilizers, a Potential Approach for Sustainable Crop Production. Sustainability 2021, 13, 1868. [Google Scholar] [CrossRef]
- Ammar, E.E.; Aioub, A.A.A.; Elesawy, A.E.; Karkour, A.M.; Mouhamed, M.S.; Amer, A.A.; EL-Shershaby, N.A. Algae as BioFertilizers: Between Current Situation and Future Prospective: The Role of Algae as a Biofertilizer in Serving of Eco-system. Saudi J. Biol. Sci. 2022, 29, 3083–3096. [Google Scholar] [CrossRef] [PubMed]
- Ronga, D.; Biazzi, E.; Parati, K.; Carminati, D.; Carminati, E.; Tava, A. Microalgal Biostimulants and Biofertilisers in Crop Productions. Agronomy 2019, 9, 192. [Google Scholar] [CrossRef]
- Tolisano, C.; Del Buono, D. Biobased: Biostimulants and Biogenic Nanoparticles Enter the Scene. Sci. Total Environ. 2023, 885, 163912. [Google Scholar] [CrossRef] [PubMed]
- Olanrewaju, O.S.; Glick, B.R.; Babalola, O.O. Mechanisms of Action of Plant Growth Promoting Bacteria. World J. Microbiol. Biotechnol. 2017, 33, 197. [Google Scholar] [CrossRef]
- Zhang, C.; Zhang, Y.; Ding, Z.; Bai, Y. Contribution of Microbial Inter-Kingdom Balance to Plant Health. Mol. Plant 2019, 12, 148–149. [Google Scholar] [CrossRef]
- El-Maraghy, S.S.; Tohamy, A.T.; Hussein, K.A. Plant Protection Properties of the Plant Growth Promoting Fungi (PGPF): Mechanisms and Potentiality. Curr. Res. Environ. Appl. Mycol. 2021, 11, 391–415. [Google Scholar] [CrossRef]
- Cao, M.; Narayanan, M.; Shi, X.; Chen, X.; Li, Z.; Ma, Y. Optimistic Contributions of Plant Growth-Promoting Bacteria for Sustainable Agriculture and Climate Stress Alleviation. Environ. Res. 2023, 15, 217. [Google Scholar] [CrossRef]
- Khan, M.S.; Zaidi, A.; Wani, P.A. Role of Phosphate-Solubilizing Microorganisms in Sustainable Agriculture—A Review. Agron. Sustain. Dev. 2007, 27, 29–43. [Google Scholar] [CrossRef]
- Bhattacharyya, P.N.; Jha, D.K. Plant Growth-Promoting Rhizobacteria (PGPR): Emergence in Agriculture. World J. Microbiol. Biotechnol. 2012, 28, 1327–1350. [Google Scholar] [CrossRef]
- Saharan, B.S.; Nehra, V. Plant Growth Promoting Rhizobacteria: A Critical Review. Life Sci. Med. Res. 2011, 2011, 1–30. [Google Scholar]
- Glick, B.R. Plant Growth-Promoting Bacteria: Mechanisms and Applications. Scientifica 2012, 2012, 963401. [Google Scholar] [CrossRef] [PubMed]
- Deka, H.; Deka, S.; Baruah, C. Plant Growth Promoting Rhizobacteria for Value Addition: Mechanism of Action. In Plant-Growth-Promoting Rhizobacteria (PGPR) and Medicinal Plants, 1st ed.; Egamberdieva, D., Shrivastava, S., Varma, A., Eds.; Springer: New York, USA, 2015; pp. 305–321. [Google Scholar]
- Dodd, I.C.; Zinovkina, N.Y.; Safronova, V.I.; Belimov, A.A. Rhizobacterial Mediation of Plant Hormone Status. Ann. Appl. Biol. 2010, 157, 361–379. [Google Scholar] [CrossRef]
- Abdel-Raouf, N.; Al-Homaidan, A.A.; Ibraheem, I.B. Agricultural Importance of Algae. Afr. J. Biotechnol. 2012, 11, 11648–11658. [Google Scholar] [CrossRef]
- Barone, G.D.; Cernava, T.; Ullmann, J.; Liu, J.; Lio, E.; Germann, A.T.; Nakielski, A.; Russo, D.A.; Chavkin, T.; Knufmann, K.; Tripodi, F.; Coccetti, P.; Secundo, F.; Fu, P.; Pfleger, B.; Axmann, I.M.; Lindblad, P. Recent Developments in the Production and Utilization of Photosynthetic Microorganisms for Food Applications. Heliyon 2023, 9, e14708. [Google Scholar] [CrossRef] [PubMed]
- Al-Ghazal, S.A.Y.; Aziz, M.M.; AL-Juheiehy, W.K.S. Response of Growth and Yield of Corn (Zea mays L.) to Biofertilizer and Sea-Algae Extract. Int. J. Agric. Stat. Sci. 2023, 19, 161–165. [Google Scholar]
- Basavaraja, P.K.; Yogendra, N.D.; Zodape, S.T.; Prakash, R.; Ghosh, A. Effect of Seaweed Sap as Foliar Spray on Growth and Yield of Hybrid Maize. J. Plant Nutr. 2018, 41, 1851–1861. [Google Scholar] [CrossRef]
- Layek, J.; Das, A.; Ramkrushna, G.I.; Ghosh, A.; Panwar, A.S.; Krishnappa, R.; Ngachan, S.V. Effect of Seaweed Sap on Germination, Growth and Productivity of Maize (Zea mays) in North Eastern Himalayas. Indian J. Agron. 2016, 61, 354–359. [Google Scholar] [CrossRef]
- Pal, A.; Dwivedi, S.K.; Maurya, P.K.; Kanwar, P. Effect of Seaweed Saps on Growth, Yield, Nutrient Uptake and Economic Improvement of Maize (Sweet Corn). J. Appl. Nat. Sci. 2015, 7, 970–975. [Google Scholar] [CrossRef]
- Santoyo, G.; Moreno-Hagelsieb, G.; Orozco-Mosqueda, M.C.; Glick, B.R. Plant Growth-Promoting Bacterial Endophytes. Microbiol. Res. 2016, 183, 92–99. [Google Scholar] [CrossRef]
- Zhou, S.; Xia, P.; Chen, J.; Xiong, Q.; Li, G.; Tian, J.; Wu, B.; Zhou, F. Optimizing Nitrogen Application Position to Change Root Distribution in Soil and Regulate Maize Growth and Yield Formation in a Wide–Narrow Row Cropping System: Pot and Field Experiments. Front. Plant Sci. 2024, 15, 1298249. [Google Scholar] [CrossRef]
- Widodo, T.W.; Muhklisin, I.; Nugroho, S.A.; Wardana, R.; Ummah, U.S.A. Growth and Yield of Maize Applicated by Rhizobium spp. from Legume and Non-legume Rhizosphere. J. Agric. Appl. Biol. 2023, 4, 151–160. [Google Scholar] [CrossRef]
- Marks, B.B.; Megías, M.; Ollero, F.J.; Nogueira, M.A.; Araujo, R.S.; Hungria, M. Maize Growth Promotion by Inoculation with Azospirillum brasilense and Metabolites of Rhizobium tropici Enriched on Lipo-chitooligosaccharides (LCOs). AMB Express 2015, 5, 71. [Google Scholar] [CrossRef] [PubMed]
- Pessoa Cavalcanti, M.I.; de Carvalho Nascimento, R.; Ribeiro, D.R.; Costa Escobar, I.E.; Resende, A.C.F.; Pereira, A.S.; Santiago, A.D.F.; Abrahão, R.S.N.; Fernandes-Júnior, P.V. Maize Growth and Yield Promoting Endophytes Isolated into a Legume Root Nodule by a Cross-Over Approach. Rhizosphere 2020, 15, 100211. [Google Scholar] [CrossRef]
- Kubiak, A.; Wolna-Maruwka, A.; Pilarska, A.A.; Niewiadomska, A.; Piotrowska-Cyplik, A. Fungi of the Trichoderma Genus: Future Perspectives of Benefits in Sustainable Agriculture. Appl. Sci. 2023, 13, 6434. [Google Scholar] [CrossRef]
- Alfiky, A.; Weisskopf, L. Deciphering Trichoderma–Plant–Pathogen Interactions for Better Development of Biocontrol Applications. J. Fungi 2021, 7, 61. [Google Scholar] [CrossRef]
- Chagas, L.F.B.; Castro, H.G.; Colonia, B.S.O.; Carvalho-Filho, M.R.; Miller, L.O.; Chagas-Junior, A.F. Efficiency of the Inoculation of Trichoderma asperellum UFT-201 in Cowpea Production Components under Growth Conditions in Field. Rev. Ciênc. Agrár. 2016, 39, 413–421. [Google Scholar] [CrossRef]
- Wei, Y.; Yang, H.; Hu, J.; Li, H.; Zhao, Z.; Wu, Y.; Li, J.; Zhou, Y.; Yang, K.; Yang, H. Trichoderma harzianum Inoculation Promotes Sweet Sorghum Growth in the Saline Soil by Modulating Rhizosphere Available Nutrients and Bacterial Community. Front. Plant Sci. 2023, 14, 1258131. [Google Scholar] [CrossRef]
- Cai, W.J.; Ye, T.T.; Wang, Q.; Cai, B.D.; Feng, Y.Q. A Rapid Approach to Investigate Spatiotemporal Distribution of Phytohormones in Rice. Plant Methods 2016, 12, 47. [Google Scholar] [CrossRef]
- Jaroszuk-Ściseł, J.; Tyśkiewicz, R.; Nowak, A.; Ozimek, E.; Majewska, M.; Hanaka, A.; Tyśkiewicz, K.; Pawlik, A.; Janusz, G. Phytohormones (Auxin, Gibberellin) and ACC Deaminase In Vitro Synthesized by the Mycoparasitic Trichoderma DEMTkZ3A0 Strain and Changes in the Level of Auxin and Plant Resistance Markers in Wheat Seedlings Inoculated with This Strain Conidia. Int. J. Mol. Sci. 2019, 20, 4923. [Google Scholar] [CrossRef]
- Díaz, G.; Rodríguez, G.; Montana, L.; Miranda, T.; Basso, C.; Arcia, M. Efecto de la aplicación de bioestimulantes y Trichoderma sobre el crecimiento en plántulas de maracuyá (Passiflora edulis Sims) en vivero. Bioagro 2020, 32, 195–204. [Google Scholar]
- Sabre, W.I.; Ghoneem, K.M.; Rashad, Y.M.; Al-Askar, A.A. Trichoderma harzianum WKY1: An Indole Acetic Acid Producer for Growth Improvement and Anthracnose Disease Control in Sorghum. Biocontrol Sci. Technol. 2017, 27, 654–676. [Google Scholar] [CrossRef]
- Halifu, S.; Deng, X.; Song, X.; Song, R. Effects of Two Trichoderma Strains on Plant Growth, Rhizosphere Soil Nutrients and Fungal Community of Pinus sylvestris var. mongolica Annual Seedlings. Forests 2019, 10, 758. [Google Scholar] [CrossRef]
- Karuppiah, V.; Vallikkannu, M.; Li, T.; Chen, J. Simultaneous and Sequential-Based Co-Fermentations of Trichoderma asperellum GDFS1009 and Bacillus amyloliquefaciens 1841: A Strategy to Enhance the Gene Expression and Metabolites to Improve the Biocontrol and Plant Growth Promoting Activity. Microb. Cell Factories 2019, 18, 1–16. [Google Scholar] [CrossRef] [PubMed]
- Petcu, V.; Bubueanu, C.; Casarica, A.; Săvoiu, G.; Stoica, R.; Bazdoaca, C.; Lazăr, D.A.; Iordan, H.L.; Horhocea, D. Efficacy of Trichoderma harzianum and Bacillus subtilis as Seed and Vegetation Application Combined with Integrated Agroecology Measures on Maize. Romanian Agric. Res. 2023, 40, 1–10. [Google Scholar] [CrossRef]
- Abdel-Raouf, N.; Al-Homaidan, A.A.; Ibraheem, I.B. Agricultural Importance of Algae. Afr. J. Biotechnol. 2012, 11, 11648–11658. [Google Scholar] [CrossRef]
- Díaz, F.G.; Gutiérrez, R.T.; Mora, K.G.; García, M.C.N. Isolation and Characterization of Rhizobia from Crotalaria sp. in Southern Ecuador. Cultivos Tropicales 2016, 37, 40–47. [Google Scholar]
- Andrzejak, R.; Janowska, B.; Renska, B.; Kosiada, T. Effect of Trichoderma spp. and Fertilization on the Flowering of Begonia × tuberhybrida Voss. ‘Picotee Sunburst’. Agronomy 2022, 11, 1278. [Google Scholar] [CrossRef]
- Sánchez, E.; Rivero, R.M.; Ruiz, J.M.; Romero, L. Changes in Biomass, Enzymatic Activity and Protein Concentration in Roots and Leaves of Green Bean Plants (Phaseolus vulgaris L. cv. Strike) under High NH₄NO₃ Application Rates. Sci. Hortic. 2004, 99, 237–248. [Google Scholar] [CrossRef]
- Cunha, A.R.D.; Katz, I.; Sousa, A.D.P.; Martinez-Uribe, R.A. Índice SPAD en el Crecimiento y Desarrollo de Plantas de Lisianthus en Función de Diferentes Dosis de Nitrógeno en Ambiente Protegido. Idesia 2015, 33, 97–105. [Google Scholar] [CrossRef]
- Wellburn, A.R. The Spectral Determination of Chlorophylls a and b, as well as Total Carotenoids, Using Various Solvents with Spectrophotometers of Different Resolution. J. Plant Physiol. 1994, 144, 307–313. [Google Scholar] [CrossRef]
- Bakuei, N.; Amini, G.; Njafpour, G.D.; Jahanshahi, M. Total and Sustainable Utilization of Biomass Resources: A Perspective. Front. Sustain. Energy 2015. [Google Scholar]
- Razafintsalama, H.; Trap, J.; Rabary, B.; Razakatiana, A.T.E.; Ramanankierana, H.; Rabeharisoa, L.; Becquer, T. Effect of Rhizobium Inoculation on Growth of Common Bean in Low-Fertility Tropical Soil Amended with Phosphorus and Lime. Sustainability 2022, 14, 4907. [Google Scholar] [CrossRef]
- Kandil, A.E.; Özdamar Ünlü, H. Effect of Rhizobium Inoculation on Yield and Some Quality Properties of Fresh Cowpea. Cogent Food Agric. 2023, 9, 2275410. [Google Scholar] [CrossRef]
- Díez-Méndez, A.; Menéndez, E. Rhizobium Presence and Functions in Microbiomes of Non-Leguminous Plants. In Symbiotic Soil Microorganisms, 1st ed.; Shrivastava, N., Mahajan, S., Varma, A., Eds.; Springer: Switzerland, 2021; pp. 241–266. [Google Scholar]
- Beltran-Medina, J.I.; Romero-Perdomo, F.; Molano-Chavez, L.; Silva, A.M.M.; Estrada-Bonilla, G.A. Differential Plant Growth Promotion Under Reduced Phosphate Rates in Two Genotypes of Maize by a Rhizobial Phosphate-Solubilizing Strain. Front. Sustain. Food Syst. 2022, 6, 955473. [Google Scholar] [CrossRef]
- Fageria, N.K.; Baligar, V.C. Enhancing Nitrogen Use Efficiency in Crop Plants. Adv. Agron. 2005, 88, 97–185. [Google Scholar]
- Canfield, D.E.; Glazer, A.N.; Falkowski, P.G. The Evolution and Future of Earth's Nitrogen Cycle. Science 2010, 330, 192–196. [Google Scholar] [CrossRef]
- Chalk, P.M.; Souza, R.F. The Role of Biological Nitrogen Fixation in the Nitrogen Cycle of Sugarcane and Maize Cropping Systems. Symbiosis 2019, 78, 105–118. [Google Scholar]
- Albahri, G.; Alyamani, A.A.; Badran, A.; Hijazi, A.; Nasser, M.; Maresca, M.; Baydoun, E. Enhancing Essential Grains Yield for Sustainable Food Security and Bio-Safe Agriculture Through Latest Innovative Approaches. Agronomy 2023, 13, 1709. [Google Scholar] [CrossRef]
- Meng, L.; Zhang, A.; Wang, F.; Han, X.; Wang, D.; Li, S. Arbuscular Mycorrhizal Fungi and Rhizobium Facilitate Nitrogen Uptake and Transfer in Soybean/Maize Intercropping System. Front. Plant Sci. 2015, 6, 339. [Google Scholar] [CrossRef]
- Zheng, F.; Tan, D. Enhancing Maize Yield and Nutrient Utilization Through Improved Soil Quality Under Reduced Fertilizer Use: The Efficacy of Organic–Inorganic Compound Fertilizer. Agriculture 2024, 14, 1482. [Google Scholar] [CrossRef]
- Kumar, V.; Prasad, R. Role of Biofertilizers in Improving Soil Fertility and Crop Productivity: A Review. J. Pharmacogn. Phytochem. 2021, 10, 634–641. [Google Scholar]
- Xie, J.; Hu, L.; Wang, Z.; Yan, C.; Bao, F. Synergistic Effects of Biofertilizers on Crop Yield and Nutrient Uptake in Maize. Agron. J. 2017, 109, 2732–2740. [Google Scholar]
- Campbell, W.H. Nitrate Reductase Structure, Function and Regulation: Bridging the Gap Between Biochemistry and Physiology. Annu. Rev. Plant Biol. 1999, 50, 277–303. [Google Scholar] [CrossRef] [PubMed]
- Shoresh, M.; Harman, G.E.; Mastouri, F. Induced Systemic Resistance and Plant Responses to Fungal Biocontrol Agents. Annu. Rev. Phytopathol. 2010, 48, 21–43. [Google Scholar] [CrossRef]
- Altomare, A.; Burla, M.C.; Camalli, M.; Carrozzini, B.; Cascarano, G.L.; Giacovazzo, C.; Guagliardi, A.; Moliterni, A.G.G.; Polidori, G.; Rizzi, R. EXPO: A Program for Full Powder Pattern Decomposition and Crystal Structure Solution. J. Appl. Crystallogr. 1999, 32, 339–340. [Google Scholar] [CrossRef]
- Khan, A.R.; Ullah, I.; Khan, S.; Fahad, S.; Khan, A.H.; Ali, S.; Shah, A.; Zhou, W. Plant Growth-Promoting Rhizobacteria as an Alternative Tool for Boosting Crop Productivity in Stressful Environments: A Review. Front. Plant Sci. 2018, 9, 1801. [Google Scholar]
- Kaushal, M.; Wani, S.P. Rhizobacterial-Plant Interactions: Strategies Ensuring Plant Growth Promotion Under Drought and Salinity Stress. Agric. Ecosyst. Environ. 2016, 231, 68–78. [Google Scholar]
- Velasquez, S.M.; Barbez, E.; Kleine-Vehn, J.; Estevez, J.M. Auxin and Cellular Elongation. Plant Physiol. 2016, 170, 1206–1215. [Google Scholar] [CrossRef]
- Li, X.; Li, Z. What Determines Symbiotic Nitrogen Fixation Efficiency in Rhizobium: Recent Insights into Rhizobium leguminosarum. Arch. Microbiol. 2023, 205, 300. [Google Scholar] [CrossRef]
- Maitra, S.; Praharaj, S.; Brestic, M.; Sahoo, R.K.; Sagar, L.; Shankar, T.; Palai, J.B.; Sahoo, U.; Pramanick, B.; Nath, S.; Venugopalan, V.K.; Skalický, M.; Hossain, A. Rhizobium as Biotechnological Tools for Green Solutions: An Environment-Friendly Approach for Sustainable Crop Production in the Modern Era of Climate Change. Curr. Microbiol. 2023, 80, 219. [Google Scholar] [CrossRef]
- Mehboob, I.; Zahir, Z.A.; Arshad, M.; Tanveer, A.; Khalid, M. Comparative Effectiveness of Different Rhizobium sp. for Improving Growth and Yield of Maize (Zea mays L.). Soil Environ. 2012, 31, 37–46. [Google Scholar]
- Shrestha, S.; Brueck, H.; Asch, F. Chlorophyll Index, Photochemical Reflectance Index and Chlorophyll Fluorescence Measurements of Rice Leaves Supplied with Different N Levels. J. Photochem. Photobiol. B Biol. 2012, 113, 7–13. [Google Scholar] [CrossRef] [PubMed]
- Ma, L.S.; Li, Y.J.; Wu, P.T.; Zhao, X.N.; Gao, X.D.; Chen, X.L. Recovery Growth and Water Use of Intercropped Maize Following Wheat Harvest in Wheat/Maize Relay Strip Intercropping. Field Crops Res. 2020, 256, 107924. [Google Scholar] [CrossRef]
- Hu, W.; Lu, Z.; Meng, F.; Li, X.; Cong, R.; Ren, T.; Sharkey, T.D.; Lu, J. The Reduction in Leaf Area Precedes That in Photosynthesis Under Potassium Deficiency: The Importance of Leaf Anatomy. New Phytol. 2020, 227, 1749–1763. [Google Scholar] [CrossRef]
- Mehboob, I.; Zahir, Z.A.; Arshad, M.; Tanveer, A.; Khalid, M. Comparative Effectiveness of Different Rhizobium sp. for Improving Growth and Yield of Maize (Zea mays L.). Soil Environ. 2012, 31, 37–46. [Google Scholar]
- Hussein, M.H.; Eltanahy, E.; Al Bakry, A.F.; Elsafty, N.; Elshamy, M.N. Seaweed Extracts as Prospective Plant Growth Biostimulant and Salinity Stress Alleviator for Vigna sinensis and Zea mays. J. Appl. Phycol. 2021, 33, 1273–1291. [Google Scholar] [CrossRef]
- Kandil, A.E.; Özdamar Ünlü, H. Effect of Rhizobium Inoculation on Yield and Some Quality Properties of Fresh Cowpea. Cogent Food Agric. 2023, 9, 2275410. [Google Scholar] [CrossRef]
- Hussain, M.B.; Zahir, Z.A.; Asghar, H.A.; Mubaraka, R.; Naveed, M. Efficacy of Rhizobia for Improving Photosynthesis, Productivity and Mineral Nutrition of Maize. Clean Soil Air Water 2016, 44, 1564–1571. [Google Scholar] [CrossRef]
- Egamberdieva, D.; Wirth, S.J.; Alqarawi, A.A.; Abd_Allah, E.F.; Hashem, A. Phytohormones and Beneficial Microbes: Essential Components for Plants to Balance Stress and Fitness. Front. Microbiol. 2017, 8, 2104. [Google Scholar]
- Lichtenthaler, H.K. Chlorophylls and Carotenoids: Pigments of Photosynthetic Biomembranes. Methods Enzymol. 1987, 148, 350–382. [Google Scholar]
- Zhao, J.; Chen, N.; Zhu, T.; Zhao, X.; Yuan, M.; Wang, Z.; Du, H. Simultaneous Quantification and Visualization of Photosynthetic Pigments in Lycopersicon esculentum Mill. Under Different Levels of Nitrogen Application with Visible-Near Infrared Hyperspectral Imaging Technology. Plants 2023, 12, 2956. [Google Scholar] [CrossRef] [PubMed]
- Ma, L.S.; Li, Y.J.; Wu, P.T.; Zhao, X.N.; Gao, X.D.; Chen, X.L. Recovery Growth and Water Use of Intercropped Maize Following Wheat Harvest in Wheat/Maize Relay Strip Intercropping. Field Crops Res. 2020, 256, 107924. [Google Scholar]
- Hu, W.; Lu, Z.; Meng, F.; Li, X.; Cong, R.; Ren, T.; Sharkey, T.D.; Lu, J. The Reduction in Leaf Area Precedes That in Photosynthesis Under Potassium Deficiency: The Importance of Leaf Anatomy. New Phytol. 2020, 227, 1749–1763. [Google Scholar] [CrossRef] [PubMed]
- Gen-Jiménez, A.; Flores-Félix, J.D.; Rincón-Molina, C.I.; Manzano-Gomez, L.A.; Rogel, M.A.; Ruíz-Valdiviezo, V.M.; Rincón-Rosales, R. Enhance of Tomato Production and Induction of Changes on the Organic Profile Mediated by Rhizobium Biofortification. Front. Microbiol. 2023, 14, 1235930. [Google Scholar] [CrossRef]
- Lu, Y.; Xu, J. Phytohormones in Microalgae: A New Opportunity for Microalgal Biotechnology? Trends Plant Sci. 2015, 20, 273–282. [Google Scholar] [CrossRef]
- Ammar, E.E.; Aioub, A.A.A.; Elesawy, A.E.; Karkour, A.M.; Mouhamed, M.S.; Amer, A.A.; El-Shershaby, N.A. Algae as Bio-fertilizers: Between Current Situation and Future Prospective. Saudi J. Biol. Sci. 2022, 29, 3083–3096. [Google Scholar] [CrossRef]
- Doni, F.; Fathurrahman, F.; Mispan, M.S.; Suhaimi, N.S.M.; Yusoff, W.M.W.; Uphoff, N. Transcriptomic Profiling of Rice Seedlings Inoculated with the Symbiotic Fungus Trichoderma asperellum SL2. J. Plant Growth Regul. 2019, 38, 1507–1515. [Google Scholar] [CrossRef]
- Harman, G.; Khadka, R.; Doni, F.; Uphoff, N. Benefits to Plant Health and Productivity from Enhancing Plant Microbial Symbionts. Front. Plant Sci. 2021, 11, 610065. [Google Scholar]
- Vinale, F.; Sivasithamparam, K. Beneficial effects of Trichoderma secondary metabolites on crops. Phytotherapy Research 2020, 34(11), 2835–2842. [Google Scholar] [CrossRef]
- Liu, W.; Zheng, L.; Qi, D. Variation in Leaf Traits at Different Altitudes Reflects the Adaptive Strategy of Plants to Environmental Changes. Ecol. Evol. 2020, 10, 8166–8175. [Google Scholar] [CrossRef]
- Fang, L.; Ju, W.; Yang, C.; Jin, X.; Liu, D.; Li, M.; Zhang, C. Exogenous Application of Signaling Molecules to Enhance the Resistance of Legume-Rhizobium Symbiosis in Pb/Cd-Contaminated Soils. Environ. Pollut. 2020, 265, 114744. [Google Scholar] [CrossRef] [PubMed]
- Sharma, D.; Gahtyari, N.C.; Chhabra, R.; Kumar, D. Role of Microbes in Improving Plant Growth and Soil Health for Sustainable Agriculture. In Advances in Plant Microbiome and Sustainable Agriculture: Diversity and Biotechnological Applications; Springer, 2020; pp. 207–256. [Google Scholar]
- Fahde, S.; Boughribil, S.; Sijilmassi, B.; Amri, A. Rhizobia: A Promising Source of Plant Growth-Promoting Molecules and Their Non-Legume Interactions: Examining Applications and Mechanisms. Agriculture 2023, 13, 1279. [Google Scholar] [CrossRef]
- Glick, B.R. Plant Growth-Promoting Bacteria: Mechanisms and Applications. Scientifica 2012, 2012, 963401. [Google Scholar] [CrossRef] [PubMed]
- Hayat, R.; Ahmed, I.; Sheirdil, R.A. An Overview of Plant Growth Promoting Rhizobacteria (PGPR) for Sustainable Agriculture. In Crop Production; Springer, 2016. [Google Scholar]
- Qureshi, M.A.; Shahzad, H.; Imran, Z.; Mushtaq, M.; Akhtar, N.; Ali, M.A.; Mujeeb, F. Potential of Rhizobium Species to Enhance Growth and Fodder Yield of Maize in the Presence and Absence of L-Tryptophan. J. Anim. Plant Sci. 2013, 23, 1448–1454. [Google Scholar]
Disclaimer/Publisher’s Note: The statements, opinions and data contained in all publications are solely those of the individual author(s) and contributor(s) and not of MDPI and/or the editor(s). MDPI and/or the editor(s) disclaim responsibility for any injury to people or property resulting from any ideas, methods, instructions or products referred to in the content. |
© 2024 by the authors. Licensee MDPI, Basel, Switzerland. This article is an open access article distributed under the terms and conditions of the Creative Commons Attribution (CC BY) license (http://creativecommons.org/licenses/by/4.0/).


