Preprint
Article

Genetic Variation Study of Several Romanian Pepper (Capsicum annuum L.) Varieties Revealed by Molecular Markers and Whole Genome Resequencing

Altmetrics

Downloads

89

Views

40

Comments

0

A peer-reviewed article of this preprint also exists.

Submitted:

13 September 2024

Posted:

15 September 2024

You are already at the latest version

Alerts
Abstract
Numerous varieties of Capsicum annuum L. with multiple valuable traits, such as adaptation to biotic and abiotic stress factors, can be found in south-east Romania, well known for vegetable cultivation and an important area of biodiversity conservation. To obtain useful information toward a sustainable agriculture, management and conservation of local pepper varieties, we analyzed the genetic diversity and we did deep molecular characterization using Whole Genome Resequencing (WGS) for variant/mutation detection. The pepper varieties used in the present study were registered by VRDS in the ISTIS catalog between 1974 and 2019 and maintained in conservative selection, however, no studies have been published yet using WGS analysis in order to characterize this specific germplasm. The genome sequences, annotation and alignments provided in this study offer essential resources for genomic research as well as for future breeding efforts using the C. annuum local varieties.
Keywords: 
Subject: Biology and Life Sciences  -   Biochemistry and Molecular Biology

1. Introduction

Capsicum annuum, commonly known as chillies, peppers or bell peppers, is a plant species belonging to the genus Capsicum in the Solanaceae family, diploid and self-pollinating crop that is native to southern North America and northern South America [1]. The chilli peppers fruits are not only used as spices and vegetables but also have medicinal purposes and are rich in vitamins A and C. Additionally, they are utilized as natural coloring agents, in cosmetics and as active ingredients in host defense repellents [2]. Although C. annuum is widely cultivated in Romania due to its economic importance, most of the cultivars are of foreign origin. There are few local Romanian varieties and most of them have limited yield potential [3]. Therefore, preserving and improving local pepper varieties requires evaluation of their degree of variation based on genetic characteristics and monitoring of the desired characters with valuable genotypes.
Molecular markers play a crucial role in plant genetics, they are essential for estimating the variability of plant varieties and species, helping to detect genetic relationships within plant genera [4,5]. In the case of C. annuum, inter simple sequence repeat (ISSR) markers have been utilized to assess genetic diversity and population structure [6], to identify genetic homogeneity and to generate molecular profiles to study genetic variability [7]. Several studies have used microsatellites (SSRs) to characterize and generate a molecular genetic map of SSR loci for C. annuum [8], to study genetic variability [9,10] or to design SSR primers that are transferable between Capsicum species [11]. Moreover, whole genome sequencing (WGS) data can provide extensive insights into the molecular mechanisms that link the association of genotypes with diseases and traits, identifying relevant variants and assessing their functionality [12,13,14,15].
The germplasm collection of Vegetable Research and Development Station (VRDS) Buzău, Romania, consists of 214 accessions of Capsicum spp. grouped by degree of genetic stability, as follows: stable, advanced and segregating [3]. Seven Romanian pepper (Capsicum annuum L.) genotypes (‘Decebal’/gDEC, ‘Vladimir’/gVLA, ‘Galben Superior’/gGAL, ‘Splendens’/gSPL, ‘Cosmin’/gCOS, ‘Roial’/gROI and ‘Cantemir’/gCAN) with valuable traits patented by the VRDS and registered in the Official Catalogue of Cultivated Plant Varieties in Romania (ISTIS), were studied in the present experiment for evaluating their genetic diversity, and were characterized in deep at molecular level using WGS for variant/mutation detection, Sanger sequencing, and genotyping with microsatellites molecular markers [16].

2. Results

2.1. Genetic Diversity Analysis

2.1.1. SSR Analysis

Five pairs of genomic SSR molecular markers designed for C. annuum [17] were selected to identify the genetic profiles of seven C. annuum genotypes. Molecular variation by SSR markers generated a total of 87 alleles, total bands and polymorphism information content (PIC) values are presented in Table 1. With BIO-R software it was calculated genetic diversity analysis and modified Roger’s genetic distances. The amplified alleles varied in size from 190 bp to 530 bp. All 87 fragments resulted in polymorphic profiles among the cultivars. The mean PIC value was 0.54, the highest was 0.72 (SSR-P5P6) and the lowest was for SSR-P9P10 (NA) (Table 1). Polymorphic and monomorphic alleles amplified with SSR markers are presented in Supplementary Figure 1. The analysis of genetic profiles using SSR-PCR molecular markers led us to select the most common bands as specific markers for identifying homologous markers among these genotypes. To identify common genetic variations, the 220 bp SSR-PCR band achieved with SSR-P3P4 was selected for cloning, Sanger sequencing and data analysis.
For each locus, the number of alleles and the number of rare alleles were calculated with BIO-R software. The highest values of rare alleles were detected for varieties gSPL (0.86) and gCOS (0.73) (Supplementary Table 2). Diversity analysis detected: % of polymorphic loci (0.31); expected heterozygosity (0.45); number of effective allele (1.85); Shannon diversity index (0.93). The observed heterozygosity (Ho) for SSR markers was ranging from 0.00 to 0.72, with a mean value 0.54 (Figure 1). For SSR markers it was calculated the modified Roger’s genetic distances that ranged from 0.44 to 1.00, with a short distance between hot peppers gDEC and gVLA (0.44) and more distant between gDEC and gROI (0.77) genotypes. No distance was observed between gDEC and gGAL genotypes, meaning that are completely similar. Among the bell pepper, sweet long red pepper and red fibster pepper varieties, similarity values registered a short distance between gCAN and gSPL (0.44). gDEC and gCAN, gGAL and gCAN, show relatively long distances (0.89), meaning they are highly dissimilar. Varieties gSPL and gGAL, gSPL and gDEC, display a big genetic distance (1.00). (Supplementary Table 3). The dendrogram produced by hierarchical clustering offers insight into how similar or dissimilar the genotypes are based on the Modified Roger’s Distances. SSR profile revealed two clusters with gVLA and gDEC and gGAL very similar and another cluster with gROI, gSPL, gCAN and gCOS with an agglomerative coefficient of 0.76 (Figure 1).

2.1.2. ISSR Analysis

Eight selected ISSR primers [18] showed amplification product sizes ranging from 350 to 4000 bp (Supplementary Figure 4); total bands and polymorphism information content (PIC) values are presented in Table 2. With BIO-R software it was calculated genetic diversity analysis and Nei’s genetic distances. The supplementary data include the results from calculus per locus analysis: expected heterozygosity (He), number of effective alleles (Ae) and specificity of a marker in each allele (Spe Allele) (Supplementary Table 5) [17]. The highest values of rare alleles were detected for varieties gDEC (8.05) and gVLA (9.49) (Supplementary Table 2). To identify common genetic variations, we selected the distinct 1000 bp ISSR-PCR band from P26 for cloning, Sanger sequencing and data analysis.
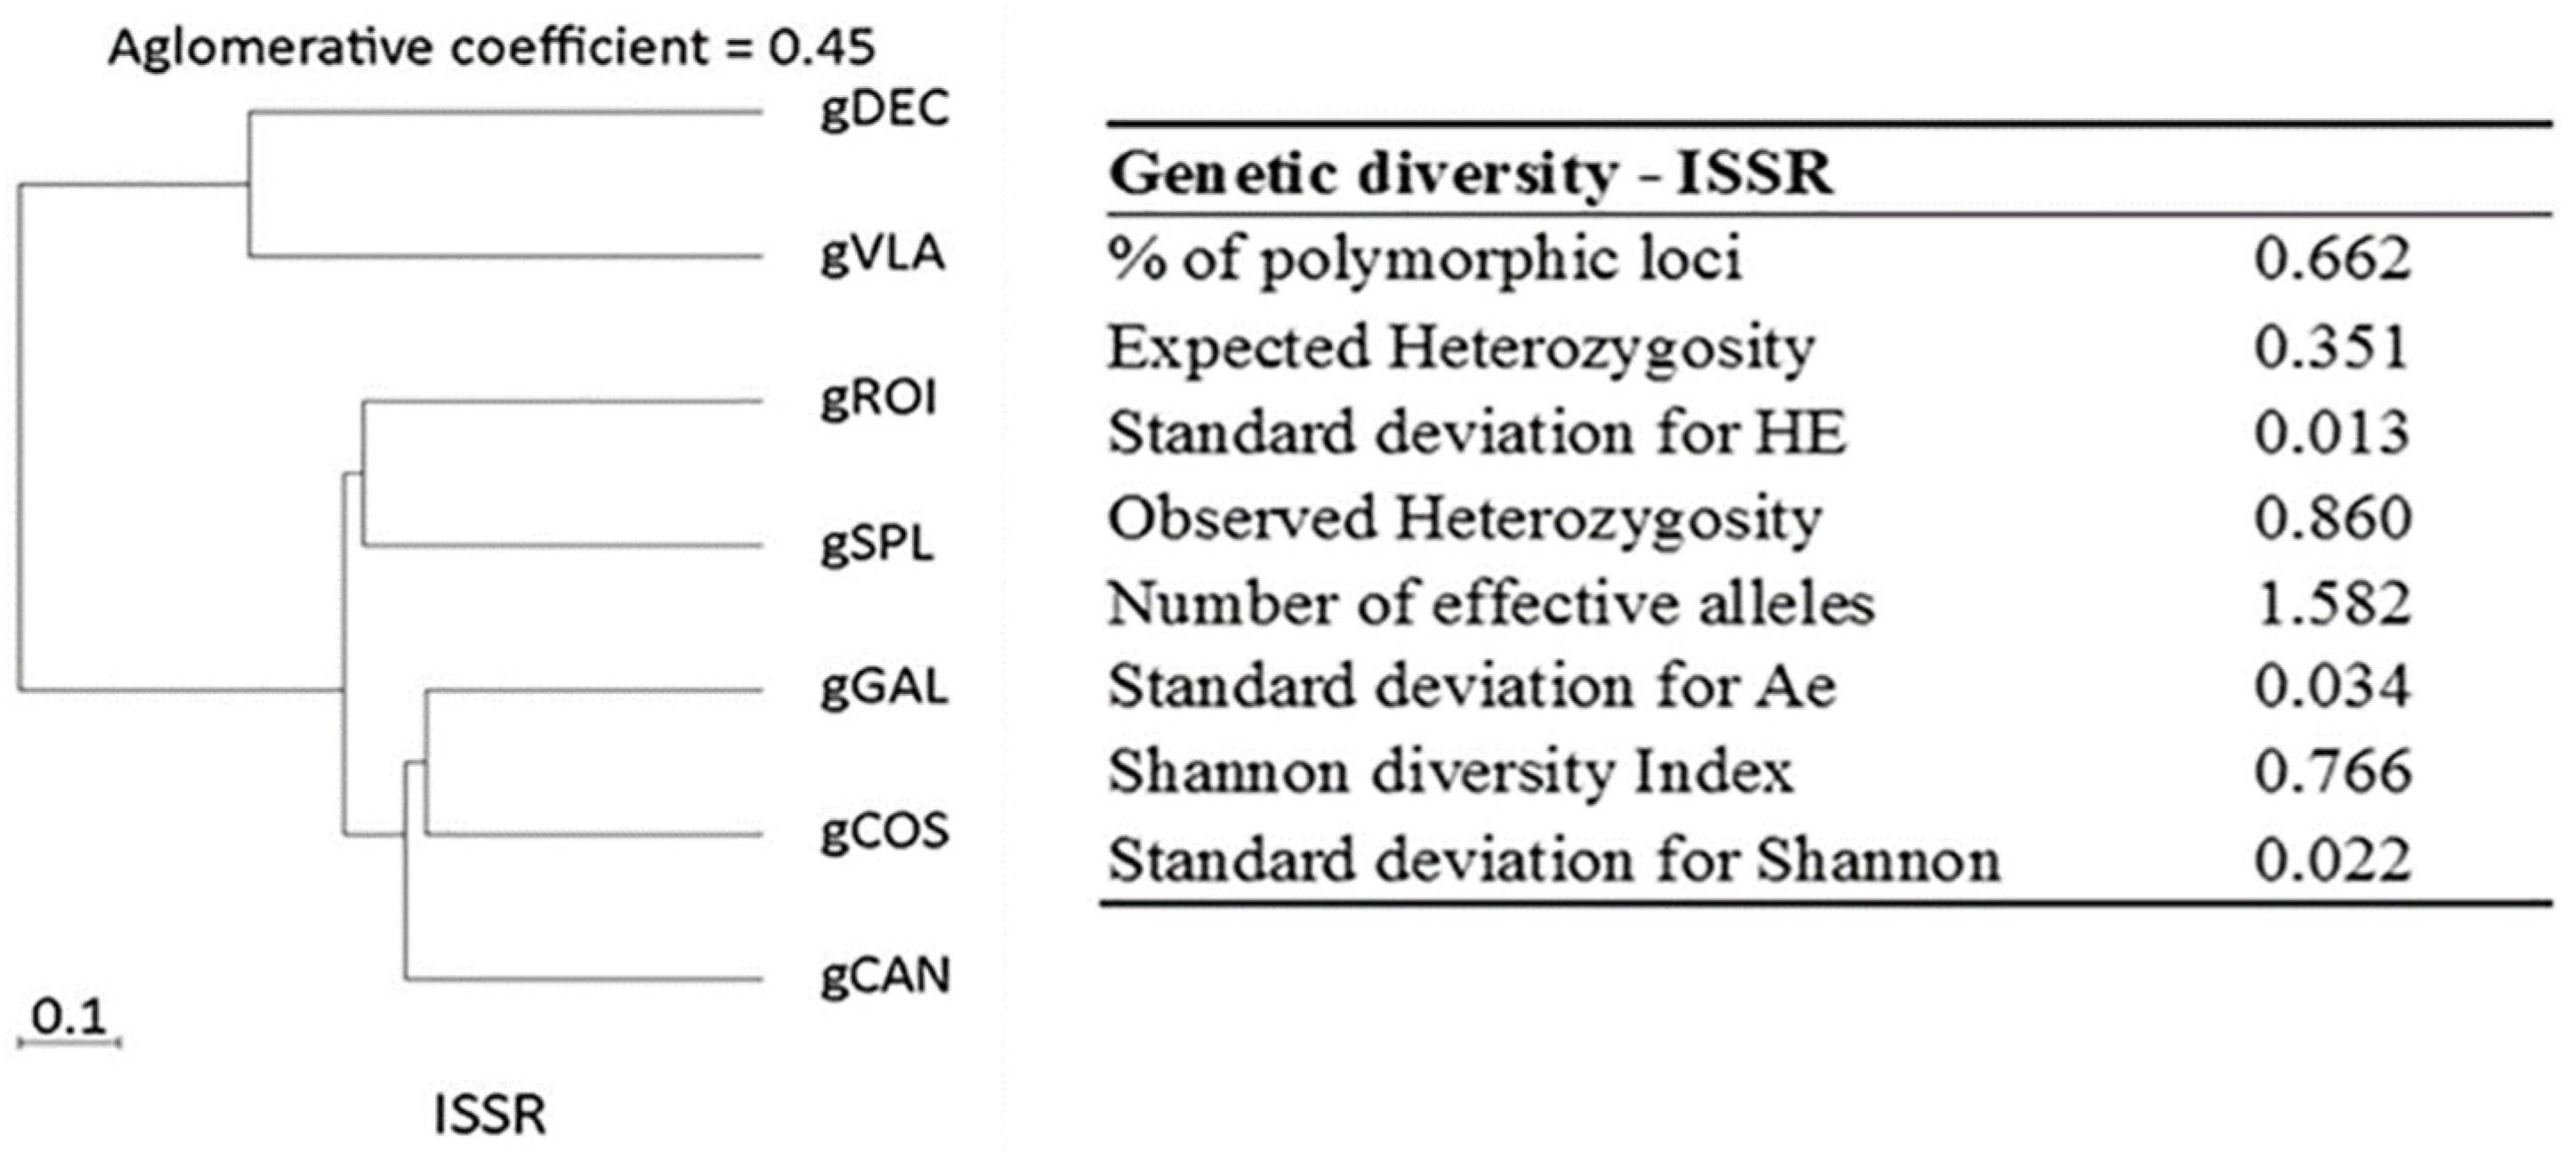
Genetic diversity analysis calculated with BIO-R revealed percent of polymorphic loci (%P), and expected and observed heterozygosity are presented in Figure 2. Together, these ISSR primers amplified 401 bands in all seven tested samples. PIC values of polymorphic ISSR markers varied from 0.08 to 0.29 (mean: 0.23). The Nei’s genetic distances results provided a genetic distance for C. annuum ranging from 0.21 to 1.50, with a short distance between gCOS and gGAL (0.21) genotypes, indicating high genetic similarity and a longer distance between gCAN and gVLA (1.50) genotypes. Among the hot peppers, the range values show a distance of 0.43 between gDEC and gROI which is smaller than the distance of 0.63 between gDEC and gVLA genotypes. Among the bell pepper and red fibster pepper varieties, similarity values between genotypes ranged from 0.21 to 0.41, with gCOS and gGAL being close (0.21) and gCAN and gSPL more distant (0.41) (Supplementary Table 6 ). The ISSR profile revealed two clusters with an agglomerative coefficient of 0.45, where gDEC and gVLA were grouped in one cluster based on their similarity and the second cluster with gROI and gSPL in the first group and gGAL, gCOS and gCAN in the second group (Figure 2).

2.2. NGS Data Analysis and Quality Control

Whole genome sequencing (WGS) has become the most rapid and effective method to identify the genetic variations in individuals of the same species or between related species. The variation information such as Single Nucleotide Polymorphism (SNP), Insertion and Deletion (InDel), Copy Number Variation (CNV) and structural variation (SV) obtained through resequencing is used in population genetics research and genome-wide association studies (GWAS) to investigate the causes of diseases, to select plants for agricultural breeding programs and to identify common genetic variations among populations (Novogene Co., Ltd., Cambridge, UK). Whole-genome sequencing (WGS) of seven Romanian pepper varieties was performed via an Illumina platform (NGS) by Novogene Co., Ltd., Cambridge, UK. The sequencing data presented quality scores Q30 above 90% for all studied genotypes, which guarantee the accuracy and reliability of the sequencing data accordingly to high standard procedures.

2.2.1. Single Nucleotide Polymorphism (SNP) Detection and Annotation

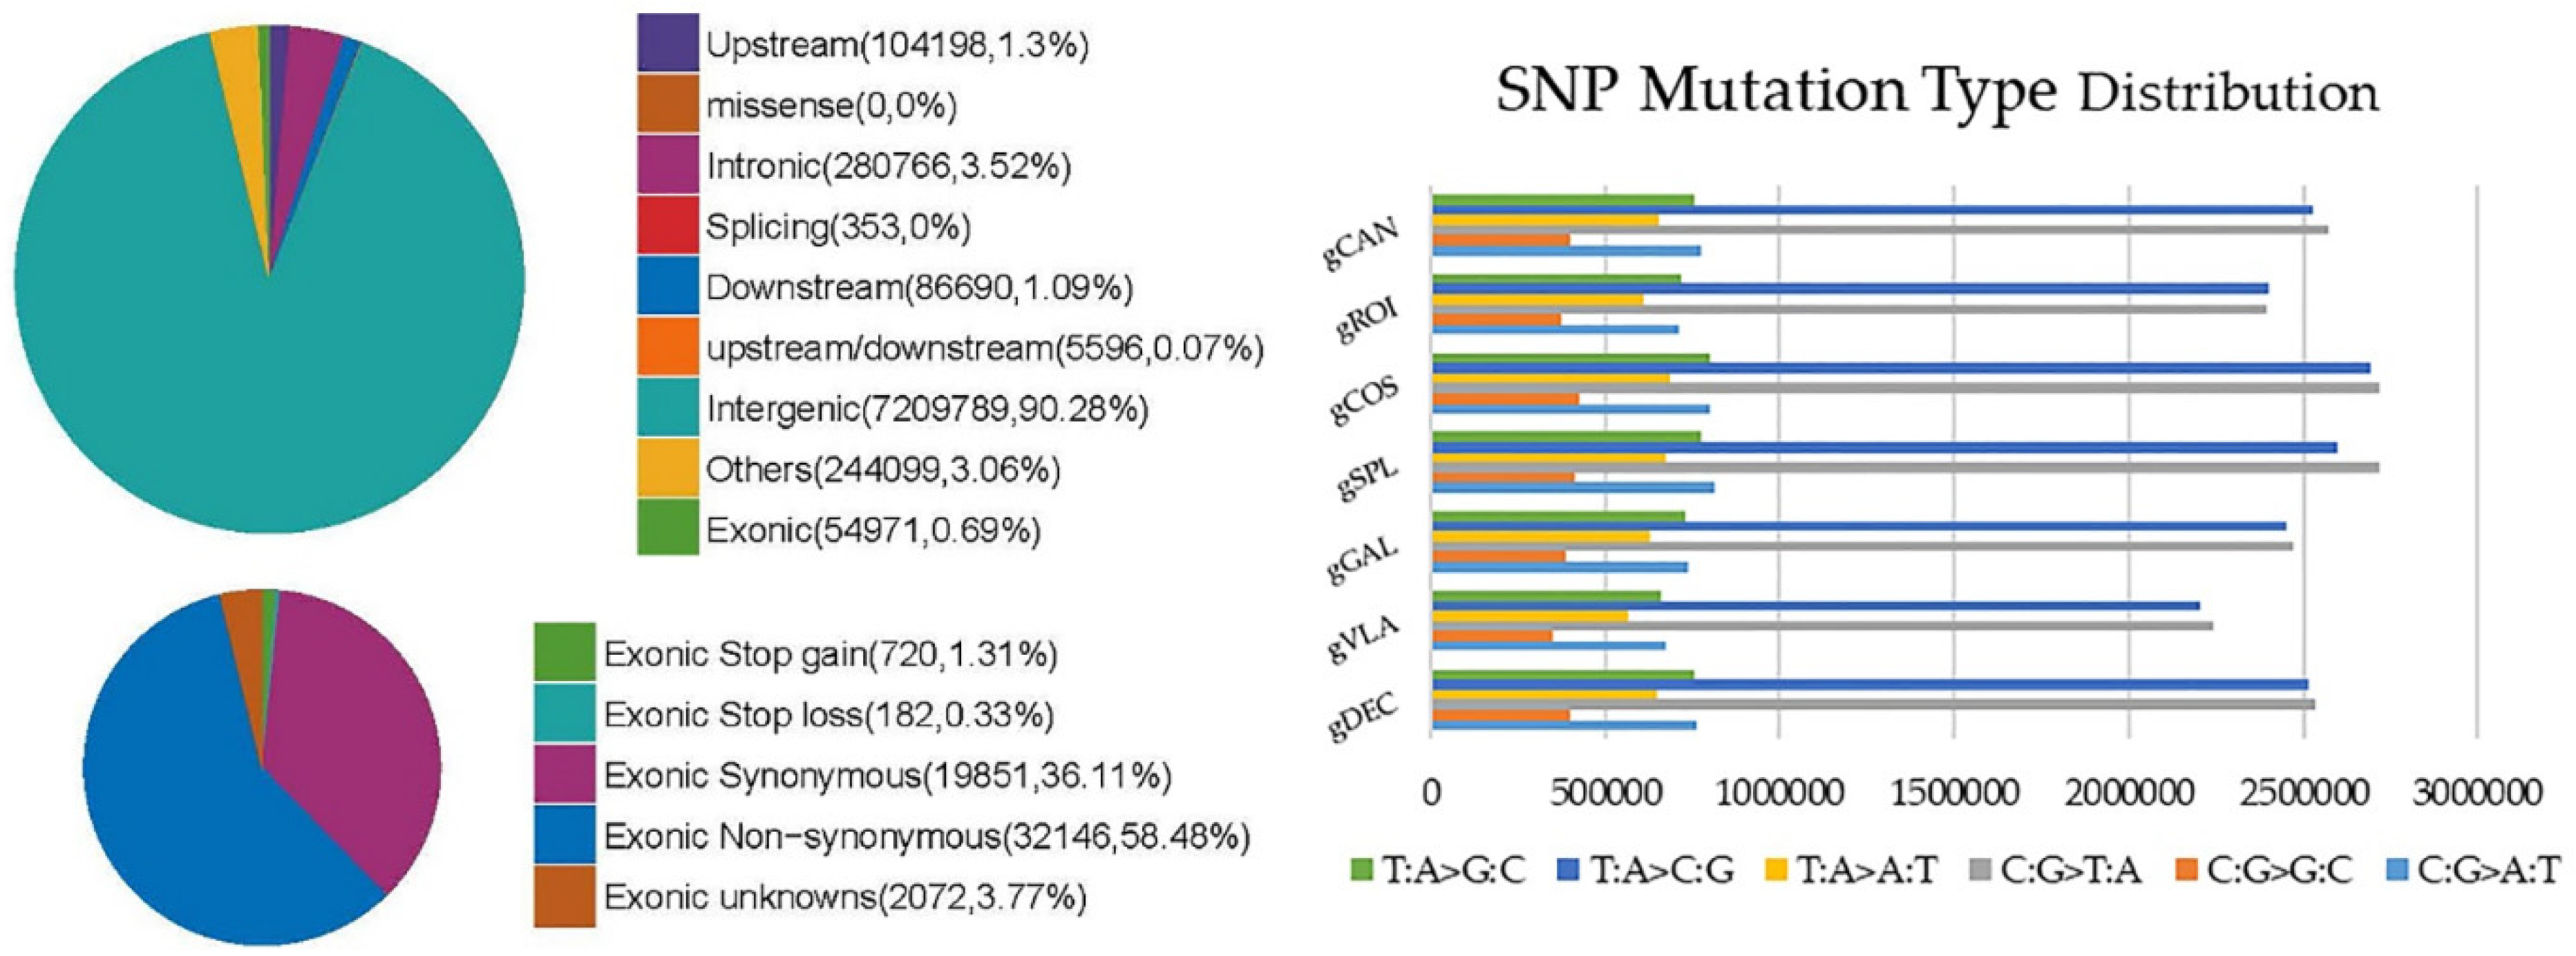
The individual SNP variations were detected in all studied genotypes, yet their number and distribution within the genomes differentiate among the genotypes. SNPs located upstream, within 1 kb away from transcription start site of the gene, show a higher value on gSPL genotype and lower on gVLA genotype. Therefore, in exonic region, gSPL genotype presented the highest number of synonymous and non-synonymous SNP mutations (Table 3). The number of SNPs in different regions of the genome for genotype gSPL is presented in Figure 3. The lowest rate of non-synonymous SNPs mutations located in exonic region (mutation with changing amino acid sequence) was observed for the genotypes gVLA and gROI, whereas the synonymous SNPs (without changing amino acid sequence) lowest frequency was observed on the gCOS and gROI genotypes. For all genotypes studied, the number of non-synonymous SNPs was higher than the synonymous ones (Table 3). SNPs located within the intergenic region, transitions and transversions showed the highest value on gCOS genotype, as well as the total number of SNPs. The lowest number of total SNPs was observed in gVLA genotype.
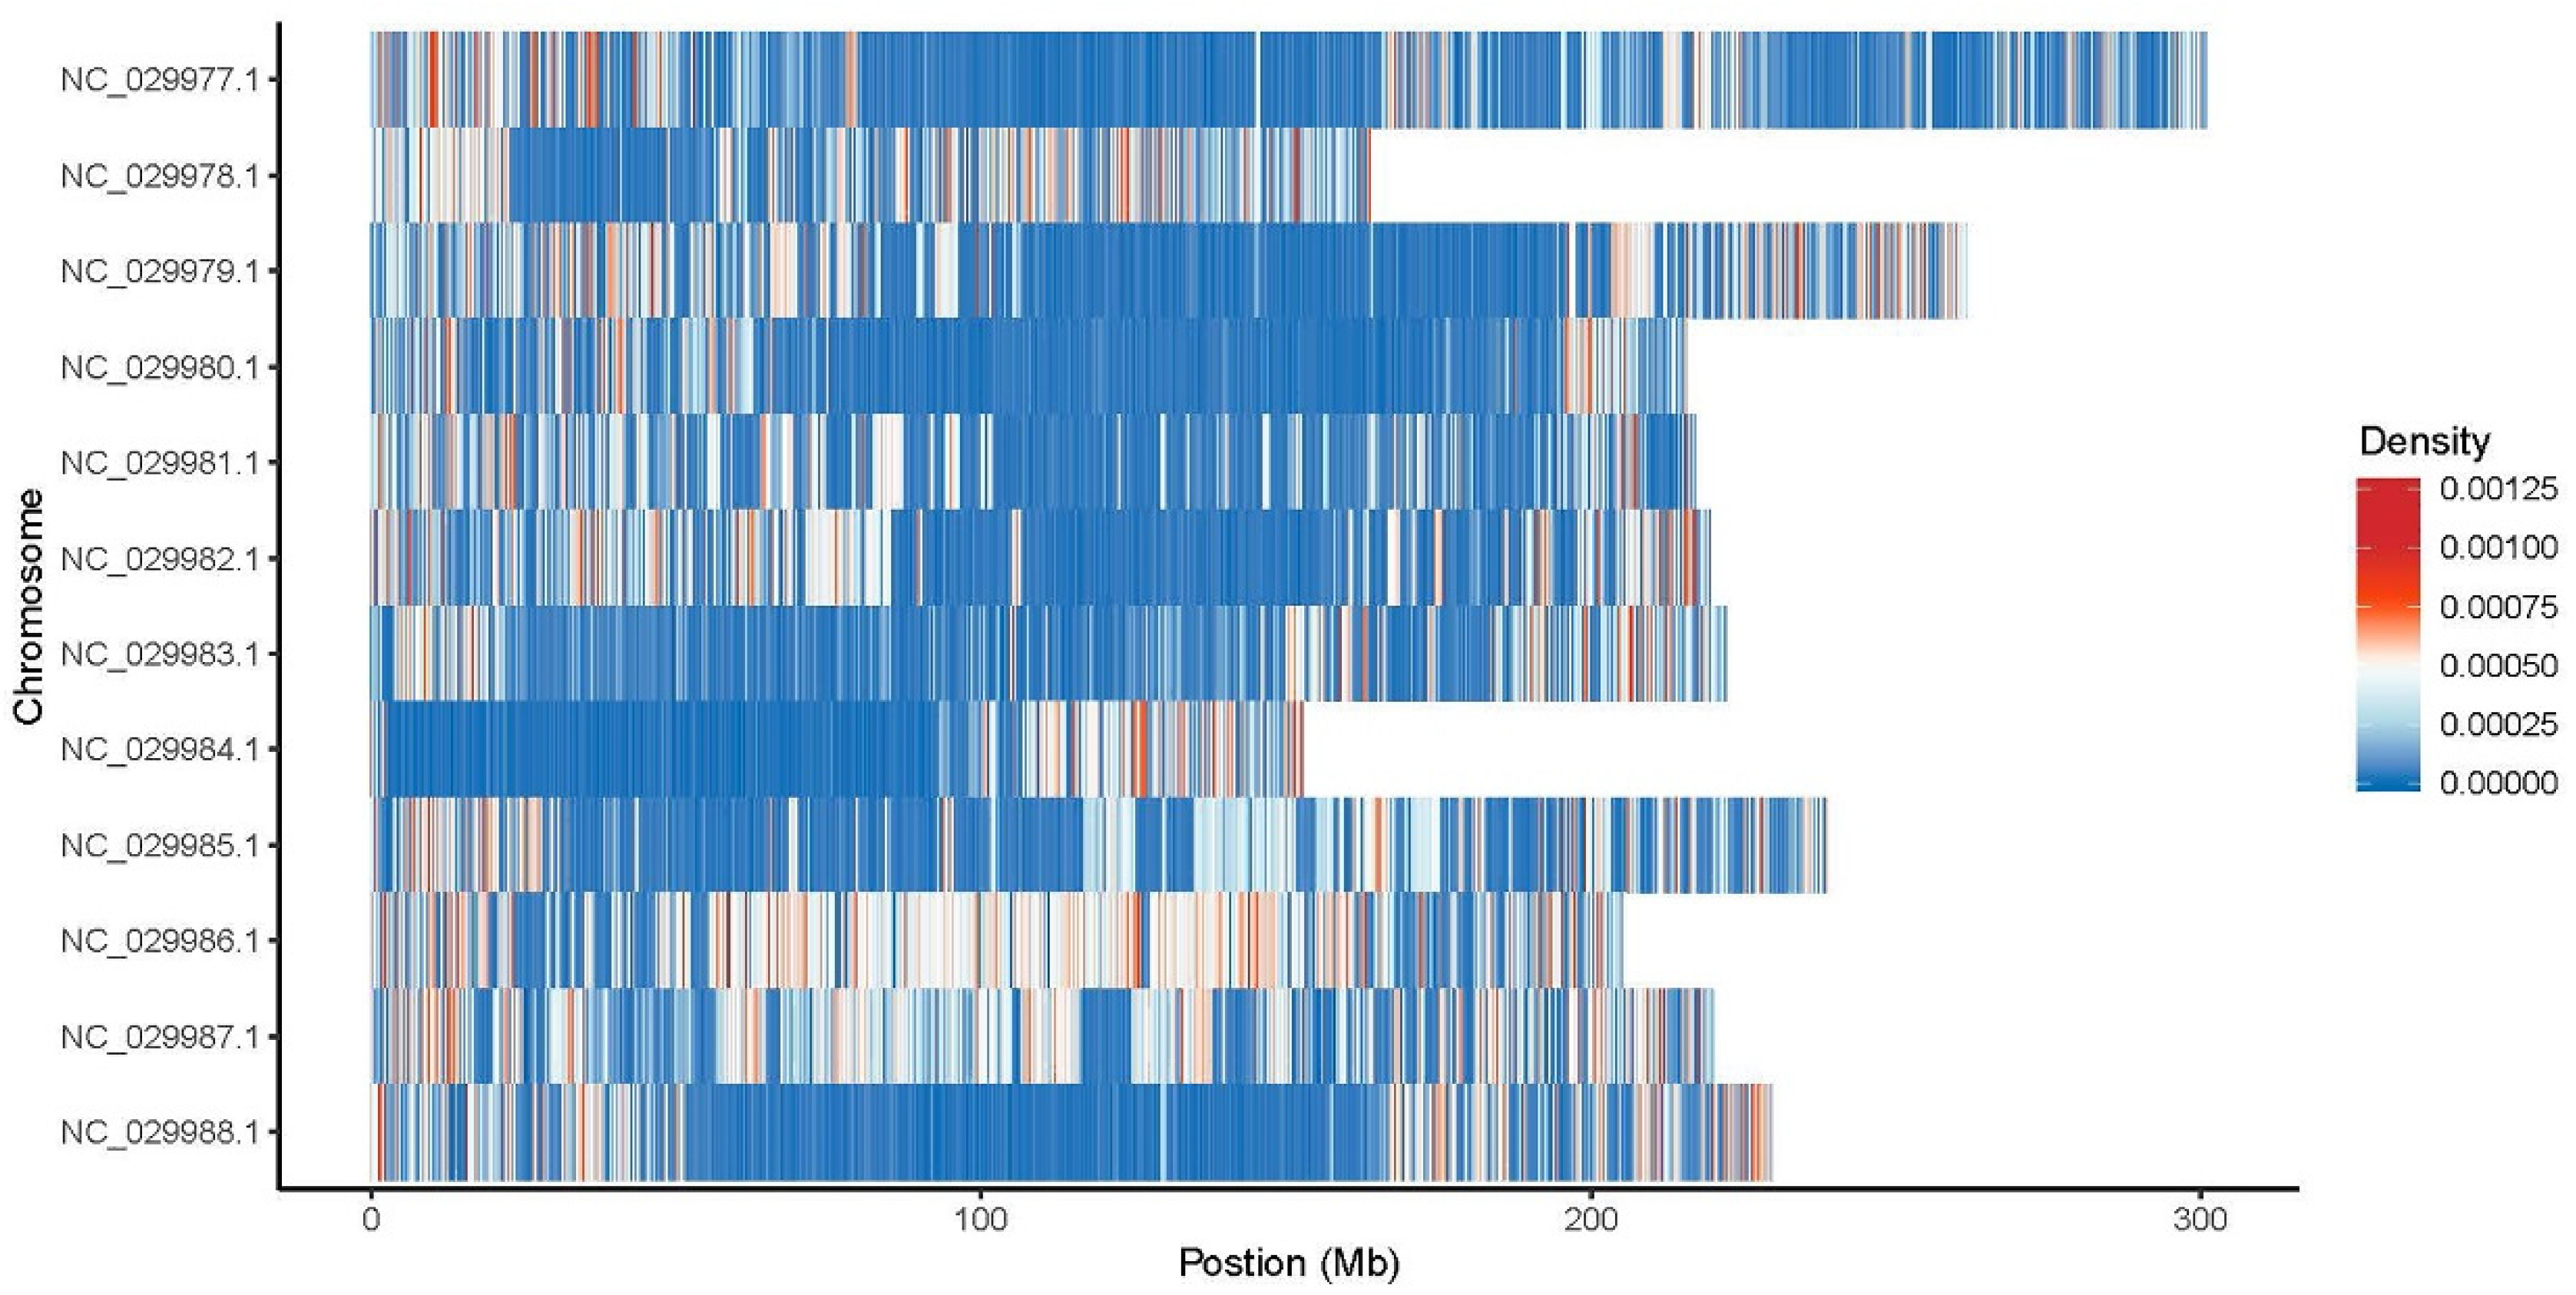
Stop gain mutations that lead to the introduction of stop codon at the variant site, are about six times more frequent on all genotypes compared with stop loss mutations that leads to removal of stop codon at the variant site. Moreover, the genotype gSPL presented the highest number of Stop gain and Stop loss exonic SNPs and gCAN genotype the lowest value. Approximately two out of three SNPs in all samples were transitions (ts), a point mutation that changes a purine nucleotide to another purine (A ↔ G) or a pyrimidine nucleotide to another pyrimidine (C ↔ T), comparative to transversions (tv), the substitution of a (two ring) purine for a (one ring) pyrimidine or vice versa. All over genotypes the most common SNPs mutation type distribution was C:G>T:A and T:A>C:G with the highest values for gCOS and gSPL, while C:G>G:C, T:A>A:T, T:A>G:C mutation types were at the lowest values for gVLA and gROI genotypes (Figure 3). SNPs density per chromosomes for genotype gSPL had the highest density on chromosomes 9 (NC_029985.1), 10 (NC_029986.1) and 11(NC_029987.1) (Figure 4).

2.2.2. Insertion/Deletion (InDel) Detection and Annotation

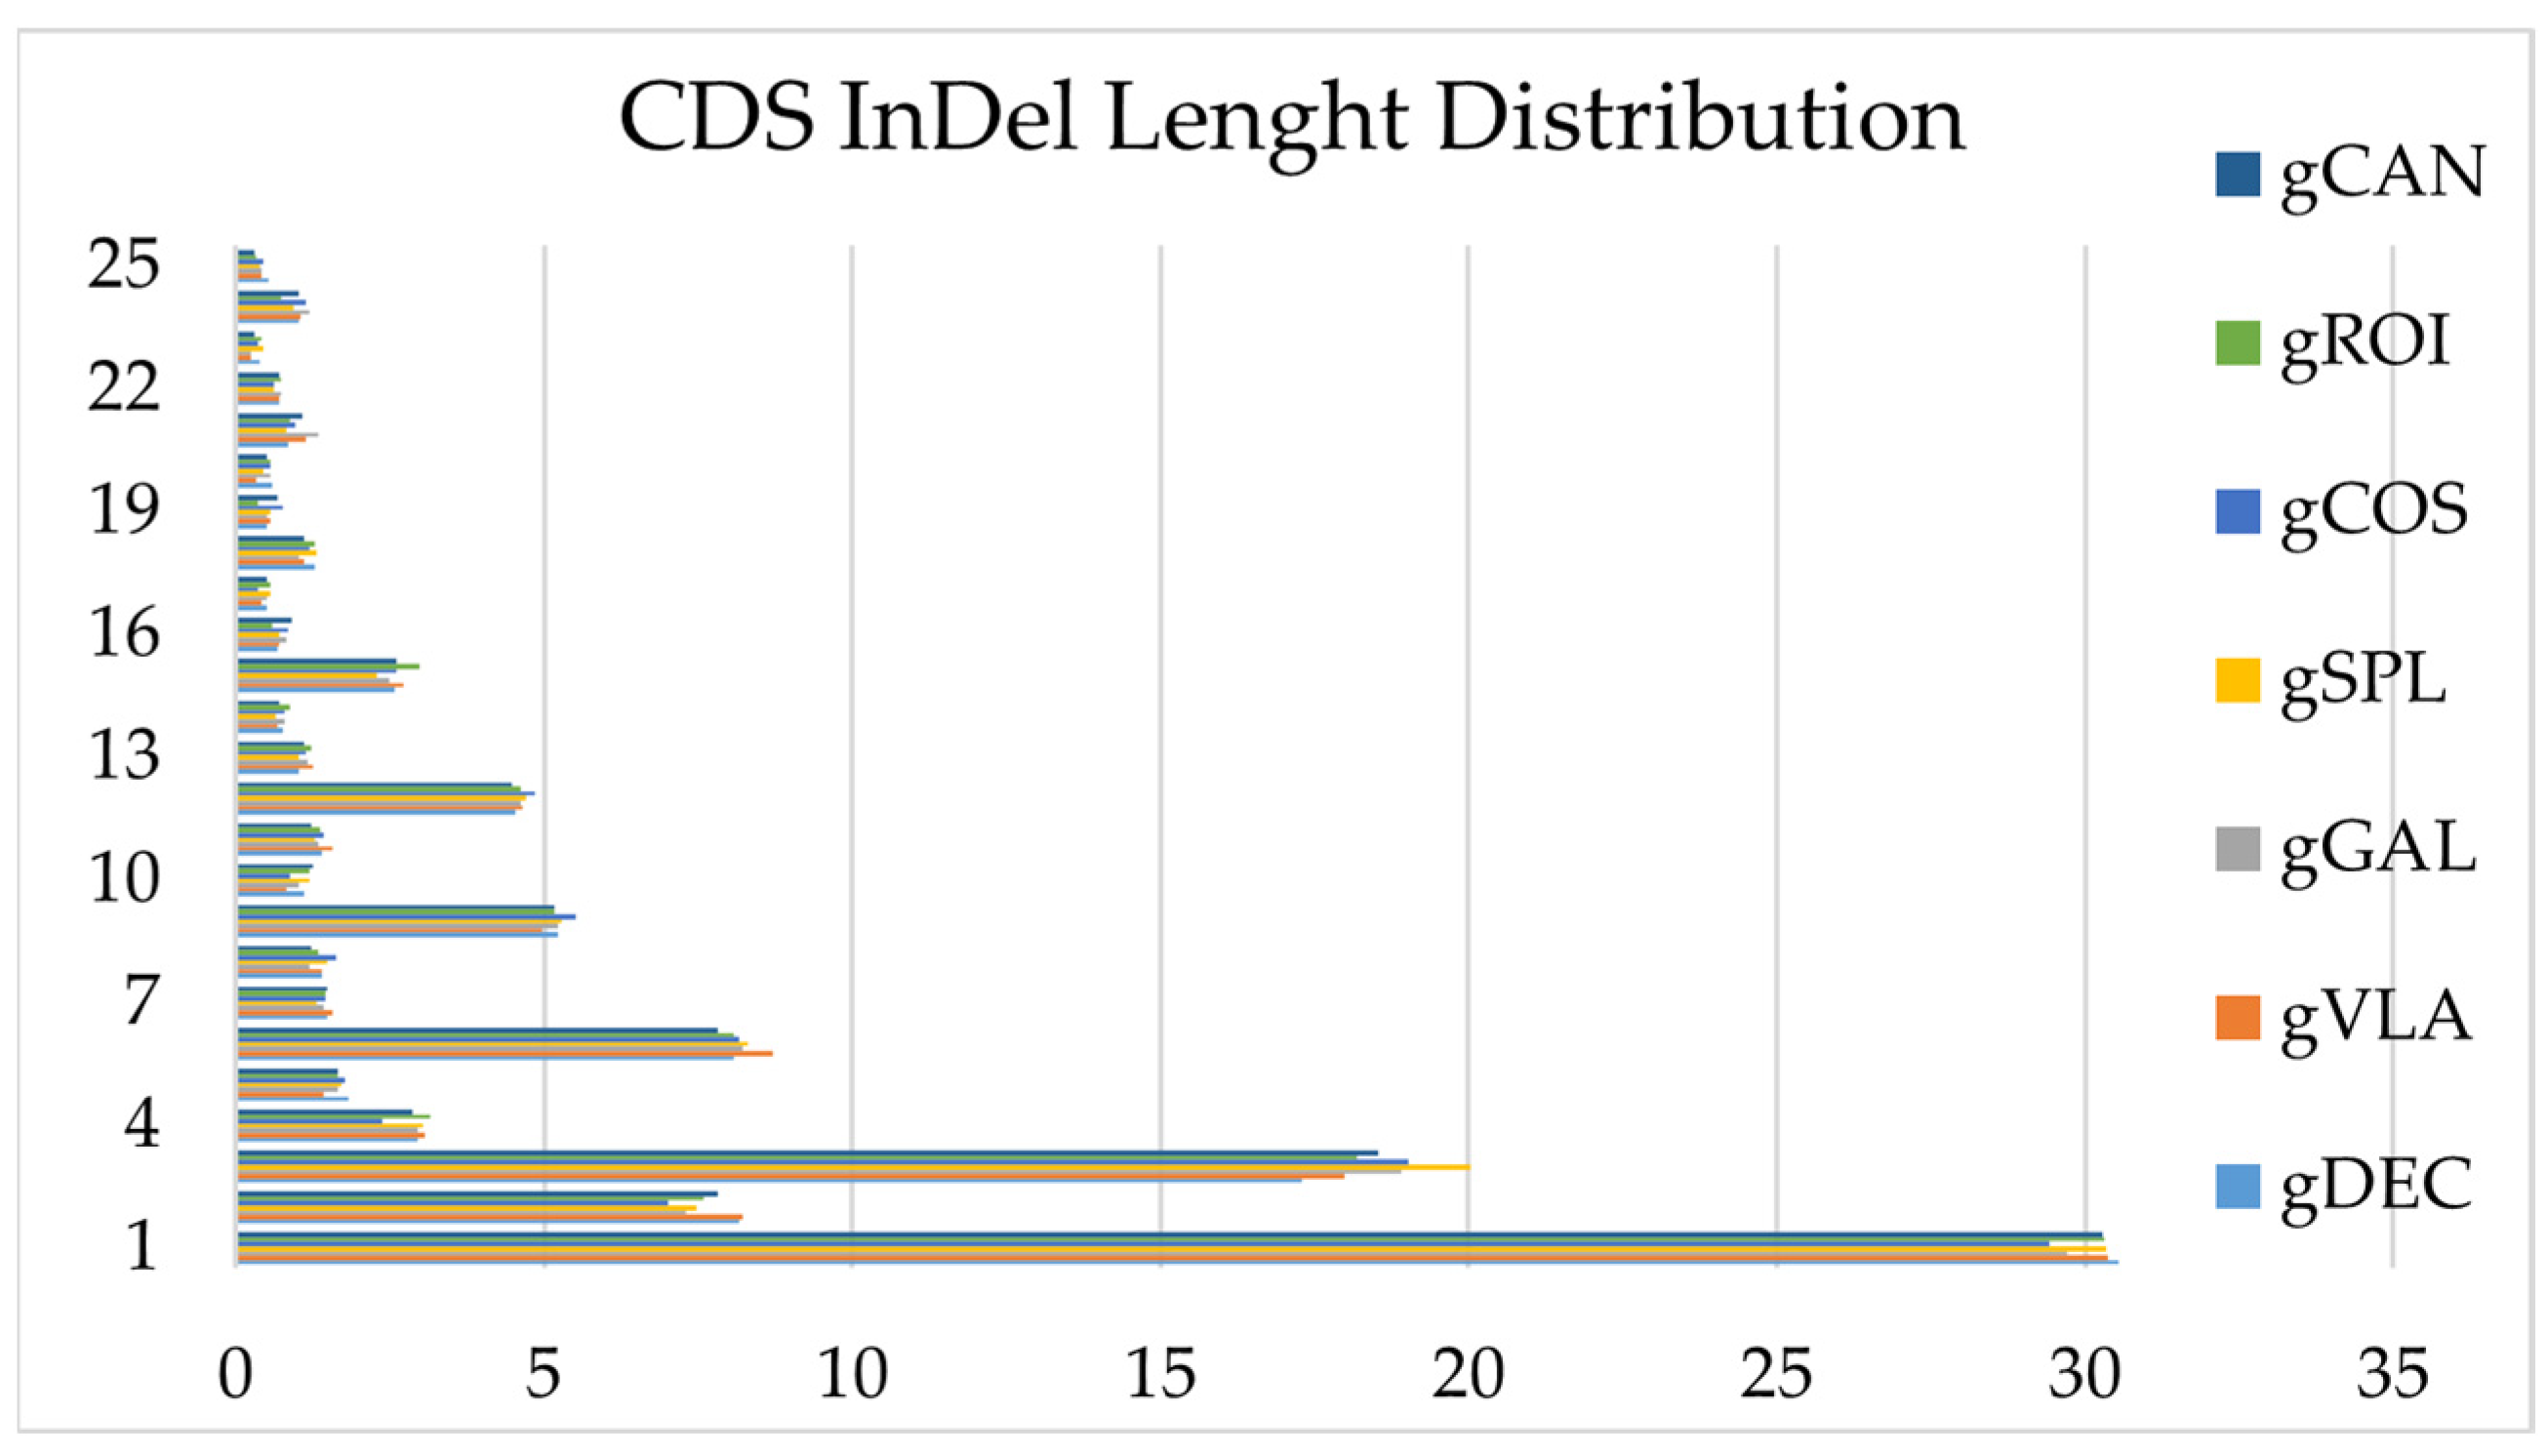
InDel variations were observed across all the genotypes studied and their number and annotation discriminate between genotypes. The InDels were distributed in all regions of the genomes: upstream, exonic (stop gain, stop loss, synonymous, non-synonymous), intronic, splicing, downstream, upstream/ downstream, intergenic and others. The number of Upstream InDels located within 1 kb away from transcription start site of the gene was higher in all samples comparative with downstream of the gene region. The genotype gDEC presented the highest number of frameshift InDel mutations that confer changing the open reading frame with deletion or insertion. The lowest number of non-frameshift InDel mutation without changing the open reading frame with deletion or insertion sequences of 3 or multiple of 3 bases was detected in the genotype gVLA. The highest number of InDels was observed between the 1-3 bp insertion/deletion and decreases sharply after 6 bp sequence length (Figure 5). The highest number of Insertions, Deletions and Intergenic mutations located within the > 2 kb intergenic region was observed in genotype gCOS, therefore the total number of InDel mutations was allocated to gCOS genotype and the lowest number to gVLA genotype. InDel density per chromosomes for genotype gCOS is presented in Figure 6. Statistics of InDels detection and annotation based on WGS for all studied genotypes are presented in Supplementary Table 7.

2.2.3. Structural Variant (SV) Detection and Annotation

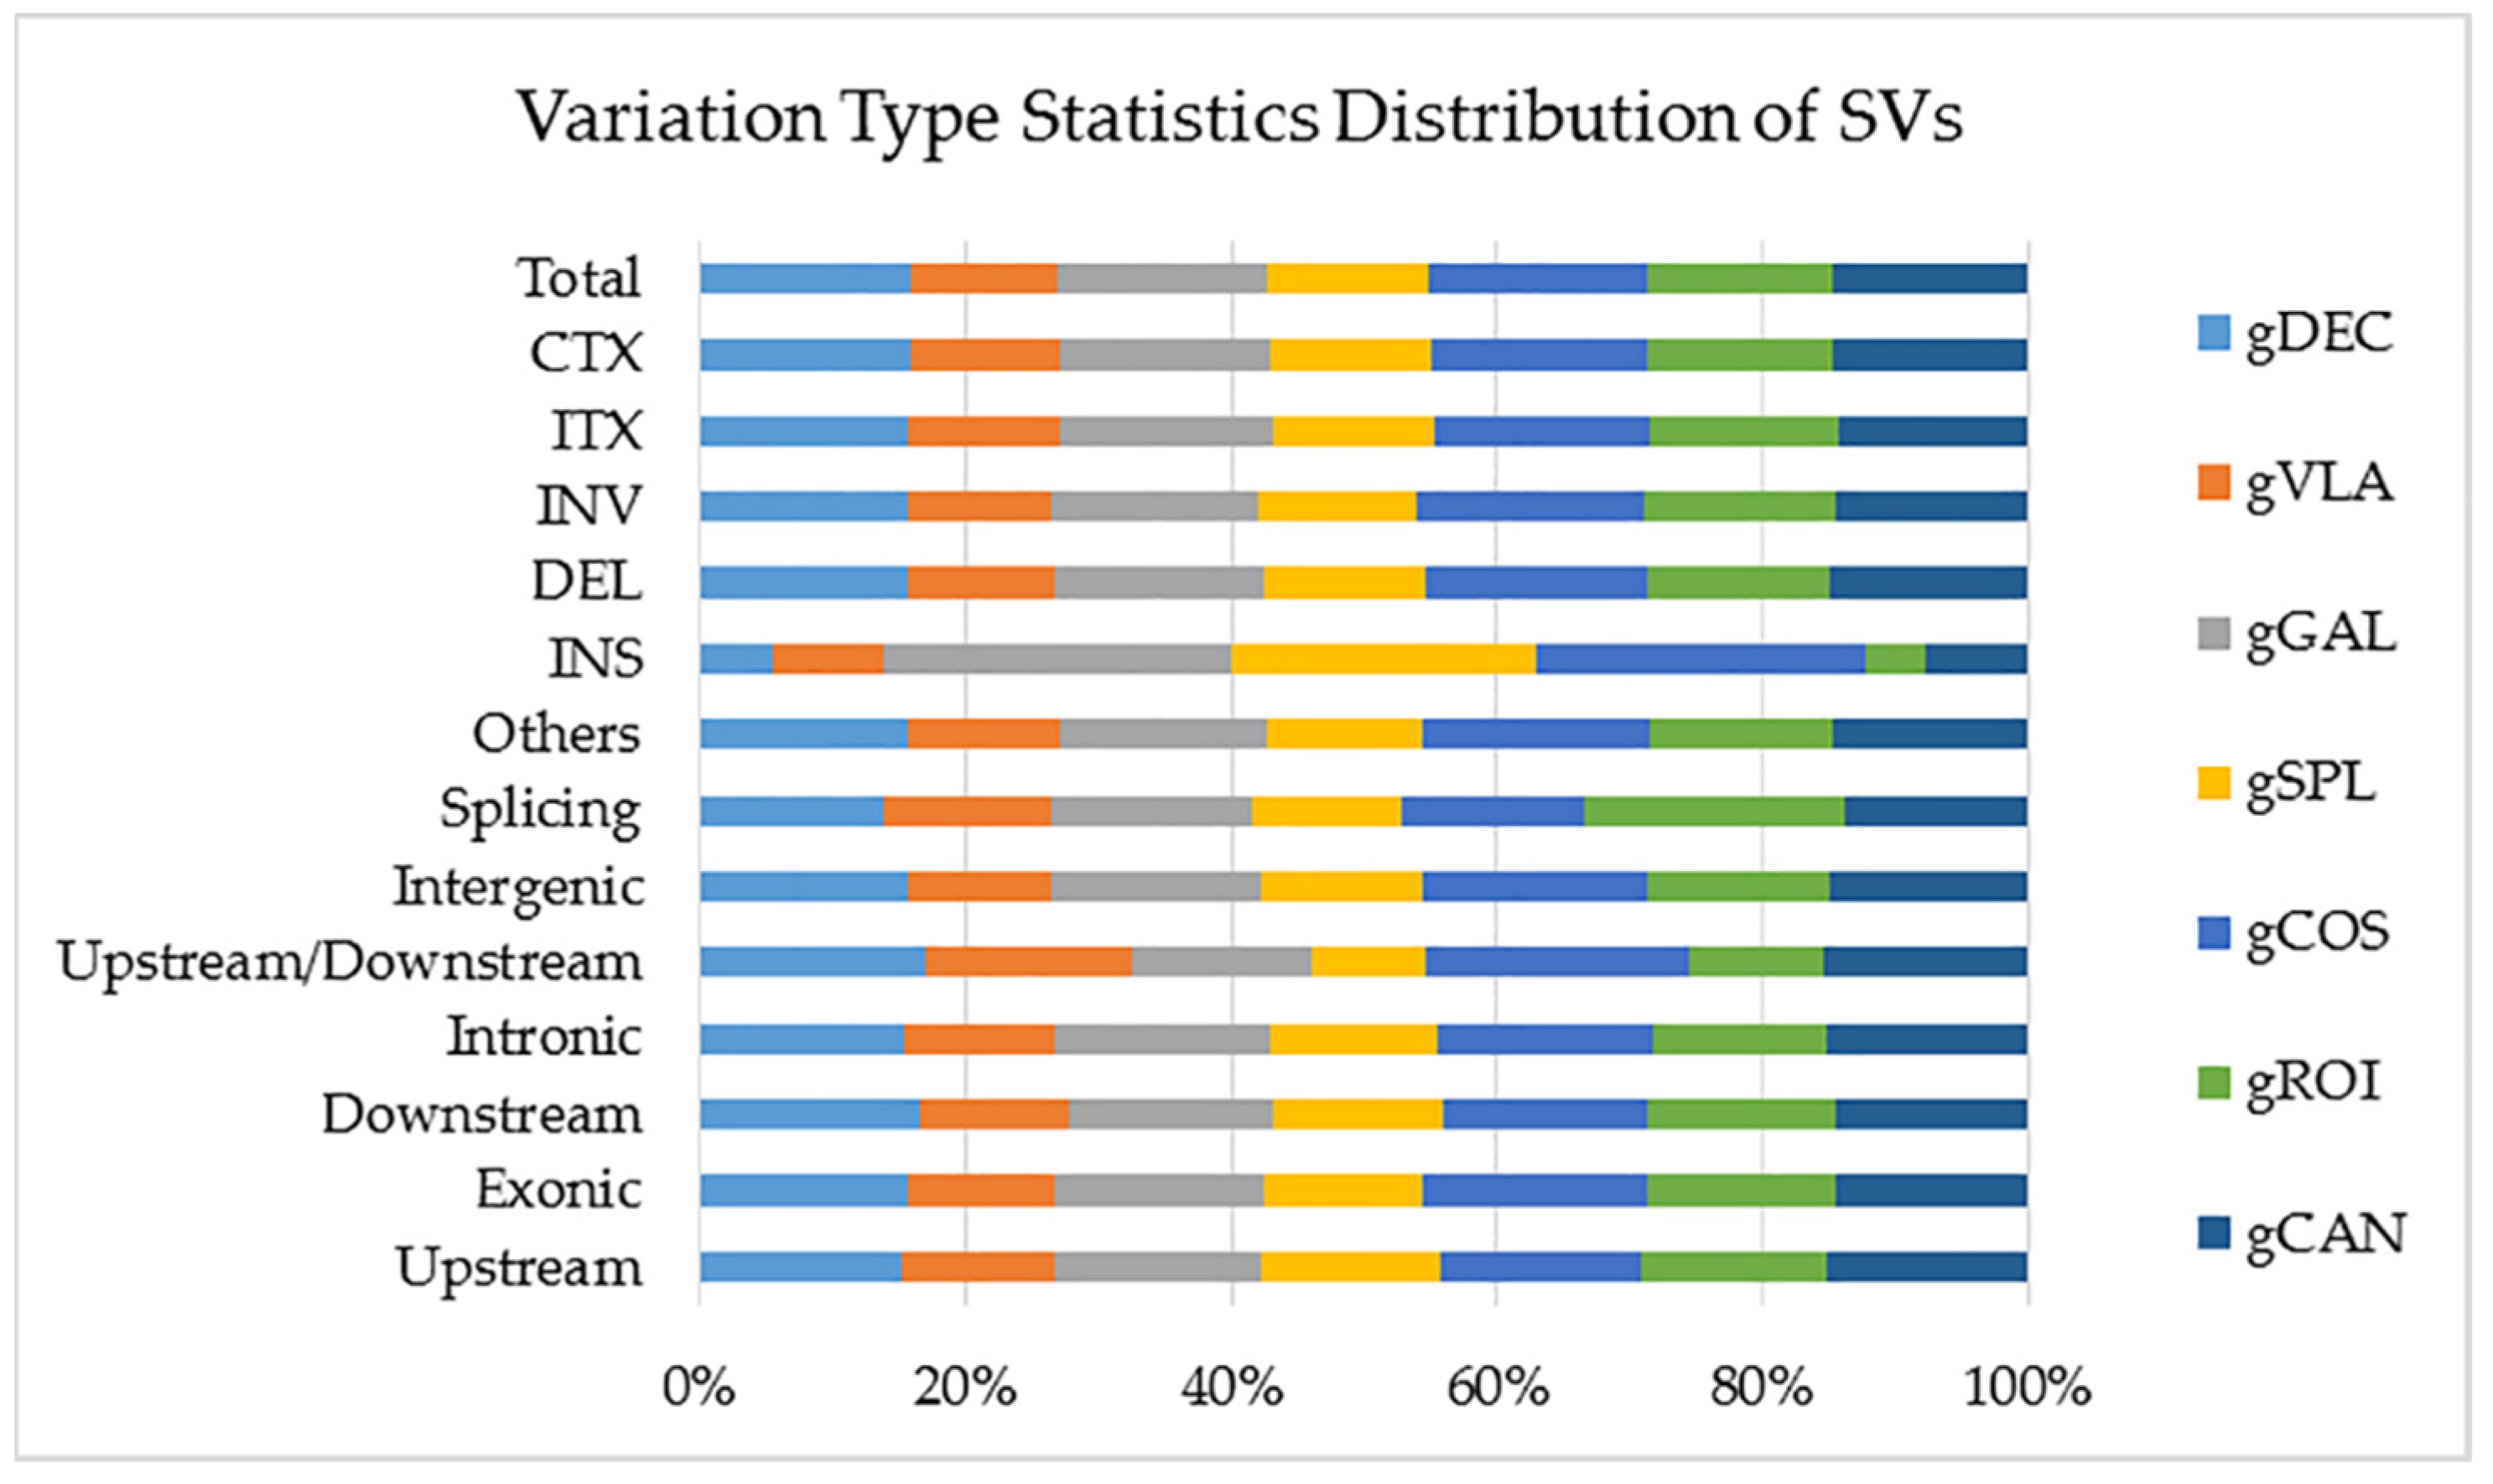
Structural variants (SVs) are genomic variation with mutations of relatively larger size (>50 bp), including deletions, duplications, insertions, inversions and translocations. In all analyzed genotypes SVs located in exonic region were approximately five times more than ones located in intronic region. Genotype gCOS showed the highest number of total SVs located within the > 2 kb intergenic region, deletions, inversions, intra-chromosomal translocations and inter-chromosomal translocations. Hence, gCOS and gGAL presented the highest number the Insertions (INS). The lowest number of INS was observed in gVLA and gROI genotypes (Figure 7). A visual representation of these data is available on statistics of SVs detection and annotation based on WGS for all studied genotypes are presented in Supplementary Table 8.

2.2.4. Copy-Number Variation (CNV) Detection and Annotation

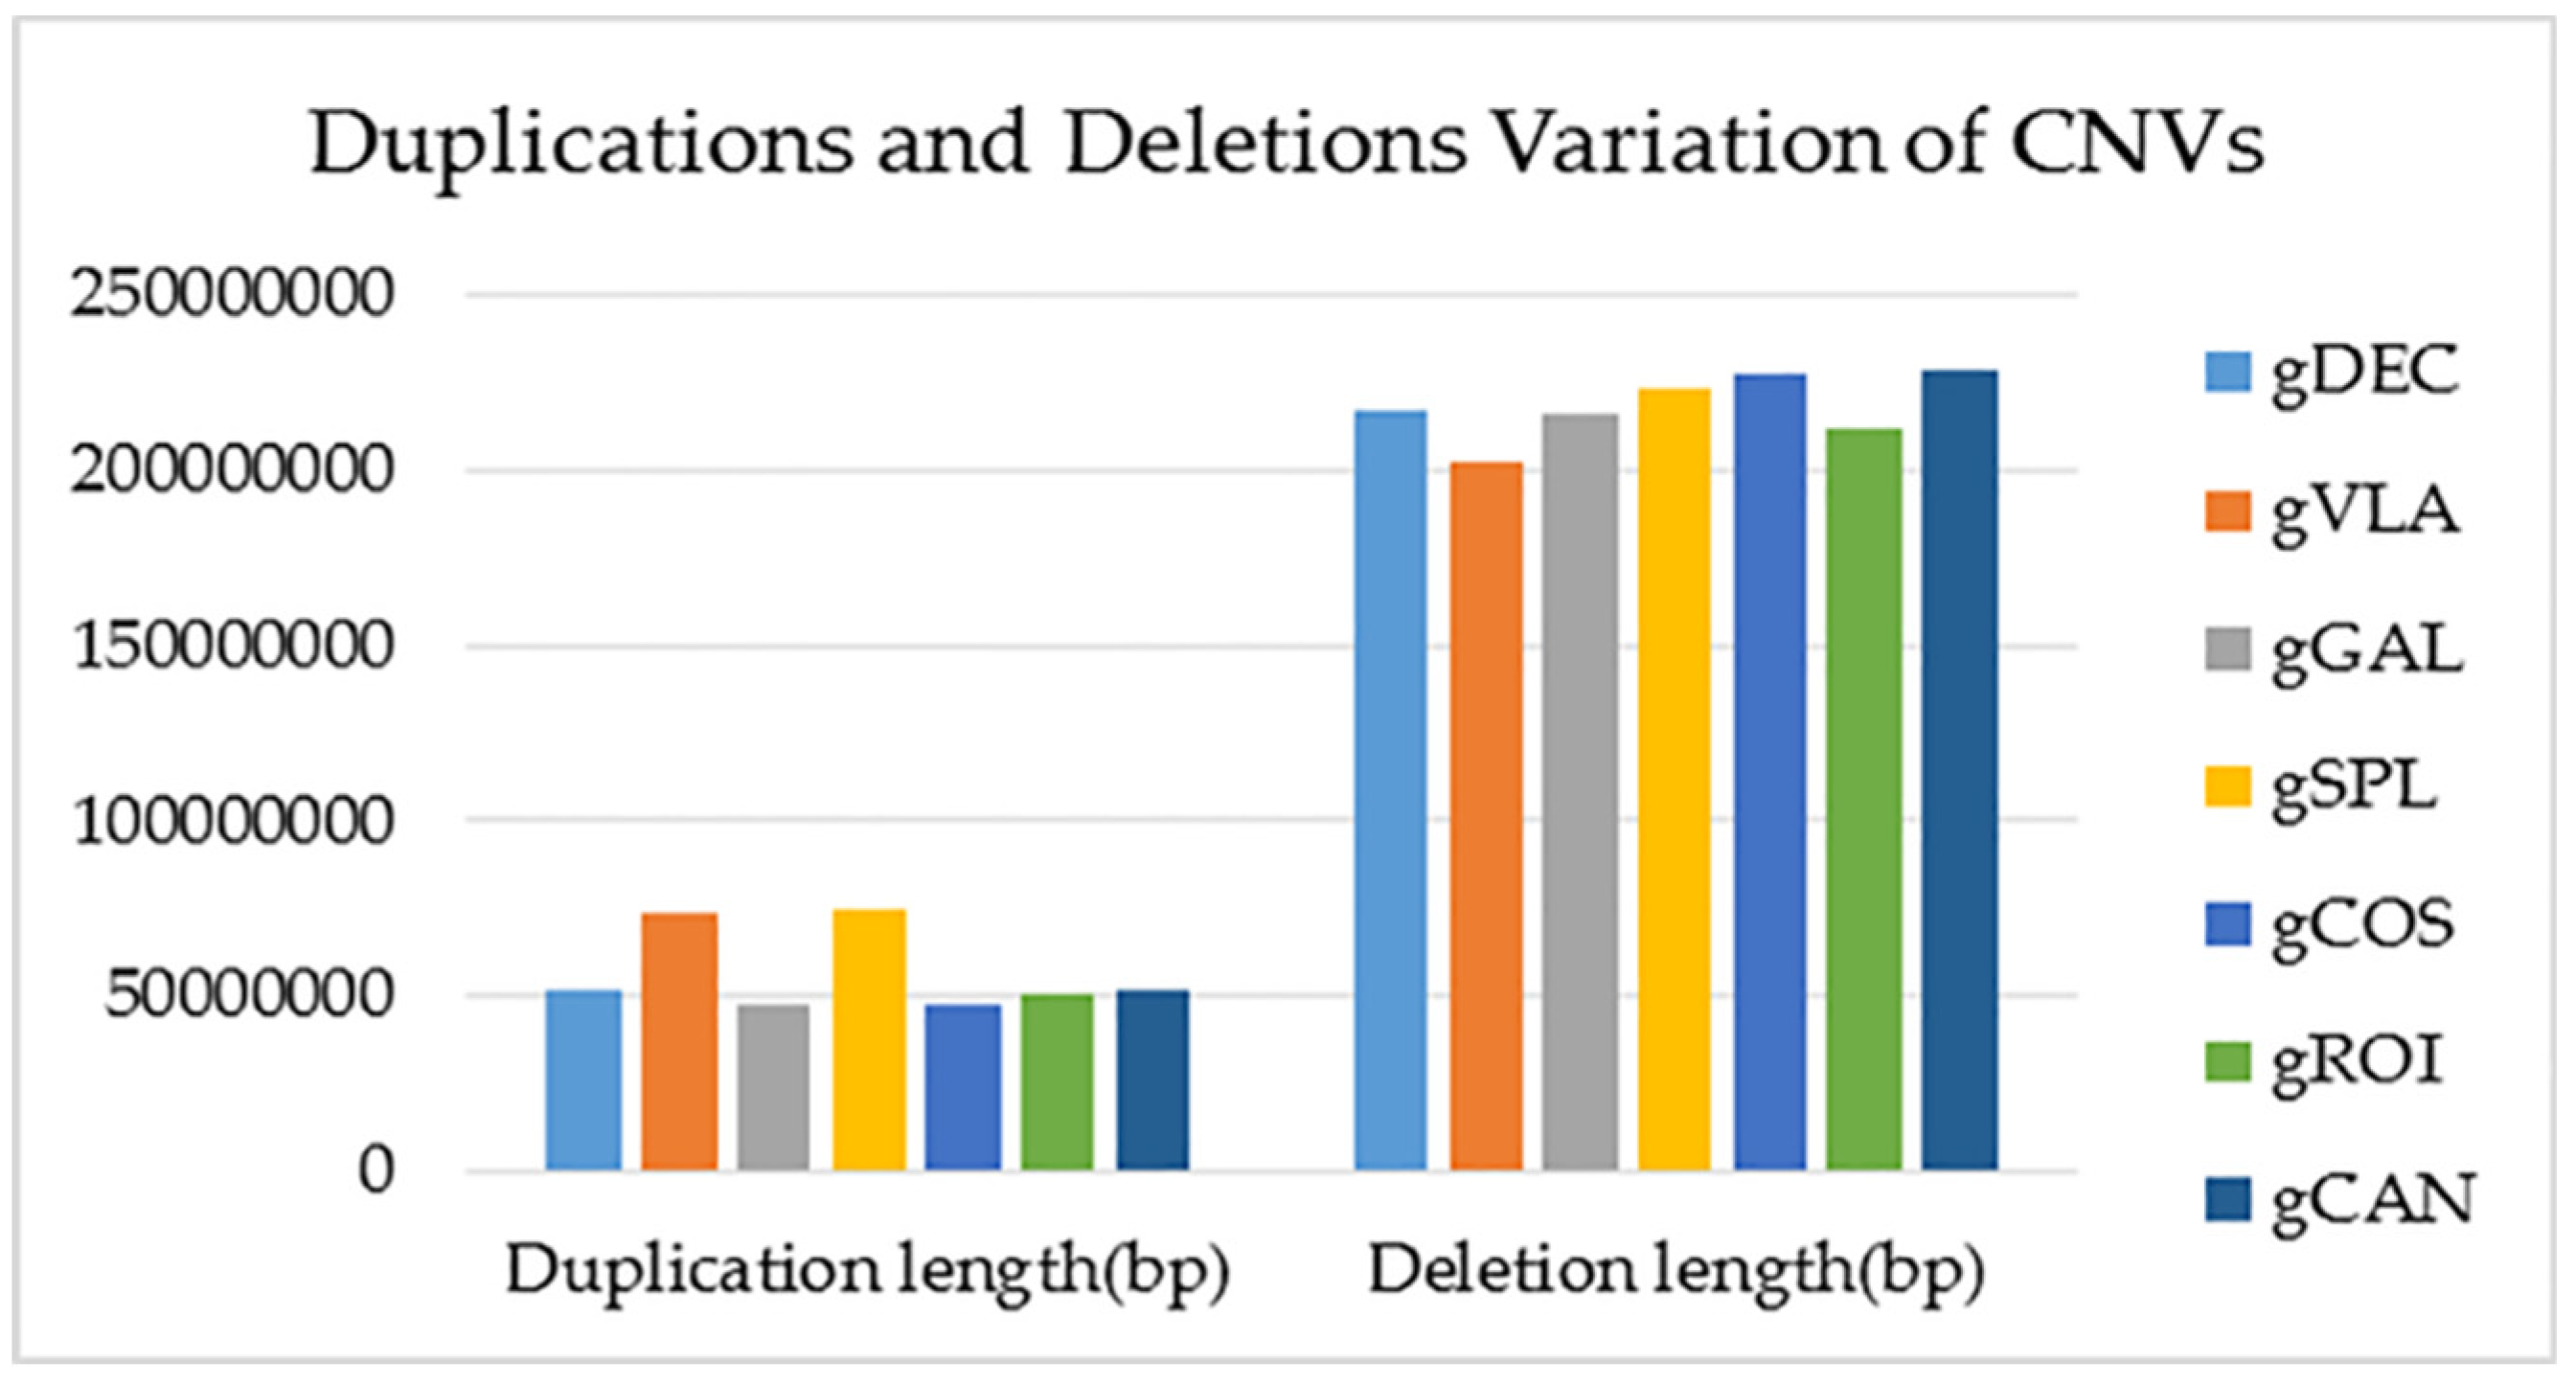
Copy-number variation (CNV) is a type of structural variation showing deletions or duplications in the genome. The highest number of CNVs with increased copy number (duplications) and CNVs located in exonic region was observed in gVLA and gSPL genotypes. The gDEC and gCAN genotypes showed the highest number of Upstream/ Downstream CNVs located within the < 2 kb intergenic region and also the highest number of CNVs with decreased copy number (deletions). The total number of CNVs was assigned to gDEC genotype and the lowest number to gVLA genotype (Figure 8). Statistics of CNV detection and annotation based on WGS for all studied genotypes are presented in Supplementary Table 9.

2.3. Sanger Sequencing and Multiple Genomic Alignments

Genetic profiles analyzed through ISSR and SSR-PCR fingerprints prompted us to use the most common bands as specific markers in order to identify homologous markers within these genotypes. Six out of seven DNA bands ( gVLA, gGAL, gSPL, gCOS, gROI, gCAN) with the size of 1000 bp previously obtained by ISSR-PCR ( P26 primer) and seven DNA bands (gDEC, gVLA, gGAL, gSPL, gCOS, gROI, gCAN) of 220 bp obtained by SSR-PCR ( P3/P4 primers), were amplified by PCR. The 1000 bp and 220 bp DNA fragments were gel purified, and then cloned into pCR™4-TOPO™ TA vector. The cloning process was confirmed by colony PCR and then sent for Sanger sequencing.
Genomic BLAST search of the 1000 bp ISSR-PCR fragment against the pepper WGS Capsicum annuum L. (taxid. 4072) produced significant alignments with LTR retrotransposon (query cover 94% and percent identity 83.47%). In order to find the localization on chromosomes we performed an alignment of ISSR –PCR marker against the Capsicum annuum reference genome UCD-10X-F1 and the result with a query cover of 99% and identity 99% was allocated to chromosome 12, UCD10Xv1.1 whole genome shotgun sequence. With NCBI Genome Workbench software it was performed a multiple genomic alignment between the C. annuum reference genome Pepper Zunla 1 Ref_v1.0, the ISSR-PCR 1000 bp cloned fragment (LTR) UCD10Xv1.1 whole genome shotgun sequence and seven BAM files of Capsicum annuum local genotypes sequences (gDEC, gVLA, gGAL, gSPL, gCOS, gROI, gCAN) from chromosome 12.
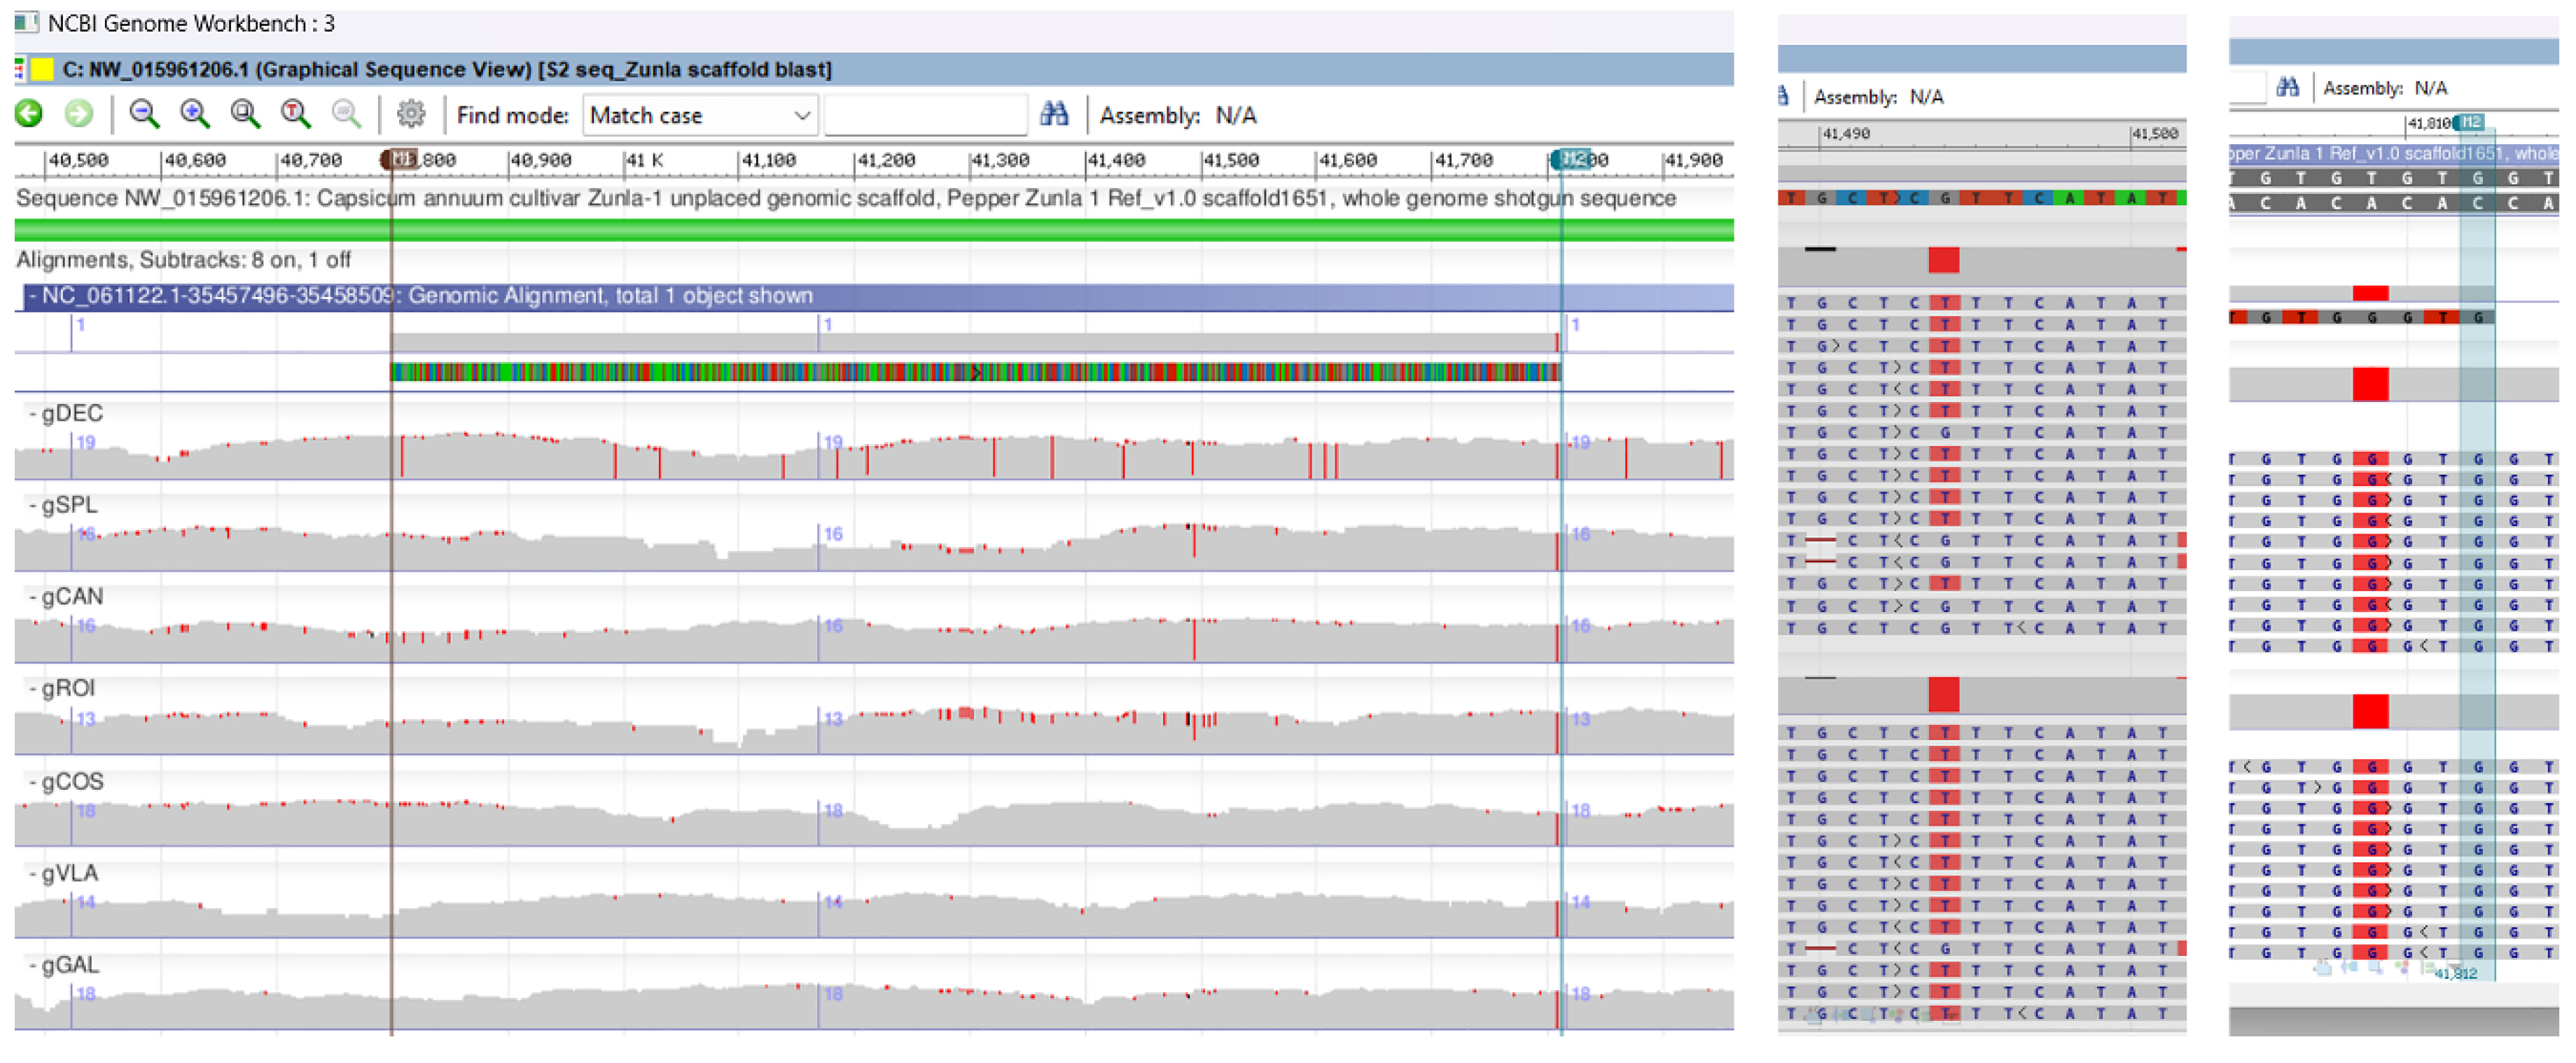
Hence, ISSR-PCR 1000 bp band was amplified only in six out of seven probes, as the gDEC genotype the band was absent on the agarose gel. Genotype gDEC was highly mutated on chromosome 12, with more than fourteen SNPs only in 1000 bp cloned PCR fragment, two of them close to the annealing primer sites (Figure 9). The BLAST search of cloned marker against reference genome Pepper Zunla 1 Ref_v1.0, unplaced genomic scaffold revealed transversions (tv) SNP mutations on gSPL, gROI and gCAN genotypes, with substitution of a purine for a pyrimidine (G ↔ T) on base position 41.494. In all genotypes, within the ISSR-PCR 1000 bp cloned fragment it was observed an SNP mutation with substitution of a pyrimidine for a purine for (T ↔ G) on base position 41.809 (Figure 9, Supplementary Figure 10).
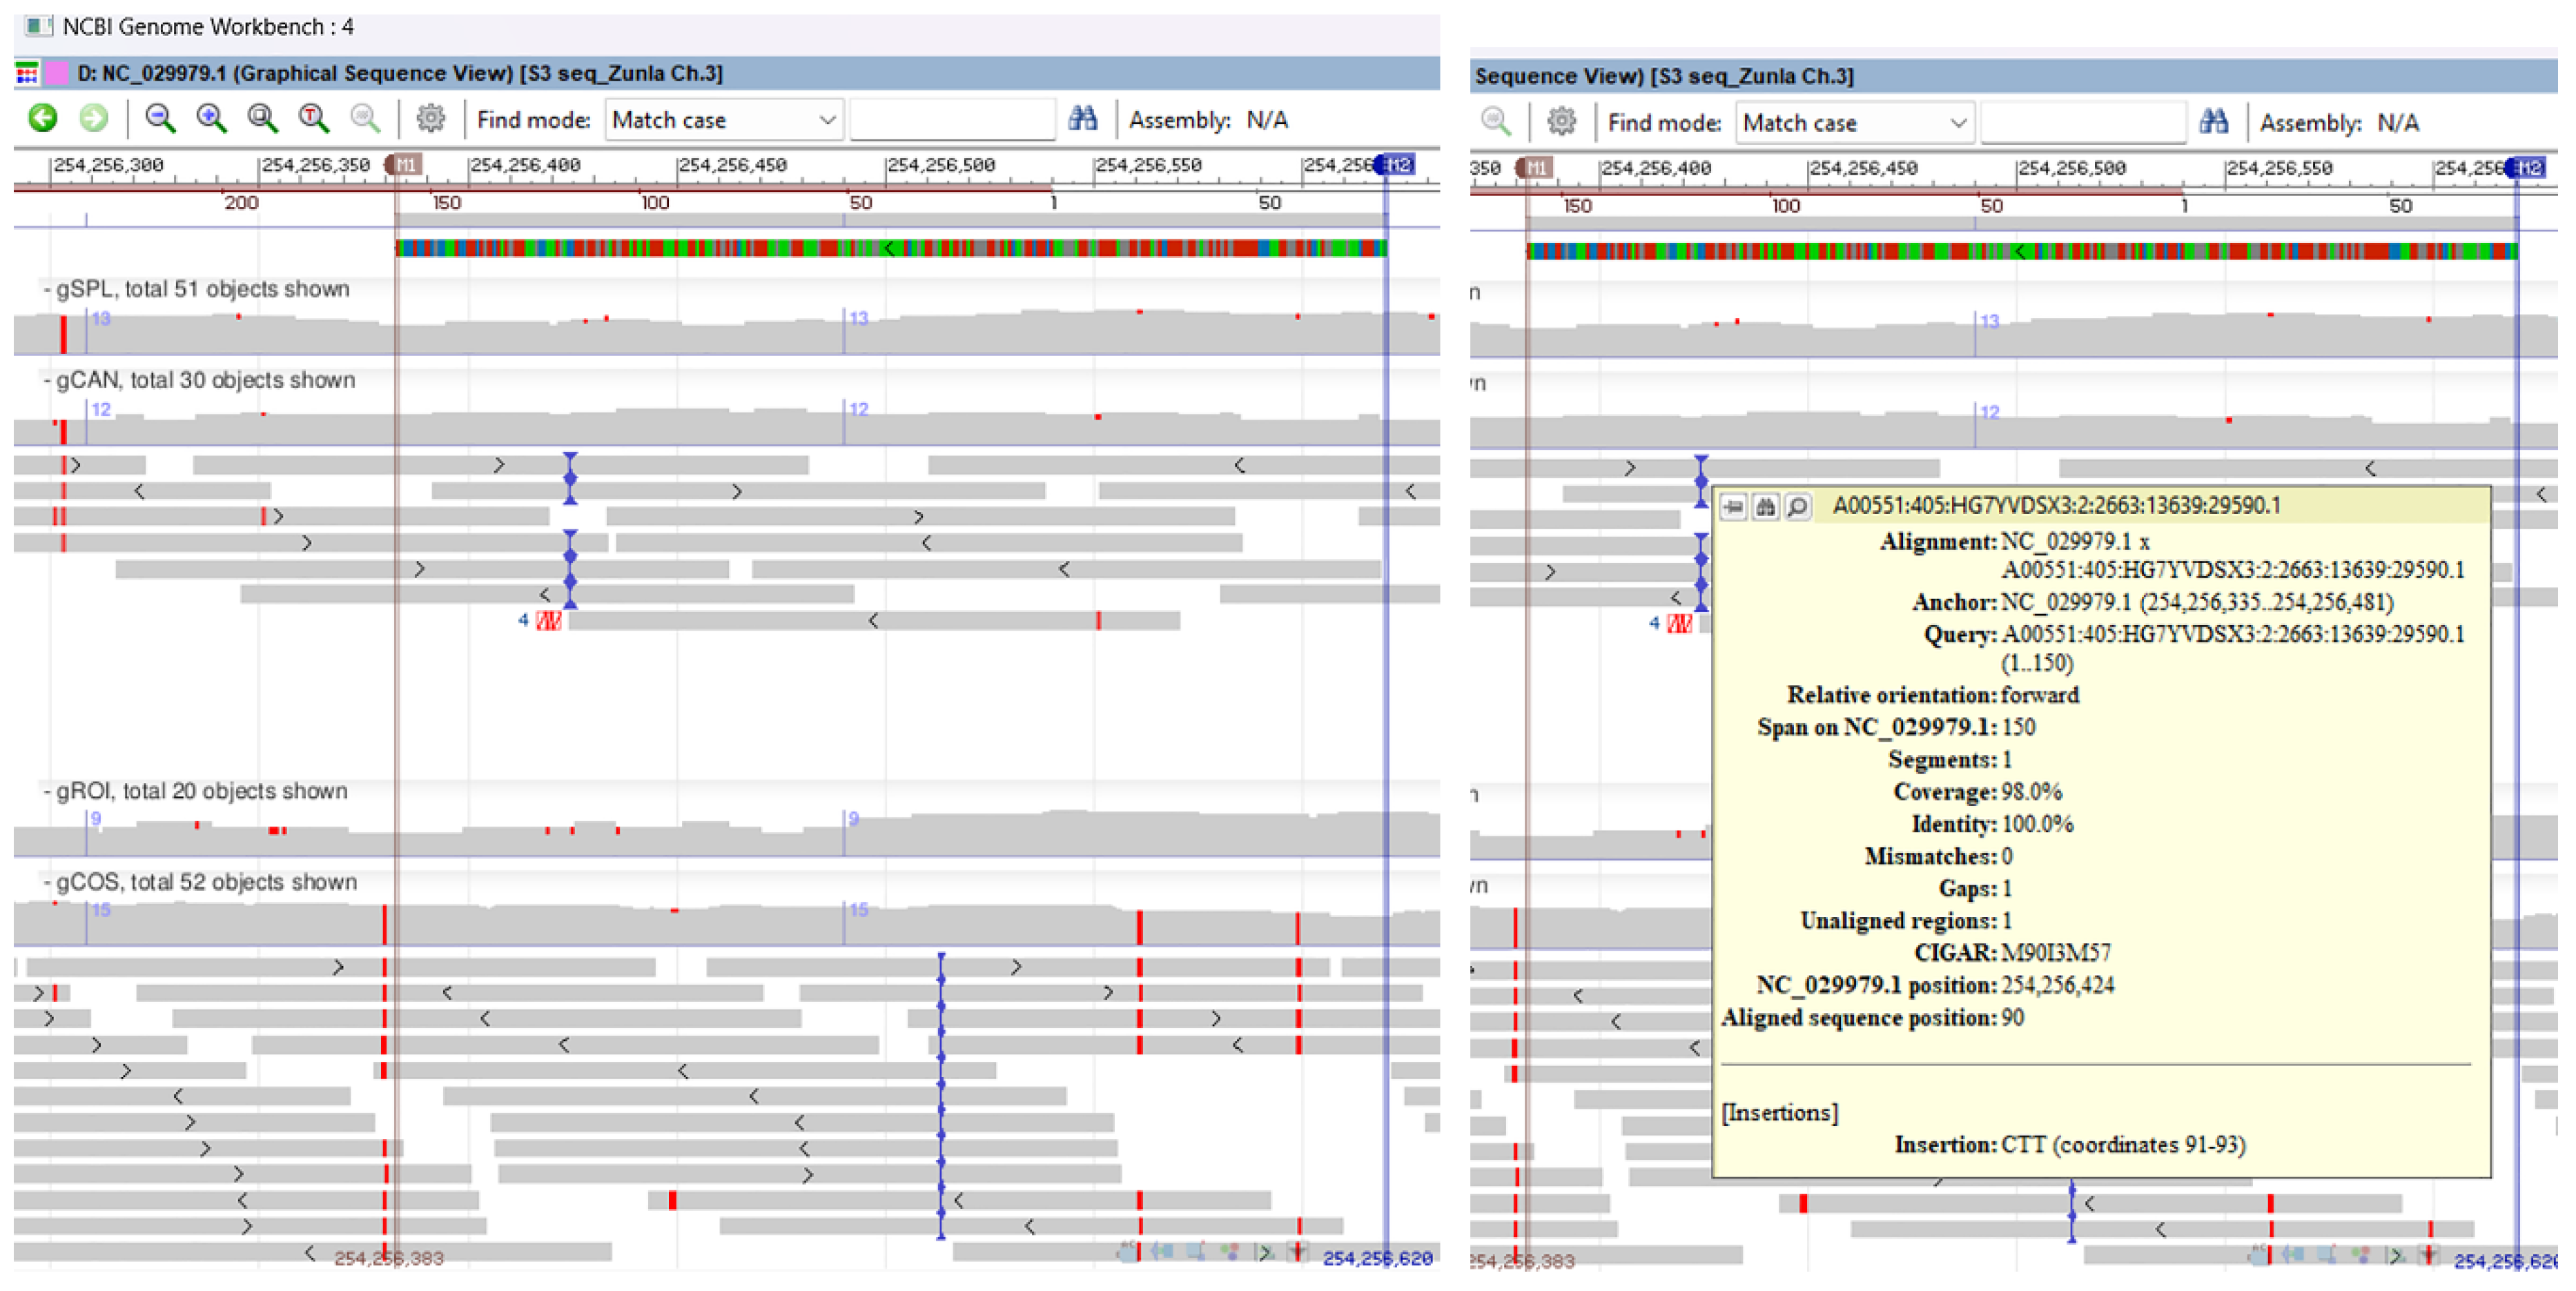
Nucleotide sequence analysis and database study revealed that the Sanger sequenced 220 bp DNA fragment amplified by SSR marker P3/P4 displayed significant sequence homology to Capsicum annuum pathogenesis-related protein 10 (PR-10) mRNA, complete CDS (query cover 100% and percent identity 100%). The BLAST search of the 220 bp DNA fragment sequence against Capsicum annuum reference genome UCD-10X-F1 assigned it to chromosome 3, whole genome shotgun sequence, with query cover 100% and identity 100%. The multiple genomic alignment of C. annuum reference genome, SSR-PCR 220 bp cloned fragment (PR-10) and chromosome 3 sequences for all seven genotypes revealed transitions (ts) SNP mutations only on gCOS genotype. On graphical sequence view, inside the SSR-PCR cloned fragment for gCOS genotype, it was observed a point mutation that changes a purine nucleotide to another purine (G↔ A) on base position 254.256.561 and another SNP with changes from a pyrimidine nucleotide to another pyrimidine (T ↔ C) on base position 254.256.599. Genomic alignment revealed no SNPs mutations inside the SSR-PCR cloned fragment for other genotypes. In addition, a trinucleotide insertion, CTT type, was observed on 254,256,423 position for gCAN genotype and one nucleotide insertion, T type, on 254,256,512 position for gCOS genotype (Figure 10, Supplementary Figure 11).

3. Discussion

In Romania, several types of pepper varieties (bell pepper, red fibster pepper, sweet long red pepper or hot pepper) are traditionally cultivated for fresh consume and for preserves [19]. Romanian consumers prefer locally grown vegetables for their taste, shape, color, size and pepper is one of the main vegetable crops preferred by the local consumers, so the breeders are constantly developing new varieties [20, 21]. Despite this, there is a lack of molecular data and conservation status of these pepper varieties. Accordingly, seven Romanian pepper (C. annuum L.) varieties with valuable traits, homologated by VRDS, were studied in the present experiment for evaluating their genetic diversity (Supplementary Figure 12) as well as in deep molecular characterization using WGS for variant/mutation detection. The pepper varieties used in the present study were registered in the ISTIS catalog between 1974 and 2019 [16] and maintained in conservative selection at VRDS development station. The varieties were chosen not only for their superior organoleptic properties, good yield and storage potential, but also for their resistance to biotic and abiotic factors [22]. Studies regarding fruit quality [23], seed germination [24], fruit storage [25], impact of environmental conditions over the crop growing [26,27], the influence of organic fertilizers [28,29], were performed on several Romanian varieties of pepper including gGAL, gCOS and gSPL. Several authors reported morphological and physiological studies [30], seedling growth [31], but no molecular studies have been published yet using WGS analysis in order to characterize VRDS pepper germplasm.
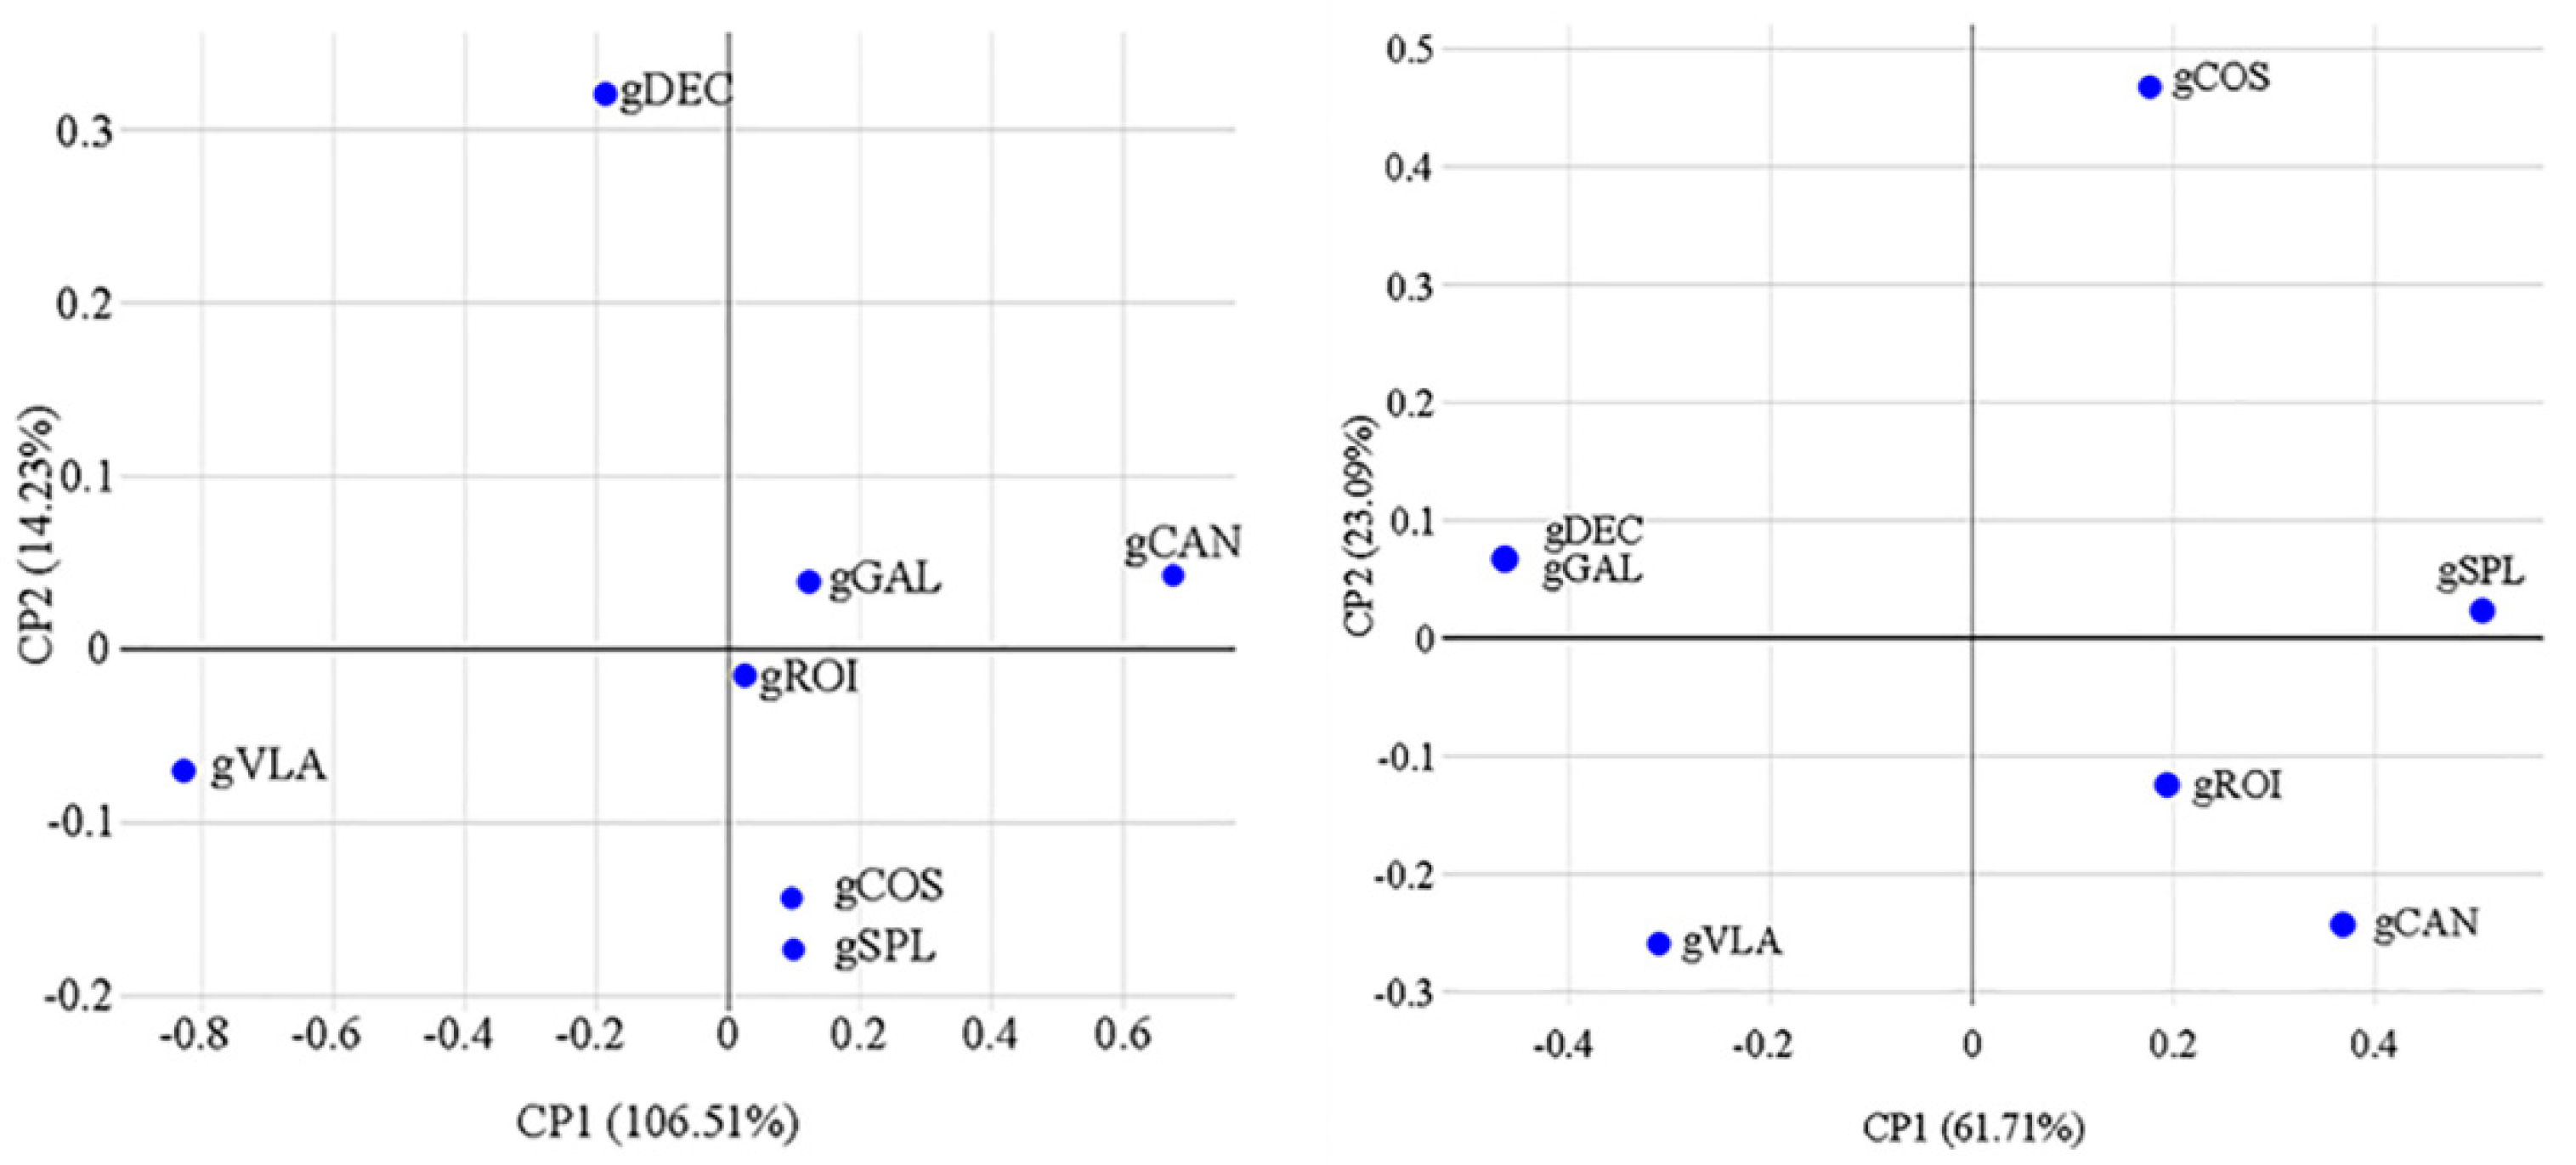
The dendrograms that shows the hierarchical trees generated by software (BIO-R) exposed that all varieties were clearly separated into two clusters. The ISSR profile revealed two clusters where gDEC and gVLA were grouped in one cluster based on their similarity and the second cluster with gROI and gSPL the first group and gGAL, gCOS and gCAN the second group, might suggests certain relationships and possible gene exchange among these varieties (Figure 2). SSR profile revealed two clusters with gVLA and gDEC and gGAL very similar and another cluster with gROI, gSPL, gCAN and gCOS (Figure 1). Multidimensional scaling analysis (MDS) in 2D represent the distances among the objects in a visual way were calculated with BIO-R software. MDS 2D variations for ISSR suggested a structure with related genotypes group as: gGAL, gCAN; gROI, gCOS, gSPL and unrelated genotypes: gDEC and gVLA. MDS 2D variations for SSR suggested a structure corresponding to combination as: gDEC,gGAL; gROI,gCAN; gSPL and gCOS at higher distance and unrelated genotypes gVLA ( Figure 11) .
Genomic alignment of ISSR-PCR 1000 bp cloned fragment against the pepper reference genome produced significant alignments with LTR retrotransposons. LTRs are mobile genetic elements characterized by their long terminal repeats essential for transposable elements integrations and some of the most abundant components found within eukaryotic genomes. [32]. Genome–wide analysis of ISSR-PCR 1000 bp LTR retrotransposon showed 12 K distance from LOC 107854643 serine/threonine-protein kinase ATG1t gene and 13 K distance from LOC 124889513 auxin-responsive protein SAUR68-like gene, both on Capsicum annuum chromosome 12 UCD 10Xv1.1.
Multiple alignments were conducted in the SOL Genomics Database with alignment analyzer tool to identify potentially active LTRs within Solanaceae family. BLAST search against Solanaceae popular datasets revealed 99% identity of 1000 bp complete query length with C. annuum Dempsey V1.0, C. annuum Maor V1.0, C. annuum UCD10X, C. annuum Zunla genomes and 94% identity with C. chinense genome scaffolds (release 0.5). In tomato reference genome (SL4.0) and tomato wild species as: S. pimpinellifolium LA1670 genome and vs S. pennellii BAC Ends only a short fragment of 100 bp had 86% identity with LTR between 600-700 bp query length. Against Potato genome and Potato Bac sequences, the same 100 bp short fragment against our clone, had 88% identity and an extra fragment of 200 bp with 79% identity was located at 5’end of the 1000 bp cloned LTR fragment. In Eggplant V 4.1, Nicotiana benthamiana V 2.6.1. and Petunia axillaris V 1.6.2. genomes only a 200 bp fragment located at 5’end had 80% identity. On the basis of sequence alignments, it seems that among Solanaceous species, transposable elements can move through genomes and may have experienced distinct degeneration events along with genome evolutionary history [33,34].
The pepper genome, as a result of large genome size, may be the best model for the analysis of genome expansion through evolution of constitutive heterochromatic regions [35] and particularly LTR retrotransposons, are major factors that constitute the heterochromatin sequences [36,37,38].
Database study revealed that the selected clone corresponding to 220 bp SSR-PCR marker is an expressed sequence tag (EST)-SSR molecular marker, identified from the transcribed region of the pathogenesis-related protein 10 (PR-10) gene. This EST-SSR molecular marker was present in all analyzed genotypes indicating conservation of wide range PR-10 up-regulated protein, expressed during hypersensitive response upon infection by pathogens. PR-10 are multifunctional proteins, present throughout various plant tissues, playing significant role in growth, development and stress response with crucial role in plant defense against pathogens [39,40,41,42].
WGS analysis revealed that SNPs located upstream away from transcription start site of the gene and SNPs mutations in exonic region (CDS) were the most abundant on gSPL genotype. Moreover, the genotype gSPL presented the highest number of Stop gain (introduction of stop codon at the variant site) and Stop loss (removal of stop codon at the variant site) exonic SNPs mutations. The genotype sSPL (Splendens, Capsicum annuum L. spp. grossum (L.) Filov. cousin. tetragonum Miller), red fibster pepper, is a variety registered in the ISTIS catalog in 2008. The lowest number of total SNPs was observed in gVLA genotype (Vladimir, Capsicum annuum L. spp. annuum convar. Microcarpum Filov.), a red hot pepper variety registered in the ISTIS catalog in 2015 (VRDS Buzău) [16].
SNPs located within the intergenic region, transitions and transversions showed the highest value on gCOS genotype, as well as the total number of SNPs. gCOS (Cosmin, Capsicum annuum L. spp. longum (DC.) Terpó) is a sweet long red pepper variety registered in the ISTIS catalog in 1984 (VRDS Buzău). SNPs are associated with variations in phenotype and resistance to disease as they may alter protein structure and function, enhance the binding affinity of transcription factors, modify alternative splicing and regulate non-coding RNA [43,44,45]. Additionally, SNPs have been used to identify QTLs underlying various traits in plants [46,47].
The highest density of Insertions, Deletions and Intergenic mutations located within the > 2 kb intergenic region was observed in genotype gCOS and the lowest number to gVLA genotype. InDels can affect the synthesis of proteins and functional RNA molecules. InDel mutations have been a valuable complement to SNPs and simple sequence repeats (SSRs) [48]. InDel variations can be formed by unequal crossover, transposable elements and sequence replication in regions of repetitive DNA [46,49,50].
Structural variants (SVs) are genomic variation with mutations of relatively larger size (>50 bp) that can have significant effects on gene expression and phenotype [51]. Genotype gCOS showed the highest number of SVs located within the > 2 kb intergenic region, deletions, inversions, intra-chromosomal translocations and inter-chromosomal translocations. Hence the total number of SVs was assigned to gCOS genotype and the lowest one to gVLA genotype.
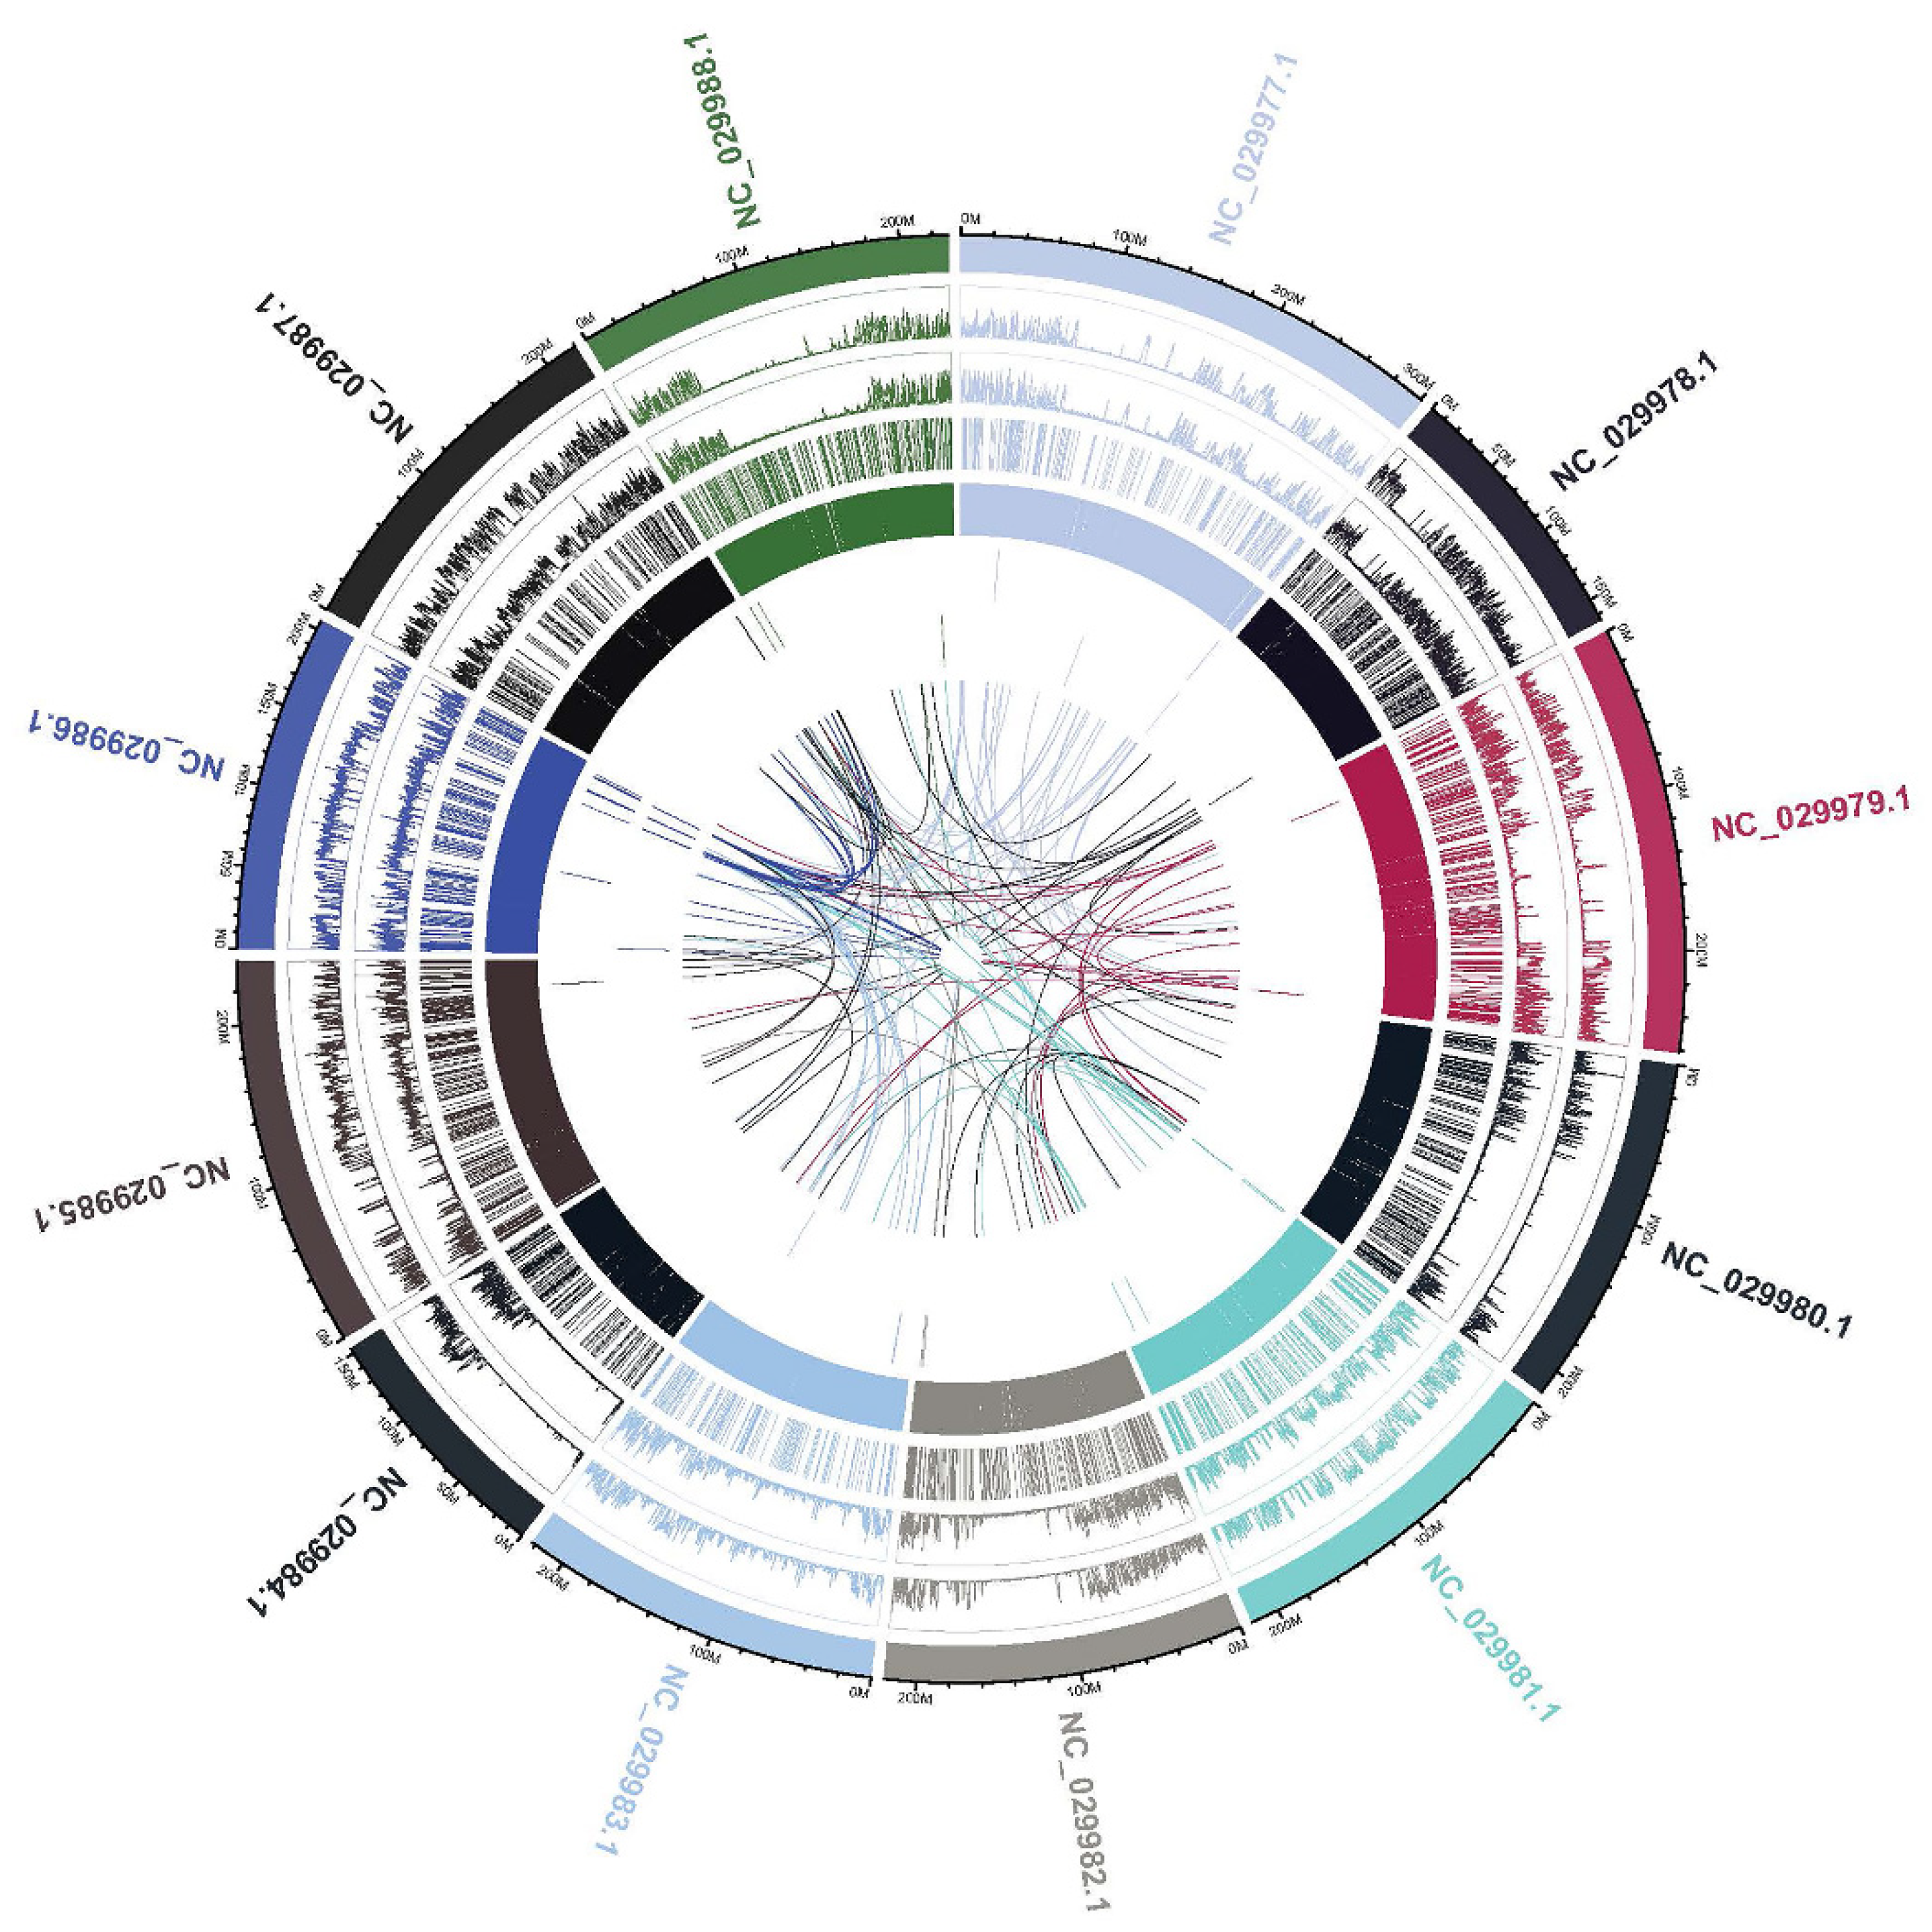
Copy-number variation (CNV) is a type of structural variation that contributes to phenotypic variance including duplications and deletions. CNVs, including duplications and deletions, can influence gene expression by disrupting gene coding sequences, perturbing long-range gene regulation or altering gene dosage [52]. CNVs with increased copy number (duplications) and CNVs located in exonic region was observed in gVLA genotype. The gDEC genotype showed the highest number of Upstream/ Downstream CNVs located within the < 2 kb intergenic region and also the highest number of CNVs with decreased copy number (deletions). CNVs can influence gene expression by disrupting gene coding sequences and perturbing long-range gene regulation or altering gene dosage [52]. For proper visualization of the structural variations on the whole-genome, sequencing data of gCOS genotype is presented according to mutation types with Circos plots. Circos uses a circular ideogram to facilitate the display of relationships between pairs of positions by the use of ribbons, which encode the position, size, and orientation of related genomic elements [53].
The outer ring represents the chromosomes and inside the chromosomes ring are drawn the density of SNP/InDel type distribution as well as for SV/CNV type, the location and size (Novogene Co., Ltd., Cambridge, UK.). Whole genome variations distribution shown aligned regions between chromosomes connected with ribbons to illustrate relationships between genomic positions. gCOS displayed the highest number of SVs located within the > 2 kb intergenic region, deletions, inversions, intra-chromosomal translocations and inter-chromosomal translocations. Additionally, the width of the ribbon corresponds to the alignment length at specific locations. For gCOS, the 90-200 M region on chromosome 4 (NC_029980.1), shows large deletions and inversions as well as translocations that involve chromosomes 5 (NC_029981.1), 6 (NC_029982.1) and 7 (NC_029983.1). (Figure 12). Also, 0-50 M region on chromosome 8 (NC_029984.1), shows large deletions and inversions that involve chromosomes 10 (NC_029986.1). A strong relation between genomic positions of 150-200M from chromosome 10 (NC_029986.1) is illustrated with 0-50 M from chromosome 12 (NC_029988.1) (Figure 12). A visual representation of WGS data with Circos plots, SNPs and InDels density per chromosomes for all studied genotypes are presented in Supplementary Figures 13.

4. Materials and Methods

4.1. Plant Material

Pepper seeds from seven Romanian pepper (Capsicum annuum L.) varieties as ‘Decebal’-gDEC (yellow hot pepper), ‘Vladimir’-gVLA (red hot pepper), ‘Galben Superior’-gGAL (yellow bell pepper), ‘Splendens’-gSPL (red fibster pepper), ‘Cosmin‘-gCOS (sweet long red pepper), ‘Roial‘-gROI (red hot pepper), and ‘Cantemir‘-gCAN (red bell pepper) were received from Vegetable Research and Development Station Buzău Station (South-East Romania) and cultivated under greenhouse conditions (18–25°C) in the Research Center for Studies of Food Quality and Agricultural Products of the University of Agronomic Sciences and Veterinary Medicine of Bucharest, Romania (https://erris.gov.ro/RESEARCH-CENTER-FOR-STUDIES--1).

4.2. DNA Extraction

Extraction of genomic DNA was performed using 100 mg young leaves for each of the seven Romanian varieties. Genomic DNA was extracted using an automated extraction system (InnuPure C16, Analytik Jena GmbH, Jena, Germany) based on the principle of magnetic particle separation for fully automated DNA isolation and purification. InnuPREP Plant DNA I Kit-IPC16 (Analytik Jena GmbH, Jena, Germany) was used for genomic DNA extraction following manufacturer’s instructions. A preliminary manual processing step was the external lysis of the starting material. The plant sample was ground in the presence of liquid nitrogen to a fine powder and homogenized with SLS lysis solution (containing CTAB as detergent component), Proteinase K and RNase A solution. After external lysis, the extraction proceeded with automated DNA extraction using the Ext_Lysis_200_C16_04 program. The DNA was quantified at 260 nm and its purity measured at a 260 nm/280 nm absorbance ratio. All measurements were conducted with a NanoDrop TM1000 spectrophotometer (Thermo Fisher Scientific), and DNA quality was also estimated in 1,2% agarose gels.

4.3. ISSR Analysis

Seven anchored ISSR primers consisting of di and tri-repeat motifs were selected [18] and synthesized by ANTISEL/CeMIA SA (Cellular and molecular immunological applications, GR.), for screening in this study. These anchored primers have an extended portion of bases in the 5’ or 3’ end of their sequence, to increase the specificity of the amplicon, such as polymorphic content and their capability of distinguishing between genotypes (Table 2).Total volume for the PCR reactions was 25 µl, containing Platinum™ II Hot-Start PCR Master Mix (2X) with Platinum™ II Taq Hot-Start DNA Polymerase premixed in an optimized PCR buffer with dNTPs and 1.5 mM MgCl2 in final reaction concentration (Invitrogen™), 0.8 µmol/µl primer, 5 µl Platinum™ GC Enhancer and 50 ng genomic DNA. Amplification was performed with a Mastercycler® Nexus system (Eppendorf™) as follows: one cycle at 94°C for 2 min; 35 cycles with 94°C for 15 s; 51°C for 30 s; 68°C for 1 min; and a final extension of 68°C for 2 min. Amplification products were separated in 1.5% agarose gels (TopVision-Thermo Scientific™), using 200 bp Ladder (Carl Roth®) and 1 kb Plus DNA ladder (Invitrogen™) as reference. Gels were stained with 1X SYBR™ Safe DNA Gel Stain (Invitrogen™) in 1X TAE buffer following a conventional protocol for electrophoresis. Agarose gels were scanned with a molecular imager PharosFX™ Plus (BioRad) system at 488 nm, provided with an external laser for high resolution and precise spectral assignment.

4.4. SSR Analysis

Six pepper genomic SSRs were selected [17] for local varieties screening and analyzed individually, as they have different melting temperatures (Table 1). PCR amplification was performed using a 20 µl reaction mixture containing Platinum™ II Hot-Start PCR Master Mix (2X) that contains Platinum™ II Taq Hot-Start DNA Polymerase premixed in an optimized PCR buffer with dNTPs and 1.5 mM MgCl2 in final reaction concentration (Invitrogen™) and 0.6 µmol/µl of each primer and 40 ng genomic DNA. The amplification was performed as follows: one cycle at 94°C for 2 min; 35 cycles with 94°C for 15 s; 49°C for 1 min; 68°C for 1 min; and a final extension of 68°C for 10 min. The PCR products were analyzed with PharosFX™ Plus (BioRad) system and the resulting molecular data were used to generate a cluster analysis.

4.5. Molecular Markers Data Analysis

Each ISSR and SSR band was classified as having polymorphic band present (“1”) or absent (“0”) for each sample and were typed into a computer file as a binary matrix like one for each molecular marker and treated as an independent locus. Only consistent bands were used in the analysis. The resulting molecular data were then analyzed by BIO-R software (Biodiversity analysis with R-Version 3.0), a set of R programs that do genetic diversity analysis of molecular data and calculate calculus per locus, calculus per genotype, expected heterozygosity, diversity among and within groups, Shannon index, number of effective allele, percent of polymorphic loci, Nei’s and modified Rogers’s distances, cluster analysis and multidimensional scaling 2D plot and 3D plot [54]. Furthermore, observed heterozygosity (Ho) and polymorphism information content (PIC) of markers were calculated. The genetic distances were calculated based on the markers analysis using the Nei’s distance for ISSR markers and modified Roger’s distance by Wright-Malecot coefficient for SSR markers analysis [55]. Percent of polymorphic gene was defined if the frequency of one of its alleles is less than or equal to 0.95 or 0.99 (Pj = q ≤ 0.95 o Pj = q ≤ 0.99) where Pj is the polymorphic rate and q is the frequency allele. This measure provides the criteria to determine whether a gene has variation [54]. Cluster analysis was done by Ward’s minimum variance method, where the distance between two clusters is the ANOVA sum of squares between the two clusters added up over all the variables. Ward’s method tends to join clusters with a small number of observations and is strongly based toward producing clusters with approximately the same number of observations. [54]. Observed heterozygosity (Ho) for markers, which is obtained by the ratio between the number of heterozygous individuals and the total number of individuals in the population was calculated with the formula H=1-∑(i=0)^kp_i^2 , were k is the number of alleles and pi the frequency of the ith allele [56,57]. Polymorphism Information Content (PIC) of markers, corresponds to its ability to detect the polymorphism among individuals of a population. For dominant markers (ISSR), the PIC value indicates the probability of finding that marker in two different states (present or absent) in two randomly selected individuals in a population. Its value ranges from 0 for monomorphic markers to 0.5 for markers present in 50% of individuals and absent in the remaining 50% [57]. In case of co-dominant markers, the PIC value was calculated in the same way as heterozygosity: PIC=1-∑(i=0)^kp_i^2 [58] where ‘k’ is the number of alleles and pi the frequency of the allele. For dominant markers the following equation was used: PIC = 2f (1-f) [59], in which ƒ is the frequency of present bands in the developing gel and 1 − ƒ represent frequency of absent bands [57,59].

4.6. NGS, Data Processing and Sequencing Analysis

Whole-genome sequencing (WGS) was performed via an Illumina platform (NGS) by Novogene Co., Ltd., Cambridge, UK. For library construction the genomic DNA was randomly sheared into short fragments, obtained fragments were end repaired, A-tailed and further ligated with Illumina adapter. The fragments with adapters were PCR amplified, size selected, and purified. The library was checked with Qubit and real-time PCR for quantification and bioanalyzer for size distribution detection. Quantified libraries were sequenced on Illumina platforms, according to effective library concentration and data amount required. Raw data were stored in FASTQ (.fq) format files [60], which contain sequencing reads and corresponding base quality. Sequencing quality distribution required a quality score Q30 above 80% and data results showed that Q30 was over 90% for all studied genotypes. The effective sequencing data was aligned with the reference sequence through BWA [61] software and the mapping rate and coverage were counted according to the alignment results. (Novogene Co., Ltd., Cambridge, UK). Reference genome was downloaded from NCBI (Pepper_Zunla_1_Ref_v1.0) and the mapping rates of samples reflect the similarity between each sample and the reference genome. For the current 2,935,884,163 bp reference genome, the mapping rate of each sample ranges from 98.42% to 98.62%, the average depths are between 10.81X and 9.78X, and 1X coverages range from 96.86% to 97.68%. This result is in the qualified normal range and may serve in the subsequent variation detection and related analyses (Novogene Co., Ltd., Cambridge, UK).
The SNPs and InDels variations were detected with SAMTOOLS software with the following parameter: 'mpileup -m 2 -F 0.002 -d 1000' [63] and followed by annotation using ANNOVAR software [64]. BreakDancer[65] software were used to detect insertion (INS), deletion (DEL), inversion (INV), intra-chromosomal translocation (ITX) and inter-chromosomal translocation (CTX) mutations, based on the reference genome mapping results and the detected insert size. Based on the reads depth of the reference genome, CNVnator[66] were used to detect CNVs of potential deletions and duplications with the following parameter '-call 100'. The detected CNVs were further annotated by ANNOVAR (Novogene Co., Ltd., Cambridge, UK).

4.7. Cloning and Sanger Sequencing

TOPO™ TA Cloning™ Kits for Sequencing was used for the insertion of amplified PCR products into a plasmid vector for sequencing analysis. ISSR and SSR-PCR products were analyzed by agarose gel electrophoresis then selected bands were gel extracted for cloned into the pCR™4-TOPO™ TA vector with specially designed sequencing primer sites. OneShot™TOP10 Chemically Competent E. coli cells (Invitrogen, Carlsbad, CA) were transformed individually with the recombinant pCR™4-TOPO™ TA plasmid vector that carried the PCR selected bands. Transformed E. coli cells were selected on LB agar plates containing ampicillin (100 μg/ml). Resulting colonies were randomly picked and cultured overnight in LB medium containing 100 μg/ml ampicillin. The presence of the inserted fragment within the vector was detected by colony PCR, then the plasmids were isolated from positive colonies using a miniprep procedure (PureLink™-Quick Plasmid Miniprep Kit, Invitrogen). The plasmids with the inserted PCR fragments were then Sanger sequenced by MACROGEN Europe using the sequencing primer sites (M13F/R). The nucleotide sequences were compared with the database sequences using the NCBI-BLAST program of the National Center for Biotechnology Information (USA gov.)

5. Conclusions

Common genetic variation is a fundamental aspect of genetic diversity within populations and essential for the adaptability of populations to changing environments. Genetic variations provide the raw material for natural selection allowing population to evolve over time. The genome sequences, annotation and alignments provided in this study offer essential resources for genetic and genomic research as well as for future breeding efforts within this important plant family.
By recognizing these differences breeders can overcome the challenges associated with interspecific crosses and successfully enhance desirable agronomic traits. The genome-wide identification of evolutionarily conserved regions, particularly in non-coding genomic regions, will enhance the discovery and characterization of functional and regulatory elements. Additionally, this information will facilitate the identification of candidate genes associated with important agronomic traits.

Supplementary Materials

The following supporting information can be downloaded at the website of this paper posted on Preprints.org. Figure S1: SSR profiles detected with 3 selected primers in C. annuum; Table S2: Calculus per genotype for each locus; Table S3: Modified Rogers distances with SSR markers; Figure S4: ISSR profiles detected with 5 selected primers in C. annuum.; Table S5: include the results of ISSR (A) and SSR (B) markers from calculus per locus analysis; Table S6: Nei distances with ISSR markers; Table S7: Statistics of InDELs detection and annotation based on WGS for all studied genotypes; Table S8: Statistics of SVs detection and annotation based on WGS for all studied genotypes; Table S9: Statistics of CNV detection and annotation based on WGS for all studied genotypes; Figure S10: Multiple genomic alignment between the C. annuum reference genome, cloned fragment (LTR) and BAM files of Capsicum annuum local genotypes sequences from chromosome 12; Figure S11: Multiple genomic alignment of C. annuum reference genome, SSR-PCR 220 bp cloned fragment (PR-10) and BAM files of Capsicum annuum local genotypes sequences from chromosome 3; Figure S12: A visual representation of seven Romanian pepper (C. annuum L.) varieties; Figure S13: A visual representation of WGS data with Circos plots, SNPs and InDels density per chromosomes for all studied genotypes.

Author Contributions

Conceptualization, A.A.U.; methodology, A.A.U. and M.I.; software, A.A.U.; validation, A.A.U., M.I. and L.B.; formal analysis, A.A.U.; investigation, A.A.U. and M.I; resources, A.A.U.; data curation, A.A.U. and M.I.; writing—original draft preparation, A.A.U.; writing—review and editing, A.A.U., M.I., L.B.; visualization, L.B.; supervision, L.B.; project administration, A.A.U. and L.B.; funding acquisition, A.A.U. and L.B. All authors have read and agreed to the published version of the manuscript.

Funding

This research was funded by the Romanian Ministry of Agriculture and Rural Devel-opment (MADR), under the Agricultural Research and Development Program 2019-2022, ADER 7.2.6 project.

Acknowledgments

The authors acknowledge the support provided by Vegetable Research and Development Station (VRDS, Buzău, Romania).

Conflicts of Interest

The authors declare no conflict of interest. The funders had no role in the design of the study; in the collection, analyses, or interpretation of data; in the writing of the manuscript, or in the decision to publish the results.

References

  1. Paran, I., & van der Knaap, E. Genetic and molecular regulation of fruit and plant domestication traits in tomato and pepper. Journal of Experimental Botany, 2007; 58(14), 3841–3852. [CrossRef]
  2. Van Zonneveld, M.; Ramirez, M.; Williams, D. E.; Petz, M.; Meckelmann, S.; Avila, T.; Bejarano, C.; Ríos, L.; Peña, K.; Jäger, M.; Libreros, D.; Amaya, K.; Scheldeman, X. Screening genetic resources of Capsicum peppers in their primary center of diversity in Bolivia and Peru. PloS one, 2015; Volume 10(9), e0134663. [CrossRef]
  3. Barcanu-Tudor, E.; Drăghici, E. M. & Vînătoru, C. New Variety of Sweet Pepper (Capsicum annuum var. Grossum) Obtained at VRDS Buzău. Bulletin UASVM Horticulture, 2018; Volume 75(1). [CrossRef]
  4. Olatunji, T. L., & Afolayan, A. J. Evaluation of genetic relationship among varieties of Capsicum annuum L. and Capsicum frutescens L. in West Africa using ISSR markers. Heliyon, 2019; Volume 5(5), e01700. [CrossRef]
  5. Lam, H. M.; Xu, X.; Liu, X.; Chen, W.; Yang, G.; Wong, F. L.; Li, M.W.; He, W.; Qin, N.; Wang, B.; Li, J. & Zhang, G. Resequencing of 31 wild and cultivated soybean genomes identifies patterns of genetic diversity and selection. Nat. Genet., 2010; Volume 42(12), pp. 1053-1059. [CrossRef]
  6. Solomon, A. M.; Han, K.; Lee, J. H.; Lee, H. Y.; Jang, S. & Kang, B. C. Genetic diversity and population structure of Ethiopian Capsicum germplasms. PloS one, 2019; Volume 14(5), e0216886. [CrossRef]
  7. Thul, S. T.; Darokar, M. P.; Shasany, A. K. & Khanuja, S. P. Molecular profiling for genetic variability in Capsicum species based on ISSR and RAPD markers. Mol. Biotech., 2012; Volume 51(2), pp. 137-147. [CrossRef]
  8. Portis, E.; Nagy, I.; Sasvári, Z.; Stágel, A.; Barchi, L. & Lanteri, S. The design of Capsicum spp. SSR assays via analysis of in silico DNA sequence, and their potential utility for genetic mapping. Plant Sci., 2007; Volume 172(3), pp. 640-648. [CrossRef]
  9. Rai, M. K.; Phulwaria, M. & Shekhawat, N. S. Transferability of simple sequence repeat (SSR) markers developed in guava (Psidium guajava L.) to four Myrtaceae species. Mol. Biol. Rep., 2013; Volume 40(8), pp. 5067-5071. [CrossRef]
  10. Tsaballa, A.; Ganopoulos, I.; Timplalexi, A.; Aliki, X.; Bosmali, I.; Irini, N. O.; Tsaftaris A. & Madesis, P. Molecular characteri-zation of Greek pepper (Capsicum annuum L) landraces with neutral (ISSR) and gene-based (SCoT and EST-SSR) molecular markers. Biochem. Syst. Ecol., 2015; Volume 59, pp. 256-263. [CrossRef]
  11. Ince, A. G.; Karaca, M. & Turgut, K. Development of new set of EST-SSR primer pairs for celery (Apium graveolens L.). Planta Med., 2010; Volume 76(12), P036. [CrossRef]
  12. Zhao, Y., Gui, L., Hou, C., Zhang, D., & Sun, S. GwasWA: A GWAS one-stop analysis platform from WGS data to variant effect assessment. Computers in Biology and Medicine, 2024; 169, 107820. [CrossRef]
  13. Choudhury, A., Ramsay, M., Hazelhurst, S., Aron, S., Bardien, S., Botha, G.,…& Pepper, M. S. Whole-genome sequencing for an enhanced understanding of genetic variation among South Africans. Nature communications, 2017; 8(1), 2062. [CrossRef]
  14. Ou, L., Li, D., Lv, J., Chen, W., Zhang, Z., Li, X., ... & Zou, X. Pan-genome of cultivated pepper (Capsicum) and its use in gene presence–absence variation analyses. New Phytologist, 2018; 220(2), 360-363. [CrossRef]
  15. Park, M., & Choi, D. The structure of pepper genome. Genetics, Genomics and Breeding of Peppers and Eggplants, 2013; 122-126. [CrossRef]
  16. The official catalogue of cultivated plant varieties in Romania for 2020 (ISTIS). https://istis.ro/image/data/download/catalog-oficial/CATALOG%202020.pdf.
  17. Lee JM, Nahm SH, Kim YM, Kim BD. Characterization and molecular genetic mapping of microsatellite loci in pepper. Theor. Appl Genet. 2004; 108 (4):619-27. [CrossRef]
  18. Ibarra-Torres, P.; Valadez-Moctezuma, E.; Pérez-Grajales, M.; Rodríguez-Campos, J. & Jaramillo-Flores, M. E. Inter-and intra-specific differentiation of Capsicum annuum and Capsicum pubescens using ISSR and SSR markers. Sci. Hortic., 2015; Volume 181, pp. 137-146. [CrossRef]
  19. Sbîrciog, G.; Buzatu, A.; Mândru, I. & Scurtu, I. Achievements in pepper breeding at Research Development Institute for Veg-etable and Flower Growing-Vidra. Curr.Trend. Nat. Sci., 2016; Volume 5(10), pp. 33-37.
  20. Drăghici, M. C.; Cristea G. M.; Popa E. E.; Miteluț C. A.; Popescu A. P.; Tylewicz U.; Rosa D. M.; Popa E. M. Research on blanching pretreatment and freezing technology effect on selected vegetables. AgroLife Sci. J., 2023; 12(2), 69–76. [CrossRef]
  21. Agapie, O. L.; Florin, S.; Costel, V.; Bianca, T.; Elena, B.; Geanina, N. & Ion, G. Description of valuable genotypes from germplasm collection of hot peppers set by directions of use. Bulletin UASVM Horticulture, 2020; Volume 77(2), pp. 117-121.
  22. González M. X.R.; Vicente O. Agrobiodiversity: conservation, threats, challenges, and strategies for the 21st century. AgroLife Sci. J., 2023; 12(1), 174–185. [CrossRef]
  23. Agapie O.L., Barcanu E. A Brief Description of Cultivated Chili Peppers. Sci. Papers. Series B, Horticulture, 2024; Vol. LXVIII, Issue 1, Print ISSN 2285-5653, 375-380.
  24. Iordăchescu, M.; Udriște, A. A.; Popa, V. & Bădulescu, L. Seed germination survey of Romanian tomato and pepper varieties. Res. J. Agric. Sci., 2020; Volume 52(2).
  25. Vintilă, M. & Niculescu, F. A. Technical aspects concerning the preservation of peppers in different storage conditions. Sci. Papers Ser. B Hortic., 2015; Volume 59, pp. 281-284.
  26. Hoble, A.; Dirja, M.; Luca, E.; Luca, L. & Salagean, T. Technology Elements for Irrigated Pepper (Capsicum annuum L.) growth in Field Cultivation Conditions. Bulletin UASVM Horticulture, 2010; Volume 67(2). [CrossRef]
  27. Scaeteanu V.G.; Săndulescu E.B.; Alistar C.F.; Croitoru C.M.; Madjar R.A.; Alistar A.; Gîlea G.C.; Stavrescu M. A short note on water quality and some biodiversity components in Gurban valley, Giurgiu County. AgroLife Sci.J., 2023; 12(2), 167–180. [CrossRef]
  28. Dimitrova K.; Kartalska Y.; Panayotov N. Effect of application of biostimulant Protifert LN 6.5 on the epiphytic and rhizosphere bacteria of pepper seedlings. Sci. Papers. Series B, Horticulture, 2024; Vol. LXVIII, Issue 1, Print ISSN 2285-5653, 438-443.
  29. Stoica V.; Hoza D. Research on the influence of organic fertilizers on the agrochemical indicators of the soil. Sci. Papers. Series B, Horticulture, 2024; Vol. LXVIII, Issue 1, Print ISSN 2285-5653, 188-193.
  30. Uleanu, F. Results on the effect of different types of Romanian native peat bio composites pots on seedling growth. Curr.Trend. Nat. Sci., 2013; Volume 2(3), pp. 92-95.
  31. Iordăchescu, M.; Udriște, A. A.; Jerca, O.; Bădulescu, L. Seedling Emergence Comparison of Several Romanian Tomato and Pepper Varieties. Bulletin of University of Agricultural Sciences and Veterinary Medicine Cluj-Napoca. Horticulture, 2021; Volume 78(1):76. [CrossRef]
  32. Finnegan, D. J. Retrotransposons. Current Biology, 2012; 22(11), R432-R437. [CrossRef]
  33. de Assis, R., Baba, V. Y., Cintra, L. A., Gonçalves, L. S. A., Rodrigues, R., & Vanzela, A. L. L. Genome relationships and LTR-retrotransposon diversity in three cultivated Capsicum L.(Solanaceae) species. BMC genomics, 2020; 21, 1-14. [CrossRef]
  34. Park, M., & Choi, D. The structure of pepper genome. Genetics, Genomics and Breeding of Peppers and Eggplants, 2013; 122-126. [CrossRef]
  35. Park, M., Park, J., Kim, S., Kwon, J.-K., Park, H. M., Bae, I. H., Yang, T.-J., Lee, Y.-H., Kang, B.-C., & Choi, D. Evolution of the large genome in Capsicum annuum occurred through accumulation of single-type long terminal repeat retrotransposons and their derivatives. The Plant Journal, 2012; 69(6), 1018–1029. [CrossRef]
  36. Wang, Y., Tang, X., Cheng, Z., Mueller, L., Giovannoni, J., & Tanksley, S. D. Euchromatin and Pericentromeric Heterochromatin: Comparative Composition in the Tomato Genome. Genetics, 2006; 172(4), 2529–2540. [CrossRef]
  37. Meyers, B. C., Tingey, S. V., & Morgante, M. Abundance, Distribution, and Transcriptional Activity of Repetitive Elements in the Maize Genome. Genome Research, 2001; 11(10), 1660–1676. [CrossRef]
  38. Galindo-González, L., Mhiri, C., Deyholos, M. K., & Grandbastien, M.-A. LTR-retrotransposons in plants: Engines of evolution. Gene, 2017; 626, 14–25. [CrossRef]
  39. Islam, M. M., El-Sappah, A. H., Ali, H. M., Zandi, P., Huang, Q., Soaud, S. A., ... & Liang, Y. Pathogenesis-related proteins (PRs) countering environmental stress in plants: A review. South African Journal of Botany, 2023; 160, 414-427. [CrossRef]
  40. Ali, S., Ganai, B. A., Kamili, A. N., Bhat, A. A., Mir, Z. A., Bhat, J. A., ... & Grover, A. Pathogenesis-related proteins and peptides as promising tools for engineering plants with multiple stress tolerance. Microbiological research, 2018; 212, 29-37. [CrossRef]
  41. Anisimova, O. K., Shchennikova, A. V., Kochieva, E. Z., & Filyushin, M. A. Pathogenesis-related genes of PR1, PR2, PR4, and PR5 families are involved in the response to Fusarium infection in garlic (Allium sativum L.). International journal of molecular sciences, 2021; 22(13), 6688. [CrossRef]
  42. Dos Santos, C., & Franco, O. L. Pathogenesis-related proteins (PRs) with enzyme activity activating plant defense responses. Plants, 2023; 12(11), 2226. [CrossRef]
  43. Yang, J., Zhang, J., Du, H., Zhao, H., Li, H., Xu, Y., ... & Wen, C. The vegetable SNP database: an integrated resource for plant breeders and scientists. Genomics, 2022; 114(3), 110348. [CrossRef]
  44. Wang, S., Yang, X., Xu, M., Lin, X., Lin, T., Qi, J., ... & Huang, S. A rare SNP identified a TCP transcription factor essential for tendril development in cucumber. Molecular Plant, 2015; 8(12), 1795-1808. [CrossRef]
  45. Zhou, H., Liu, Q., Li, J., Jiang, D., Zhou, L., Wu, P., ... & Zhuang, C. Photoperiod-and thermo-sensitive genic male sterility in rice are caused by a point mutation in a novel noncoding RNA that produces a small RNA. Cell research, 2012; 22(4), 649-660. [CrossRef]
  46. Jia, J. I. A., Huan, W. A. N. G., Yang, X. M., Bo, C. H. E. N., Wei, R. Q., Cheng, Y. B., & Hai, N. I. A. N. Identification of the long InDels through whole genome resequencing to fine map of qIF05-1 controlling seed isoflavone content in soybean (Glycine max L. Merr.). Journal of Integrative Agriculture. 2023. [CrossRef]
  47. Fliege C E, Ward R A, Vogel P, Nguyen H, Quach T, Guo M, Viana J, Santos L B, Specht J E, Clemente T E, Hudson M E, Diers B W. Fine mapping and cloning of the major seed protein quantitative trait loci on soybean chromosome 20. Plant Journal, 2022; 110, 114-128. [CrossRef]
  48. Moghaddam, S. M., Song, Q., Mamidi, S., Schmutz, J., Lee, R., Cregan, P., Osorno, J. M., & McClean, P. E. Developing market class specific InDel markers from next generation sequence data in Phaseolus vulgaris L. Frontiers in Plant Science, 2014; 5, 185. [CrossRef]
  49. Guo, G., Zhang, G., Pan, B., Diao, W., Liu, J., Ge, W., Gao, C., Zhang, Y., Jiang, C., & Wang, S. Development and Application of InDel Markers for Capsicum spp. Based on Whole-Genome Re-Sequencing. Scientific Reports, 2019; 9(1), 3691. [CrossRef]
  50. Britten, R. J., Rowen, L., Williams, J., & Cameron, R. A. Majority of divergence between closely related DNA samples is due to indels. Proceedings of the National Academy of Sciences, 2003; 100(8), 4661–4665. [CrossRef]
  51. Delmore, K. E., Van Doren, B. M., Ullrich, K., Curk, T., van der Jeugd, H. P., & Liedvogel, M. Structural genomic variation and migratory behavior in a wild songbird. Evolution Letters, 2023; 7(6), 401-412. [CrossRef]
  52. Blue, Y. A., & Satake, A. Analyses of gene copy number variation in diverse epigenetic regulatory gene families across plants: Increased copy numbers of BRUSHY1/TONSOKU/MGOUN3 (BRU1/TSK/MGO3) and SILENCING DEFECTIVE 3 (SDE3) in long-lived trees. Plant Gene, 2022; 32, 100384. [CrossRef]
  53. Krzywinski, M., Schein, J., Birol, I., Connors, J., Gascoyne, R., Horsman, D., ... & Marra, M. A. Circos: an information aesthetic for comparative genomics. Genome research, 2009; 19(9), 1639-1645. [CrossRef]
  54. Pacheco, Á.; Alvarado, G.; Rodríguez, F.; Crossa, J.; Burgueño, J. BIO-R (Biodiversity analysis with R for Windows) Version 3.0, 2020; International Maize and Wheat Improvement Center.
  55. Laval, G.; San Cristobal, M. & Chevalet, C. Measuring genetic distances between breeds: use of some distances in various short term evolution models. Genet. Sel. Evol., 2002; Volume 34(4), pp. 1-27. [CrossRef]
  56. Nei, M. Molecular evolutionary genetics. Columbia University Press, 1987.
  57. Serrote, C. M. L.; Reiniger, L. R. S.; Silva, K. B.; dos Santos Rabaiolli, S. M. & Stefanel, C. M. Determining the Polymorphism Information Content of a molecular marker. Gene, 2020; Volume 726, 144175. [CrossRef]
  58. Botstein, D.; White, R. L.; Skolnick, M. & Davis, R. W. Construction of a genetic linkage map in man using restriction fragment length polymorphisms. Am. J. Hum. Genet., 1980; Volume 2(3), pp. 314.
  59. Roldàn-Ruiz, I.; Dendauw, J.; Van Bockstaele, E.; Depicker, A. & De Loose, M. AFLP markers reveal high polymorphic rates in ryegrasses (Lolium spp.). Molec. Breed., 2000; Volume 6(2), pp. 125-134. http://hdl.handle.net/1854/LU-133034.
  60. De Riek, J.; Calsyn, E.; Everaert, I.; Van Bockstaele, E. & De Loose, M. AFLP based alternatives for the assessment of distinct-ness, uniformity and stability of sugar beet varieties. Theor. Appl. Genet., 2001; Volume 103(8), pp. 1254-1265. [CrossRef]
  61. Cock, P.J.A., Fields, et al. The Sanger FASTQ file format for sequences with quality scores, and the Solexa/Illumina FASTQ variants. Nucleic Acids Research. 2010; 38(6):1767-1771. [CrossRef]
  62. Li H, Durbin R. Fast and accurate short read alignment with Burrows-Wheeler transform. Bioinformatics. 2009; 25(14):1754-1760. [CrossRef]
  63. Li H, Handsaker B, Wysoker A, et al. The Sequence Alignment/Map format and SAMtools. Bioinformatics. 2009; 25(16):2078-2079. [CrossRef]
  64. Wang K, Li M, Hakonarson H. ANNOVAR: functional annotation of genetic variants from high-throughput sequencing data. Nucleic Acids Research. 2010; 38(16):e164. [CrossRef]
  65. Chen, K, et al. BreakDancer: an algorithm for high-resolution mapping of genomic structural variation. Nature Methods. 2009; 6:677-681. [CrossRef]
  66. Abyzov A, Urban A E, Snyder M, et al. CNVnator: an approach to discover, genotype, and characterize typical and atypical CNVs from family and population genome sequencing. Genome research. 2011; 21(6):974-984. [CrossRef]
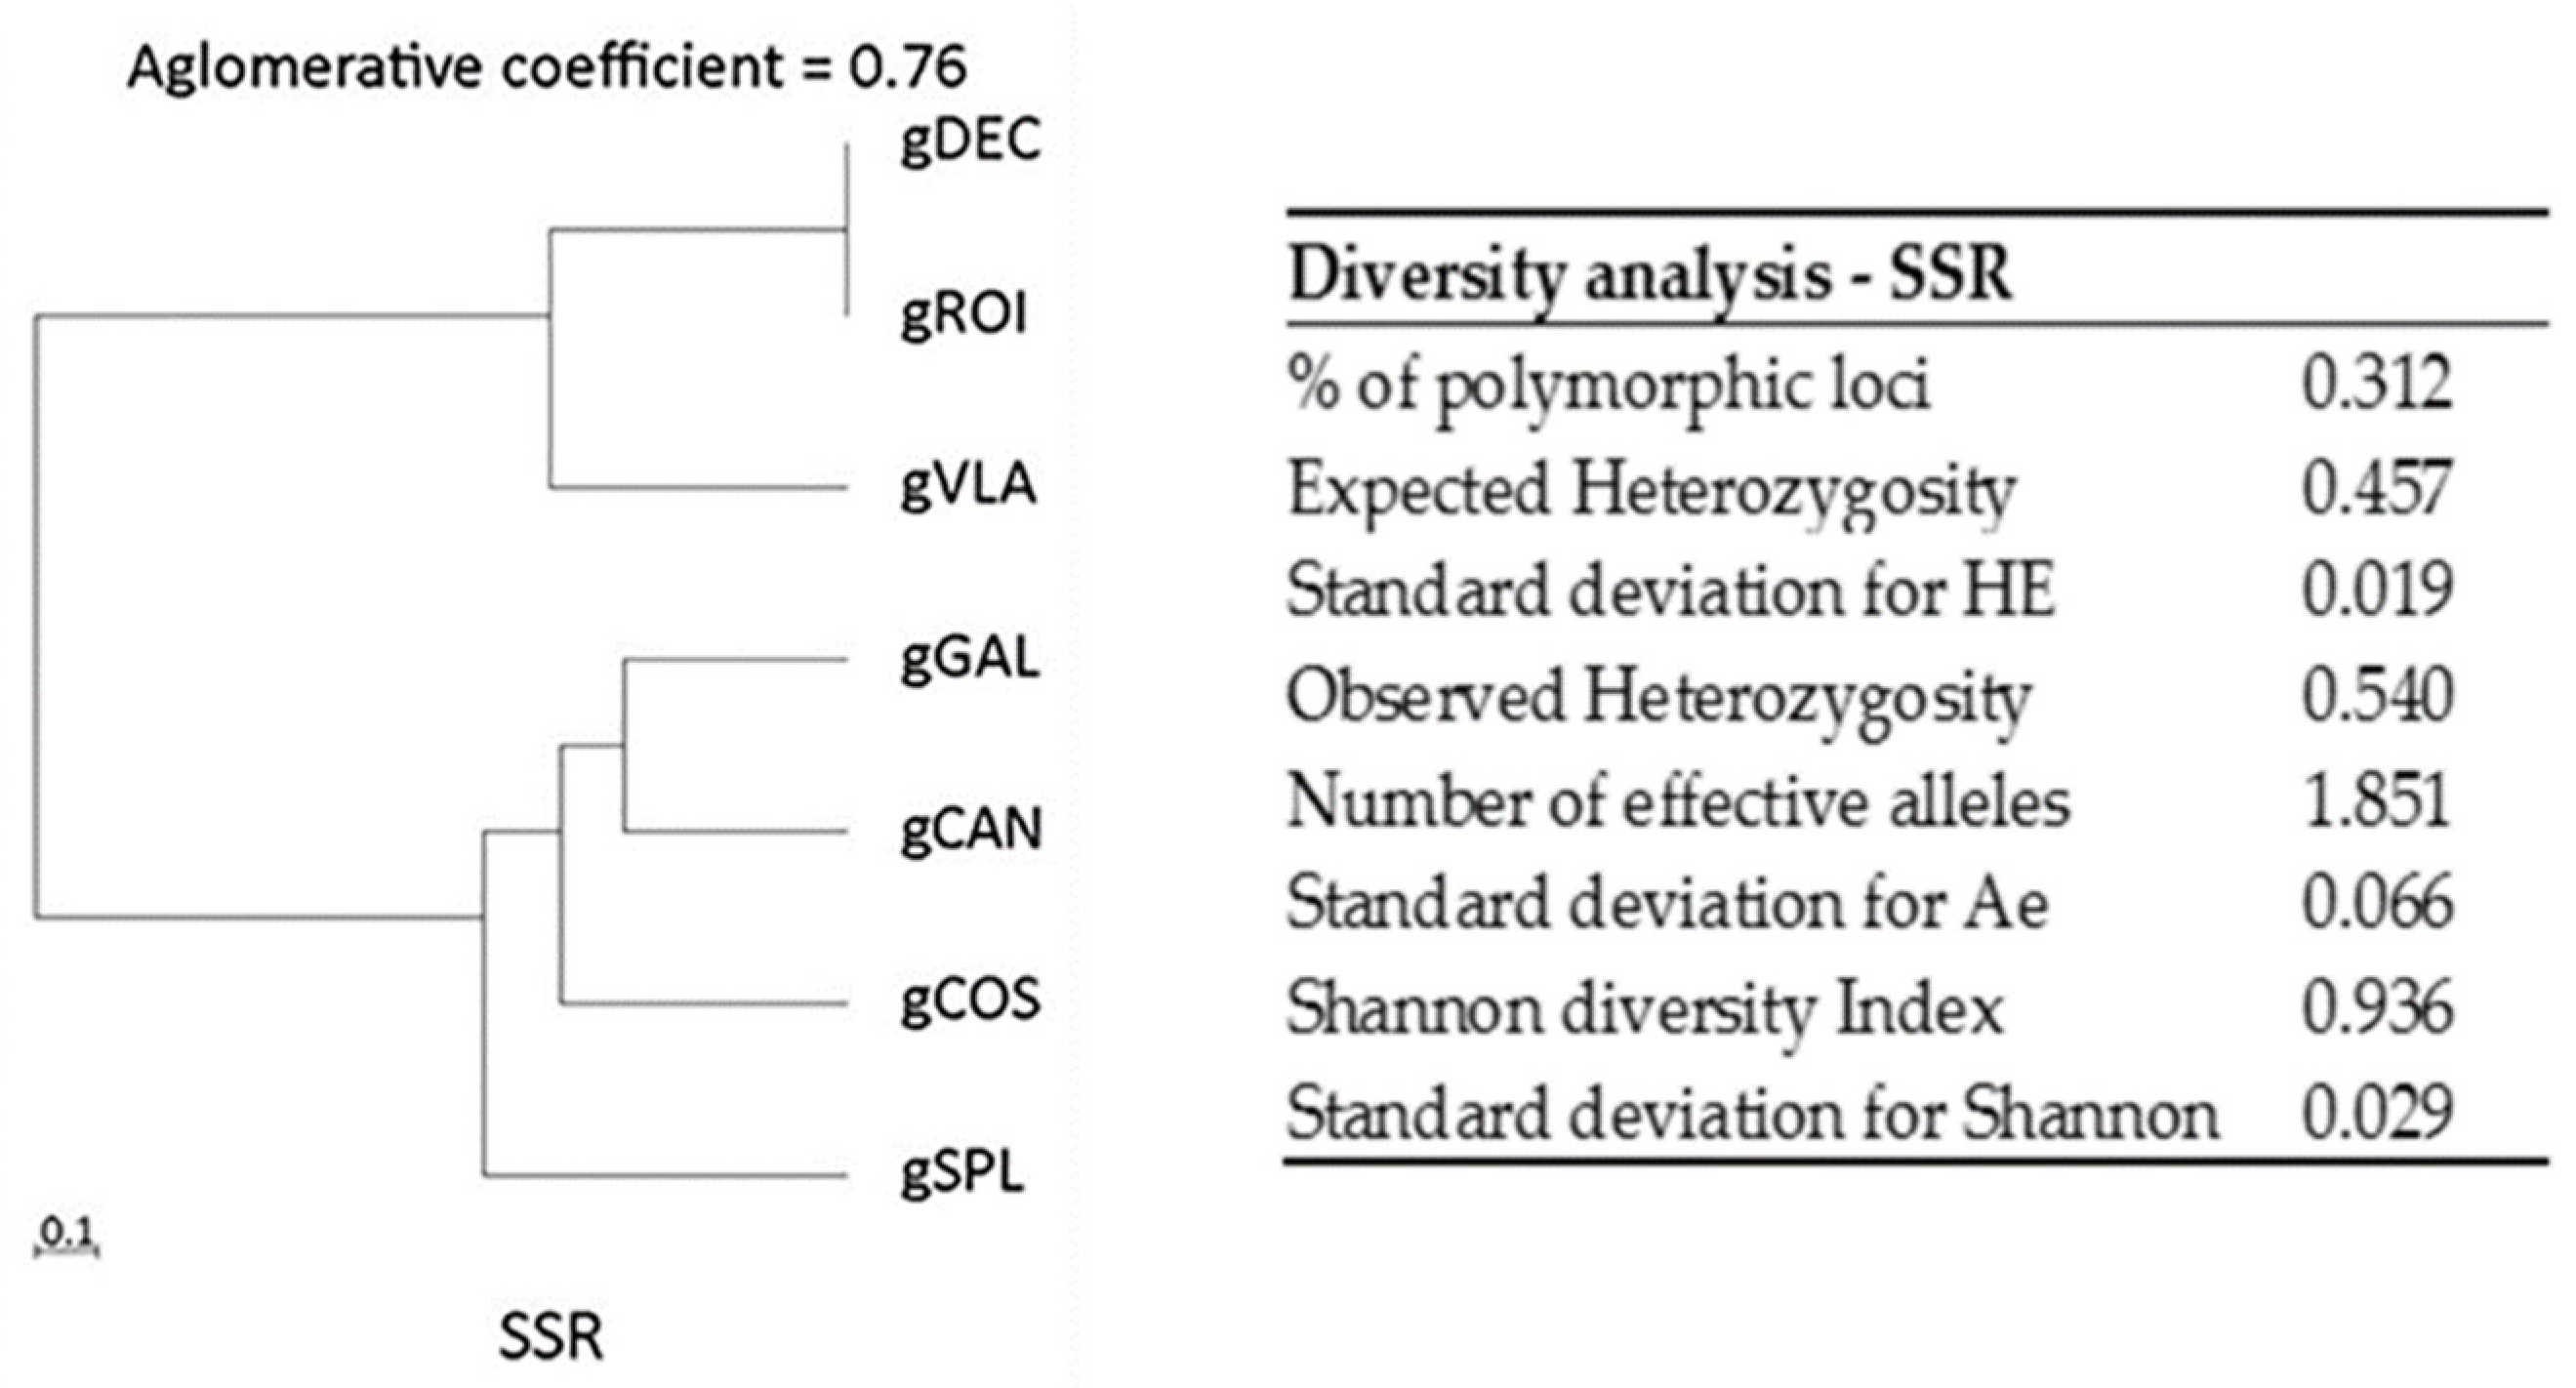
Figure 1. Dendrogram with agglomerative coefficients and diversity analysis for SSR markers.
Preprints 118150 g001
Figure 2. Dendrogram with agglomerative coefficients and diversity analysis for ISSR markers.
Preprints 118150 g002
Figure 3. Frequency and type of SNPs mutations for each genotype: the most common SNPs mutation type distribution was C:G>T:A and T:A>C:G. The pie chart shows the number of SNPs in different regions of the genome for genotype gSPL; in exonic region, gSPL genotype presented the highest number of synonymous and non-synonymous SNP mutations.
Preprints 118150 g003
Figure 4. SNPs density per chromosomes for genotype gSPL.
Preprints 118150 g004
Figure 5. The length distribution of InDels for all genotypes within the coding sequence.
Preprints 118150 g005
Figure 6. InDel density per chromosomes for genotype gCOS.
Preprints 118150 g006
Figure 7. The number of SVs in different regions of the genome for all genotypes. gGAL and gCOS presented the highest number the Insertions (INS). The lowest number of INS was observed in gVLA and gROI genotypes. The details of SV detection statistics are as follows: CTX (Inter-chromosomal translocations); ITX (Intra-chromosomal translocations); INS (Insersion); DEL (Deletion); INV (Inversion); Splicing; Intergenic; Upstream/Downstream; Intronic; Downstream; Exonic; Upstream.
Preprints 118150 g007
Figure 8. Variation type statistics distribution of CNVs in the genome.
Preprints 118150 g008
Figure 9. Multiple genomic alignment between the C. annuum reference genome Pepper Zunla 1 Ref_v1.0 unplaced genomic scaffold, the ISSR-PCR 1000 bp cloned fragment (LTR) UCD10Xv1.1 whole genome shotgun sequence ID: NC_061122.1 and all BAM files of Capsicum annuum local genotypes sequences from chromosome 12. On the right side the BLAST revealed SNPs mutations on cloned fragment for gSPL, gCAN and gROI genotypes on base position 41.494 and SNPs mutation on base position 41.809 for all seven genotypes. gDEC exhibits significant mutations on cloned fragment. On the right side is a close-up view of SNPs at specific positions.
Preprints 118150 g009
Figure 10. Multiple genomic alignment of C. annuum reference genome, SSR-PCR 220 bp cloned fragment (PR-10 protein) and chromosome 3 sequences for all seven genotypes revealed ts SNP mutations only on gCOS genotype. On the left side is presented graphical sequence view with a point mutation on base position 254.256.561 and another SNP on base position 254.256.599; on the right side, three nucleotide insertions as CTT type on 254,256,423 position for gCAN genotype and one nucleotide insertion as T type on 254,256,512 position for gCOS genotype.
Preprints 118150 g010
Figure 11. Multidimensional scaling analysis (MDS) for ISSR analysis based on Nei’s distance and SSR analysis based on modified Roger’s distance. CP1 and CP2 are the first and second principal coordinate matrices, respectively combination to related genotypes group: for ISSR analysis-gGAL, gCAN/ gROI, gCOS, gSPL and unrelated genotypes gDEC, gVLA are shown; for SSR analysis-gDEC,gGAL/ gROI,gCAN/ gSPL,gCOS and unrelated genotypes gVLA.
Preprints 118150 g011
Figure 12. Visualization of the structural variations on the whole genome for gCOS genotype according with Circos plot analysis. The 90-200 Mb region on chromosome 4 (NC_029980.1), shows large deletions and inversions as well as translocations that involve chromosomes 5 (NC_029981.1), 6 (NC_029982.1) and 7 (NC_029983.1).
Preprints 118150 g012
Table 1. Characteristics of SSR primers evaluated in Capsicum spp.
ID Locus Primer (forward/ reverse) Size (bp) Tm (ºC) Total alleles PIC value
SSRP3P4 AF244121 5'TACCTCCTCGCCAATCCTTCTG 3'/
5'TTGAAAGTTCTTTCCATGACAACC 3'
200-400 bp 45 3 0.63
SSRP5P6 HpmS 1-148 5'GGCGGAGAAGAACTAGACGATTAGC3'/
5'TCACCCAATCCACATAGACG 3'
150-250 bp 45 4 0.72
SSRP9P10 HpmS 1_1 5'TCAACCCAATATTAAGGTCACTTCC3'/
5'CCAGGCGGGGATTGTAGATG3'
260 pb 49 NA NA
SSRP11P12 HpmS 1_274 5'TCCCAGACCCCTCGTGATAG3'/
5'TCCTGCTCCTTCCACAACTG 3'
190-530 bp 47 4 0.71
SSRP19P20 HpmS 1_172 5'GGGTTTGCATGATCTAAGCATTTT3'/
5'CGCTGGAATGCATTGTCAAAGA3'
230-420 bp 48 3 0.66
Table 2. Characteristics of ISSR primers evaluated in C. annuum varieties.
ID Primer Tm (ºC) Total bands (TB) Range of the amplification product (bp) PIC value
P21 5’ACGACAGACAGACAGACA3’ 51 38 850-4000 bp 0.08
P22 5’ACACACACACACACACCTG3’ 50 28 500-2800 bp NA
P23 5'GCAGACAGACAGACAGACGC3' 50 68 500-4000 bp 0.28
P24 5'GAGAGAGAGAGAGAGACTC 3' 50 56 800-3800 bp 0.23
P25 5'GAGAGAGAGAGAGAGACTC3' 50 80 550-3100 bp 0.29
P26 5'CACACACACACACACAAGT 3' 51 27 1000-2500 bp 0.26
P27 5'GACAGACAGACAGACAGT3' 51 70 380-4000 bp 0.20
P28 5'TCCTCCTCCTCCTCCAGCT3' 50 34 350-2700 bp 0.29
Table 3. Statistics of SNPs detection and annotation based on WGS for all studied genotypes (Decebal/gDEC; Vladimir/gVLA; Galben Superior/gGAL; Splendens/gSPL; Cosmin/gCOS; Roial/gROI and Cantemir/gCAN). The details for SNP detection and annotation statistics are as follows: Upstream (SNPs located within 1 kb upstream); Exonic: SNPs located in exonic region (Stop gain, Stop loss, Synonymous, Non-Synonymous); Intronic; Splicing; Downstream; Intergenic; Transitions (ts); Transversions (tv); Heterozygous rate (Het. rate).
Genotype gDEC gVLA gGAL gSPL gCOS gROI gCAN
Upstream 98681 93968 97182 104198 100293 95159 98084
Exonic
Stop gain
645 644 635 720 664 657 634
Exonic
Stop loss
164 162 166 182 175 163 160
Exonic
Synonymous
17898 17757 17668 19851 18012 17321 18229
Exonic
Non-synonymous
29071 28736 29115 32146 29349 28540 29504
Intronic 255395 240657 249296 280766 262290 246344 260011
Splicing 307 286 308 353 303 295 319
Downstream 80621 77439 79503 86690 82171 77640 80567
Upstream/
Downstream
5010 4943 5126 5596 5365 4728 5058
Intergenic 6899284 6009182 6706315 7209789 7383834 6528591 6955410
Others 229351 213191 222529 244099 236949 214605 233623
ts 5051787 4442276 4923303 5313137 5408262 4796597 5099410
tv 2565834 2245868 2485560 2672644 2712300 2418530 2583426
ts/tv 1.969 1.978 1.981 1.988 1.994 1.983 1.974
Het. rate 0.162 0.636 0.126 0.764 0.13 0.116 0.121
Total 7617621 6688144 7408863 7985781 8120562 7215127 7682836
Disclaimer/Publisher’s Note: The statements, opinions and data contained in all publications are solely those of the individual author(s) and contributor(s) and not of MDPI and/or the editor(s). MDPI and/or the editor(s) disclaim responsibility for any injury to people or property resulting from any ideas, methods, instructions or products referred to in the content.
Copyright: This open access article is published under a Creative Commons CC BY 4.0 license, which permit the free download, distribution, and reuse, provided that the author and preprint are cited in any reuse.
Prerpints.org logo

Preprints.org is a free preprint server supported by MDPI in Basel, Switzerland.

Subscribe

© 2024 MDPI (Basel, Switzerland) unless otherwise stated