Preprint
Article

Transcriptomic Profiling Reveals Altered Expression of Genes Involved in Metabolic and Immune Processes in NDV-Infected Chicken Embryos

Altmetrics

Downloads

84

Views

82

Comments

0

A peer-reviewed article of this preprint also exists.

Submitted:

13 September 2024

Posted:

15 September 2024

You are already at the latest version

Alerts
Abstract
The objective of this study was to investigate the transcriptomic profiling of differentially ex-pressed genes between a commercial layer breed and an indigenous Indian breed. RNA was ex-tracted from NDV-infected and uninfected embryo lung tissue samples of Aseel, Kadaknath, and White Leghorn chickens. RNA-Seq was performed, and reads were aligned to the chicken refer-ence genome (Galgal7). A total of 594 genes were significantly differentially expressed, with 264 upregulated and 330 downregulated in infected embryos. Highly overexpressed genes in infect-ed conditions included C8A, FGG, PIT54, FETUB, APOC3, FGA, SPIA1, AvBD13, APOH, AMBP, TTR, PLA2G12B. Additionally, 29 novel transcripts and 20 lncRNAs were upregulated. White Leghorn embryos showed distinct expression patterns for CAV1 and GATA3, while Kadaknath healthy embryos had higher levels of CYTB, HBBA, ND4, ND4L, and ND5, indicating breed uniqueness. The analysis revealed significant gene involvement through Gene Ontology and KEGG pathways, highlighting alterations in gene expression related to immune function, me-tabolism, cell cycle, nucleic acid processes, and mitochondrial activity due to NDV infection. ALDOB, PRPS2, XDH, DCK2, and TK1 genes, which were involved in several metabolic path-ways, clearly displayed an altered expression pattern in the infected embryo. Additionally, ALB, TLR4, TLR2, TLR21, IL1R2, IL22RA2, HSP90AA, HSPB9(p60), and HSPB8 were significantly up-regulated in infected lung samples, while CXCR4, CXCL14, GATA3, IL17REL, and IL22RA1 were downregulated. Notably, higher expression of HSPs in Kadaknath suggests heat tolerance. This research provides insights into the genetic differences between commercial and local breeds and reveals the impact of NDV infection on metabolic processes, potentially identifying candidate genes for breed improvement.
Keywords: 
Subject: Biology and Life Sciences  -   Animal Science, Veterinary Science and Zoology

1. Introduction

As the population continues to grow, there is a significant need for a more efficient and secure food production system. Globally, poultry production plays a crucial role in enhancing nutrition and food security by providing affordable and sustainable animal protein source and it provides an addition income for the rural household community [1]. India, ranked as the third-largest poultry egg producer globally (FAO), has experienced significant changes in poultry disease patterns due to a considerable increase in poultry population and shifts in husbandry practices. These changes have led to both direct and indirect economic losses [2,3]. The rapidly growing poultry industry faces numerous challenges, particularly in managing disease problems. Worldwide, the poultry sector incurs substantial economic losses annually due to diseases [3]. Among these, Newcastle disease is particularly impactful, causing significant production losses and high mortality rates [4,5]. This disease poses a major threat to the poultry industry, leading to considerable economic setbacks for farmers [2,3].
Newcastle disease (ND) is a highly infectious viral infection that affects poultry and, resulting in substantial financial losses for the poultry industry globally. ND has the ability to quickly spread throughout avian communities and destroying whole flocks of chickens [6]. Although indigenous breeds have greater tolerance to various diseases compared to commercial chicken breeds, native backyard chicken breeds such as Aseel and Kadaknath are still affected [7,8,9]. Modern high-efficiency growth techniques in commercial poultry farming have put selection pressure on immunological competence. This has resulted in intensive breeding practices that produce lines of chickens more susceptible to common infections [10]. Now, the best ways to manage ND infection are vaccination and biosafety measures. A comprehensive understanding of the molecular mechanisms by which the host immune system responds to ND infection is essential for developing new prevention and treatment strategies for ND [11]. Additionally, from the perspective of developmental perspective, the embryonic stage of the immune system and its response regulated by developmental genes are crucial for evolution [12]. Hence, understanding early embryonic development necessitates examining the sequential regulation of genes that govern basic cellular programming and signaling pathways, going beyond mere morphological observations.

2. Materials and Methods

2.1. Ethics Statement

The experiment was conducted with the approval of the Institutional Bio-safety Committee (IBSC) (Approval Lr. No. 1764/VCRI-NKL/IBSC/2022 dated 11.05.2022 of the Dean, VCRI, Namakkal) and Institutional Animal Ethical committee (IAEC) (Project proposal No. 09/VCRI-NKL/2023 dated 08.09.2023) of TANUVAS-Veterinary College and Research Institute, Namakkal, Tamil Nadu, India.

2.2. Experimental Birds and Sample Collection

Eighteen (6 Aseel, 6 Kadaknath and 6 Commercial Layer White Leghorn) SPF chicken embryos, 19 days old, were acquired from the Department of Poultry Science at VCRI in Namakkal and utilized in the viral challenge study. With the exception of a control group consisting of 3 Aseel, 3 Kadaknath and 3 White Leghorn the remaining 3 Aseel, 3 Kadaknath and 3 White Leghorn embryos were exposed to a lentogenic-B1 strain of live Newcastle disease virus (NDV) at a dosage of 50 percent Embryo Infective Dose (106 EID50). Subsequently, these embryos were maintained in an egg incubator at a temperature of 38 °C and a relative humidity range of 65–75 percent until tissue harvesting at various hours after infection.

2.3. RNA Isolation and Quality Check

Lung tissues was collected from NDV infected and control Aseel and Kadaknath chicken embryos at 24 hours post infection. Tissues were immediately stored in RNAlater® (ThermoFisher) at -80 oC until RNA isolation. A total RNA was extracted by Trizole method using RNAiso Plus, M/s Takara, (Cat. No: 9109). The amount of extracted RNA was measured using a Nanodropper, and RNA samples were combined at an equimolar ratio to form one pool for each breed of treated (three samples from each breed combined), as well as a pool for each breed of control samples. In order to verify the quality, a 2% electrophoresis gel (Figure 1) was used in the laboratory to view the integrity of the extracted RNA. Samples were then shipped to be sequenced after being sealed on dry ice. Clevergene Biocorp Pvt. Ltd., Bengaluru 560043, India, performed the RNA sequencing. RNA was measured using the QubitTM RNA HS Assay Kit in accordance with the manufacturer’s instructions on the Qubit 3.0 Fluorometer (Thermofisher Scientific). Using RNA screen tape, the 4150 TapeStation system (Agilent) was used to evaluate the integrity of RNA. RNA with a RIN greater than 7 was deemed intact and proceeded to further processing for the development of an RNA library. The estimated library fragment size comprises a wide peak with an average size of 350 bp and a range of 200–700 bp. The sample passed the quality check with more than 3ng/µl and more than 6 nM molarity concentration.

2.4. Sequencing and Data Analysis

The sequence data was generated using Illumina NovaSeq 6000 sequencer and with the Adapter Sequence, P7 adapter read1 – AGATCGGAAGAGCACACGTCTGAACTCCAGTCA, and P5 adapter read2 – AGATCGGAAGAGCGTCGTGTAGGGAAAGAGTGT. The generated sequence data were analyzed and data analysis workflow was given in Figure 1. Sequence reads were processed to remove adapter sequences and low-quality bases using fastp 0.20 [13]. Clean data for downstream analysis requires quality assurance and FASTQ file preparation [14].
The QC passed reads were mapped onto indexed bGalGal1.mat.broiler.GRCg7b_genome using STAR aligner [15]. The distribution of genes, exons, and transcripts per chromosome and genes was examined using the Chi-square test, and with p<0.05 were deemed significant. Gene level expression values were obtained as read counts using feature-counts [16]. Principal Component Analysis (PCA) is a powerful statistical technique used to analyze and visualize the patterns of gene expression data. For differential expression analysis the biological replicates were grouped as control and infected. Differential expression analysis was carried out using the DESeq2 [17] package after normalizing the data using the relative log expression normalization method. Genes with absolute log2 fold change ≥ 1 and adjusted p-value ≤ 0.05 were considered significant.

2.5. Functional Analysis

Further the set of transcripts identified from the sequence data were analyzed for functional significance, GO and KEGG, gene cluster comparison were done by bioinformatic tools with the R package, such as Cluster Profiler, GOplot, and Pathview, were utilized. [18,19,20]. In short, within the examined gene set, we looked at whether functional terms or pathways were statistically significant and linked to at least two genes. Benjamini-Hochberg employed a significance threshold of p-values < 0.05 to modify the calculated p-values. Gene ontology and Enrichment analysis was done by using the online tool ShinyGO 0.80 (http://bioinformatics.sdstate.edu/go/) [21]. On line free SRplot platform was used for graphing and data visualization [22].

2.6. Protein-Protein Interaction (PPI)

Protein-protein interactions (PPIs) were contracted using STRING (Search Tool for the Retrieval of Interacting Genes/Proteins) version 12.0 online bioinformatics tool (https://version-12-0.string-db.org/cgi/) [23]. In order to ascertain the functional relationship between the genes related to metabolism, cell cycle, immunity, and mitochondria, DEGs (with corrected p-values of ≤ 0.05) annotated for the KEGG pathway were utilized to establish a network of close interactions among this gene set based on databases of predicted and experimental protein interactions [23]. We eliminated PPIs based on high confidence ratings of less than 0.7, and disconnected nodes were hidden. In order to identify a certain number of clusters based on their centroids, k-mean clustering was also performed.

2.7. Quantitative Real-Time PCR (RT-qPCR) Validation

To validate the RNA-Seq results by RT-qPCR, five differentially expressed were randomly selected and primers were designed using Primer-Blast. Three biological replicates were conducted from each breed. Total RNA was extracted from the lungs of chickens using RNAiso Plus, M/s Takara, (Cat. No: 9109). according to the manufacturers’ protocols and the concentration and purity of RNAs were measured using NanoDrop. The cDNA was synthesized from total RNA by using an iScript cDNA Synthesis Kit (Bio-Rad, Hercules, CA, USA, Cat # 1708891) according to the manufacturer’s protocol, which follows a method of Reverse Transcription (RT) with a random primer. The details of all the designed primers are provided in Table 1. The relative expression of specific gene mRNA was quantified as per the method [24] by a real-time thermal cycler (Roche LightCycler® 96). Bio-Rad Univer SYBR green Master mix (Cat.No: 1725271). RT-qPCR was performed with the following thermo cycling conditions: an initial 1 cycle at 95 °C for 10 min, 40 cycles at 95 °C for 15 s, 60 °C for 20 s and 72 °C for 20 s, followed by a 72 °C elongation for 60 s. β-Actin was used as house-keeping genes to normalize the expressions of mRNA. The alteration in mRNA levels of each gene in NDV-infected embryos was quantified as a fold change using the 2−ΔΔCt method [25], in comparison to the non-infected control.

3. Results

3.1. RNA-Seq Data Analysis

The average number of reads obtained from lung RNA sequencing was 25 million, and the Q20 and Q90 rates showed average matching call accuracy of 95% and 90%, respectively. In average twenty million of the 25 million readings made it passed quality control. An analysis of the sequence revealed that its average GC content was 54%. The summary of data quantity and quality in Table 2 and Table 3. On average 99.84% of the reads aligned onto the reference genome (GRCg7b). According to read alignment statistics, on average 88, 2, and 10 per cent of the sequences were identified as unique mapped, multi-mapped, and unmapped sequences, respectively. There were 30108 genes found in total, of which 17410–20332 genes were expressed in all samples (Table 4).

3.2. Principal Component Analysis (PCA)

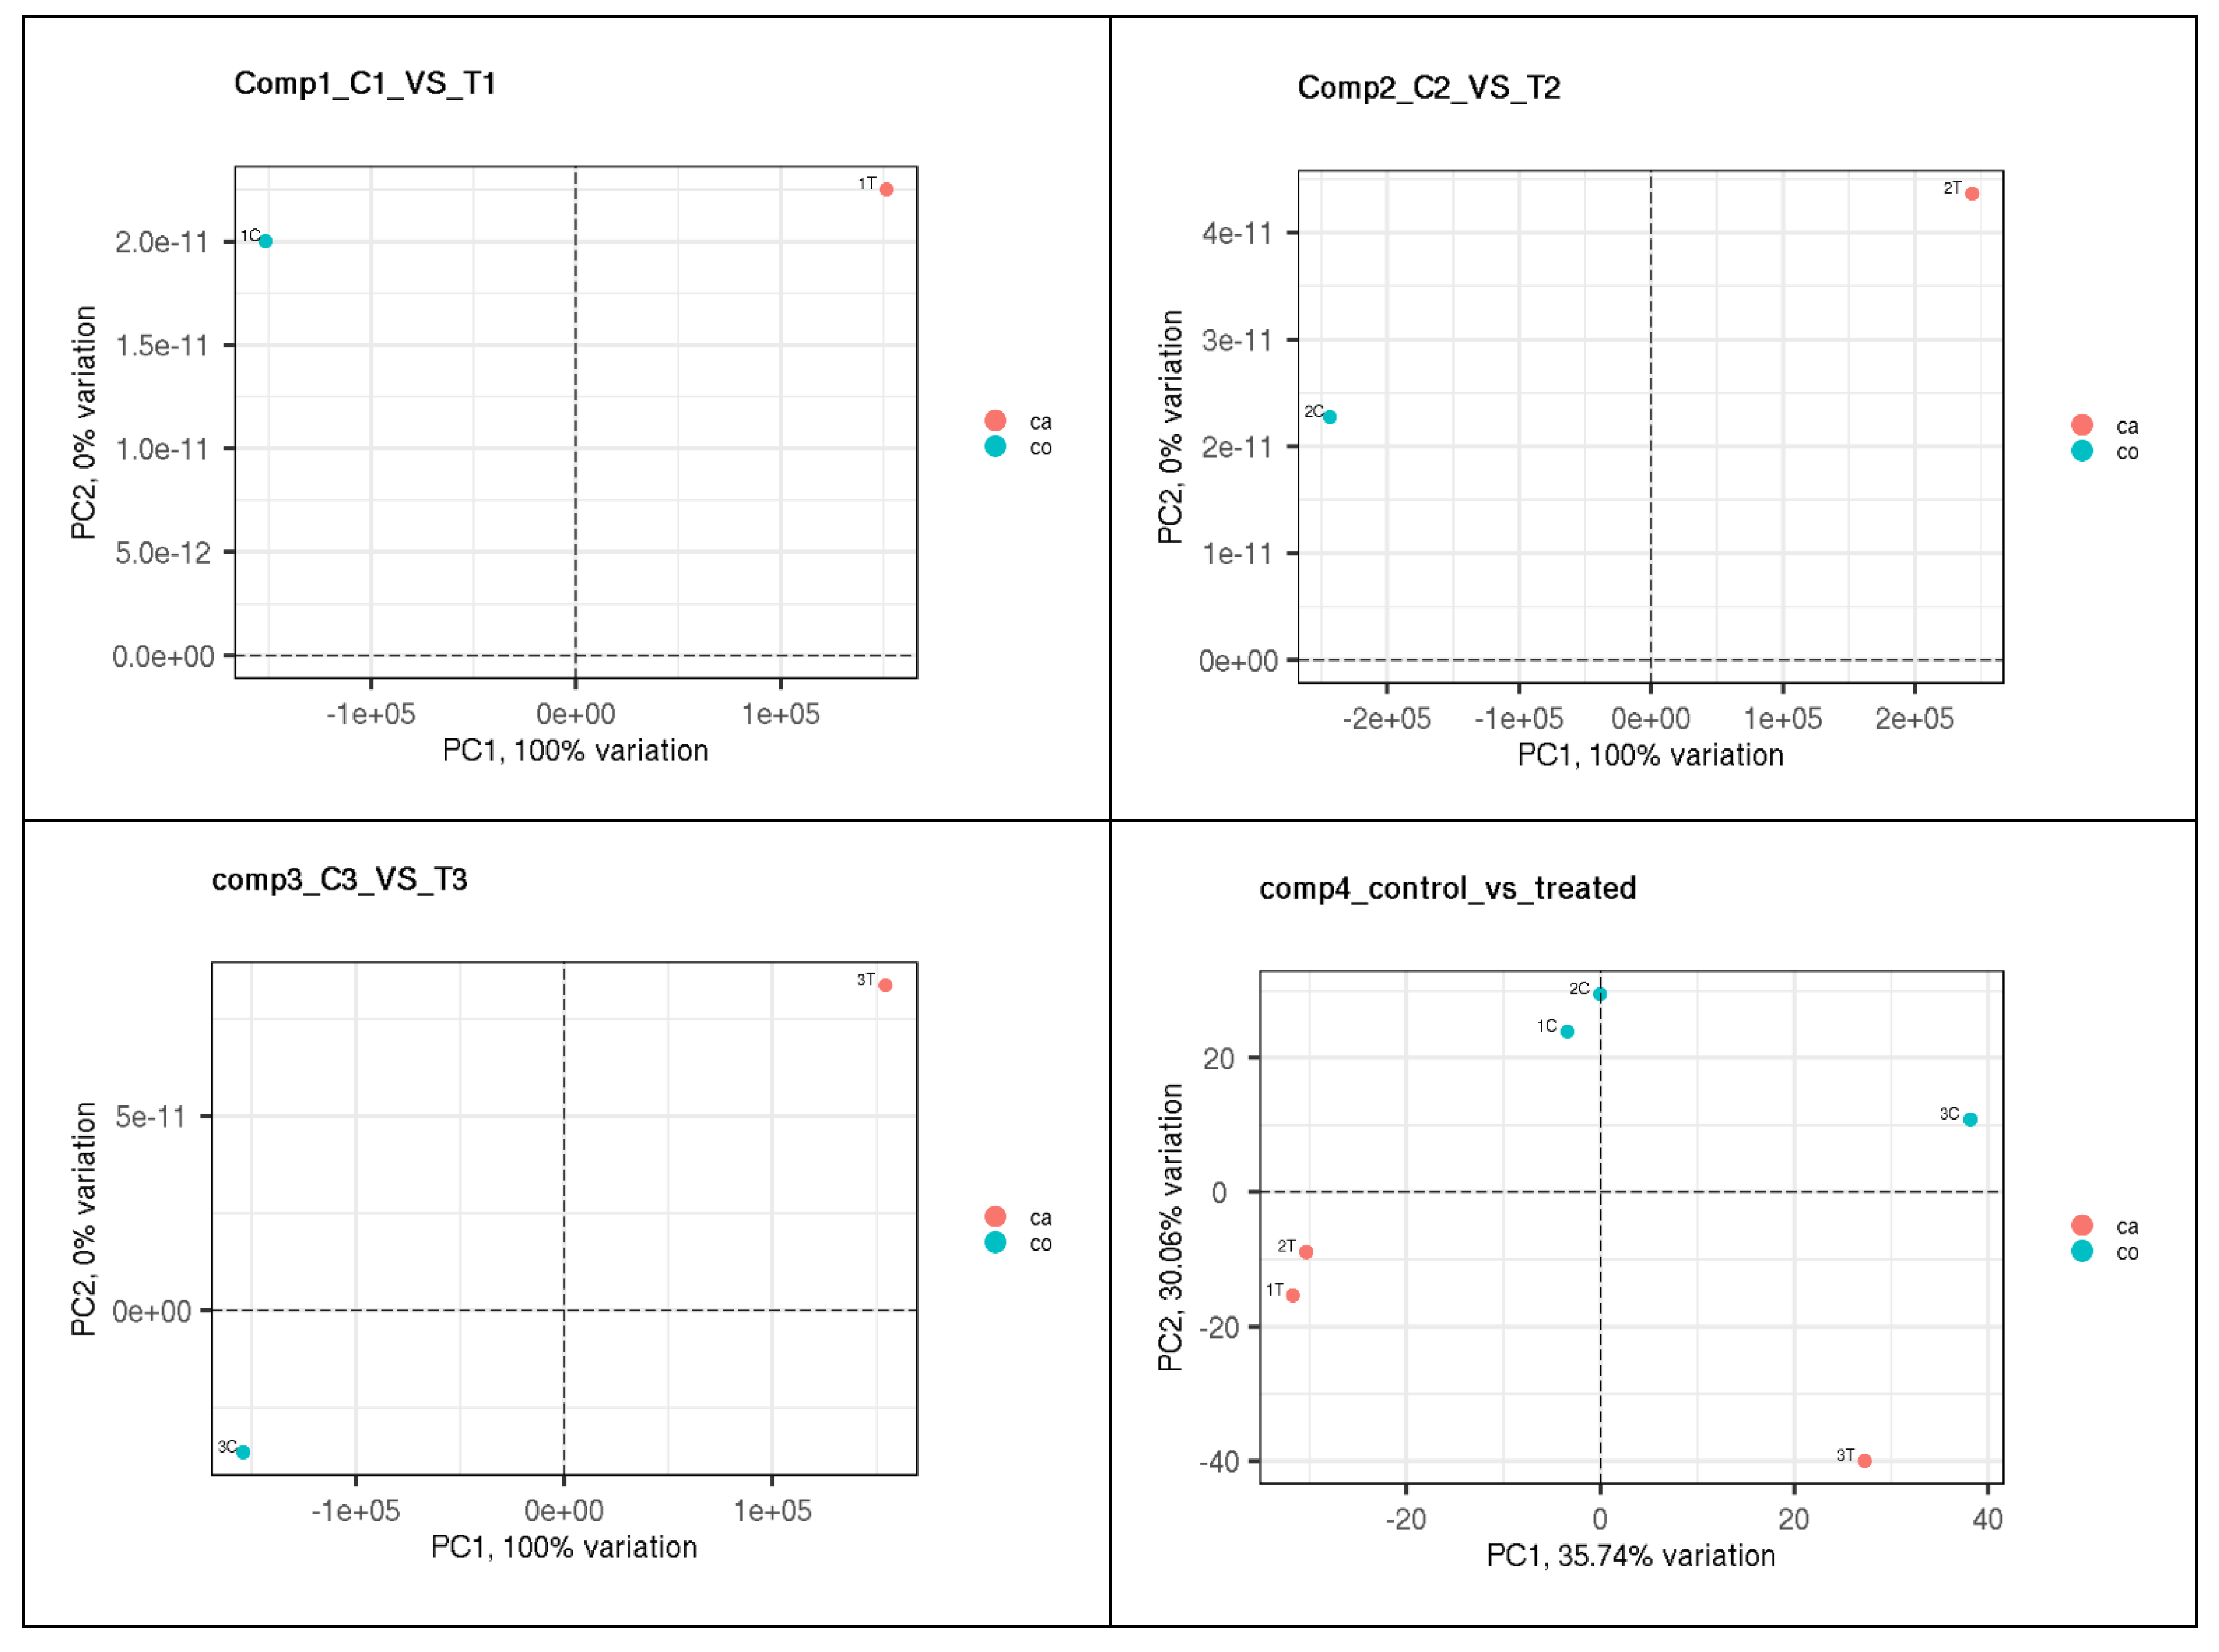
Principal Component Analysis (PCA) plot of normalized gene expression data is used to perform data reduction when dealing with a high number of variables (Figure 2). In this analysis, PC1 captures 100% of the variance, while PC2 captures 0% of the variation. This result is quite straightforward but unusual, indicating a very specific data structure. This pattern was observed when comparing control and infected samples within a breed across all three breeds individually. Whereas, while considering all breeds together and comparing the control and infected, PC1 (x-axis, 35.74% variance): This principal component captures the largest variance in the data. PC2 (y-axis, 30.06% variance): This principal component captures the second largest variance in the data, slightly less than PC1. The control samples (1C, 2C, 3C) are clustered together on the right side of the plot. Represented by the red color. The treated samples (1T, 2T, 3T) are clustered together on the left side of the plot. There is a clear separation between the control and treated samples along both PC1 and PC2. Together, PC1 and PC2 account for 65.80% of the total variance (30.06% + 35.74%). This indicates that the principal components effectively capture the significant differences between the control and treated.

3.3. Identification, Characterization of Transcripts and Differential Expression Analysis

In the differential expression analysis, biological replicates were categorized into control and treated groups. Among the 23,400 genes tested for significance by comparing control and treated samples within the same breed, no significant differences were found. However, when all control samples were compared to all treated samples across breeds, 594 genes exhibited significant differential expression (p<0.01). Of them, 544 protein-coding RNA transcripts were expressed from different chromosomes, and 50 lnRNA was detected (Figure 3, Table 5). Chromosome number one had expressed the most transcripts, making up 13.47% of all transcripts, with 72 protein-coding RNA and 8 lnRNA. Next to the first chromosome, the highest percentage of gene expression was noticed from the second (9.93%), fourth (8.75%), third (7.41%), fifth (6.06%), sixth (5.56%), and Z (5.39%) chromosomes. Gene expressed from the remining chromosomes were less than 4 per cent Figure 3.
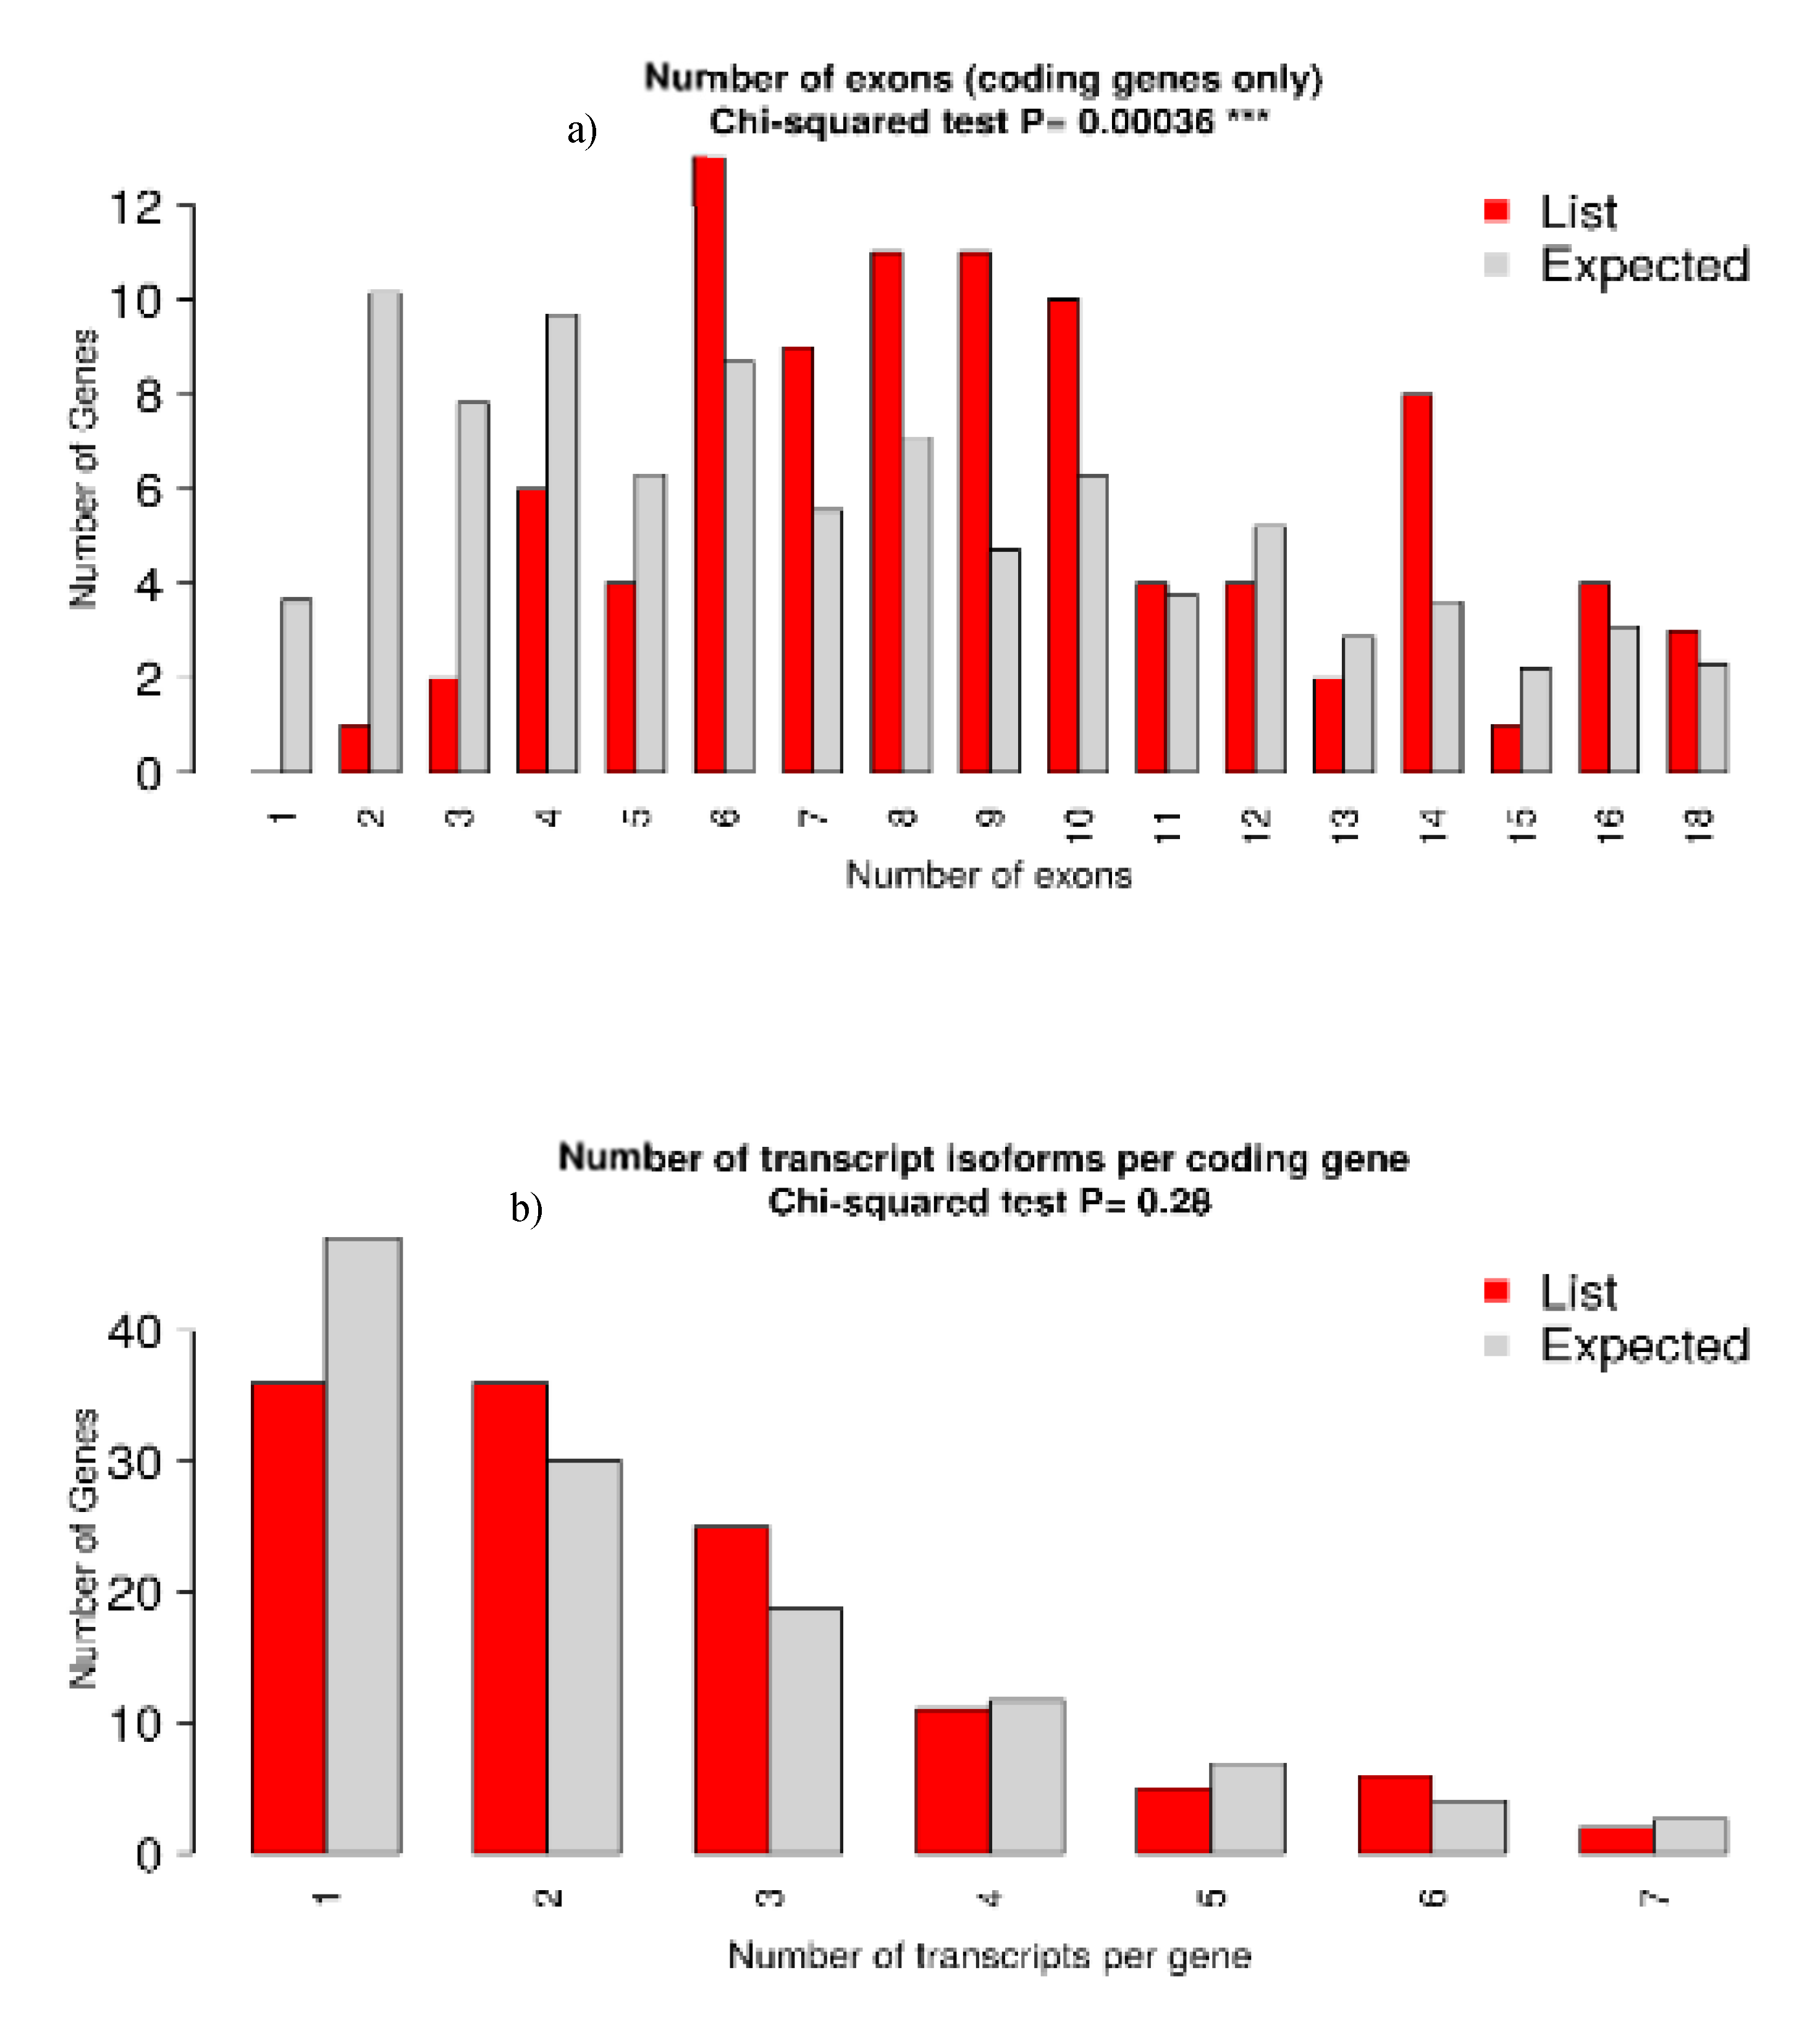
According to the Chi-square test, there was no significant difference in the distribution of query genes across the chromosomes (p=0.37). The quantity of transcripts for each gene was also not observed to vary significantly (p>0.05) (Figure 4). On the other hand, the number of exons per gene showed extremely significant (p<0.01) variations (Figure 4). Findings revealed that the majority of the genes contained six exons and transcribed one to two RNA.
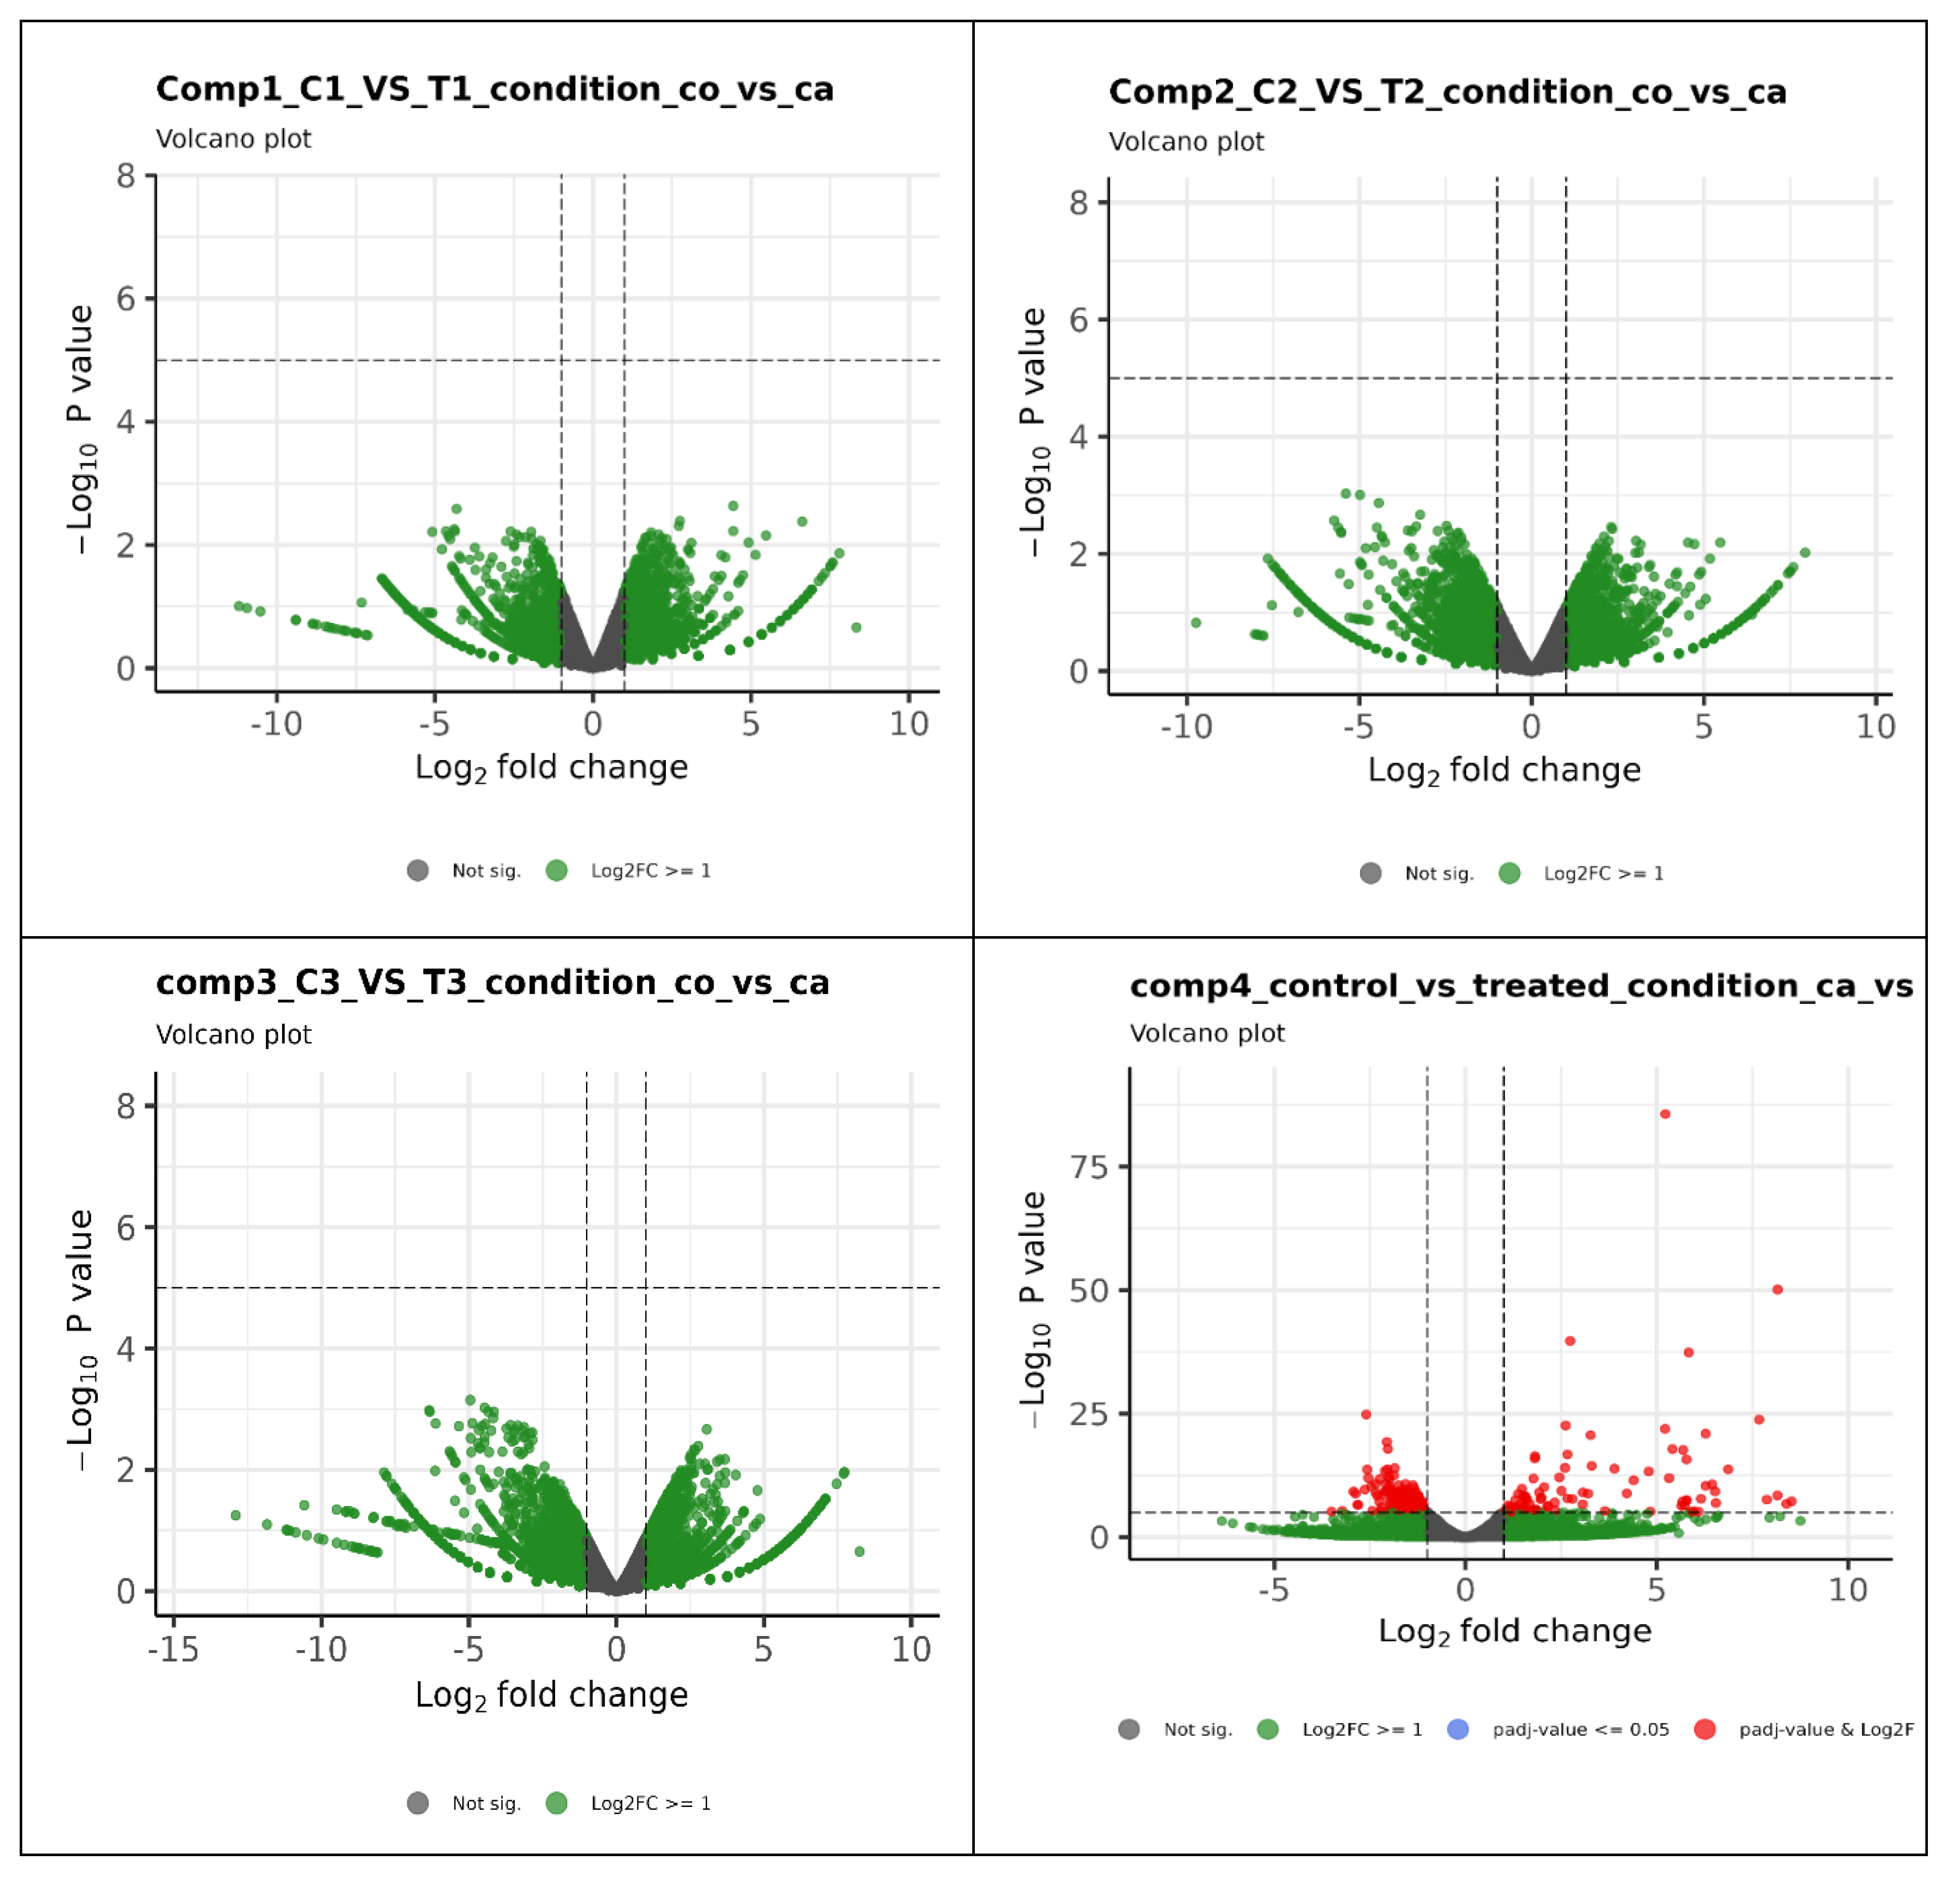
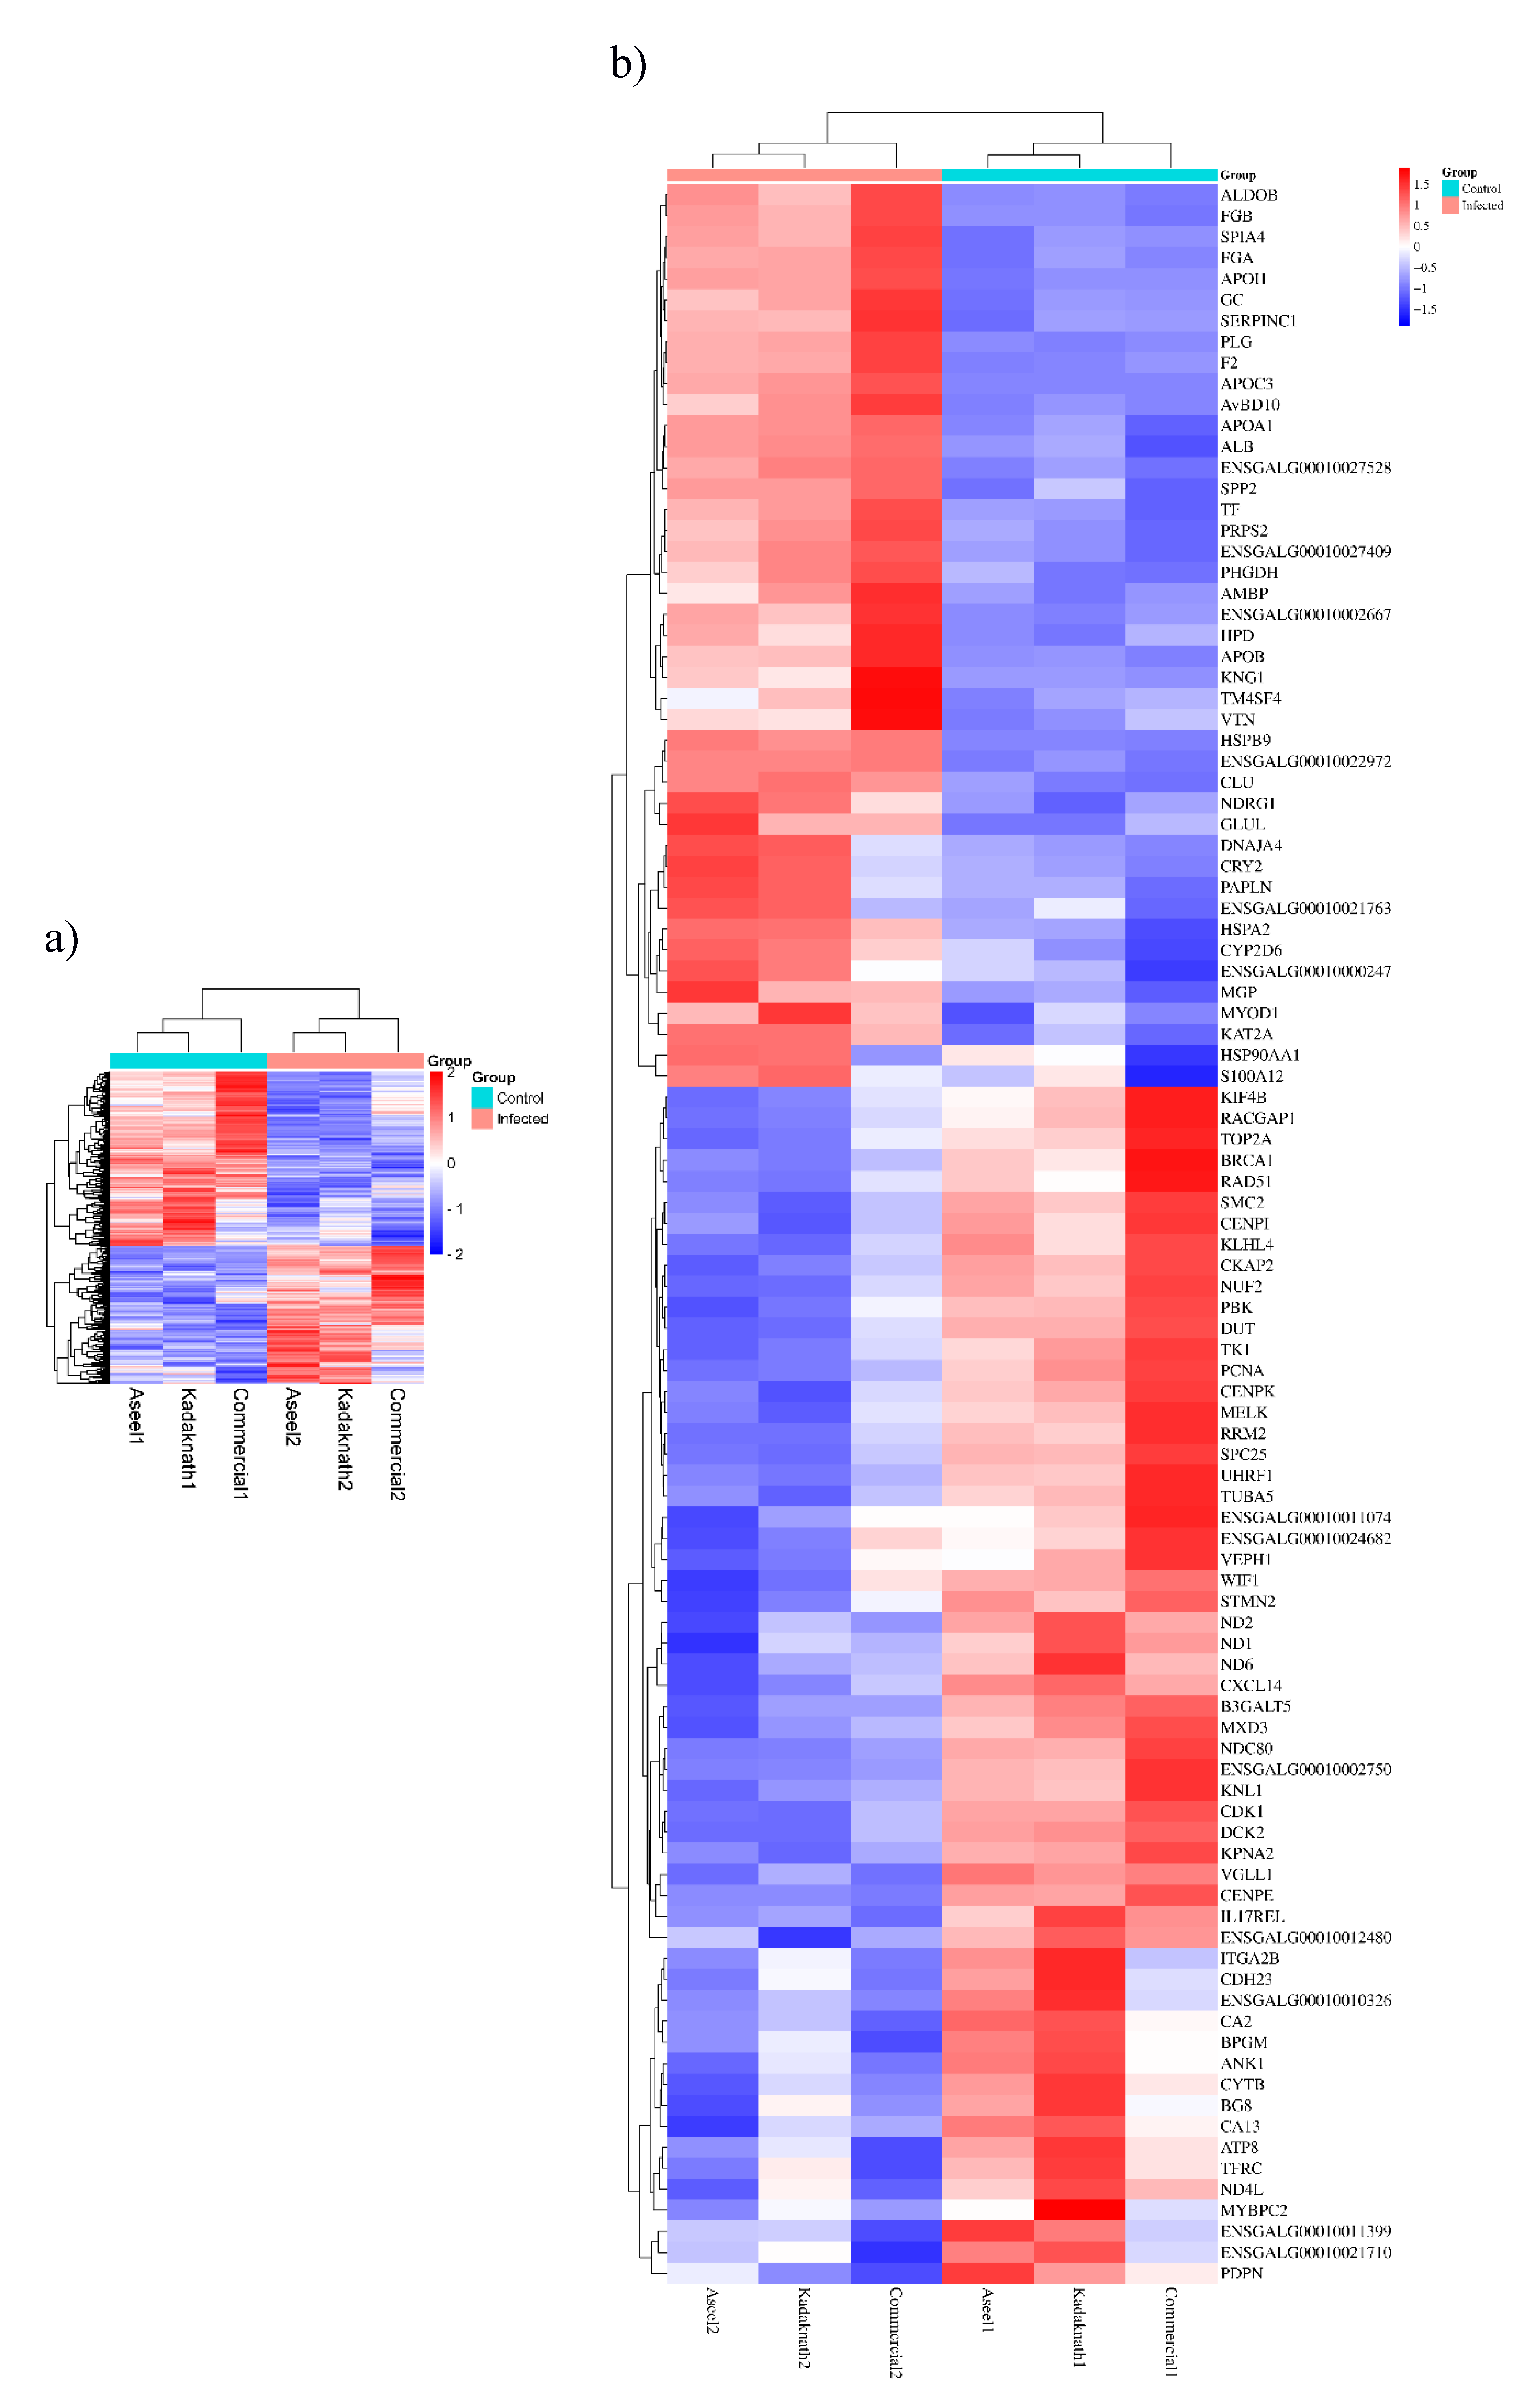
Out of 594 differentially expressed genes, 264 genes (44%) were upregulated, while 330 genes (56%) were downregulated. Similar results were found in a volcano plot for gene expression analysis and genes expression level is 2 times higher in the treated group compared to the control group (Figure 5). The heat map was generated for expression profile of the significant differentially expressed top 100 genes across the samples (Figure 6) to show the breed specific pattern of gene expression. A few genes expression show exceptionally up or down regulated compared to the majority, which could be of particular interest for further investigation as they may play key roles in the biological processes under study. The highly and significantly (p<0.05) overexpressed genes (log2 fold change) in infected chicken embryonic conditions include ALB, C8A, FGG, PIT54, FETUB, APOC3, FGA, SPIA1, AvBD13, APOH, AMBP, TTR, PLA2G12B TLR4, TLR2, TLR21, IL1R2, IL22RA2, HSP90AA, HSPB9, and HSPB8. All these genes were found to be expressed with a log2 fold change greater than 8. Additionally, 29 novel transcripts and 20 lncRNAs were found to be significantly upregulated in infected chicken embryos.
Among these, the top 12 highly expressed transcripts were ENSGALG00010016177, ENSGALG00010017501, ENSGALG00010006269, ENSGALG00010027528, ENSGALG00010002667, ENSGALG00010022972, ENSGALG00010014764, ENSGALG00010022012, ENSGALG00010017606, ENSGALG00010021130, ENSGALG00010022479 and ENSGALG00010000247. Furthermore, clusters of genes with comparable expression patterns are visible on the heat map, which may point to co-regulation or shared functional pathways. In all three breeds, the majority of the genes exhibit uniform changes in expression in response to infection. The Aseel NRSN1 and TNIP3 genes, the Kadaknath RSFR and CEBPD genes, and the White Leghorn HPGDS, FGG, FGB, FGA, and PIT54 genes were shown to have higher levels of breed-specific responses than the others.
Infected samples had significantly (p<0.01) down-regulated levels of 331 genes in total. Results showed that the quantity of mRNA for BPIFB3, TRIM39.1, MAP3K7CL, IL17REL, IL22A1 KHDRBS2, KCNH5, VGLL1, CA2, CXCR4, CXCL14, GATA3 and SLC25A48 genes were significantly low in infected lung. In infected chicken embryos, 34 new genes were under expressed, and 10 novel transcripts were identified to be strongly downregulated in infected samples (ENSGALG00010029558, ENSGALG00010011074, ENSGALG00010000768, ENSGALG00010028733, ENSGALG00010028337, ENSGALG00010011399, ENSGALG00010018325, ENSGALG00010011368, ENSGALG00010017833, and ENSGALG00010027164).
Infected embryos also showed 28 under expressed and 20 overexpressed lnRNAs. Out of 28 lnRNA 10 were found highly under expressed (ENSGALG00010030044, ENSGALG00010012473, ENSGALG00010007497, ENSGALG00010010093, ENSGALG00010028388, ENSGALG00010002237, ENSGALG00010011328, ENSGALG00010019663, ENSGALG00010014138, ENSGALG00010011830) in infected embryos.
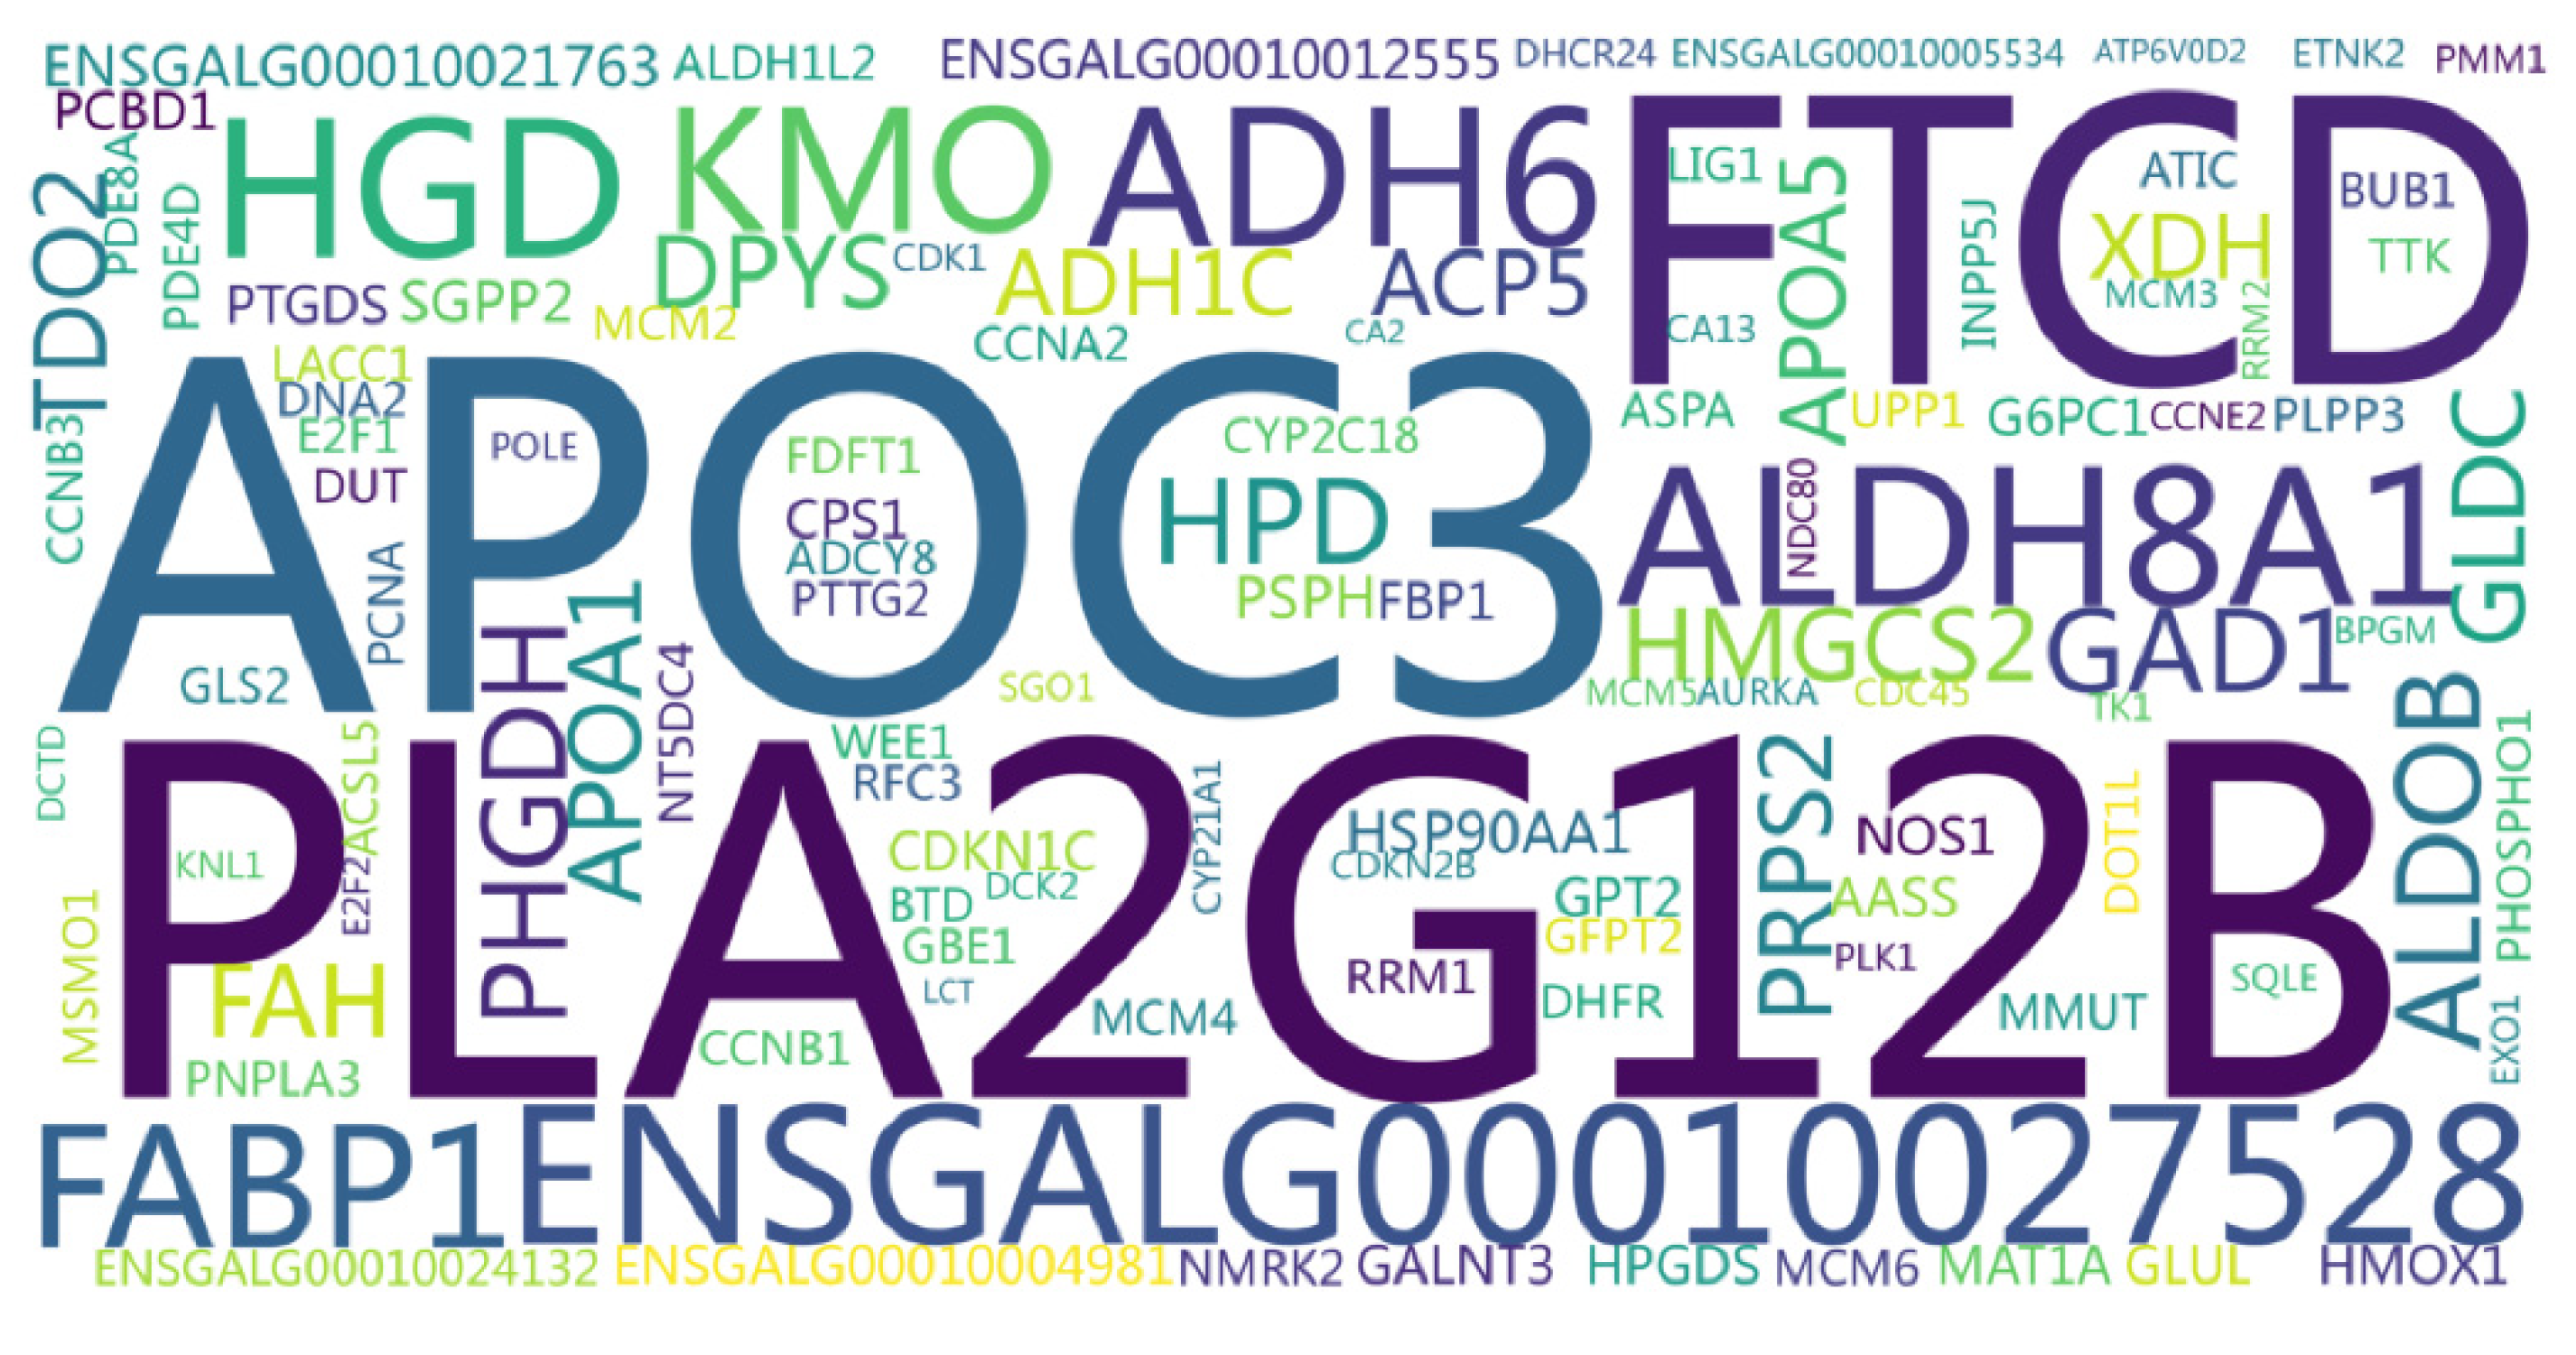
Word cloud illustating the level of transcription of varioud genes involved in various pathway (Figure 7). Genes associated with various metabolic activities, such as APOC3, PLA2G12B, FTCD, ENSGALG00010027528, and ADH6 transcripts, exhibited significantly higher expression levels in infected embryos, with log fold changes (logFC) of 8.16, 6.58, 5.85, 5.83, and 5.65, respectively, compared to healthy embryos. Conversely, several transcripts, including BPGM (-2.06 logFC), CA13 (-2.10 logFC), TK1 (-2.11 logFC), ATP6V0D2 (-2.44 logFC), LCT (-2.52 logFC), and CA2 (-2.60 logFC), were significantly underexpressed.
Additionally, genes involved in cell cycle regulation and DNA replication, such as NDC80 (-2.08 logFC), E2F2 (-2.20 logFC), CCNE2 (-2.35 logFC), MCM (-1.81 logFC), CDC45 (-1.68 logFC), and CDK1 (-1.85 logFC), were also found to be significantly underexpressed in infected embryos. Likewise, mitochondrial genes including ND1 (-1.29 logFC), ND2 (-1.35 logFC), ND4 (-1.10 logFC), ND5 (-1.21 logFC), and ND6 (-1.44 logFC) were found to be downregulated. In contrast, immune-related genes such as IL1R2 (3.15 logFC), TRIM14 (1.24 logFC), TLR2 (2.79 logFC), TLR21 (1.22 logFC), and TLR4 (1.22 logFC) showed increased expression levels in infected embryos.

3.4. RNA-Seq Data Validation by RT-qPCR

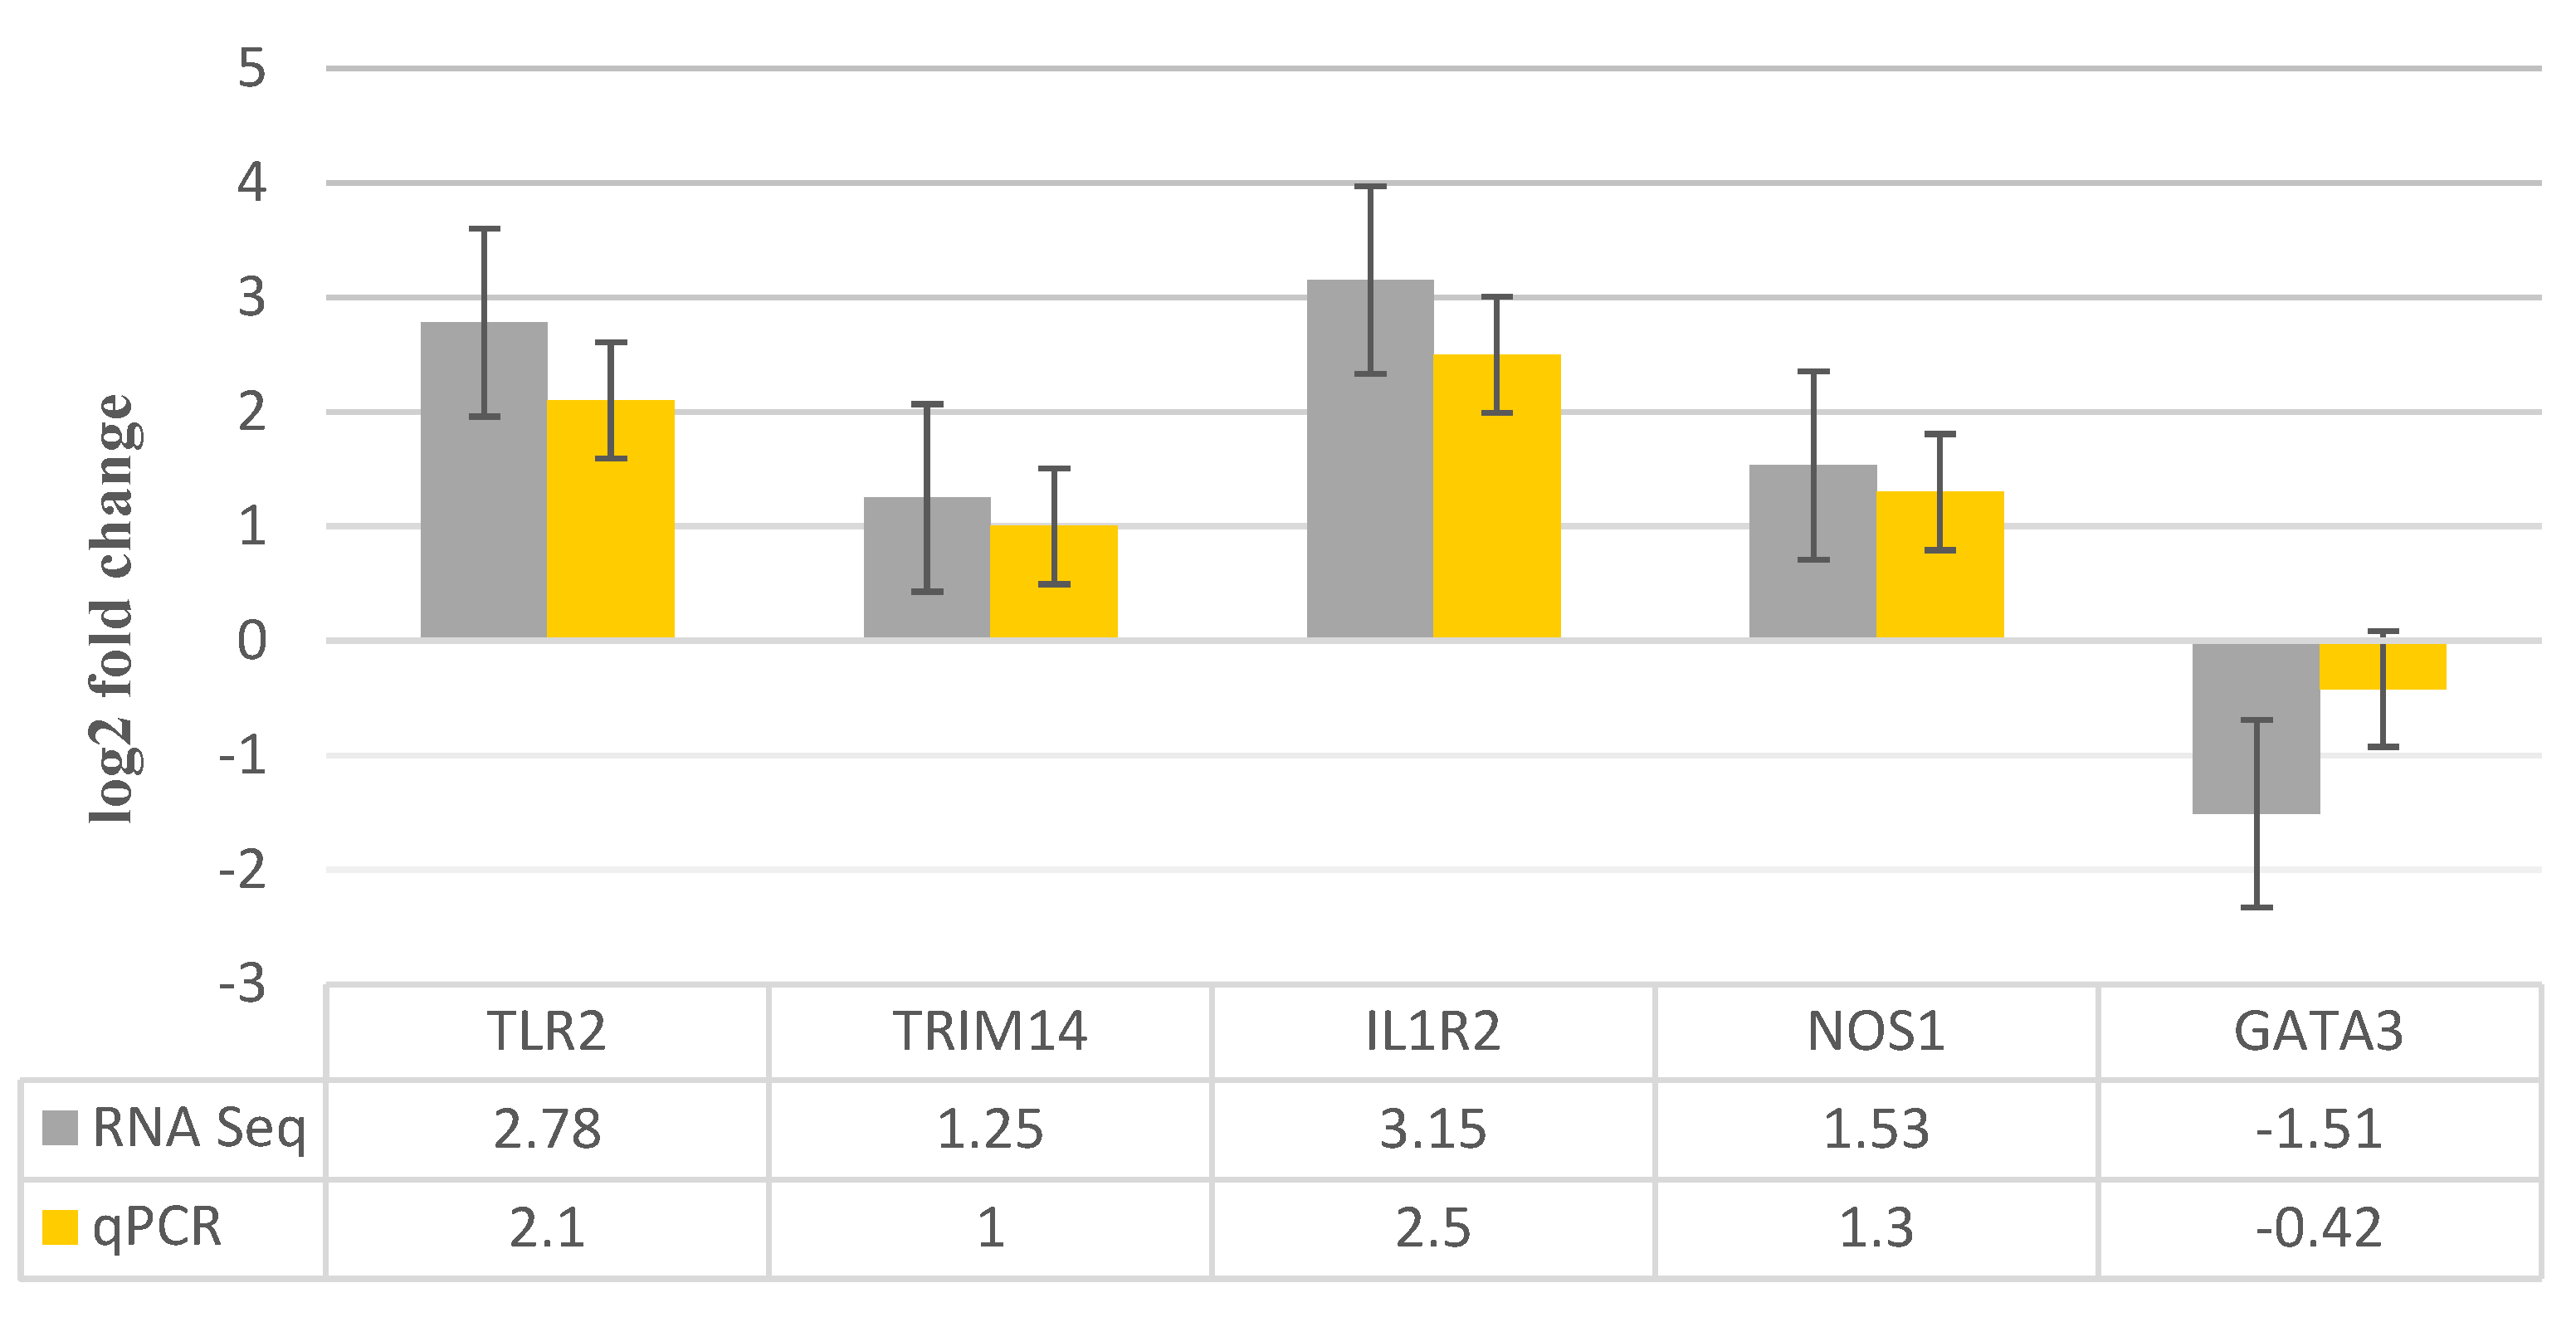
Five mRNAs that were differently expressed were subjected to RT-qPCR in order to further verify the correctness of the sequencing findings. When comparing RT-qPCR data to RNA-Seq data, a comparable expression pattern was seen, as seen in Figure 8. However, there were differences seen in various techniques, which are due to inherent characteristics of these methodologies.

3.5. Functional Analysis

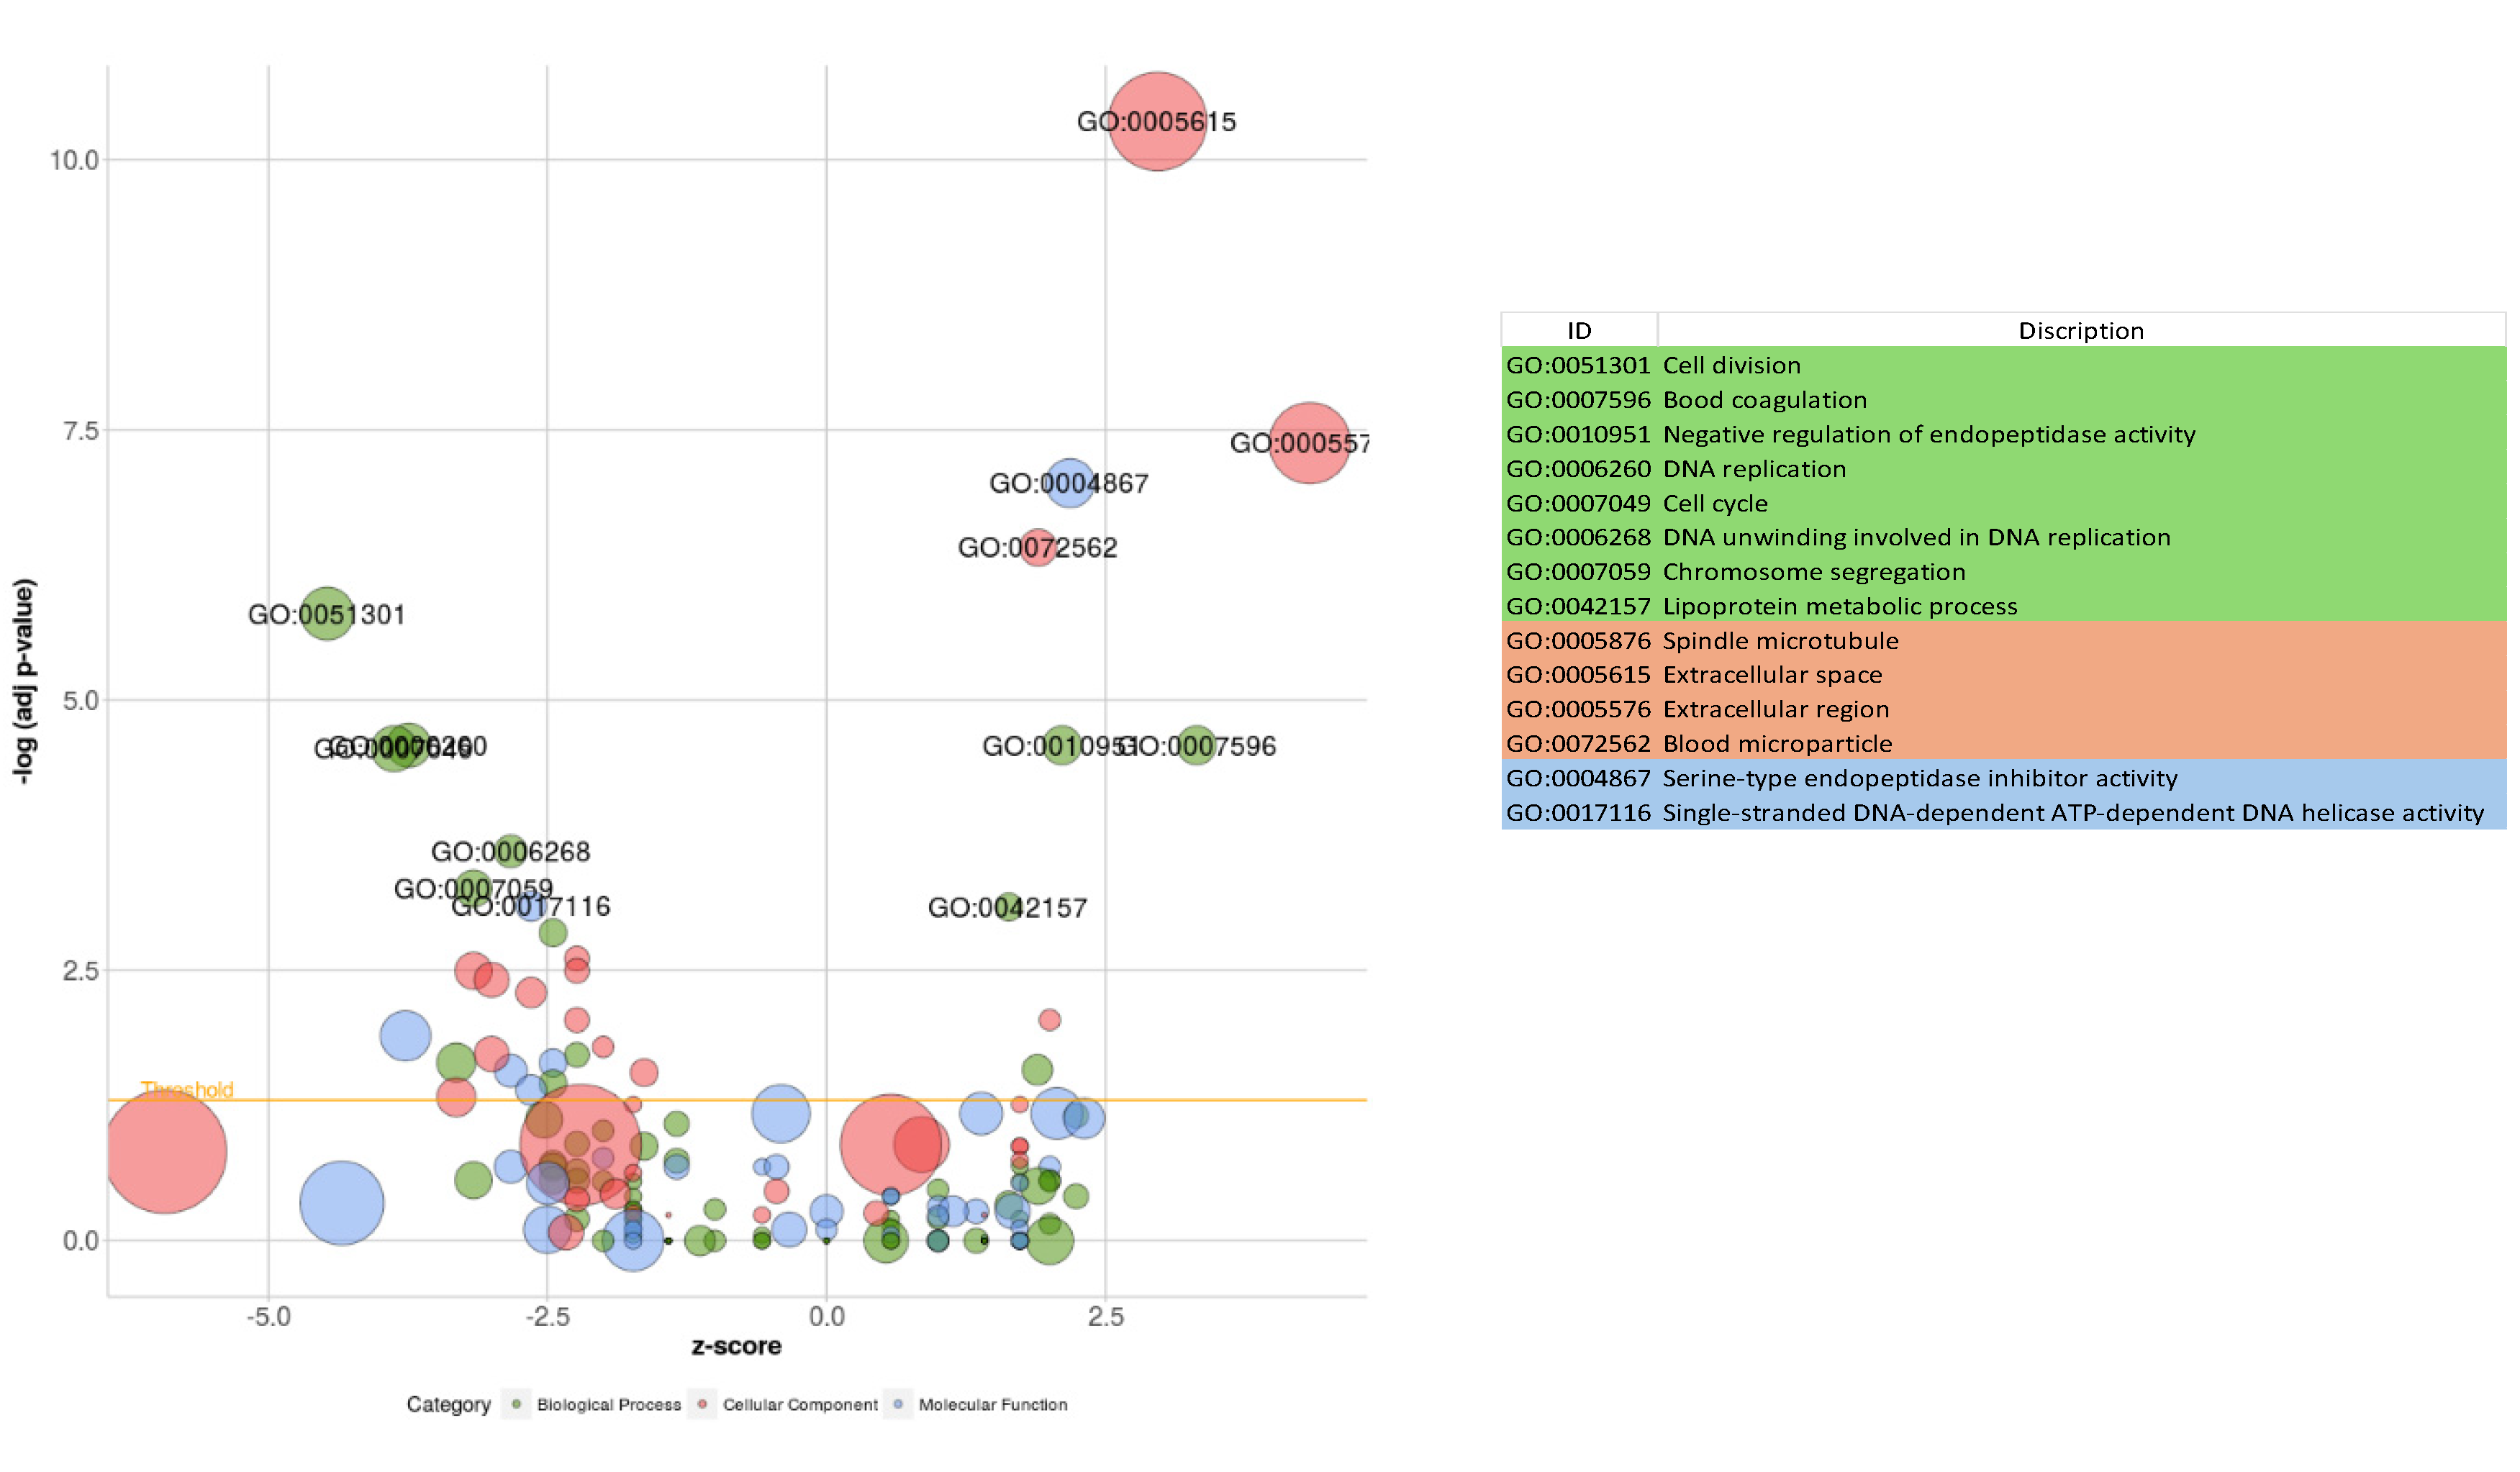
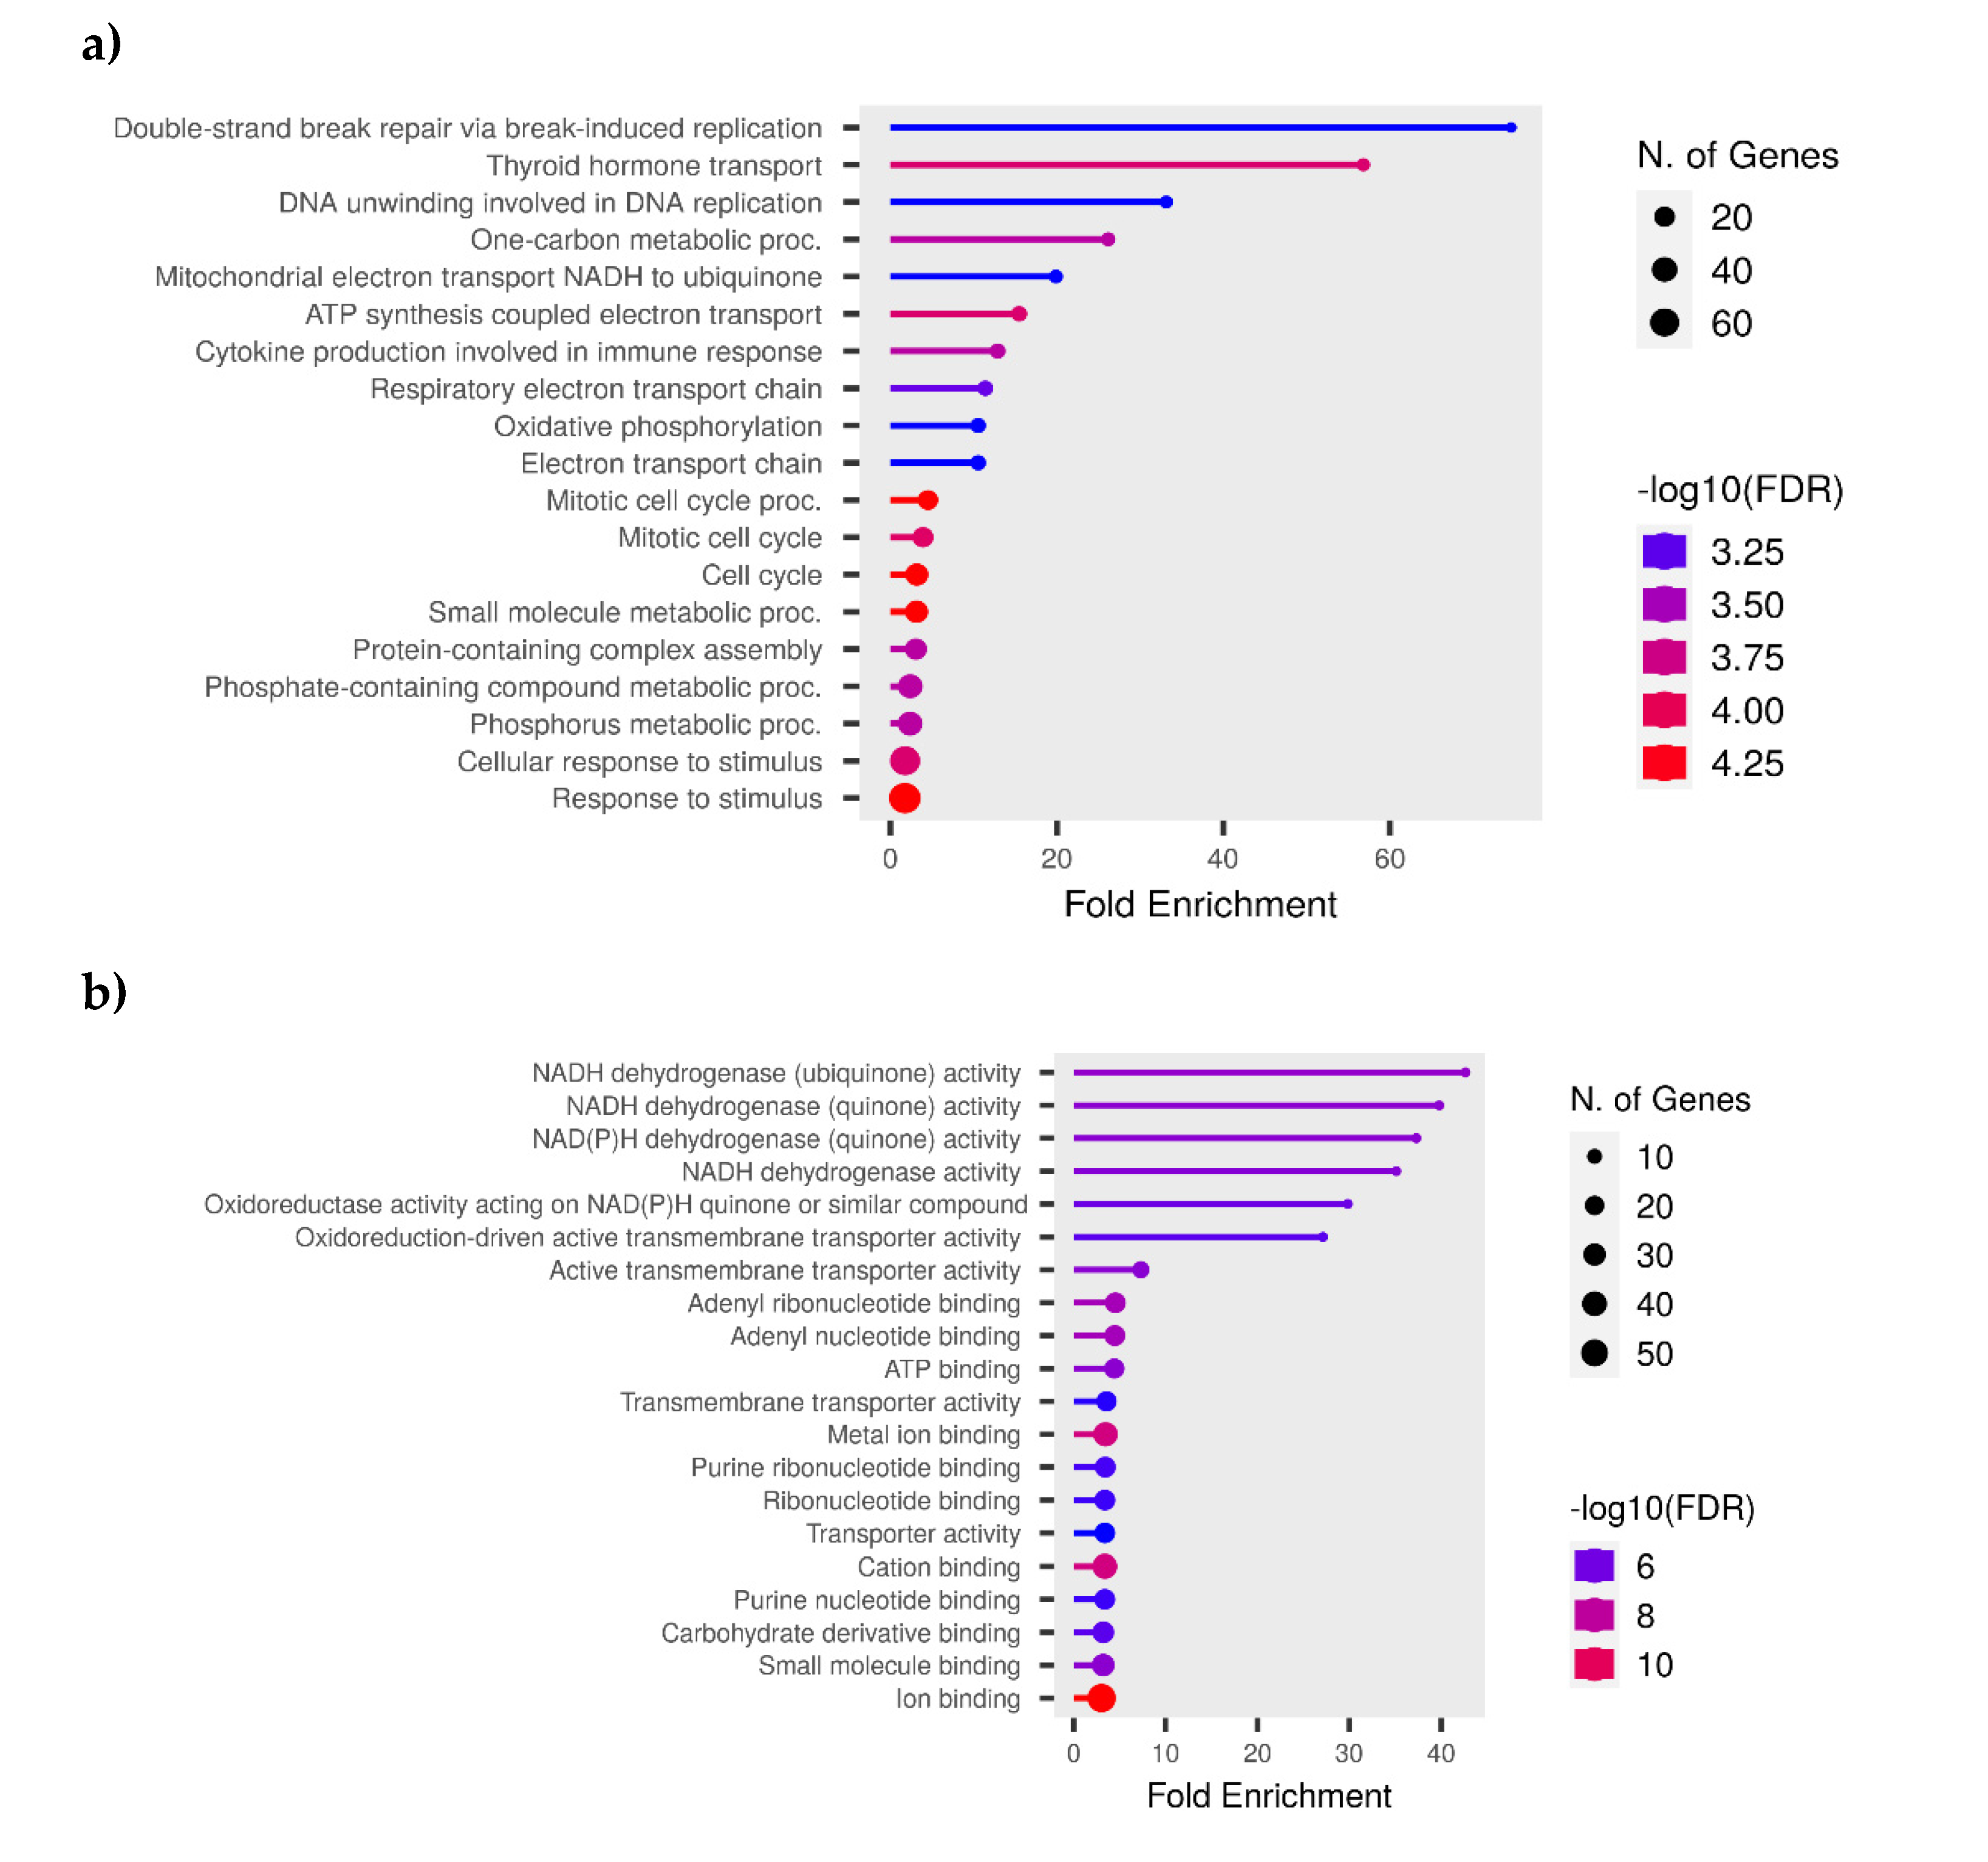
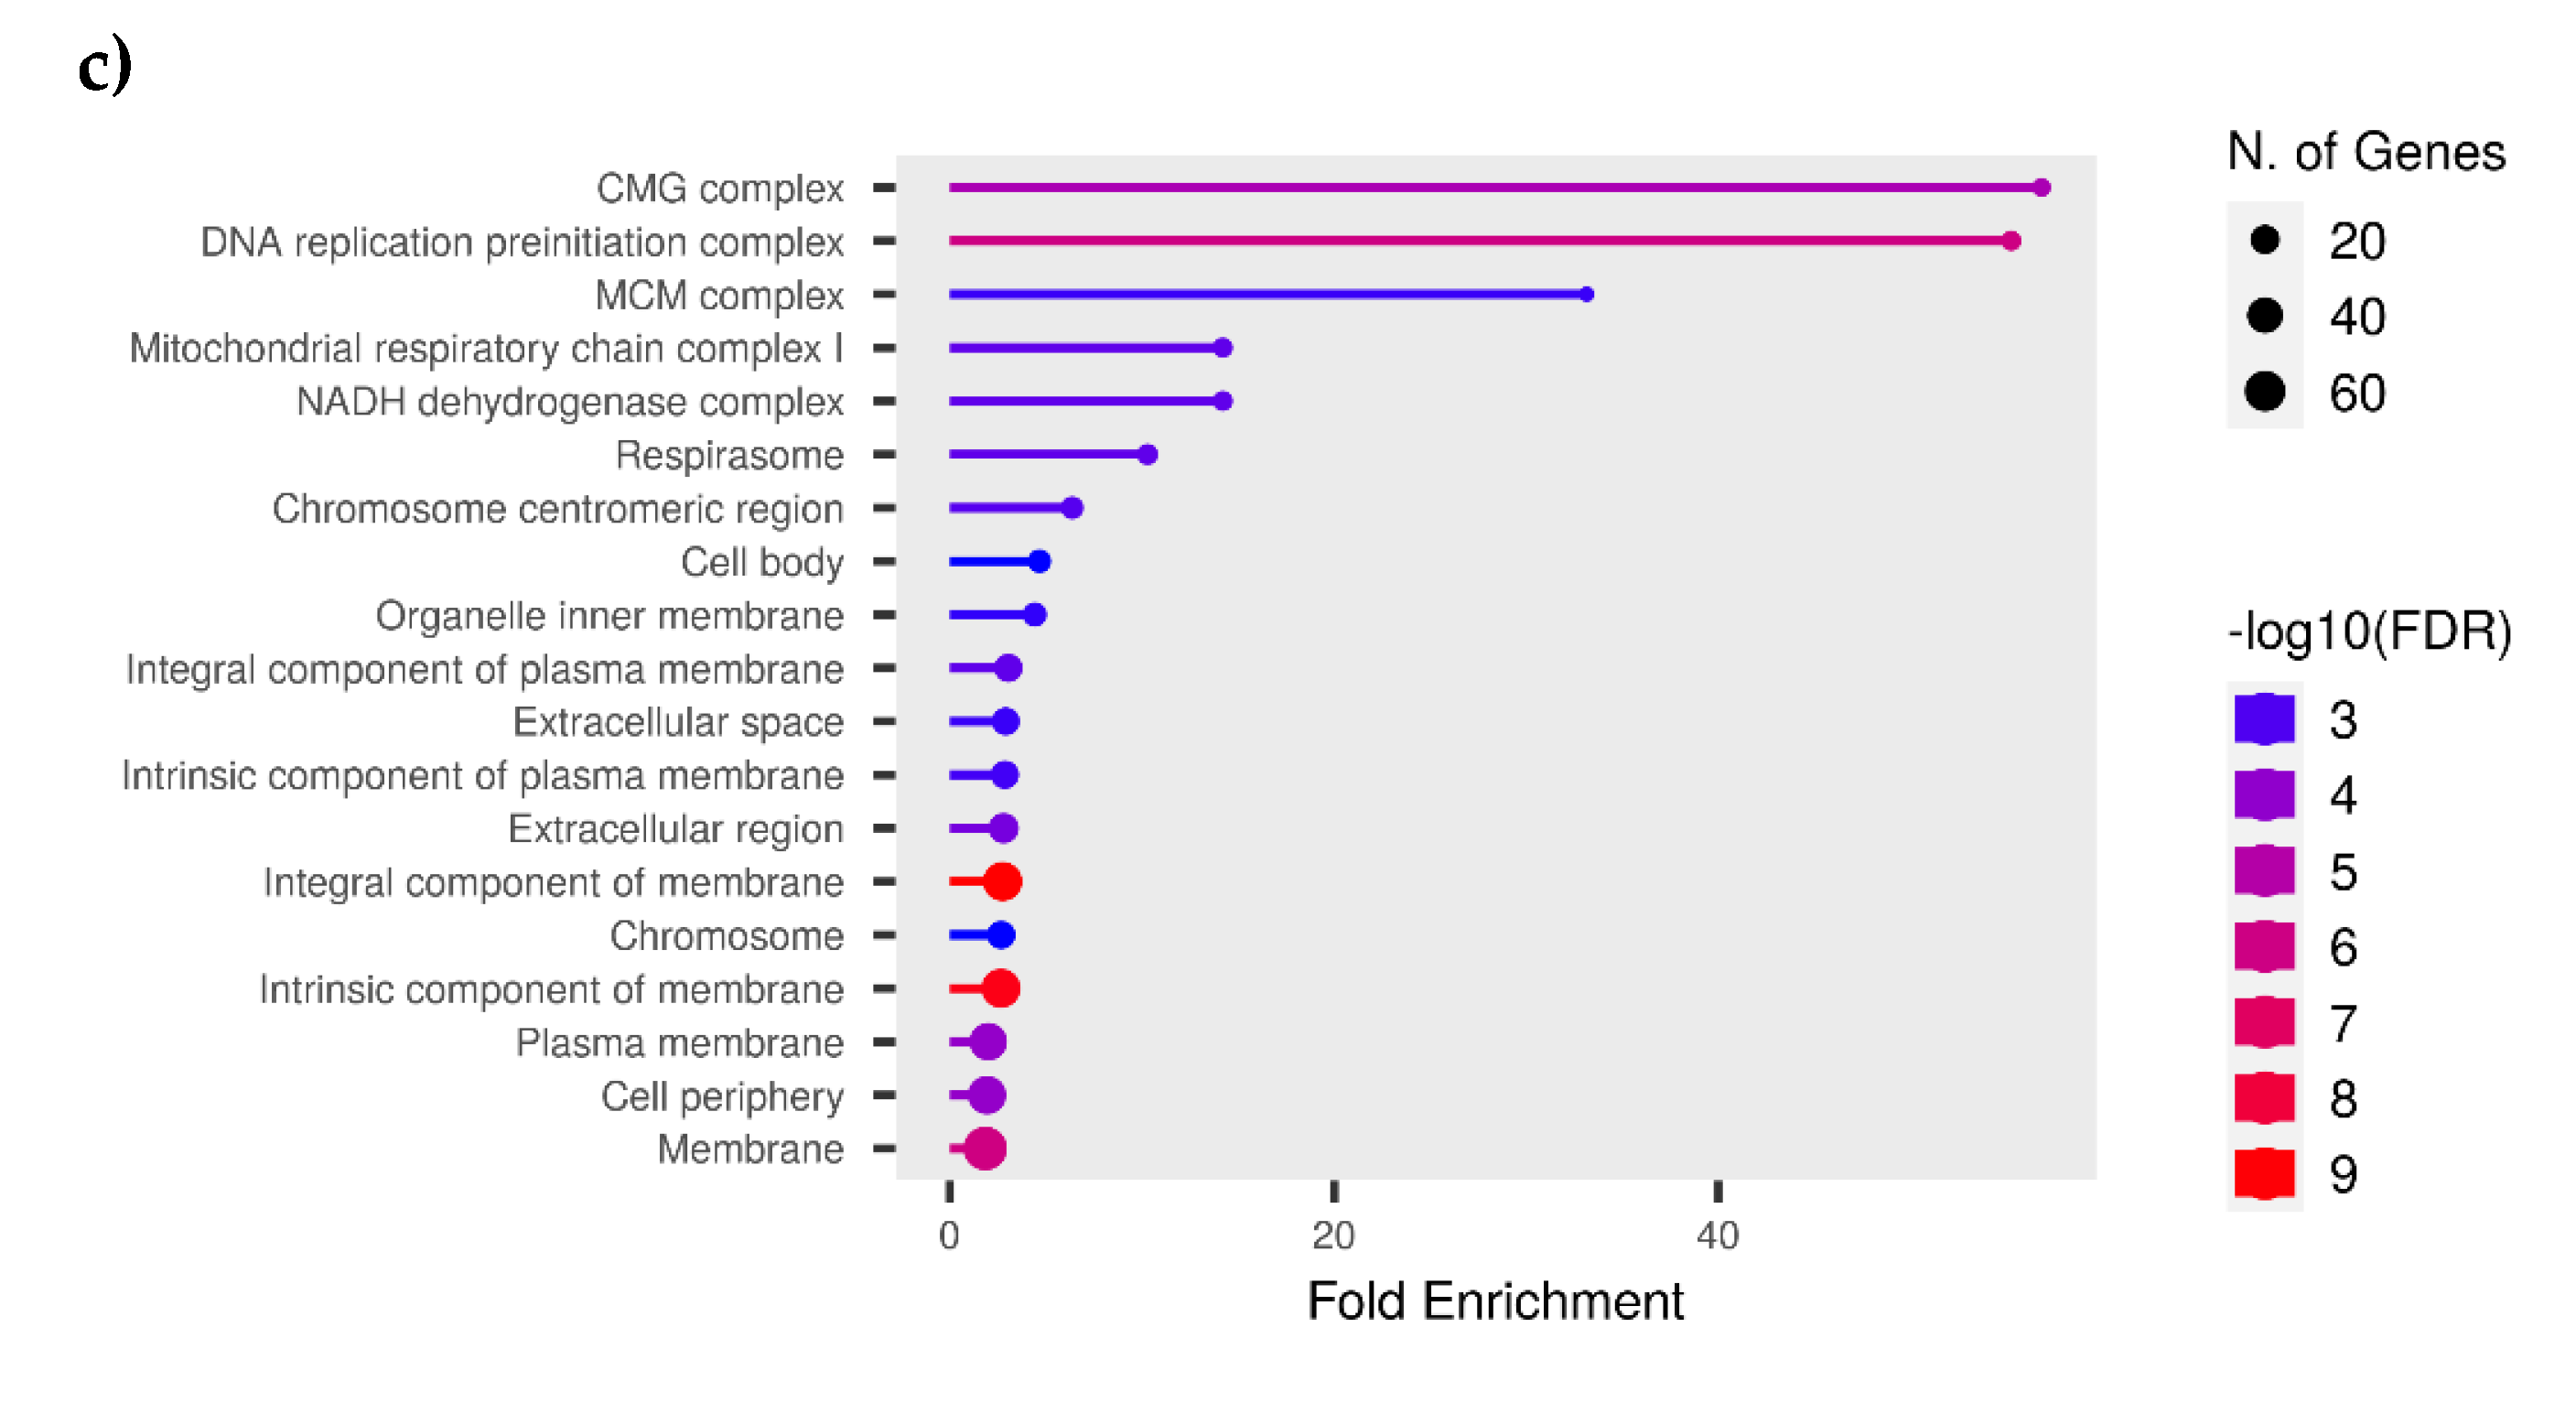
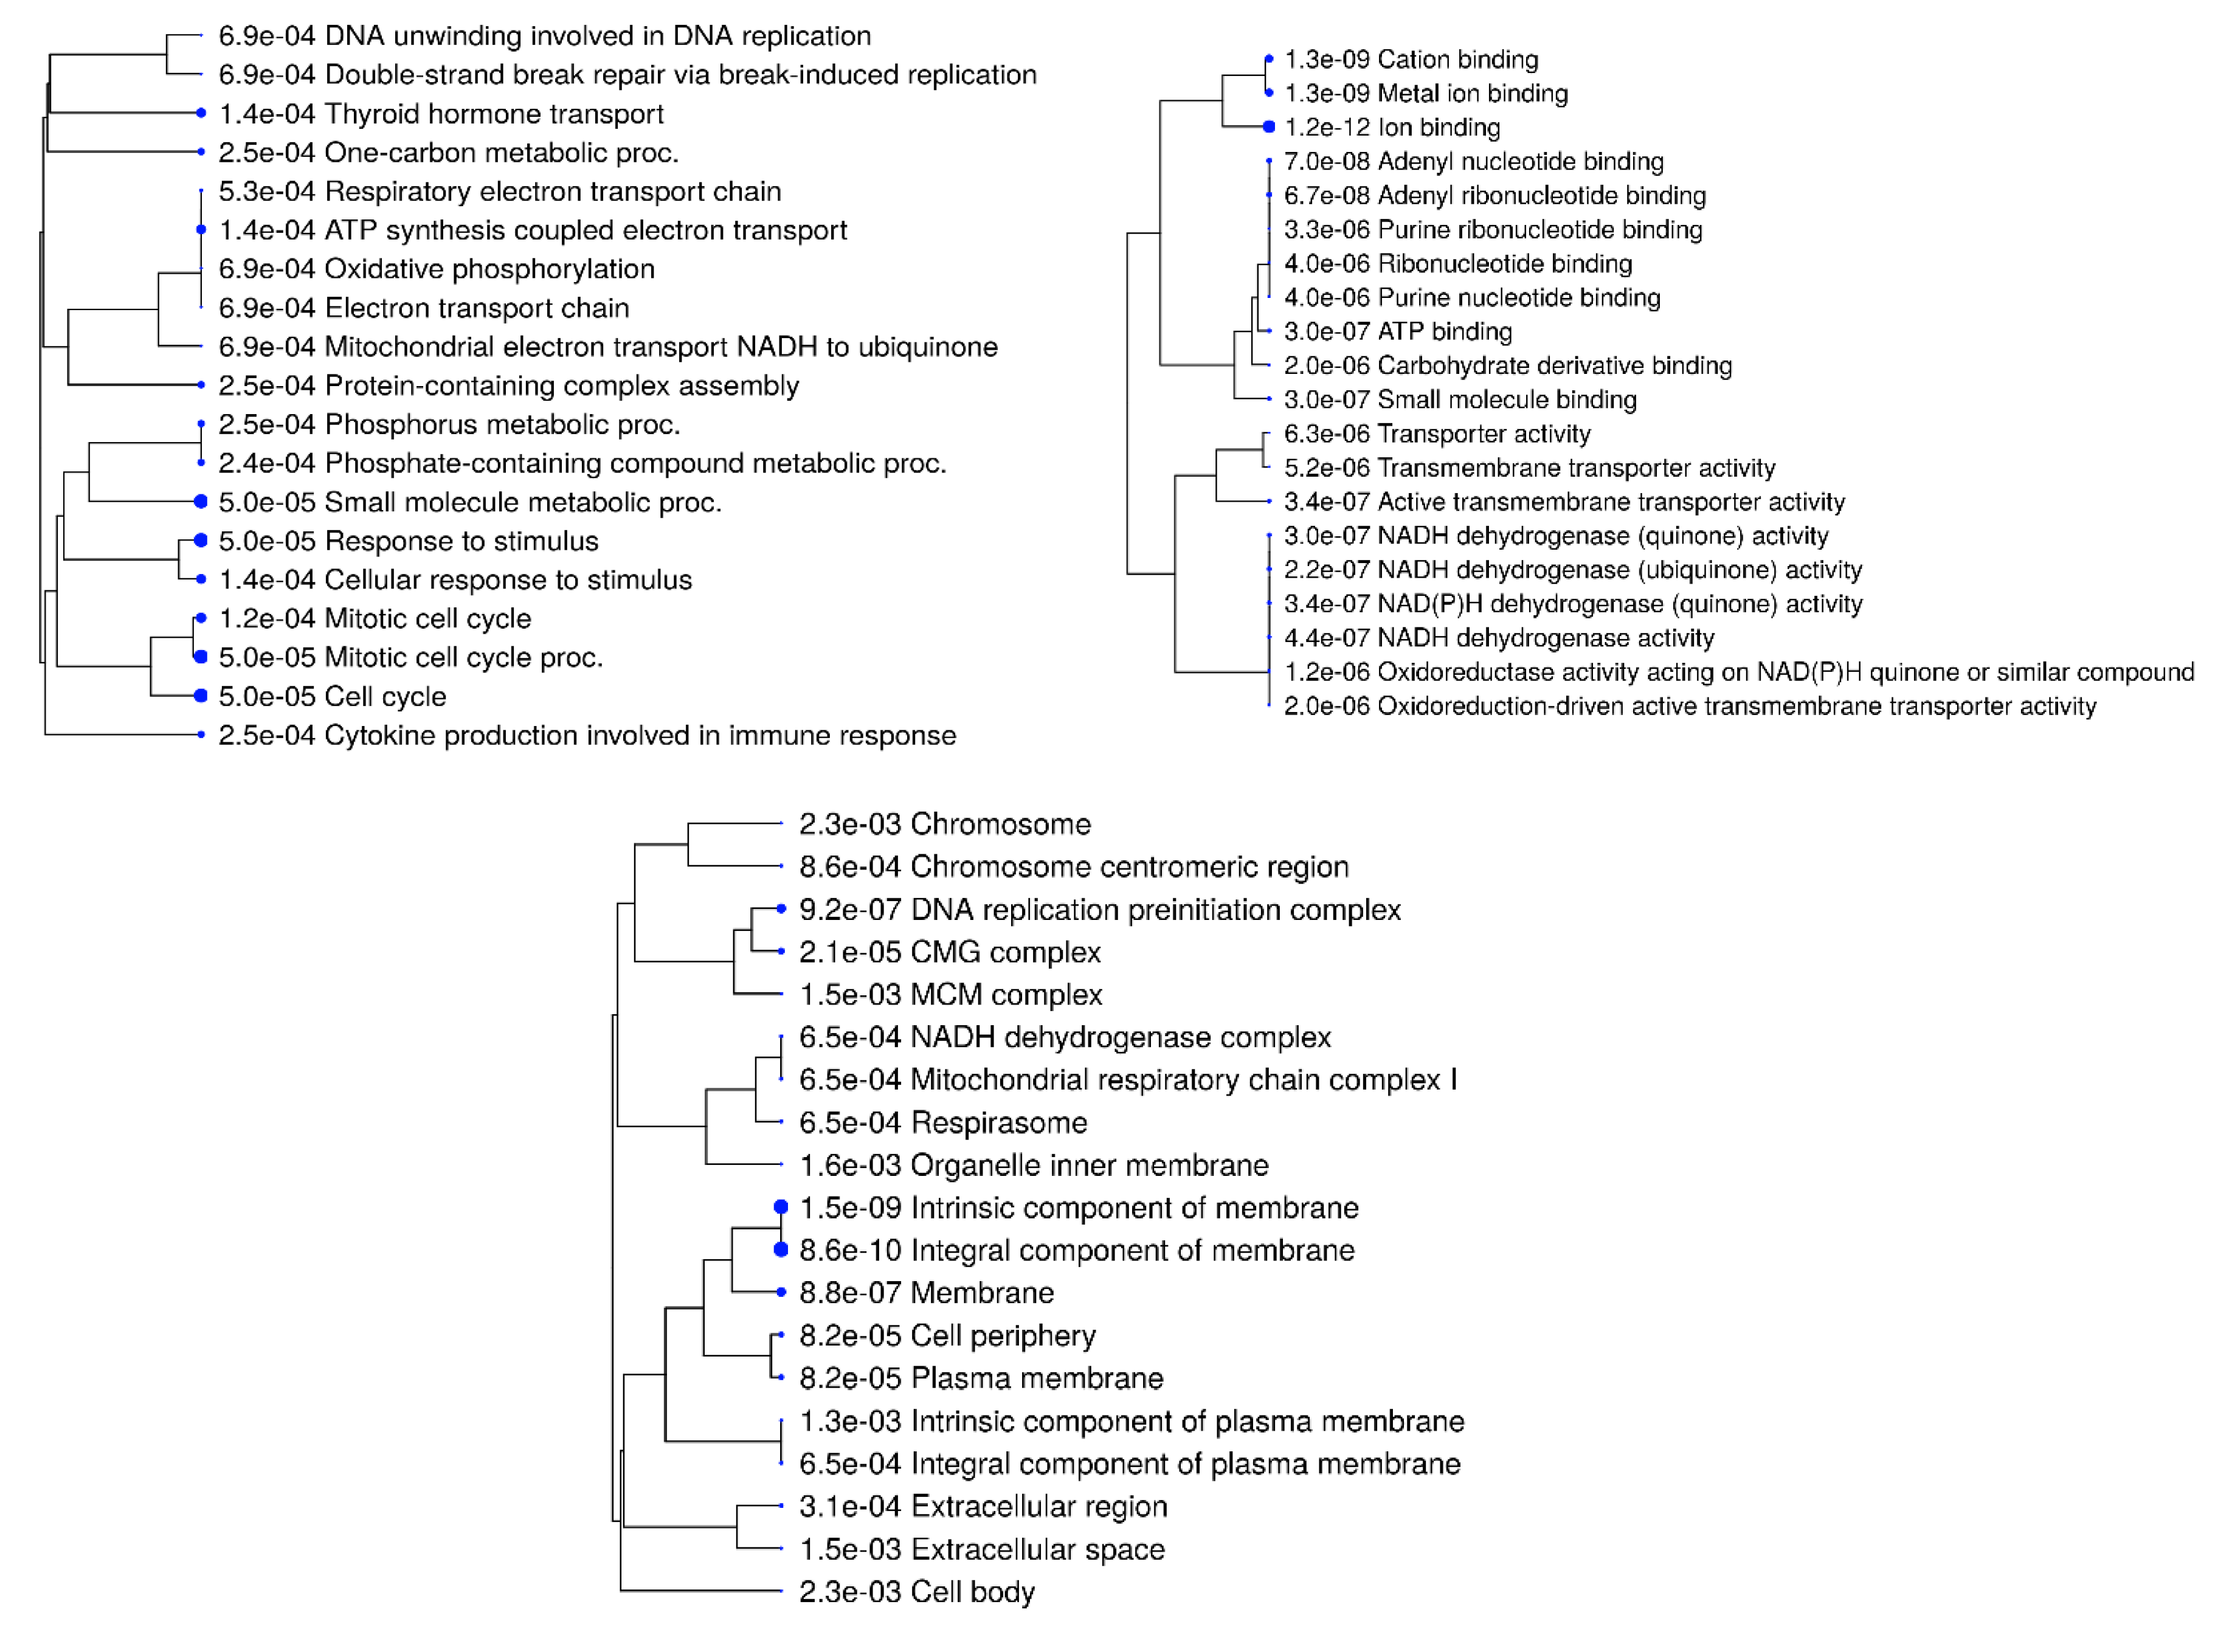
The GO over-representation analysis revealed several significant GO terms across different categories (p<0.05) (Figure 9). The most enriched GO terms include "Extracellular Space" (GO:0005615) with 71 gene count and 2.61-Fold Enriched within the Cellular Component category, "Serine-Type Endopeptidase Inhibitor Activity" (GO:0004867) with 17 gene count and 7.97-Fold Enrichment in the Molecular Function category, and cell division (GO:0051301) with 20 gene count and 5.77-Fold Enrichment among other biological activities. The high fold enrichment and low adjusted p-values indicate robust associations that are unlikely to be due to chance. Notably, the "Blood Microparticle" term exhibited a high fold enrichment, indicating a strong association with the gene list. Further, analysis shows that the “Cytokine production involved in immune response” had a −log10 (FDR) as 3.25, which provided a clearer picture of the statistical significance with involvement of 20 genes (Figure 10). Additionally, it was also found that mitochondrial electron transport, specifically NADH to ubiquinone (GO:0006120), and mitochondrial respiratory chain complex I activity (GO:0032981) were affected, with 5 genes involved and fold enrichments of 6.69 and 4.6, respectively. This indicates an alteration in mitochondrial activity due to the infection. Enriched pathways and hierarchical clustering tree analysis revealed more significantly enriched gene sets with greater gene overlap as well as the link between important pathways. Pathways that share a large number of genes are grouped together (Figure 11).

3.6. KEGG Pathway Analysis

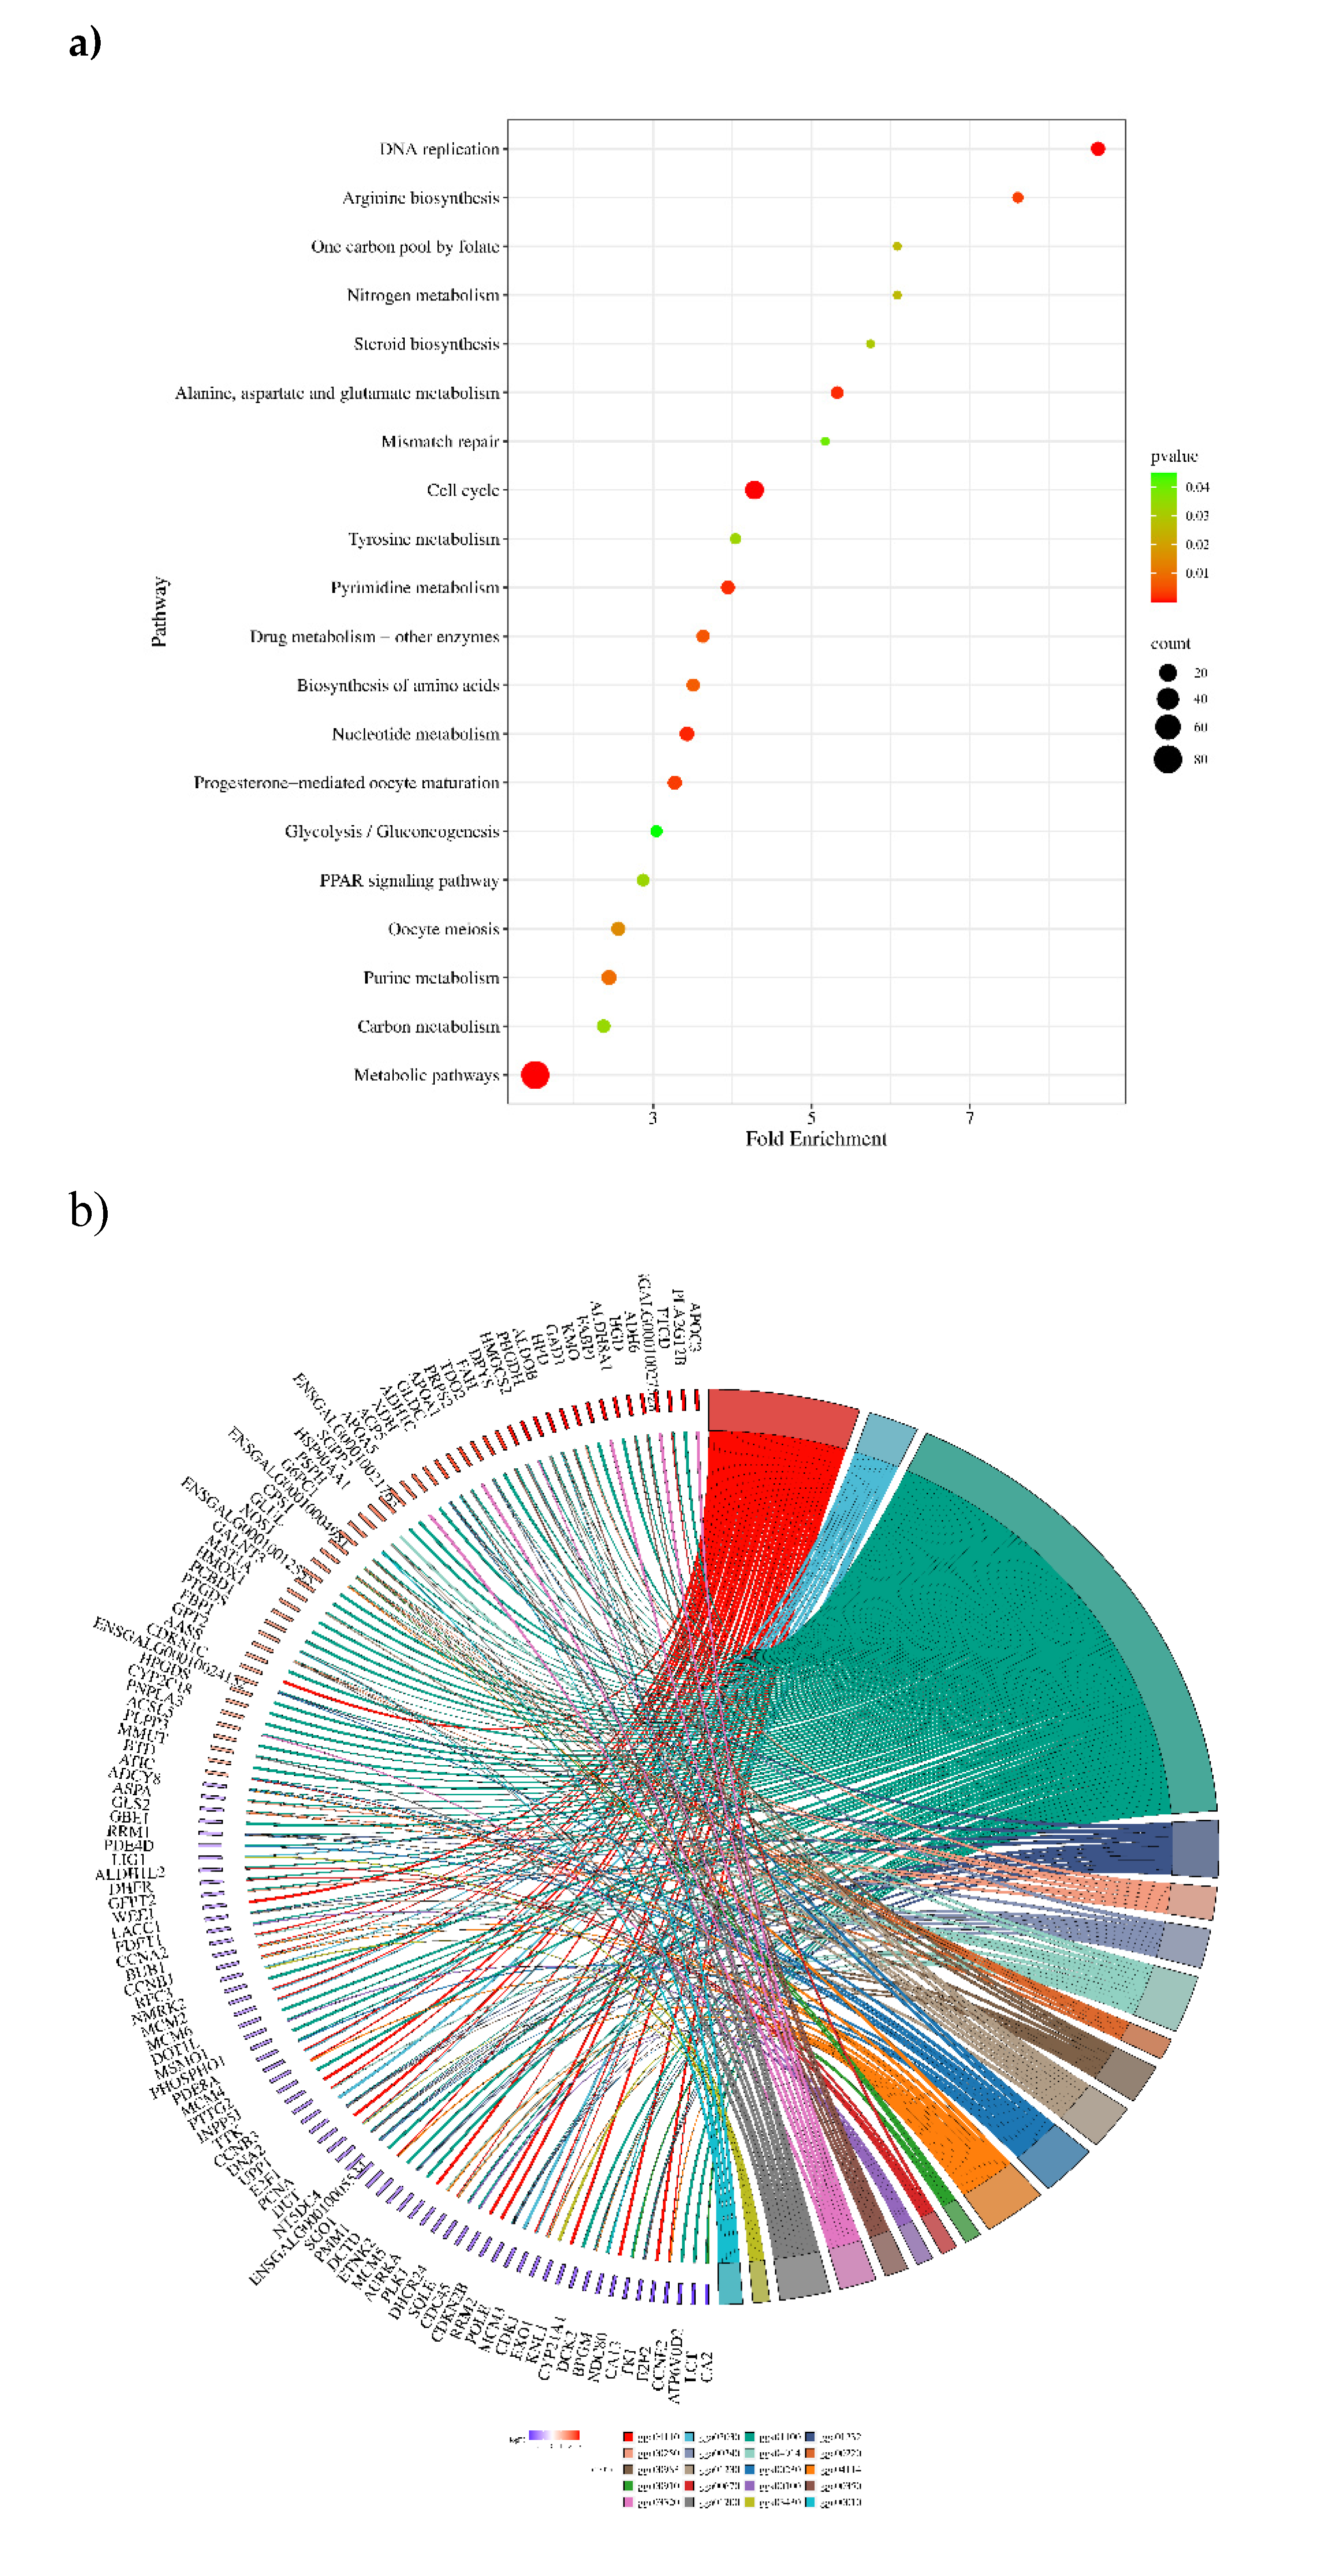
Out of a total of 209 genes, 117 were found to be significantly involved (p < 0.05) in 20 KEGG pathways with the fold enrichment ranges from 1.5 to 8.6. Among these, the Cell Cycle (gga04110), DNA Replication (gga03030), and Metabolic (gga01100) pathways showed a particularly high level of significance (p < 0.001) and included a greater number of genes (80 count), all with a low false discovery rate (FDR < 0.001). Additionally, highly significant (p < 0.01) metabolic pathways were identified, including gga01232 (Nucleotide metabolism), gga00250 (Alanine, aspartate, and glutamate metabolism), gga00240 (Pyrimidine metabolism), gga04914 (Progesterone-mediated oocyte maturation), gga00220 (Arginine biosynthesis), gga00983 (Drug metabolism - other enzymes), gga01230 (Biosynthesis of amino acids), and gga00230 (Purine metabolism). Figure 12. show the relationship bewteen KEGG term, genes and fold enrichment level.
The analysis of metabolic pathway genes revealed significant alterations in gene expression in infected chicken embryos due to NDV infection. Several genes were markedly downregulated, including CA2 (-2.60 Log FC), LCT (-2.52 Log FC), ATP6V0D2 (-2.44 Log FC), TK1 (-2.11 Log FC), CA13 (-2.10 Log FC), BPGM (-2.06 Log FC), DCK2 (-1.99 Log FC), CYP21A1 (-1.96 Log FC), RRM2 (-1.75 Log FC), SQLE (-1.62 Log FC), and DHCR24 (-1.57 Log FC) Conversely, a set of genes exhibited notable upregulation: ACP5 (2.05 log FC), XDH (2.15 log FC), ADH1C (2.48 log FC), GLDC (2.52 log FC), PRPS2 (2.66 log FC), TDO2 (2.74 log FC), FAH (2.79 log FC), DPYS (2.96 log FC), HMGCS2 (3.04 log FC), PHGDH (3.07 log FC), ALDOB (3.27 log FC), HPD (3.30 log FC), GAD1 (3.82 log FC), KMO (3.84 log FC), ALDH8A1 (4.27 log FC), HGD (4.47 log FC), ADH6 (5.65 log FC), FTCD (5.85 log FC), and PLA2G12B (6.58 log FC). These findings highlight significant disruptions in metabolic processes associated with NDV infection, underscoring the profound impact of the virus on embryonic metabolism. In the cell cycle pathway, a total of 24 genes were involved, with only CDKN1C showing upregulation (-1.21 log FC). All other genes were downregulated (-2.35 to -1.14 log FC), indicating that NDV infection leads to disruptions in cell cycle regulation and growth in the infected embryos.

3.7. Protein-Protein Interaction (PPI)

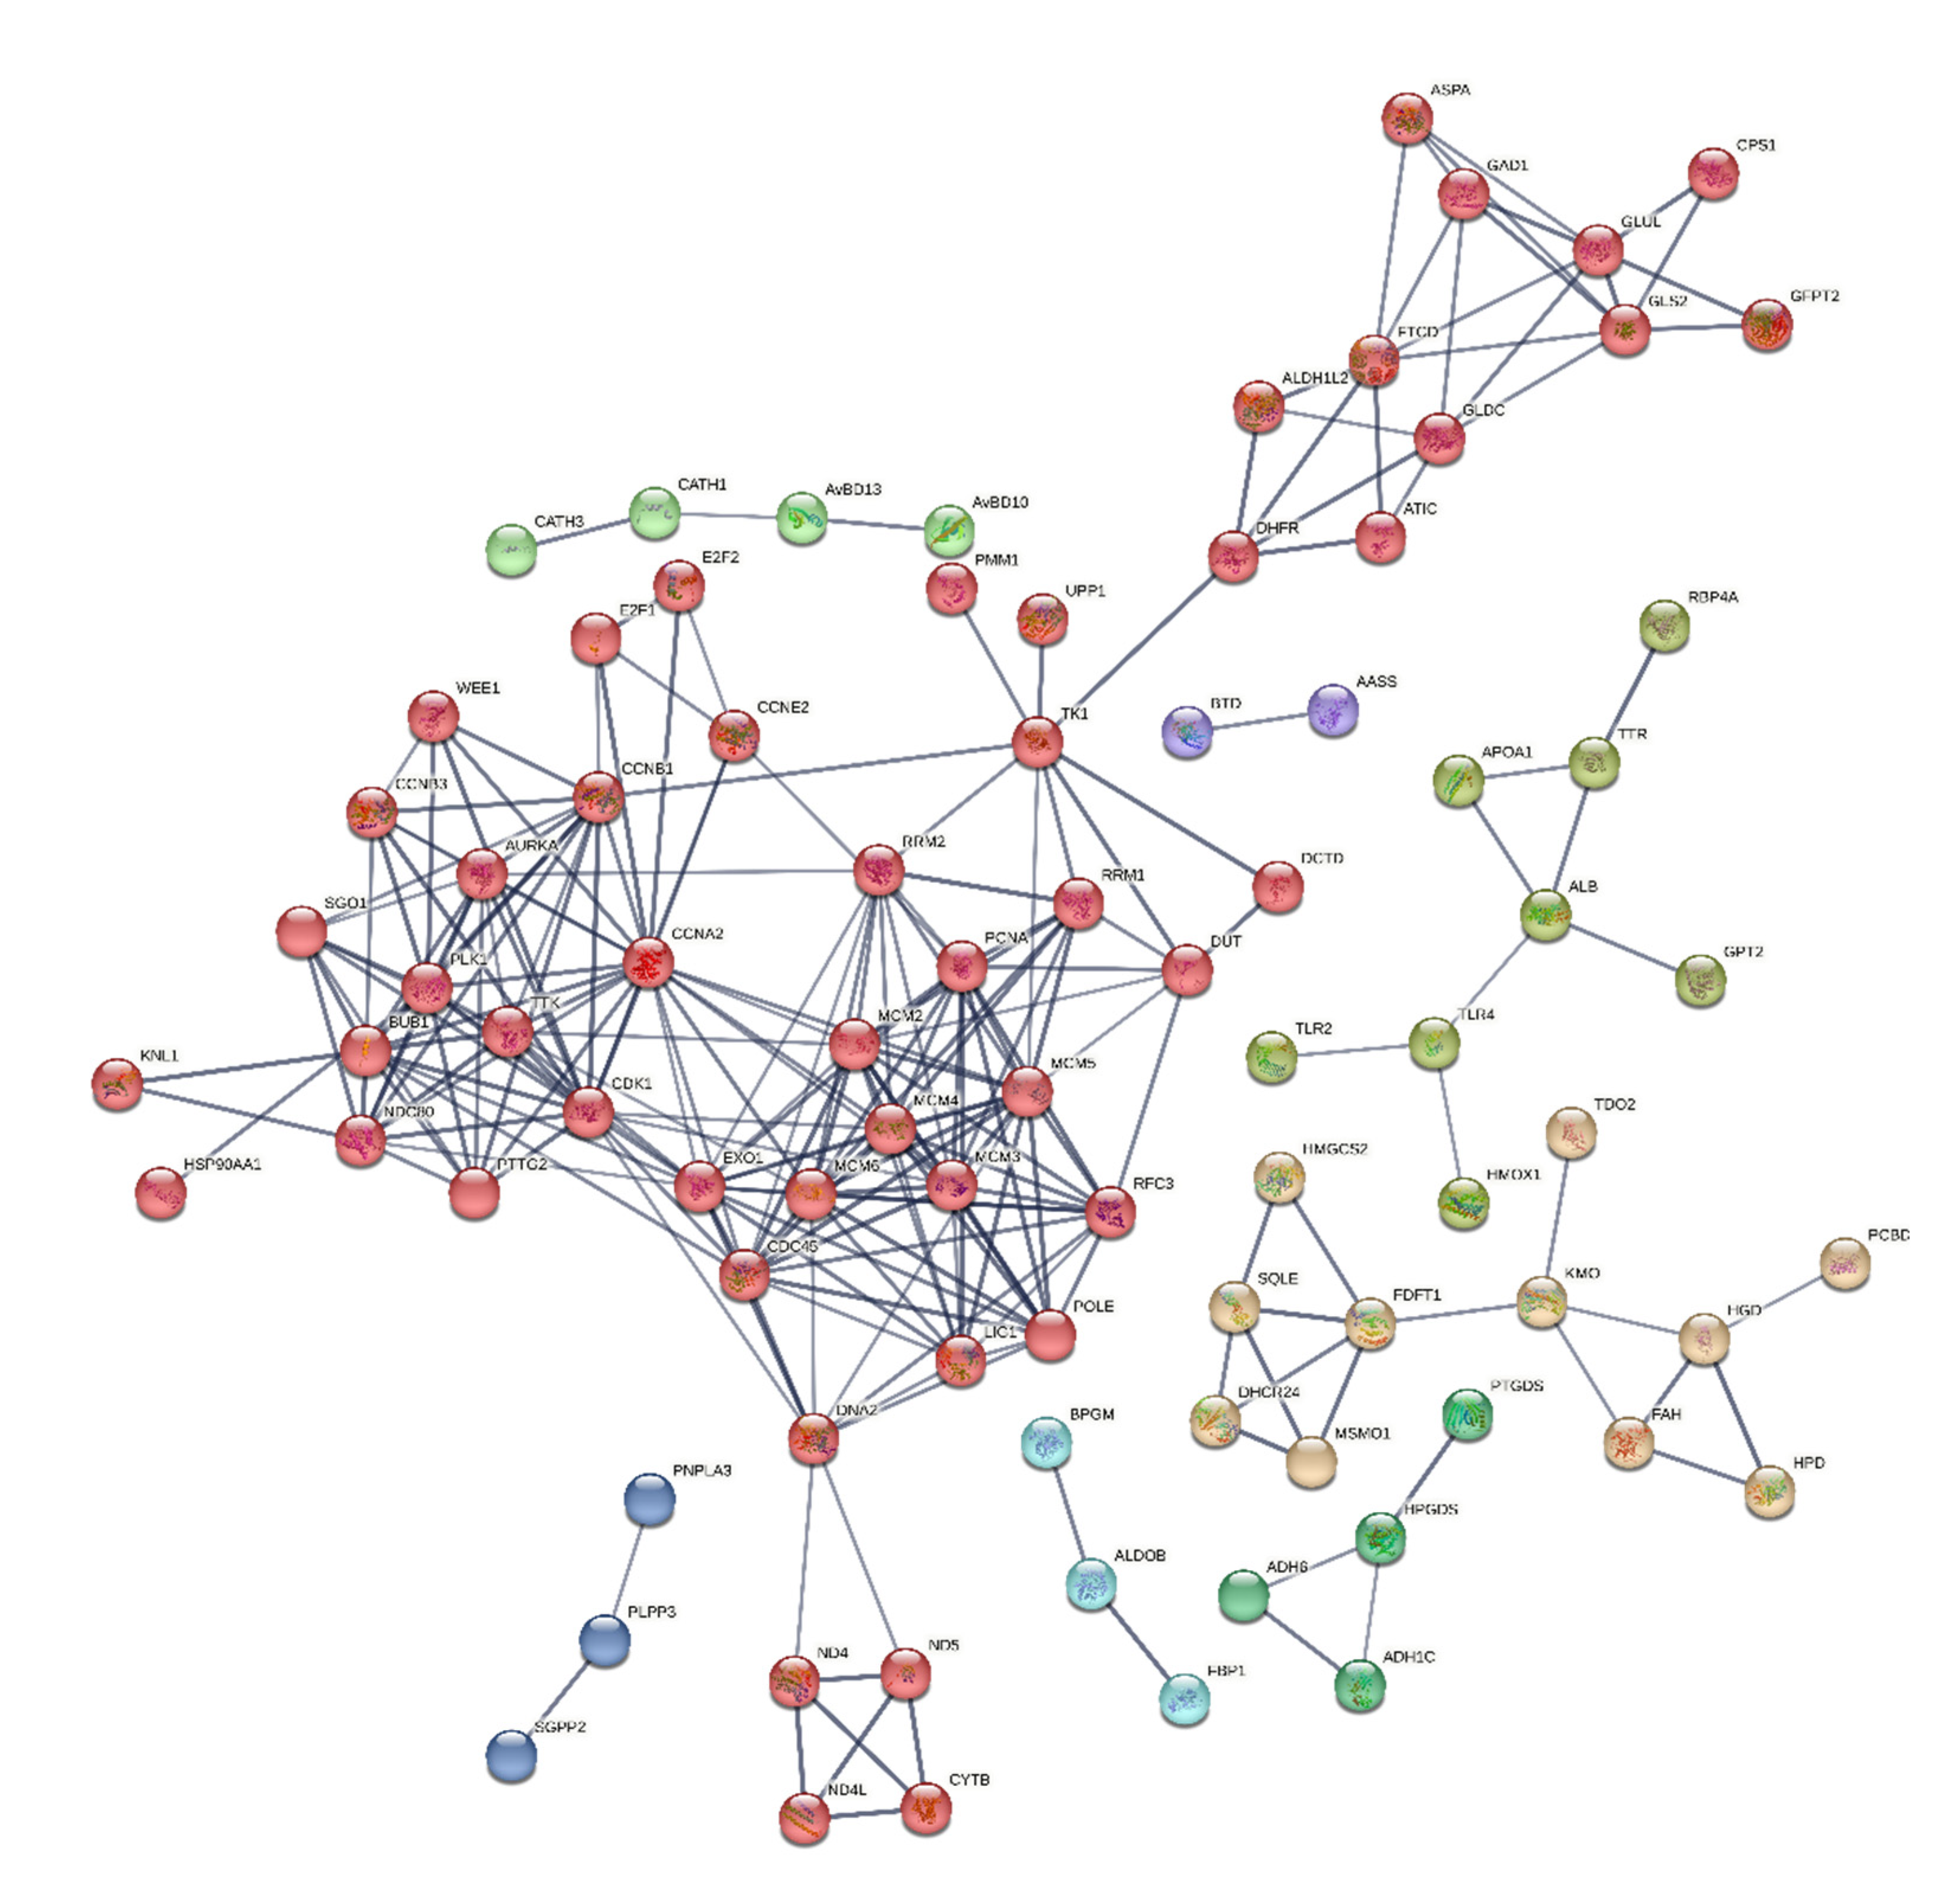
Protein-protein interactions (PPIs) were analyzed for selectively 150 genes using String (version 12.0) online bioinformatics tool with a minimum required interaction score set at the confidence level of 0.700. This analysis revealed that the proteins had more interactions among themselves than expected for a random set of proteins of the same size and degree distribution drawn from the genome. This enrichment indicates that the proteins are at least partially biologically connected as a group. The network consisted of 136 nodes and 244 edges, with an average node degree of 3.59. The average local clustering coefficient was predicted to be 0.452, and the expected number of edges in the PPI enrichment network was 46, with a p-value of less than 1.0e-16 and FDR<0.05. The k-mean clustering results showed that there were eight distinct clusters. A central area with a high density of connections may signify a fundamental cellular mechanism, such as transcription regulation or control of the cell cycle. Less connected peripheral nodes may be associated with more specialized roles or newly identified proteins with few known interactions, as depicted in Figure 13. Edges represent protein-protein associations, i.e. proteins jointly contribute to a shared function; this does not necessarily mean they are physically binding to each other. These include genes belonging to the RRM, CCN, TNF, HDP, CXC, IL, HSP, MCM and mitochondrial genes etc., were found to be interacting with each other significantly at (p<0.05). The module was significantly enriched for 198 biological processes, 3 Molecular function and 9 Cellular component GO terms, including regulation of Metabolic, Cell cycle, Nucleic acid metabolisms, Innate, Humoral, TLR signaling, cytokine signaling pathways.

4. Discussion

The present study utilized a global transcriptome analysis to investigate molecular events and gene expression patterns in lung of chicken embryos infected with Newcastle disease virus (NDV) across three different breeds. This approach allowed us to identify changes in gene expression linked to NDV infection and to examine candidate genes involved in the innate immune response of chicken embryo to the virus. By taking this comprehensive transcriptome-wide perspective, the study provides new insights into the host response to NDV infection and the complex interactions between the virus and its host. These findings contribute valuable information that can inform and guide future research efforts in this area. Our study investigated the dynamic gene expression changes induced in the lung by NDV at 24 hpi to understand the host response during viral infection in Aseel, Kadaknath and Commercial chicken embryo.
With the development of next-generation sequencing, transcriptome analyses have been performed for many bacterial and viral infection, such as Mycoplasma gallisepticum, Pasteurella multocida, laryngotracheitis, Duck Hepatitis A Virus, Fowl Adenovirus and Fowl Adenovirus [26,27,28,29,30,31]
The immune system of chickens has a direct impact on their health and plays a significant role in the farm economy, influenced by the genetic makeup of the flock [32]. RNA-Seq technology enables the detection of key genes associated with important traits such as disease and heat resistance [33,34] Consequently, high-throughput sequencing was conducted to assess the gene expression profiles of three chicken breeds with extreme phenotypes. This analysis aims to understand the potential differences in their immune and metabolic pathway that may be crucial in responding to Newcastle disease viral infection [1,35].

4.1. Differential Gene Expression Analysis

RNA-sequencing studies have shown that Chromosome 1 expresses the highest number of transcripts amonge the macrochromosomes in chicken embryos, underscoring its critical role in regulating gene expression during embryogenesis. Macrochromosomes such as chr1, chr2, chr3, chr4, chr5, chr6, chr7, chr8, chr9, and chrZ contain over 1,000 genes [36,37]. Another study reported a strong correlation between the size of chicken chromosomes and the abundance of lncRNAs and mRNAs (r = 0.9850 and 0.9677, respectively) [38,38], suggesting that transcript distribution is proportional to chromosome size. This relationship contributes to higher transcriptional activity in larger chromosomes during the developmental stages of chicken embryos [38,39]. When comparing the infected embryos of White Leghorn, Aseel, and Kadaknath to their respective control uninfected counterparts, no significant differences were observed in DEGs across the infected embryos at 24 hours post-infection (hpi) within each breed. However, when analyzing all infected embryos collectively against all uninfected embryos, regardless of breed, significant differences in DEGs were identified. This suggests that a broader comparison reveals notable changes in gene expression associated with the infection.
At two days post-infection (dpi), a large number of DEGs were found in the lungs of NDV-infected Fayoumi chickens, with 122 DEGs being noticeably elevated. The C8A gene is significantly upregulated in infected embryos and encodes a protein that is part of the complement membrane attack complex (MAC). This complex plays a crucial role in the immune defense mechanism against invading microorganisms and infected host cells [40]. In a study similar to the one mentioned, researchers found that the genes FGG, FGA, TNIP3, and IL1R2 were predominantly involved in the immune response of broiler thymus tissue against lipopolysaccharide (LPS) challenge [41]. The cytokine signaling-related gene IL17REL and the phagosome maturation pathway-related genes NOX4, PRDX1, and RAB7B are important immune-related genes. [6]. Our results are contradicted by a previous research that found 389 DEGs in the lungs of chicken embryos infected with Mycoplasma gallisepticum, where 96.14% of the genes were upregulated and 3.86% of the genes were downregulated. [31]. In another research, 564 differentially expressed lncRNAs were observed in chickens infected with the parasite Eimeria tenella. Of these, lncRNA BTN3A2 was revealed to control the inflammatory response to coccidia infection [42].
In recent years, long non-coding RNAs (lncRNAs) have garnered significant attention, with numerous studies revealing their crucial roles in various physiological and pathological processes across different species [43,44]. While the functions of many lncRNAs are well-documented in humans and mice, 17 948 and 13,186 lncRNA genes respectively identified in each species, research on lncRNAs in domestic animals, particularly chickens, is still in its early stages [45,46]. Only 4,641 lncRNA genes were found in the Ensemble reference database in chickens, compared to 18,346 protein-coding genes [46]. It was also stated that, like other species, 79% of chicken lncRNAs are found in intergenic regions [47].
Among the three chicken breeds, five new transcripts ENSGALG00010002557, ENSGALG00010002584, ENSGALG00010003033, ENSGALG00010004529, and ENSGALG00010004839 have been identified with distinct expression patterns. All five transcripts were found to be downregulated in both infected and uninfected embryos of White Leghorn. Specifically, ENSGALG00010002557 was downregulated in both infected and uninfected embryos of Aseel also but strongly upregulated in both infected and control Kadaknath chicken embryos. The ENSGALG00010004529 transcript exhibited a similar expression pattern but was strongly upregulated in both infected and uninfected Aseel chicken embryos, contrasting with its downregulation in both infected and uninfected Kadaknath chicken embryos. According to the PANTHER (Protein Analysis Through Evolutionary Relationships) database [48], the ENSGALG00010002557 and ENSGALG00010002584 transcripts encode a protein with an Ig-like domain that binds to signal receptors and T cell receptors, playing roles in biological processes and the regulation of cytokine production (Mi et al., 2021). The other three transcripts ENSGALG00010003033, ENSGALG00010004529, and ENSGALG00010004839 are reported to encode long non-coding RNAs (lncRNAs) in the Ensemble database. These may be the one reason for that the indigenous chicken breeds Aseel and Kadaknath exhibit higher tolerance to NVD viral infection [7,11,49].
KLHL14 is highly expressed in uninfected White Leghorn embryo also and it was found to be in immune tissues, especially in B cells and involved in regulation of B cell regulation and stability [50]. A unique expression pattern was noticed in CYTB, CAV1, GATA3, HBBA, ND4, ND4L, and ND5 genes. CAV1, GATA3 gene transcripts were found to be low in White Leghorn embryo at all the conditions. The transcription factor GATA-3 is selectively expressed in Th2 cells and plays a critical role in Th2 differentiation and cytokines Interleukins (IL) expressions [51,52]. CYTB, HBBA, ND4, ND4L, and ND5 were significantly more abundant in Kadaknath chicken embryos, indicating breed specificity and presences of more mitochondria. Except for the HBBA gene, the other four genes [53,54,55]. Additionally, it was observed that the Kadaknath healthy embryo expressed the highest fold of ND (1, 2, and 6) genes, which is indicative of a higher amount of mitochondria. Similar to Kadaknath, it was shown that, in contrast to birds resistant to Marek’s disease (MD), the spleen of birds vulnerable to MD had much lower mitochondrial DNA levels throughout the transformation phase [56].
A recent study demonstrated that the chicken thymus exhibited significant and distinct expression of various innate immune genes, including NR1H4, RBM14, SLC26A6, SLC11A1, MASP2, CYBA, CATHB1, PTX3, MASP1, COLEC11, SOCS1L, OTOP1, COCH, TMEM173, CFD, APOA4, MIF, RARRES2, TRIM62, TKFC, SERPING1, HEXIM1, STAT2, FAU, NOP53, GFI1 and NLRX1. The responses of these genes were found to be conserved across different organisms [57]. The laryngotracheitis virus infection also caused differential expression of 789 genes in the lung cells of chicken embryos. These genes include those that regulate the cell cycle (cyclin B2, CDK1, and CKI3), the immune system (cytokines, chemokines, MHC, and NF), matrix metalloproteinases (MMPs), and cellular metabolism [26]. The increased expression of heat shock protein (HSP) genes, including HSPB8, HSPB9, HSPA2, and HSP90AA1, in the lungs of infected embryos as compared to control, uninfected chicken embryos, is one of the findings of the current study. Interestingly HSPB8 (P60), HSPA2 (HSP70) and HSP90AA1 genes were expressed highly in Kadaknath and followed by Aseel than White leghorn. Which indicated the heat tolerance of the indigenous breed [58,59]. The HSP70 family of heat shock proteins is the most conserved across a wide range of species [34,60,61].

4.2. GO and KEGG Pathwy Analysis

Gene Ontology (GO) terms are increasingly valuable for predicting protein functions, though the number of terms used can be quite large. When predicting non-classical secretory proteins in eukaryotes and prokaryotes, the most informative GO terms are those associated with subcellular localization. A ranking of GO terms in this context reveals that the top terms in both datasets during embryonic stage are associated with subcellular locations: GO:0005576 (extracellular region), GO:0005634 (nucleus), GO:0005737 (cytoplasm), GO:0005615 (extracellular space), GO:0016020 (membrane), GO:0005886 (plasma membrane) and GO:0008152 (metabolic process) [38,62]. Similarly, another study that highlighted a strong presence of the KEGG pathways gga01100 (metabolic pathways) and gga04110 (cell cycle) during the early embryonic stage [38]. This suggests that embryos grow more quickly and have a high amount of metabolic activity [63]. Whereas, the downregulation of the BPGM (bisphosphoglycerate mutase) gene in the glycolysis/gluconeogenesis pathway (gga00010) during infection in chickens can lead to various physiological consequences that may alter metabolic activity in the embryo [64]. Further, PPAR signaling pathway (gga03320) found to have higest expression of APOC3 gene which activly involved in lipid metabolism [65] and this pathway genes promotes adipocyte differentiation to enhance blood glucose uptake [66].
Pathway analysis had also highlighted the critical roles of cytokine production and Toll-like receptors (TLRs) in the immune response, particularly in recognizing pathogen-associated molecular patterns (PAMPs). Chicken TLRs have been shown to recognize a broad array of PAMPs, leading to enhanced immune responses. TLR21 in chickens can recognize immunostimulatory CpG-oligodeoxynucleotides, further emphasizing the role of TLRs in pathogen recognition [67,68]. The lung of a newly born chick was shown to have TLR21 transcript expression. TLR21 recognition is essential for activating innate immune cells, such as dendritic cells and natural killer (NK) cells, which release chemokines and cytokines to fight infections [67,68,69].
Cytokines are another important component of the immune system, acting as soluble extracellular proteins and glycoproteins that regulate intercellular interactions. They have a substantial pleiotropic effect on mobilizing cells engaged in both innate and adaptive immune responses, influencing processes such as inflammation, cell proliferation, cell differentiation, apoptosis, angiogenesis, and tissue repair to restore homeostasis. Cytokines allow communication and coordination between immune cells by acting on particular receptors on target cells, organizing a comprehensive response to varied stresses and maintaing general health [70,71]. Human Extracellular Vesicles have higher quantities of 11 cytokines, including IFNγ, IL2, IL4, IL12p70, IL17, IL21, IL22, IL33, ITAC, TGFβ, and TNFα, compared to their free form in most systems [72]
In the context of chicken embryo development, pathway analysis has identified several key processes essential for the embryo’s rapid growth and maturation. These processes include chromosome organization, mitosis, DNA replication, mitochondrial activity, and the roles of the CMG (Cdc45-MCM-GINS) and MCM (Minichromosome Maintenance) complexes. These processes are likely crucial in cell cycle and multiplication occurring rapidly in the developing chicken embryo [73,74].
Numerous publications demonstrate the critical role that mitochondria and mtDNA play in the healthy embryonic development with aboundant copy number of mtDNA [75,76]. Similarly, pathways of current study also emphasized that there is increased mitochondrial activity during the embryonic stage, resulting in elevated ATP levels [63]. Where as chickens infected with MD virus, the ATP (6 and 8) genes, which encode subunits of Complex V, showed increased expression levels. On the other hand, the ND (1, 2, 3, 4, 4L, 5, and 6) genes, which encode subunits of NADH dehydrogenase (Complex I), exhibited decreased expression levels in lymphoid tissue [56]. The processing, stability, and upkeep of the mitochondrial genome depend on the genes DNA2, MGME1, and SLC25A4. Reduced numbers of mitochondrial copies are often the result of changes in these genes’ transcripts [56,77,78,79,80].
Although the immune system of a chick embryo is still immature, it possesses active defense mechanisms mediated by cytokines and natural antimicrobial peptides that effectively combat invading microbes. In this study, we found four Host Defense Peptides (HDPs), including AvBD10, AvBD13, CATH1, and CATH3, were highly expressed in infected chicken embryo lungs [31,81]. It has been observed that AvBDs and HDPs are expressed in different tissues, such as the bone marrow, multiple lymphoid organs, the respiratory system, and the gastrointestinal tract [81,82].
By analyzing 150 differentially expressed genes across various pathways, we constructed a protein–protein interaction network and identified several key genes: APOC3 from the PPAR signaling pathway [65], HGD, HMGCS2, HPD, and FAH from the steroid biosynthesis pathway, and ALDOB from the glycolysis pathway with higher topology scores ranges from 0.999 to 0.701. Further, PPI confirmed that the cyclin protein family, including CCNA2, CCNB1, CCNB3, and CCNE2, plays a crucial role in the regulation of the cell cycle by binding and activating cyclin-dependent kinases (CDKs), particularly CDK1 [83]. A recent report confirmed that the Gene Ontology functional enrichment analysis for the CDK1, CCNA2 and CCNB1 gene clusters and their neighboring genes primarily highlighted processes such as histone phosphorylation, chromosome segregation, regulation of ubiquitin protein ligase activity, organelle organization, cell division, and overall regulation of the cell cycle and nuclear division [84]. Similarly, MCM2–6 proteins are members of minichromosome maintenance (MCM) complex has a critical role in DNA synthesis during cell divition [85].
However, few studies have indicated that in-ovo microbial challenges are valuable for understanding the changes in cellular mechanisms during stress in newborn chicks. The findings from this research will support future investigations into metabolic, cellular, and immune signaling pathways, contributing to the development of more effective management strategies to enhance the health of chicken breeds.

5. Conclusion

This study investigated the differences in trascripte level between the embryos of the commercial layer and the indigenous chicken breeds in response to Newcastle Disease Virus (NDV) infection. The findings highlighted breed-specific gene expressions and provided insights into the genetic mechanisms behind variations in immune competence. While intensive selection for growth traits in commercial birds often compromises immune fitness, the high HSP protein expression in indigenous breeds offers a valuable model for improving productivity, disease resistance, and environmental adaptation, which are increasingly important due to rising global temperatures. Research has concurrently revealed that NDV infection significantly alters cellular, metabolic, mitochondrial, and mitotic activities. While this research has primarily focused on the molecular impact of NDV in embryos, it is crucial to conduct additional trials in live adult birds to gain a comprehensive understanding of the virus’s effects. Such studies are essential for effective management of the poultry sector and for addressing global food security challenges.

Author Contributions

Conceptualization, M.M. and A.K.T.; methodology, M.M., and A.K.T.; software, M.M.; validation, K.S., T.R.K and A.K.T..; formal analysis, A.K.T.; investigation, M.M.; resources, T.V., and V.G.; data curation, M.M. and A.K.T.; writing—original draft preparation, M.M., and A.K.T.; writing—review and editing, S.O.P., N.M., P.S., and K.S; supervision, A.K.T.; project administration, A.K.T.; funding acquisition, A.K.T.: All authors have read and agreed to the published version of the manuscript.

Funding

Please add: This research was funded by TANUVAS, India. (USO. No. 20652/A1/2020 and No.273/A1/2021, dated 26.02.2021 of Registrar, TANUVAS, Chennai – 51, India.)

Institutional Review Board Statement

The experiment was conducted with the approval of the Institutional Bio-safety Com-mittee (IBSC) of TANUVAS-Veterinary College and Research Institute, Namakkal, Tamil Nadu, India (Approval Lr. No. 1764/VCRI-NKL/IBSC/2022 dated 11.05.2022 of the Dean, VCRI, Namakkal) and Institutional Animal Ethical committee (IAEC) (Project proposal No. 09/VCRI-NKL/2023 dated 08.09.2023) of TANUVAS-Veterinary College and Research Institute, Namakkal, Tamil Nadu, India.

Informed Consent Statement

Not applicable.

Data Availability Statement

The data set created and analysed in the current study will be made available on reasonable request.

Acknowledgments

The authors gratefully acknowledge the support provided by the Tamil Nadu Veterinary and Animal Sciences University (TANUVAS), Chennai, Tamil Nadu, India Clevergene Biocorp Pvt. Ltd., Bengaluru 560043, India, for Sequencing facilities and Support.

Conflicts of Interest

The authors declare that the research was conducted in the absence of any commercial or financial relationships that could be construed as a potential conflict of interest..

References

  1. Wang, Y.; Saelao, P.; Chanthavixay, G.; Gallardo, R.A.; Wolc, A.; Fulton, J.E.; Dekkers, J.M.; Lamont, S.J.; Kelly, T.R.; Zhou, H. Genomic Regions and Candidate Genes Affecting Response to Heat Stress with Newcastle Virus Infection in Commercial Layer Chicks Using Chicken 600K Single Nucleotide Polymorphism Array. International Journal of Molecular Sciences 2024, 25, 2640. [Google Scholar] [CrossRef] [PubMed]
  2. Jaynudin, K.; Joshi, B.; Mathakiya, R.; Prajapati, K.; Sipai, S. Economic Impact of Genotype- Xiii Newcastle Disease Virus Infection on Commercial Vaccinated Layer Farms in India. International Journal of Livestock Research 2018, 8, 1. [Google Scholar] [CrossRef]
  3. Sharma, R.; Saran, S.; Yadav, A.S.; Kumar, S.; Verma, M.R.; Kumar, D.; Tyagi, J.S. Economic Losses Due to Newcastle Disease in Layers in Subtropical India. The Indian Journal of Animal Sciences 2023, 93, 422–426. [Google Scholar] [CrossRef]
  4. Bhadouriya, S.; Kapoor, S.; Krishan, B.; Chhabra, R. Isolation and Characterization of the Newcastle Disease Virus (NDV) of Haryana Region Based on F-Gene Sequence. 2018, 999–1003.
  5. Narayanan, M.S.; Parthiban, M.; Sathiya, P.; Kumanan, K. Molecular Detection of Newcastle Disease Virus Using Flinders Tehnology Associates-PCR. Vet. arhiv 2010. [Google Scholar]
  6. Saelao, P.; Wang, Y.; Chanthavixay, G.; Yu, V.; Gallardo, R.A.; Dekkers, J.C.M.; Lamont, S.J.; Kelly, T.; Zhou, H. Integrated Proteomic and Transcriptomic Analysis of Differential Expression of Chicken Lung Tissue in Response to NDV Infection during Heat Stress. Genes (Basel) 2018, 9, 579. [Google Scholar] [CrossRef]
  7. Radhika, R; Thiagarajan, D; Veeramani, P.; Karthickeyan, S.M.K. Aseel, Kadaknath and White Leghorn Chicken Immune Response to Variation in Sheep Red Blood Cell. Int. J. Pure App. Biosci. 2017, 5, 335–340. [Google Scholar] [CrossRef]
  8. Rout, P.K.; Pani, P.K.; Naithani, S. Genetic Susceptibility of Indigenous Chicks to Subgroup A Rous Sarcoma Virus Inoculated via the Chorioallantoic Membrane. Veterinary Immunology and Immunopathology 1992, 33, 89–102. [Google Scholar] [CrossRef]
  9. Yadav, S.P.; Kannaki, T.R.; Mahapatra, R.K.; Reddy, M.R.; Paul, S.S.; Bhattacharya, T.K.; Laxmi, N.A.; Jayakumar, S.; Chatterjee, R.N. Immunocompetence Profile of Indian Native vs Exotic Chicken Breeds. Indian Journal of Animal Research 2022, 1. [Google Scholar] [CrossRef]
  10. Zerjal, T.; Härtle, S.; Gourichon, D.; Guillory, V.; Bruneau, N.; Laloë, D.; Pinard-van der Laan, M.-H.; Trapp, S.; Bed’hom, B.; Quéré, P. Assessment of Trade-Offs between Feed Efficiency, Growth-Related Traits, and Immune Activity in Experimental Lines of Layer Chickens. Genetics Selection Evolution 2021, 53, 44. [Google Scholar] [CrossRef]
  11. Malarmathi, M.; Murali, N.; Selvaraju, M.; Sivakumar, K.; Gowthaman, V.; Raghavendran, V.B.; Raja, A.; Peters, S.O.; Thiruvenkadan, A.K. In Vitro Characterization of chIFITMs of Aseel and Kadaknath Chicken Breeds against Newcastle Disease Virus Infection. Biology 2023, 12, 919. [Google Scholar] [CrossRef]
  12. Gilbert, S.F. Developmental Biology, the Stem Cell of Biological Disciplines. PLoS Biol 2017, 15, e2003691. [Google Scholar] [CrossRef] [PubMed]
  13. Andrews, S. Babraham Bioinformatics - FastQC A Quality Control Tool for High Throughput Sequence Data. Available online: https://www.bioinformatics.babraham.ac.uk/projects/fastqc/ (accessed on 19 June 2024).
  14. Chen, S.; Zhou, Y.; Chen, Y.; Gu, J. Fastp: An Ultra-Fast All-in-One FASTQ Preprocessor. Bioinformatics (Oxford, England) 2018, 34. [Google Scholar] [CrossRef] [PubMed]
  15. Dobin, A.; Ca, D.; F, S.; J, D.; C, Z.; S, J.; P, B.; M, C.; Tr, G. STAR: Ultrafast Universal RNA-Seq Aligner. Bioinformatics (Oxford, England) 2013, 29. [Google Scholar] [CrossRef]
  16. Liao, Y.; Gordon, K.S. Wei Shi RNA-Seq Profiling between Commercial and Indigenous Iranian Chickens Highlights Differences in Innate Immune Gene Expression. Available online: https://www.mdpi.com/2073-4425/14/4/793 (accessed on 10 May 2024).
  17. Love, M.I.; Huber, W.; Anders, S. Moderated Estimation of Fold Change and Dispersion for RNA-Seq Data with DESeq2. Genome Biology 2014, 15, 550. [Google Scholar] [CrossRef]
  18. Yu, G.; Wang, L.-G.; Han, Y.; He, Q.-Y. clusterProfiler: An R Package for Comparing Biological Themes Among Gene Clusters. OMICS : a Journal of Integrative Biology 2012, 16, 284. [Google Scholar] [CrossRef] [PubMed]
  19. Luo, W.; Brouwer, C. Pathview: An R/Bioconductor Package for Pathway-Based Data Integration and Visualization. Bioinformatics (Oxford, England) 2013, 29. [Google Scholar] [CrossRef]
  20. Walter W; F, S.-C.; M, R. GOplot: An R Package for Visually Combining Expression Data with Functional Analysis. Bioinformatics (Oxford, England) 2015, 31. [CrossRef]
  21. Ge, S.X.; Jung, D.; Yao, R. ShinyGO: A Graphical Gene-Set Enrichment Tool for Animals and Plants. Bioinformatics 2020, 36, 2628–2629. [Google Scholar] [CrossRef]
  22. Tang, D.; Chen, M.; Huang, X.; Zhang, G.; Zeng, L.; Zhang, G.; Wu, S.; Wang, Y. SRplot: A Free Online Platform for Data Visualization and Graphing. PLOS ONE 2023, 18, e0294236. [Google Scholar] [CrossRef]
  23. Szklarczyk, D.; Kirsch, R.; Koutrouli, M.; Nastou, K.; Mehryary, F.; Hachilif, R.; Gable, A.L.; Fang, T.; Doncheva, N.T.; Pyysalo, S.; et al. The STRING Database in 2023: Protein-Protein Association Networks and Functional Enrichment Analyses for Any Sequenced Genome of Interest. Nucleic Acids Res 2023, 51, D638–D646. [Google Scholar] [CrossRef]
  24. Pfaf, M.W. A New Mathematical Model for Relative Quantification in Real-Time RT–PCR. Nucleic Acids Res 2001, 29, 45. [Google Scholar] [CrossRef]
  25. Livak, K.J.; Schmittgen, T.D. Analysis of Relative Gene Expression Data Using Real-Time Quantitative PCR and the 2(-Delta Delta C(T)) Method. Methods 2001, 25, 402–408. [Google Scholar] [CrossRef] [PubMed]
  26. Lee, J.Y.; Song, J.J.; Wooming, A.; Li, X.; Zhou, H.; Bottje, W.G.; Kong, B.-W. Transcriptional Profiling of Host Gene Expression in Chicken Embryo Lung Cells Infected with Laryngotracheitis Virus. BMC Genomics 2010, 11, 445. [Google Scholar] [CrossRef]
  27. Xie, J.; Zeng, Q.; Wang, M.; Ou, X.; Ma, Y.; Cheng, A.; Zhao, X.-X.; Liu, M.; Zhu, D.; Chen, S.; et al. Transcriptomic Characterization of a Chicken Embryo Model Infected With Duck Hepatitis A Virus Type 1. Front. Immunol. 2018, 9. [Google Scholar] [CrossRef]
  28. Chen, Y.; Huang, R.; Qu, G.; Peng, Y.; Xu, L.; Wang, C.; Huang, C.; Wang, Q. Transcriptome Analysis Reveals New Insight of Fowl Adenovirus Serotype 4 Infection. Front. Microbiol. 2020, 11. [Google Scholar] [CrossRef]
  29. Li, P.; He, F.; Wu, C.; Zhao, G.; Hardwidge, P.R.; Li, N.; Peng, Y. Transcriptomic Analysis of Chicken Lungs Infected With Avian and Bovine Pasteurella Multocida Serotype A. Front Vet Sci 2020, 7, 452. [Google Scholar] [CrossRef] [PubMed]
  30. Wang, X.P.; Wen, B.; Zhang, X.J.; Ma, L.; Liang, X.L.; Zhang, M.L. Transcriptome Analysis of Genes Responding to Infection of Leghorn Male Hepatocellular Cells With Fowl Adenovirus Serotype 4. Front Vet Sci 2022, 9, 871038. [Google Scholar] [CrossRef]
  31. Zou, M.; Wang, T.; Wang, Y.; Luo, R.; Sun, Y.; Peng, X. Comparative Transcriptome Analysis Reveals the Innate Immune Response to Mycoplasma Gallisepticum Infection in Chicken Embryos and Newly Hatched Chicks. Animals (Basel) 2023, 13, 1667. [Google Scholar] [CrossRef]
  32. Emam, M.; Mehrabani-Yeganeh, H.; Barjesteh, N.; Nikbakht, G.; Thompson-Crispi, K.; Charkhkar, S.; Mallard, B. The Influence of Genetic Background versus Commercial Breeding Programs on Chicken Immunocompetence. Poult Sci 2014, 93, 77–84. [Google Scholar] [CrossRef] [PubMed]
  33. Han, D.; Zhang, Y.; Chen, J.; Hua, G.; Li, J.; Deng, X.; Deng, X. Transcriptome Analyses of Differential Gene Expression in the Bursa of Fabricius between Silky Fowl and White Leghorn. Sci Rep 2017, 7, 45959. [Google Scholar] [CrossRef]
  34. Sadr, A.S.; Nassiri, M.; Ghaderi-Zefrehei, M.; Heidari, M.; Smith, J.; Muhaghegh Dolatabady, M. RNA-Seq Profiling between Commercial and Indigenous Iranian Chickens Highlights Differences in Innate Immune Gene Expression. Genes 2023, 14, 793. [Google Scholar] [CrossRef]
  35. Liu, W.; Xu, Z.; Qiu, Y.; Qiu, X.; Tan, L.; Song, C.; Sun, Y.; Liao, Y.; Liu, X.; Ding, C. Single-Cell Transcriptome Atlas of Newcastle Disease Virus in Chickens Both In Vitro and In Vivo. Microbiology Spectrum 2023, 11, e05121–22. [Google Scholar] [CrossRef] [PubMed]
  36. Huang, Z.; Xu, Z.; Bai, H.; Huang, Y.; Kang, N.; Ding, X.; Liu, J.; Luo, H.; Yang, C.; Chen, W.; et al. Evolutionary Analysis of a Complete Chicken Genome. Proc Natl Acad Sci U S A 120, e2216641120. [CrossRef]
  37. Ayers, K.L.; Davidson, N.M.; Demiyah, D.; Roeszler, K.N.; Grützner, F.; Sinclair, A.H.; Oshlack, A.; Smith, C.A. RNA Sequencing Reveals Sexually Dimorphic Gene Expression before Gonadal Differentiation in Chicken and Allows Comprehensive Annotation of the W-Chromosome. Genome Biology 2013, 14, R26. [Google Scholar] [CrossRef] [PubMed]
  38. Xu, Z.; Che, T.; Li, F.; Tian, K.; Zhu, Q.; Mishra, S.K.; Dai, Y.; Li, M.; Li, D. The Temporal Expression Patterns of Brain Transcriptome during Chicken Development and Ageing. BMC Genomics 2018, 19, 917. [Google Scholar] [CrossRef] [PubMed]
  39. Nie, H.; Crooijmans, R.; Bastiaansen, J.; Megens, H.-J.; Groenen, M. Regional Regulation of Transcription in the Chicken Genome. BMC genomics 2010, 11, 28. [Google Scholar] [CrossRef]
  40. Hadders, M.A.; Beringer, D.X.; Gros, P. Structure of C8α-MACPF Reveals Mechanism of Membrane Attack in Complement Immune Defense. Science 2007, 317, 1552–1554. [Google Scholar] [CrossRef]
  41. Monson, M.S.; Van Goor, A.G.; Persia, M.E.; Rothschild, M.F.; Schmidt, C.J.; Lamont, S.J. Genetic Lines Respond Uniquely within the Chicken Thymic Transcriptome to Acute Heat Stress and Low Dose Lipopolysaccharide. Sci Rep 2019, 9, 13649. [Google Scholar] [CrossRef]
  42. Yu, H.; Mi, C.; Wang, Q.; Dai, G.; Zhang, T.; Zhang, G.; Xie, K.; Zhao, Z. Long Noncoding RNA Profiling Reveals That LncRNA BTN3A2 Inhibits the Host Inflammatory Response to Eimeria Tenella Infection in Chickens. Front Immunol 2022, 13, 891001. [Google Scholar] [CrossRef]
  43. Kern, C.; Wang, Y.; Chitwood, J.; Korf, I.; Delany, M.; Cheng, H.; Medrano, J.F.; Van Eenennaam, A.L.; Ernst, C.; Ross, P.; et al. Genome-Wide Identification of Tissue-Specific Long Non-Coding RNA in Three Farm Animal Species. BMC Genomics 2018, 19, 684. [Google Scholar] [CrossRef]
  44. Karimi, P.; Bakhtiarizadeh, M.R.; Salehi, A.; Izadnia, H.R. Transcriptome Analysis Reveals the Potential Roles of Long Non-Coding RNAs in Feed Efficiency of Chicken. Sci Rep 2022, 12, 2558. [Google Scholar] [CrossRef]
  45. Kosinska-Selbi, B.; Mielczarek, M.; Szyda, J. Review: Long Non-Coding RNA in Livestock. Animal 2020, 14, 2003–2013. [Google Scholar] [CrossRef] [PubMed]
  46. Lagarrigue, S.; Lorthiois, M.; Degalez, F.; Gilot, D.; Derrien, T. LncRNAs in Domesticated Animals: From Dog to Livestock Species. Mamm Genome 2022, 33, 248–270. [Google Scholar] [CrossRef] [PubMed]
  47. Jehl, F.; Muret, K.; Bernard, M.; Boutin, M.; Lagoutte, L.; Désert, C.; Dehais, P.; Esquerré, D.; Acloque, H.; Giuffra, E.; et al. An Integrative Atlas of Chicken Long Non-Coding Genes and Their Annotations across 25 Tissues. Sci Rep 2020, 10, 20457. [Google Scholar] [CrossRef] [PubMed]
  48. Mi, H.; Ebert, D.; Muruganujan, A.; Mills, C.; Albou, L.-P.; Mushayamaha, T.; Thomas, P.D. PANTHER Version 16: A Revised Family Classification, Tree-Based Classification Tool, Enhancer Regions and Extensive API. Nucleic Acids Research 2021, 49, D394–D403. [Google Scholar] [CrossRef] [PubMed]
  49. Jaiswal, G.; Kumar, S.; Prasad, Y. Immunocompetence Traits and Their Inheritance Pattern in Kadaknath Native Chicken. Indian Journal of Animal Research 2014, 48, 509. [Google Scholar] [CrossRef]
  50. Choi, J.; Phelan, J.D.; Wright, G.W.; Häupl, B.; Huang, D.W.; Shaffer, A.L.; Young, R.M.; Wang, Z.; Zhao, H.; Yu, X.; et al. Regulation of B Cell Receptor-Dependent NF-κB Signaling by the Tumor Suppressor KLHL14. Proc Natl Acad Sci U S A 2020, 117, 6092–6102. [Google Scholar] [CrossRef]
  51. Lee, H.J.; Takemoto, N.; Kurata, H.; Kamogawa, Y.; Miyatake, S.; O’Garra, A.; Arai, N. Gata-3 Induces T Helper Cell Type 2 (Th2) Cytokine Expression and Chromatin Remodeling in Committed Th1 Cells. J Exp Med 2000, 192, 105–116. [Google Scholar] [CrossRef]
  52. Zheng, W.; Flavell, R.A. The Transcription Factor GATA-3 Is Necessary and Sufficient for Th2 Cytokine Gene Expression in CD4 T Cells. Cell 1997, 89, 587–596. [Google Scholar] [CrossRef]
  53. Attar, M.H.; Nassiri, M. Genetic Analysis of ND4 and ND4L Regions of Mitochondrial Genome in Khorasan Native Chickens. 2014.
  54. Bao, H.G.; Zhao, C.J.; Li, J.Y.; Wu, C. Association of MT-ND5 Gene Variation with Mitochondrial Respiratory Control Ratio and NADH Dehydrogenase Activity in Tibet Chicken Embryos. Anim Genet 2007, 38, 514–516. [Google Scholar] [CrossRef] [PubMed]
  55. Yacoub, H.A.; Fathi, M.M.; Sadek, M.A. Using Cytochrome b Gene of mtDNA as a DNA Barcoding Marker in Chicken Strains. Mitochondrial DNA 2015, 26, 217–223. [Google Scholar] [CrossRef]
  56. Chu, Q.; Ding, Y.; Cai, W.; Liu, L.; Zhang, H.; Song, J. Marek’s Disease Virus Infection Induced Mitochondria Changes in Chickens. International Journal of Molecular Sciences 2019, 20, 3150. [Google Scholar] [CrossRef]
  57. Guo, L.; Mu, Z.; Nie, F.; Chang, X.; Duan, H.; Li, H.; Zhang, J.; Zhou, J.; Ji, Y.; Li, M. Thymic Transcriptome Analysis after Newcastle Disease Virus Inoculation in Chickens and the Influence of Host Small RNAs on NDV Replication. Sci Rep 2021, 11, 10270. [Google Scholar] [CrossRef] [PubMed]
  58. Nawaz, A.H.; Lin, S.; Wang, F.; Zheng, J.; Sun, J.; Zhang, W.; Jiao, Z.; Zhu, Z.; An, L.; Zhang, L. Investigating the Heat Tolerance and Production Performance in Local Chicken Breed Having Normal and Dwarf Size. Animal 2023, 17, 100707. [Google Scholar] [CrossRef] [PubMed]
  59. Rachman, M.P.; Bamidele, O.; Dessie, T.; Smith, J.; Hanotte, O.; Gheyas, A.A. Genomic Analysis of Nigerian Indigenous Chickens Reveals Their Genetic Diversity and Adaptation to Heat-Stress. Sci Rep 2024, 14, 2209. [Google Scholar] [CrossRef]
  60. Beere, H.M. ‘The Stress of Dying’: The Role of Heat Shock Proteins in the Regulation of Apoptosis. Journal of Cell Science 2004, 117, 2641–2651. [Google Scholar] [CrossRef]
  61. Wang, L.; Yang, S.; Zhao, K.; Han, L. Expression Profiles of the Heat Shock Protein 70 Gene in Response to Heat Stress in Agrotis C-Nigrum (Lepidoptera: Noctuidae). J Insect Sci 2015, 15, 9. [Google Scholar] [CrossRef]
  62. Huang, W.-L. Ranking Gene Ontology Terms for Predicting Non-Classical Secretory Proteins in Eukaryotes and Prokaryotes. Journal of Theoretical Biology 2012, 312, 105–113. [Google Scholar] [CrossRef]
  63. de Lima, C.B.; dos Santos, É.C.; Ispada, J.; Fontes, P.K.; Nogueira, M.F.G.; dos Santos, C.M.D.; Milazzotto, M.P. The Dynamics between in Vitro Culture and Metabolism: Embryonic Adaptation to Environmental Changes. Sci Rep 2020, 10, 15672. [Google Scholar] [CrossRef]
  64. Van Every, H.A.; Schmidt, C.J. Transcriptomic and Metabolomic Characterization of Post-Hatch Metabolic Reprogramming during Hepatic Development in the Chicken. BMC Genomics 2021, 22, 380. [Google Scholar] [CrossRef] [PubMed]
  65. Kumar, H.; Choo, H.; Iskender, A.U.; Srikanth, K.; Kim, H.; Zhunushov, A.T.; Jang, G.W.; Lim, Y.; Song, K.-D.; Park, J.-E. RNA Seq Analyses of Chicken Reveals Biological Pathways Involved in Acclimation into Different Geographical Locations. Sci Rep 2020, 10, 19288. [Google Scholar] [CrossRef]
  66. WU, H.; LI, X.; SHEN, C. Peroxisome Proliferator-Activated Receptor γ in White and Brown Adipocyte Regulation and Differentiation. Physiol Res 2020, 69, 759–773. [Google Scholar] [CrossRef]
  67. Brownlie, R.; Zhu, J.; Allan, B.; Mutwiri, G.K.; Babiuk, L.A.; Potter, A.; Griebel, P. Chicken TLR21 Acts as a Functional Homologue to Mammalian TLR9 in the Recognition of CpG Oligodeoxynucleotides. Molecular Immunology 2009, 46, 3163–3170. [Google Scholar] [CrossRef] [PubMed]
  68. Chuang, Y.-C.; Tseng, J.-C.; Yang, J.-X.; Liu, Y.-L.; Yeh, D.-W.; Lai, C.-Y.; Yu, G.-Y.; Hsu, L.-C.; Huang, C.-M.; Chuang, T.-H. Toll-Like Receptor 21 of Chicken and Duck Recognize a Broad Array of Immunostimulatory CpG-Oligodeoxynucleotide Sequences. Vaccines 2020, 8, 639. [Google Scholar] [CrossRef] [PubMed]
  69. Nawab, A.; An, L.; Wu, J.; Li, G.; Liu, W.; Zhao, Y.; Wu, Q.; Xiao, M. Chicken Toll-like Receptors and Their Significance in Immune Response and Disease Resistance. International Reviews of Immunology 2019, 38, 284–306. [Google Scholar] [CrossRef]
  70. Barnes, B.J.; Somerville, C.C. Modulating Cytokine Production via Select Packaging and Secretion From Extracellular Vesicles. Front. Immunol. 2020, 11. [Google Scholar] [CrossRef]
  71. Henry, G.; Garner, W.L. Inflammatory Mediators in Wound Healing. Surgical Clinics of North America 2003, 83, 483–507. [Google Scholar] [CrossRef]
  72. Fitzgerald, W.; Freeman, M.L.; Lederman, M.M.; Vasilieva, E.; Romero, R.; Margolis, L. A System of Cytokines Encapsulated in ExtraCellular Vesicles. Sci Rep 2018, 8, 8973. [Google Scholar] [CrossRef] [PubMed]
  73. Kaur, G.; Balasubramaniam, S.D.; Lee, Y.J.; Balakrishnan, V.; Oon, C.E. Minichromosome Maintenance Complex (MCM) Genes Profiling and MCM2 Protein Expression in Cervical Cancer Development. Asian Pac J Cancer Prev 2019, 20, 3043–3049. [Google Scholar] [CrossRef]
  74. Seo, Y.-S.; Kang, Y.-H. The Human Replicative Helicase, the CMG Complex, as a Target for Anti-Cancer Therapy. Front Mol Biosci 2018, 5, 26. [Google Scholar] [CrossRef] [PubMed]
  75. Czernik, M.; Winiarczyk, D.; Sampino, S.; Gręda, P.; Parillo, S.; Modliński, J.A.; Loi, P. Mitochondrial Function and Intracellular Distribution Is Severely Affected in in Vitro Cultured Mouse Embryos. Sci Rep 2022, 12, 16152. [Google Scholar] [CrossRef]
  76. Maheshwari, A.; Peng, J.; Ramatchandirin, B.; Pearah, A.; He, L. Development and Functions of Mitochondria in Early Life. Newborn 2022, 1, 131–141. [Google Scholar] [CrossRef]
  77. Kaukonen, J.; Juselius, J.K.; Tiranti, V.; Kyttälä, A.; Zeviani, M.; Comi, G.P.; Keränen, S.; Peltonen, L.; Suomalainen, A. Role of Adenine Nucleotide Translocator 1 in mtDNA Maintenance. Science 2000, 289, 782–785. [Google Scholar] [CrossRef] [PubMed]
  78. Kornblum, C.; Nicholls, T.J.; Haack, T.B.; Schöler, S.; Peeva, V.; Danhauser, K.; Hallmann, K.; Zsurka, G.; Rorbach, J.; Iuso, A.; et al. Loss-of-Function Mutations in MGME1 Impair mtDNA Replication and Cause Multi-Systemic Mitochondrial Disease. Nat Genet 2013, 45, 214–219. [Google Scholar] [CrossRef] [PubMed]
  79. Ahmed, N.; Ronchi, D.; Comi, G.P. Genes and Pathways Involved in Adult Onset Disorders Featuring Muscle Mitochondrial DNA Instability. Int J Mol Sci 2015, 16, 18054–18076. [Google Scholar] [CrossRef] [PubMed]
  80. Thompson, K.; Majd, H.; Dallabona, C.; Reinson, K.; King, M.S.; Alston, C.L.; He, L.; Lodi, T.; Jones, S.A.; Fattal-Valevski, A.; et al. Recurrent De Novo Dominant Mutations in SLC25A4 Cause Severe Early-Onset Mitochondrial Disease and Loss of Mitochondrial DNA Copy Number. Am J Hum Genet 2016, 99, 860–876. [Google Scholar] [CrossRef]
  81. Jang, H.-J.; Monson, M.; Kaiser, M.; Lamont, S.J. Induction of Chicken Host Defense Peptides within Disease-Resistant and -Susceptible Lines. Genes (Basel) 2020, 11, 1195. [Google Scholar] [CrossRef]
  82. Cuperus, T.; Coorens, M.; van Dijk, A.; Haagsman, H.P. Avian Host Defense Peptides. Developmental & Comparative Immunology 2013, 41, 352–369. [Google Scholar] [CrossRef]
  83. Almalki, S.G. The Pathophysiology of the Cell Cycle in Cancer and Treatment Strategies Using Various Cell Cycle Checkpoint Inhibitors. Pathology - Research and Practice 2023, 251, 154854. [Google Scholar] [CrossRef]
  84. Xing, Z.; Wang, X.; Liu, J.; Zhang, M.; Feng, K.; Wang, X. Expression and Prognostic Value of CDK1, CCNA2, and CCNB1 Gene Clusters in Human Breast Cancer. J Int Med Res 2021, 49, 0300060520980647. [Google Scholar] [CrossRef]
  85. Kelman, L.M.; Kelman, Z. Replication | DNA Replication Fork, Eukaryotic. In Encyclopedia of Biological Chemistry III (Third Edition); Jez, J., Ed.; Elsevier: Oxford, 2013; pp. 63–66. ISBN 978-0-12-822040-5. [Google Scholar]
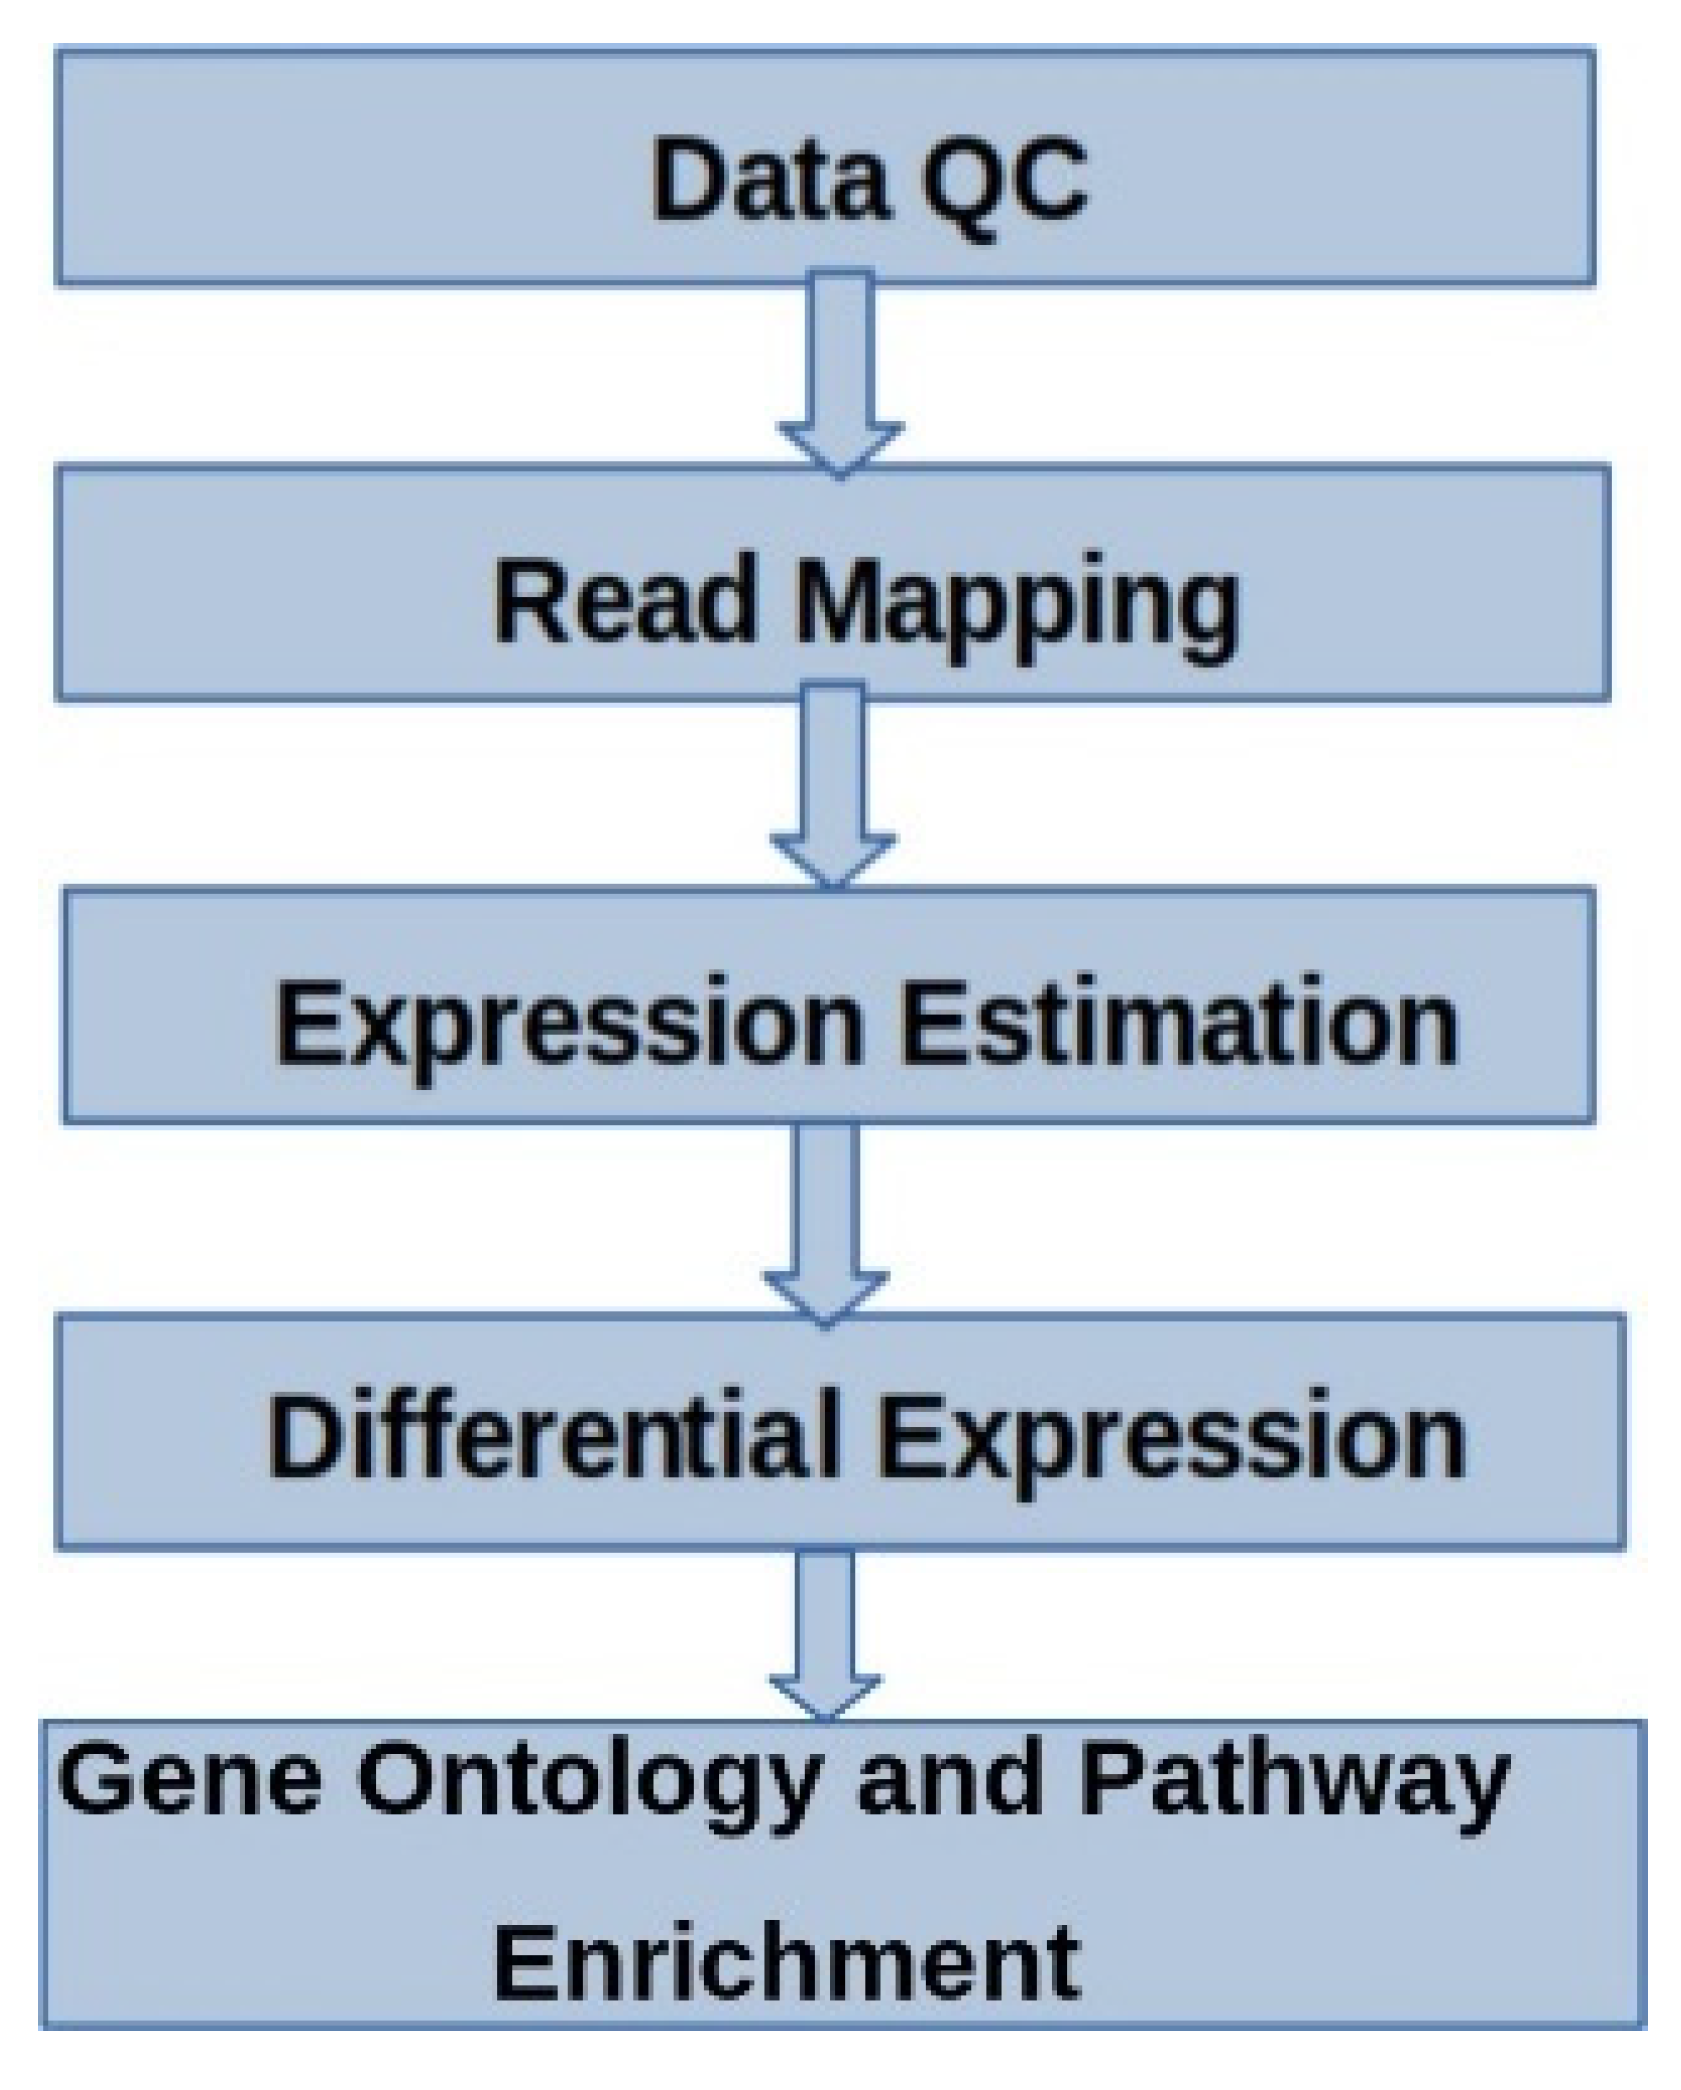
Figure 1. Data analysis workflow.
Preprints 118143 g001
Figure 2. Principal Component Analysis (PCA) plot of normalized gene expression. PCA is used to perform data reduction when there are a high number of variables (in this case genes). The algorithm will generate a few principle components which can account for the variation present in the variables. When the values of two major components (PC1, and PC2) are plotted, the samples that have similar variance will fall in the same plane of the graph. The X-axis represents PC1 and the Y-axis represents PC2. While reading the graph the % of variance the axis represents should be considered.
Preprints 118143 g002
Figure 3. illustrating the proportion of differently expressed genes from the respective chicken chromosomes. 3a) displays the amount of lnRNA and protein coding RNA, 3b) shows overall total amount of RNA from each chromosome, and 3c) displays quantity of transcripts had expressed from each chromosome.
Preprints 118143 g003
Figure 4. Bar diagram illustrating the proportionate number of exons (a) and transcripts (b) per gene.
Preprints 118143 g004
Figure 5. Volcano plot showing differential expression profile of genes. Blue indicates absolute log2 fold change ≥ 1 and p value ≤ 0.05. Red indicates absolute log2 fold change ≥1 and adjusted p value value ≤ 0.01. As first three comparisons didn’t have any significantly expressed genes, the graphical results are provided only for fouth comparison (1C,2C,3C vs 1T,2T,3T).
Preprints 118143 g005
Figure 6. Hierarchical cluster and expression profile of a) differently expressed 594 genes (p<0.002) and b) the highly significant (p<1E-07) differentially expressed top 100 genes across the samples. The heat maps are generated from the normalized expression values of each sample for a given gene.
Preprints 118143 g006
Figure 7. Word cloud showing the transcription levels of several genes engaged in different metabolic pathways..The word cloud’s font sizes are proportionate to logFC at (p<0.05) in an infected embryo compared to control.
Preprints 118143 g007
Figure 8. A bar graphic depicts the five transcripts that were chosen at random and validated by RT-qPCR. The fold change indicates the variation in transcript amount between infected and control samples.
Preprints 118143 g008
Figure 9. Control vs Treated (COMP4) Bubble plot of the overrepresented GO terms using significantly expressed genes. The orange line represents the p-value threshold (Benjamini-Hochberg p-value 0.05). The size of the bubble is proportionate to the number of genes involved in the GO term.
Preprints 118143 g009
Figure 10. The Lollypop graph displays the results of the Functional fold enrichment study conducted on the target genes of predicted known RNAs pertaining to various different (a) Biological, (b) Metabolically and (c) Cellular processes.
Preprints 118143 g010aPreprints 118143 g010b
Figure 11. A hierarchical clustering tree of (a) Biological, (b) Metabolically and (c) Cellular processes, summarizes the correlation among significant pathways listed in the Enrichment tab. Pathways with many shared genes are clustered together. Bigger dots indicate more significant P-values.
Preprints 118143 g011
Figure 12. KEGG Pathway enrichment analysis of transcripts with differential expression against NDV. (a) A bubble graphic illustrates the degree of enrichment and the number of genes in KEGG pathway. The top 20 significant KEGG keywords in metabolic processes are displayed in a chord plot (b).
Preprints 118143 g012
Figure 13. Potential networks of protein interactions encoded by genes related to different biological and cellular mechanics of cell functions. We drew the interaction networks using STRING: functional protein association networks (https://string-db.org). Proteins with known or projected three-dimensional structures have clusters indicated by their colour.
Preprints 118143 g013
Table 1. List of primers used for validation of RNA sequencing result.
Gene Name Primer sequence Product size
Forward Primer Reverse Primer
TLR2 CAAGACCTACCTGGAGTGGC GGATGGCTACAGTCTCCATTTT 116
TRIM14 GATTGGTGCAGCCTACCCTT TCTCCCCCTTGTGAAATGCC 128
IL1R2 TTCCCTCGCTCTTCTTCCCATTT ATGGTGTGATCTGGGCAGTTT 137
NOS1 ATGCACAAACAGCAGGGAGT CCAGGACAGGGATTGGGTTG 196
GATA3 CCTTTGGACCTCACCATCCC AAGCATTCAGCAGGGGAGTC 72
β-Actin TATGTGCAAGGCCGGTTTC TGTCTTTCTGGCCCATACCAA 110
Table 2. Summary of Raw sequence data and quality.
Sample ID Total reads q20 rate q30 rate GC content
Aseel control 11712582 0.956 0.906 0.518
Aseel infected 19473512 0.959 0.911 0.520
Kadaknath control 27264370 0.958 0.907 0.549
Kadaknath infected 22294792 0.962 0.917 0.526
White Leghorn control 45866934 0.953 0.892 0.588
White Leghorn infected 27691980 0.957 0.910 0.532
Table 3. Read alignment statistics.

Sample ID
QC Passed
Reads
Unique
Mapped %
Multi
Mapped %
Unmapped %
Aseel control 9665406 88.71 1.77 9.53
Aseel infected 16400020 88.81 1.71 9.48
Kadaknath control 20680458 86.49 1.98 11.53
Kadaknath infected 19415268 89.71 1.69 8.6
White Leghorn control 31375608 88.89 1.43 9.68
White Leghorn infected 23667448 88.2 1.69 10.11
Table 4. Number of expressed genes in each sample (genes with at least 1 mapped read).
Sample ID Total Number of Genes Expressed Genes
Aseel control 30108 17410
Aseel infected 30108 18733
Kadaknath control 30108 18502
Kadaknath infected 30108 18998
White Leghorn control 30108 20332
White Leghorn infected 30108 19915
Table 5. Number of transcripts expressed from each chromosome.
Chromosome No lncRNA Protein coding Total number of transcripts
Ch 1 8 72 80
Ch 2 7 52 59
Ch 3 2 42 44
Ch 4 3 49 52
Ch 5 2 34 36
Ch 6 3 30 33
Ch 7 1 19 20
Ch 8 1 18 19
Ch 9 3 15 18
Ch 10 0 15 15
Ch 11 3 12 15
Ch 12 1 10 11
Ch 13 2 13 15
Ch 14 0 7 7
Ch 15 0 12 12
Ch 16 0 8 8
Ch 17 1 7 8
Ch 18 2 8 10
Ch 19 2 9 11
Ch 20 0 8 8
Ch 21 0 6 6
Ch 22 0 6 6
Ch 23 1 6 7
Ch 24 2 8 10
Ch 25 0 6 6
Ch 26 0 8 8
Ch 27 0 12 12
Ch 28 0 7 7
Ch 30 0 2 2
Ch 31 0 4 4
Ch 34 0 5 5
Ch Z 6 26 32
Mitochondrial 0 8 8
Disclaimer/Publisher’s Note: The statements, opinions and data contained in all publications are solely those of the individual author(s) and contributor(s) and not of MDPI and/or the editor(s). MDPI and/or the editor(s) disclaim responsibility for any injury to people or property resulting from any ideas, methods, instructions or products referred to in the content.
Copyright: This open access article is published under a Creative Commons CC BY 4.0 license, which permit the free download, distribution, and reuse, provided that the author and preprint are cited in any reuse.
Prerpints.org logo

Preprints.org is a free preprint server supported by MDPI in Basel, Switzerland.

Subscribe

© 2024 MDPI (Basel, Switzerland) unless otherwise stated