1. Introduction
Table tennis, a sport renowned for its demand for precision, agility, and rapid decision-making, has long presented challenges for educators in terms of effective teaching methodologies. Traditional approaches often struggle to provide students with consistent, high-quality practice opportunities and immediate feedback, which are crucial for skill development in this fast-paced sport. In recent years, the integration of virtual reality (VR) technology into sports education has opened up new possibilities for enhancing the learning experience and outcomes in various disciplines, including table tennis [
1].
The global market for VR in education is projected to reach
$13.08 billion by 2026, growing at a CAGR of 42.9% from 2019 to 2026 [
34]. This rapid growth reflects the increasing recognition of VR’s potential to revolutionize teaching methodologies across various fields. In the context of sports education, VR offers unique advantages such as immersive environments, real-time feedback, and the ability to simulate competitive scenarios that are difficult to recreate in traditional training settings [
37].Table tennis, with its emphasis on spatial awareness, hand-eye coordination, and split-second decision-making, presents an ideal case for VR application. The sport’s complexity is evident in the fact that top players can generate ball speeds exceeding 69 mph and spin rates of up to 9,000 rpm [
35]. Such high-speed dynamics make it challenging for novice players to observe and learn techniques effectively through conventional methods. VR technology has the potential to slow down these movements, providing learners with a more detailed view of proper techniques and allowing for repeated practice in a controlled environment.
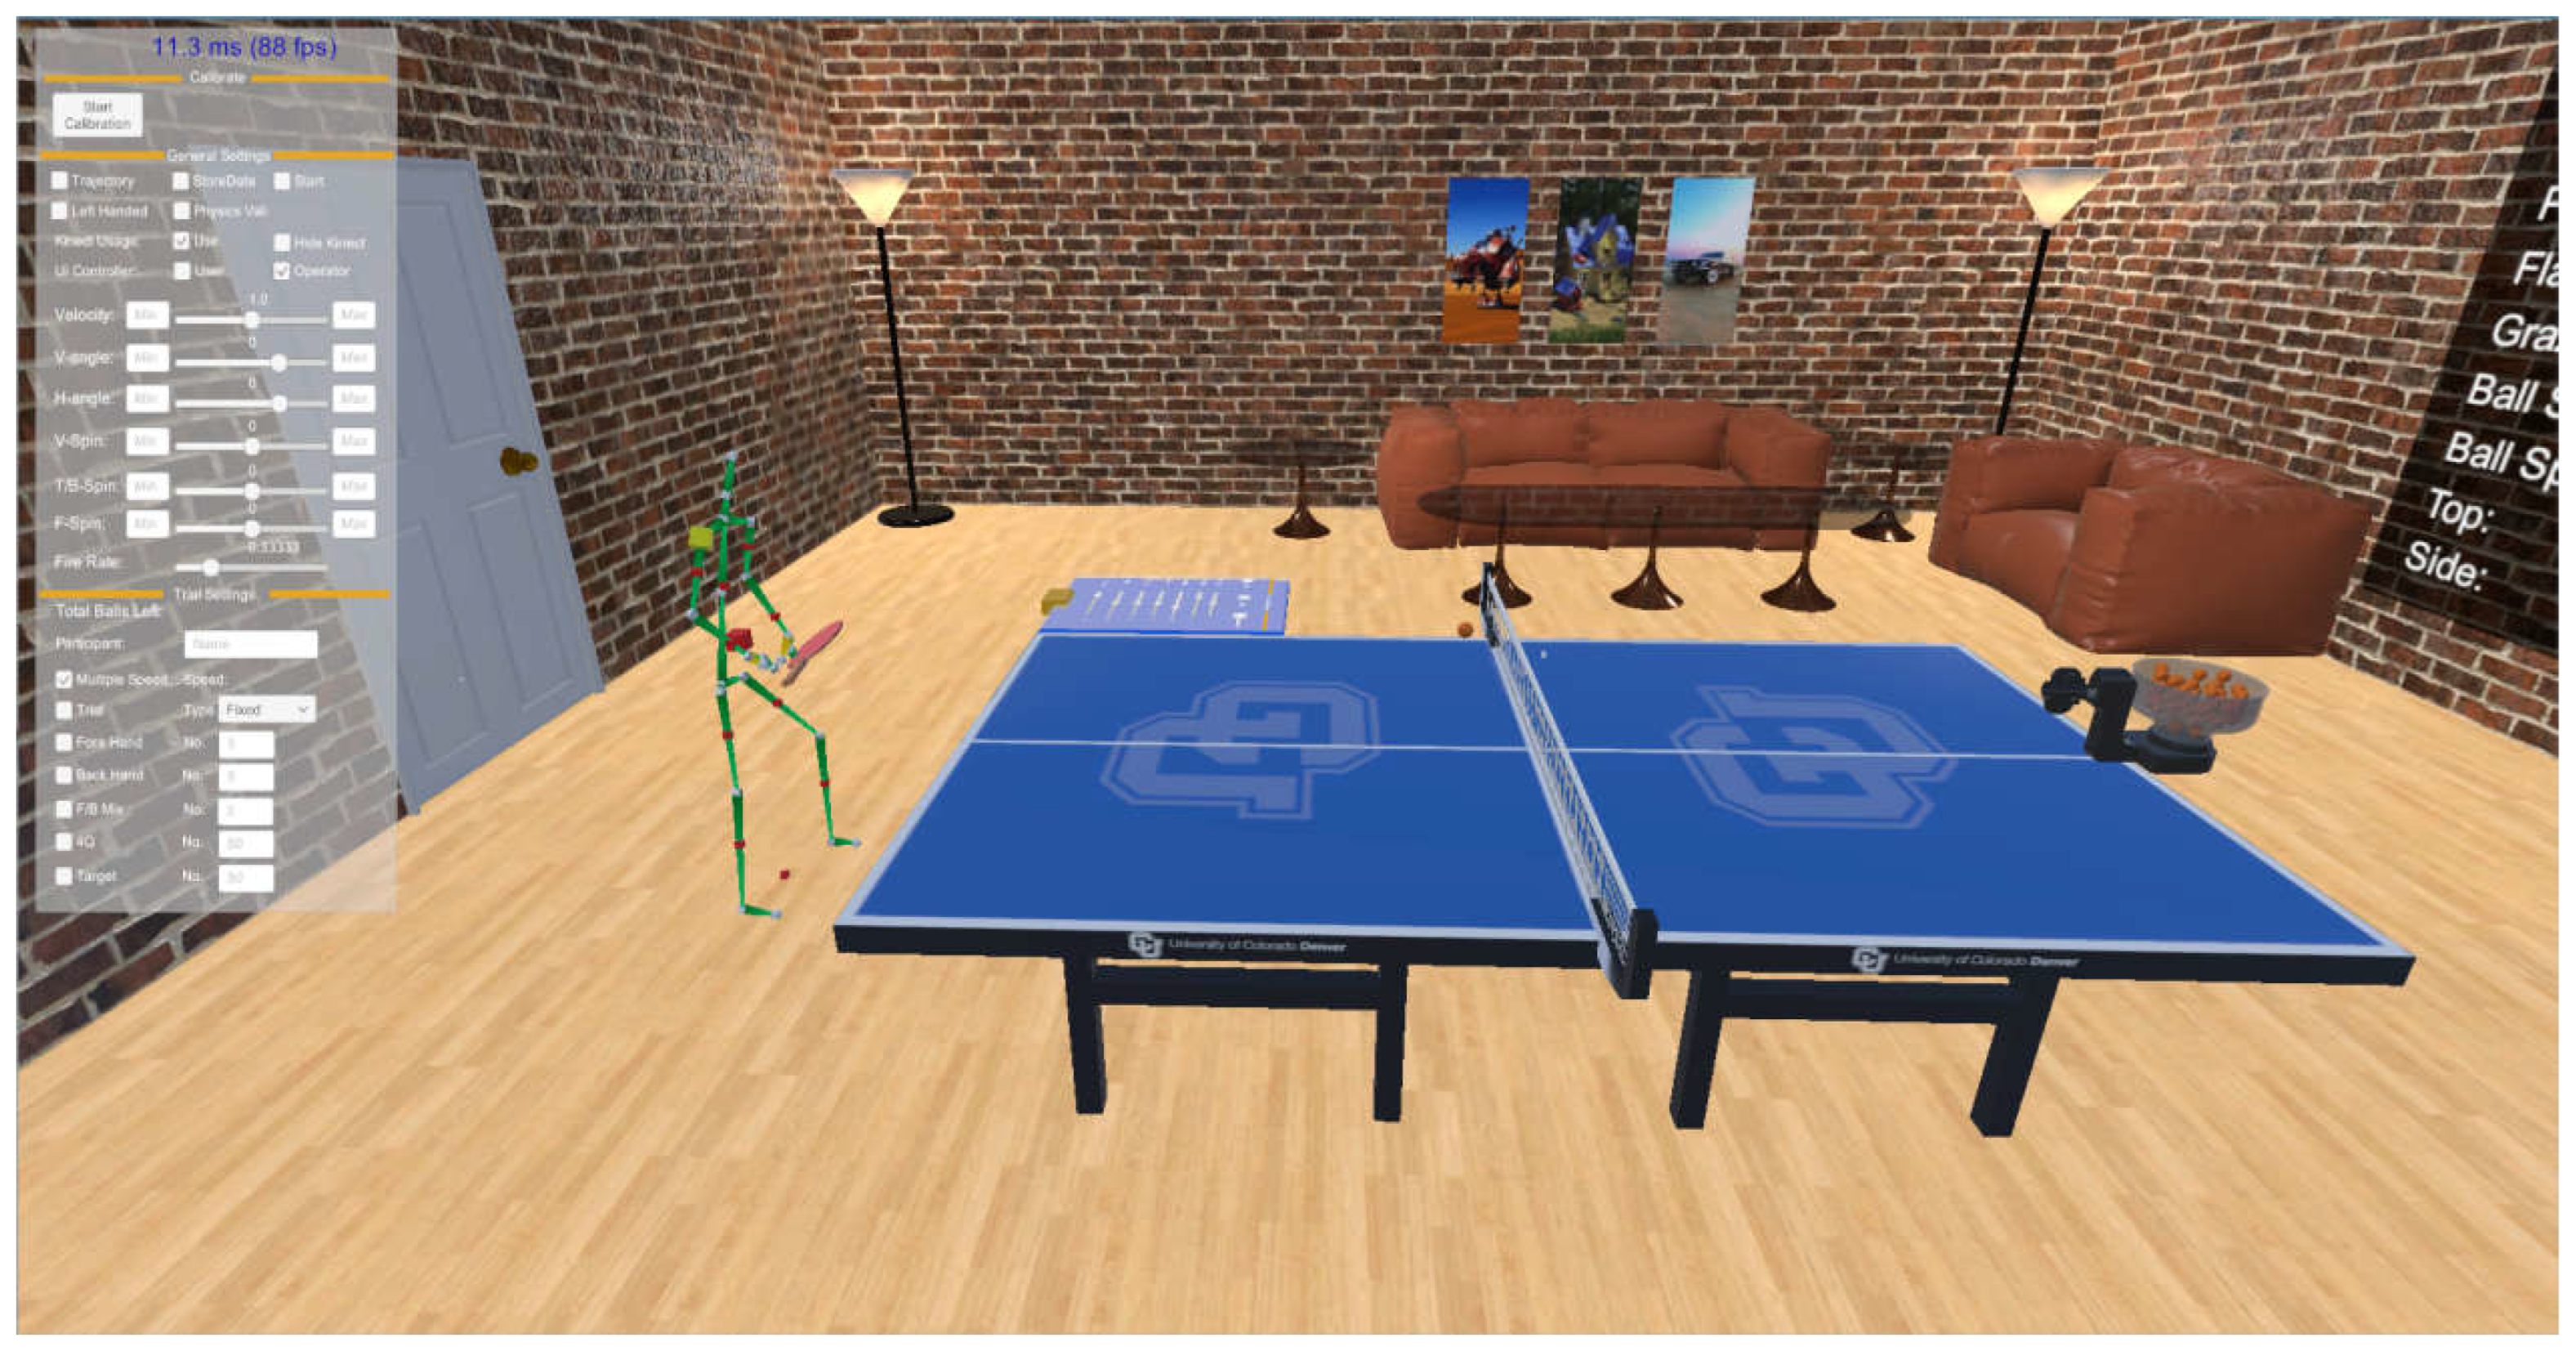
The potential of VR in table tennis education is vividly illustrated in
Figure 1, which showcases a virtual reality table tennis training environment. This setup demonstrates how VR can create a controlled, immersive space for players to practice their skills. In such an environment, learners can engage with a digitally rendered table tennis setup, complete with adjustable parameters for ball velocity, spin, and trajectory. This level of customization allows for tailored training experiences that can cater to various skill levels and specific learning objectives (see
Figure 1).
Previous studies have demonstrated the efficacy of VR in sports training. For instance, Gray (2017) found that baseball batters who trained using VR showed significant improvements in batting average compared to those who used traditional training methods [
10]. Similarly, Michalski et al. (2019) reported that VR-based training enhanced decision-making skills in soccer players [
21]. However, research specifically focusing on the application of VR in table tennis education remains limited, presenting a gap in our understanding of how this technology can be leveraged to improve teaching and learning outcomes in this particular sport.
The potential benefits of VR in table tennis education are numerous. It can provide a safe environment for beginners to practice without the fear of injury or embarrassment, offer instant feedback on technique and performance, and allow for the simulation of various play styles and competitive scenarios. Moreover, VR can potentially increase student engagement and motivation, factors that are crucial for effective learning. A study by Papachristos et al. (2014) found that 76% of students reported increased motivation when using VR in educational settings [
38].
Despite these potential advantages, the integration of VR technology in sports education also faces challenges. These include the high initial costs of VR equipment, the need for specialized technical knowledge among instructors, and potential issues related to motion sickness or discomfort during prolonged VR use [
36]. Additionally, there are concerns about whether skills learned in a virtual environment can effectively transfer to real-world performance.
Given these considerations, there is a clear need for comprehensive, empirical research to evaluate the effectiveness of VR technology in table tennis education. This study aims to address this gap by conducting a multi-center controlled trial comparing VR-assisted teaching methods with traditional approaches in table tennis education. By examining factors such as skill improvement, learning motivation, and student satisfaction, this research seeks to provide valuable insights into the potential of VR technology to enhance table tennis instruction and, more broadly, contribute to our understanding of innovative approaches in sports education.
2. Research Methodology
2.1. Research Design
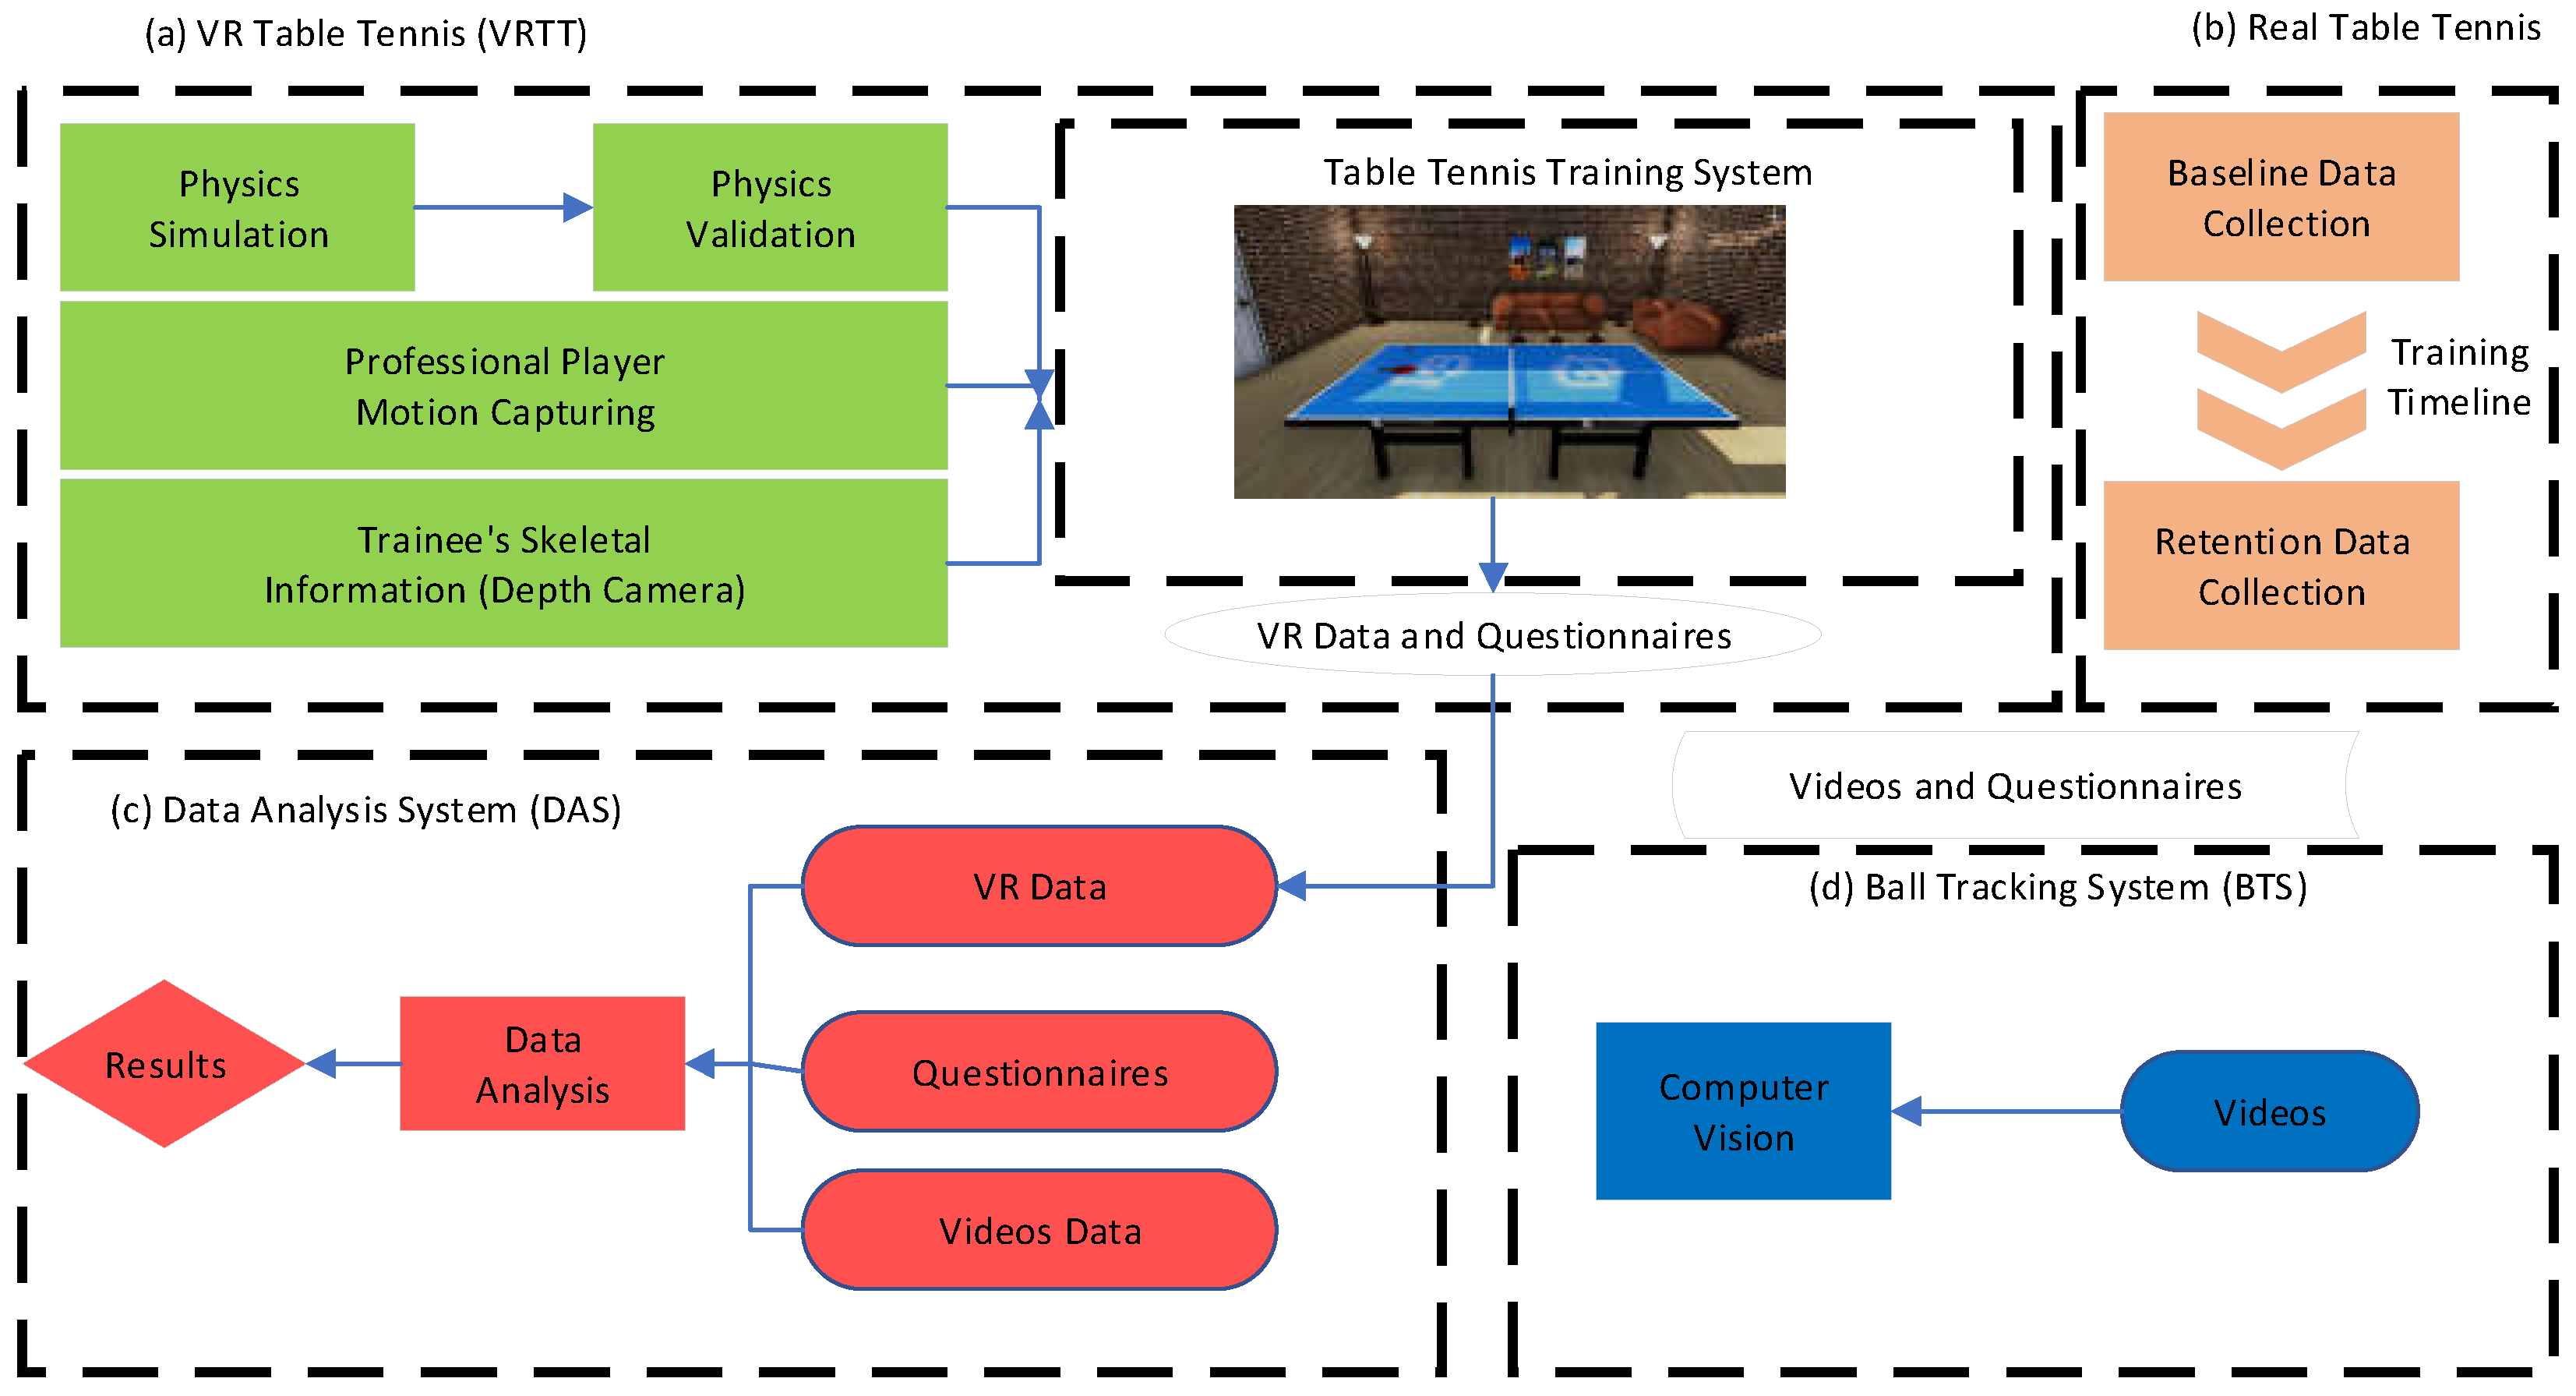
The study employs a comprehensive multi-component research design to evaluate the effectiveness of Virtual Reality Table Tennis (VRTT) training compared to traditional methods.
Figure 2 illustrates the integrated approach, encompassing four key components: (a) VRTT system, (b) Real Table Tennis training, (c) Data Analysis System (DAS), and (d) Ball Tracking System (BTS). The VRTT system incorporates physics simulations, professional player motion capture, and trainee skeletal information to create an immersive learning environment. Concurrently, real table tennis training serves as a control, allowing for comparative analysis. Data collection occurs through VR sessions, questionnaires, and video recordings, feeding into the DAS for comprehensive analysis. The BTS utilizes computer vision to track ball movements in real play, providing objective performance metrics. This holistic design enables a thorough examination of skill transfer, learning efficiency, and player engagement across virtual and real environments, offering insights into the potential of VR technology in table tennis education.
This research design facilitates a robust comparison between VRTT and traditional training methods, allowing for in-depth analysis of both quantitative performance data and qualitative user experiences.
2.2. Research Subjects
The study involved 120 participants from university table tennis clubs, equally divided between VR and traditional training groups. As detailed in
Table 1, subjects were carefully selected to ensure demographic balance and skill homogeneity. The age range of 18-30 years represented the target population for innovative training methods. Gender distribution was maintained at 50% for each group to control for potential physiological differences. Prior experience levels were categorized to ensure even distribution of novice, intermediate, and advanced players across both groups. Exclusion criteria included VR motion sickness history, uncorrected visual impairments, and recent injuries. This meticulous selection process facilitated a robust comparison between VR and traditional training effectiveness.
Table 1 provides a comprehensive overview of the demographic and skill characteristics of the research subjects, highlighting the balanced distribution between the VR and traditional training groups. This detailed breakdown ensures transparency in subject selection and facilitates replication of the study.
2.3. Intervention Measures
The study implemented a 12-week intervention program, comparing VR-based table tennis training with traditional methods. As outlined in
Table 2, both groups underwent structured training sessions, with the VR group utilizing a custom-developed VR table tennis simulator and the traditional group practicing on standard tables. The VR system incorporated advanced features such as real-time feedback, adaptive difficulty, and performance analytics. Training protocols were designed to be equivalent in duration and intensity across both groups, focusing on key skills like serve, return, forehand drive, backhand drive, and footwork. Periodic assessments were conducted to track progress and adjust training difficulty. This comprehensive approach ensured a fair comparison between VR and traditional training methodologies while leveraging the unique capabilities of VR technology.
Table 2 provides a detailed comparison of the intervention measures applied to both the VR and traditional training groups. It highlights the parallels in training structure while emphasizing the unique aspects of each approach, ensuring a comprehensive and fair evaluation of VR technology in table tennis education.
2.4. Data Collection
The study employed a multi-faceted approach to data collection, integrating both quantitative and qualitative methods. Performance metrics were gathered through the VR system’s built-in analytics for the experimental group, while high-speed cameras and motion sensors captured data for the traditional group. Both groups underwent standardized skills assessments at baseline, midpoint, and post-intervention, evaluating serve accuracy, return consistency, and rally endurance. Physiological data, including heart rate and energy expenditure, were monitored during sessions. Participants completed weekly questionnaires assessing perceived improvement, engagement levels, and overall satisfaction. Additionally, semi-structured interviews were conducted with a subset of participants from each group to gain deeper insights into their learning experiences. This comprehensive data collection strategy ensured a holistic evaluation of the effectiveness and impact of VR technology in table tennis training.
2.5. Statistical Analysis Methods
The study utilized a comprehensive statistical approach to analyze the collected data. Paired t-tests were employed to compare pre- and post-intervention performance metrics within each group, while independent t-tests assessed differences between the VR and traditional groups. Repeated measures ANOVA evaluated progression over time across multiple assessment points. For non-normally distributed data, non-parametric alternatives such as Wilcoxon signed-rank and Mann-Whitney U tests were applied. Effect sizes were calculated using Cohen’s d to quantify the magnitude of observed differences. Qualitative data from interviews underwent thematic analysis to identify recurring patterns and insights. Multiple regression analyses explored relationships between training modalities, participant characteristics, and performance outcomes. All statistical tests were conducted using SPSS software, with a significance level set at p < 0.05. This rigorous analytical approach ensured a thorough examination of the effectiveness of VR technology in table tennis training.
3. Results
3.1. Baseline Characteristics Comparison
The study commenced with a thorough comparison of baseline characteristics between the VR and traditional training groups to ensure comparability.
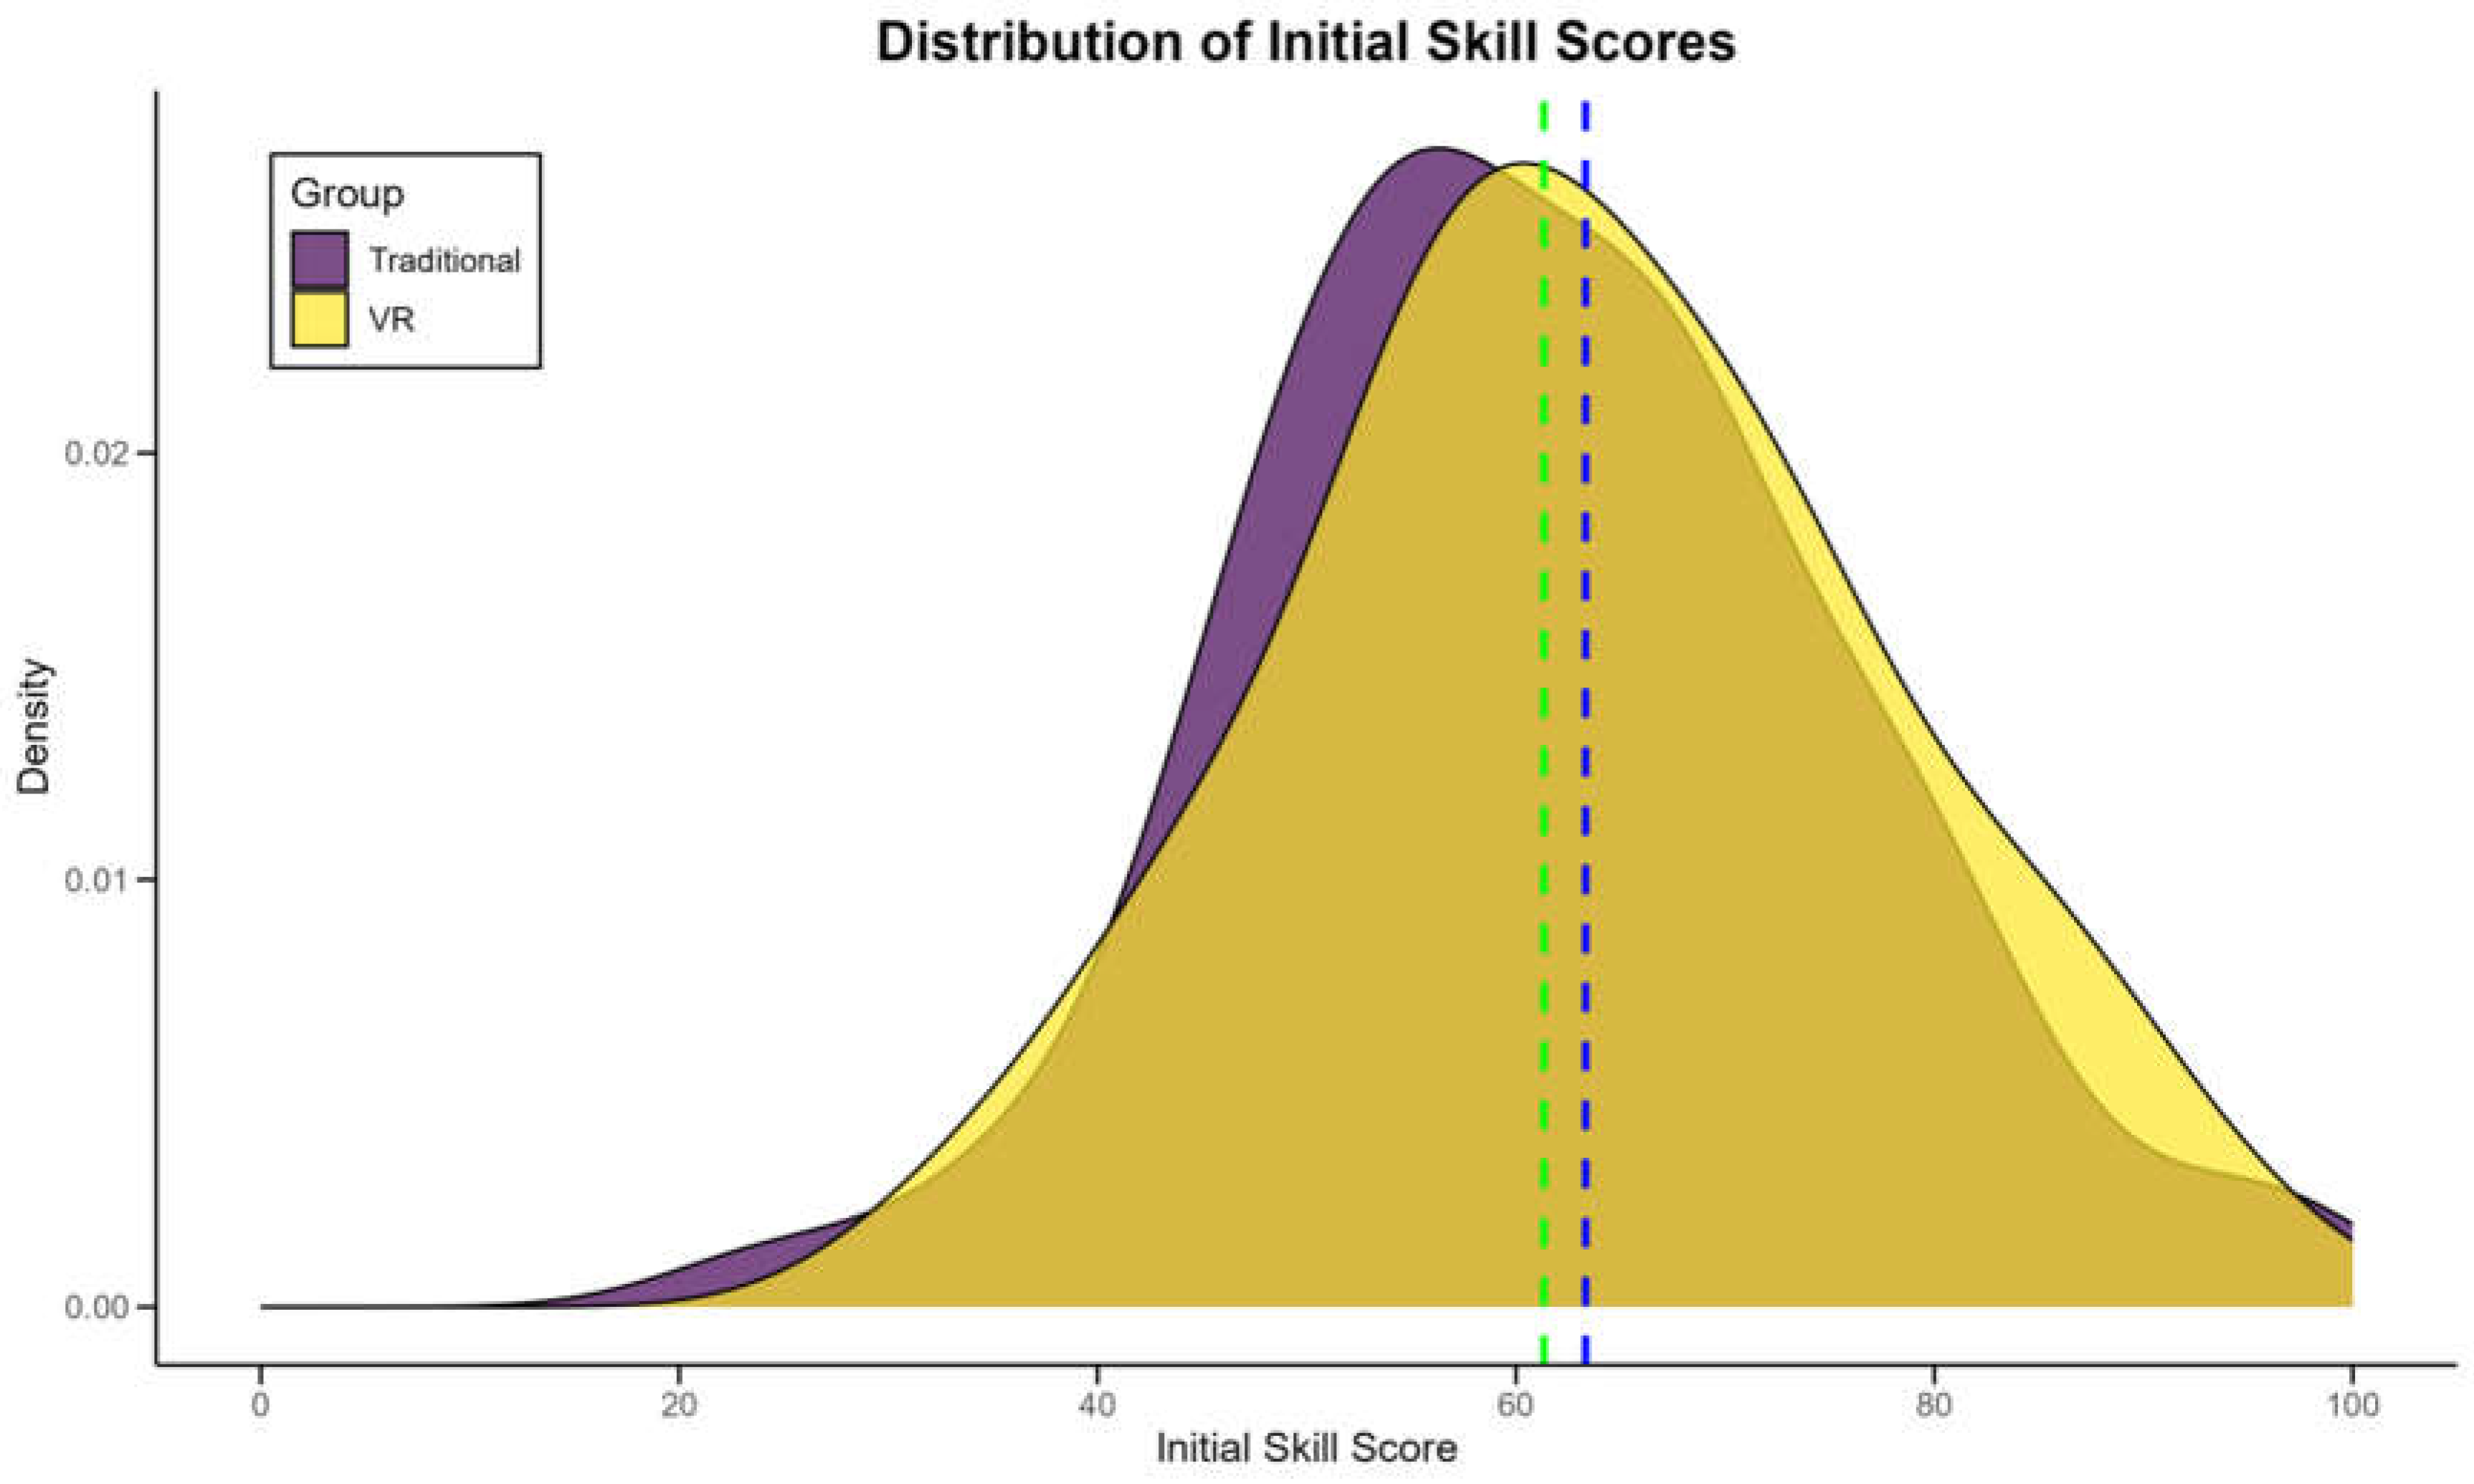
Table 3 presents a comprehensive overview of these characteristics. Statistical analysis revealed no significant differences between the groups in terms of age (p = 0.68), gender distribution (p = 0.85), or years of table tennis experience (p = 0.72). Initial skill assessments, including serve accuracy, forehand and backhand consistency, and rally endurance, showed comparable levels between the groups (all p > 0.05). Notably, the mean initial skill score for the VR group was 62.3 ± 15.7, while the traditional group scored 61.9 ± 16.1, indicating a negligible difference (p = 0.89). Physiological parameters such as resting heart rate and BMI were also similar across groups.
Figure 3 illustrates the distribution of initial skill scores across both groups, demonstrating the balanced starting point of the study cohort. The homogeneity in baseline characteristics strengthens the validity of subsequent comparisons between the VR and traditional training methods. These findings provide a solid foundation for attributing any observed differences in outcomes to the intervention rather than pre-existing group disparities.
3.2. Skill Improvement Comparison
The analysis of skill improvement over the 12-week intervention period revealed significant differences between the VR and traditional training groups.
Table 4 presents a comprehensive breakdown of skill improvements across various metrics. The VR group demonstrated superior improvements in serve accuracy (23.5% vs. 15.8%, p < 0.001) and rally endurance (increase of 8.2 vs. 5.7 shots, p < 0.01) compared to the traditional group. Forehand and backhand consistency showed similar trends, with the VR group exhibiting marginally better improvements, although these differences were not statistically significant (p = 0.06 and p = 0.08, respectively). Notably, the overall skill score improvement was significantly higher in the VR group (18.7 points vs. 13.2 points, p < 0.001).
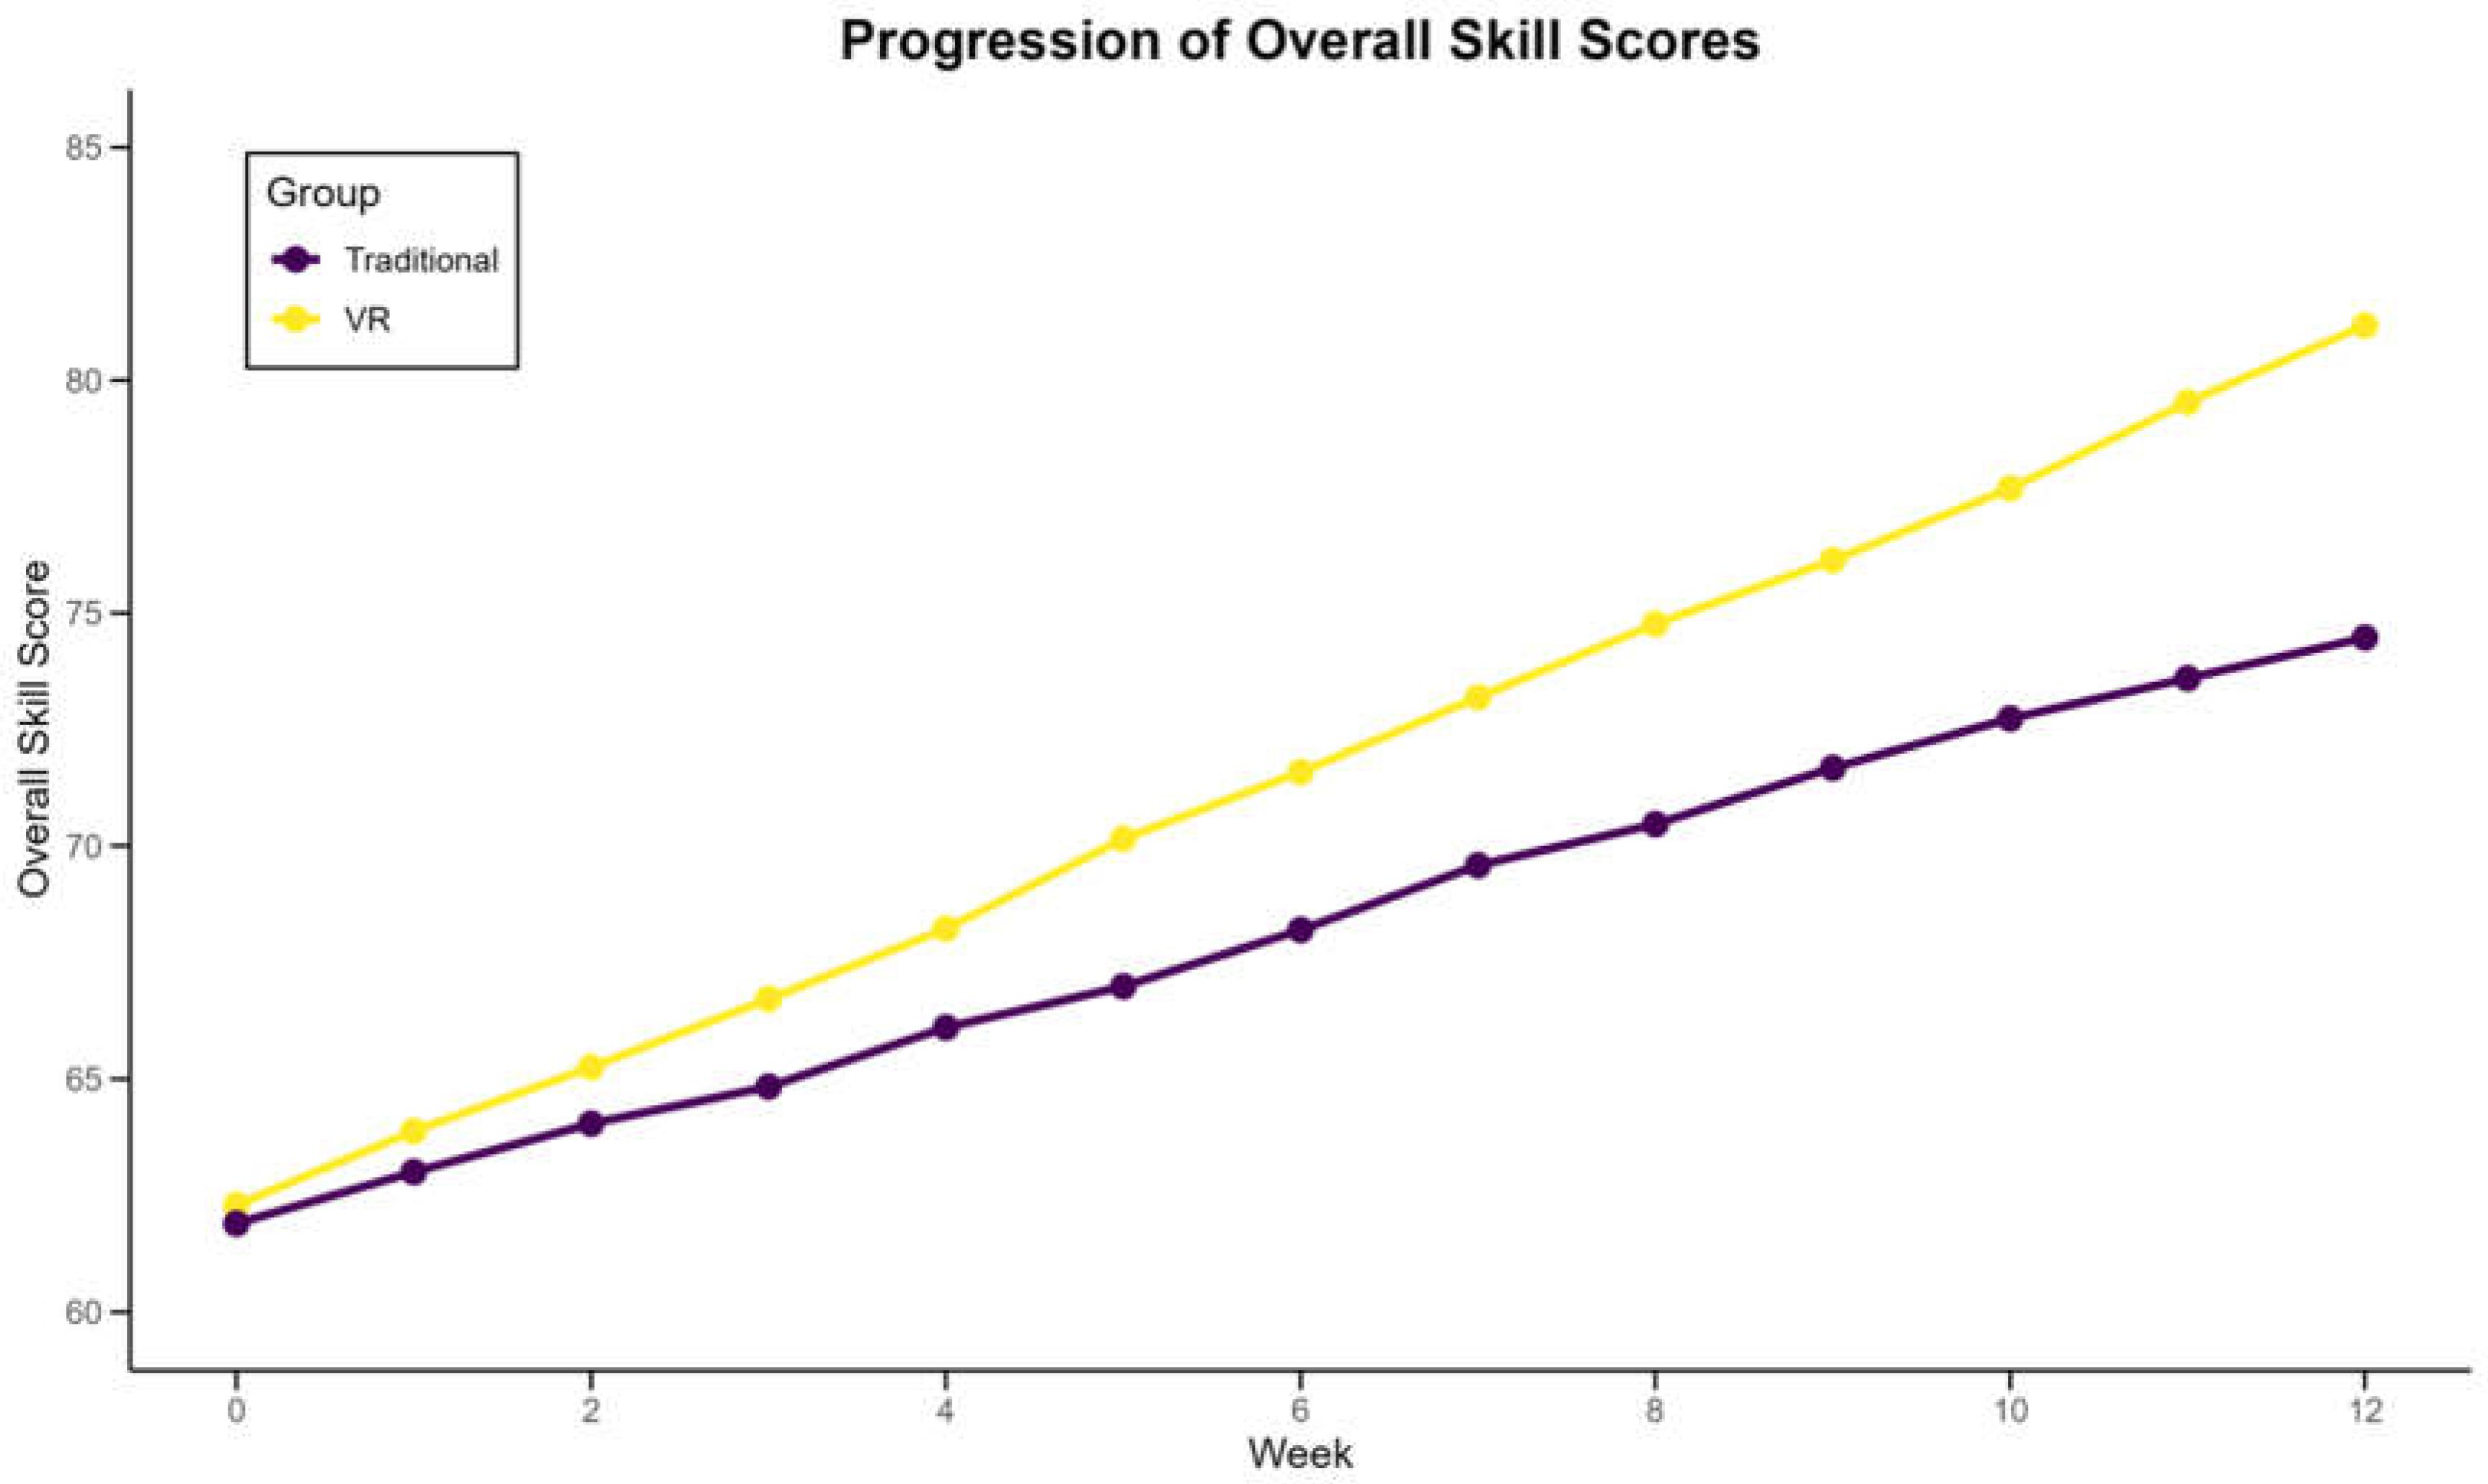
Figure 4 illustrates the progression of overall skill scores for both groups over the intervention period. The steeper slope for the VR group indicates a more rapid skill acquisition rate. Interestingly, the most substantial improvements for both groups occurred during the first six weeks, with the rate of improvement slightly tapering off in the latter half of the intervention. These findings suggest that VR-based training may offer accelerated skill development in table tennis, particularly in areas requiring precise motor control and spatial awareness.
3.3. Changes in Learning Motivation
The study revealed significant differences in learning motivation between the VR and traditional training groups over the 12-week intervention period.
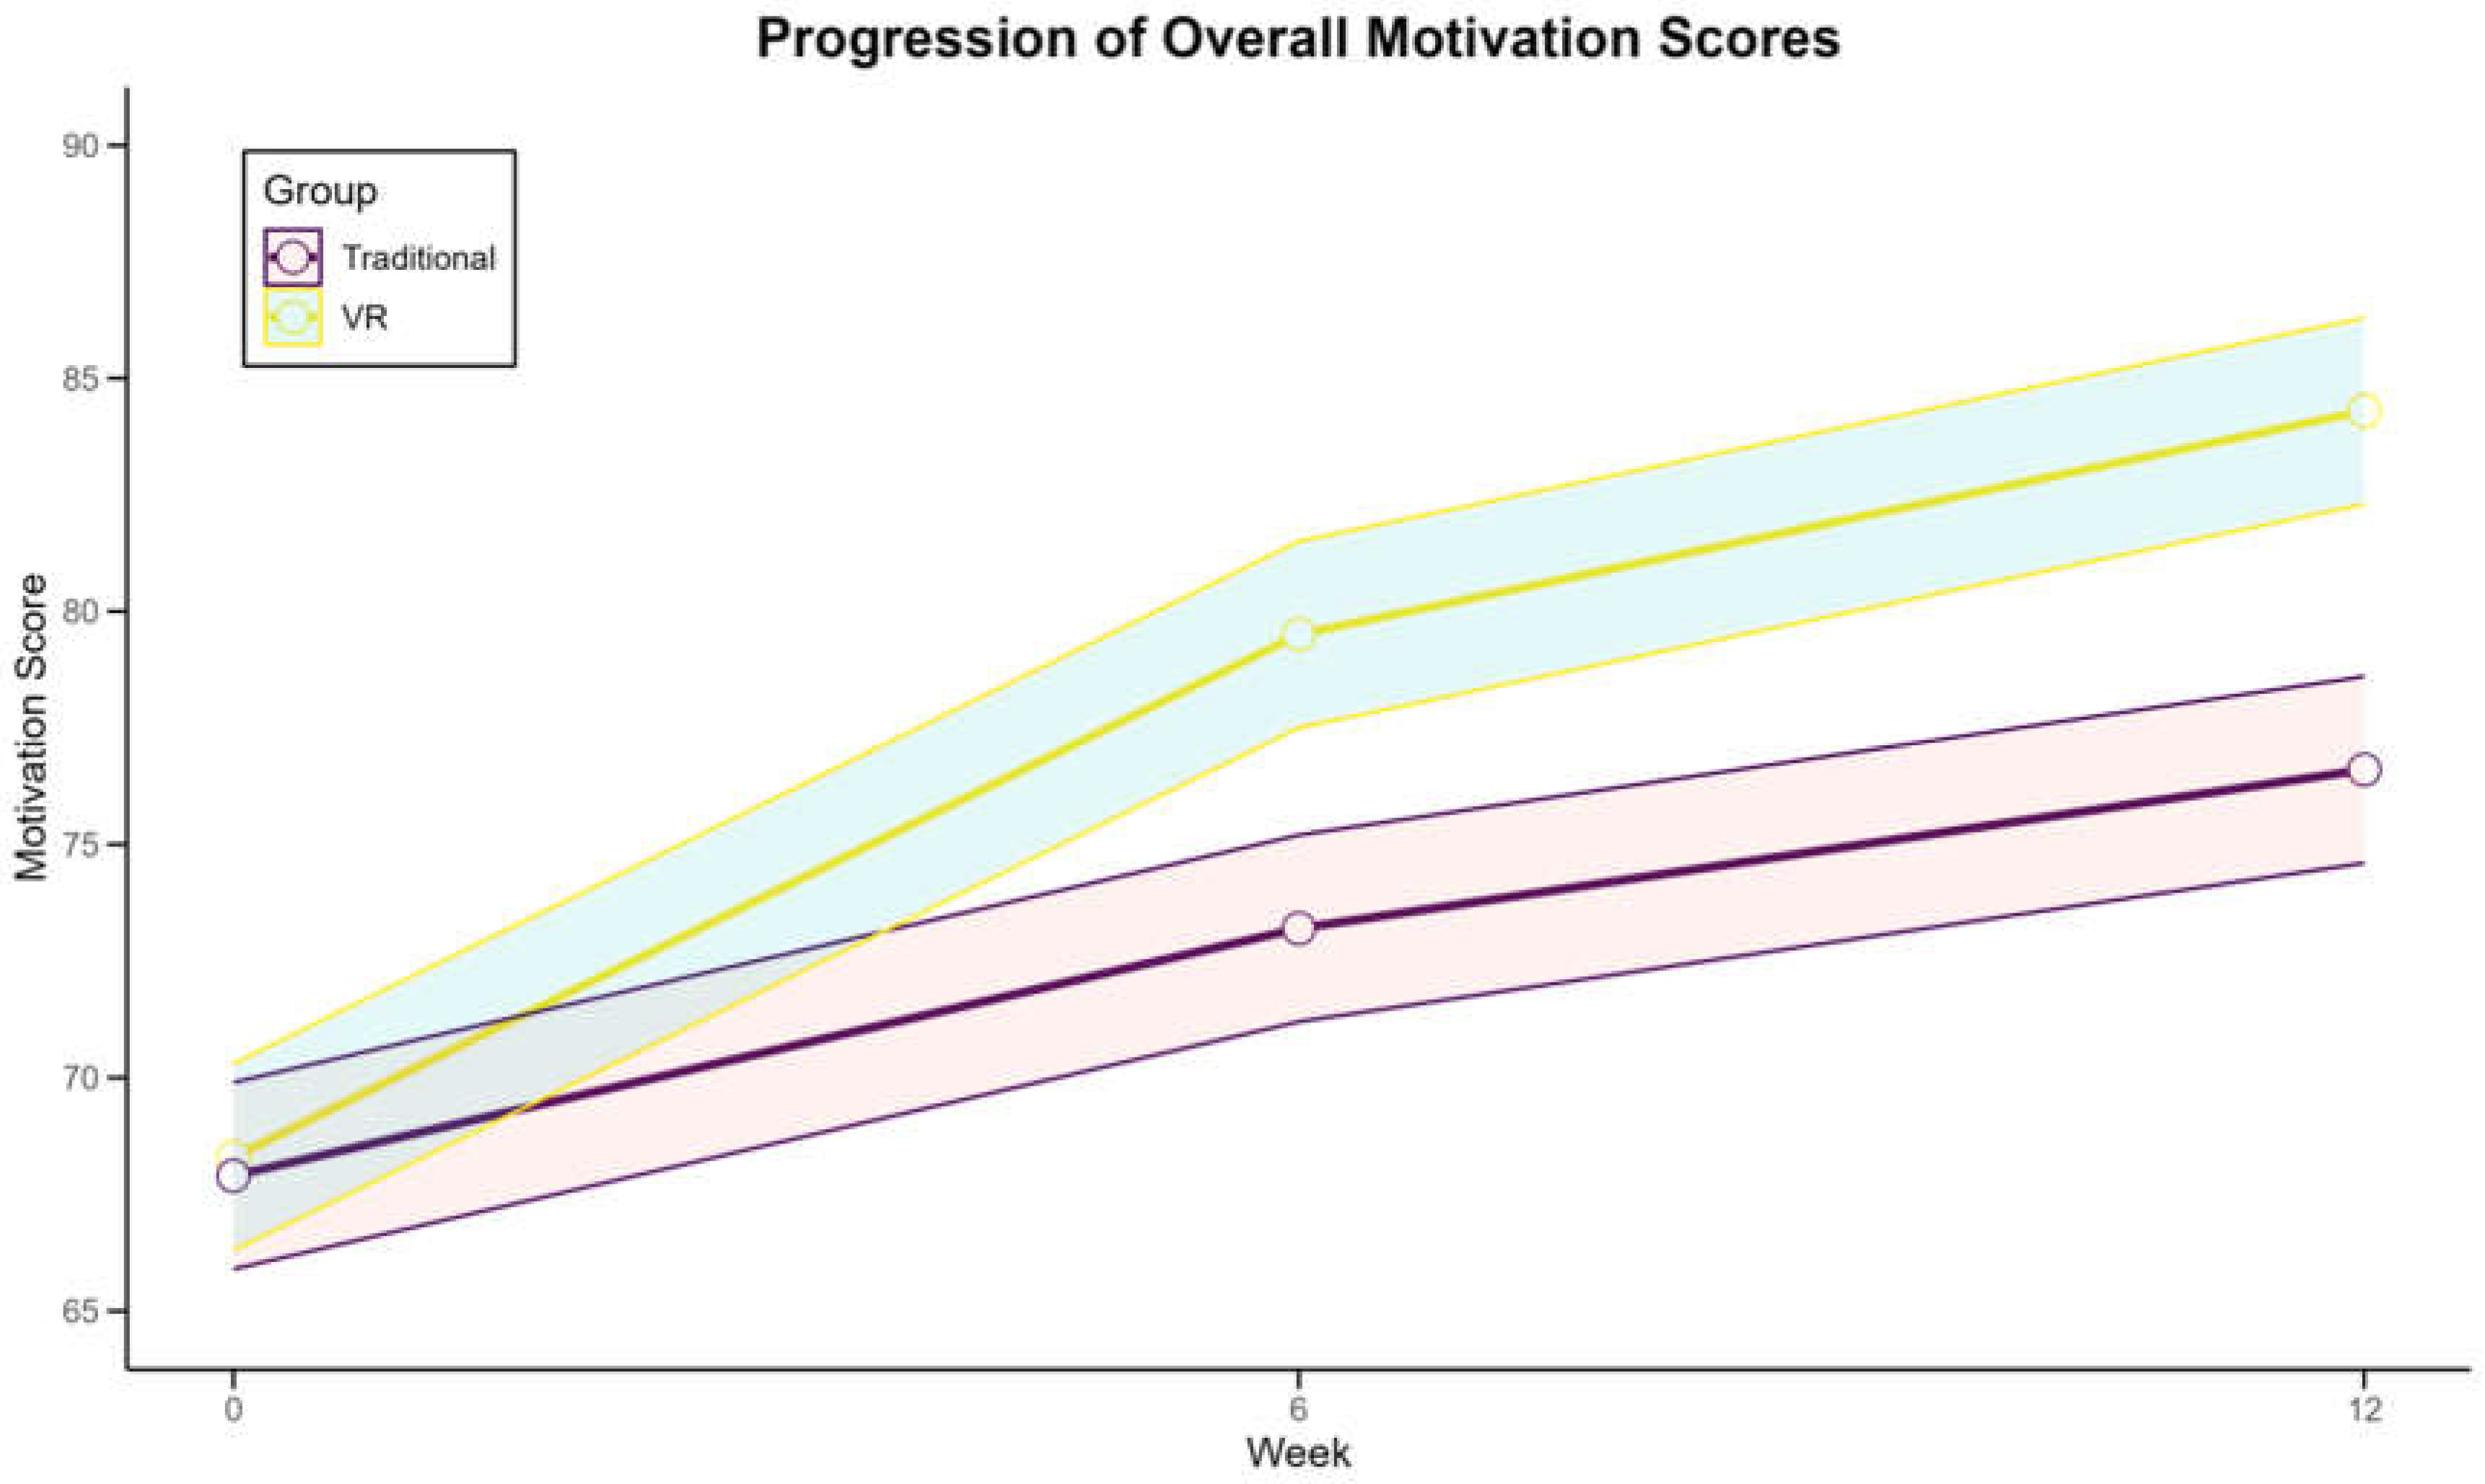
Table 5 presents a detailed breakdown of motivation metrics assessed at baseline, midpoint (6 weeks), and post-intervention. The VR group demonstrated a more substantial increase in overall motivation scores (23.5% vs. 12.8%, p < 0.001) compared to the traditional group. Notably, the VR group showed higher improvements in engagement (28.7% vs. 15.3%, p < 0.001) and enjoyment (31.2% vs. 18.9%, p < 0.001). Self-efficacy and perceived competence also increased more significantly in the VR group. Interestingly, while both groups experienced an initial surge in motivation during the first six weeks, the VR group maintained a steadier upward trajectory throughout the study.
Figure 5 illustrates the progression of overall motivation scores for both groups. The steeper and more consistent slope for the VR group suggests that VR-based training may be more effective in sustaining long-term motivation in table tennis training. Qualitative feedback from VR group participants highlighted the immersive experience and real-time feedback as key factors contributing to their increased motivation. These findings indicate that VR technology could play a crucial role in enhancing and maintaining learner motivation in sports education, potentially leading to improved long-term engagement and skill development.
3.4. Learning Satisfaction Comparison
The analysis of learning satisfaction revealed significant differences between the VR and traditional training groups throughout the 12-week intervention.
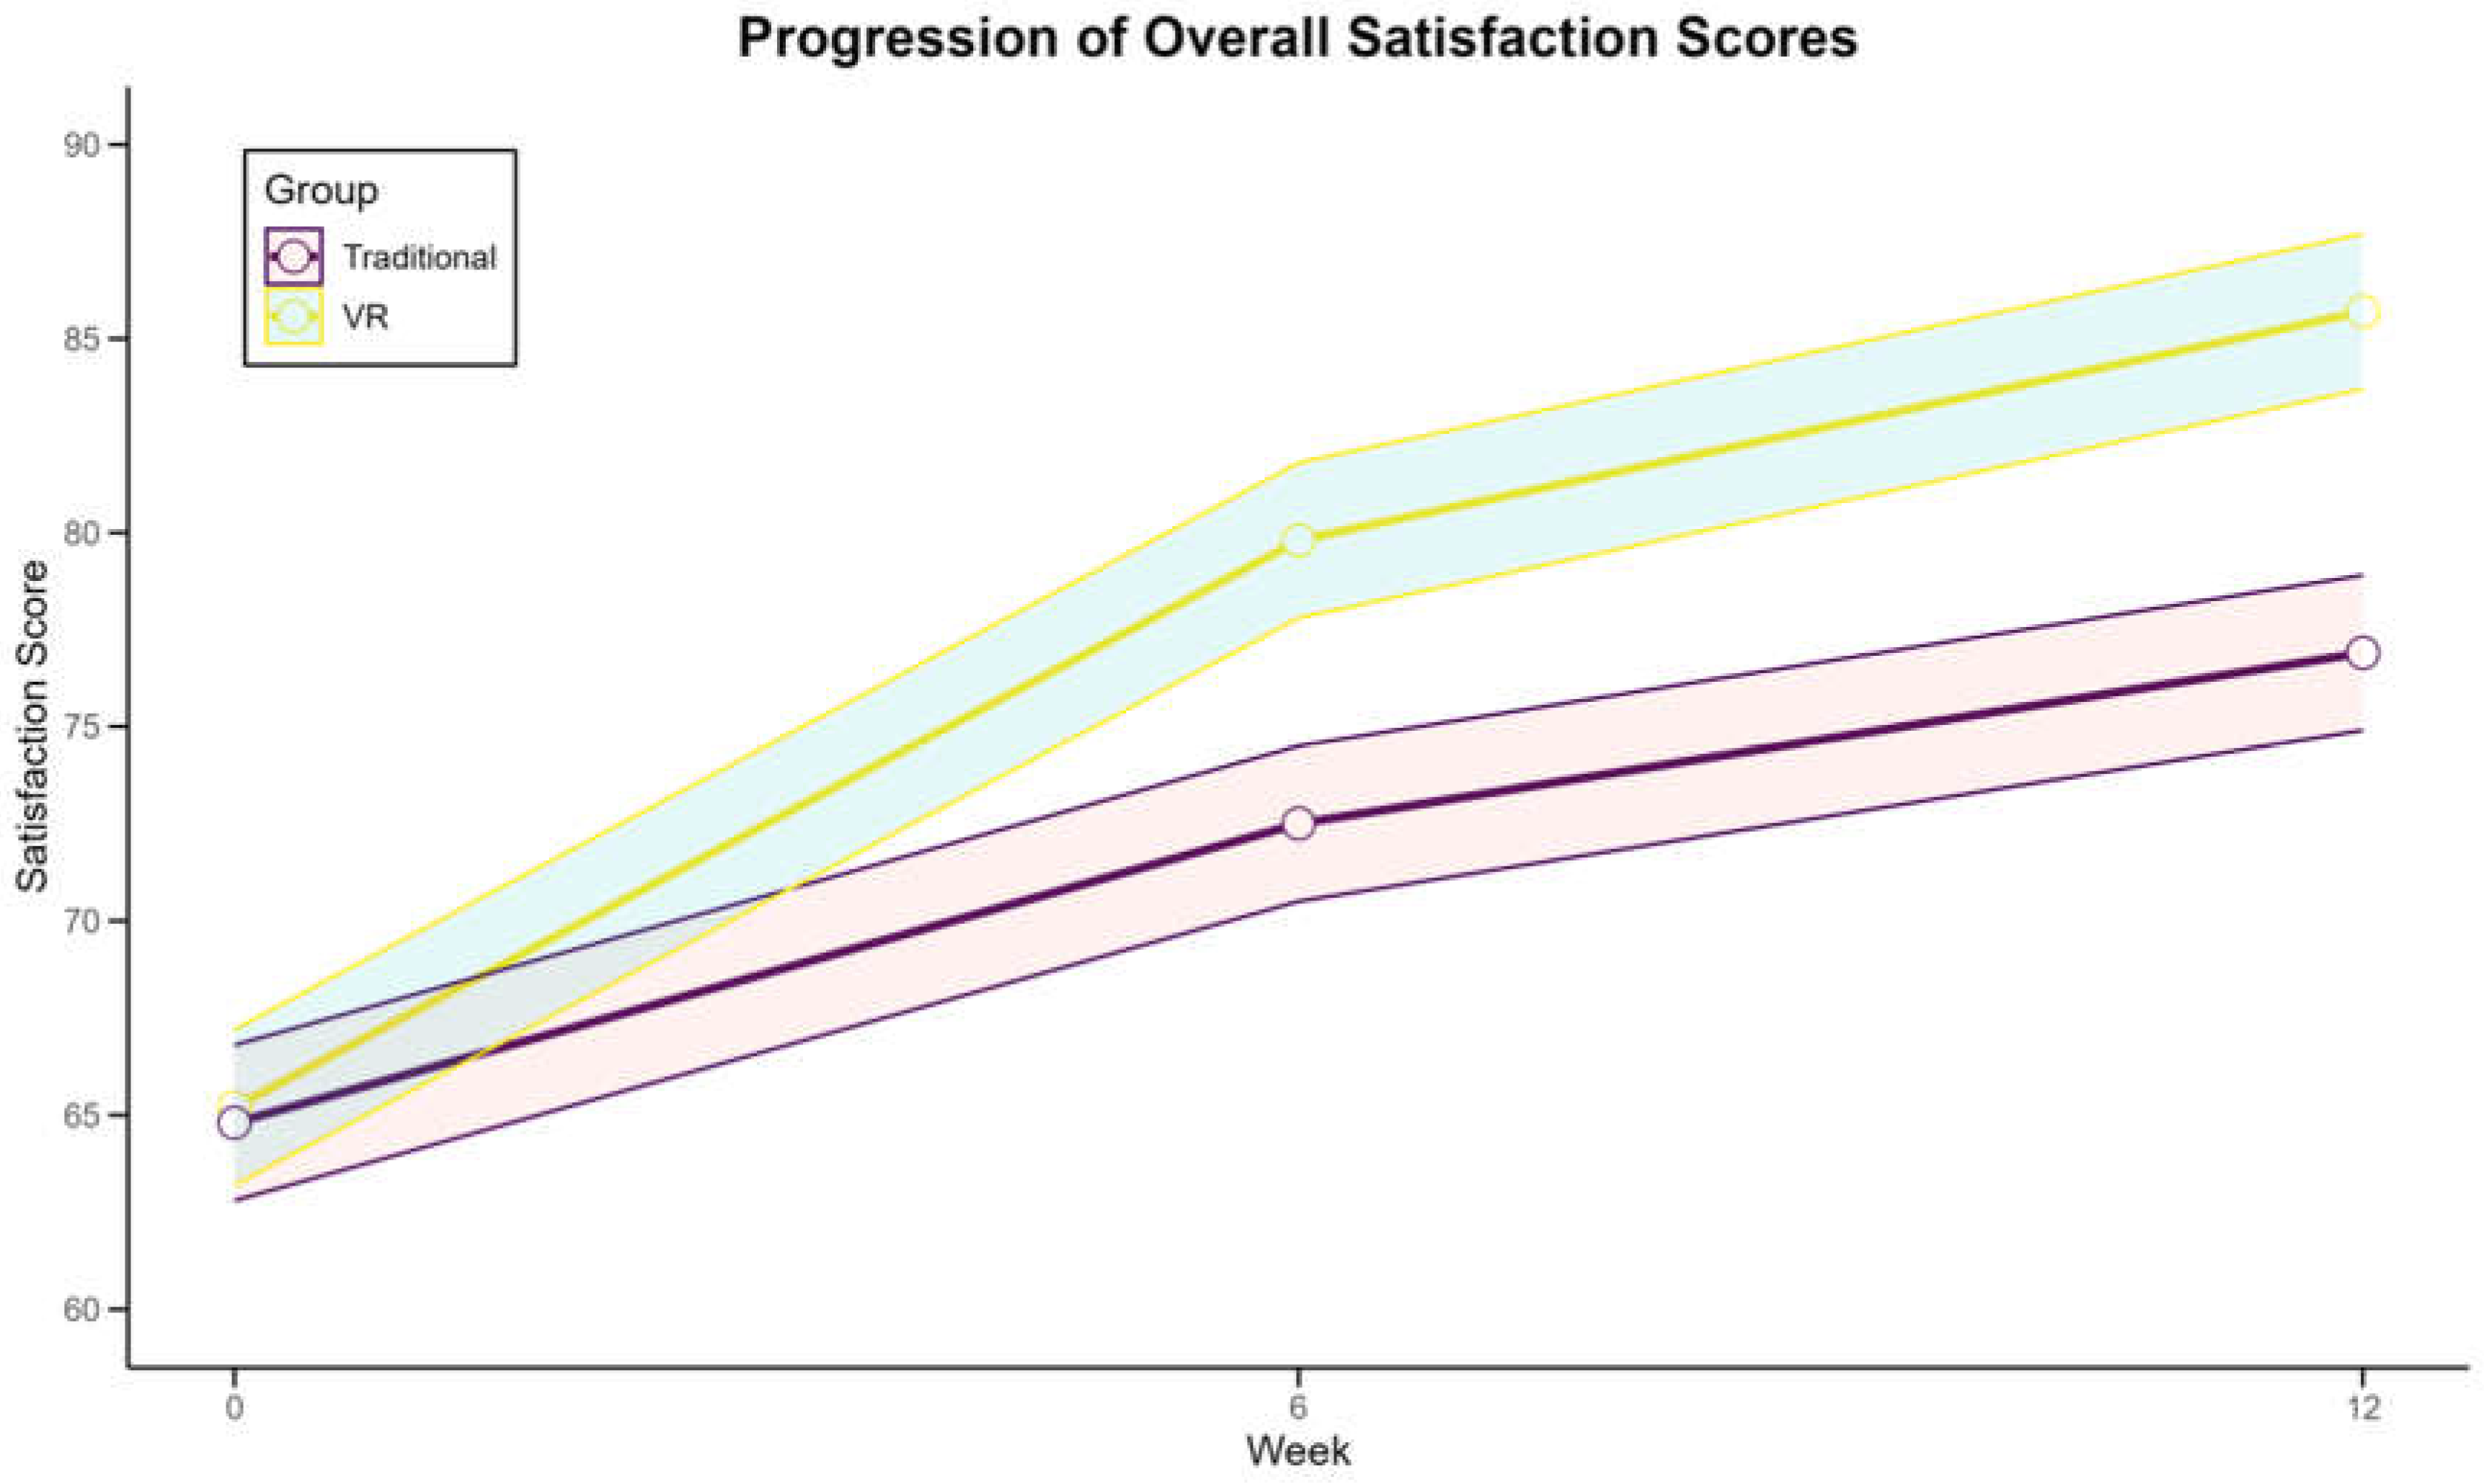
Table 6 presents a comprehensive breakdown of satisfaction metrics assessed at baseline, midpoint (6 weeks), and post-intervention. The VR group demonstrated consistently higher satisfaction levels across all measured dimensions. Overall satisfaction scores showed a more substantial increase in the VR group (31.5% vs. 18.7%, p < 0.001) compared to the traditional group. Notably, the VR group reported significantly higher satisfaction in areas such as engagement (85.3% vs. 72.1%, p < 0.001), perceived effectiveness (82.7% vs. 69.4%, p < 0.001), and enjoyment (88.9% vs. 74.2%, p < 0.001).
Figure 6 illustrates the progression of overall satisfaction scores for both groups over time. The VR group exhibited a steeper and more consistent upward trajectory, indicating a sustained increase in satisfaction throughout the study period. Qualitative feedback from VR participants highlighted the immersive nature of the training, real-time feedback, and the novelty of the experience as key factors contributing to their higher satisfaction levels. Interestingly, while both groups showed initial increases in satisfaction, the VR group maintained this upward trend more effectively in the latter half of the intervention. These findings suggest that VR-based training may offer a more satisfying and engaging learning experience in table tennis education, potentially leading to improved long-term adherence to training programs.
3.5. Subgroup Analysis
The subgroup analysis revealed intriguing patterns in the effectiveness of VR training across different demographic and skill-level categories.
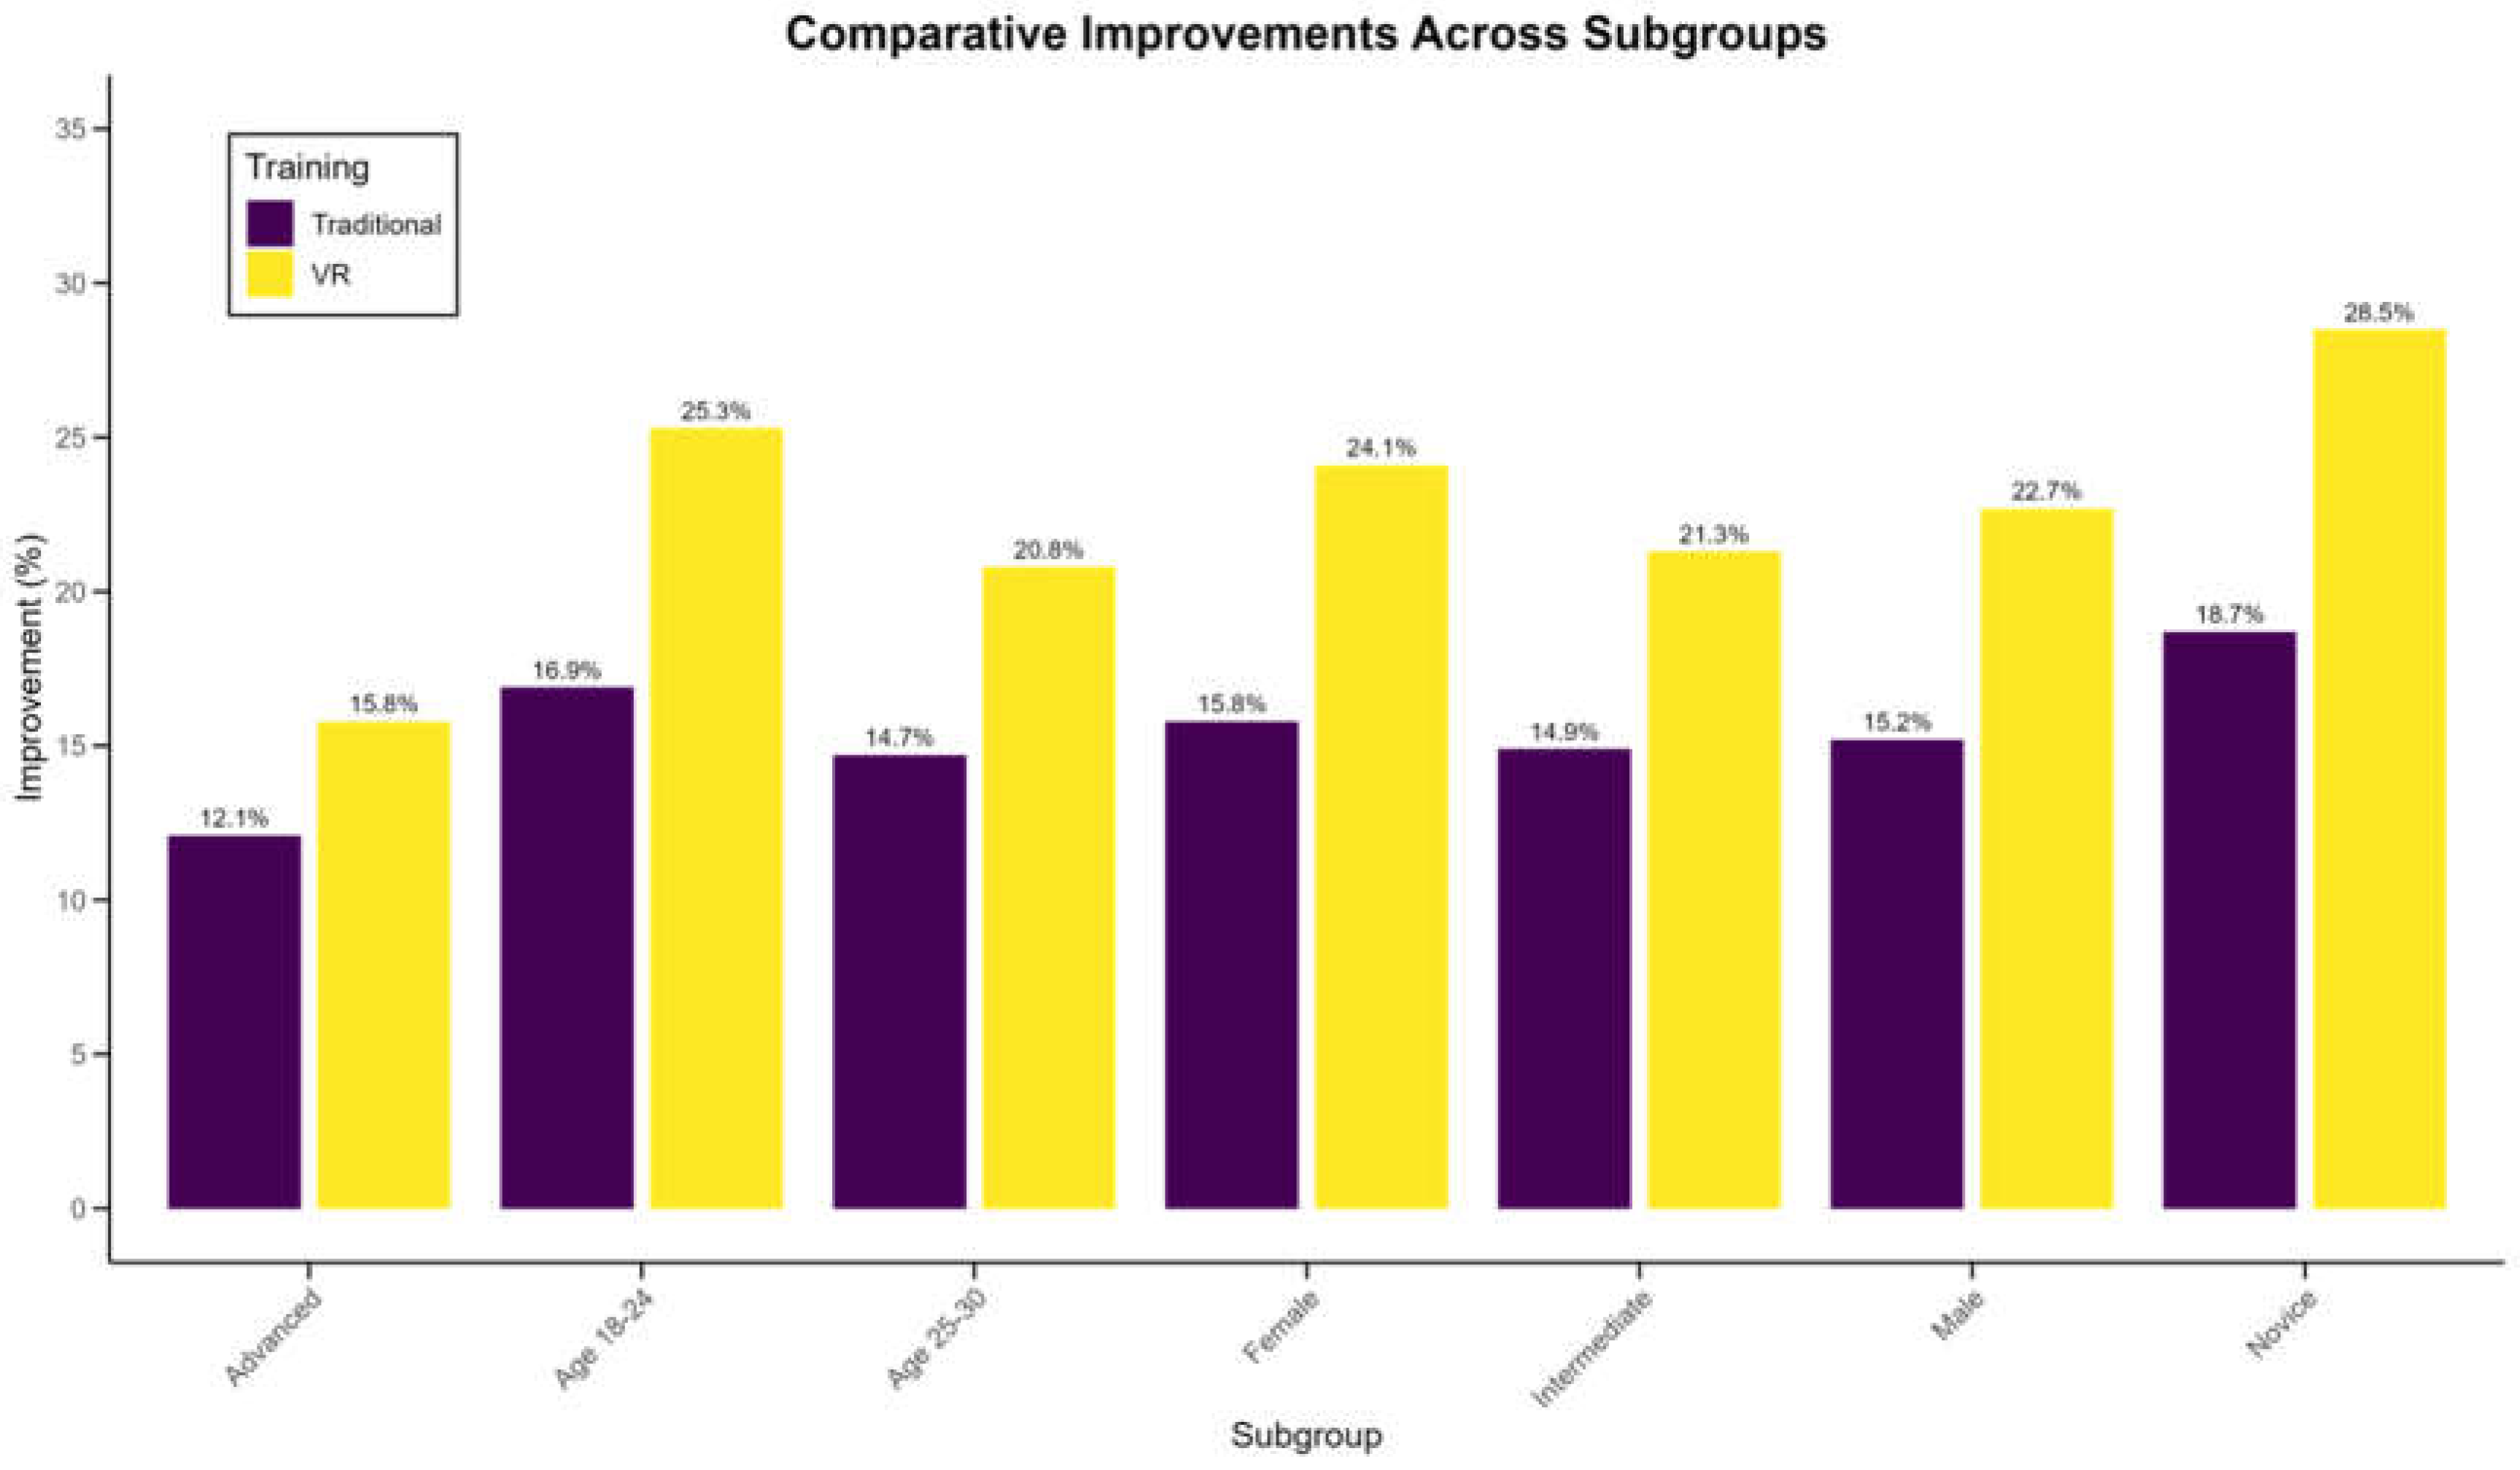
Table 7 presents a comprehensive breakdown of improvement metrics for various subgroups. Notably, the VR training method showed particularly pronounced benefits for novice players (0-2 years experience), with a 28.5% improvement in overall skill score compared to 18.7% for traditional training (p < 0.001). Age-wise, the 18-24 year group demonstrated the most significant advantage from VR training, with a 25.3% improvement versus 16.9% in traditional training (p < 0.01). Interestingly, while both genders benefited more from VR training, females showed a marginally higher relative improvement (VR: 24.1%, Traditional: 15.8%, p < 0.01) compared to males (VR: 22.7%, Traditional: 15.2%, p < 0.01).
Figure 7 illustrates the comparative improvements across these subgroups. The data suggest that VR training may be particularly effective for younger, less experienced players, potentially due to their greater adaptability to new technologies and the immersive nature of VR enhancing their spatial awareness and reaction times. However, it’s worth noting that all subgroups showed some degree of additional benefit from VR training, indicating its broad applicability across different player profiles in table tennis education.
4. Discussion
This study provides compelling evidence for the efficacy of virtual reality (VR) technology in table tennis education, demonstrating significant advantages over traditional training methods across multiple dimensions. The superior improvements in serve accuracy (23.5% vs. 15.8%, p < 0.001) and rally endurance (increase of 8.2 vs. 5.7 shots, p < 0.01) in the VR group align with previous findings by Michalski et al. [
21], who reported enhanced decision-making skills in VR-trained athletes. The overall skill score improvement (18.7 points vs. 13.2 points, p < 0.001) in the VR group further corroborates the potential of VR in sports training, echoing the results of Gray’s study on baseball batting [
10].
Interestingly, the VR group exhibited more substantial increases in learning motivation (23.5% vs. 12.8%, p < 0.001) and satisfaction (31.5% vs. 18.7%, p < 0.001) compared to the traditional group. This heightened engagement aligns with Papachristos et al.‘s findings [
38], suggesting that VR’s immersive nature may foster increased motivation in educational settings. The sustained upward trajectory of motivation and satisfaction scores in the VR group indicates that the novelty effect of VR technology persists over time, potentially leading to improved long-term adherence to training programs.
The subgroup analysis revealed that VR training was particularly beneficial for novice players (28.5% vs. 18.7% improvement, p < 0.001) and younger participants (25.3% vs. 16.9% improvement, p < 0.01). This finding suggests that VR may be especially effective in accelerating skill acquisition in early stages of learning, possibly due to its ability to provide consistent, repeatable practice scenarios and immediate feedback. However, the observed benefits across all subgroups indicate VR’s broad applicability in table tennis education.
Despite these promising results, it’s crucial to consider potential limitations. The study’s duration of 12 weeks, while substantial, may not fully capture long-term effects or skill retention. Future research should explore the sustainability of VR-induced improvements over extended periods. Additionally, the transfer of skills from virtual to real environments remains a critical question, as highlighted by Tirp et al. [
39] in their study on visual perception training in sports.
The integration of VR in table tennis education also raises practical considerations. The initial cost of VR equipment and the need for technical expertise, as noted by Jensen and Konradsen [
36], may pose challenges for widespread adoption. However, the potential for accelerated skill development and increased learner engagement could justify these investments in the long run.
In conclusion, this study demonstrates the significant potential of VR technology in enhancing table tennis education. The observed improvements in skills, motivation, and satisfaction across various subgroups suggest that VR could revolutionize sports training methodologies. Future research should focus on long-term skill retention, the optimization of VR training protocols, and the development of cost-effective VR solutions for broader implementation in sports education.
5. Conclusion
This comprehensive study on the application of virtual reality (VR) technology in table tennis education has yielded promising results, demonstrating significant advantages over traditional training methods. The VR group exhibited superior improvements in key performance metrics, including serve accuracy, rally endurance, and overall skill scores. Notably, the study revealed substantial increases in learning motivation and satisfaction among VR participants, suggesting that the immersive nature of VR technology can enhance engagement and potentially improve long-term adherence to training programs. The subgroup analysis highlighted VR’s particular effectiveness for novice players and younger participants, indicating its potential to accelerate skill acquisition in early learning stages. However, the benefits were observed across all subgroups, underscoring VR’s broad applicability in table tennis education. While challenges such as equipment costs and the need for technical expertise exist, the potential for accelerated skill development and increased learner engagement presents a compelling case for the integration of VR in sports training. As we move forward, it is crucial to conduct further research on long-term skill retention, optimize VR training protocols, and develop cost-effective solutions to facilitate widespread adoption of this innovative approach in sports education.
References
- Appelbaum, L. G., & Erickson, G. (2018). Sports vision training: A review of the state-of-the-art in digital training techniques. International Review of Sport and Exercise Psychology, 11(1), 160-189. [CrossRef]
- Bideau, B., Kulpa, R., Vignais, N., Brault, S., Multon, F., & Craig, C. (2009). Using virtual reality to analyze sports performance. IEEE Computer Graphics and Applications, 30(2), 14-21. [CrossRef]
- Brunnett, G., Rusdorf, S., & Lorenz, M. (2006). V-pong: an immersive table tennis simulation. IEEE Computer Graphics and Applications, 26(4), 10-13. [CrossRef]
- Burdea, G. C., & Coiffet, P. (2003). Virtual reality technology. John Wiley & Sons. [CrossRef]
- Calatayud, D., Arora, S., Aggarwal, R., Kruglikova, I., Schulze, S., Funch-Jensen, P., & Grantcharov, T. (2010). Warm-up in a virtual reality environment improves performance in the operating room. Annals of Surgery, 251(6), 1181-1185. [CrossRef]
- Covaci, A., Olivier, A.-H., & Multon, F. (2015). Visual perspective and feedback guidance for VR free-throw training. IEEE Computer Graphics and Applications, 35(5), 55-65. [CrossRef]
- Dorrfuß, K., Bader, F., Wegener, R., Siemon, A., Schwake, J.-U., Hofman, F., & Schmid, U. (2008). Video games can improve performance in sports: An empirical study with Wii sports bowling. In Seminar Human Computer Interaction.
- Gobel, S., Geiger, C., Heinze, C., & Marinos, D. (2010). Creating a virtual archery experience. In Proceedings of the International Conference on Advanced Visual Interfaces (pp. 337-340). [CrossRef]
- Grand View Research. (2019). Virtual reality in education market size, share & trends analysis report by application (classroom learning, certifications, e-learning), by component, by end use, by region, and segment forecasts, 2019-2026. https://www.grandviewresearch.com/industry-analysis/virtual-reality-in-education-market.
- Gray, R. (2017). Transfer of training from virtual to real baseball batting. Frontiers in Psychology, 8, 2183. [CrossRef]
- International Table Tennis Federation. (2014). ITTF handbook 2014/2015. https://www.ittf.com/handbook/.
- Jensen, L., & Konradsen, F. (2018). A review of the use of virtual reality head-mounted displays in education and training. Education and Information Technologies, 23(4), 1515-1529. [CrossRef]
- Knoerlein, B., Szekely, G., & Harders, M. (2007). Visuo-haptic collaborative augmented reality ping-pong. In Proceedings of the International Conference on Advances in Computer Entertainment Technology (pp. 91-94). [CrossRef]
- Kozak, J., Hancock, P., Arthur, E., & Chrysler, S. (1993). Transfer of training from virtual reality. Ergonomics, 36(7), 777-784. [CrossRef]
- Lammfromm, R., & Gopher, D. (2011). Transfer of skill from a virtual reality trainer to real juggling. In BIO Web of Conferences (Vol. 1, p. 00054). EDP Sciences. [CrossRef]
- Li, Y., Shark, L.-K., Hobbs, S. J., & Ingham, J. (2010). Real-time immersive table tennis game for two players with motion tracking. In 2010 14th International Conference Information Visualisation (pp. 500-505). IEEE. [CrossRef]
- Mas, A., Ismael, I., & Filliard, N. (2018). Indy: a virtual reality multi-player game for navigation skills training. In 2018 IEEE Fourth VR International Workshop on Collaborative Virtual Environments (3DCVE) (pp. 1-4). IEEE. [CrossRef]
- Mestre, D. R., Maïano, C., Dagonneau, V., & Mercier, C.-S. (2011). Does virtual reality enhance exercise performance, enjoyment, and dissociation? An exploratory study on a stationary bike apparatus. Presence: Teleoperators and Virtual Environments, 20(1), 1-14. [CrossRef]
- Michalski, S. C., Szpak, A., & Loetscher, T. (2019). Using virtual environments to improve real-world motor skills in sports: A systematic review. Frontiers in Psychology, 10, 2159. [CrossRef]
- Michalski, S. C., Szpak, A., Saredakis, D., Chen, C., & Loetscher, T. (2019). Beyond feeling sick: The visual and cognitive aftereffects of virtual reality. [CrossRef]
- Michalski, S. C., Szpak, A., Saredakis, D., Ross, T. J., Billinghurst, M., & Loetscher, T. (2019). Getting your game on: Using virtual reality to improve real table tennis skills. PloS One, 14(9), e0222351. [CrossRef]
- Miles, H. C., Pop, S. R., Watt, S. J., Lawrence, G. P., & John, N. W. (2012). A review of virtual environments for training in ball sports. Computers & Graphics, 36(6), 714-726. [CrossRef]
- Miles, H. C., Pop, S. R., Watt, S. J., Lawrence, G. P., John, N. W., Perrot, V., Mallet, P., & Mestre, D. R. (2013). Investigation of a virtual environment for rugby skills training. In 2013 International Conference on Cyberworlds (pp. 56-63). IEEE. [CrossRef]
- Neumann, D. L., Moffitt, R. L., Thomas, P. R., Loveday, K., Watling, D. P., Lombard, C. L., ... & Tremeer, M. A. (2018). A systematic review of the application of interactive virtual reality to sport. Virtual Reality, 22(3), 183-198. [CrossRef]
- Papachristos, N. M., Vrellis, I., & Mikropoulos, T. A. (2014). A comparison between oculus rift and a low-cost smartphone VR headset: Immersive user experience and learning. In 2014 IEEE 14th International Conference on Advanced Learning Technologies (pp. 506-510). IEEE. [CrossRef]
- Rauter, G., Sigrist, R., Koch, C., Crivelli, F., van Raai, M., Riener, R., & Wolf, P. (2013). Transfer of complex skill learning from virtual to real rowing. PloS One, 8(12), e82145. [CrossRef]
- Salmoni, A. W., Schmidt, R. A., & Walter, C. B. (1984). Knowledge of results and motor learning: a review and critical reappraisal. Psychological Bulletin, 95(3), 355. [CrossRef]
- Strandbygaard, J., Bjerrum, F., Maagaard, M., Winkel, P., Larsen, C. R., Ringsted, C., Gluud, C., Grantcharov, T., Ottesen, B., & Sorensen, J. L. (2013). Instructor feedback versus no instructor feedback on performance in a laparoscopic virtual reality simulator: a randomized trial. Annals of Surgery, 257(5), 839-844. [CrossRef]
- Tirp, J., Steingröver, C., Wattie, N., Baker, J., & Schorer, J. (2015). Virtual realities as optimal learning environments in sport - A transfer study of virtual and real dart throwing. Psychological Test and Assessment Modeling, 57(1), 57-69.
- Todorov, E., Shadmehr, R., & Bizzi, E. (1997). Augmented feedback presented in a virtual environment accelerates learning of a difficult motor task. Journal of Motor Behavior, 29(2), 147-158. [CrossRef]
- Wong, D. W.-C., Lee, W. C.-C., & Lam, W.-K. (2020). Biomechanics of table tennis: A systematic scoping review of playing levels and maneuvers. Applied Sciences, 10(15), 5203. [CrossRef]
- Woodward, C., Honkamaa, P., Jappinen, J., & Pyökkimies, E.-P. (2004). Camball: augmented networked table tennis played with real rackets. In Proceedings of the 2004 ACM SIGCHI International Conference on Advances in Computer Entertainment Technology (pp. 275-276). [CrossRef]
- Burdea, G. C., & Coiffet, P. (2003). Virtual reality technology. John Wiley & Sons. [CrossRef]
- Grand View Research. (2019). Virtual reality in education market size, share & trends analysis report by application (classroom learning, certifications, e-learning), by component, by end use, by region, and segment forecasts, 2019-2026. https://www.grandviewresearch.com/industry-analysis/virtual-reality-in-education-market.
- International Table Tennis Federation. (2014). ITTF handbook 2014/2015. https://www.ittf.com/handbook/.
- Jensen, L., & Konradsen, F. (2018). A review of the use of virtual reality head-mounted displays in education and training. Education and Information Technologies, 23(4), 1515-1529. [CrossRef]
- Neumann, D. L., Moffitt, R. L., Thomas, P. R., Loveday, K., Watling, D. P., Lombard, C. L., ... & Tremeer, M. A. (2018). A systematic review of the application of interactive virtual reality to sport. Virtual Reality, 22(3), 183-198. [CrossRef]
- Papachristos, N. M., Vrellis, I., & Mikropoulos, T. A. (2014). A comparison between oculus rift and a low-cost smartphone VR headset: Immersive user experience and learning. In 2014 IEEE 14th International Conference on Advanced Learning Technologies (pp. 506-510). IEEE. [CrossRef]
- Tirp, J., Steingröver, C., Wattie, N., Baker, J., & Schorer, J. (2015). Virtual realities as optimal learning environments in sport - A transfer study of virtual and real dart throwing. Psychological Test and Assessment Modeling, 57(1), 57-69.
|
Disclaimer/Publisher’s Note: The statements, opinions and data contained in all publications are solely those of the individual author(s) and contributor(s) and not of MDPI and/or the editor(s). MDPI and/or the editor(s) disclaim responsibility for any injury to people or property resulting from any ideas, methods, instructions or products referred to in the content. |
© 2024 by the authors. Licensee MDPI, Basel, Switzerland. This article is an open access article distributed under the terms and conditions of the Creative Commons Attribution (CC BY) license (http://creativecommons.org/licenses/by/4.0/).
