Preprint
Article

Effectiveness of Generative AI for Post-Earthquake Damage Assessment

Altmetrics

Downloads

98

Views

66

Comments

0

A peer-reviewed article of this preprint also exists.

This version is not peer-reviewed

Submitted:

13 September 2024

Posted:

16 September 2024

You are already at the latest version

Alerts
Abstract
After an earthquake, assessing the seismic vulnerability of buildings is essential for prioritizing emergency response, guiding reconstruction, and ensuring public safety. Accurate and timely evaluation of structural damage plays a vital role in mitigating further risks and facilitating in-formed decision-making during disaster recovery. This study investigates the performance of various Generative Artificial Intelligence (GAI) models, developed by different companies with diverse model sizes and context windows, in analysing post-earthquake images. The primary objective was to evaluate the models' effectiveness in classifying structural damage according to the EMS-98 scale (with 5 levels of damage), which ranges from minor damage to total destruction. For masonry buildings, the correct classification rates varied widely across models, from 28.6% to 64.3%, with mean damage grade errors ranging from 0.50 to 0.79. In the case of reinforced concrete buildings, correct classification rates ranged from 37.5% to 75.0%, with mean damage grade errors between 0.50 and 0.88. The use of fine-tuning could probably improve the results substantially. Improving the accuracy of GAI models could significantly reduce the time and resources needed to assess post-earthquake damage, namely when comparing with more traditional approaches. The results achieved thus far demonstrate the promise of GAI models for rapid, automated, and ac-curate damage evaluation, which is critical for expediting decision-making in disaster response scenarios.
Keywords: 
Subject: Engineering  -   Civil Engineering

1. Introduction

In regions with a history of destructive earthquakes, it’s vital for communities to be prepared to respond effectively to such natural disasters. Improving the ability to quickly and safely assess the seismic vulnerability of affected buildings, based on the damage they’ve sustained, plays a crucial role in ensuring a swift and effective response.
In this context, it is crucial to explore the potential use of artificial intelligence (AI) algorithms for assessing building damage following a devastating earthquake. This approach can be particularly valuable when there is a limited number of available human resources to perform the task. AI can assist in identifying severe damage or collapses, which may involve potential victims, as well as in evaluating less critical damage that could still affect the safe occupancy of buildings. Addressing these issues promptly is essential to managing the number of displaced individuals who also require timely assistance.
There is a wide variety of AI algorithms, which can be categorized into several subcategories (Figure 1). These AI algorithms possess different capabilities, making it essential to understand some fundamental concepts before selecting one to address a specific problem. For example, some AI algorithms are particularly effective in handling classification tasks, others are better suited for addressing regression problems, and some are optimized for solving complex optimization challenges.
The use of AI in the context of Earthquake Engineering is not a new concept. For example, Estêvão [1] was one of the first researchers in Portugal to propose the application of AI in seismic risk assessment for buildings. Specifically, in his MSc thesis, defended in 1999, he presented the idea and used a combination of a fuzzy expert system with a deep learning (DL) system based on multi-layered feedforward neural networks (NN), utilizing an Error Backpropagation Learning Algorithm. That generation of researchers was significantly influenced by the success of the AI system known as DeepBlue, which, for the first time in human history, was able to defeat the world chess champion, Kasparov, in 1997 [2]. It is important to highlight that, at that time, the wide array of AI libraries for various programming languages (such as Python or C#) that we have today did not exist. Therefore, these algorithms had to be studied in great detail before they could be implemented in software, as was the case with the NEUNET software [1]. However, this line of research often remained stagnant for many years. For example, Estêvão’s study [1] was only partially published in a journal almost 20 years after it was initially presented, now including results from nonlinear analyses used to train the neural networks (NN) [3]. This approach was later extended to the context of schools [4], following the PERSISTAH project [5]. The temporal gap in the adoption of AI for various applications was largely due to the evolution of AI itself and advancements in computational systems. In the past, there was a significant limitation in the computational power required to train deep learning (DL) systems. Additionally, a substantial portion of the scientific community was highly sceptical about the use of AI, which hindered the formation of collaborations, the acquisition of funding, and made it challenging to get AI-related research in seismic engineering published in scientific journals. This resistance was also evident in other scientific fields, such as computer vision. A pertinent example is a paper submitted to a conference by Yann LeCun and his collaborators, which was rejected because the scientific community at the time did not believe that deep learning systems could learn to classify images solely from examples [6]. It is important to highlight that Yann LeCun was a pioneer in using Convolutional Neural Networks (CNN) for image recognition [7], and today he is a well-known and highly awarded researcher. In essence, there were two prevailing perspectives: on one side were the researchers who had an intuition about the potential of DL, and on the other side was the majority of the researchers who were highly distrustful of these capabilities, primarily because they viewed these systems as “black boxes,” where humans could only control the training process of the AI system, not what it learned.
A significant turning point in the perception of DL capabilities occurred in 2012 with the advent of the widely recognized AlexNet [6,8], which demonstrated its effectiveness in accurately classifying various types of images. This shift in perception was further reinforced in 2016 when AlphaGo defeated a world champion human player in the game of Go, followed by AlphaZero’s remarkable performance in chess [2]. However, DL systems require substantial amounts of data to ensure proper training of neural networks; otherwise, issues like overfitting may arise [3]. In the domain of computer vision, strategies must also be developed to combat overfitting, especially when there is an insufficient number of images available, such as employing distinct forms of data augmentation [6].
With the emergence of the transformer architecture in 2017 [9], followed by its application in natural language processing (NLP) [10], generative artificial intelligence (GAI) gained significant visibility within the scientific community. This visibility extended to the general public in November 2022 with the release of ChatGPT, showcasing its potential across various domains [11]. Today, the conversational abilities and cognitive performance exhibited by the most recent large language models (LLMs) are already evident [12], particularly in the chatbots currently in use.
In the context of post-earthquake damage assessment, several methods for the rapid and automatic evaluation of building damage have recently been tested. The first attempt to use remote sensing imagery for earthquake damage mapping, still preliminary in nature, occurred during the 1906 San Francisco earthquake in California, USA, where aerial photographs of the affected areas were obtained. The first use of satellite images likely dates back to 1972, concerning the 1964 Alaska earthquake [13]. Currently, the methods typically proposed rely on satellite images, aerial views, images captured by unmanned aerial vehicles (UAVs) at the building level, or combinations of these image sources [13,14,15,16,17]. Many of these methods employ various types of AI algorithms, such as Support Vector Machines (SVM) and Random Forest (RF), which are ML algorithms, or CNN, which are DL algorithms [13,18,19,20].
RF is an algorithm typically used to solve regression or classification problems. In the context of post-earthquake scenarios, these algorithms can be trained to classify the extent of building damage into categories such as “standing” and “collapsed” over large areas using imagery [21].
SVM is a supervised learning algorithm primarily used in classification problems, allowing the assignment of a damage grade based on the distance of a result to a hyperplane that divides the data into classes [22].
The use of CNNs is, very likely, the most widely adopted strategy for assessing building damage in post-earthquake scenarios, with numerous recent studies published on the topic [23,24,25,26,27,28,29,30,31,32,33,34,35,36,37]. Various network architectures based on AlexNet [25], previously recognized as a significant milestone in computer vision, have been developed, alongside many other CNN architectures [24]. An important conclusion is that CNN-based networks encounter several challenges, particularly related to the loss of spatial information and the fact that training data may not fully represent the problem domain [24].
Generative Adversarial Networks (GANs) are relatively recent models of GAI that are beginning to be employed in earthquake engineering [38], particularly for post-earthquake damage assessment in buildings [39]. In this context, a pertinent question arises: Can GAI, especially considering the current availability of multimodal systems with models that possess an enormous number of parameters and have been trained on supercomputers using vast amounts of data from the internet, effectively contribute to solving the problem of damage assessment in post-earthquake scenarios? Addressing this question, the present work conducts a preliminary study aimed at providing an initial answer to this inquiry.

2. GAI Models

Given that the approach proposed in this work involves GAI concepts that are not yet widely understood by all stakeholders in post-earthquake damage assessment, and because information on the subject is still fragmented, this section has been created to provide the necessary clarifications within the context of the research conducted, which involves both text and image data.
For a GAI system to effectively assess the damage level of a building in a post-earthquake scenario based on a single image, it is likely desirable to utilize a Foundation Model (FM) [40,41] with multimodal capabilities (text-image-text). Access to such models can be facilitated through a chatbot, which provides a user-friendly interface, or via an Application Programming Interface (API), which is more suited for software developers.
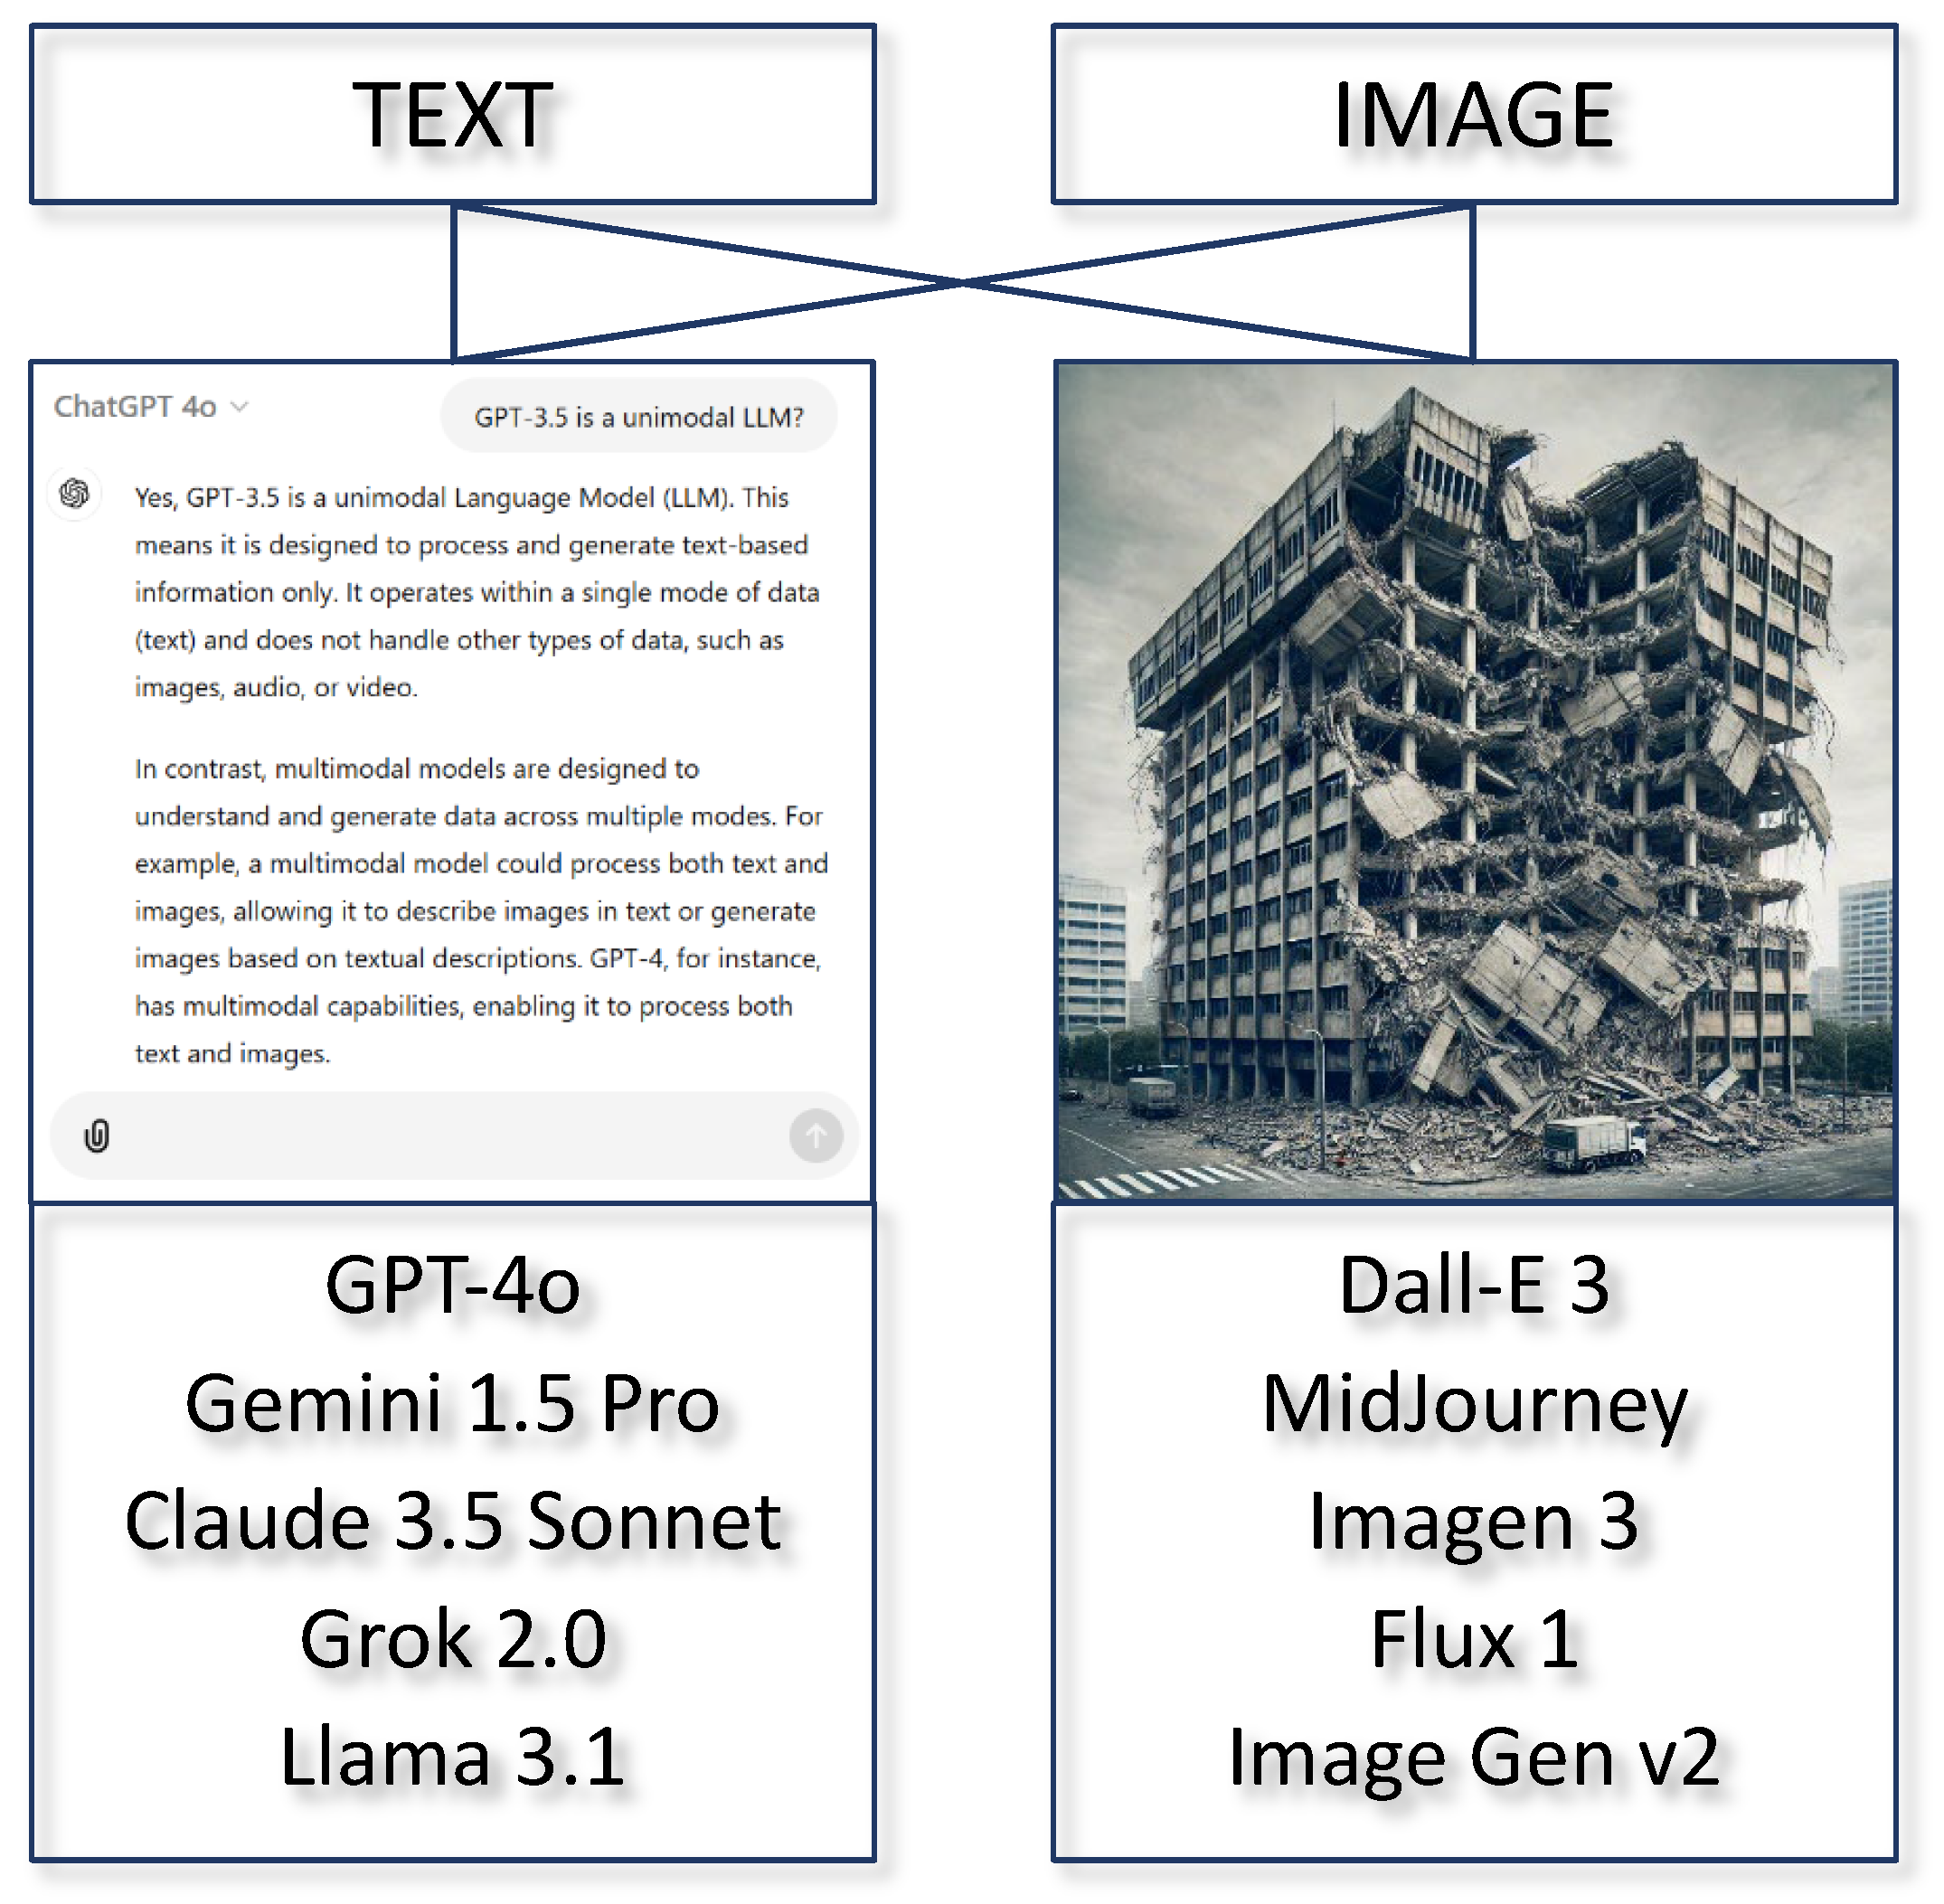
Since the introduction of the first version of ChatGPT, a chatbot powered by a Generative Pretrained Transformer (GPT) based LLM, the potential impact of such models on society has become evident, encompassing both positive and negative aspects [42]. To enable these chatbots with multimodal capabilities [11], multimodal models can be employed, such as a text-to-image diffusion model like DALL-E 3 [43], or a multimodal LLM with text-to-text and image-to-text capabilities like GPT-4 [44]. Alternatively, a combination of unimodal models may be used (e.g., an LLM like GPT-3.5 [45], initially introduced in ChatGPT on November 22, 2022 [46], paired with an image generation model), or hybrid approaches may be adopted that integrate certain multimodal components with unimodal ones, working together synergistically (Figure 2).
Given the multiplicity of FM and the rapid emergence of new models, it is crucial to understand their differences. One significant characteristic is the model size, which has increased with each generation, necessitating larger training datasets to prevent overfitting. For example, the GPT-1 model was developed with 117 million parameters and trained on 4.5 gigabytes of text data, while GPT-2 expanded to 1.5 billion parameters, trained on 40 gigabytes of text data. GPT-3 marked a substantial leap with 175 billion parameters and was trained on 570 gigabytes of text [11,45]. As for GPT-4, its exact size is debated, with some suggesting it consists of trillions of parameters [11,45], though this has not been confirmed by OpenAI [44].
The performance of these models also varies significantly. For instance, GPT-3.5’s performance is notably inferior to GPT-4 across various benchmarks [44], highlighting the need for careful model selection when using AI to assist with specific tasks.
On the other hand, GAI models can be categorized into two major groups: open-source models (or open-weight models) and closed-source models [48]. Open-source models are free and available for anyone to use, modify, and distribute. In the case of open-weight models, only the model’s parameters (the neural network weights) are modifiable, not the underlying code. Typically, closed-source models are larger and offer superior performance, but they limit customization and provide less control over the training data. However, there are now large open-source models with performance comparable to those of closed-source models [41]. The choice between an open-source (or open-weight) model and a closed-source model depends on the specific needs of its use, including budget, security requirements, and the need for customization and control over data and the model.

2.1. Transformer Architecture

The emergence of the transformer architecture [9] and GPT [10] has been pivotal in the development of LLMs. Therefore, it is crucial to have a fundamental theoretical understanding of these topics, particularly regarding their evolution, to better anticipate potential application domains [11].

2.1.1. Tokenization

Tokenization is the process aimed at creating a digital representation of a real-world object. In the context of LLMs, text is divided into tokens, which can be words, sub-words, or individual characters. These tokens are mapped to specific codes (numerical identifiers) [49], as illustrated in Figure 3. The same principle can also be applied to images, where images are similarly tokenized to facilitate processing by AI models [50].

2.1.2. Embedings

Each token is converted into a numerical vector known as an embedding, of a specific dimension (dimension N E ), as depicted in Figure 4. This vector aims to represent the meaning of the word (or token) in a multidimensional vector space, capturing both semantic and syntactic relationships with other tokens [51]. Accordingly, the model has a predefined vocabulary of tokens with a certain size ( N V ), and an embedding matrix is created with dimensions equal to N E × N V (each column represents the vector representation of a token from the vocabulary in the embedding space) [52].
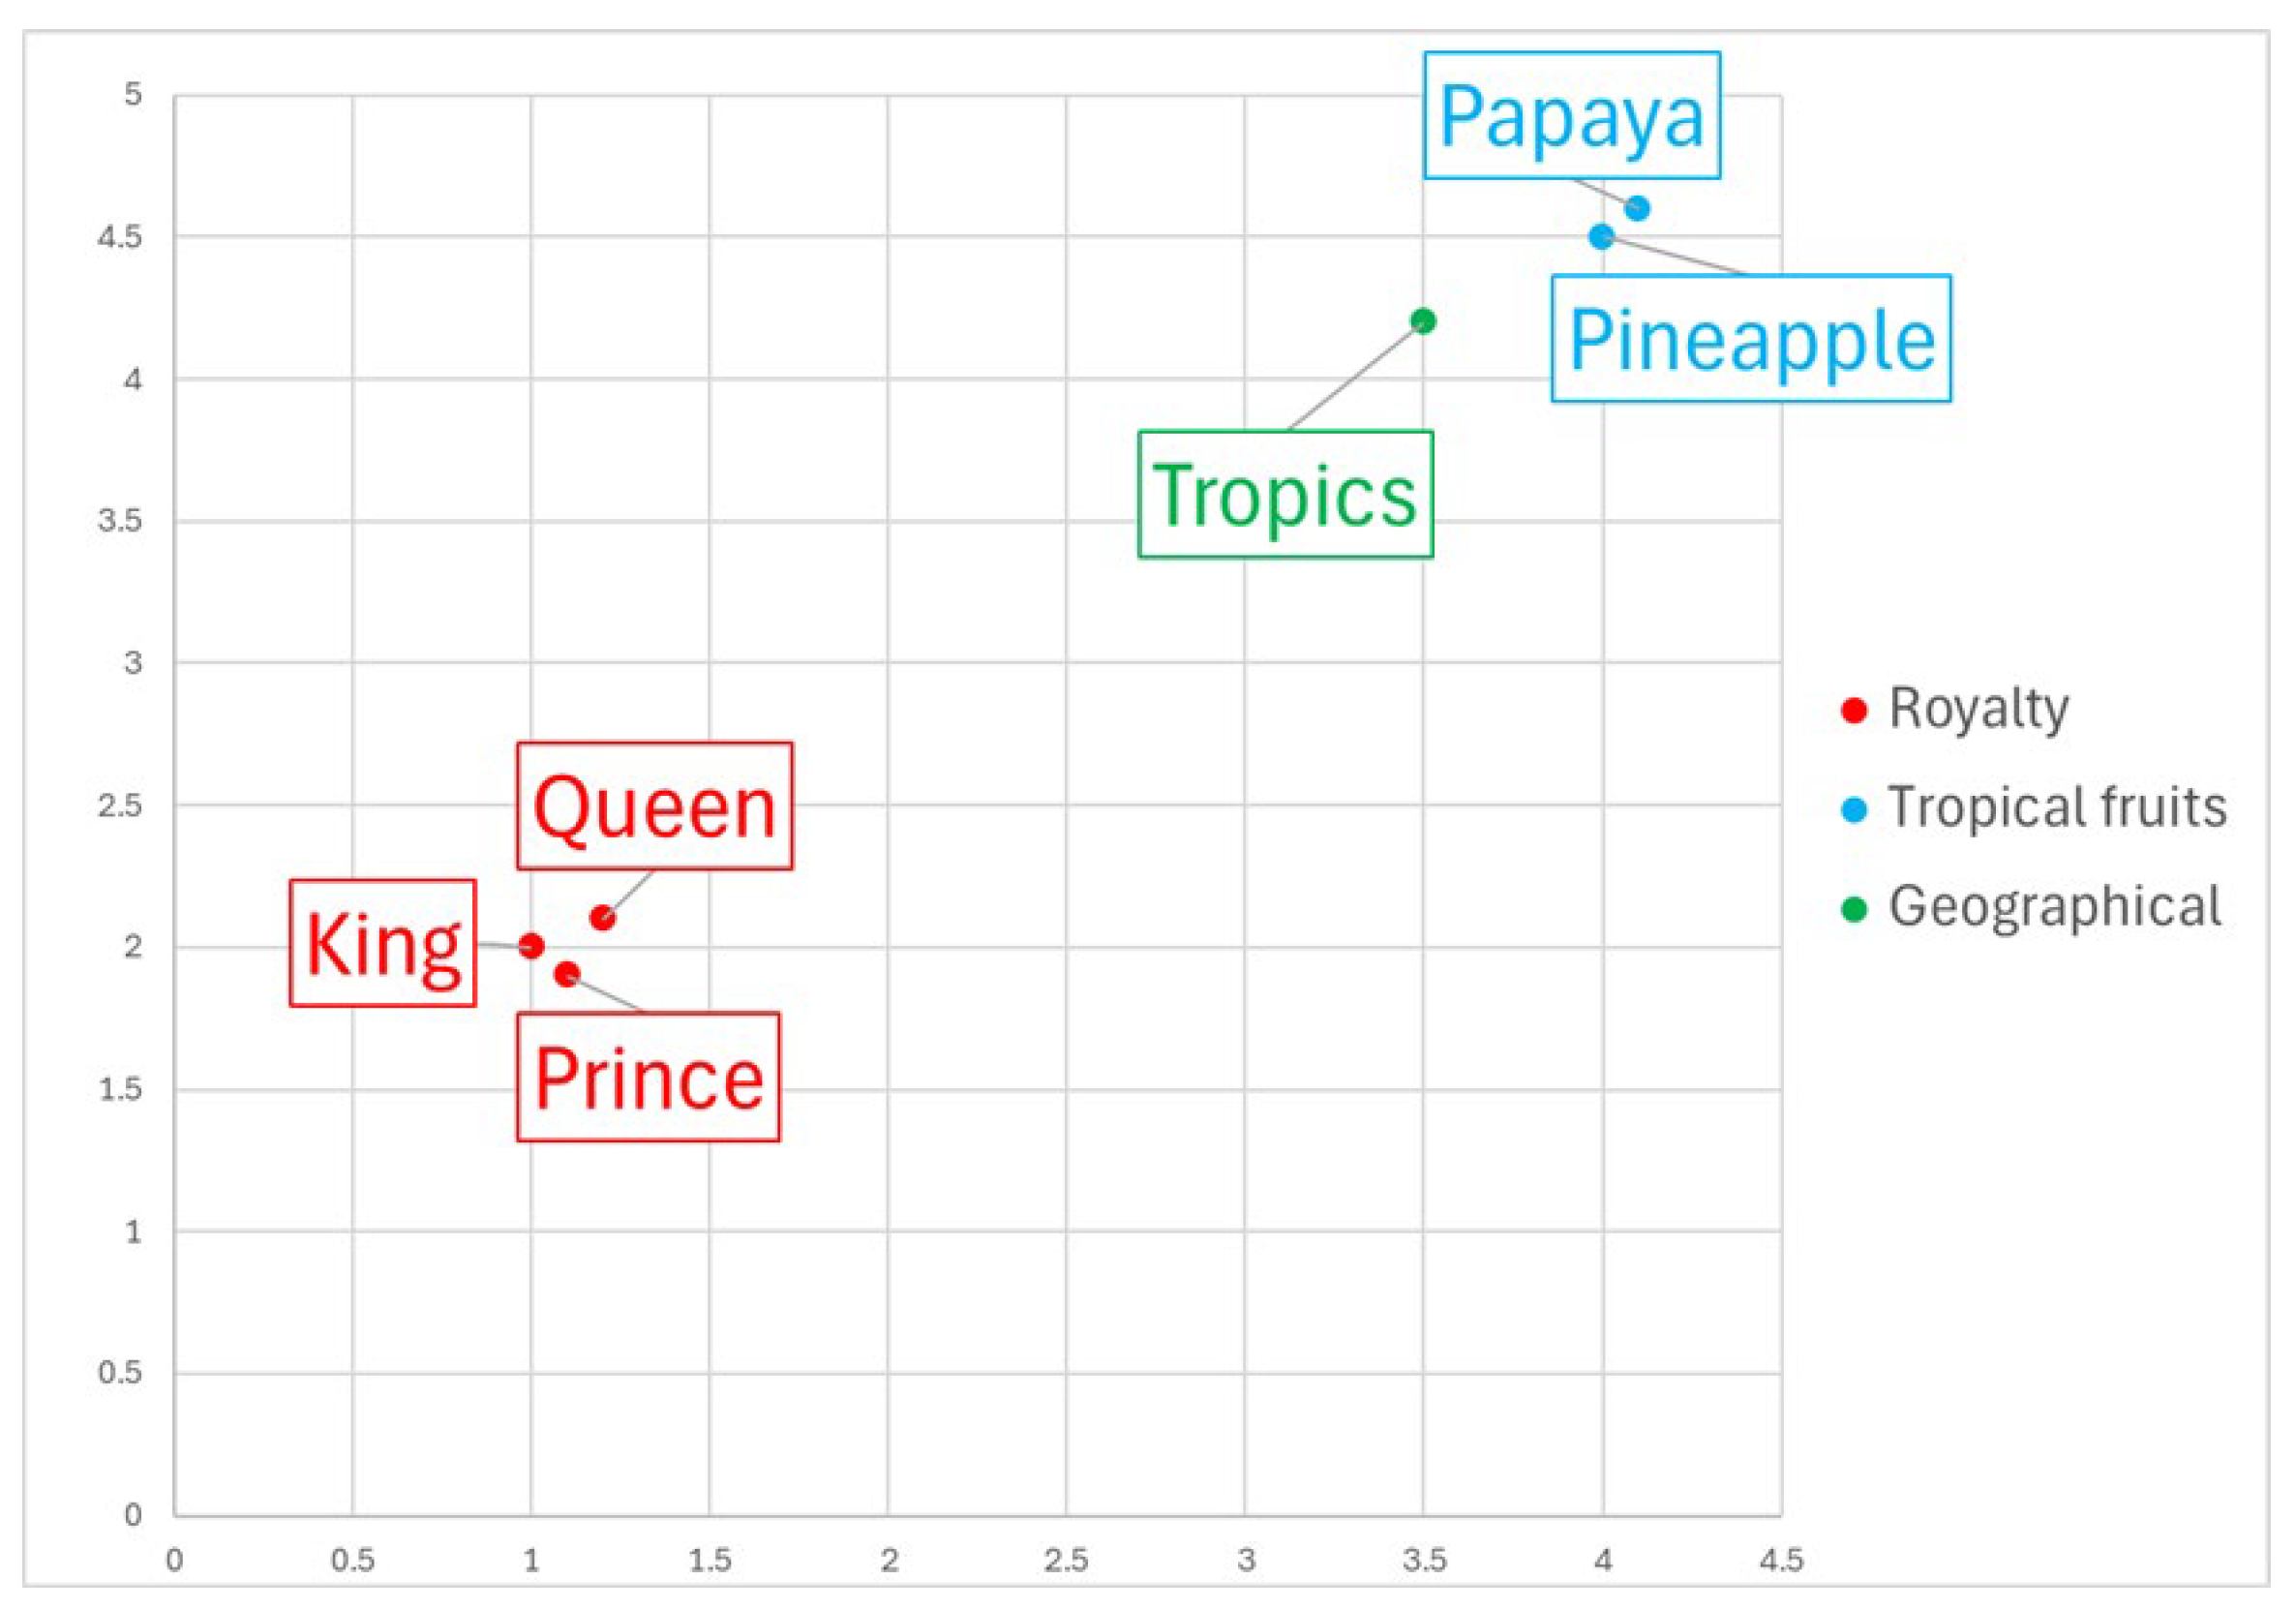
The distance between two vectors measures their relatedness [53,54]. Small distances indicate high relatedness, while large distances suggest low relatedness. To better understand this concept, consider the embeddings represented in the two-dimensional space shown in Figure 5. The “Royalty” cluster consists of the words King, Queen, and Prince, which are located close to each other because they are semantically related, representing terms associated with monarchy and nobility. Their coordinates reflect their strong semantic connections, forming a tight cluster in the vector space. The “Tropical Fruits” cluster is composed of the words Pineapple and Papaya, which are located in another region of the space, reflecting their semantic relationship as tropical fruits. This cluster is distant from the Royalty cluster, highlighting the distinct context and meaning of these words. The “Geographical” cluster contains only the word Tropics, which is associated with geographical and environmental concepts, particularly relating to regions where fruits like pineapples and papayas grow. Therefore, it is placed closer to the Tropical Fruits cluster than to the Royalty cluster, but still distinct to indicate its unique context.

2.1.3. Attention Mechanism

There are different types of attention mechanisms, such as self-attention, which occurs within the same sequence (e.g., between words in a sentence), and cross-attention, which occurs between different sequences (e.g., between a question and a context in question-answering systems) [55].
Typically, attention mechanisms involve three distinct steps in each attention layer: calculating the attention score, applying the softmax function to obtain probabilities, and generating the context vector.
The attention score is a concept in DL models that combines proximity in the embedding space and relevance in the context. For each token, three vectors are created [9]: Query (Q), Key (K), and Value (V), using projection matrices W Q , W K , and W V (weight matrices whose dimensions correspond to the embedding space dimensions and the projection space dimensions, which typically match the embedding space dimensions) [55].
The Q vector represents the query for which the model is attempting to find relevant information. It is derived from the token being processed and seeks to identify which parts of the input should be focused on. The K vector represents the “key” that is compared with the query to measure compatibility or relevance. Each token in the input sequence has its own key vector. The V vector contains the information that will be extracted and combined based on the relevance calculated between the query and the keys. It represents the information associated with each token [55].
For each token i and each layer of the transformer model, we have:
Q i = e m b e d d i n g _ t o k e n i · W Q ,
K i = e m b e d d i n g _ t o k e n i · W K ,
V i = e m b e d d i n g _ t o k e n i · W V .
Many practical implementations utilize multi-head attention mechanisms [9], where multiple sets of Q, K, and V vectors are used in parallel.
In each layer of the transformer model, when evaluating a token, the relevance (or “attention”) between that token and all other tokens in the prompt is calculated. Therefore, an attention score matrix is generated (with dimensions N T × N T , where N T is the number of tokens in the prompt). Each entry of the matrix s c o r e i j represents the attention score between token i and token j in the prompt and is computed as:
s c o r e i j = Q i · K j T .
Subsequently, the attention scores are normalized using the softmax function, converting them into probabilities. These probabilities sum to 100% and indicate the relative importance of each token in the context [52].
The context vector for a token i is then calculated as a weighted combination of the V vectors of all tokens, using the attention probabilities as weights, given by:
c o n t e x t _ v e c t o r i = j = 1 N T a t t e n t i o n _ w e i g h t s i j · V j
These vectors serve as the input to the subsequent layer. The process is repeated until the output of the last attention layer is obtained [52].
It is important to highlight that these models can only process a certain number of tokens, a characteristic referred to as context window [56], which is a crucial feature of a GAI model.

2.1.4. Next Token Prediction

The process of predicting the next token involves several steps. The context vector, derived from the attention mechanism, is processed through additional layers of the NN, such as feed-forward neural network layers. The resulting state then passes through an output layer, typically a linear transformation followed by a softmax function. This generates a probability distribution over all tokens in the model’s vocabulary. The token with the highest probability is generally selected as the next in the sequence, though techniques like sampling can be employed to introduce diversity. This process occurs iteratively, with each new predicted token being added to the context for the next prediction [41,52,55] (Figure 6).

2.1.5. Temperature and Top-P

Temperature is a parameter that controls the randomness of predictions made by a LLM. It adjusts the probability distribution associated with the prediction of the next token. A lower temperature (<1) reduces randomness, leading the model to select words with higher probabilities more conservatively. This results in more predictable and deterministic text. If the temperature is set to zero, the next token generated will be the one with the highest probability. Conversely, a higher temperature (>1) increases randomness, allowing the model to choose less probable words more frequently. This can produce more varied and creative text, but may also introduce incoherence [52].
In addition to temperature, another parameter that can be adjusted in a model (especially when using an API) is top-P (nucleus sampling). Instead of considering all possible words, the model selects only the words whose cumulative probability reaches a cut-off value P [57].
Low values of temperature and top-P result in safer and more coherent texts, ideal for applications where precision and clarity are crucial, such as document summaries or formal responses. Higher values of temperature and top-P allow for more creative and varied text generation, making them better suited for tasks like story writing or brainstorming.

2.2. Prompt Engineering

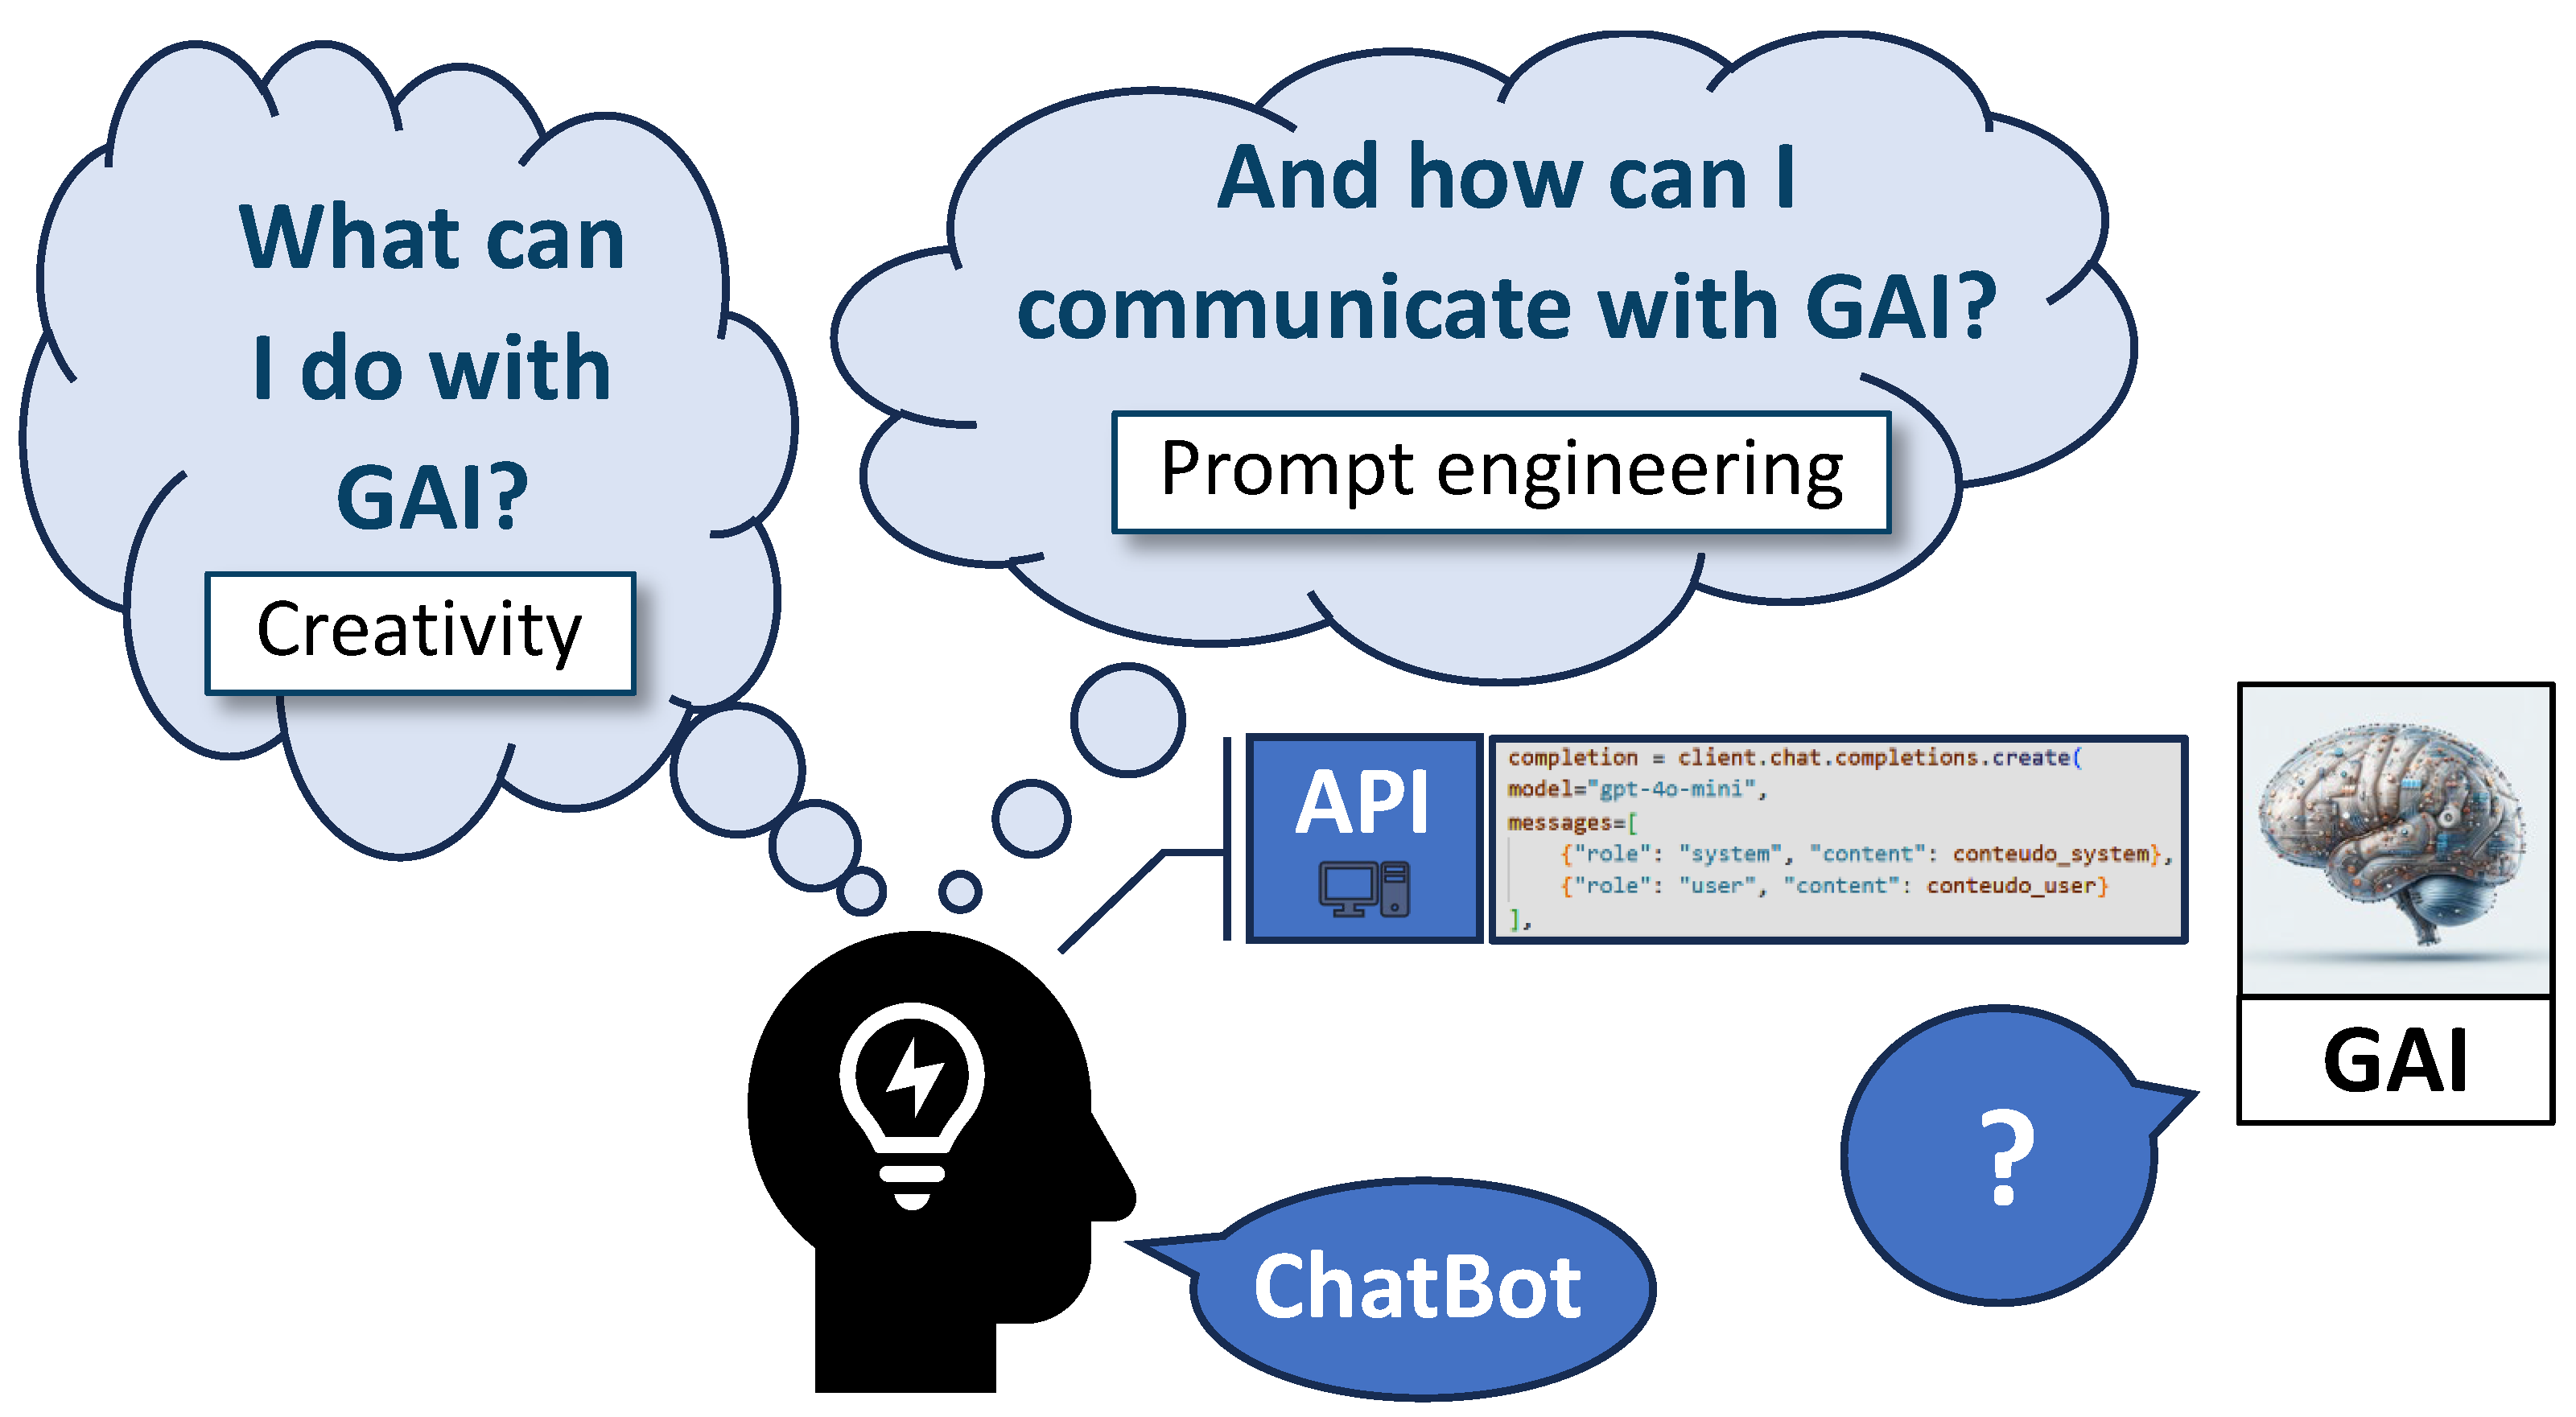
To develop effective strategies for utilizing GAI models in socially beneficial activities, it is essential first to have a theoretical understanding of the subject. This involves leveraging human creativity and possessing knowledge of prompt engineering (Figure 7).
A prompt is a set of instructions given to a GAI model, such as a Large Language Model (LLM), to generate a desired output. The prompts can significantly influence the generated results, including their accuracy. In this context, prompt engineering is becoming increasingly important [58], particularly in efforts to minimize the occurrence of “hallucinations” in LLMs.
In the context of LLMs, “hallucination” refers to the generation of incorrect or unintended responses [59]. These hallucinations may present in various forms: 1) internal inconsistency within the response, such as the LLM generating contradictory statements; 2) contradiction of the prompt, where the response diverges from the intended meaning of the question (e.g., a positive inquiry receives a negative reply); 3) factual inaccuracies; or 4) contextually misplaced information, where correct data is presented but does not adhere to the specific instructions provided to the LLM.
Several factors contribute to hallucinations in LLMs. The most evident is the quality of the training data. If the LLM lacks data on a particular topic, it is more likely to generate a hallucination - producing text that is grammatically correct but factually inaccurate. Thus, the more specialized the topic, particularly if it is not well-represented in freely accessible online sources, the higher the likelihood of hallucination. The type of LLM also plays a role; for instance, the hallucination rate is higher in GPT-3.5 compared to GPT-4 [60]. Another significant source of hallucinations relates to the quality of the prompts used. A well-structured prompt can guide the LLM toward generating accurate results, whereas a poorly constructed prompt might lead to hallucination [58]. This is the aspect of hallucination control that users can most easily manage.
In this context, the need for the development of prompt engineering emerges, where human capabilities such as creativity and intuition play a crucial role, alongside interdisciplinary knowledge [61].
A good prompt should be concise (with brief and clear instructions), logical (structured and coherent instructions), explicit (clear directives on how to present results), adaptive (balancing creativity and specificity), and reflective (prompt refinement should result from multiple tests that assess their effectiveness in known domains, particularly regarding the accuracy, coherence, and utility of responses within the given instructions) [61].
The so-called zero-shot prompt is the most basic type of instruction, where no specific context is provided on the subject being queried, yet the LLM is expected to generate a suitable response using its general knowledge (e.g., “Describe what an earthquake is.”).
One way to enhance LLM outcomes is by utilizing multiple-shot prompts. In this type of prompt, several instructions are provided to give the LLM the necessary context to recognize patterns by presenting a logical sequence of examples and instructions, thereby reducing the likelihood of hallucination [62]. One-shot prompts are a particular case where only one example is given for the LLM to correctly replicate that pattern in another task. This type of prompt requires some subject matter knowledge to ensure that the example presented to the LLM is accurate.
More sophisticated strategies are also emerging, such as the use of “Tree of Thoughts” [63], where instructions are provided in a manner that encourages the LLM to create different lines of reasoning (which can involve various entities, such as virtual personas). These strategies can lead to a more consensual and potentially more accurate solution.
Thus, the user’s creativity in crafting prompts, combined with their knowledge of prompt engineering, seems to be factors that can influence the reliability of results obtained using multimodal generative AI models, making it essential to test and evaluate these approaches in the context of building damage assessment.

2.3. Fine-Tuning

Typically, multimodal AI models are built upon a FM that has been trained on large datasets, often sourced from the internet. These models then undergo a fine-tuning process, often leveraging Reinforcement Learning (RL), which enhances their initial capabilities [44]. There are various strategies for implementing this fine-tuning [64].
Focusing on the current capabilities of multimodal models to extract text, objects, and general concepts from images, it becomes evident that fine-tuning the model for the specific application domain under consideration could significantly improve the accuracy of the results. However, this task presents challenges: it is computationally intensive, potentially leading to high costs, and currently, there are few multimodal models that allow for further fine-tuning. For cost-effectiveness, one might need to select a smaller, open-source (or open-weight) multimodal model. Therefore, exploring alternative strategies to enhance model performance is crucial.

2.4. Retrieval-Augmented Generation (RAG)

RAG is a technique that combines the ability to retrieve relevant information (Retrieval), interpret and augment it (Augmented), and generate well-formulated and complete responses (Generation) [65]. This technique closely mimics how a human would respond to a specific question - by reading relevant material, particularly when they do not have full knowledge on the subject.
RAG can be successfully adapted to specific problems [66], particularly in enhancing the accuracy of image interpretation, such as in radiological images [67]. Therefore, it is crucial to assess its effectiveness in post-earthquake damage evaluation using images.

3. Tested Approach

The approach proposed and partially tested in this study involves assessing post-earthquake damage by utilizing images of buildings captured on-site (e.g., using drones) and employing multimodal GAI alongside RAG or fine-tuning techniques to enhance the accuracy of the results.
The European Macroseismic Scale 1998 (EMS-98) [68] is an important tool for assessing the impacts of earthquakes. This scale classifies building damage into six levels, ranging from D0 to D5, describing damage severity progressively: D0 (No Damage) - no visible damage after a perceptible earthquake; D1 (Slight Damage) - small cracks in walls and superficial damage to non-structural elements like plaster and ceilings; D2 (Moderate Damage) - more pronounced cracks in walls, detachment of plaster, and significant damage to non-structural elements such as chimneys; D3 (Substantial Damage) - structural damage, including cracks in beams and columns, as well as extensive damage to non-structural components; D4 (Severe Damage) - severe structural damage, potentially leading to partial building collapse and generally requiring immediate evacuation; D5 (Destruction) - total or partial collapse of the building, rendering the structure completely uninhabitable.
This systematic assessment is vital for guiding post-earthquake response actions, such as determining the need for resident relocation, planning emergency interventions, and supporting reconstruction efforts in affected areas. Additionally, it provides valuable data to improve construction practices and strategies for mitigating seismic risks.
In this context, the EMS-98 scale was utilized in this study to test the current capabilities of multimodal GAI models in assessing damage to masonry and reinforced concrete (RC) buildings in post-earthquake scenarios, using only photographs of the buildings presented in EMS-98 document [68].
There were two primary reasons for selecting the images from EMS-98 document to test the capabilities of GAI in identifying damage to buildings affected by earthquakes. First, the document is openly accessible, eliminating any concerns related to confidentiality. Second, the images contained within it are exemplary, setting the standard for this type of damage assessment. If other types of images, particularly those captured from recent earthquakes, had been used, there would always be a question regarding the accuracy of human interpretation in damage assessment, which would then be compared to the models.
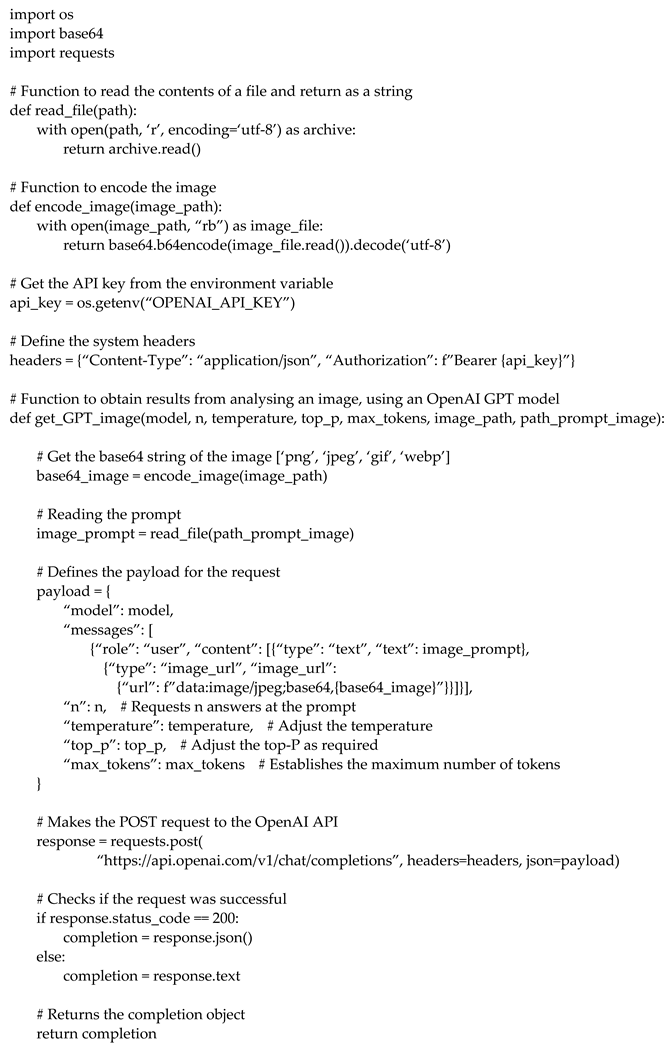
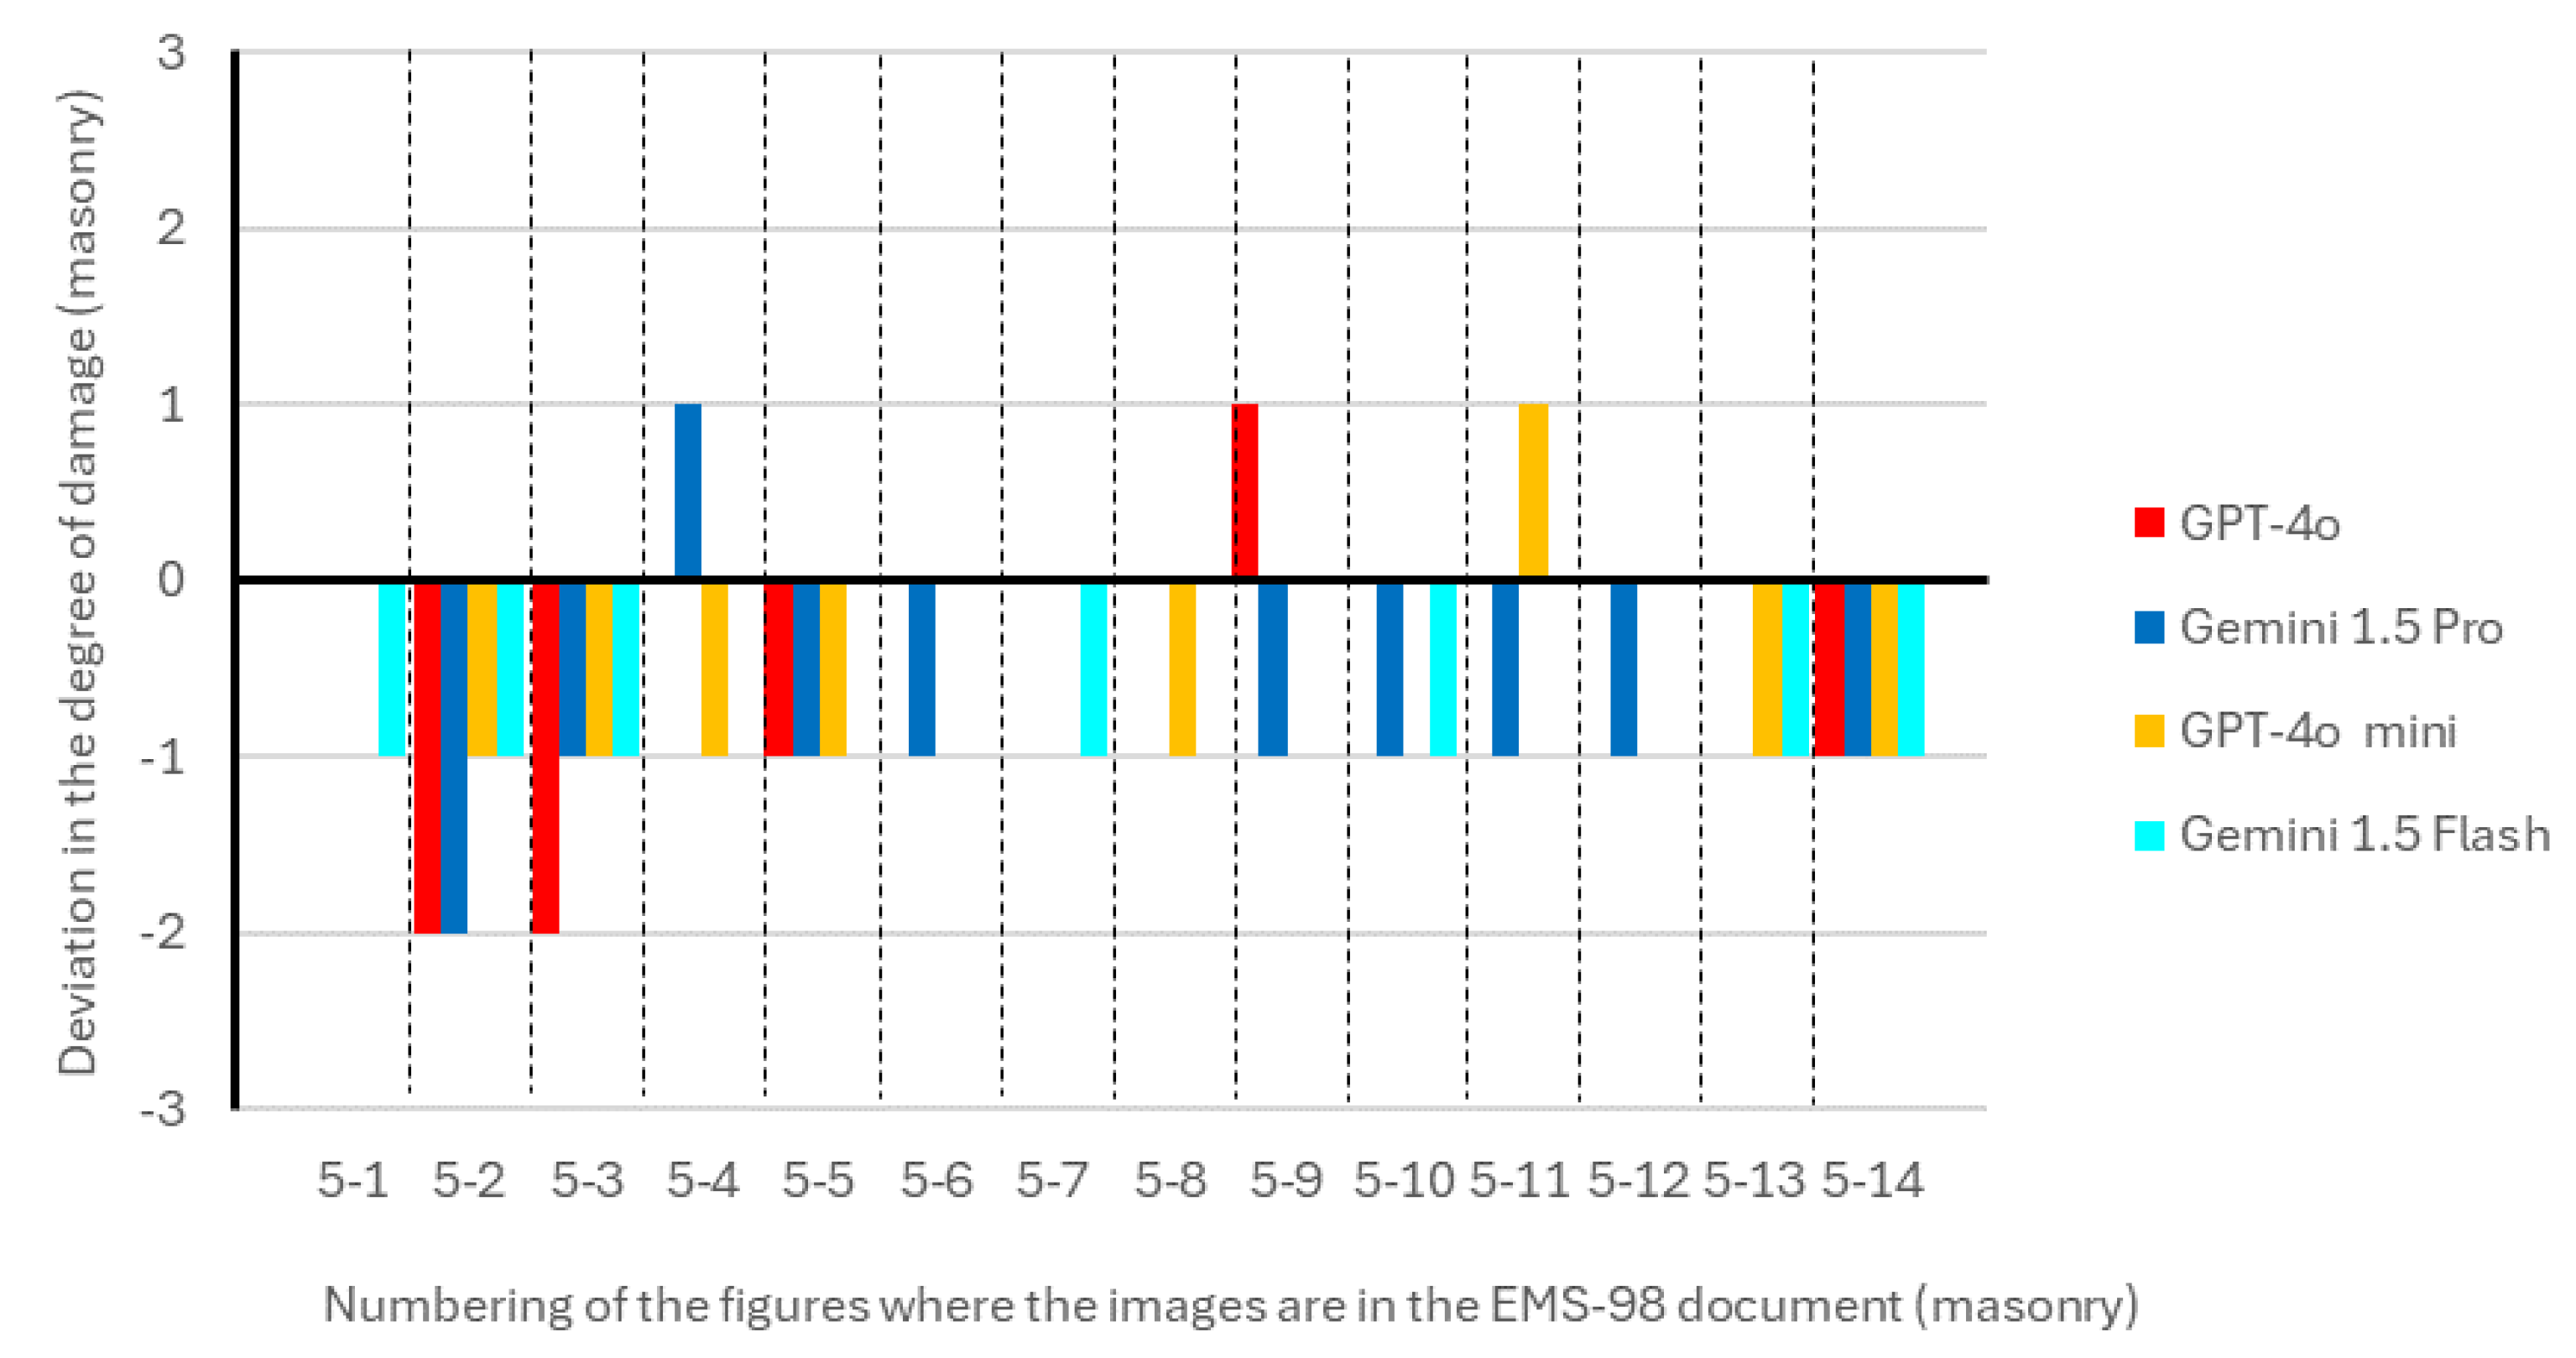
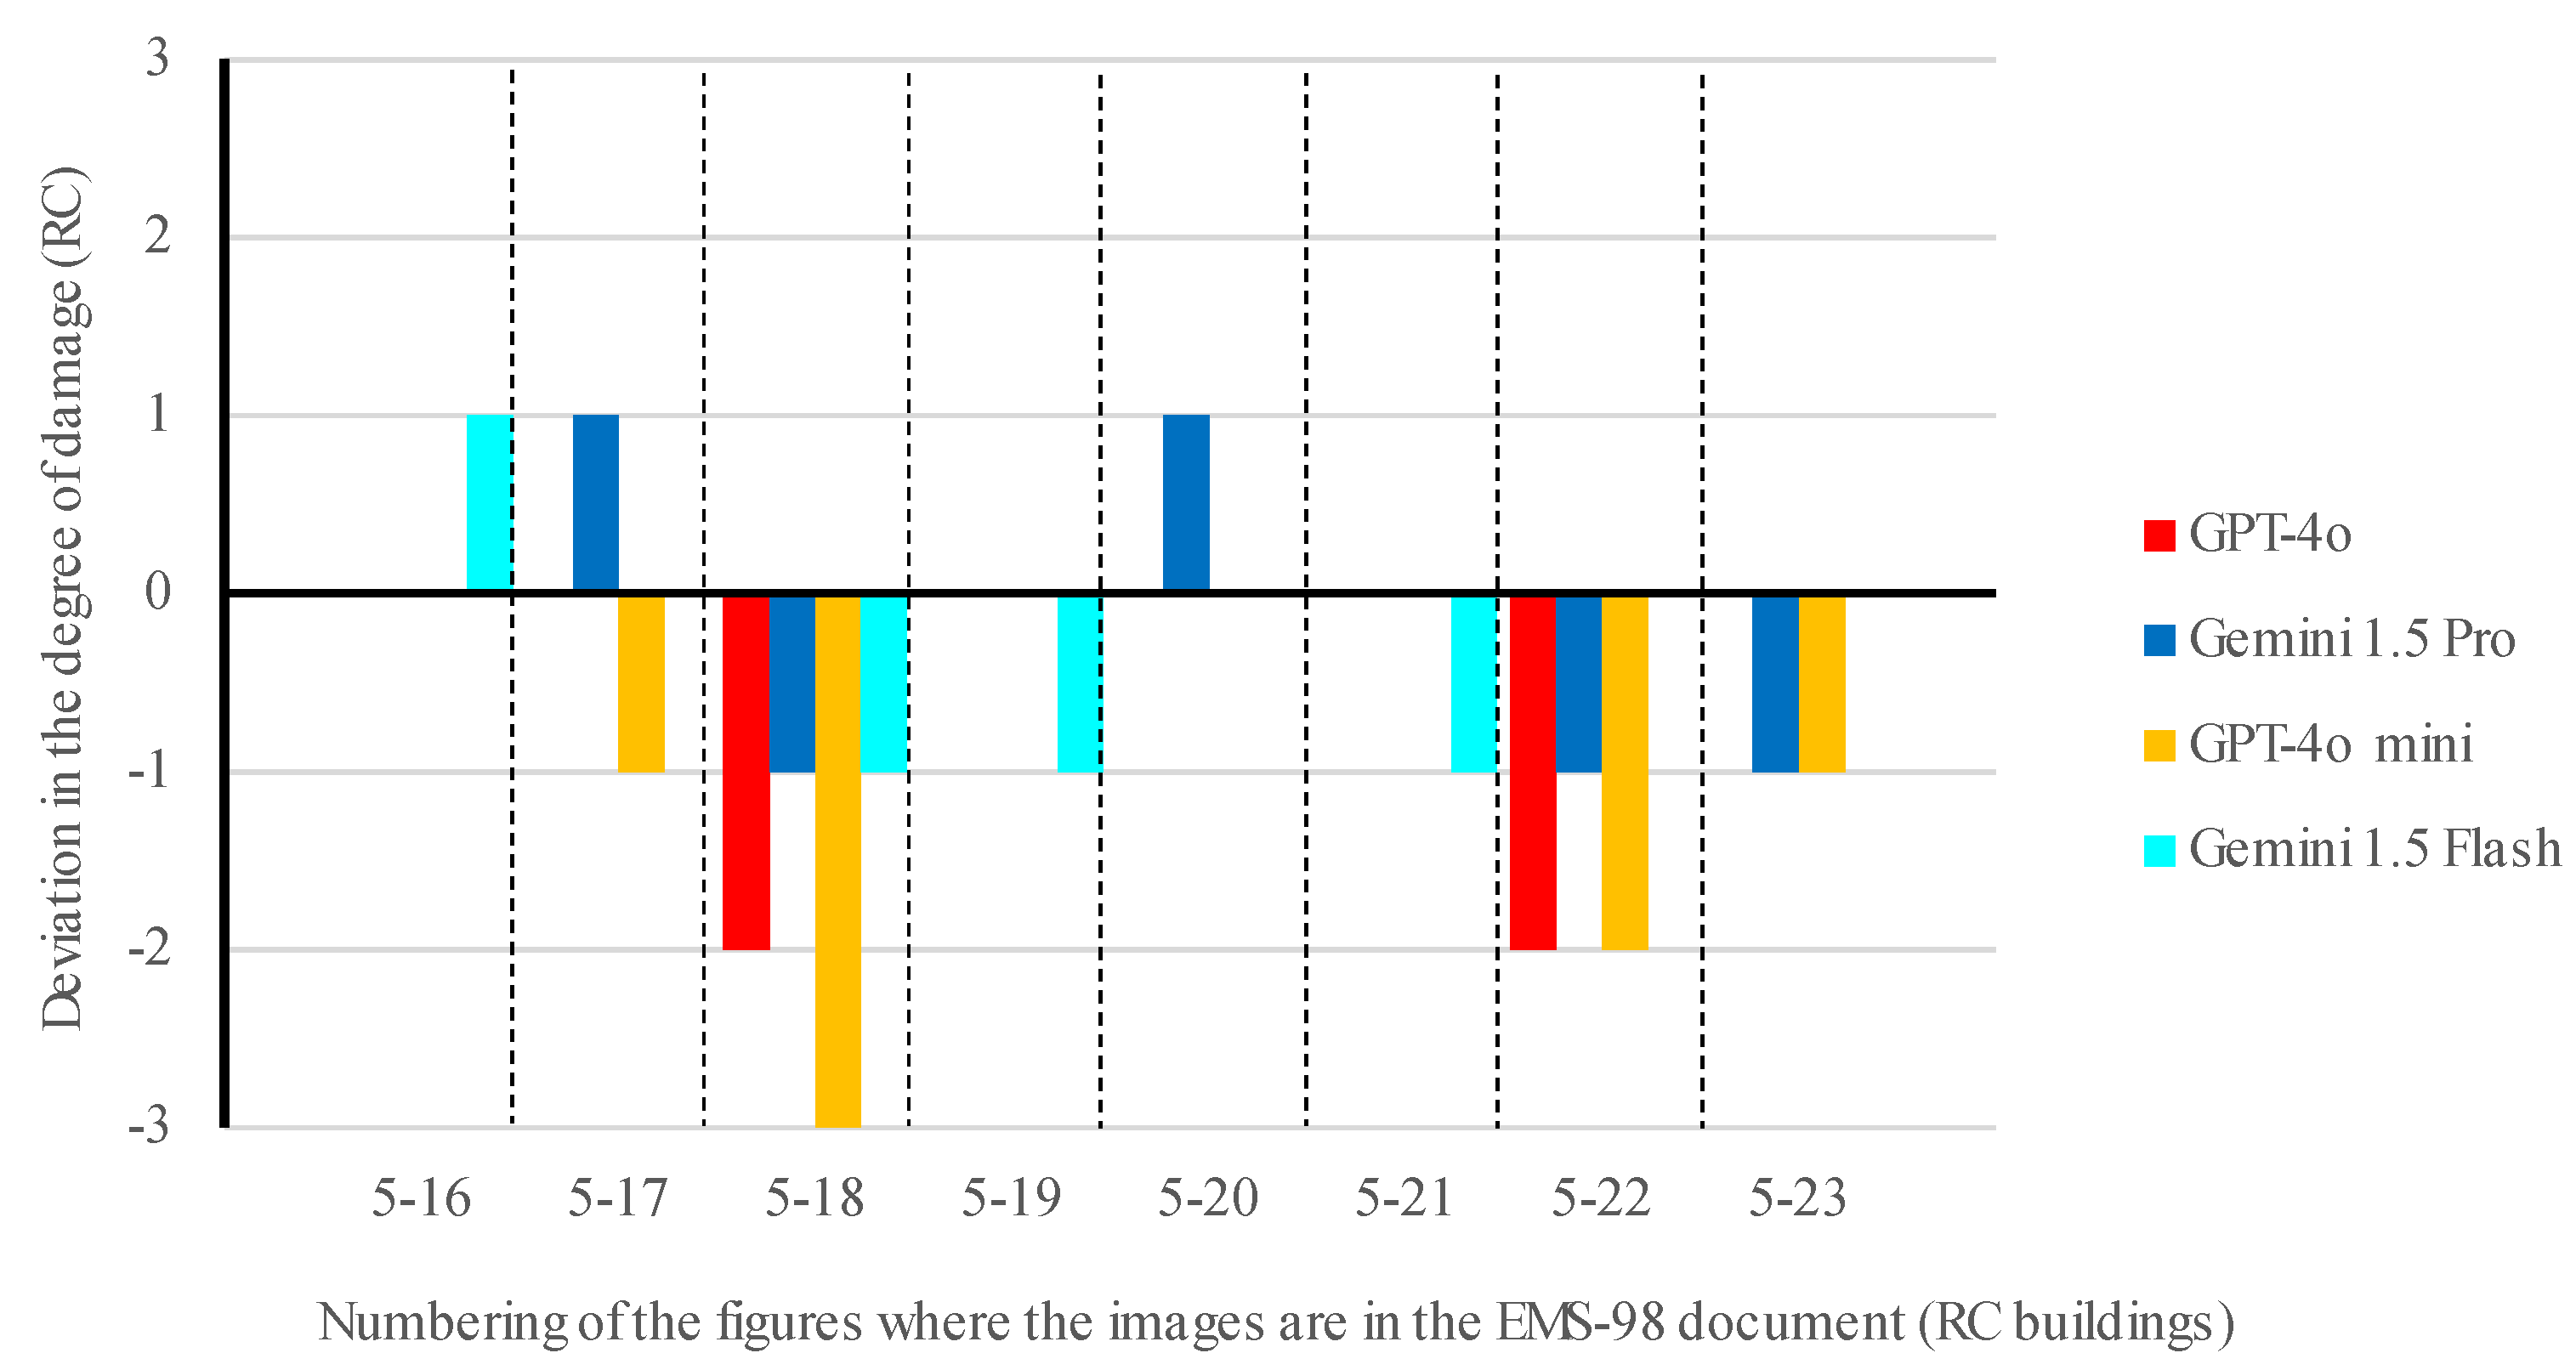
The performance of models with varying numbers of parameters and attention window sizes (with temperature = 1 and Top-P = 0.95) was evaluated, specifically OpenAI’s GPT-4o [69] (a large model that currently leads in many benchmarks, featuring a context window of 128,000 tokens), Google’s Gemini 1.5 Pro [70] (a large model with an enormous context window of approximately 2 million tokens), OpenAI’s GPT-4o mini [71] (equivalent to GPT-4o but smaller, accessed through the computer code listed in Appendix A), and Google’s Gemini 1.5 Flash [70] (with a context window of about 1 million tokens). The results obtained are presented in Table 1 and Figure 8 for the images in the EMS-98 document related to masonry buildings, and in Table 2 and Figure 9 for the images related to RC buildings, using the prompt provided in Appendix B.
Accuracy rates for masonry buildings: 64.3% with GPT-4o; 28.6% with Gemini 1.5 Pro; 42.9% with GPT-4o mini; 50.0% with Gemini 1.5 Flash. Mean error in damage degree for masonry buildings: 0.50 with GPT-4o; 0.79 with Gemini 1.5 Pro; 0.57 with GPT-4o mini; 0.50 with Gemini 1.5 Flash.
Accuracy rates for reinforced concrete buildings: 75.0% with GPT-4o; 37.5% with Gemini 1.5 Pro; 50.0% with GPT-4o mini; 50.0% with Gemini 1.5 Flash. Mean error in damage degree for reinforced concrete buildings: 0.50 with GPT-4o; 0.63 with Gemini 1.5 Pro; 0.88 with GPT-4o mini; 0.50 with Gemini 1.5 Flash.
The use of RAG was also tested with the larger models (GPT-4o and Gemini 1.5 Pro), utilizing the official EMS-98 document to improve the results. In this context, both models were able to correctly identify the damage degree for all the images previously tested without RAG, due to the memorization effect of the images.

4. Discussion

GAI models have been advancing at an accelerating rate. As a result, while some of the most recent GAI models were tested in this study, it is possible that they will already be outdated by the time this article is published. Despite this rapid advancement, the results obtained in this research can serve as a preliminary basis for the future development of software designed to perform automatic damage assessments of buildings. This could be especially important in earthquake-prone regions with a historical record of destructive earthquakes. This type of software could be crucial in regions like the Algarve (Portugal), which has been significantly impacted by earthquakes over time, most notably the one in 1755, where this region experienced the highest seismic intensities in Portugal [72].
It is important to emphasize that the results presented are those obtained from a single run of each of the tested models. Given the stochastic nature of these models, as described at the beginning of this article, it is possible that a slightly different outcome could be obtained in another run of the model. However, the impact of this randomness on the results is expected to be captured within the overall context of all evaluations, in principle.
It is noteworthy to observe the already significant capability of these models in identifying the existing structural systems in damaged buildings, whose images were analysed by the GAI models. Only one error occurred across all tests conducted, as can be observed from the results listed in Table 1 and Table 2.
Regarding the degree of damage, it is advisable to analyse the results obtained from masonry buildings separately from those with RC structures.
When examining the errors presented in Figure 8, for masonry buildings, it can be noted that these are generally within the range of one degree (+1 or −1), except for the buildings shown in Figures 5-2 and 5-3 of the EMS-98 document. The most significant errors (−2) are likely due to the fact that these images are in black and white in the EMS-98 document. Furthermore, most of the images are old and of low resolution, which may or may not present greater challenges for the models, particularly in the precise identification of small cracks. It is important to highlight that some tests were conducted with more recent images, whose results were not presented in this study for the reasons mentioned above, and the consistency of the results presented in this study was maintained. The variation of +1 or −1 observed in the damage degree indicates that the models still have some difficulty in accurately predicting the correct value for masonry buildings, but they are already very close. This type of variation might also be expected in the context of human assessment, which makes these results very promising from the outset.
Regarding buildings with RC structures, although the average error was lower than that obtained for masonry buildings, the maximum degree of error was higher (−3), as presented in Figure 9, which somewhat contradicted initial expectations, and there is no clear explanation for this fact.
In both types of buildings, the GPT-4o model demonstrated the best performance.
It also became evident that larger models do not always yield better results. For example, in this study, the Gemini 1.5 Flash model (more recent) delivered better results than the Gemini 1.5 Pro model (bigger but older).
To illustrate the type of responses generated by the models, several results have been reproduced in Appendix C. These include those obtained for Figure 5-4 (a correct identification of the damage level of a masonry building), Figure 5-17 (an incorrect identification of the building type), and Figure 5-19 (a correct identification of the damage level of a RC structure) from the EMS-98 document.
It is likely that, with fine-tuning of the models or even with a simpler process such as the application of RAG techniques (as was tested, where the Gemini 1.5 Pro excelled), significantly higher levels of accuracy can be achieved in the future.

5. Conclusions

Based on this study, the following key conclusions can be drawn:
-
It is relatively straightforward to create software for the automatic assessment of building damage in post-earthquake scenarios by integrating calls to Generative AI (GAI) models via an API.
-
Using recent multimodal GAI models of different sizes, such as GPT-4o, GPT-4o mini, Gemini 1.5 Pro, and Gemini 1.5 Flash, very different results were obtained. The overall average accuracy values were: 68.2% with GPT-4o; 31.8% with Gemini 1.5 Pro; 45.5% with GPT-4o mini; and 50.0% with Gemini 1.5 Flash. GPT-4o demonstrated the lowest average error.
-
Although the results are not yet ideal, based on the tests conducted, it is possible to conclude that the use of techniques such as RAG or fine-tuning (which is more demanding) could significantly improve the outcomes. Thus, the future use of GAI models appears to be feasible for preliminary damage assessments of buildings subjected to seismic vibrations.

Acknowledgments

We would like to acknowledge the funding provided by FCT to the projects LA/P/0069/2020 awarded to the Associate Laboratory ARNET and UID/00350/2020 awarded to CIMA of the University of the Algarve.

Conflicts of Interest

The author declares no conflicts of interest.

Appendix A

Example of Python code used to call the OpenAI API (all required libraries were previously installed on a personal computer) with the goal of extracting information from an image stored on the hard drive of a personal computer:
Preprints 118197 i001

Appendix B

Adopted prompt using Markdown (which is a simple and easy-to-use markup language for formatting documents):
# Task
1. Look at the images of one building very carefully;
2. Identify the type of building based of the main structural system (masonry, reinforced concrete, timber or steel);
3. Classify the degree of seismic damage to the building;
4. Present your degree of confidence in the assessment you made (0 to 100%).
# Role
You are an earthquake engineer
# Format
## Material
1. Type of building
2. Degree of confidence
## Damage
1. Grade
2. Degree of confidence
## Explanation
### Material
### Damage
### Confidence
# Conditions
The degree of damage is assigned according to EMS-98 (D0, D1, D2, D3, D4 or D5).

Appendix C

Example of a correct output of a model for Figure 5-4 of the EMS-98 document (GPT-4o):
Material
Type of building: Masonry
Degree of confidence: 90%
Damage
Grade: D4 (Very heavy damage)
Degree of confidence: 85%
Explanation
Material
The building in the images appears to be made primarily of masonry. This assessment is based on the visible cracking patterns and the type of material exposed in the damaged areas, which resemble typical masonry construction with visible stones or bricks and mortar. The absence of visible reinforcing bars and the nature of the wall construction further support this conclusion.
Damage
The observed damage in the images includes:
Severe cracking and partial collapse of the walls.
Significant loss of structural integrity, particularly at the corners and edges of the building.
Large sections of the wall have crumbled and fallen away, exposing the interior.
Extensive damage to load-bearing walls, which indicates a compromise in the building’s structural stability.
These observations align closely with the description of D4 (very heavy damage), which involves heavy structural damage and potentially very heavy non-structural damage. The building appears to be on the verge of collapse, which is characteristic of D4 damage, but it is not entirely demolished, distinguishing it from D5.
Confidence
The confidence levels are based on the clarity of the visible damage and the typical characteristics of masonry buildings. The visual evidence strongly supports the identification of the material and the classification of the damage, leading to high confidence levels in both assessments.
Example of an output of a model for Figure 5-17 of the EMS-98 document (GPT-4o mini):
Material
1. Type of building: Masonry
2. Degree of confidence: 90%
Damage
1. Grade: D3
2. Degree of confidence: 85%
Explanation
Material
The building appears to be constructed of masonry due to the visible brick and concrete elements that are typical in this type of construction. The presence of cracked walls and structural damage indicates that it is not reinforced concrete or steel.
Damage
The damage observed includes significant structural failure, including collapsed sections and large cracks, which aligns with a grade of D3 according to EMS-98. This grade indicates that the building has sustained considerable damage, affecting its integrity but not resulting in total collapse.
Confidence
The confidence levels are high due to clear visual indicators of material type and the extent of the damage observed, albeit with some uncertainty due to the limitations of assessing from a single image.
Example of an output of a model for Figure 5-19 of the EMS-98 document (GPT-4o):
Material
Type of building: Reinforced concrete
Degree of confidence: 90%
Damage
Grade: D5
Degree of confidence: 95%
Explanation
Material
The building in the image appears to be constructed primarily of reinforced concrete. This assessment is based on the visible structure, which includes concrete floors and columns that are characteristic of reinforced concrete buildings. Additionally, the manner in which the building has collapsed suggests that the primary structural system is reinforced concrete, as masonry buildings typically collapse differently, and timber or steel structures would not exhibit the same kind of damage.
Damage
The damage observed in the building is extensive. The building has suffered partial collapse, with significant portions of the structure having disintegrated and fallen. This level of destruction corresponds to a Grade D5 classification according to the EMS-98 scale, which indicates very heavy damage or destruction. The visible signs include:
Complete collapse of large sections of the building.
Structural elements, such as columns and beams, have failed.
Extensive debris from the building’s collapse is present.
Confidence
The degree of confidence in the material identification is 90% because the visible evidence strongly indicates reinforced concrete, though there might be some uncertainty due to the lack of close-up views of the construction materials. The confidence in the damage assessment is 95% because the extent of the collapse and the type of damage observed clearly match the criteria for Grade D5 damage as per EMS-98 standards.

References

  1. Estêvão, J.M.C. Modelo computacional de avaliação do risco sísmico de edifícios (Computational model for seismic risk assessment of buildings). MSc thesis, Instituto Superior Técnico, UTL, Lisbon, 1998.
  2. Klein, D. Neural Networks for Chess. The magic of deep and reinforcement learning revealed; arXiv:2209.01506: 2022. [CrossRef]
  3. Estêvão, J.M.C. Feasibility of using neural networks to obtain simplified capacity curves for seismic assessment. Buildings 2018, 8, 151. [CrossRef]
  4. de-Miguel-Rodríguez, J.; Morales-Esteban, A.; Requena-García-Cruz, M.-V.; Zapico-Blanco, B.; Segovia-Verjel, M.-L.; Romero-Sánchez, E.; Estêvão, J.M.C. Fast Seismic Assessment of Built Urban Areas with the Accuracy of Mechanical Methods Using a Feedforward Neural Network. Sustainability 2022, 14. [CrossRef]
  5. Estêvão, J.M.C.; Morales-Esteban, A.; Sá, L.F.; Ferreira, M.A.; Tomás, B.; Esteves, C.; Barreto, V.; Carreira, A.; Braga, A.; Requena-Garcia-Cruz, M.-V., et al. Improving the Earthquake Resilience of Primary Schools in the Border Regions of Neighbouring Countries. Sustainability 2022, 14. [CrossRef]
  6. Krizhevsky, A.; Sutskever, I.; Hinton, G.E. ImageNet classification with deep convolutional neural networks. Commun. ACM 2017, 60, 84–90. [CrossRef]
  7. LeCun, Y.; Boser, B.; Denker, J.S.; Henderson, D.; Howard, R.E.; Hubbard, W.; Jackel, L.D. Backpropagation Applied to Handwritten Zip Code Recognition. Neural Computation 1989, 1, 541-551. [CrossRef]
  8. Alom, M.Z.; Taha, T.M.; Yakopcic, C.; Westberg, S.; Sidike, P.; Nasrin, M.S.; Esesn, B.C.V.; Awwal, A.A.S.; Asari, V.K. The History Began from AlexNet: A Comprehensive Survey on Deep Learning Approaches. arXiv:1803.01164v2 2018, 1-39. [CrossRef]
  9. Vaswani, A.; Shazeer, N.; Parmar, N.; Uszkoreit, J.; Jones, L.; Gomez, A.N.; Kaiser, Ł.; Polosukhin, I. Attention is all you need. In Advances in neural information processing systems, 2017; pp. 5998–6008.
  10. Radford, A.; Narasimhan, K.; Salimans, T.; Sutskever, I. Improving Language Understanding by Generative Pre-Training. Availabe online: https://cdn.openai.com/research-covers/language-unsupervised/language_understanding_paper.pdf (accessed on 10/07/2024).
  11. Yenduri, G.; Ramalingam, M.; Selvi, G.C.; Supriya, Y.; Srivastava, G.; Maddikunta, P.K.R.; Raj, G.D.; Jhaveri, R.H.; Prabadevi, B.; Wang, W., et al. GPT (Generative Pre-Trained Transformer) - A Comprehensive Review on Enabling Technologies, Potential Applications, Emerging Challenges, and Future Directions. IEEE Access 2024, 12, 54608-54649. [CrossRef]
  12. Yildirim, I.; Paul, L.A. From task structures to world models: what do LLMs know? Trends in Cognitive Sciences 2024, 28, 404-415. [CrossRef]
  13. Matin, S.S.; Pradhan, B. Challenges and limitations of earthquake-induced building damage mapping techniques using remote sensing images-A systematic review. Geocarto International 2022, 37, 6186-6212. [CrossRef]
  14. Ishiwatari, M. Leveraging Drones for Effective Disaster Management: A Comprehensive Analysis of the 2024 Noto Peninsula Earthquake Case in Japan. Progress in Disaster Science 2024, 10.1016/j.pdisas.2024.100348, 100348. [CrossRef]
  15. Yu, R.; Li, P.; Shan, J.; Zhang, Y.; Dong, Y. Multi-feature driven rapid inspection of earthquake-induced damage on building facades using UAV-derived point cloud. Measurement 2024, 232, 114679. [CrossRef]
  16. Yu, X.; Hu, X.; Song, Y.; Xu, S.; Li, X.; Song, X.; Fan, X.; Wang, F. Intelligent assessment of building damage of 2023 Turkey-Syria Earthquake by multiple remote sensing approaches. npj Natural Hazards 2024, 1, 3. [CrossRef]
  17. Jia, D.; Liu, Y.; Zhang, L. A rapid evaluation method of the seismic damage to buildings based on UAV images. Geomatica 2024, 76, 100006. [CrossRef]
  18. Albahri, A.S.; Khaleel, Y.L.; Habeeb, M.A.; Ismael, R.D.; Hameed, Q.A.; Deveci, M.; Homod, R.Z.; Albahri, O.S.; Alamoodi, A.H.; Alzubaidi, L. A systematic review of trustworthy artificial intelligence applications in natural disasters. Computers and Electrical Engineering 2024, 118, 109409. [CrossRef]
  19. Bhatta, S.; Dang, J. Seismic damage prediction of RC buildings using machine learning. Earthquake Engineering & Structural Dynamics 2023, 52, 3504-3527. [CrossRef]
  20. Bhatta, S.; Dang, J. Machine Learning-Based Classification for Rapid Seismic Damage Assessment of Buildings at a Regional Scale. Journal of Earthquake Engineering 2024, 28, 1861-1891. [CrossRef]
  21. Macchiarulo, V.; Giardina, G.; Milillo, P.; Aktas, Y.D.; Whitworth, M.R.Z. Integrating post-event very high resolution SAR imagery and machine learning for building-level earthquake damage assessment. Bulletin of Earthquake Engineering 2024, . [CrossRef]
  22. Anniballe, R.; Noto, F.; Scalia, T.; Bignami, C.; Stramondo, S.; Chini, M.; Pierdicca, N. Earthquake damage mapping: An overall assessment of ground surveys and VHR image change detection after L’Aquila 2009 earthquake. Remote Sensing of Environment 2018, 210, 166-178. [CrossRef]
  23. Adriano, B.; Yokoya, N.; Xia, J.; Miura, H.; Liu, W.; Matsuoka, M.; Koshimura, S. Learning from multimodal and multitemporal earth observation data for building damage mapping. ISPRS Journal of Photogrammetry and Remote Sensing 2021, 175, 132-143. [CrossRef]
  24. Akhyar, A.; Asyraf Zulkifley, M.; Lee, J.; Song, T.; Han, J.; Cho, C.; Hyun, S.; Son, Y.; Hong, B.-W. Deep artificial intelligence applications for natural disaster management systems: A methodological review. Ecological Indicators 2024, 163, 112067. [CrossRef]
  25. Amanollah, H.; Asghari, A.; Mashayekhi, M.; Zahrai, S.M. Damage detection of structures based on wavelet analysis using improved AlexNet. Structures 2023, 56, 105019. [CrossRef]
  26. Bai, Z.; Liu, T.; Zou, D.; Zhang, M.; Hu, Q.; zhou, A.; Li, Y. Multi-scale image-based damage recognition and assessment for reinforced concrete structures in post-earthquake emergency response. Engineering Structures 2024, 314, 118402. [CrossRef]
  27. Bhatta, S.; Dang, J. Multiclass seismic damage detection of buildings using quantum convolutional neural network. Computer-Aided Civil and Infrastructure Engineering 2024, 39, 406-423. [CrossRef]
  28. Braik, A.M.; Koliou, M. Automated building damage assessment and large-scale mapping by integrating satellite imagery, GIS, and deep learning. Computer-Aided Civil and Infrastructure Engineering 2024, n/a. [CrossRef]
  29. Cheng, M.-Y.; Khasani, R.R.; Citra, R.J. Image-based preliminary emergency assessment of damaged buildings after earthquake: Taiwan case studies. Engineering Applications of Artificial Intelligence 2023, 126, 107164. [CrossRef]
  30. Kijewski-Correa, T.; Canales, E.; Hamburger, R.; Lochhead, M.; Mbabazi, A.; Presuma, L. A hybrid model for post-earthquake performance assessments in challenging contexts. Bulletin of Earthquake Engineering 2024, 10.1007/s10518-024-01927-8. [CrossRef]
  31. Matin, S.S.; Pradhan, B. Earthquake-Induced Building-Damage Mapping Using Explainable AI (XAI). Sensors 2021, 21. [CrossRef]
  32. Ogunjinmi, P.D.; Park, S.-S.; Kim, B.; Lee, D.-E. Rapid Post-Earthquake Structural Damage Assessment Using Convolutional Neural Networks and Transfer Learning. Sensors 2022, 22. [CrossRef]
  33. Sublime, J.; Kalinicheva, E. Automatic Post-Disaster Damage Mapping Using Deep-Learning Techniques for Change Detection: Case Study of the Tohoku Tsunami. Remote Sensing 2019, 11. [CrossRef]
  34. Xia, H.; Wu, J.; Yao, J.; Zhu, H.; Gong, A.; Yang, J.; Hu, L.; Mo, F. A Deep Learning Application for Building Damage Assessment Using Ultra-High-Resolution Remote Sensing Imagery in Turkey Earthquake. International Journal of Disaster Risk Science 2023, 14, 947-962. [CrossRef]
  35. Yilmaz, M.; Dogan, G.; Arslan, M.H.; Ilki, A. Categorization of Post-Earthquake Damages in RC Structural Elements with Deep Learning Approach. Journal of Earthquake Engineering 2024, 28, 2620-2651. [CrossRef]
  36. You, C.; Liu, W.; Hou, L. Convolutional Neural Networks for Structural Damage Identification in Assembled Buildings. Mathematical Problems in Engineering 2022, 2022, 2326903. [CrossRef]
  37. Zhan, Y.; Liu, W.; Maruyama, Y. Damaged Building Extraction Using Modified Mask R-CNN Model Using Post-Event Aerial Images of the 2016 Kumamoto Earthquake. Remote Sensing 2022, 14. [CrossRef]
  38. Marano, G.C.; Rosso, M.M.; Aloisio, A.; Cirrincione, G. Generative adversarial networks review in earthquake-related engineering fields. Bulletin of Earthquake Engineering 2024, 22, 3511-3562. [CrossRef]
  39. Cheng, M.-Y.; Sholeh, M.N.; Kwek, A. Computer vision-based post-earthquake inspections for building safety assessment. Journal of Building Engineering 2024, 94, 109909. [CrossRef]
  40. Bommasani, R.; Hudson, D.A.; Adeli, E.; Altman, R.; Arora, S.; Arx, S.v.; Bernstein, M.S.; Bohg, J.; Bosselut, A.; Brunskill, E., et al. On the Opportunities and Risks of Foundation Models. arXiv:2108.07258v3 2022. [CrossRef]
  41. LlamaTeam. The Llama 3 Herd of Models. Availabe online: https://ai.meta.com/research/publications/the-llama-3-herd-of-models/ (accessed on 24/07/2024).
  42. Eloundou, T.; Manning, S.; Mishkin, P.; Rock, D. GPTs are GPTs: An Early Look at the Labor Market Impact Potential of Large Language Models. arXiv:2303.10130v5 2023, 1-36 . [CrossRef]
  43. Betker, J.; Goh, G.; Jing, L.; Brooks, T.; Wang, J.; Li, L.; Ouyang, L.; Zhuang, J.; Lee, J.; Guo, Y., et al. Improving Image Generation with Better Captions. Availabe online: https://cdn.openai.com/papers/dall-e-3.pdf (accessed on 12/07/2024).
  44. OpenAI. GPT-4 Technical Report. arXiv:2303.08774v6 2023, 1-100 . [CrossRef]
  45. Ray, P.P. ChatGPT: A comprehensive review on background, applications, key challenges, bias, ethics, limitations and future scope. Internet of Things and Cyber-Physical Systems 2023, 3, 121-154. [CrossRef]
  46. Ooi, K.-B.; Tan, G.W.-H.; Al-Emran, M.; Al-Sharafi, M.A.; Capatina, A.; Chakraborty, A.; Dwivedi, Y.K.; Huang, T.-L.; Kar, A.K.; Lee, V.-H., et al. The Potential of Generative Artificial Intelligence Across Disciplines: Perspectives and Future Directions. Journal of Computer Information Systems 2023, 10.1080/08874417.2023.2261010, 1-32. [CrossRef]
  47. 3, D.-E. Tokenizer. Availabe online: https://openai.com/index/dall-e-3/ (accessed on September 2024).
  48. Yao, Y.; Duan, J.; Xu, K.; Cai, Y.; Sun, Z.; Zhang, Y. A survey on large language model (LLM) security and privacy: The Good, The Bad, and The Ugly. High-Confidence Computing 2024, 4, 100211. [CrossRef]
  49. OpenAI. Tokenizer. Availabe online: https://platform.openai.com/tokenizer (accessed on July 2024).
  50. ChameleonTeam. Chameleon: Mixed-ModalEarly-FusionFoundation Models. arXiv:2405.09818v1 2024, 1-27. [CrossRef]
  51. Neelakantan, A.; Xu, T.; Puri, R.; Radford, A.; Han, J.M.; Tworek, J.; Yuan, Q.; Tezak, N.; Kim, J.W.; Hallacy, C., et al. Text and Code Embeddings by Contrastive Pre-Training. arXiv:2201.10005v1 2022, 1-13 . [CrossRef]
  52. Sanderson, G. But what is a GPT? Visual intro to transformers | Chapter 5, Deep Learning. Availabe online: https://www.3blue1brown.com/lessons/gpt (accessed on 17/07/2024).
  53. Mikolov, T.; Sutskever, I.; Chen, K.; Corrado, G.; Dean, J. Distributed Representations of Words and Phrases and their Compositionality. arXiv:1310.4546v1 2013, 1-9 . [CrossRef]
  54. Li, Y.; Xu, L.; Tian, F.; Jiang, L.; Zhong, X.; Chen, E. Word Embedding Revisited: A New Representation Learning and Explicit Matrix Factorization Perspective. In Proceedings of Twenty-Fourth International Joint Conference on Artificial Intelligence, Buenos Aires, Argentina; pp. 3650-3656.
  55. Sanderson, G. Visualizing Attention, a Transformer’s Heart | Chapter 6, Deep Learning. Availabe online: https://www.3blue1brown.com/lessons/attention (accessed on 17/07/2024).
  56. Gemini Team, G. Gemini 1.5: Unlocking multimodal understanding across millions of tokens of context. arXiv:2403.05530v3 2024, 1-154 . [CrossRef]
  57. Holtzman, A.; Buys, J.; Du, L.; Forbes, M.; Choi, Y. The Curious Case of Neural Text Degeneration. arXiv:1904.09751v2 2020, 1-16 . [CrossRef]
  58. White, J.; Fu, Q.; Hays, S.; Sandborn, M.; Olea, C.; Gilbert, H.; Elnashar, A.; Spencer-Smith, J.; Schmidt, D.C. A Prompt Pattern Catalog to Enhance Prompt Engineering with ChatGPT. arXiv:2302.11382v1 2023, 1-19 . [CrossRef]
  59. Ji, Z.; Lee, N.; Frieske, R.; Yu, T.; Su, D.; Xu, Y.; Ishii, E.; Bang, Y.J.; Madotto, A.; Fung, P. Survey of Hallucination in Natural Language Generation. ACM Comput. Surv. 2023, 55, Article 248. [CrossRef]
  60. López Espejel, J.; Ettifouri, E.H.; Yahaya Alassan, M.S.; Chouham, E.M.; Dahhane, W. GPT-3.5, GPT-4, or BARD? Evaluating LLMs reasoning ability in zero-shot setting and performance boosting through prompts. Natural Language Processing Journal 2023, 5, 100032. [CrossRef]
  61. Lo, L.S. The Art and Science of Prompt Engineering: A New Literacy in the Information Age. Internet Reference Services Quarterly 2023, 10.1080/10875301.2023.2227621, 1-8. [CrossRef]
  62. Brown, T.B.; Mann, B.; Ryder, N.; Subbiah, M.; Kaplan, J.; Dhariwal, P.; Neelakantan, A.; Shyam, P.; Sastry, G.; Askell, A., et al. Language models are few-shot learners. In Proceedings of Proceedings of the 34th International Conference on Neural Information Processing Systems, Vancouver, BC, Canada; p. Article 159.
  63. Yao, S.; Yu, D.; Zhao, J.; Shafran, I.; Griffiths, T.L.; Cao, Y.; Narasimhan, K. Tree of Thoughts: Deliberate Problem Solving with Large Language Models. arXiv:2305.10601v2 2023, 1-14 . [CrossRef]
  64. Devlin, J.; Chang, M.-W.; Lee, K.; Toutanova, K. BERT: Pre-training of Deep Bidirectional Transformers for Language Understanding. arXiv:1810.04805v2 2019, 1-16 . [CrossRef]
  65. Wu, S.; Xiong, Y.; Cui, Y.; Wu, H.; Chen, C.; Yuan, Y.; Huang, L.; Liu, X.; Kuo, T.-W.; Guan, N., et al. Retrieval-Augmented Generation for Natural Language Processing: A Survey. arXiv:2407.13193v2 2023, 1-14 . [CrossRef]
  66. Pu, Y.; He, Z.; Qiu, T.; Wu, H.; Yu, B. Customized Retrieval Augmented Generation and Benchmarking for EDA Tool Documentation QA. arXiv:2407.15353v1 2024, 1-9.
  67. Arasteh, S.T.; Lotfinia, M.; Bressem, K.; Siepmann, R.; Ferber, D.; Kuhl, C.; Kather, J.N.; Nebelung, S.; Truhn, D. RadioRAG: Factual Large Language Models for Enhanced Diagnostics in Radiology Using Dynamic Retrieval Augmented Generation. arXiv:2407.15621v1 2024, 1-32.
  68. Grünthal, G. European Macroseismic Scale 1998. Volume 15.; Centre Europèen de Géodynamique et de Séismologie: Luxembourg, 1998; pp. 99.
  69. OpenAI. GPT-4o. Availabe online: https://platform.openai.com/playground/chat?models=gpt-4o (accessed on July 2024).
  70. Google. Google AI Studio. Availabe online: https://aistudio.google.com/app/prompts/new_chat (accessed on July 2024).
  71. OpenAI. GPT-4o mini. Availabe online: https://platform.openai.com/playground/chat?models=gpt-4o-mini (accessed on July 2024).
  72. Chester, D.K.; Chester, O.K. The impact of eighteenth century earthquakes on the Algarve region, southern Portugal. The Geographical Journal 2010, 176, 350–370. [CrossRef]
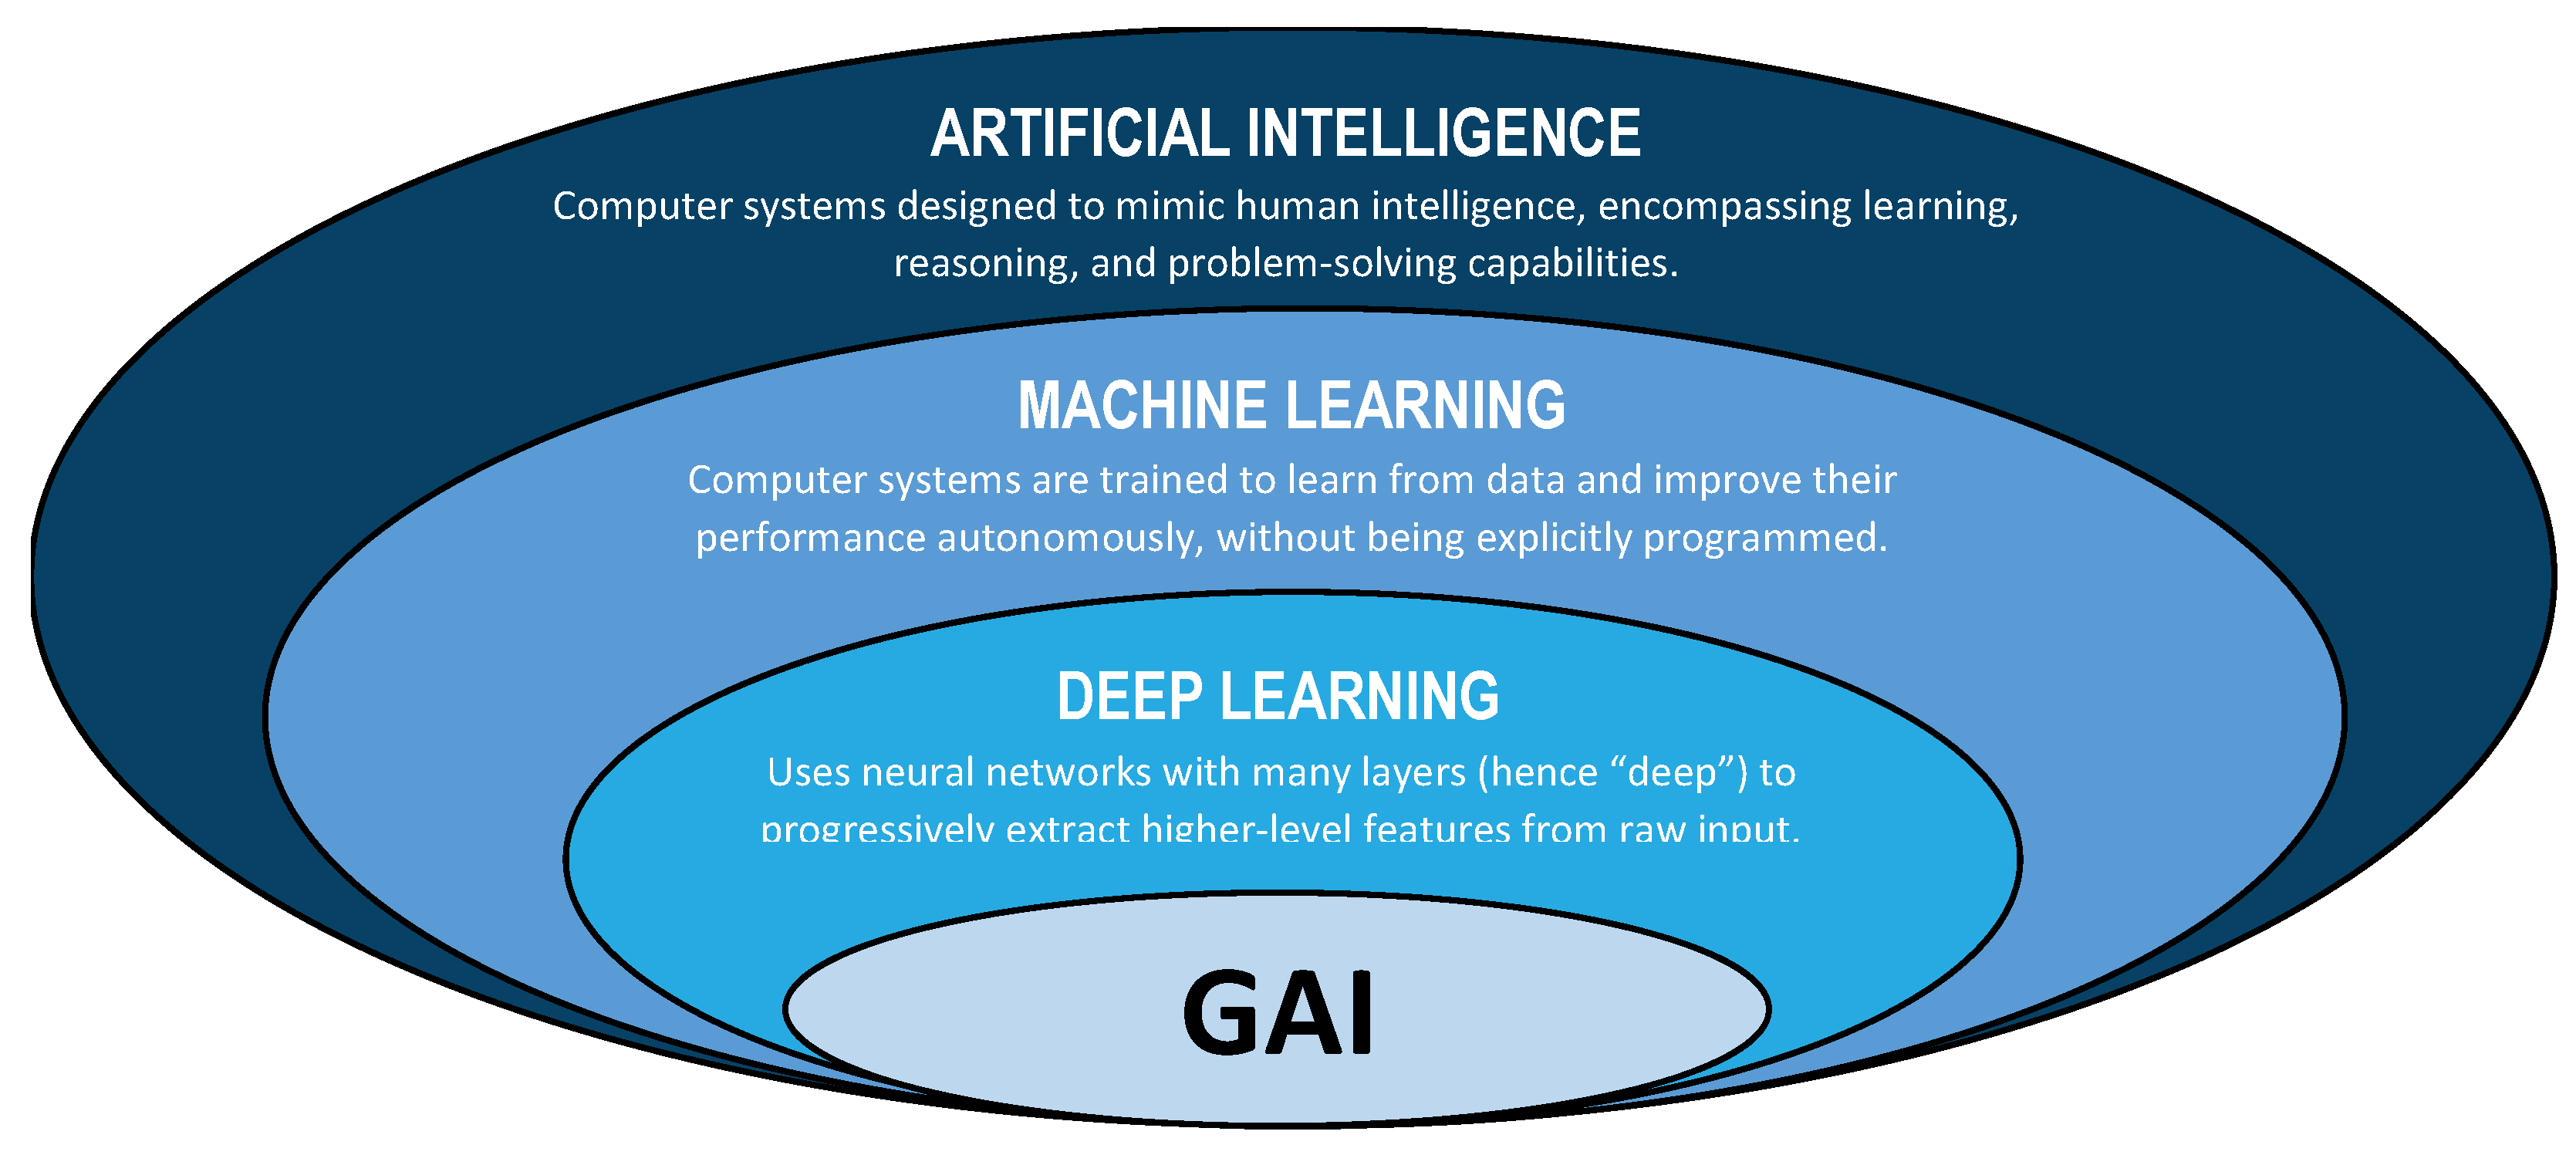
Figure 1. Diagram of the different subgroups of methods in the field of AI.
Preprints 118197 g001
Figure 2. GAI models (examples include text-to-text, text-to-image, image-to-text, and image-to-image). The image of the damaged building shown in the figure was generated by the DALL-E 3 model [47], to illustrate the current capabilities of GAI.
Preprints 118197 g002
Figure 3. Example of text tokenization in GPT-4 [49].
Preprints 118197 g003
Figure 4. Example of embedding creation.
Preprints 118197 g004
Figure 5. Illustration of a possible spatial representation of embeddings (in a 2-dimensional space).
Preprints 118197 g005
Figure 6. Illustration of the next token prediction process in a typical architecture [41].
Preprints 118197 g006
Figure 7. Diagram illustrating possible interaction between a human and a GAI model.
Preprints 118197 g007
Figure 8. Deviations in the results obtained from the models tested on masonry buildings, compared to the damage levels presented in the EMS-98 document.
Preprints 118197 g008
Figure 9. Deviations in the results obtained from the models tested on RC buildings, compared to the damage levels presented in the EMS-98 document.
Preprints 118197 g009
Table 1. Performance evaluation of GAI models for building seismic damage assessment using EMS-98 imagery – masonry buildings.
N. Figure EMS-98 document GPT-4o Gemini 1.5 Pro GPT-4o mini Gemini 1.5 Flash
1 5-1 D3 Masonry (85%)
D3 (80%) 1
Masonry (95%)
D3 (80%)
Masonry (85%)
D3 (80%)
Masonry (100%)
D2 (90%)
2 5-2 D4 Masonry (90%)
D2 (80%)
Masonry (95%)
D2 (80%)
Masonry (85%)
D3 (80%)
Masonry (100%)
D3 (80%)
3 5-3 D4 Masonry (95%)
D2 (90%)
Masonry (95%)
D3 (80%)
Masonry (85%)
D3 (80%)
Masonry (100%)
D3 (100%)
4 5-4 D4 Masonry (90%)
D4 (85%)
Masonry (95%)
D5 (95%)
Masonry (90%)
D3 (80%)
Masonry (100%)
D4 (90%)
5 5-5 D5 Masonry (90%)
D4 (85%)
Masonry (95%)
D4 (85%)
Masonry (85%)
D4 (90%)
Masonry (100%)
D5 (90%)
6 5-6 D2 Masonry (90%)
D2 (80%)
Masonry (95%)
D1 (70%)
Masonry (85%)
D2 (75%)
Masonry (100%)
D2 (80%)
7 5-7 D3 Masonry (90%)
D3 (80%)
Masonry (100%)
D3 (80%)
Masonry (85%)
D3 (80%)
Masonry (100%)
D2 (90%)
8 5-8 D4 Masonry (95%)
D4 (90%)
Masonry (95%)
D4 (90%)
Masonry (90%)
D3 (85%)
Masonry (100%)
D4 (90%)
9 5-9 D2 Masonry (90%)
D3 (85%)
Masonry (95%)
D1 (75%)
Masonry (85%)
D2 (80%)
Masonry (100%)
D2 (100%)
10 5-10 D2 Masonry (90%)
D2 (80%)
Masonry (95%)
D1 (75%)
Masonry (90%)
D2 (85%)
Masonry (100%)
D1 (90%)
11 5-11 D2 Masonry (90%)
D2 (85%)
Masonry (90%)
D1 (80%)
Masonry (85%)
D3 (80%)
Masonry (100%)
D2 (90%)
12 5-12 D2 Masonry (90%)
D2 (85%)
Masonry (95%)
D1 (80%)
Masonry (85%)
D2 (80%)
Masonry (100%)
D2 (80%)
13 5-13 D3 Masonry (90%)
D3 (80%)
Masonry (95%)
D3 (85%)
Masonry (85%)
D2 (75%)
Masonry (100%)
D2 (100%)
14 5-14 D4 Masonry (90%)
D3 (85%)
Masonry (95%)
D3 (85%)
Masonry (85%)
D3 (80%)
Masonry (100%)
D3 (90%)
1 In brackets is the degree of confidence that was presented by the model.
Table 2. Performance evaluation of GAI models for building seismic damage assessment using EMS-98 imagery – RC buildings.
N. Figure EMS-98 document GPT-4o Gemini 1.5 Pro GPT-4o mini Gemini 1.5 Flash
1 5-16 D3 RC (90%)
D3 (85%) 1
RC (95%)
D3 (85%)
RC (90%)
D3 (85%)
RC (100%)
D4 (100%)
2 5-17 D4 RC (90%)
D4 (85%)
RC (95%)
D5 (95%)
Masonry (90%)
D3 (85%)
RC (100%)
D4 (90%)
3 5-18 D5 RC (90%)
D3 (85%)
RC (95%)
D4 (85%)
RC (90%)
D2 (85%)
RC (100%)
D4 (90%)
4 5-19 D5 RC (90%)
D5 (95%)
RC (95%)
D5 (90%)
RC (85%)
D5 (90%)
RC (100%)
D4 (90%)
5 5-20 D4 RC (90%)
D4 (85%)
RC (95%)
D5 (90%)
RC (90%)
D4 (85%)
RC (100%)
D4 (90%)
6 5-21 D5 RC (90%)
D5 (95%)
RC (95%)
D5 (99%)
RC (85%)
D5 (90%)
RC (100%)
D4 (100%)
7 5-22 D5 RC (95%)
D3 (90%)
RC (95%)
D4 (85%)
RC (85%)
D3 (80%)
RC (100%)
D5 (100%)
8 5-23 D3 RC (90%)
D3 (85%)
RC (95%)
D2 (80%)
RC (85%)
D2 (80%)
RC (100%)
D3 (90%)
1 In brackets is the degree of confidence that was presented by the model.
Disclaimer/Publisher’s Note: The statements, opinions and data contained in all publications are solely those of the individual author(s) and contributor(s) and not of MDPI and/or the editor(s). MDPI and/or the editor(s) disclaim responsibility for any injury to people or property resulting from any ideas, methods, instructions or products referred to in the content.
Copyright: This open access article is published under a Creative Commons CC BY 4.0 license, which permit the free download, distribution, and reuse, provided that the author and preprint are cited in any reuse.
Prerpints.org logo

Preprints.org is a free preprint server supported by MDPI in Basel, Switzerland.

Subscribe

© 2024 MDPI (Basel, Switzerland) unless otherwise stated