Submitted:
14 September 2024
Posted:
17 September 2024
You are already at the latest version
Abstract

Keywords:
1. Introduction
2. Materials and Methods
2.1. Animals and Experimental Design
2.2. Feed Oxidation Stability Testing
2.3. Growth Performance
2.4. Sample Collection
2.5. Liver Antioxidant Capacity
2.6. Intestinal Morphology
2.7. Intestinal Barrier Permeability
2.8. Expression of Intestinal Barrier, Antioxidant, and Inflammation-Related Proteins
2.9. Expression of Intestinal Inflammation-Related Genes
2.10. Cecal Microbiota
2.11. Statistical Analysis
3. Results
3.1. Oxidative Stability of Feeds
3.2. Growth Performance
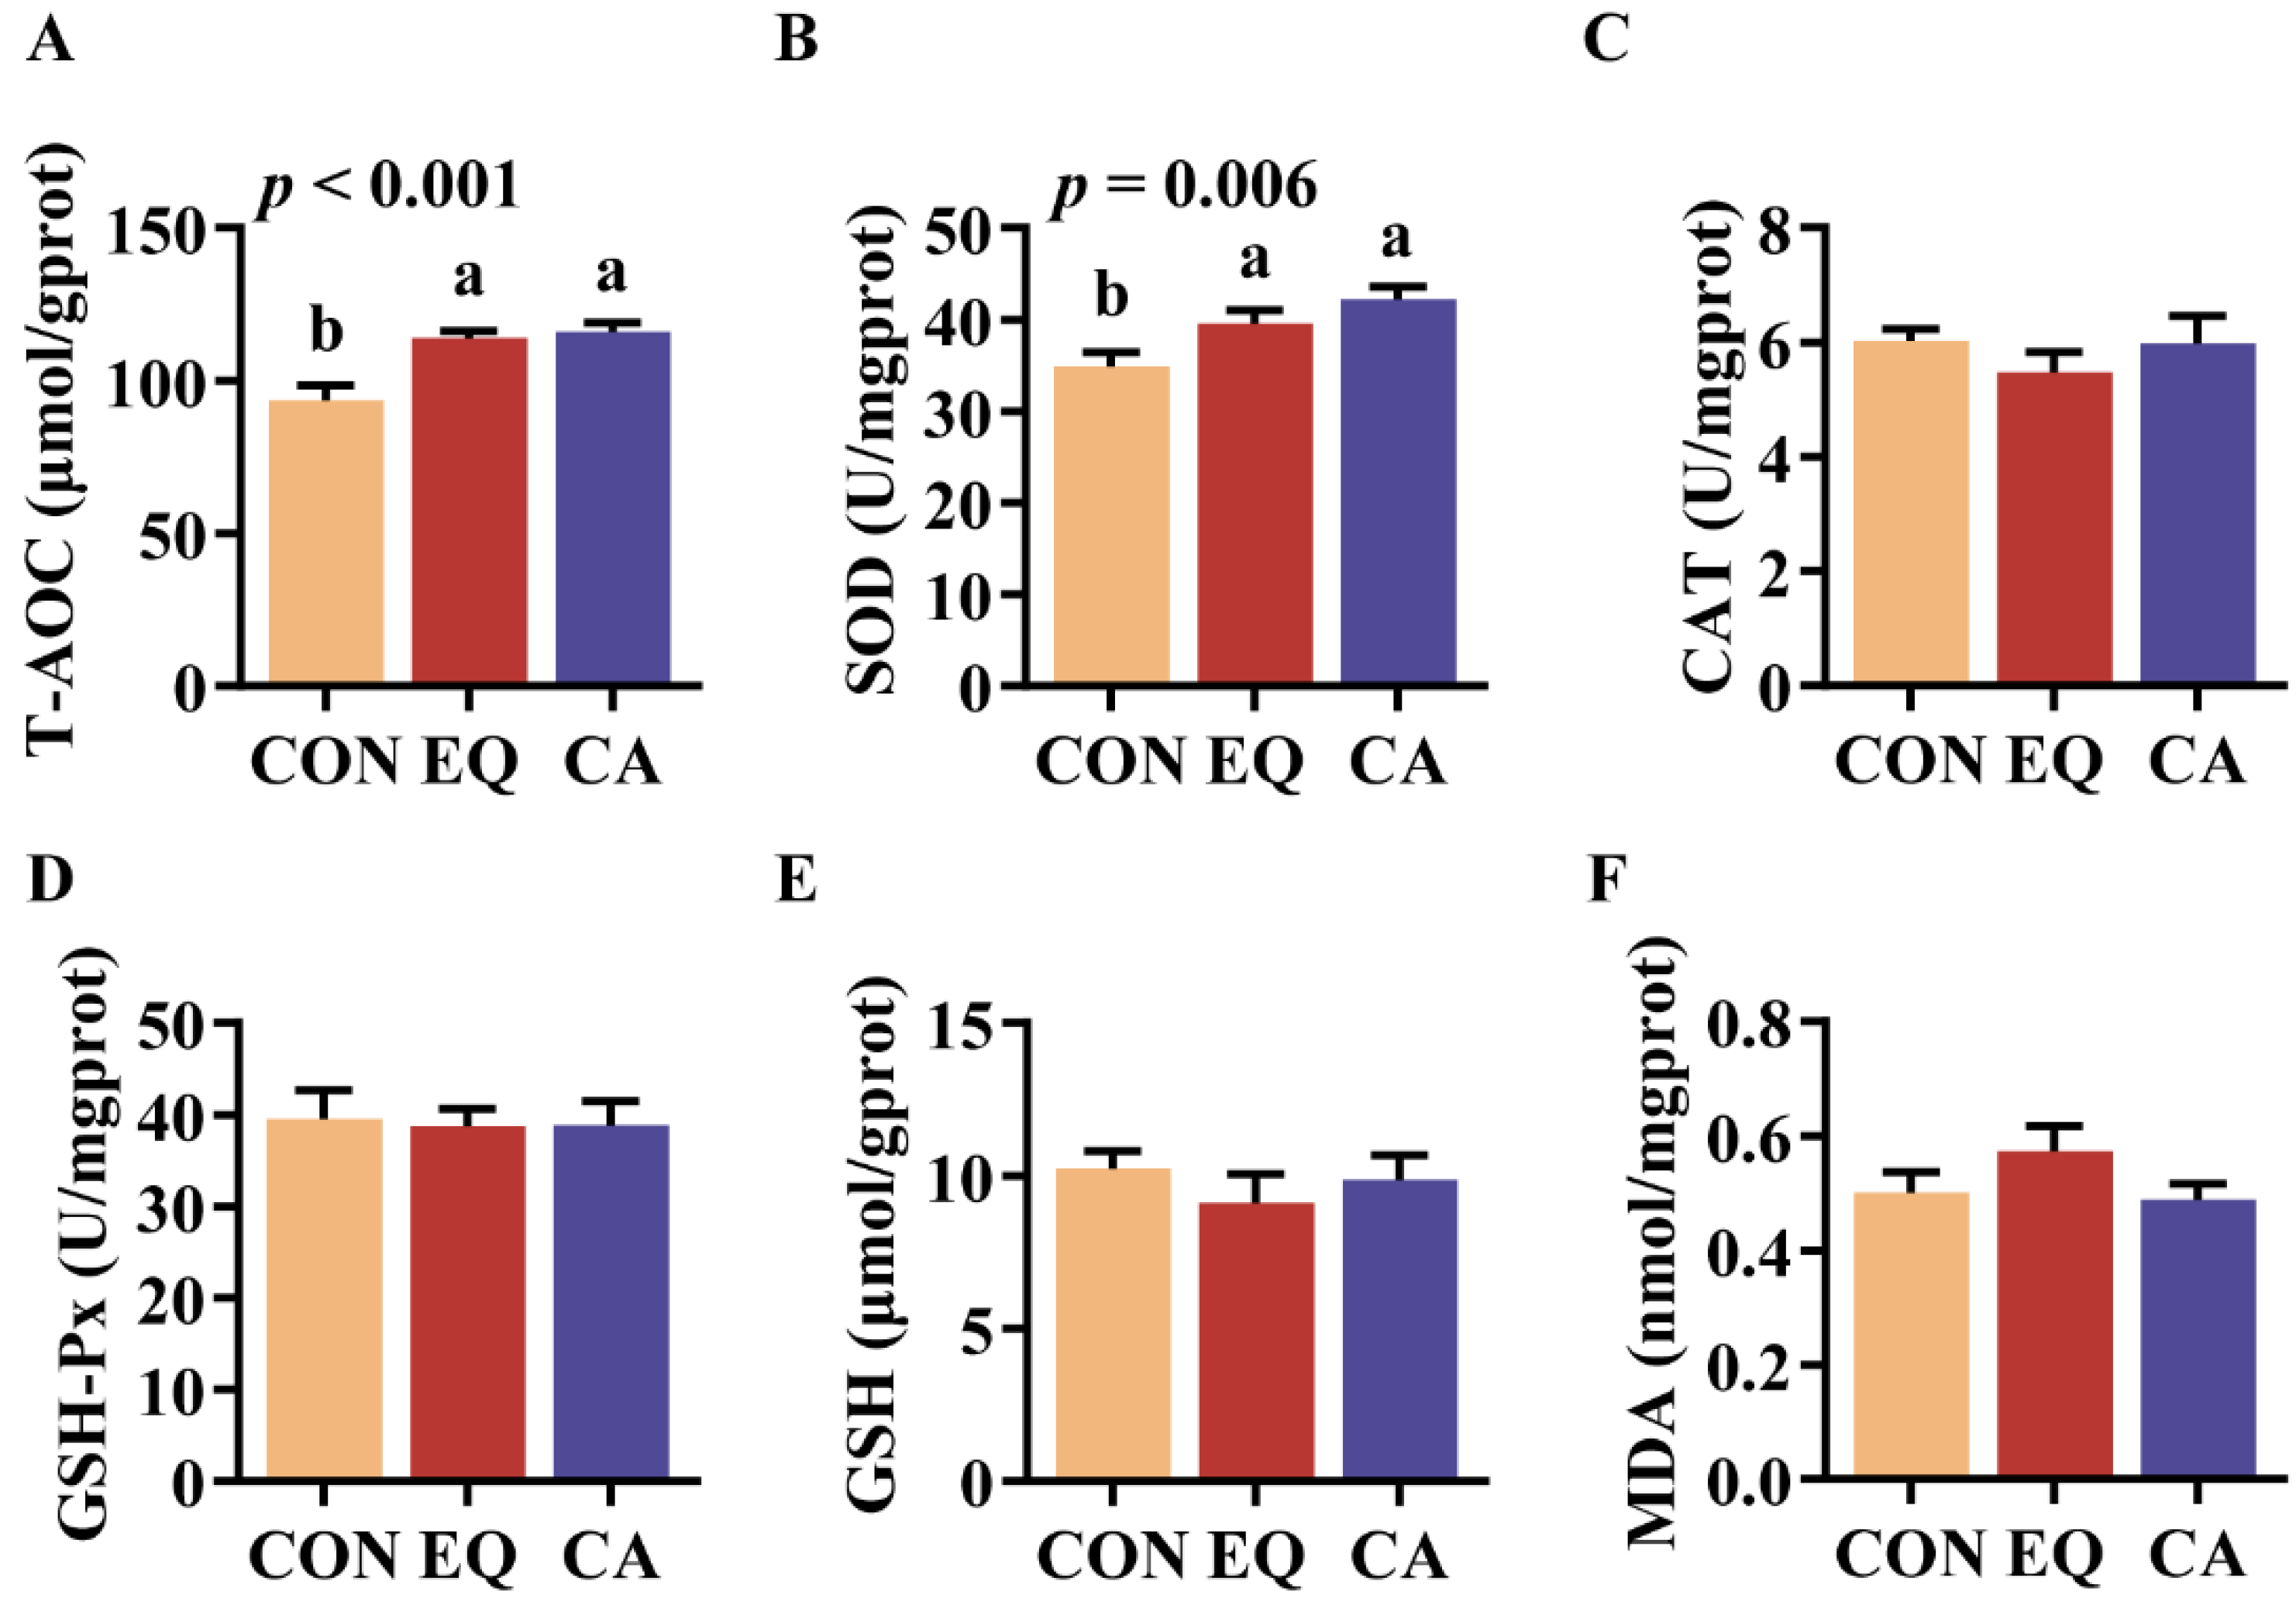
3.3. Liver Antioxidant Capacity
3.4. Intestinal Morphology
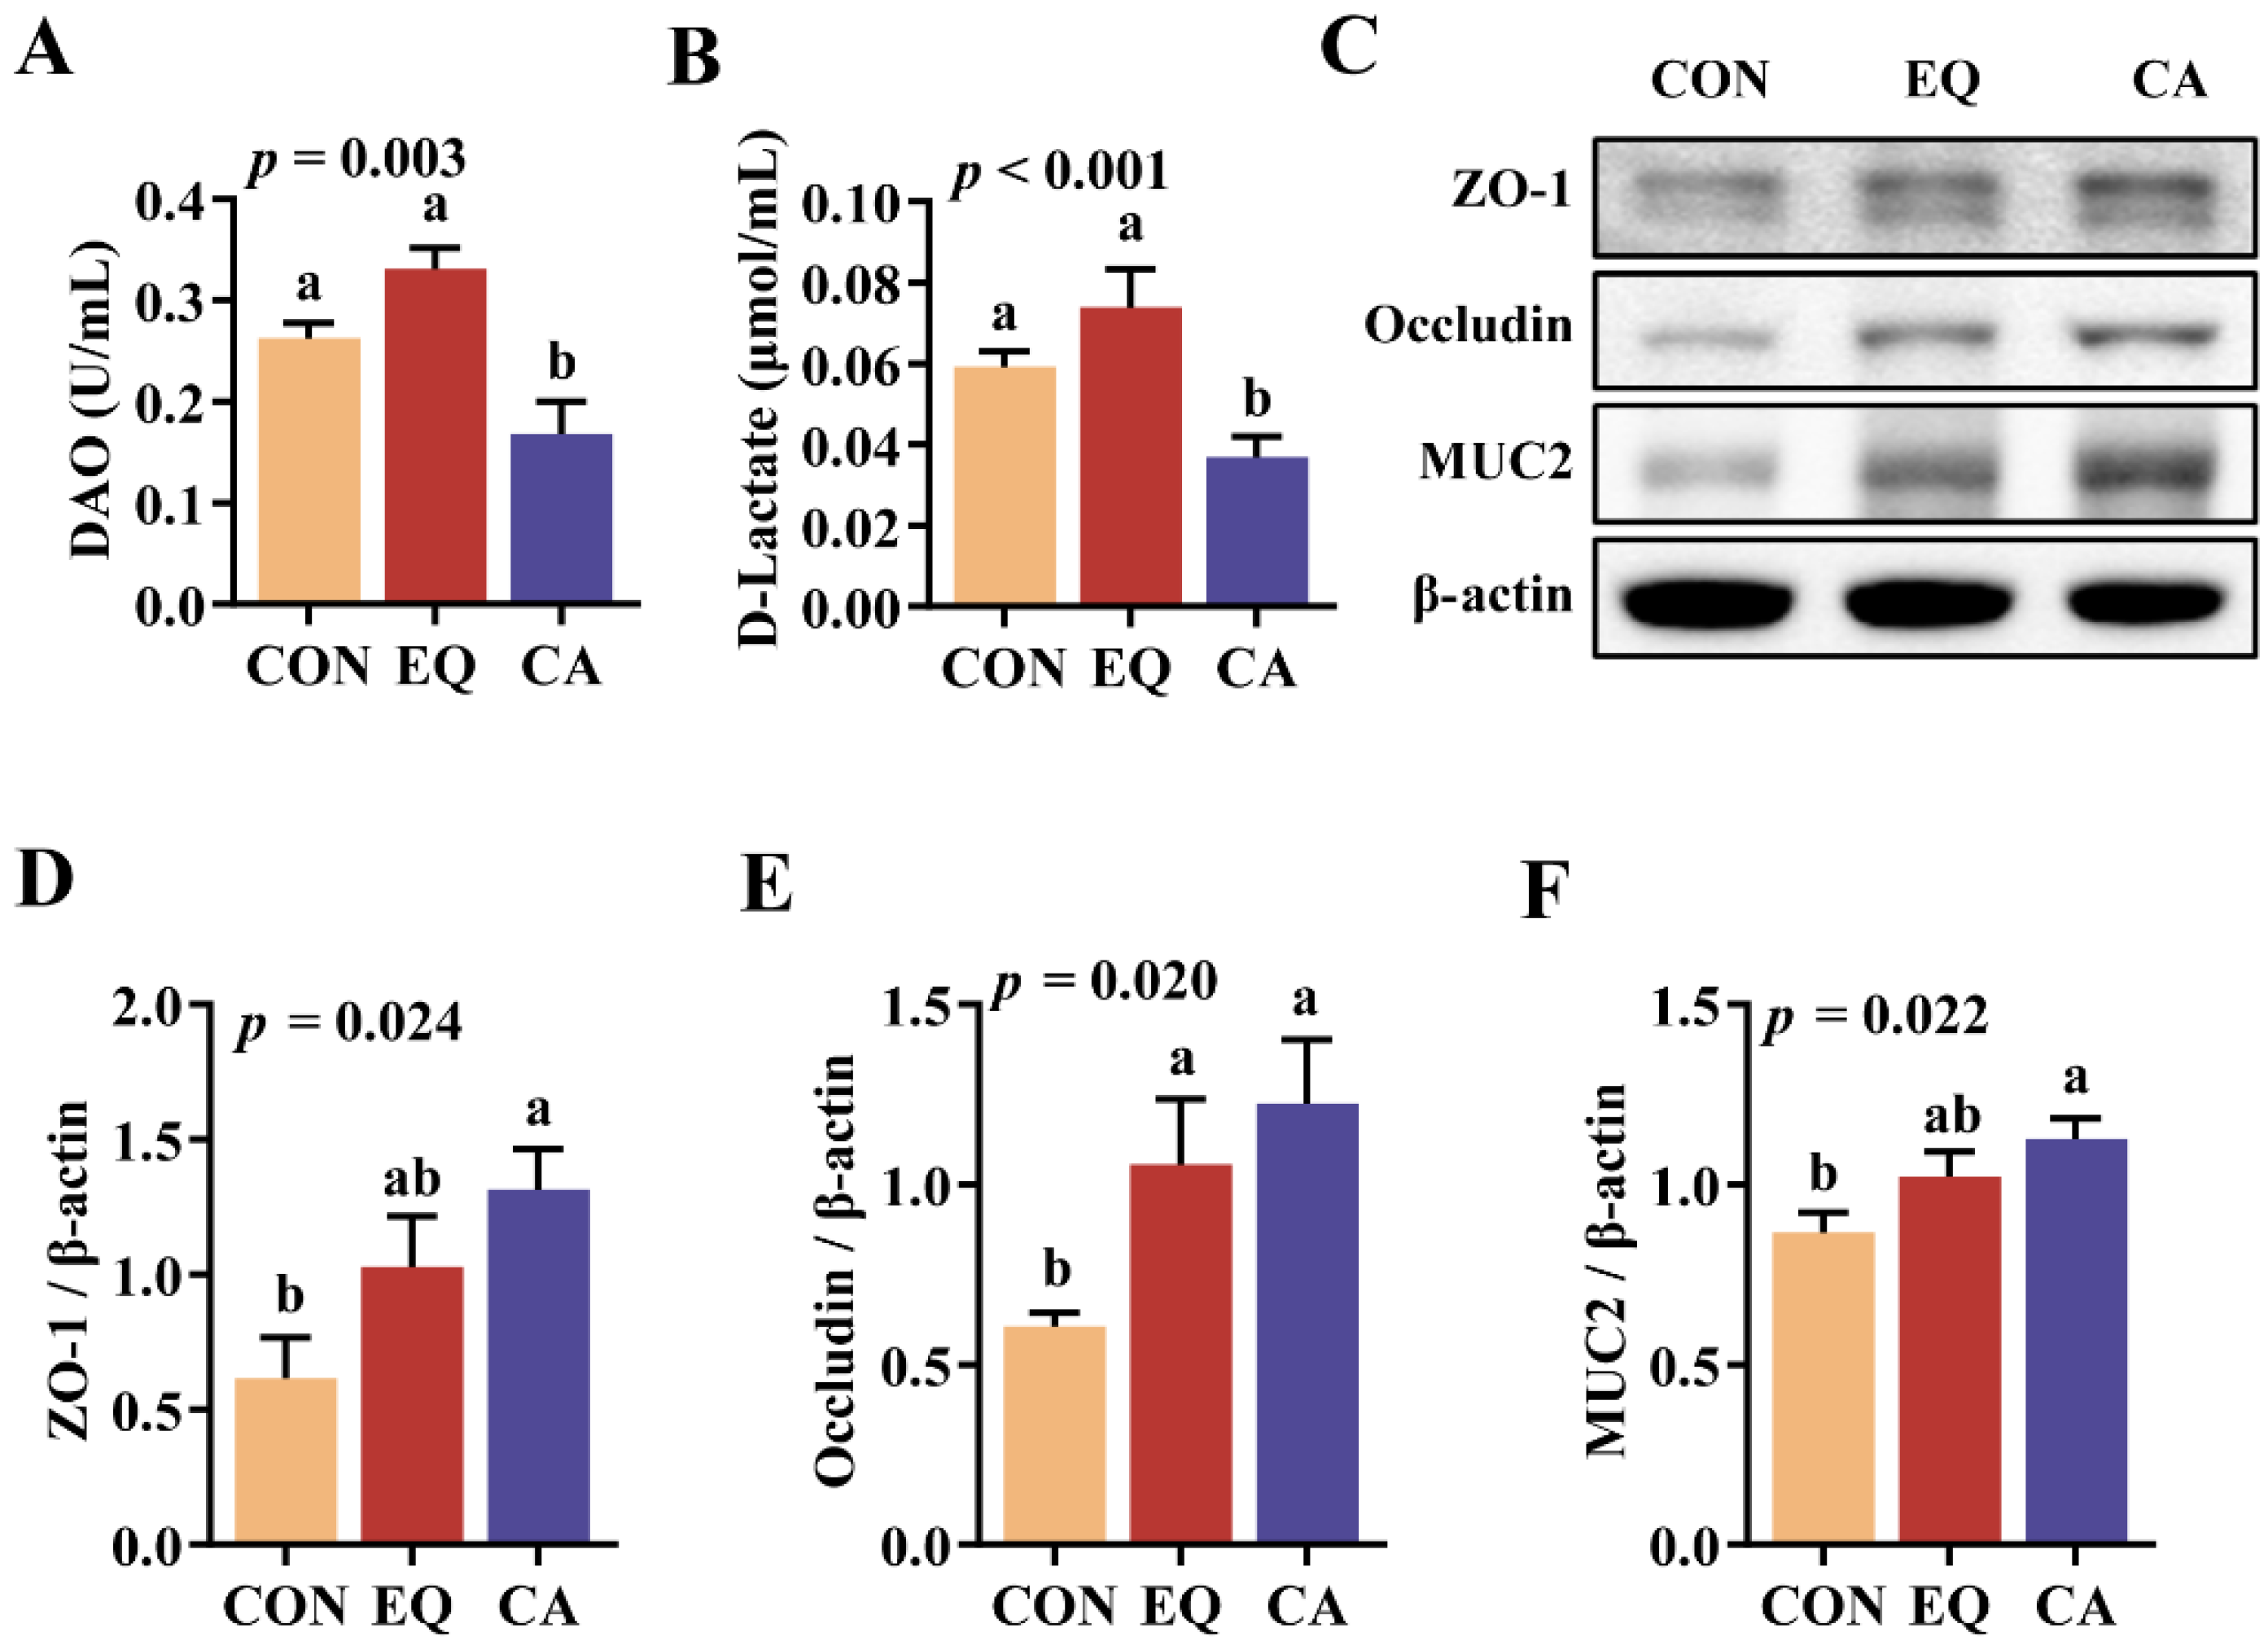
3.5. Intestinal Barrier Permeability and Expression of Related Proteins
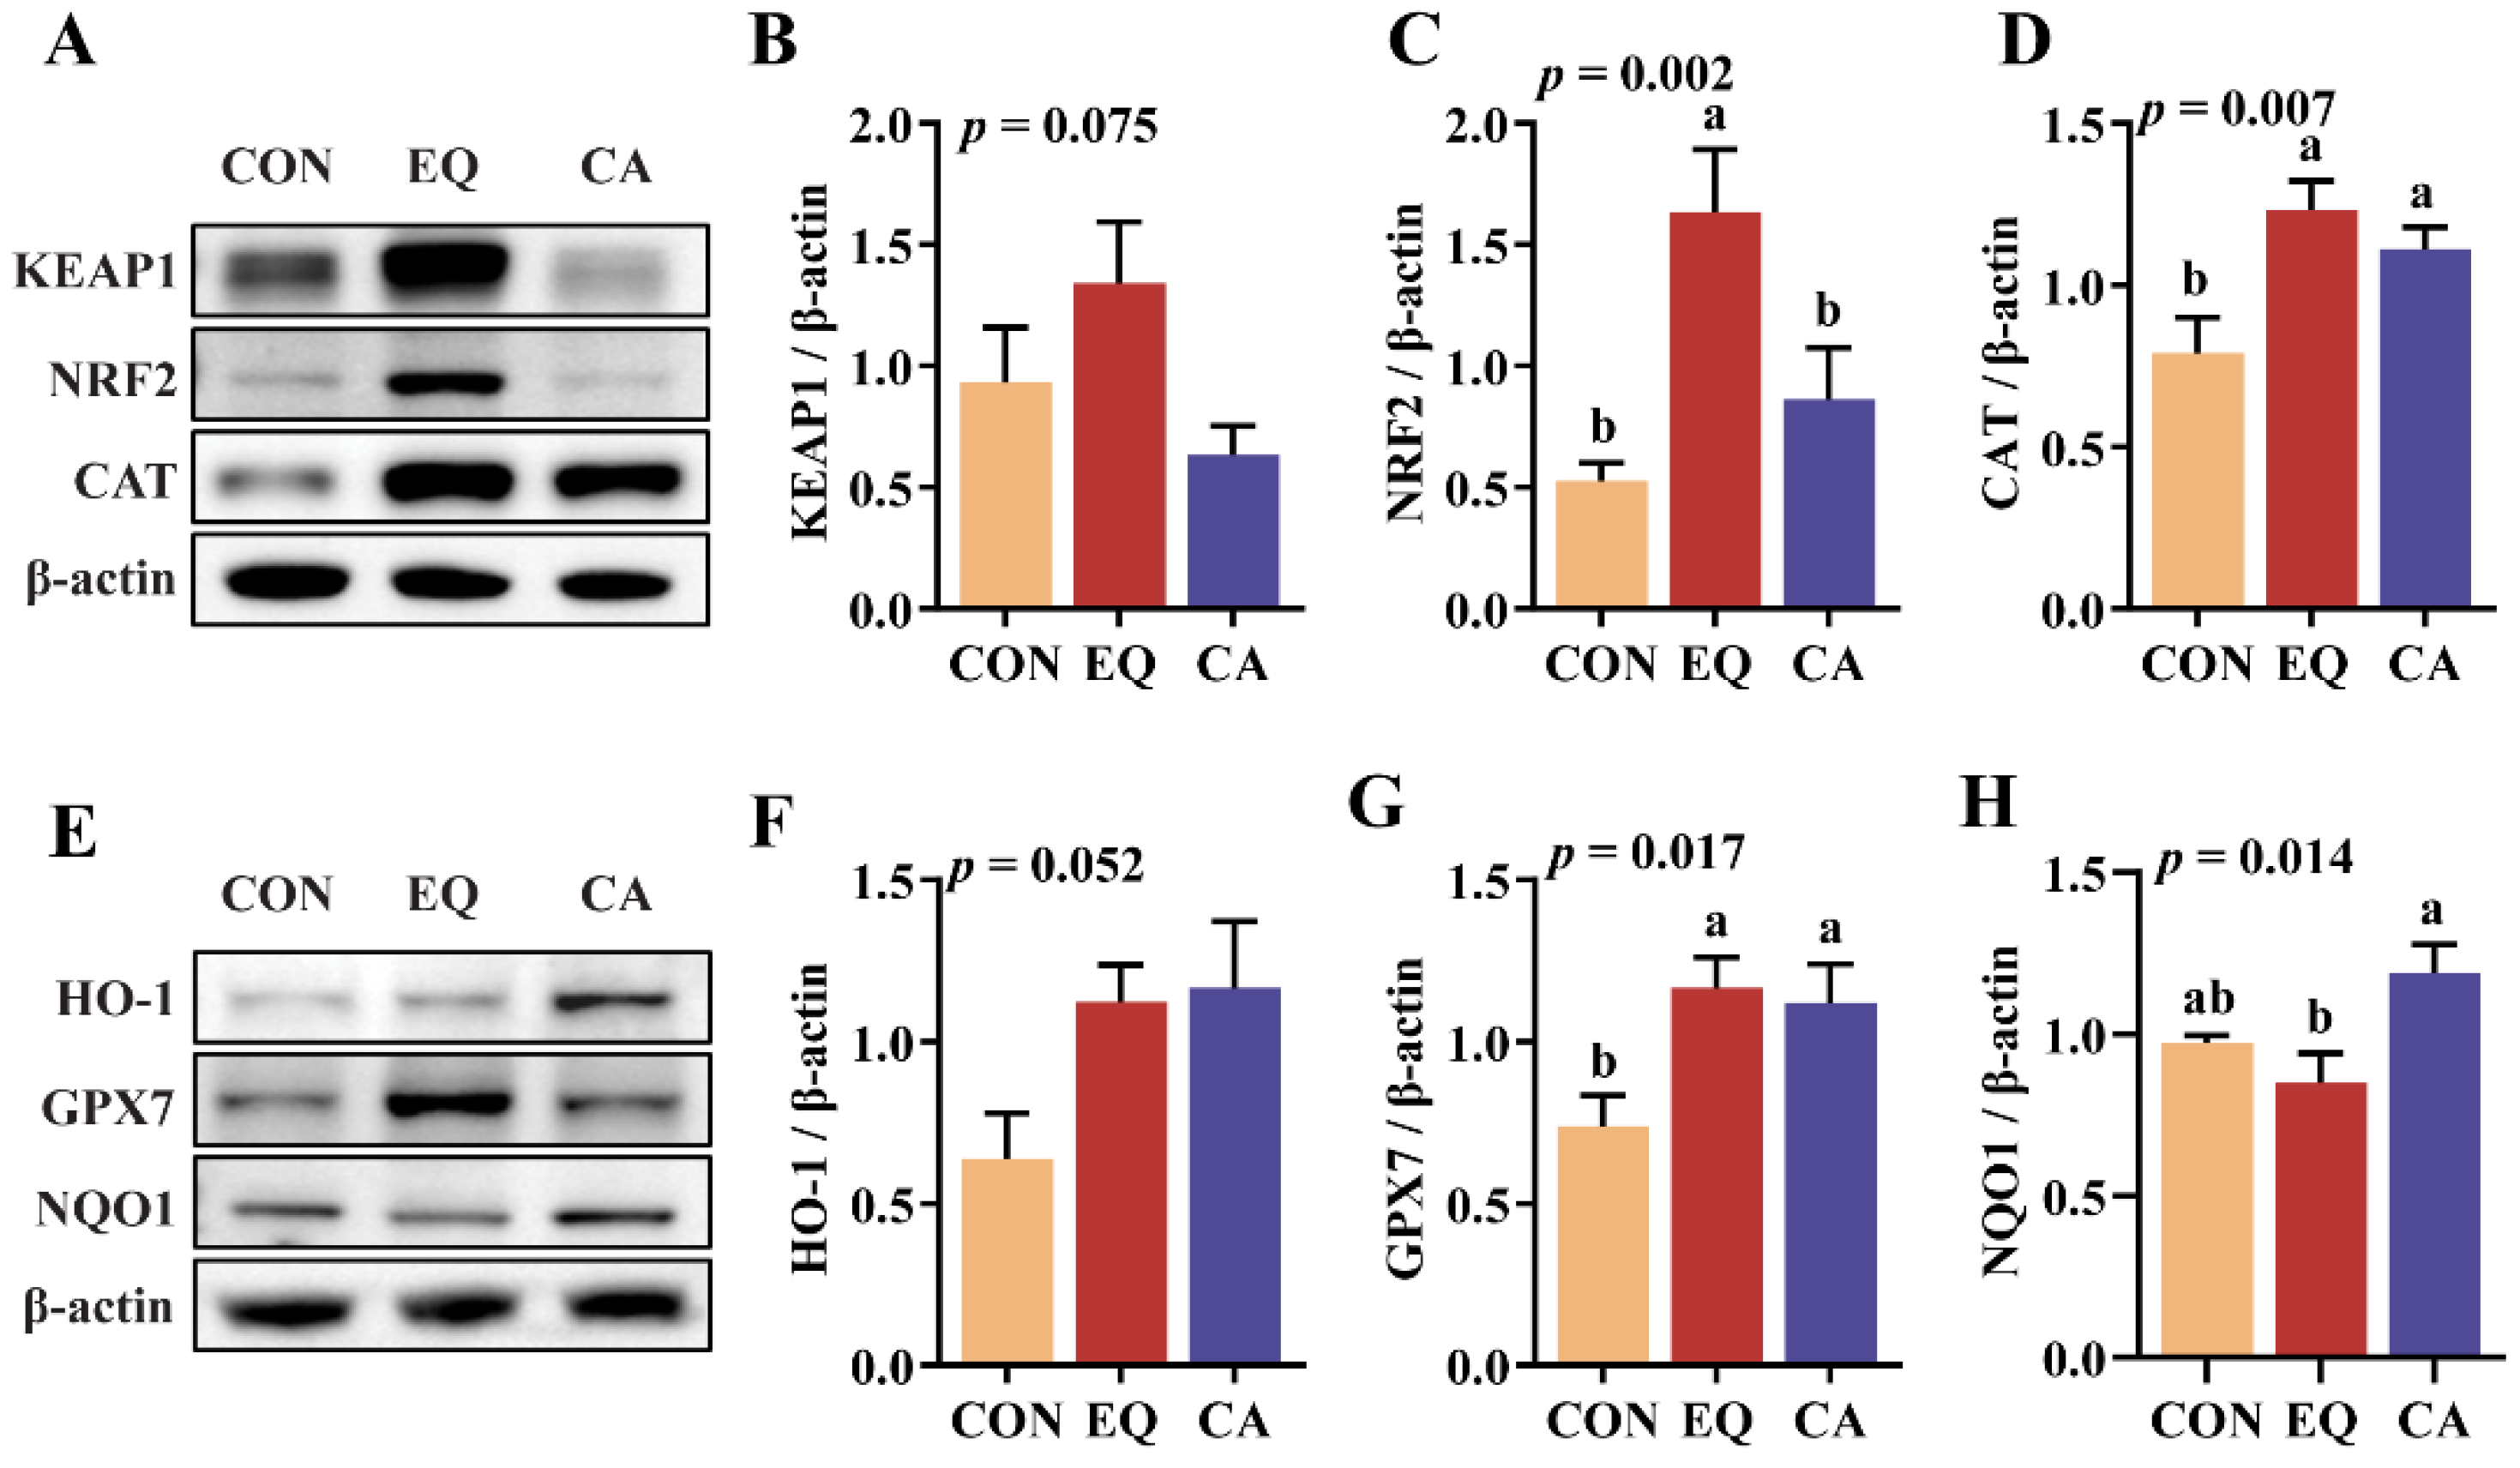
3.6. Intestinal Antioxidant Capacity
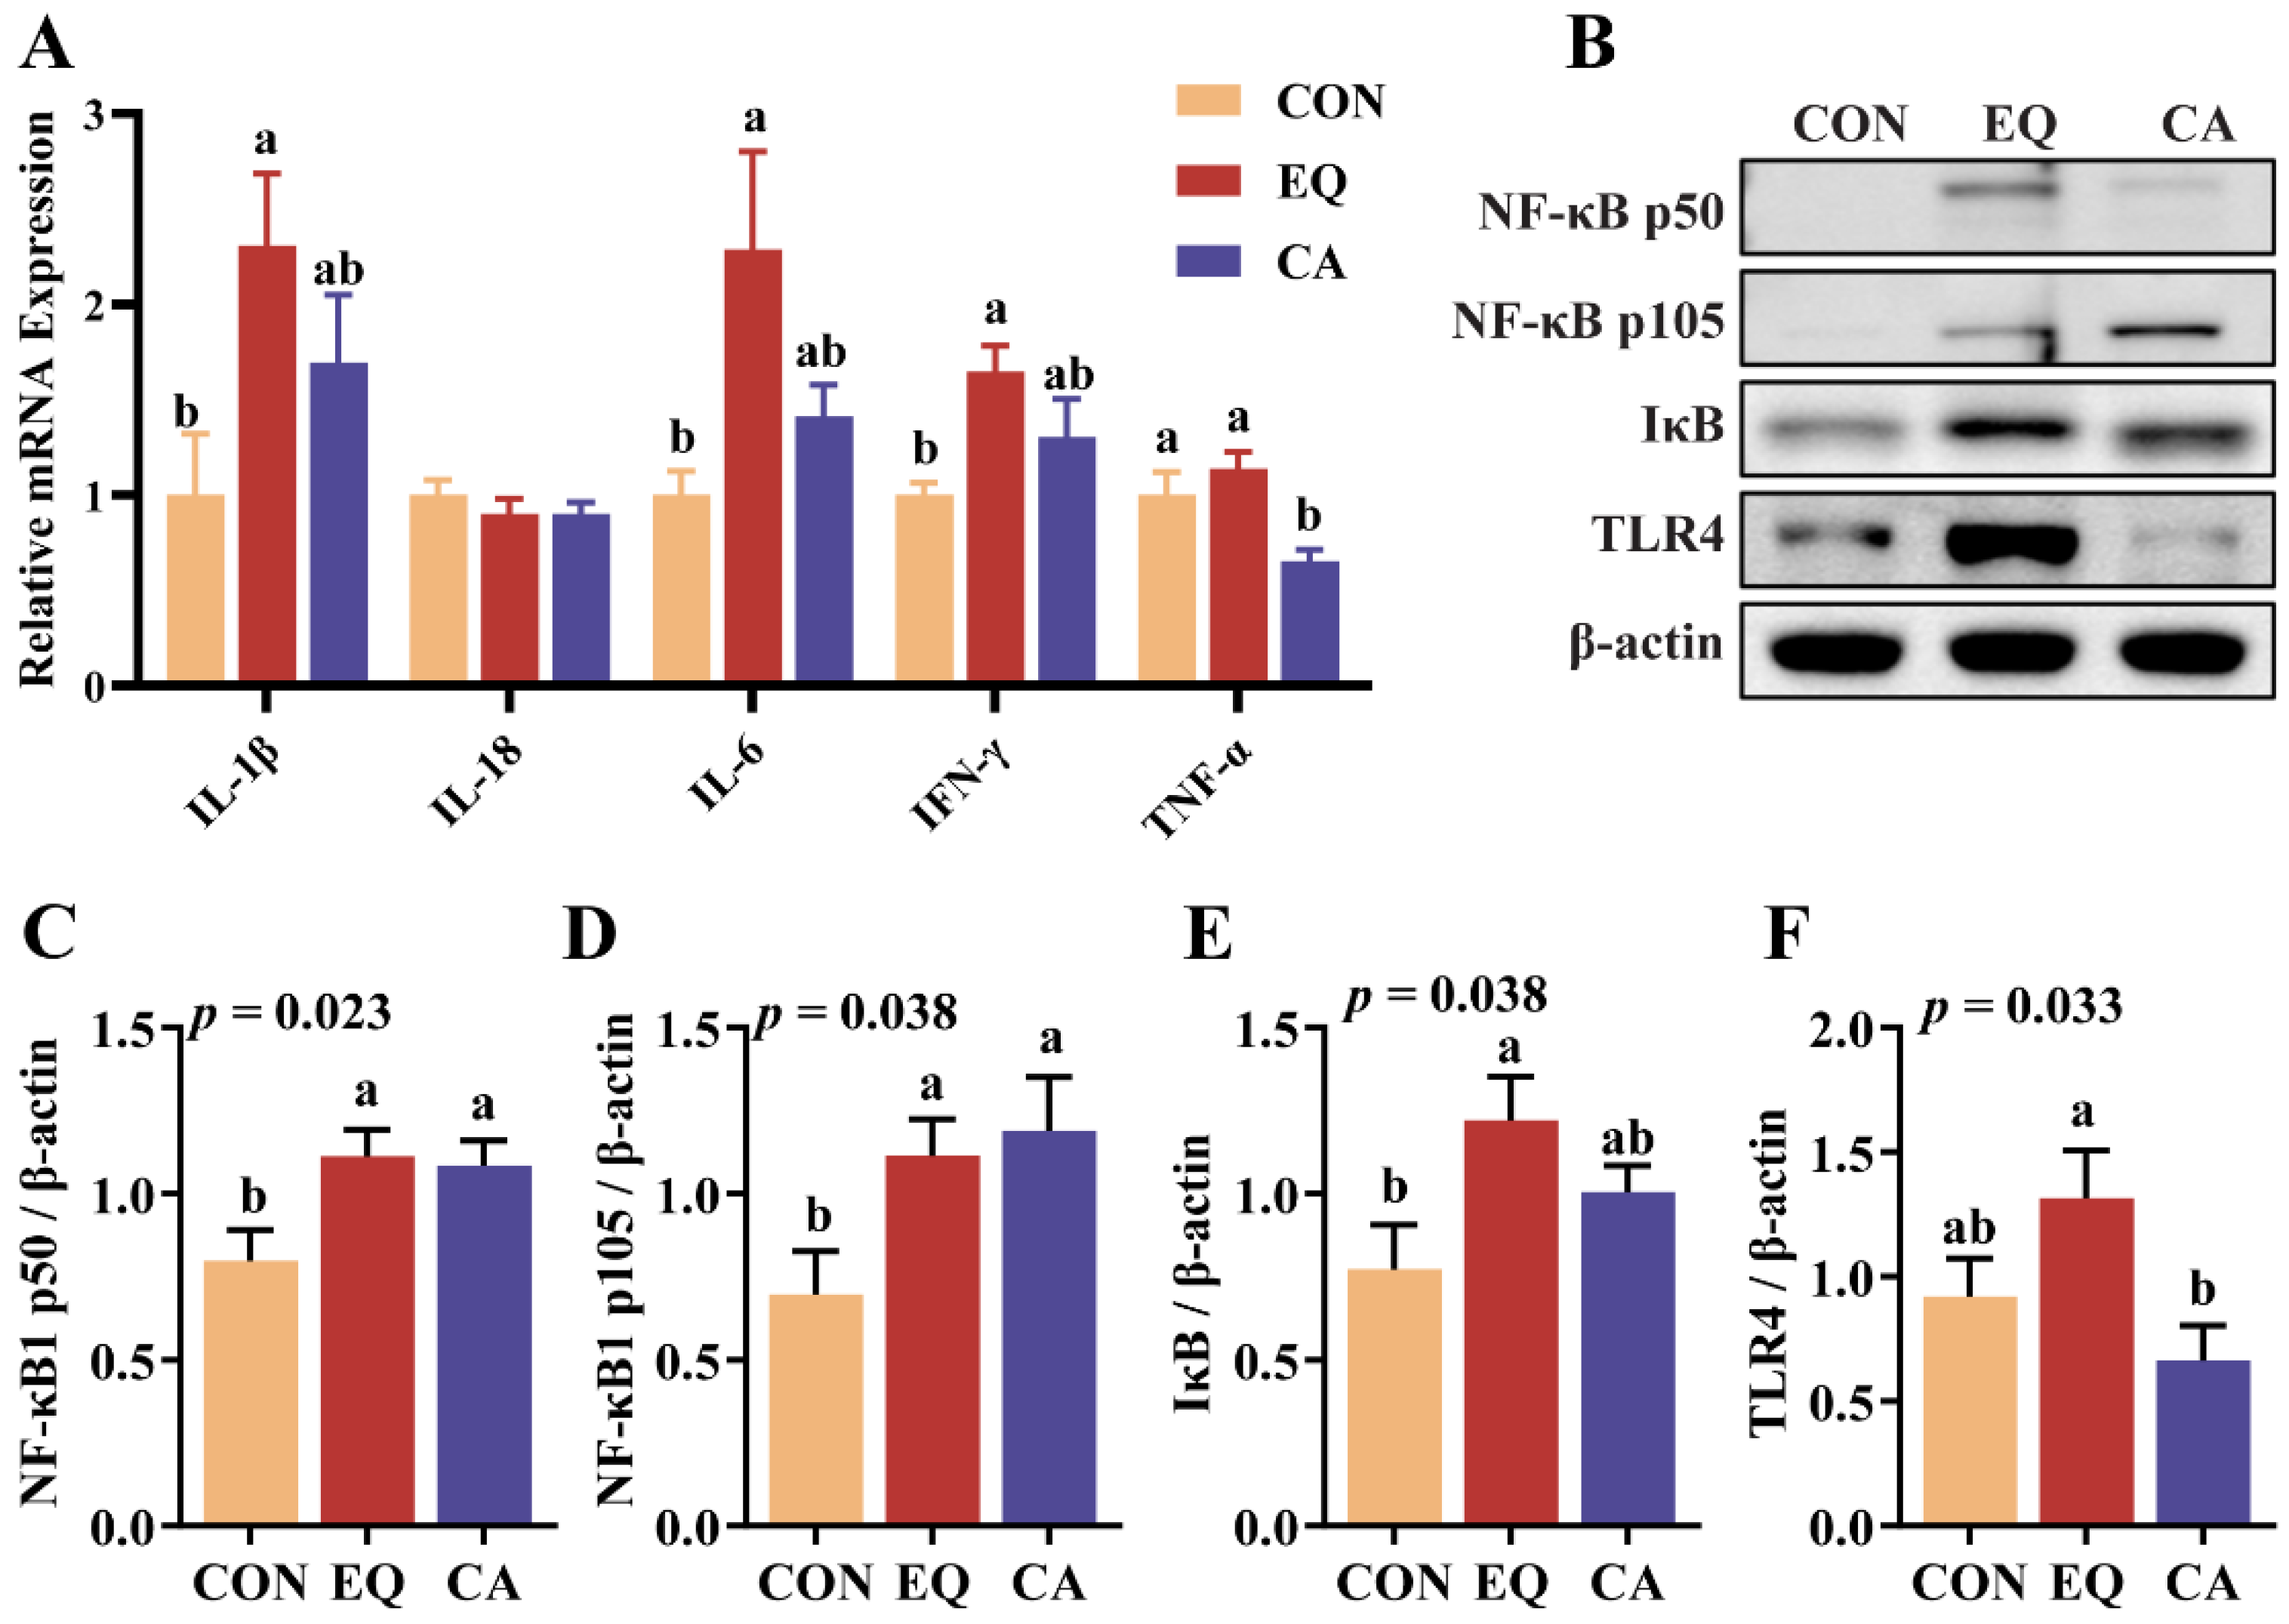
3.7. Expression of Intestinal Inflammation-Related Cytokines
3.8. Cecal Microbiota
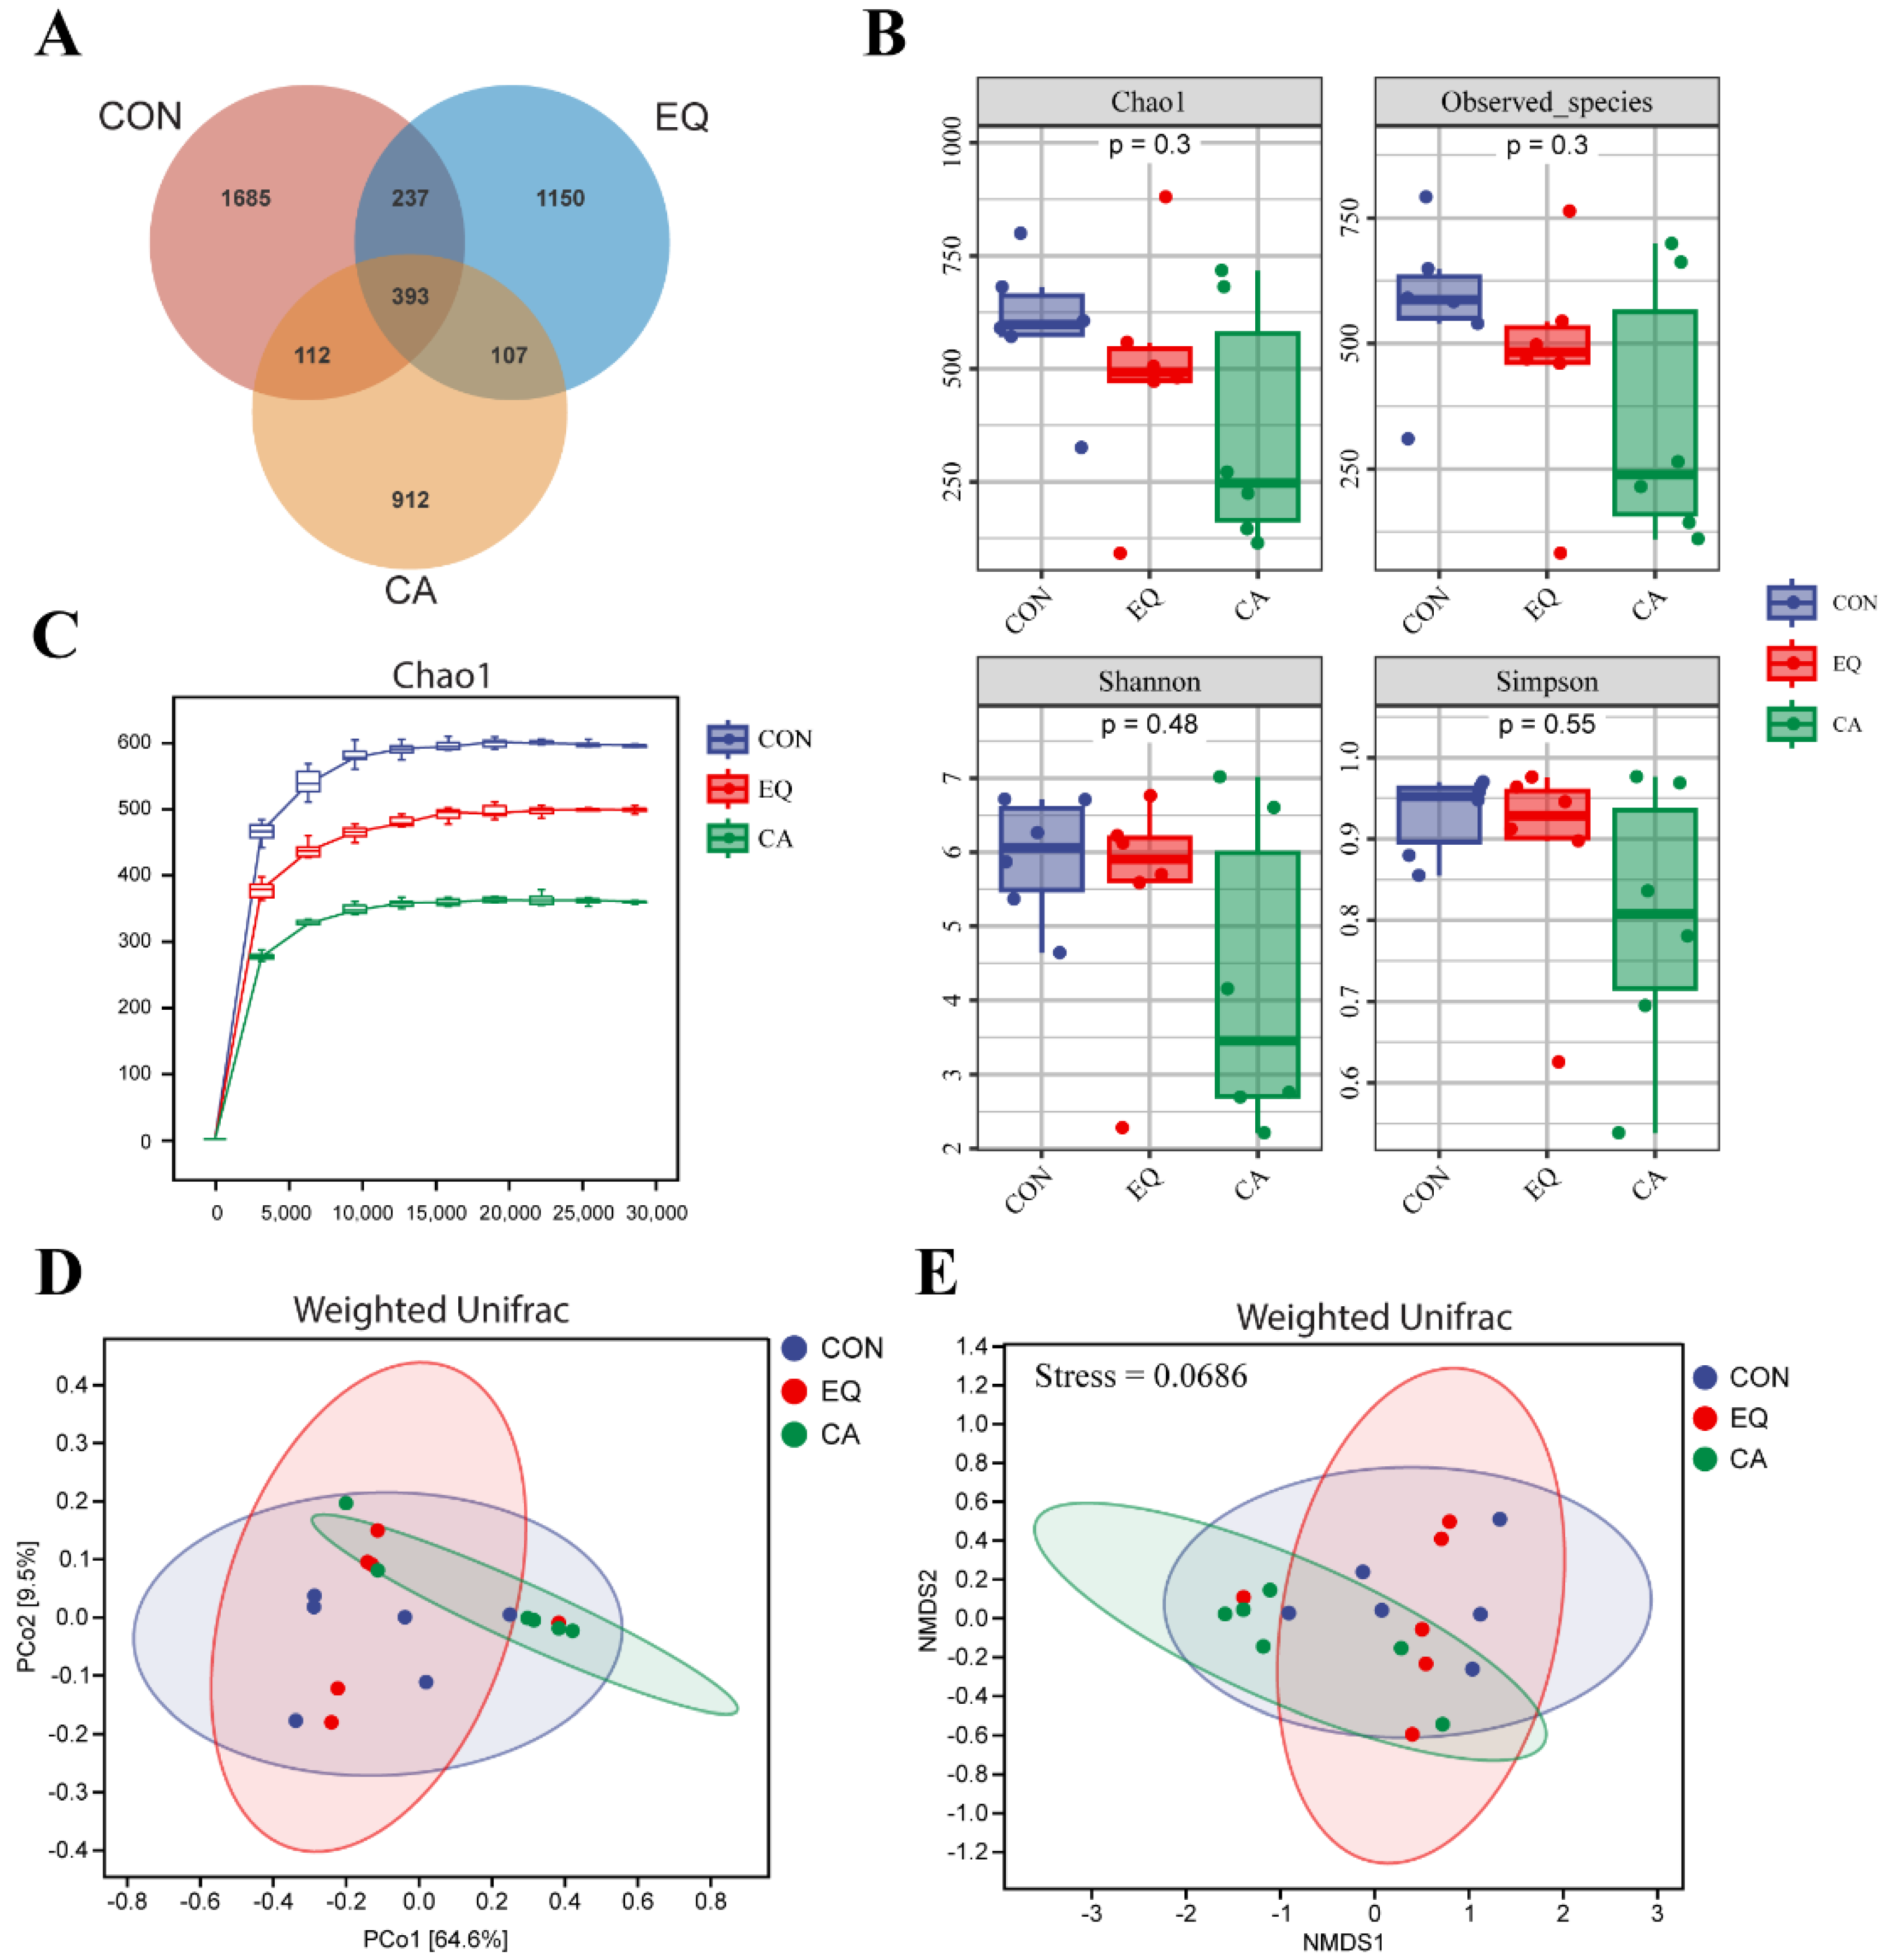
3.8.1. Microbial Diversity
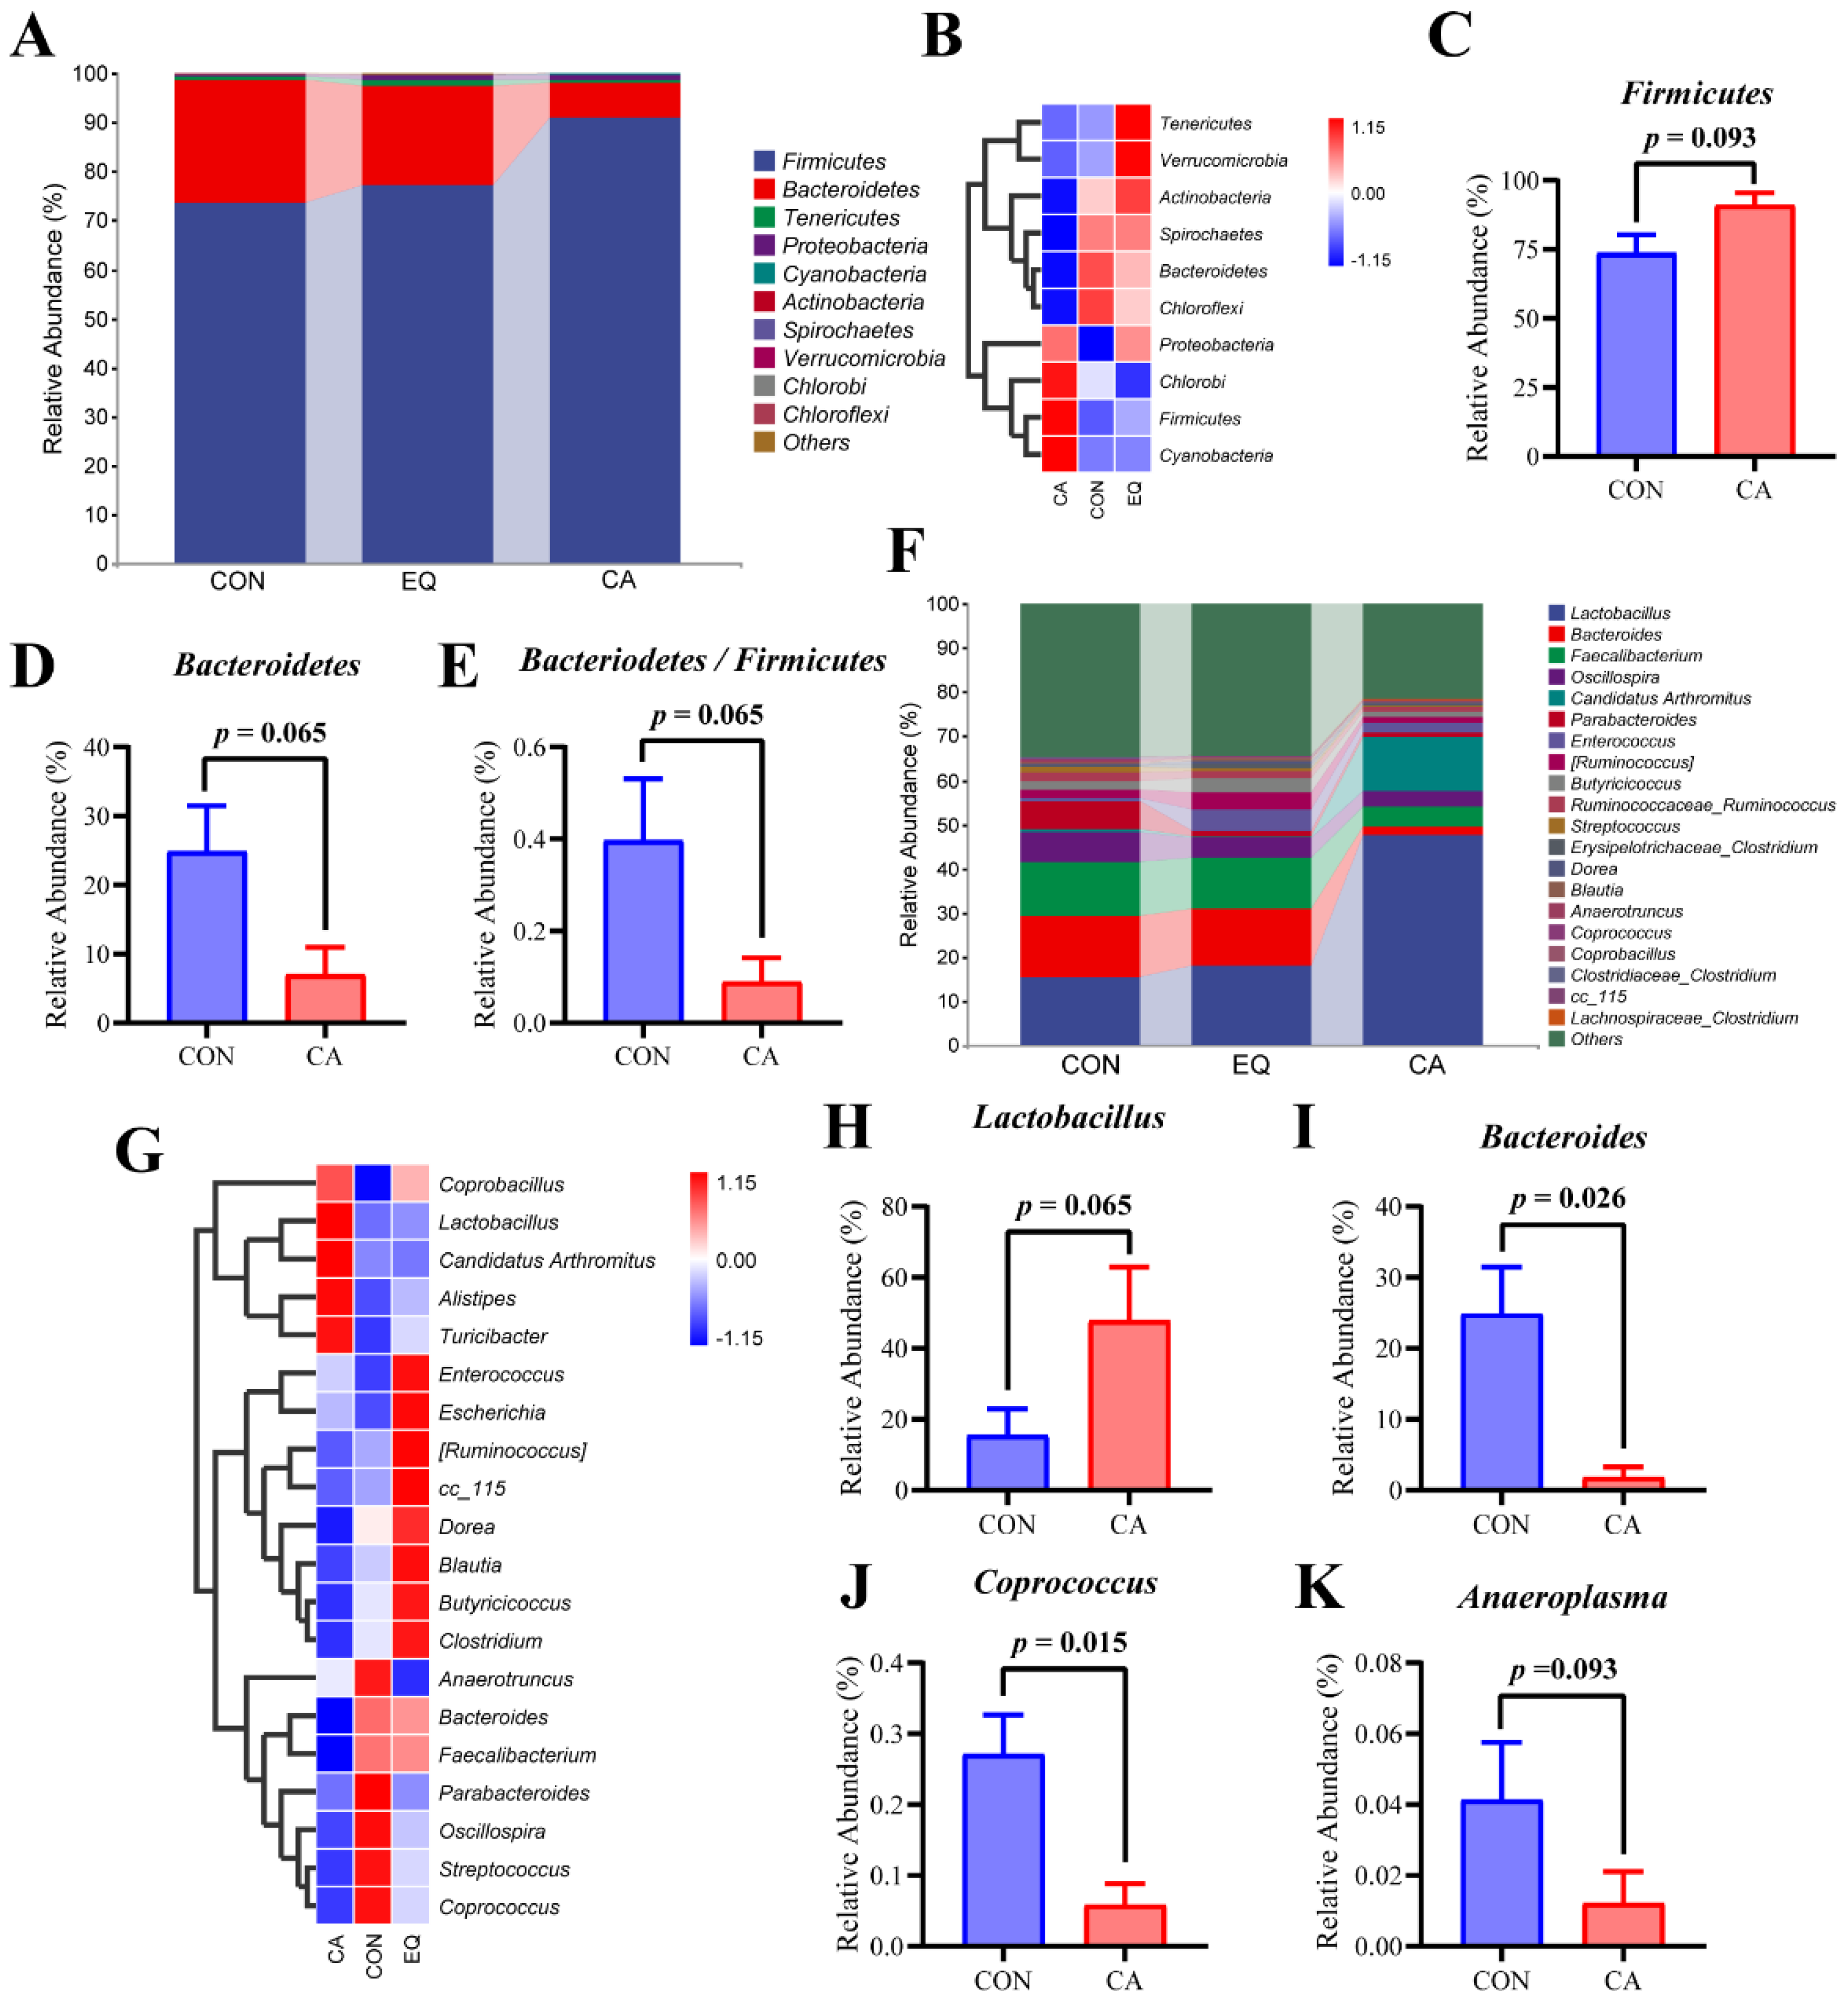
3.8.2. Microbial Composition Analysis
4. Discussion
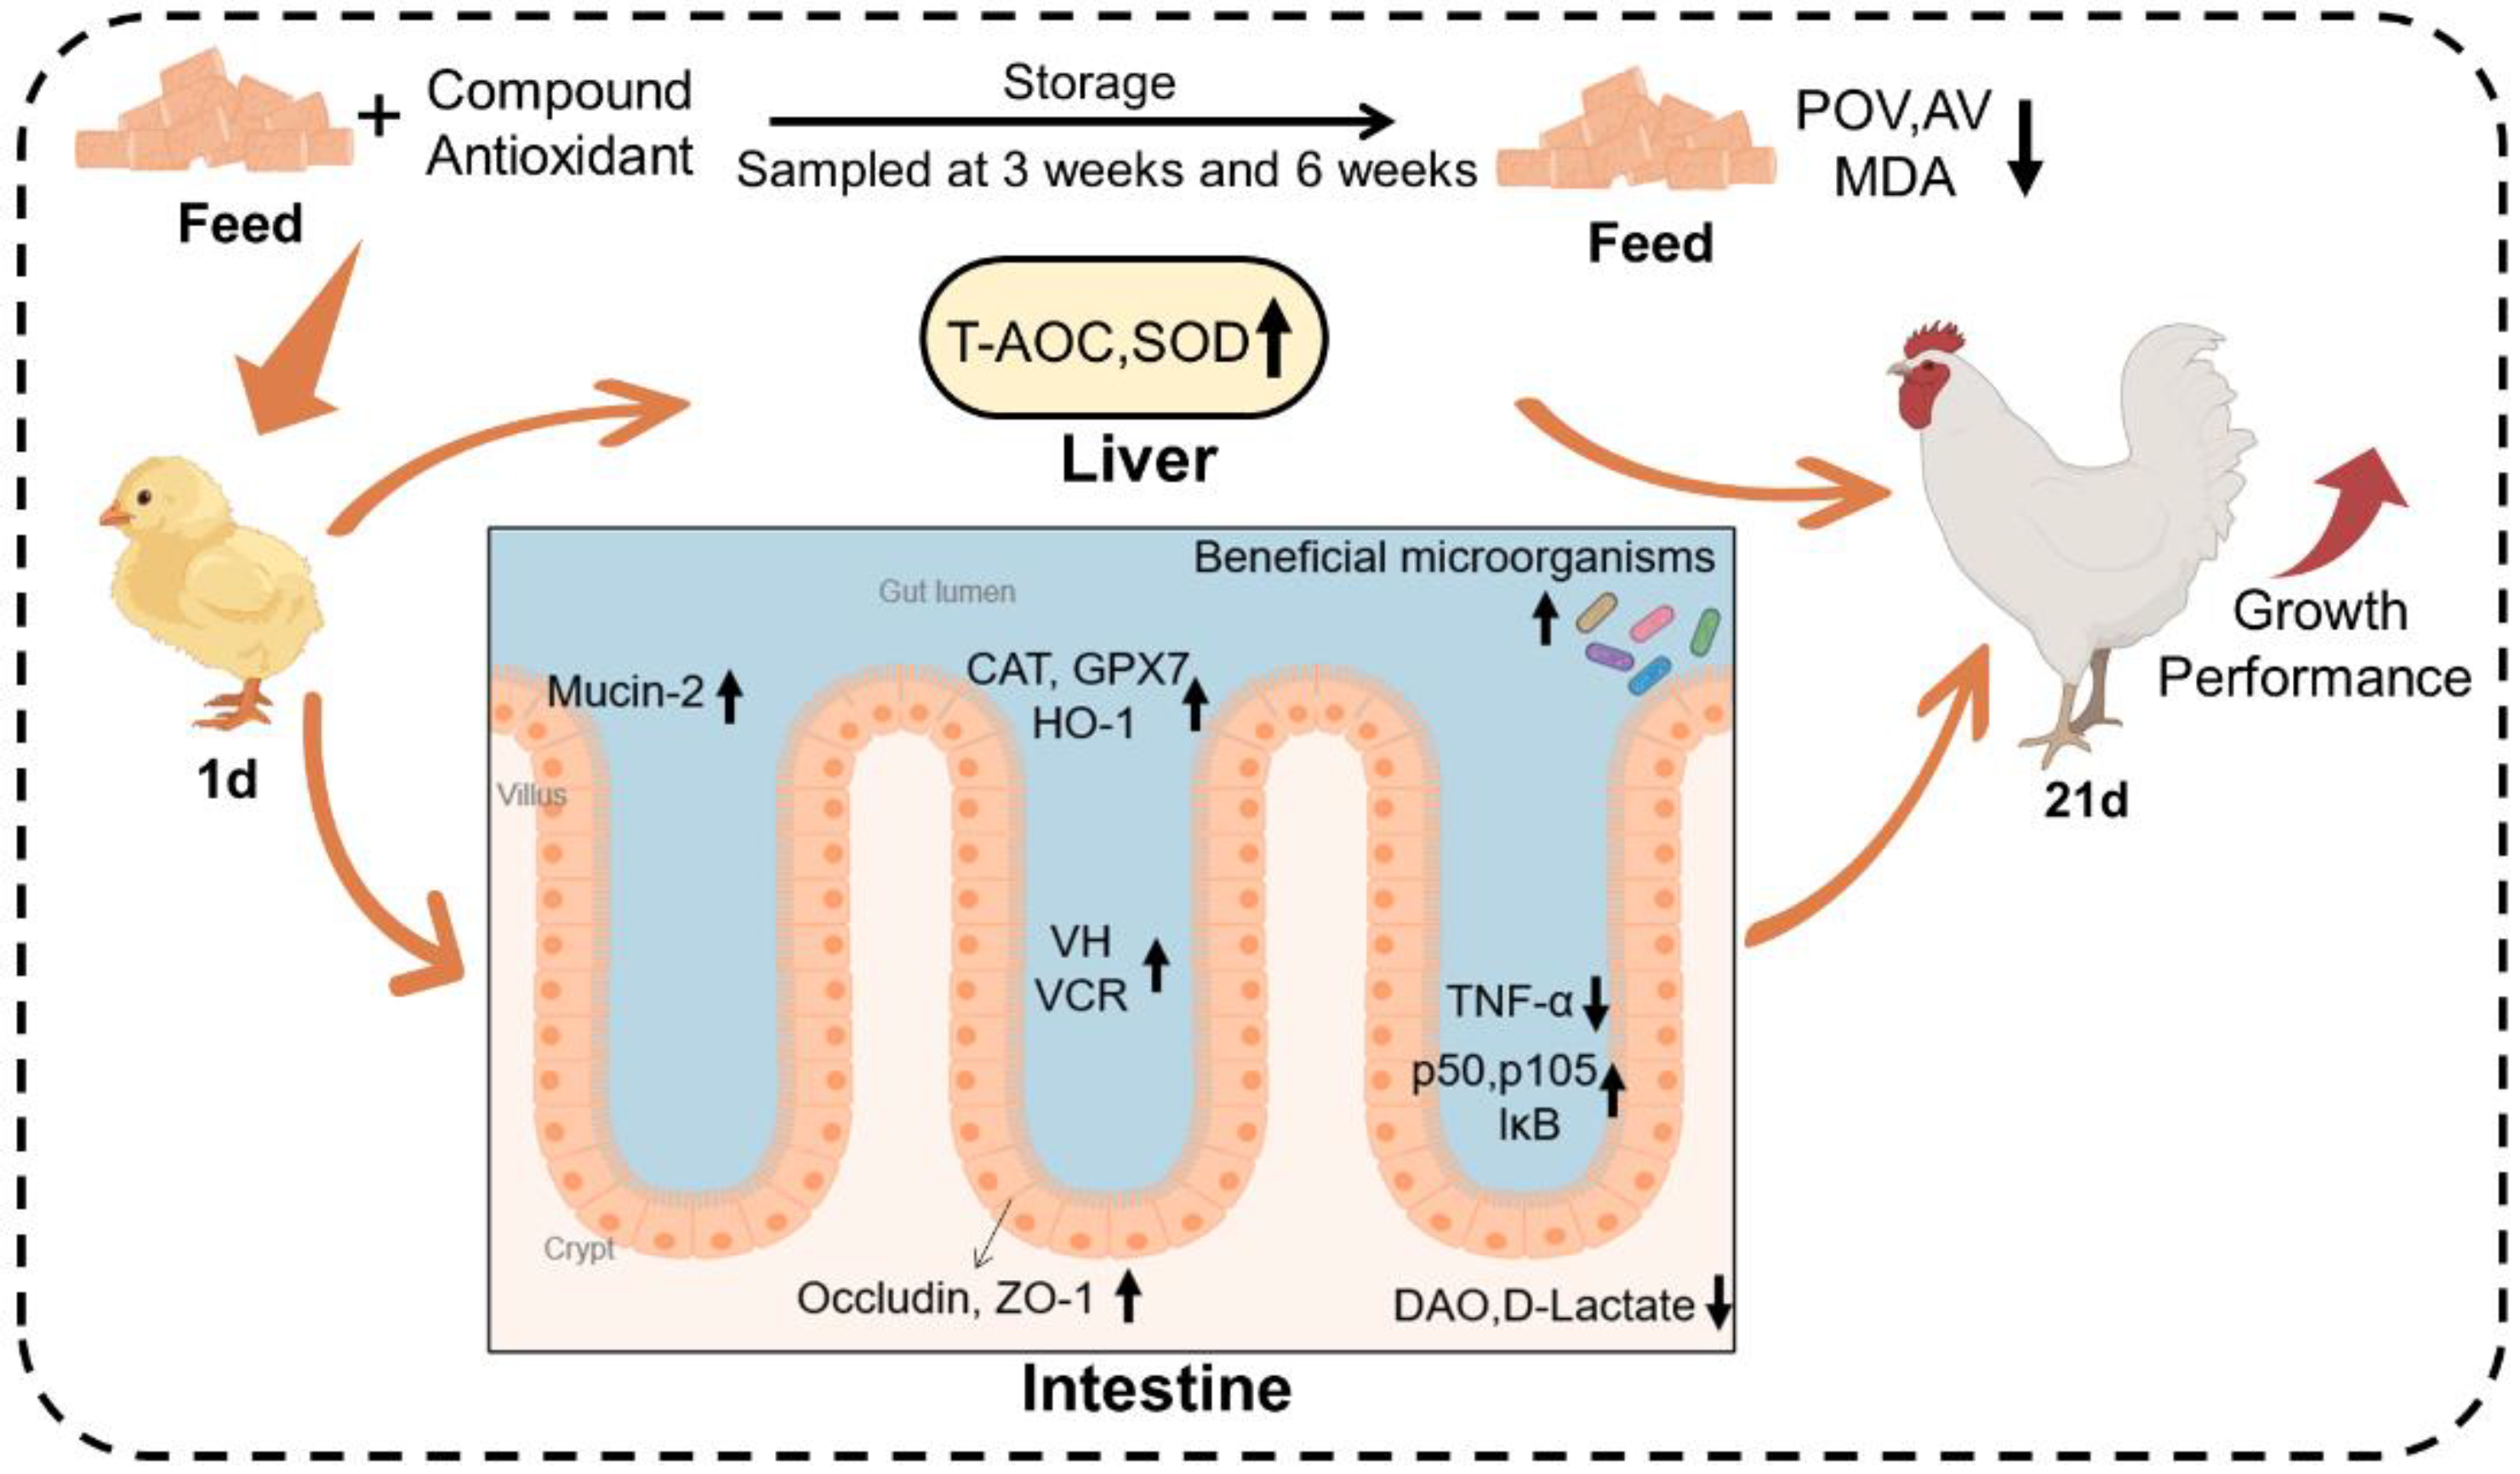
5. Conclusions
Author Contributions
Funding
Institutional Review Board Statement
Informed Consent Statement
Data Availability Statement
Conflicts of Interest
References
- Shahidi, F.; Zhong, Y. Lipid Oxidation and Improving the Oxidative Stability. Chem. Soc. Rev. 2010, 39, 4067–4079. [Google Scholar] [CrossRef] [PubMed]
- Liu, K.; Liu, Y.; Chen, F. Effect of Storage Temperature on Lipid Oxidation and Changes in Nutrient Contents in Peanuts. Food Sci. Nutr. 2019, 7, 2280–2290. [Google Scholar] [CrossRef]
- Guo, Q.; Zhang, L.; Yin, Y.; Gong, S.; Yang, Y.; Chen, S.; Han, M.; Duan, Y. Taurine Attenuates Oxidized Fish Oil-Induced Oxidative Stress and Lipid Metabolism Disorder in Mice. Antioxidants 2022, 11, 1391. [Google Scholar] [CrossRef] [PubMed]
- Gao, F.; Guan, X.; Zhang, W.; Han, T.; Liu, X.; Shi, B. Oxidized Soybean Oil Evoked Hepatic Fatty Acid Metabolism Disturbance in Rats and Their Offspring. J. Agric. Food Chem. 2023, 71, 13483–13494. [Google Scholar] [CrossRef] [PubMed]
- Zhang, Y.; Mahmood, T.; Tang, Z.; Wu, Y.; Yuan, J. Effects of Naturally Oxidized Corn Oil on Inflammatory Reaction and Intestinal Health of Broilers. Poult. Sci. 2022, 101, 101541. [Google Scholar] [CrossRef]
- Gao, F.; Liu, H.; Du, Y.; Fang, X.; Cheng, B.; Shi, B. Dietary Resveratrol Ameliorates Hepatic Fatty Acid Metabolism and Jejunal Barrier in Offspring Induced by Maternal Oxidized Soybean Oil Challenge. J. Agric. Food Chem. 2024, 72, 3730–3740. [Google Scholar] [CrossRef] [PubMed]
- Błaszczyk, A.; Augustyniak, A.; Skolimowski, J. Ethoxyquin: An Antioxidant Used in Animal Feed. Int. J. Food Sci. 2013, 2013, 1–12. [Google Scholar] [CrossRef]
- Błaszczyk, A.; Skolimowski, J. Cytotoxicity and Genotoxicity of Ethoxyquin Used As an Antioxidant. Food Rev. Int. 2015, 31, 222–235. [Google Scholar] [CrossRef]
- Zhang, C.; Gai, X.; Tian, Y.; Wang, J.; He, D.; Yang, W.; Zhang, L.; Chen, Y. Analysis of Ethoxyquin and Its Oxidation Products in Swine Tissues by Gas Chromatography-Tandem Mass Spectrometry for Evaluating the Feed-to-Animal Tissue Transfer of Ethoxyquin and Its Metabolites. J. Anim. Sci. Biotechnol. 2021, 12, 8. [Google Scholar] [CrossRef]
- Tan, X.Y.; Chin, Z.X.; Chua, S.L.; Lee, K.K.M.; Wu, Y.; Chan, J.S.H. Determination of Ethoxyquin by Ultra-High Performance Liquid Chromatography with Tandem Mass Spectrometry and a Singapore Survey of Ethoxyquin Residues in Eggs, Egg Products and Poultry. Food Addit. Contam. Part A 2024, 41, 261–270. [Google Scholar] [CrossRef]
- Yehye, W.A.; Rahman, N.A.; Ariffin, A.; Abd Hamid, S.B.; Alhadi, A.A.; Kadir, F.A.; Yaeghoobi, M. Understanding the Chemistry behind the Antioxidant Activities of Butylated Hydroxytoluene (BHT): A Review. Eur. J. Med. Chem. 2015, 101, 295–312. [Google Scholar] [CrossRef] [PubMed]
- Yu, L.L.; Yu, H.H.; Liang, X.F.; Li, N.; Wang, X.; Li, F.H.; Wu, X.F.; Zheng, Y.H.; Xue, M.; Liang, X.F. Dietary Butylated Hydroxytoluene Improves Lipid Metabolism, Antioxidant and Anti-Apoptotic Response of Largemouth Bass (Micropterus Salmoides). Fish Shellfish Immunol. 2018, 72, 220–229. [Google Scholar] [CrossRef]
- Wong, Y.H.; Goh, K.M.; Nyam, K.L.; Nehdi, I.A.; Sbihi, H.M.; Tan, C.P. Effects of Natural and Synthetic Antioxidants on Changes in 3-MCPD Esters and Glycidyl Ester in Palm Olein during Deep-Fat Frying. Food Control 2019, 96, 488–493. [Google Scholar] [CrossRef]
- Bayram, I.; Decker, E.A. Underlying Mechanisms of Synergistic Antioxidant Interactions during Lipid Oxidation. Trends Food Sci. Technol. 2023, 133, 219–230. [Google Scholar] [CrossRef]
- Li, J.; Chen, J.; Bi, Y.; Yang, H. Insight into Synergistic Antioxidation Mechanisms of Butyl Hydroxyanisole with Common Synthetic Antioxidants. Grain Oil Sci. Technol. 2022, 5, 114–130. [Google Scholar] [CrossRef]
- Borsato, D.; Cini, J.R. de M.; Silva, H.C. da; Coppo, R.L.; Angilelli, K.G.; Moreira, I.; Maia, E.C.R. Oxidation Kinetics of Biodiesel from Soybean Mixed with Synthetic Antioxidants BHA, BHT and TBHQ: Determination of Activation Energy. Fuel Process. Technol. 2014, 127, 111–116. [Google Scholar] [CrossRef]
- Ghorbani Gorji, S.; Smyth, H.E.; Sharma, M.; Fitzgerald, M. Lipid Oxidation in Mayonnaise and the Role of Natural Antioxidants: A Review. Trends Food Sci. Technol. 2016, 56, 88–102. [Google Scholar] [CrossRef]
- Yu, Z.; Lu, L.; Lu, L.; Pan, L.; Qiu, X.; Tang, Y. Development and Antioxidation of Metal Ion Chelating Packaging Film. Food Packag. Shelf Life 2022, 32, 100846. [Google Scholar] [CrossRef]
- Ma, P.; Wen, H.; Chen, X.; Zhang, W.; Rong, L.; Luo, Y.; Xie, J. Synergistic Rosemary Extract with TBHQ and Citric Acid Improves Oxidative Stability and Shelf Life of Peanut. J. Food Sci. 2024, 89, 3591–3602. [Google Scholar] [CrossRef]
- Ma, Y.; Wang, C.; Liu, C.; Tan, J.; Ma, H.; Wang, J. Physiochemical Responses of the Kernel Quality, Total Phenols and Antioxidant Enzymes of Walnut in Different Forms to the Low-Temperature Storage. Foods 2021, 10, 2027. [Google Scholar] [CrossRef]
- Mahesar, S.A.; Sherazi, S.T.H.; Khaskheli, A.R.; Kandhro, A.A.; Uddin, S. Analytical Approaches for the Assessment of Free Fatty Acids in Oils and Fats. Anal. Methods 2014, 6, 4956–4963. [Google Scholar] [CrossRef]
- Zhang, N.; Li, Y.; Wen, S.; Sun, Y.; Chen, J.; Gao, Y.; Sagymbek, A.; Yu, X. Analytical Methods for Determining the Peroxide Value of Edible Oils: A Mini-Review. Food Chem. 2021, 358, 129834. [Google Scholar] [CrossRef]
- Vandemoortele, A.; Heynderickx, P.M.; Leloup, L.; De Meulenaer, B. Kinetic Modeling of Malondialdehyde Reactivity in Oil to Simulate Actual Malondialdehyde Formation upon Lipid Oxidation. Food Res. Int. 2021, 140, 110063. [Google Scholar] [CrossRef] [PubMed]
- Farahat, M.; Abdallah, F.; Abdel-Hamid, T.; Hernandez-Santana, A. Effect of Supplementing Broiler Chicken Diets with Green Tea Extract on the Growth Performance, Lipid Profile, Antioxidant Status and Immune Response. Br. Poult. Sci. 2016, 57, 714–722. [Google Scholar] [CrossRef]
- Farahat, M.H.; Abdallah, F.M.; Ali, H.A.; Hernandez-Santana, A. Effect of Dietary Supplementation of Grape Seed Extract on the Growth Performance, Lipid Profile, Antioxidant Status and Immune Response of Broiler Chickens. animal 2017, 11, 771–777. [Google Scholar] [CrossRef] [PubMed]
- Hung, Y.T.; Hanson, A.R.; Urriola, P.E.; Johnston, L.J.; Kerr, B.J.; Shurson, G.C. Addition of Tert-Butylhydroquinone (TBHQ) to Maize Oil Reduces Lipid Oxidation but Does Not Prevent Reductions in Serum Vitamin E in Nursery Pigs. J. Anim. Sci. Biotechnol. 2019, 10, 51. [Google Scholar] [CrossRef]
- Fikry, A.M.; Attia, A.I.; Ismail, I.E.; Alagawany, M.; Reda, F.M. Dietary Citric Acid Enhances Growth Performance, Nutrient Digestibility, Intestinal Microbiota, Antioxidant Status, and Immunity of Japanese Quails. Poult. Sci. 2021, 100, 101326. [Google Scholar] [CrossRef]
- Chen, X.; Zeng, D.; Zeng, X.; Zeng, Q. Effects of Complex Antioxidants Added to Chicken Diet on Growth Performance, Serum Biochemical Indices, Meat Quality, and Antioxidant Capacity. Animals 2024, 14, 360. [Google Scholar] [CrossRef]
- Zhao, W.; Li, J.; Xing, T.; Zhang, L.; Gao, F. Effects of Guanidinoacetic Acid and Complex Antioxidant Supplementation on Growth Performance, Meat Quality, and Antioxidant Function of Broiler Chickens. J. Sci. Food Agric. 2021, 101, 3961–3968. [Google Scholar] [CrossRef]
- Pisoschi, A.M.; Pop, A.; Iordache, F.; Stanca, L.; Predoi, G.; Serban, A.I. Oxidative Stress Mitigation by Antioxidants - An Overview on Their Chemistry and Influences on Health Status. Eur. J. Med. Chem. 2021, 209, 112891. [Google Scholar] [CrossRef]
- Ayo, J.O.; Ogbuagu, N.E. Heat Stress, Haematology and Small Intestinal Morphology in Broiler Chickens: Insight into Impact and Antioxidant-Induced Amelioration. Worlds Poult. Sci. J. 2021, 77, 949–968. [Google Scholar] [CrossRef]
- Li, S.; Tan, H.-Y.; Wang, N.; Zhang, Z.-J.; Lao, L.; Wong, C.-W.; Feng, Y. The Role of Oxidative Stress and Antioxidants in Liver Diseases. Int. J. Mol. Sci. 2015, 16, 26087–26124. [Google Scholar] [CrossRef] [PubMed]
- Tao, Q.; Zhang, Z.-D.; Qin, Z.; Liu, X.-W.; Li, S.-H.; Bai, L.-X.; Ge, W.-B.; Li, J.-Y.; Yang, Y.-J. Aspirin Eugenol Ester Alleviates Lipopolysaccharide-Induced Acute Lung Injury in Rats While Stabilizing Serum Metabolites Levels. Front. Immunol. 2022, 13, 939106. [Google Scholar] [CrossRef] [PubMed]
- Circu, M.L.; Aw, T.Y. Intestinal Redox Biology and Oxidative Stress. Semin. Cell Dev. Biol. 2012, 23, 729–737. [Google Scholar] [CrossRef] [PubMed]
- Yamamoto, M.; Kensler, T.W.; Motohashi, H. The KEAP1-NRF2 System: A Thiol-Based Sensor-Effector Apparatus for Maintaining Redox Homeostasis. Physiol. Rev. 2018, 98, 1169–1203. [Google Scholar] [CrossRef] [PubMed]
- Campbell, N.K.; Fitzgerald, H.K.; Dunne, A. Regulation of Inflammation by the Antioxidant Haem Oxygenase 1. Nat. Rev. Immunol. 2021, 21, 411–425. [Google Scholar] [CrossRef]
- Ross, D.; Siegel, D. NQO1 in Protection against Oxidative Stress. Curr. Opin. Toxicol. 2018, 7, 67–72. [Google Scholar] [CrossRef]
- Onoki, T.; Izumi, Y.; Takahashi, M.; Murakami, S.; Matsumaru, D.; Ohta, N.; Wati, S.M.; Hatanaka, N.; Katsuoka, F.; Okutsu, M.; et al. Skeletal Muscle-Specific Keap1 Disruption Modulates Fatty Acid Utilization and Enhances Exercise Capacity in Female Mice. Redox Biol. 2021, 43, 101966. [Google Scholar] [CrossRef]
- Wang, M.; Yang, C.; Wang, Q.; Li, J.; Huang, P.; Li, Y.; Ding, X.; Yang, H.; Yin, Y. The Relationship between Villous Height and Growth Performance, Small Intestinal Mucosal Enzymes Activities and Nutrient Transporters Expression in Weaned Piglets. J. Anim. Physiol. Anim. Nutr. 2020, 104, 606–615. [Google Scholar] [CrossRef]
- Hu, P.; Yuan, M.; Guo, B.; Lin, J.; Yan, S.; Huang, H.; Chen, J.-L.; Wang, S.; Ma, Y. Citric Acid Promotes Immune Function by Modulating the Intestinal Barrier. Int. J. Mol. Sci. 2024, 25, 1239. [Google Scholar] [CrossRef]
- Suzuki, T. Regulation of Intestinal Epithelial Permeability by Tight Junctions. Cell. Mol. Life Sci. 2013, 70, 631–659. [Google Scholar] [CrossRef] [PubMed]
- Buckley, A.; Turner, J.R. Cell Biology of Tight Junction Barrier Regulation and Mucosal Disease. Cold Spring Harb. Perspect. Biol. 2018, 10, a029314. [Google Scholar] [CrossRef] [PubMed]
- Cai, G.; Wu, Y.; Wusiman, A.; Gu, P.; Mao, N.; Xu, S.; Zhu, T.; Feng, Z.; Liu, Z.; Wang, D. Alhagi Honey Polysaccharides Attenuate Intestinal Injury and Immune Suppression in Cyclophosphamide-Induced Mice. Food Funct. 2021, 12, 6863–6877. [Google Scholar] [CrossRef] [PubMed]
- Garcia-Carbonell, R.; Yao, S.-J.; Das, S.; Guma, M. Dysregulation of Intestinal Epithelial Cell RIPK Pathways Promotes Chronic Inflammation in the IBD Gut. Front. Immunol. 2019, 10, 1094. [Google Scholar] [CrossRef]
- Nii, T.; Bungo, T.; Isobe, N.; Yoshimura, Y. Intestinal Inflammation Induced by Dextran Sodium Sulphate Causes Liver Inflammation and Lipid Metabolism Disfunction in Laying Hens. Poult. Sci. 2020, 99, 1663–1677. [Google Scholar] [CrossRef]
- Pelaseyed, T.; Bergström, J.H.; Gustafsson, J.K.; Ermund, A.; Birchenough, G.M.H.; Schütte, A.; van der Post, S.; Svensson, F.; Rodríguez-Piñeiro, A.M.; Nyström, E.E.L.; et al. The Mucus and Mucins of the Goblet Cells and Enterocytes Provide the First Defense Line of the Gastrointestinal Tract and Interact with the Immune System. Immunol. Rev. 2014, 260, 8–20. [Google Scholar] [CrossRef]
- Rohr, M.W.; Narasimhulu, C.A.; Rudeski-Rohr, T.A.; Parthasarathy, S. Negative Effects of a High-Fat Diet on Intestinal Permeability: A Review. Adv. Nutr. 2020, 11, 77–91. [Google Scholar] [CrossRef]
- Nenci, A.; Becker, C.; Wullaert, A.; Gareus, R.; van Loo, G.; Danese, S.; Huth, M.; Nikolaev, A.; Neufert, C.; Madison, B.; et al. Epithelial NEMO Links Innate Immunity to Chronic Intestinal Inflammation. Nature 2007, 446, 557–561. [Google Scholar] [CrossRef]
- Sun, S.-C.; Chang, J.-H.; Jin, J. Regulation of Nuclear Factor-κB in Autoimmunity. Trends Immunol. 2013, 34, 282–289. [Google Scholar] [CrossRef]
- BEINKE, S.; LEY, S.C. Functions of NF-κB1 and NF-κB2 in Immune Cell Biology. Biochem. J. 2004, 382, 393–409. [Google Scholar] [CrossRef]
- Chang, M.; Lee, A.J.; Fitzpatrick, L.; Zhang, M.; Sun, S.-C. NF-κB1 P105 Regulates T Cell Homeostasis and Prevents Chronic Inflammation1. J. Immunol. 2009, 182, 3131–3138. [Google Scholar] [CrossRef] [PubMed]
- Sun, S.-C. Non-Canonical NF-κB Signaling Pathway. Cell Res. 2011, 21, 71–85. [Google Scholar] [CrossRef] [PubMed]
- Guarner, F.; Malagelada, J.-R. Gut Flora in Health and Disease. The Lancet 2003, 361, 512–519. [Google Scholar] [CrossRef] [PubMed]
- Xie, D.; Jiang, L.; Lin, Y.; Liu, Z. Antioxidant Activity of Selenium-Enriched Chrysomyia Megacephala (Fabricius) Larvae Powder and Its Impact on Intestinal Microflora in D-Galactose Induced Aging Mice. BMC Complement. Med. Ther. 2020, 20, 264. [Google Scholar] [CrossRef] [PubMed]
- Riaz Rajoka, M.S.; Thirumdas, R.; Mehwish, H.M.; Umair, M.; Khurshid, M.; Hayat, H.F.; Phimolsiripol, Y.; Pallarés, N.; Martí-Quijal, F.J.; Barba, F.J. Role of Food Antioxidants in Modulating Gut Microbial Communities: Novel Understandings in Intestinal Oxidative Stress Damage and Their Impact on Host Health. Antioxidants 2021, 10, 1563. [Google Scholar] [CrossRef]
- Segain, J.-P.; Blétière, D.R. de la; Bourreille, A.; Leray, V.; Gervois, N.; Rosales, C.; Ferrier, L.; Bonnet, C.; Blottière, H.M.; Galmiche, J.-P. Butyrate Inhibits Inflammatory Responses through NFκB Inhibition: Implications for Crohn’s Disease. Gut 2000, 47, 397–403. [Google Scholar] [CrossRef]
- Zhang, F.; Wan, Y.; Zuo, T.; Yeoh, Y.K.; Liu, Q.; Zhang, L.; Zhan, H.; Lu, W.; Xu, W.; Lui, G.C.Y.; et al. Prolonged Impairment of Short-Chain Fatty Acid and L-Isoleucine Biosynthesis in Gut Microbiome in Patients With COVID-19. Gastroenterology 2022, 162, 548–561.e4. [Google Scholar] [CrossRef]
- Han, G.G.; Lee, J.-Y.; Jin, G.-D.; Park, J.; Choi, Y.H.; Chae, B.J.; Kim, E.B.; Choi, Y.-J. Evaluating the Association between Body Weight and the Intestinal Microbiota of Weaned Piglets via 16S rRNA Sequencing. Appl. Microbiol. Biotechnol. 2017, 101, 5903–5911. [Google Scholar] [CrossRef]
- Ma, Y.; Wang, W.; Zhang, H.; Wang, J.; Zhang, W.; Gao, J.; Wu, S.; Qi, G. Supplemental Bacillus Subtilis DSM 32315 Manipulates Intestinal Structure and Microbial Composition in Broiler Chickens. Sci. Rep. 2018, 8, 15358. [Google Scholar] [CrossRef]
- Zeng, X.; Xing, X.; Gupta, M.; Keber, F.C.; Lopez, J.G.; Lee, Y.-C.J.; Roichman, A.; Wang, L.; Neinast, M.D.; Donia, M.S.; et al. Gut Bacterial Nutrient Preferences Quantified in Vivo. Cell 2022, 185, 3441–3456.e19. [Google Scholar] [CrossRef]
- Yang, Y.; Torchinsky, M.B.; Gobert, M.; Xiong, H.; Xu, M.; Linehan, J.L.; Alonzo, F.; Ng, C.; Chen, A.; Lin, X.; et al. Focused Specificity of Intestinal TH17 Cells towards Commensal Bacterial Antigens. Nature 2014, 510, 152–156. [Google Scholar] [CrossRef] [PubMed]
- Ivanov, I.I.; Atarashi, K.; Manel, N.; Brodie, E.L.; Shima, T.; Karaoz, U.; Wei, D.; Goldfarb, K.C.; Santee, C.A.; Lynch, S.V.; et al. Induction of Intestinal Th17 Cells by Segmented Filamentous Bacteria. Cell 2009, 139, 485–498. [Google Scholar] [CrossRef] [PubMed]
- Danzeisen, J.L.; Calvert, A.J.; Noll, S.L.; McComb, B.; Sherwood, J.S.; Logue, C.M.; Johnson, T.J. Succession of the Turkey Gastrointestinal Bacterial Microbiome Related to Weight Gain. PeerJ 2013, 1, e237. [Google Scholar] [CrossRef]
- Lynch, J.B.; Gonzalez, E.L.; Choy, K.; Faull, K.F.; Jewell, T.; Arellano, A.; Liang, J.; Yu, K.B.; Paramo, J.; Hsiao, E.Y. Gut Microbiota Turicibacter Strains Differentially Modify Bile Acids and Host Lipids. Nat. Commun. 2023, 14, 3669. [Google Scholar] [CrossRef]
- Torok, V.A.; Hughes, R.J.; Mikkelsen, L.L.; Perez-Maldonado, R.; Balding, K.; MacAlpine, R.; Percy, N.J.; Ophel-Keller, K. Identification and Characterization of Potential Performance-Related Gut Microbiotas in Broiler Chickens across Various Feeding Trials. Appl. Environ. Microbiol. 2011, 77, 5868–5878. [Google Scholar] [CrossRef]
- Parker, B.J.; Wearsch, P.A.; Veloo, A.C.M.; Rodriguez-Palacios, A. The Genus Alistipes: Gut Bacteria With Emerging Implications to Inflammation, Cancer, and Mental Health. Front. Immunol. 2020, 11, 906. [Google Scholar] [CrossRef]
- Xu, Y.-X.; Liu, L.-D.; Zhu, J.-Y.; Zhu, S.-S.; Ye, B.-Q.; Yang, J.-L.; Huang, J.-Y.; Huang, Z.-H.; You, Y.; Li, W.-K.; et al. Alistipes Indistinctus-Derived Hippuric Acid Promotes Intestinal Urate Excretion to Alleviate Hyperuricemia. Cell Host Microbe 2024, 32, 366–381.e9. [Google Scholar] [CrossRef] [PubMed]
- Dziarski, R.; Park, S.Y.; Kashyap, D.R.; Dowd, S.E.; Gupta, D. Pglyrp-Regulated Gut Microflora Prevotella Falsenii, Parabacteroides Distasonis and Bacteroides Eggerthii Enhance and Alistipes Finegoldii Attenuates Colitis in Mice. PLOS ONE 2016, 11, e0146162. [Google Scholar] [CrossRef]
- Chen, Q.; Wang, S.; Guo, J.; Xie, Q.; Evivie, S.E.; Song, Y.; Li, B.; Huo, G. The Protective Effects of Lactobacillus Plantarum KLDS 1.0344 on LPS-Induced Mastitis In Vitro and In Vivo. Front. Immunol. 2021, 12, 770822. [Google Scholar] [CrossRef]
- Zhang, H.; Pertiwi, H.; Hou, Y.; Majdeddin, M.; Michiels, J. Protective Effects of Lactobacillus on Heat Stress-Induced Intestinal Injury in Finisher Broilers by Regulating Gut Microbiota and Stimulating Epithelial Development. Sci. Total Environ. 2024, 918, 170410. [Google Scholar] [CrossRef]
- Wang, L.; Lin, Z.; Ali, M.; Zhu, X.; Zhang, Y.; Li, S.; Li, K.; Kebzhai, F.; Li, J. Effects of Lactic Acid Bacteria Isolated from Tibetan Chickens on the Growth Performance and Gut Microbiota of Broiler. Front. Microbiol. 2023, 14, 1171074. [Google Scholar] [CrossRef] [PubMed]
- Xu, Y.; Li, H.; Chen, W.; Yao, X.; Xing, Y.; Wang, X.; Zhong, J.; Meng, G. Mycoplasma Hyorhinis Activates the NLRP3 Inflammasome and Promotes Migration and Invasion of Gastric Cancer Cells. PLOS ONE 2013, 8, e77955. [Google Scholar] [CrossRef] [PubMed]
- Gates, T.J.; Yuan, C.; Shetty, M.; Kaiser, T.; Nelson, A.C.; Chauhan, A.; Starr, T.K.; Staley, C.; Subramanian, S. Fecal Microbiota Restoration Modulates the Microbiome in Inflammation-Driven Colorectal Cancer. Cancers 2023, 15, 2260. [Google Scholar] [CrossRef] [PubMed]


| Ingredients | % | Nutrient parameters | Nutrient level |
|---|---|---|---|
| Corn | 52.35 | Metabolic energy, Kcal/kg | 2950 |
| Soybean meal | 38.71 | Crude protein, % | 22.0 |
| Corn gluten meal | 1.31 | Lys, % | 1.31 |
| Soybean oil | 3.06 | Met, % | 0.48 |
| Dicalcium phosphate | 1.79 | Met + Cys, % | 0.96 |
| Limestone | 1.3 | Thr, % | 0.86 |
| Sodium chloride | 0.35 | Val, % | 0.89 |
| Choline chloride (50%) | 0.2 | Calcium, % | 1.02 |
| L-Lysine Hydrochloride (98.5%) | 0.26 | Non-phytate phosphorus, % | 0.39 |
| DL-Methionine (98%) | 0.31 | ||
| L-Threonine (98.5%) | 0.05 | ||
| L-Isoleucine (90%) | 0.03 | ||
| L-Arginine (98%) | 0.02 | ||
| Phytase (10000U/g) | 0.03 | ||
| Mineral premix1 | 0.2 | ||
| Vitamin premix2 | 0.03 | ||
| Total | 100 |
| Gene1 | Primer sequences (5’-3’)2 | Accession number |
|---|---|---|
| β-actin | F: TTGTTGACAATGGCTCCGGT | NM_205518.1 |
| R: TCTGGGCTTCATCACCAACG | ||
| IFN-γ | F: CTCGCAACCTTCACCTCACCATC | NM_205149.1 |
| R: CAGGAACCAGGCACGAGCTTG | ||
| IL-6 | F: GAACGTCGAGTCTCTGTGCTAC | NM_204628 |
| R: CACCATCTGCCGGATCGT | ||
| IL-1β | F: CAGCCTCAGCGAAGAGACCTT | NM_204524 |
| R: ACTGTGGTGTGCTCAGAATCC | ||
| TNF-α | F: CCCCTACCCTGTCCCACAA | NM_204267 |
| R: TGAGTACTGCGGAGGGTTCAT | ||
| IL-18 | F: GTGTGTGCAGTACGGCTTAG | NM_204608.1 |
| R: TCCACTGCCAGATTTCACCT |
| Item1 | Duodenum | Jejunum | ||||
|---|---|---|---|---|---|---|
| VH | CD | VCR | VH | CD | VCR | |
| CON | 1413.64 | 214.71 | 6.28b | 965.15b | 175.31b | 5.57a |
| EQ | 1253.73 | 211.79 | 5.93b | 752.79c | 165.16b | 4.38b |
| CA | 1366.46 | 204.85 | 7.38a | 1112.82a | 203.73a | 5.07a |
| SEM | 29.265 | 4.838 | 0.159 | 37.593 | 5.567 | 0.147 |
| p-Value | 0.067 | 0.71 | < 0.001 | < 0.001 | 0.008 | 0.001 |
Disclaimer/Publisher’s Note: The statements, opinions and data contained in all publications are solely those of the individual author(s) and contributor(s) and not of MDPI and/or the editor(s). MDPI and/or the editor(s) disclaim responsibility for any injury to people or property resulting from any ideas, methods, instructions or products referred to in the content. |
© 2024 by the authors. Licensee MDPI, Basel, Switzerland. This article is an open access article distributed under the terms and conditions of the Creative Commons Attribution (CC BY) license (http://creativecommons.org/licenses/by/4.0/).


