1. Introduction
The rapid rise in global greenhouse gas (GHG) emissions since the debut of the Industrial Revolution has led to considerable changes in the Earth’s climate, which has been the subject of much research over recent decades. The Intergovernmental Panel on Climate Change (IPCC) has determined that this increase in anthropogenic GHG emissions is the primary driver of climate change, which can push temperatures beyond the thermal tolerances of many species [
1,
2]. According to current trends, global warming that is linked to these gases will likely exceed 1.5 °C within several decades, despite aggressive emissions reduction strategies [
3]. Removing CO2 from the atmosphere by favouring nature-based solutions (protected areas and forests) could contribute greatly to climate change mitigation [
4,
5,
6].
Forests constitute one of the largest reservoirs of terrestrial carbon, thereby playing a vital role in offsetting the aforementioned climate changes and regulating global carbon balance. Annually, they contribute to about 50% of net terrestrial primary production, store about 45% of the planet's active carbon, and sequester around 33% of anthropogenic emissions [
7,
8,
9]. Unfortunately, tropical forest ecosystems, which maintain the global ecological equilibrium, are constantly threatened by deforestation and degradation for economic purposes. Timber extraction and forest clearing for other land uses are among the largest sources of anthropogenic carbon emissions [
10]. In this context, the implementation of the Paris Agreement on climate change and the 2030 Agenda for Sustainable Development (adopted in 2015) by UN member nations require quantitative studies that would provide essential data for monitoring forest dynamics [
11,
12,
13].
Canopy height is one of several structural parameters that is used to monitor these forest dynamics. Its precise estimation is crucial for quantifying biophysical parameters, such as aboveground biomass, carbon storage, biodiversity, and many other parameters to which it is strongly linked [
14,
15,
16]. Traditional methods of estimating forest height are based upon manual forest inventories, which are conducted in the field. While these inventories can provide accurate detailed information, they are very labour-intensive, time-consuming, and may cover only small spatio-temporal scales. Consequently, remote sensing has been employed in recent decades, in combination with field measurements, to estimate canopy height over large spatial extents [
17,
16]. The remote sensing observations are provided by various platforms. These include for instance multi-spectral optical data that are derived from Landsat [
18,
19], Sentinel 2 [
20,
21], or SPOT5 [
22,
23], as well as synthetic aperture radar (SAR) data from Sentinel 1 [
24,
25], TerraSAR-X [
26,
27], TanDEM-X [
28,
29] or ALOS PALSAR [
30,
31]. Regardless of whether the data are optical or obtained from radar, signal saturation (especially in dense forests) can constitute a substantial limitation [
32,
33,
34,
35]. The introduction of LiDAR (Light Detection And Ranging) has enabled notable advances in the estimation of canopy height, because of their capacity to detect vertical structure in the forest [
16]. The most frequently used applications in forestry are based on telemetry from airborne laser scanning (ALS) [
36,
37] and terrestrial laser scanning (TLS) [
38,
39]. However, ALS and TLS exhibit spatio-temporal limitations, given that it is generally difficult to apply them over large areas and on a regular basis, due to their high costs of acquisition and to signal occultation, particularly in dense forests [
40,
41,
42,
43].
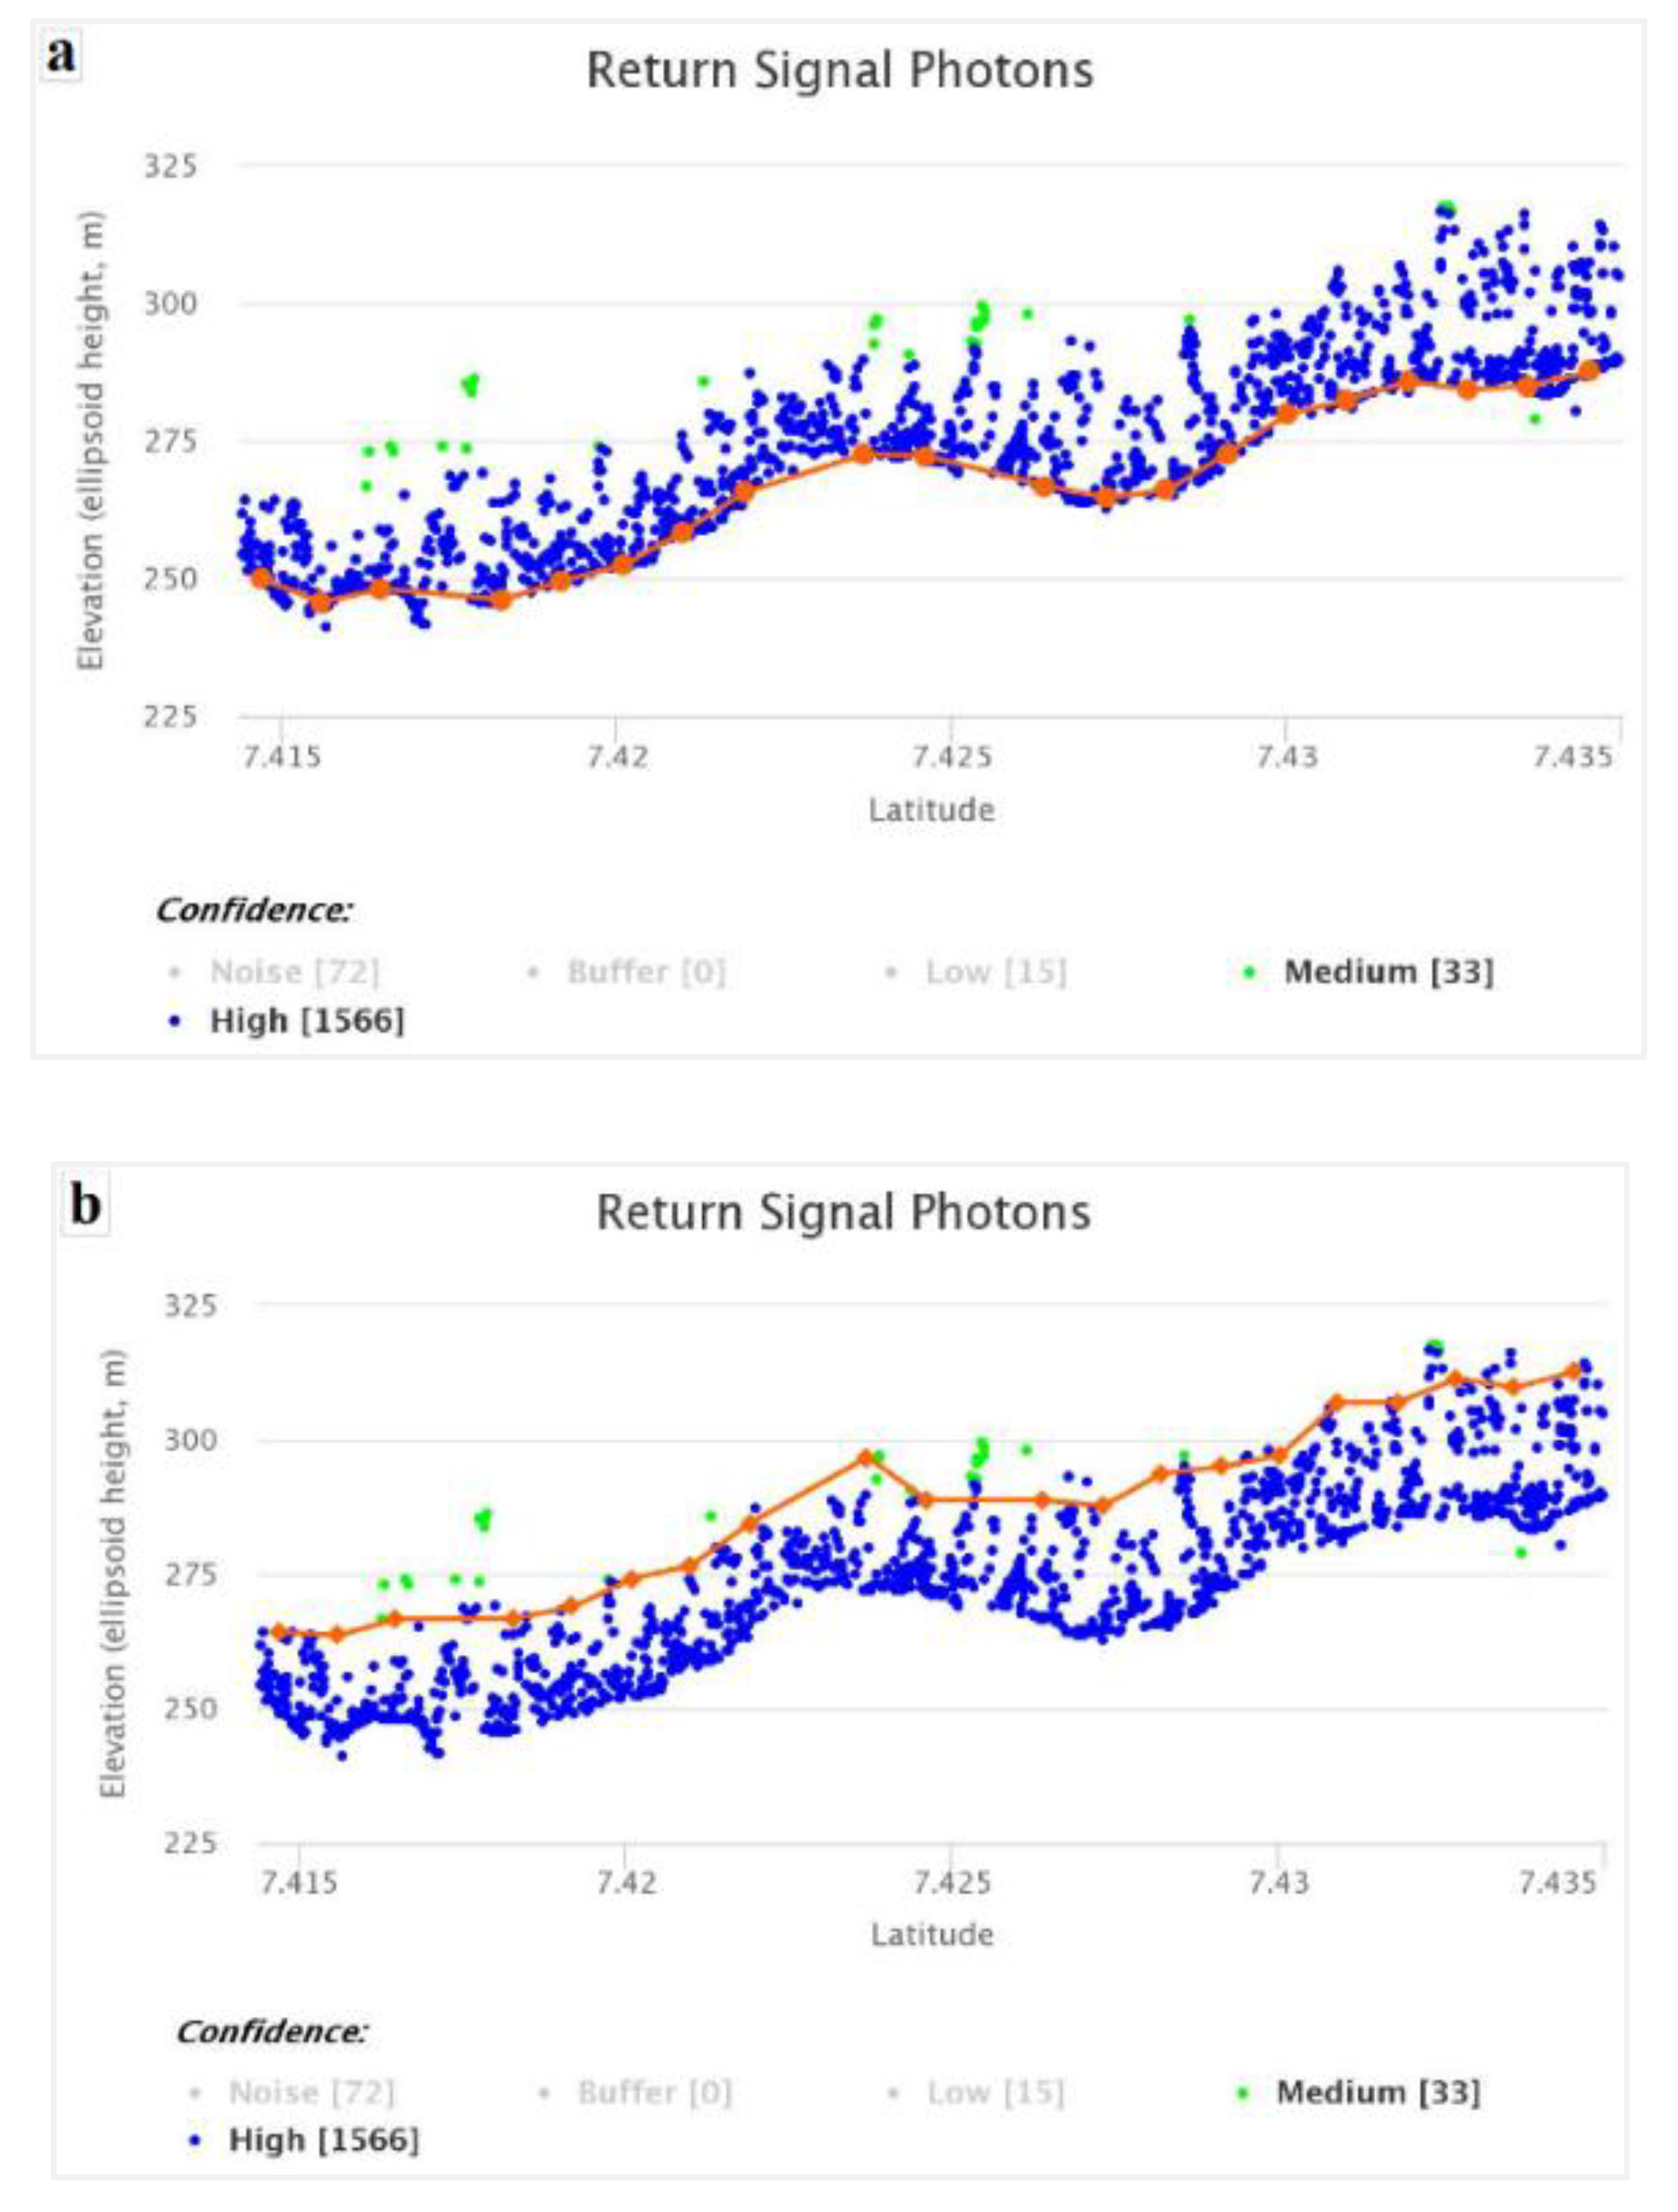
Airborne or satellite platforms have made it possible to extend canopy height estimation from local to global spatial scales [
13]. The first platform, i.e., Ice, Cloud, and land Elevation Satellite (ICESat) carried the Geoscience Laser Altimeter System (GLAS). Between 2003 and 2009, this sensor made it possible to estimate the height of forests on a global scale on circular footprints with a diameter of about 60 m and a spacing of about 170 m along the transects [
44,
45,
46,
9]. The second ICESat-2 satellite was launched in September 2018 and carried the Advanced Topographic Laser Altimetry System (ATLAS), which uses photon-counting LiDAR technology. Between 88◦ S and 88◦ N, the laser produces three pairs of beams, thereby making it possible to obtain altimeter parameters on Earth’s surface for continuous monitoring of polar glaciers. In parallel with its main mission, this satellite also acquired terrestrial measurements of forest cover and vegetation. For the scientific community, this represents an important database for mapping plant biomass and for estimating carbon inventories at a global level [
47,
17]. The latest LiDAR instrument that was launched into space by NASA in December 2018 is the Global Ecosystem Dynamics Investigation (GEDI) system, which operates aboard the International Space Station (ISS) between 51.6◦ N and 51.6◦ S. GEDI is a multi-beam laser altimeter that measures parameters of vertical canopy structures at a very high sampling rate, thereby allowing forest height and wood volume estimation across different types of forest ecosystems, topography and latitudes [
13]. Data that are acquired by GEDI have been increasingly used to estimate forest height and forest biomass [
48,
49,
50]. These data consist of an impressive number of samples, which offer great potential for estimating canopy heights in complex savannah and forest mosaics.
ICESat-2 and GEDI LiDAR data are point clouds that permit the height of forest cover to be estimated, but only within ground acquisition footprints, rather than in a spatially continuous manner over large areas [
51]. In contrast, optical or radar data provide continuous spatial coverage; but cannot, alone, allow the direct extraction of vertical profiles of the canopy. Therefore, the complementarity of different types of data can be exploited to map the height of the forest cover [
52,
53,
54,
55]. To accomplish this task, machine-learning models are being increasingly used to combine vertical LiDAR profiles with spectral or backscatter attributes [
56,
16]. For example, Li
et al. [
15] used variables derived from Sentinel 1&2 and Landsat-8 images over Northeast China to extrapolate ICESat-2 canopy height from the footprint-level to regional-level, using Deep Learning (DL) and Random Forest (RF) models, with correlations of (
r =) 0.78 and 0.68, respectively. Zhu
et al. [
9] used stepwise regression and Random Forest (RF) approaches to estimate canopy heights in the United States. They obtained better results with RF using GEDI variables (
R2 = 0.93; RMSE = 2.99 m) compared to those of ICESat-2 (
R2 = 0.78; RMSE = 4.62 m). Sothe
et al. [
57] carried out continuous mapping of the forest cover height of Canada from the combination of GEDI and ICESat-2 data with PALSAR and Sentinel data. They found that both LiDAR products overestimated canopy height compared to ALS data, but GEDI outperformed ICESat-2, with an average difference of 0.9 m vs. 2.9 m and RMSE of 4.2 m vs. 5.2 m, respectively. To map China's forest canopy heights, Liu
et al. [
58] used neural network-guided interpolation to merge GEDI and ICESat-2 data. They then compared the height of the forest cover that was interpolated with the GEDI validation footprints (
R2 = 0.55; RMSE = 5.32 m), followed by drone-LiDAR validation data (
R2 = 0.58, RMSE = 4.93 m) and, finally, with field-collected data (
R2 = 0.60; RMSE = 4.88 m).
The aforementioned examples show real potential for using GEDI and ICESat-2 data alone or in combination with other spatial data. However, they also raise several questions, which depend upon the ecosystems that are being considered. Of particular interest is the following: Can the use of GEDI or ICESat-2 data (alone or in combination) with multisource optical or radar satellite observations make it possible to estimate satisfactorily the canopy heights of complex mosaics of forests and savannahs in a tropical environment? Our study attempts to answer the question through analyses of the forest-savannah mosaics of the Sudano-Guinean zone of West Africa, particularly in Togo, where research of this type is almost non-existent. Our main objective is to develop models for estimating height of the canopy in forest-savannah mosaics using a combination of space LiDAR, optical data and radar data. The specific objectives that we pursued are: 1) to analyze the performance of covariates and ICESat-2 and GEDI data in predicting canopy height in these forest ecosystems; 2) to develop canopy height prediction models that are adapted to forest-savannah mosaics; and 3) to establish continuous mapping of canopy height in these forest types from these discontinuous satellite LiDAR data. To accomplish these goals, optical and radar co-variables, such as spectral reflectances, vegetation indices, texture and backscatter variables, are derived from the spatially continuous satellite data, which were then integrated with those derived from ICESat-2 and GEDI, using machine-learning models.
5. Conclusions
In our search for greater accuracy in estimating the canopy height of forest-savannah mosaics in the Sudano-Guinean zone, the research relied upon a combination of multisource and multisensor data. Four machine-learning algorithms (RF, SVM, XGBoost, DNN) were evaluated before selecting Random Forest, which was demonstrably more efficient in predicting canopy height across the study area than the remaining models. Our results indicate that the final model developed from GEDI data is more efficient than that derived from ICESat-2. Investigations carried out during this research also reveal that the prediction models based on grouping data by height classes did not provide any improvement compared to those where the height classes were not defined, using both GEDI and ICESat-2 data.
Estimation of canopy height was best achieved using combinations of several types of remote sensing data rather than using each one in isolation. Yet, we found that variables derived from optical and topographic data contributed much more to the development of better performing models that did those derived from radar data, which showed very little sensitivity. Furthermore, future studies should be able to assess the effects of different variables extracted from the radar data for the estimation of forest and vegetation structural parameters. The return signal that is received by satellite LiDAR sensors depends upon the characteristics of the land cover (height, density, canopy closure). Future studies, therefore, could also analyze the effects of ecosystem characteristics on the quality of GEDI-based models, especially in the ecosystems within our study area, which are characterized by sparse and relatively small vegetation types or patches.
In the short-term, our results of canopy height modelling could be used by local decision-makers for forest management in the study area by favouring the use of GEDI data in estimating canopy height. In the long-term, the estimation of field dendrometric parameters within GEDI data footprints is more necessary than ever in order to better validate the models that have been developed. Validation of these GEDI data and models in this particular eco-climatic zone would also provide forest managers with an appropriate tool for estimating aboveground biomass to better understand forest dynamics and carbon fluxes and, thus, adapt their practices and management methods to the requirements of REDD+.
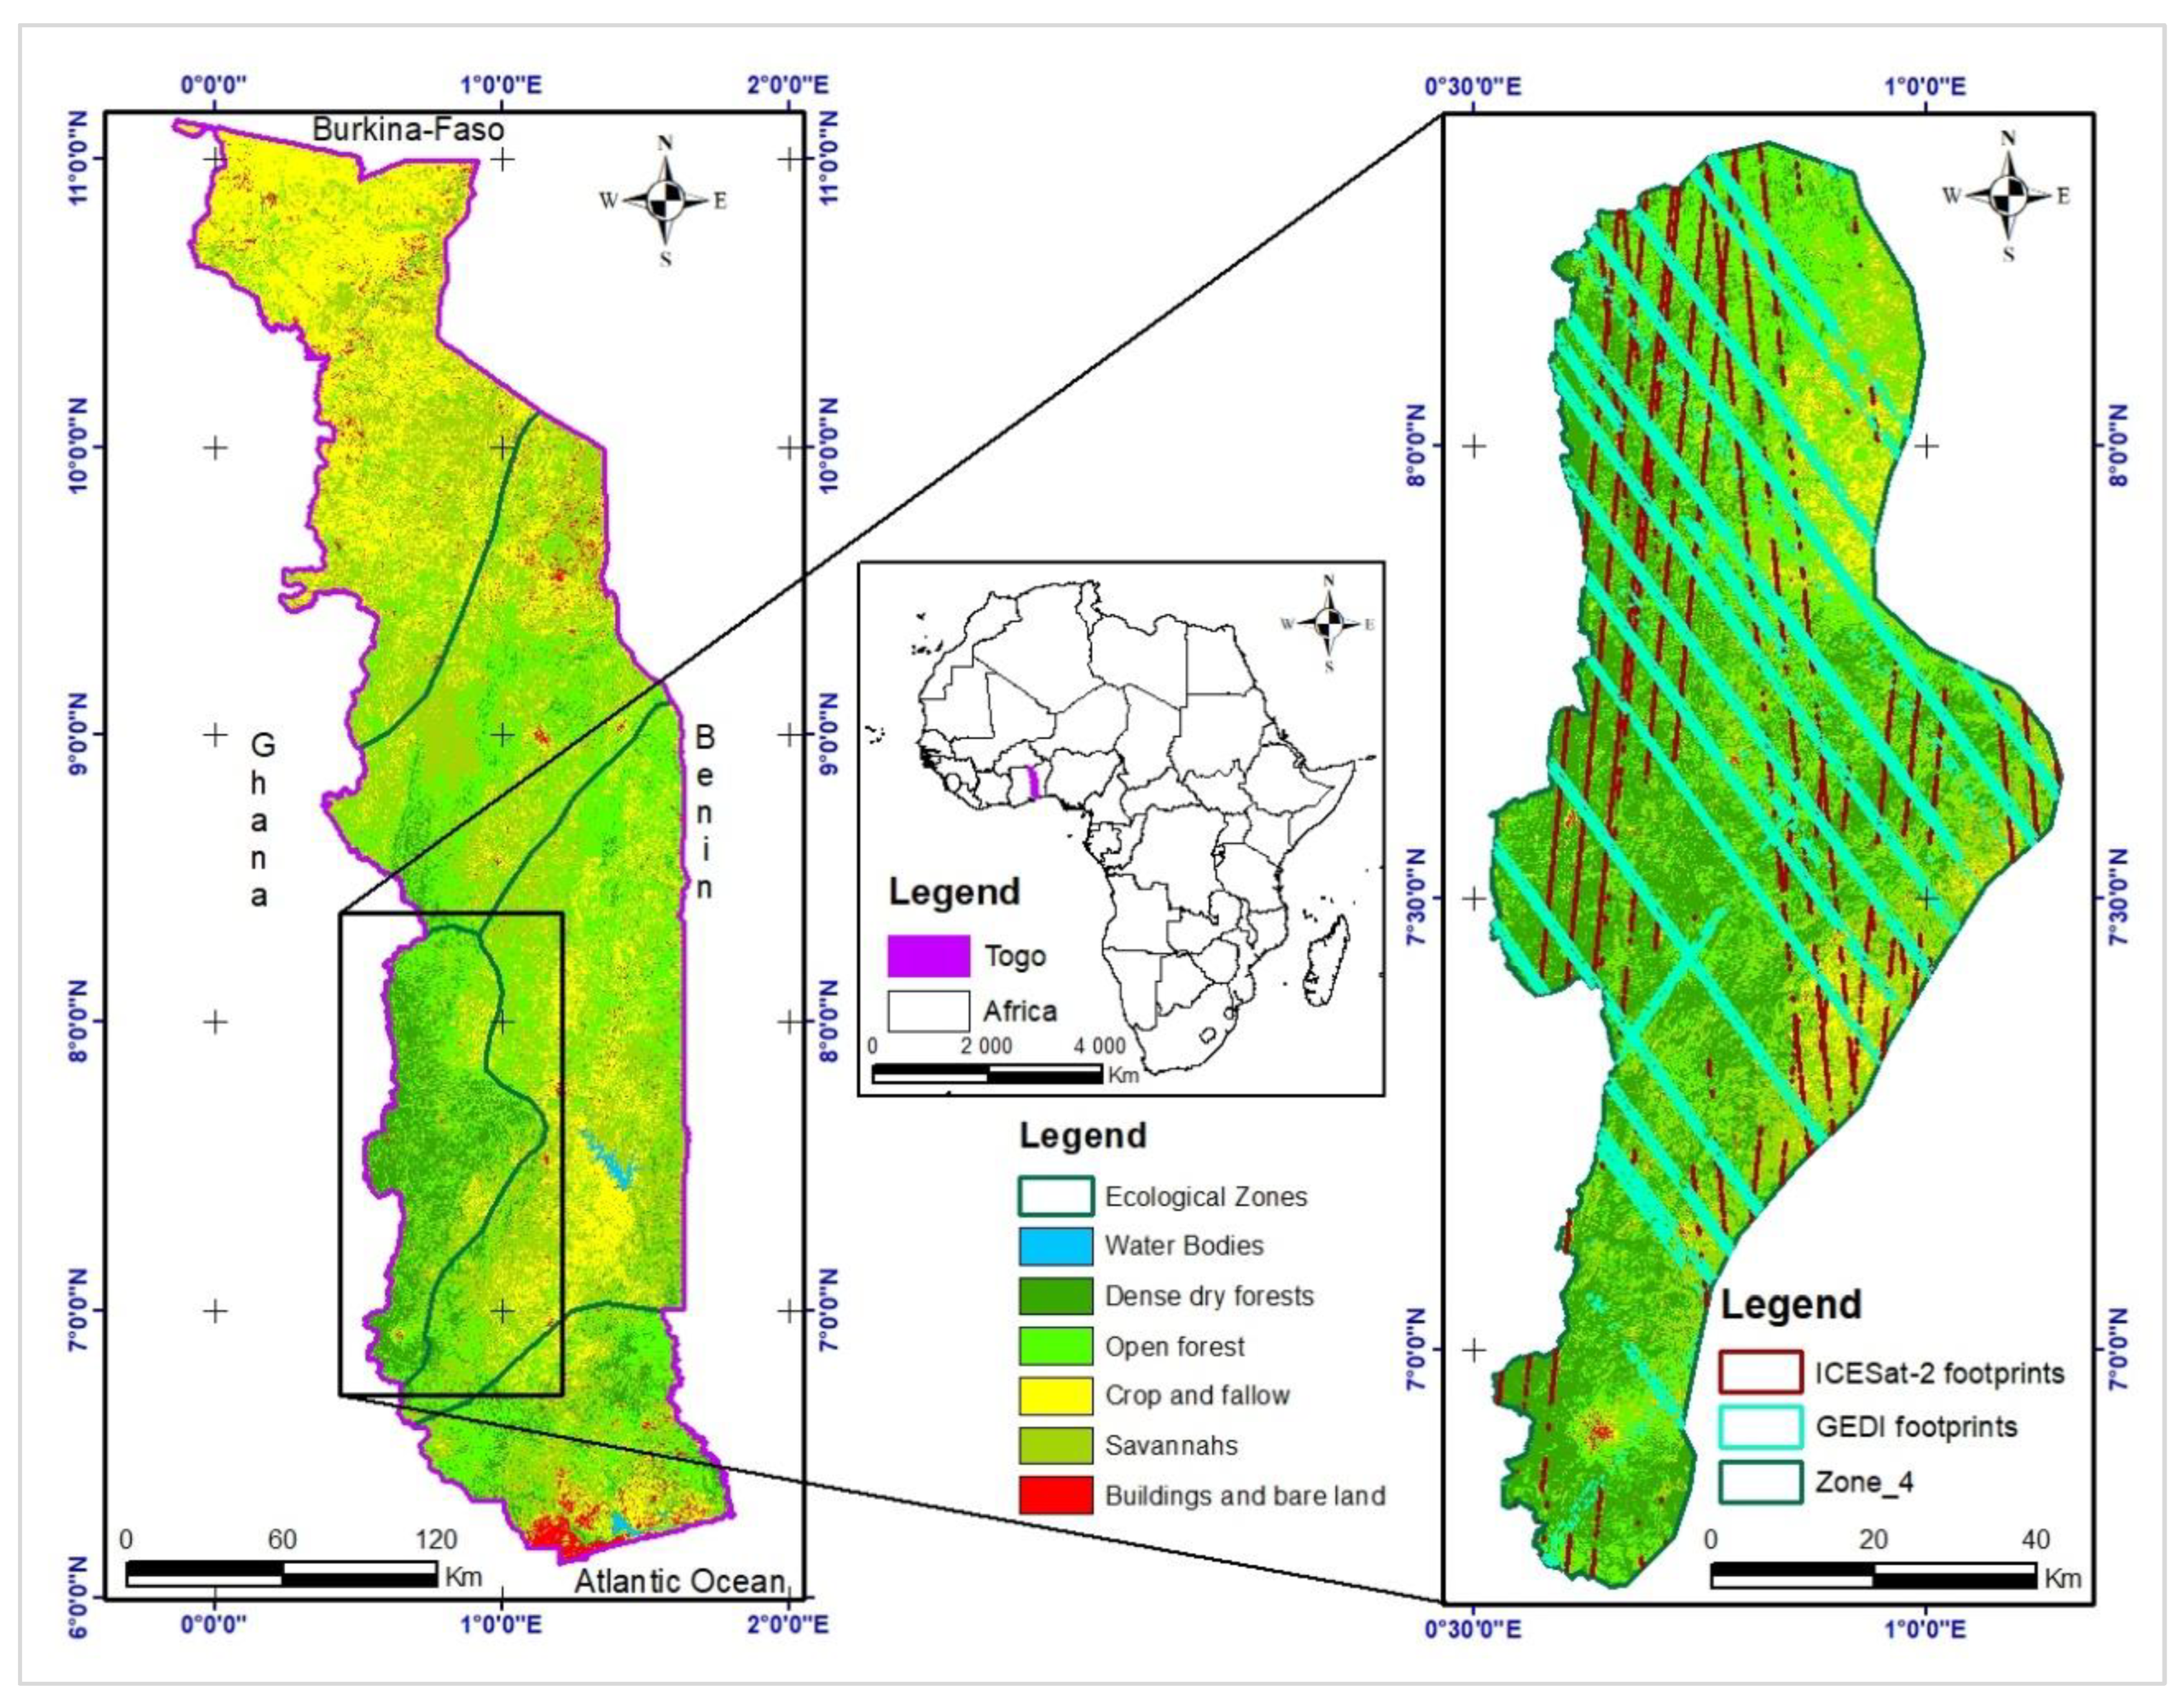
Figure 1.
Location of Ecological Zone 4 within Togo.
Figure 1.
Location of Ecological Zone 4 within Togo.
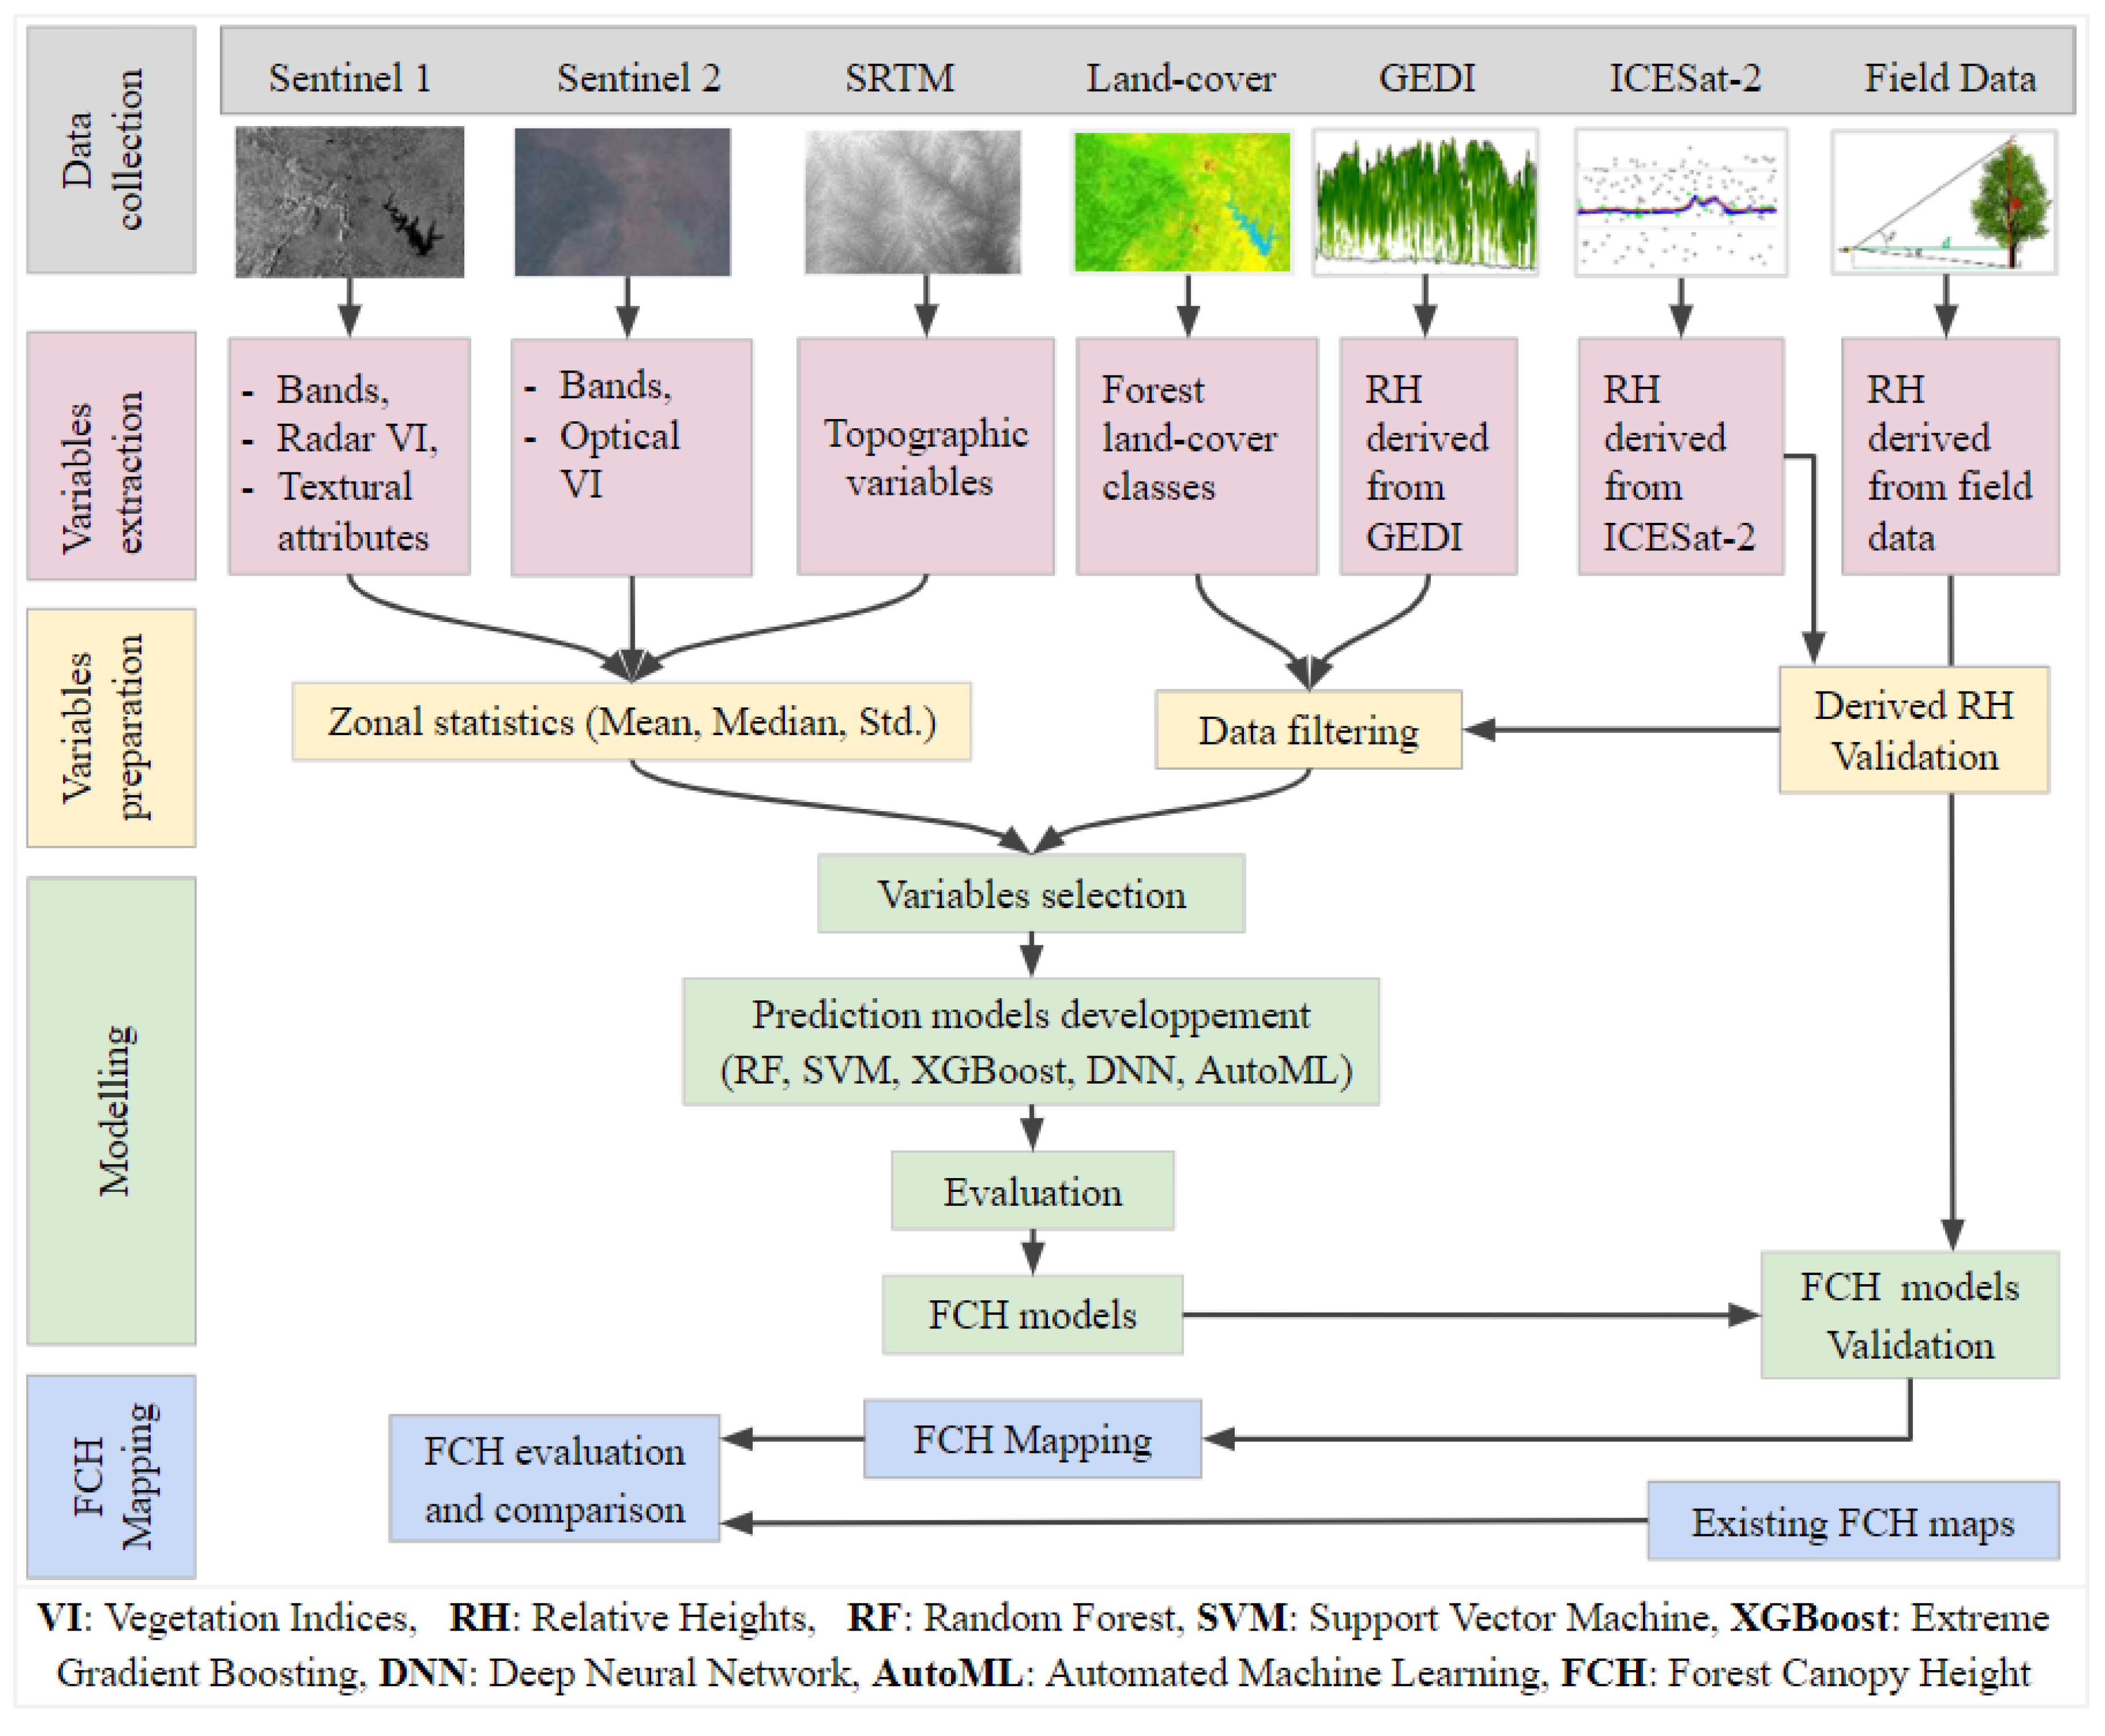
Figure 2.
Flowchart of the research methodology.
Figure 2.
Flowchart of the research methodology.
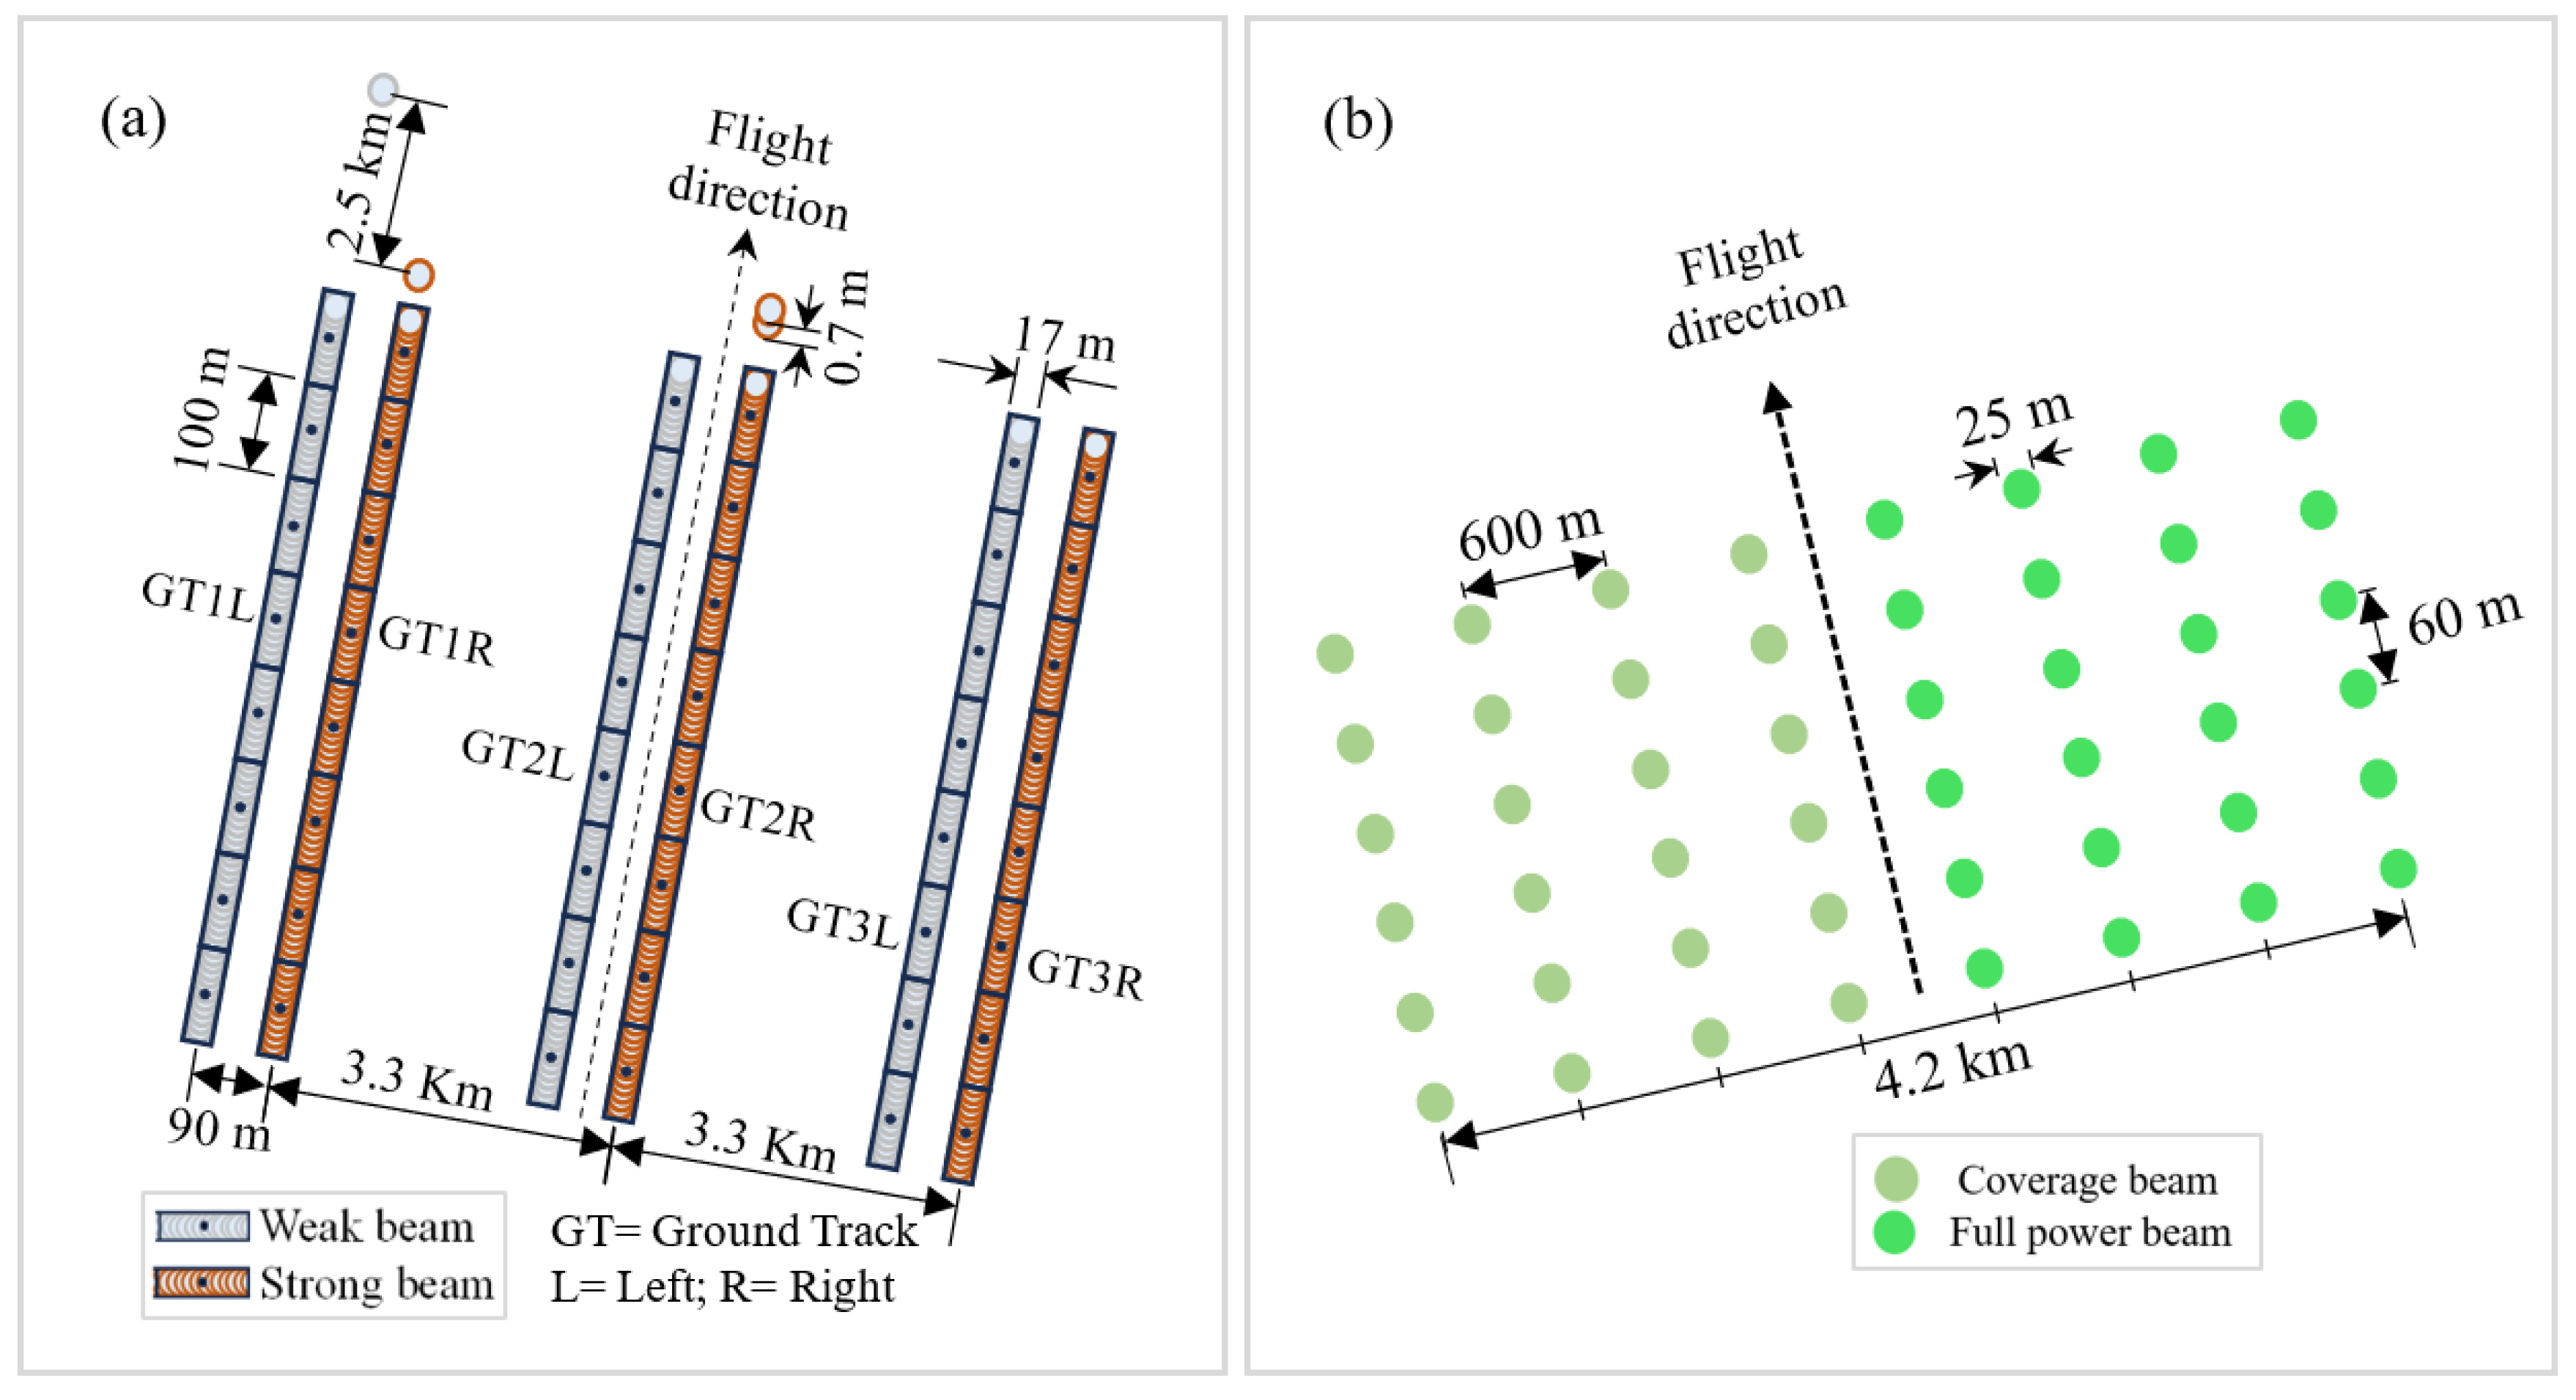
Figure 3.
Illustrative diagram of the structure of ICESat-2 (a) and GEDI (b) footprints.
Figure 3.
Illustrative diagram of the structure of ICESat-2 (a) and GEDI (b) footprints.
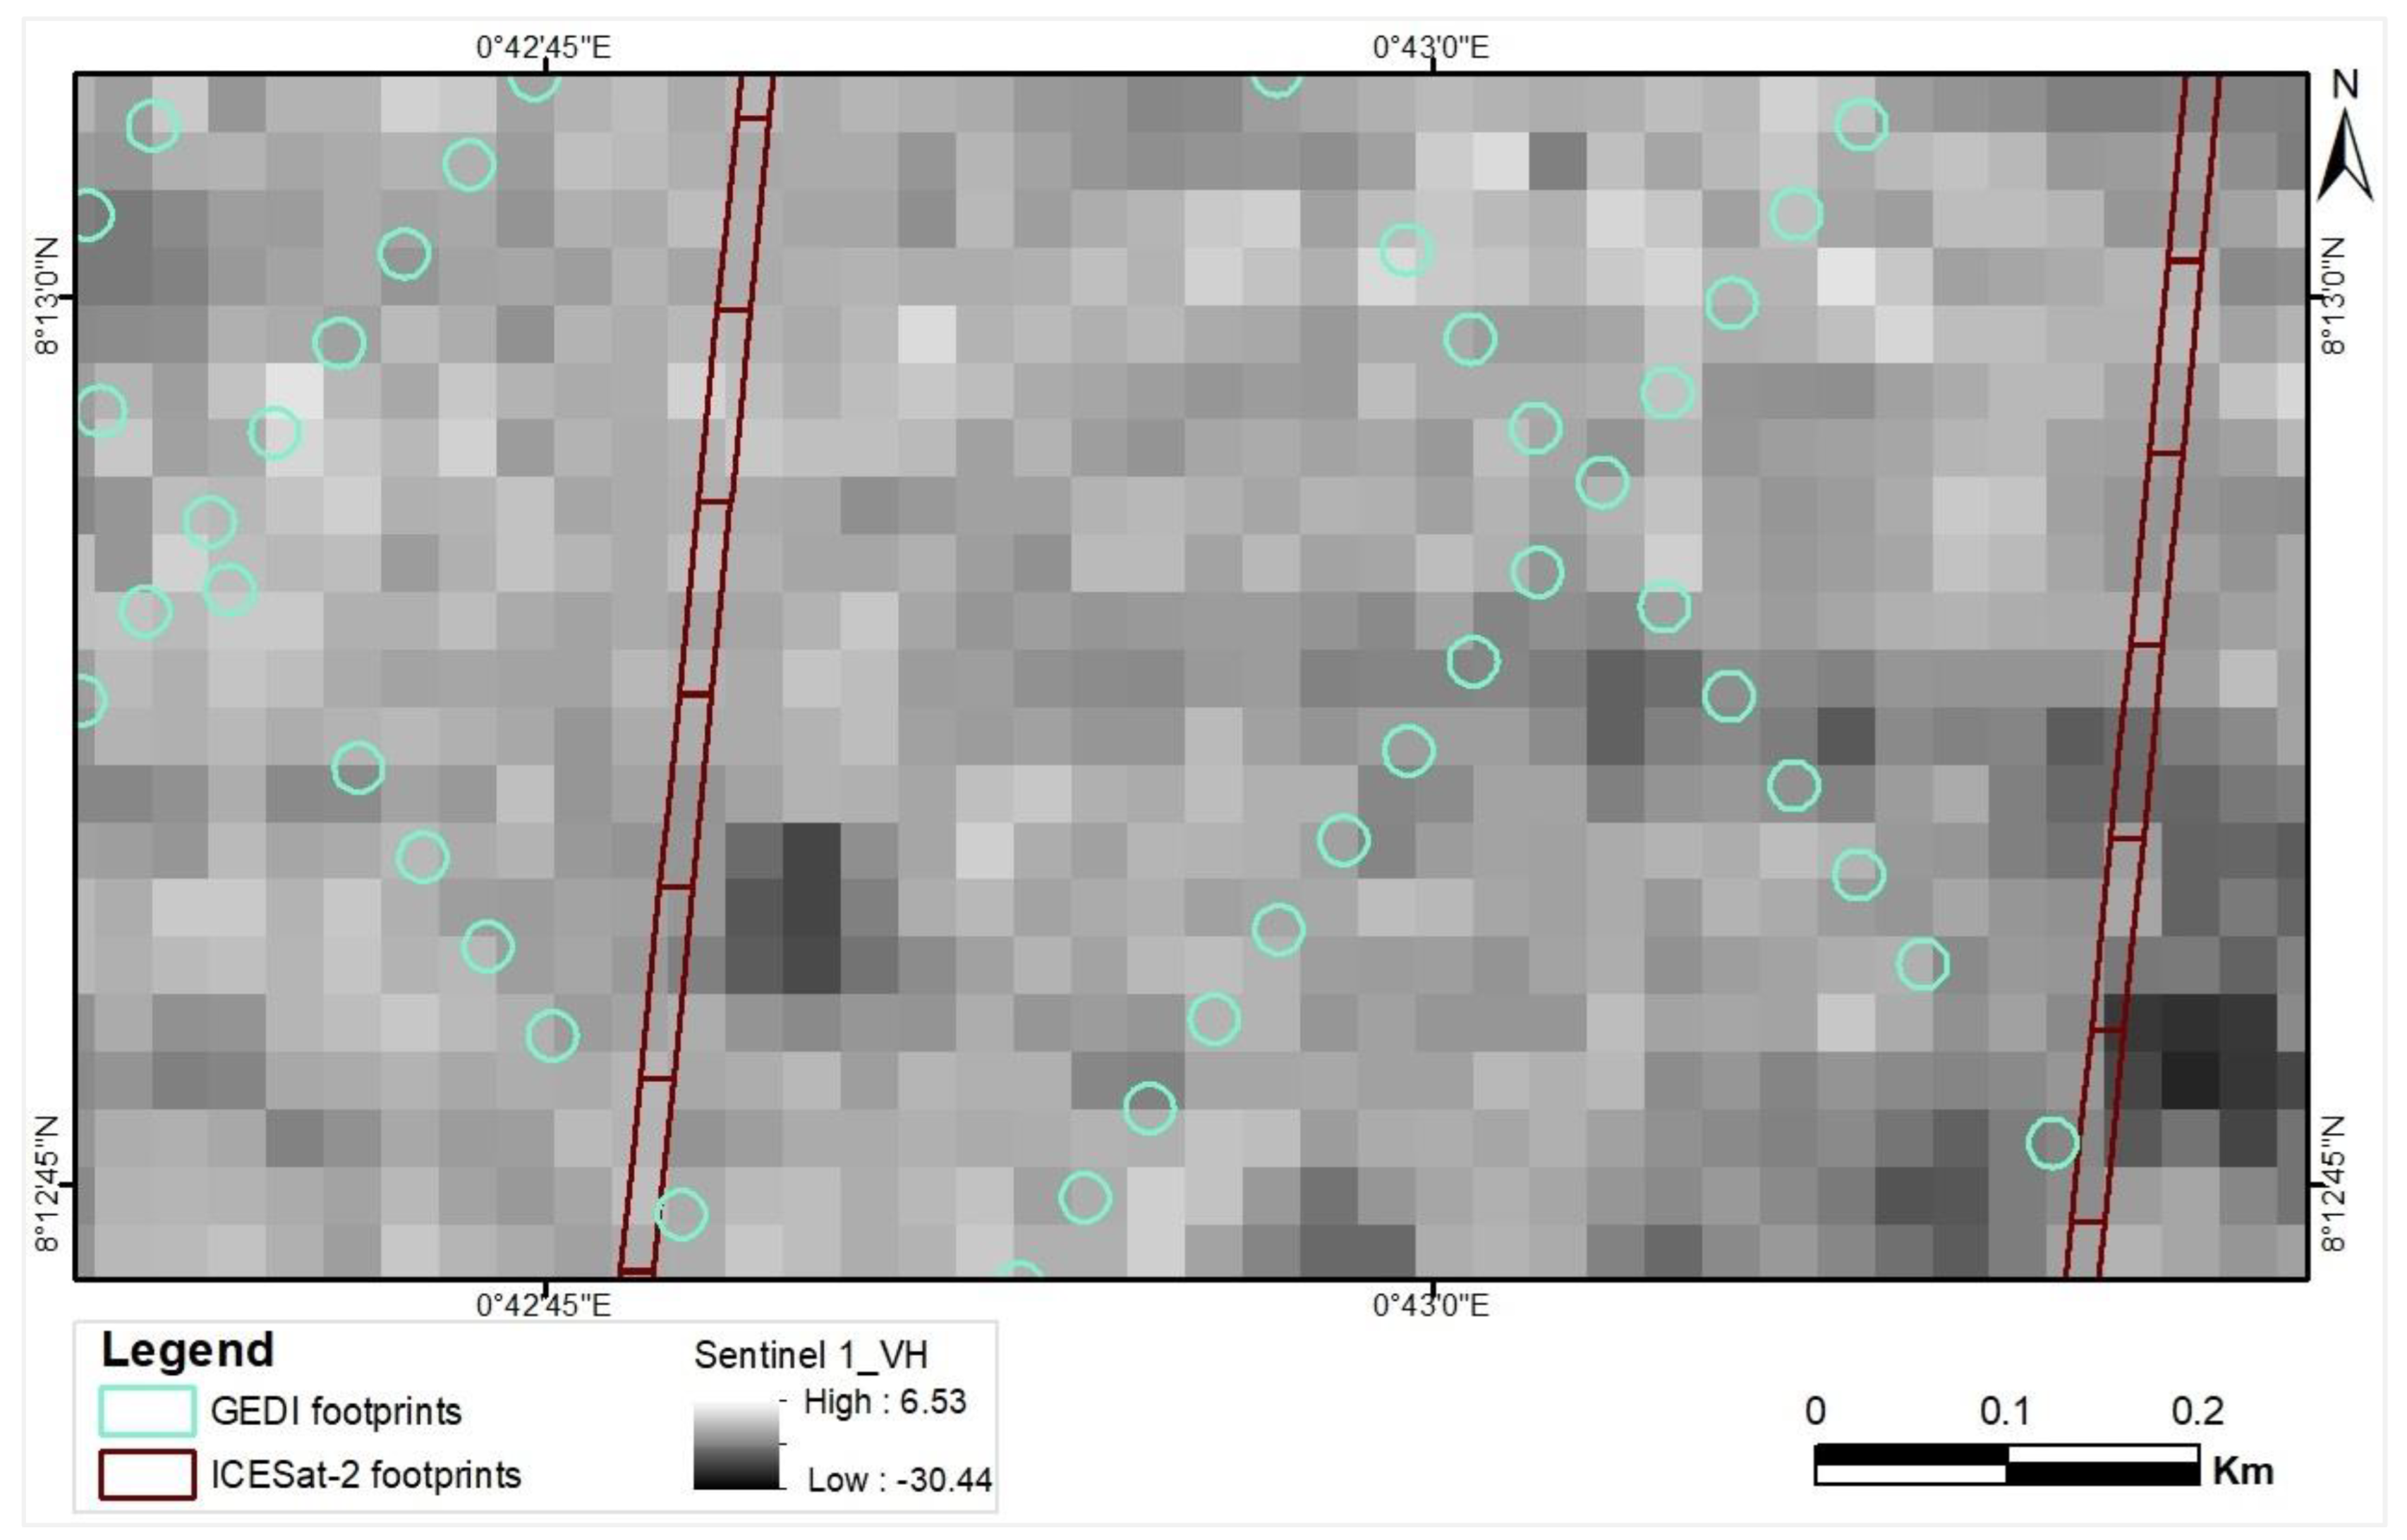
Figure 4.
Illustration of the overlay of GEDI and ICESat-2 data onto the VH band from Sentinel 1 to calculate zonal statistics.
Figure 4.
Illustration of the overlay of GEDI and ICESat-2 data onto the VH band from Sentinel 1 to calculate zonal statistics.
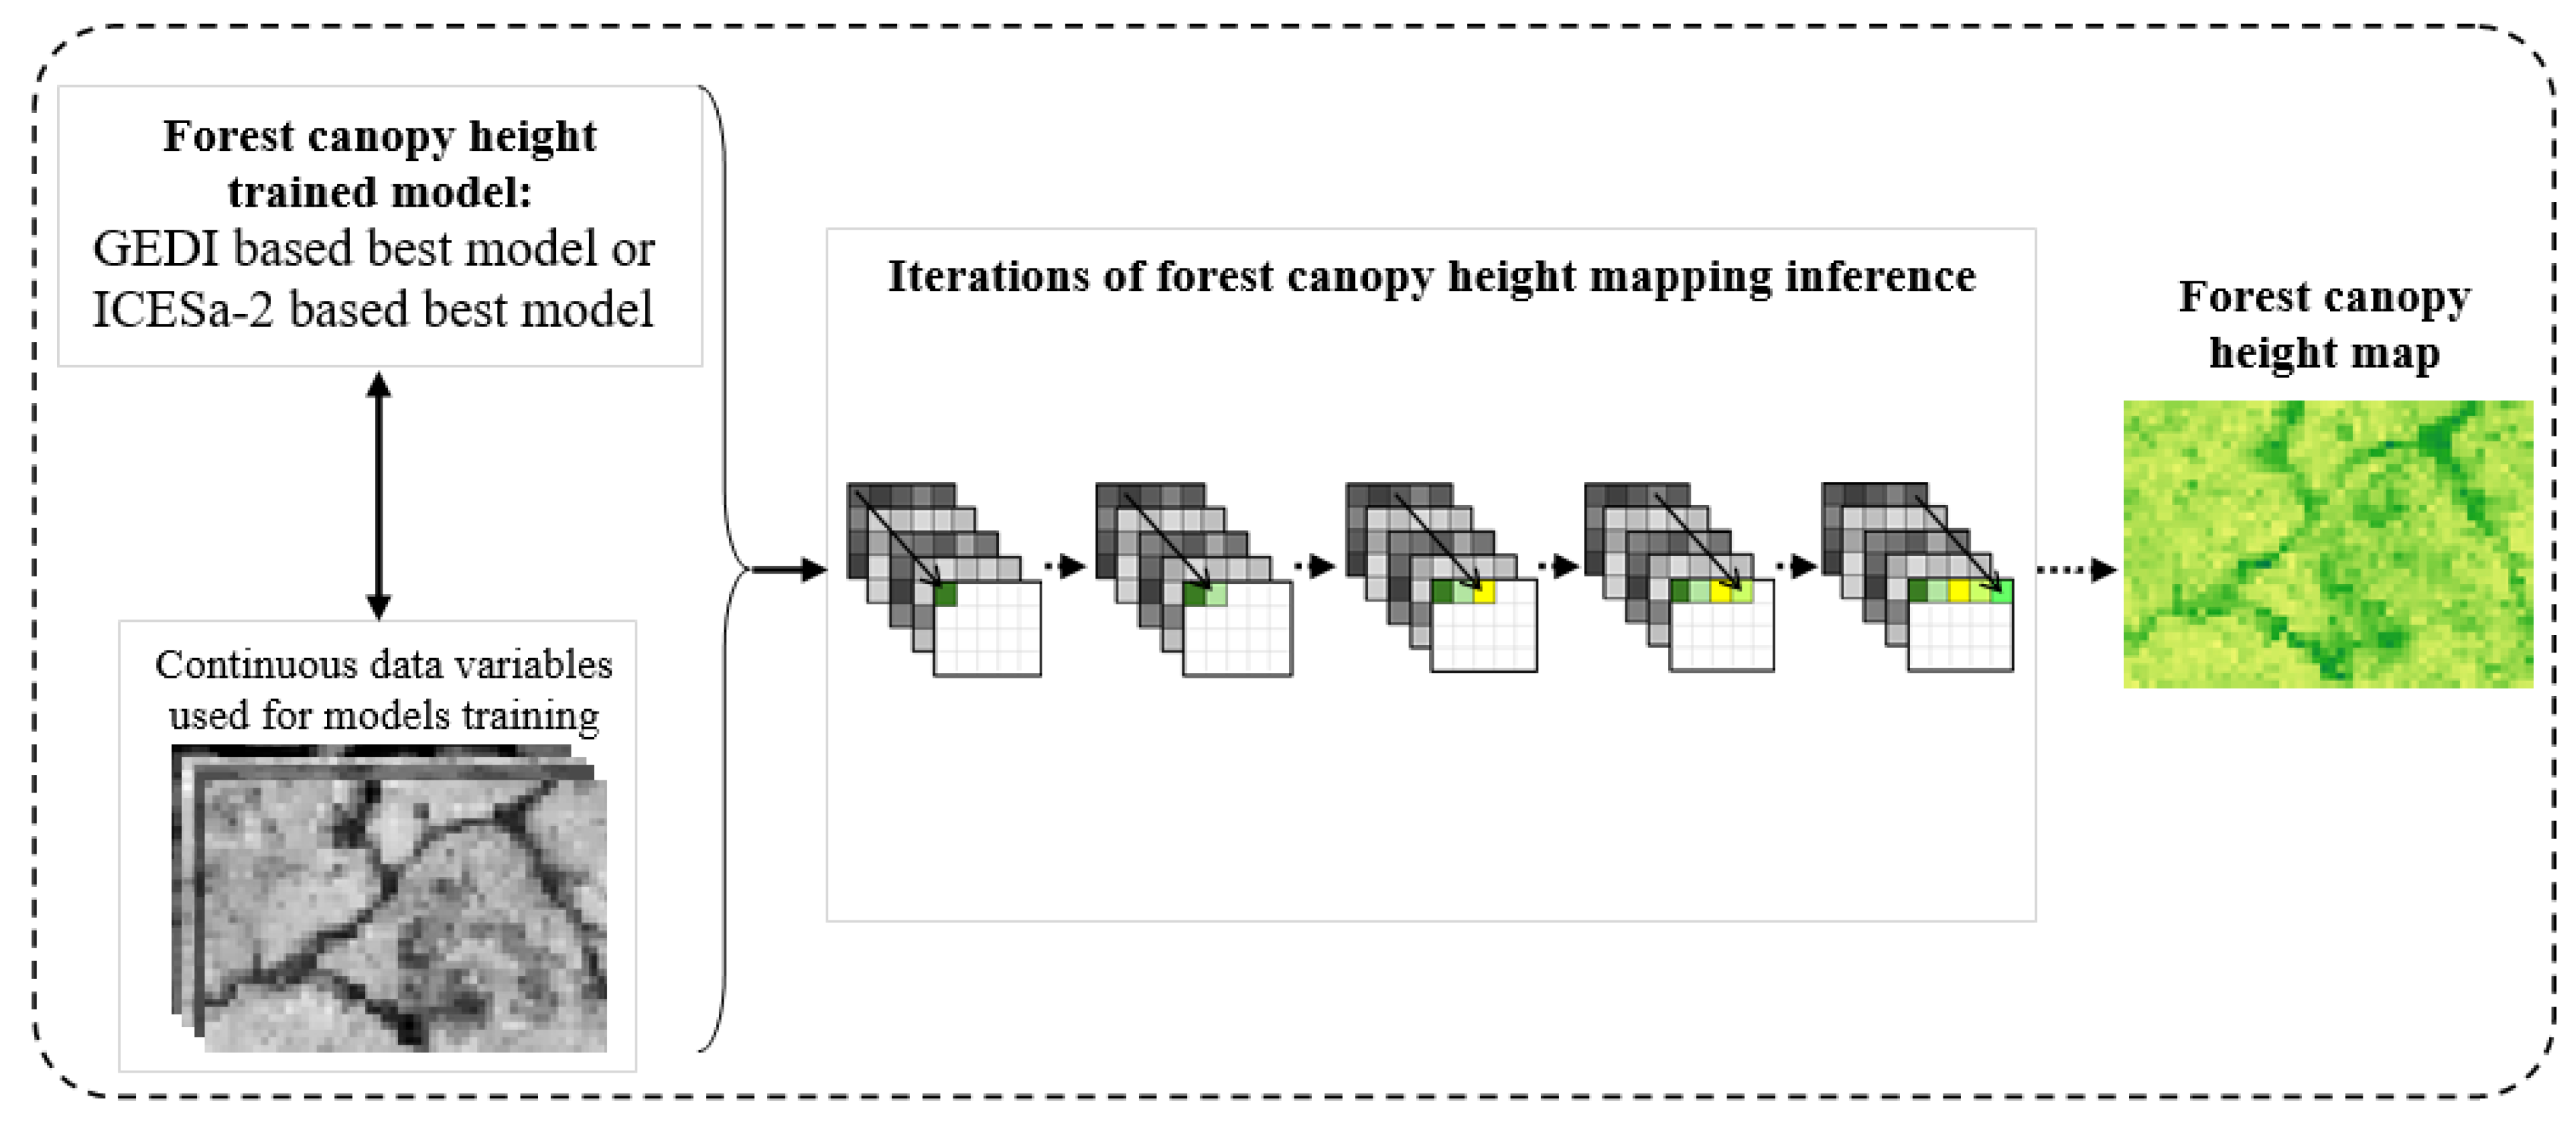
Figure 5.
Illustration of map inference from GEDI- or ICESat-2-based models.
Figure 5.
Illustration of map inference from GEDI- or ICESat-2-based models.
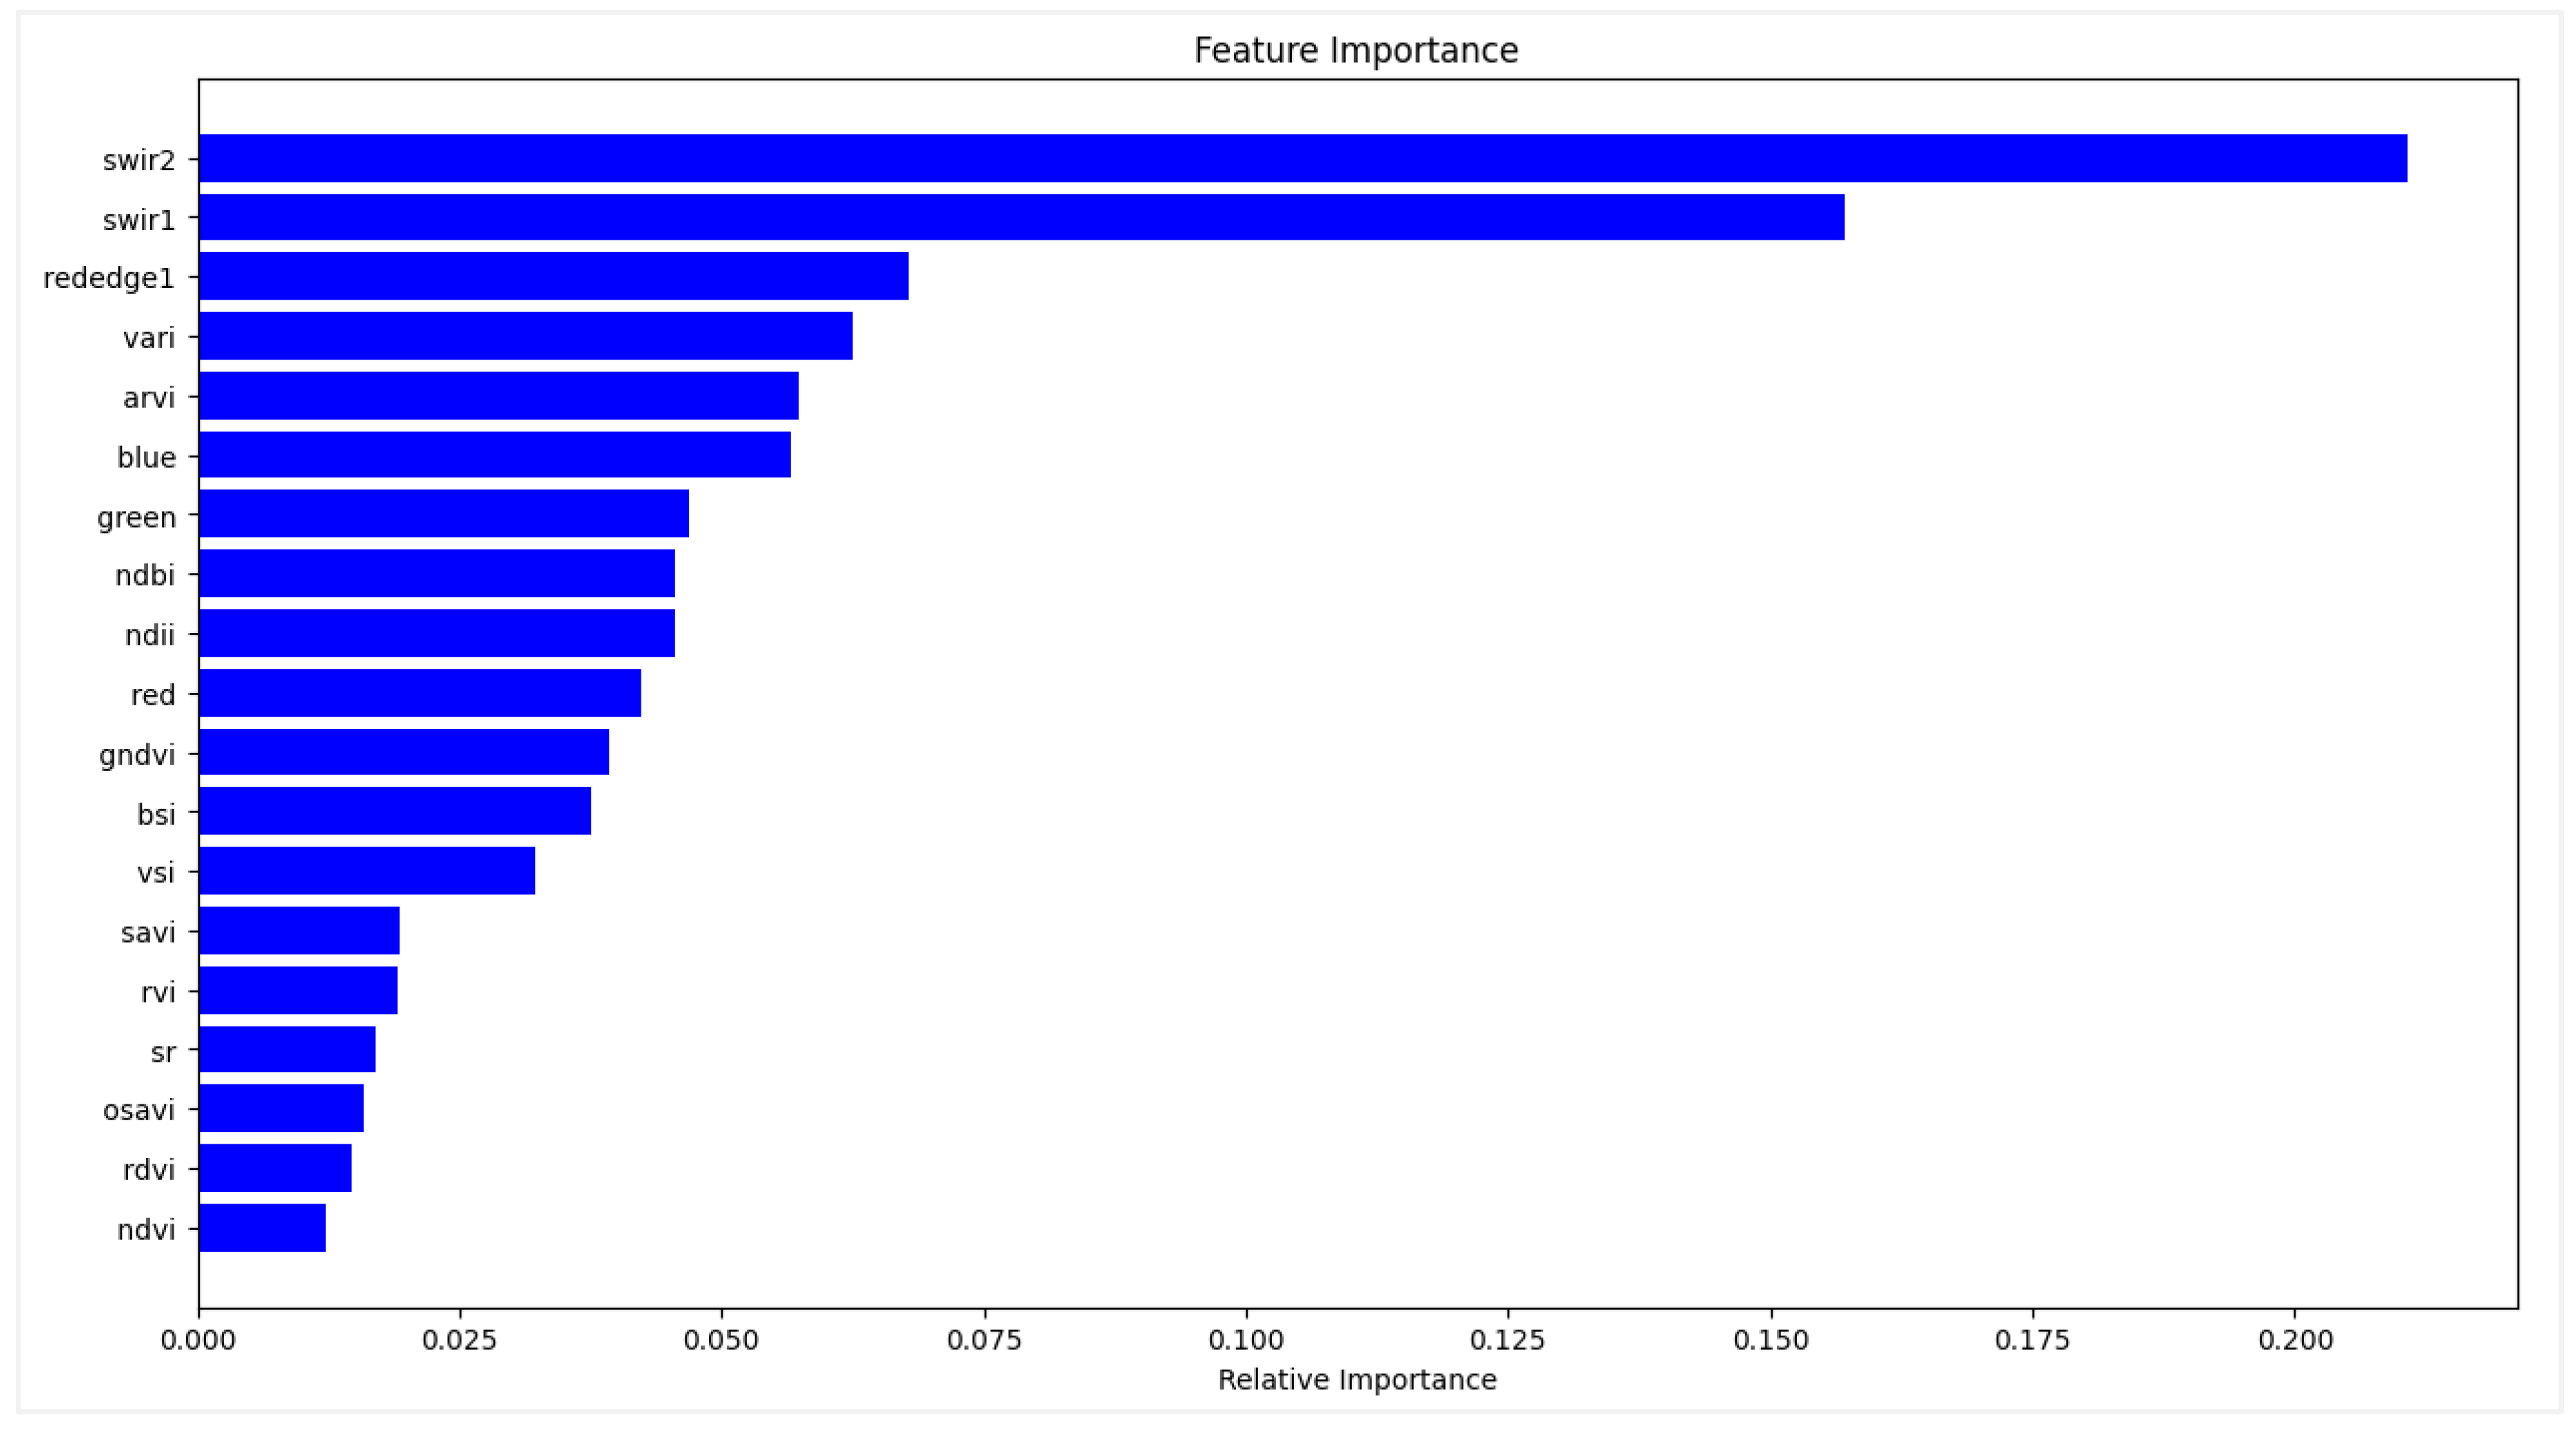
Figure 6.
Importance of variables with the RF module.
Figure 6.
Importance of variables with the RF module.
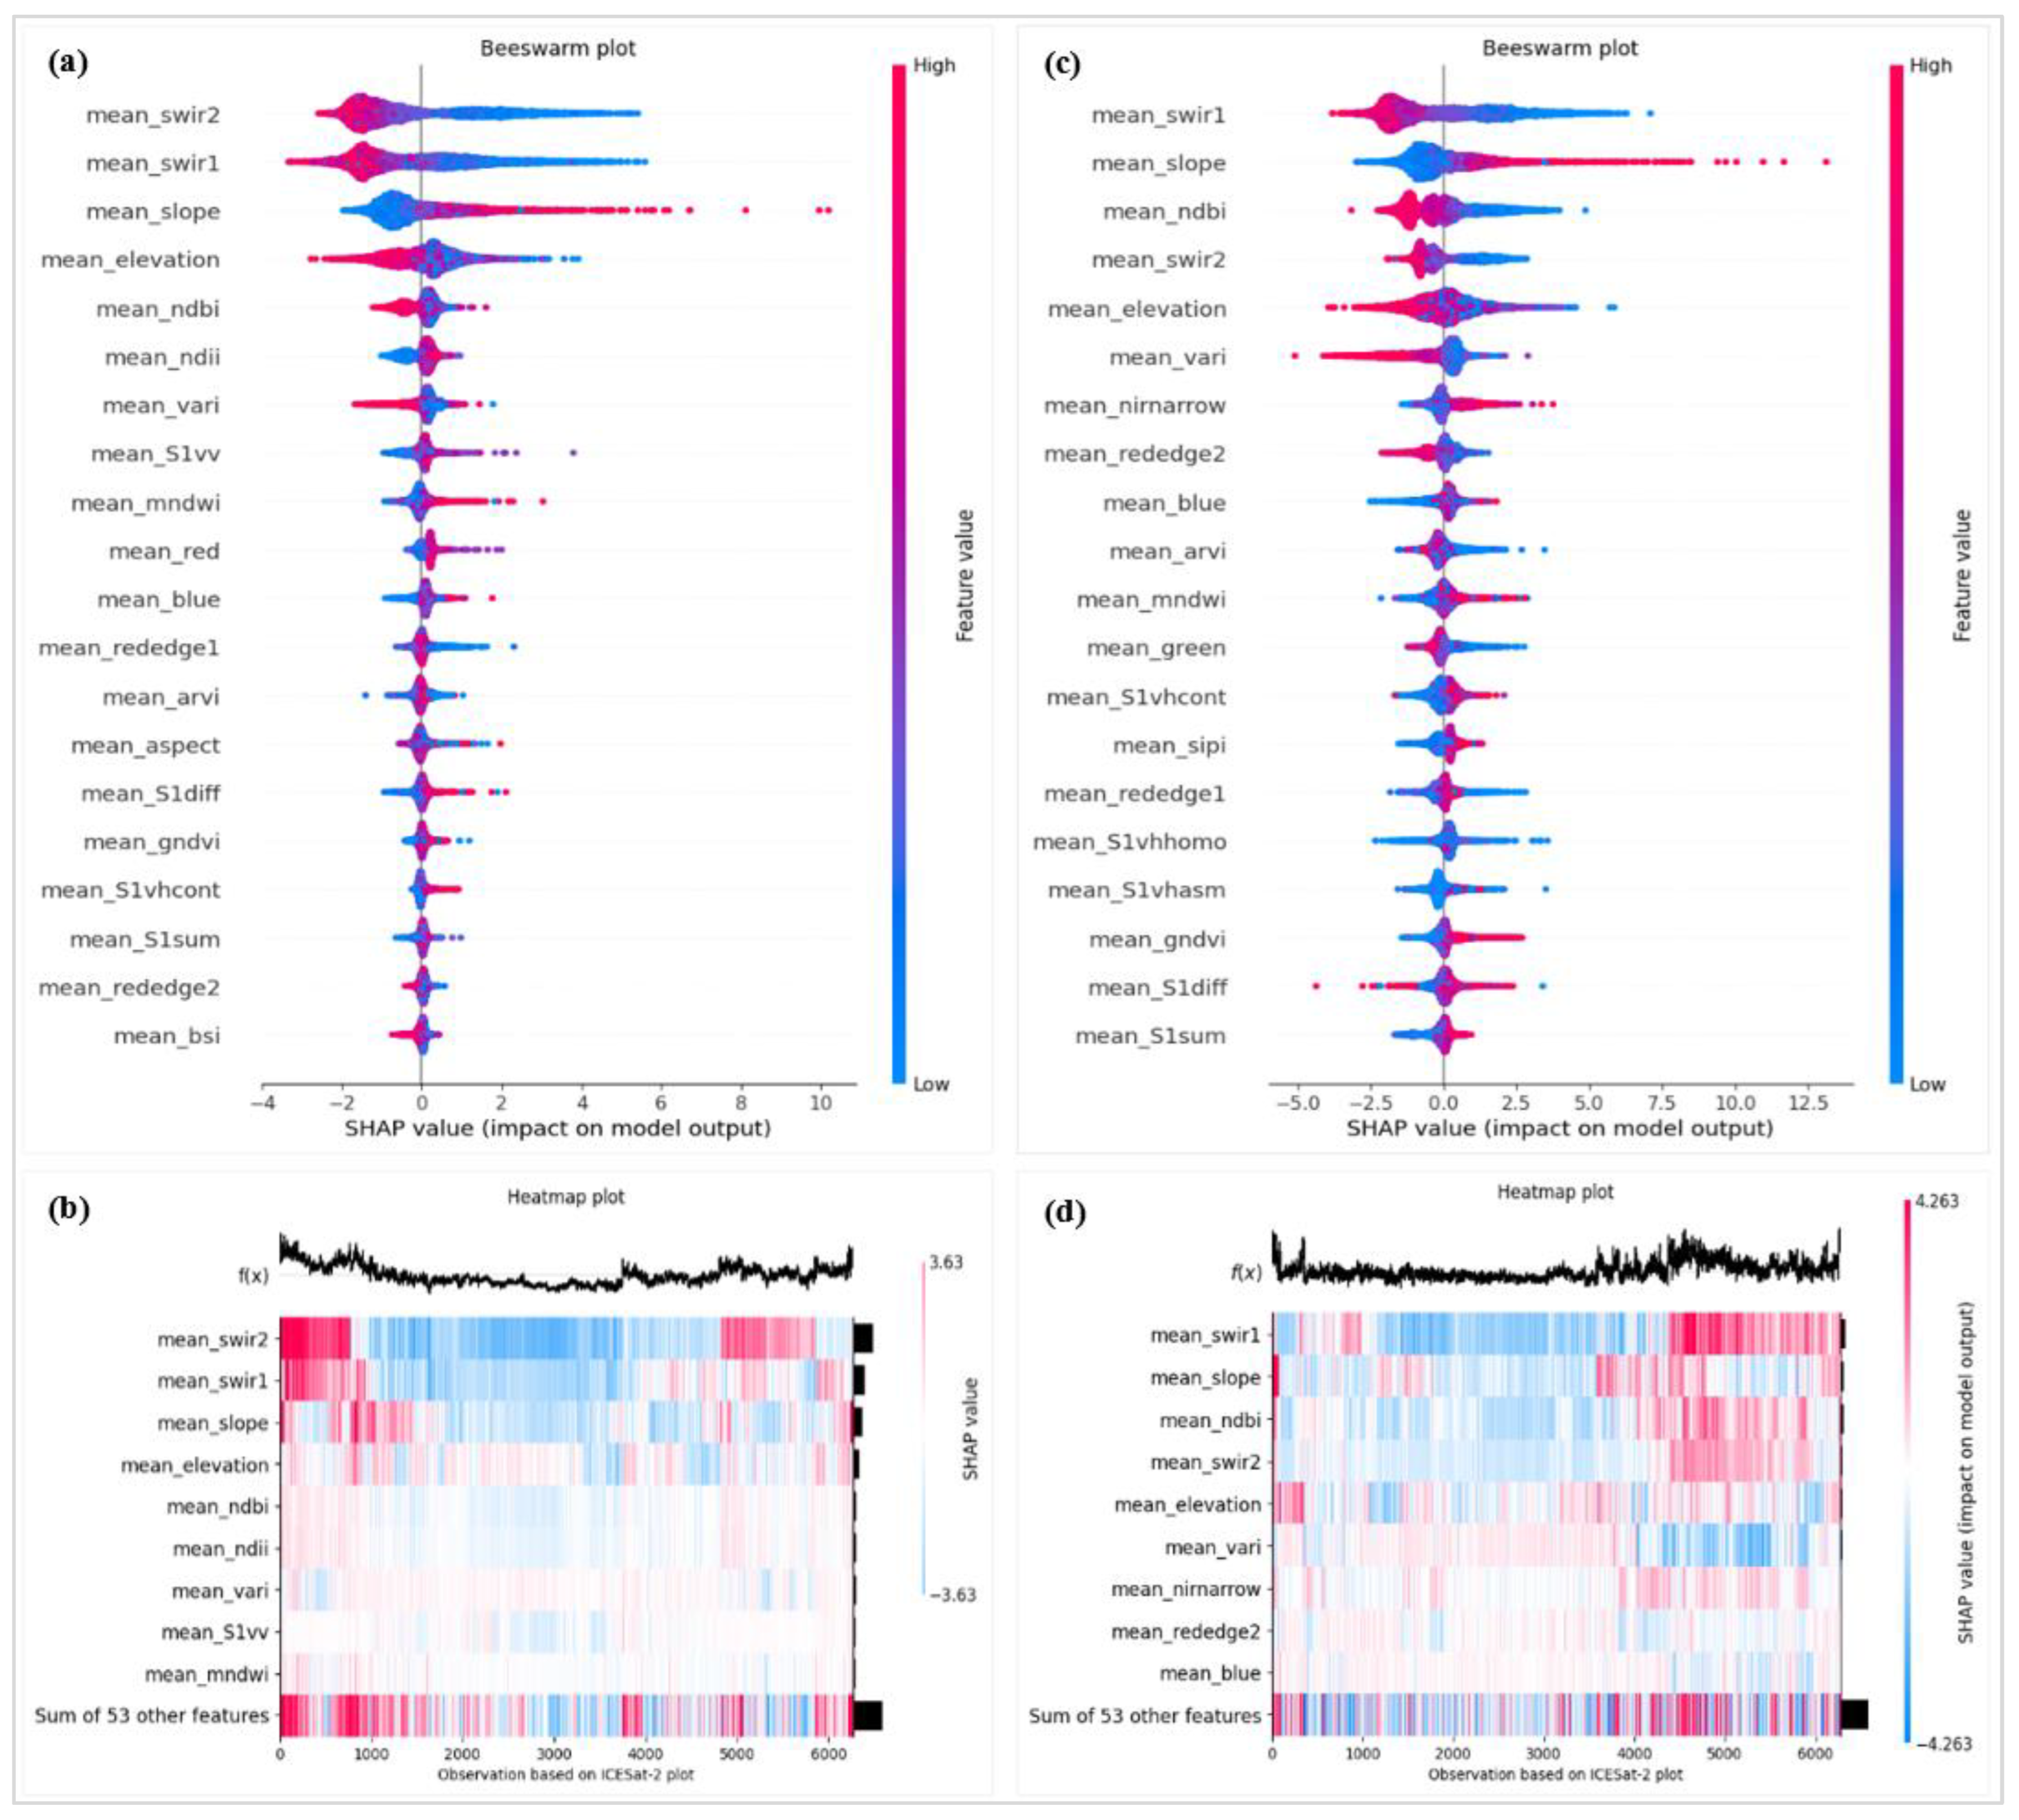
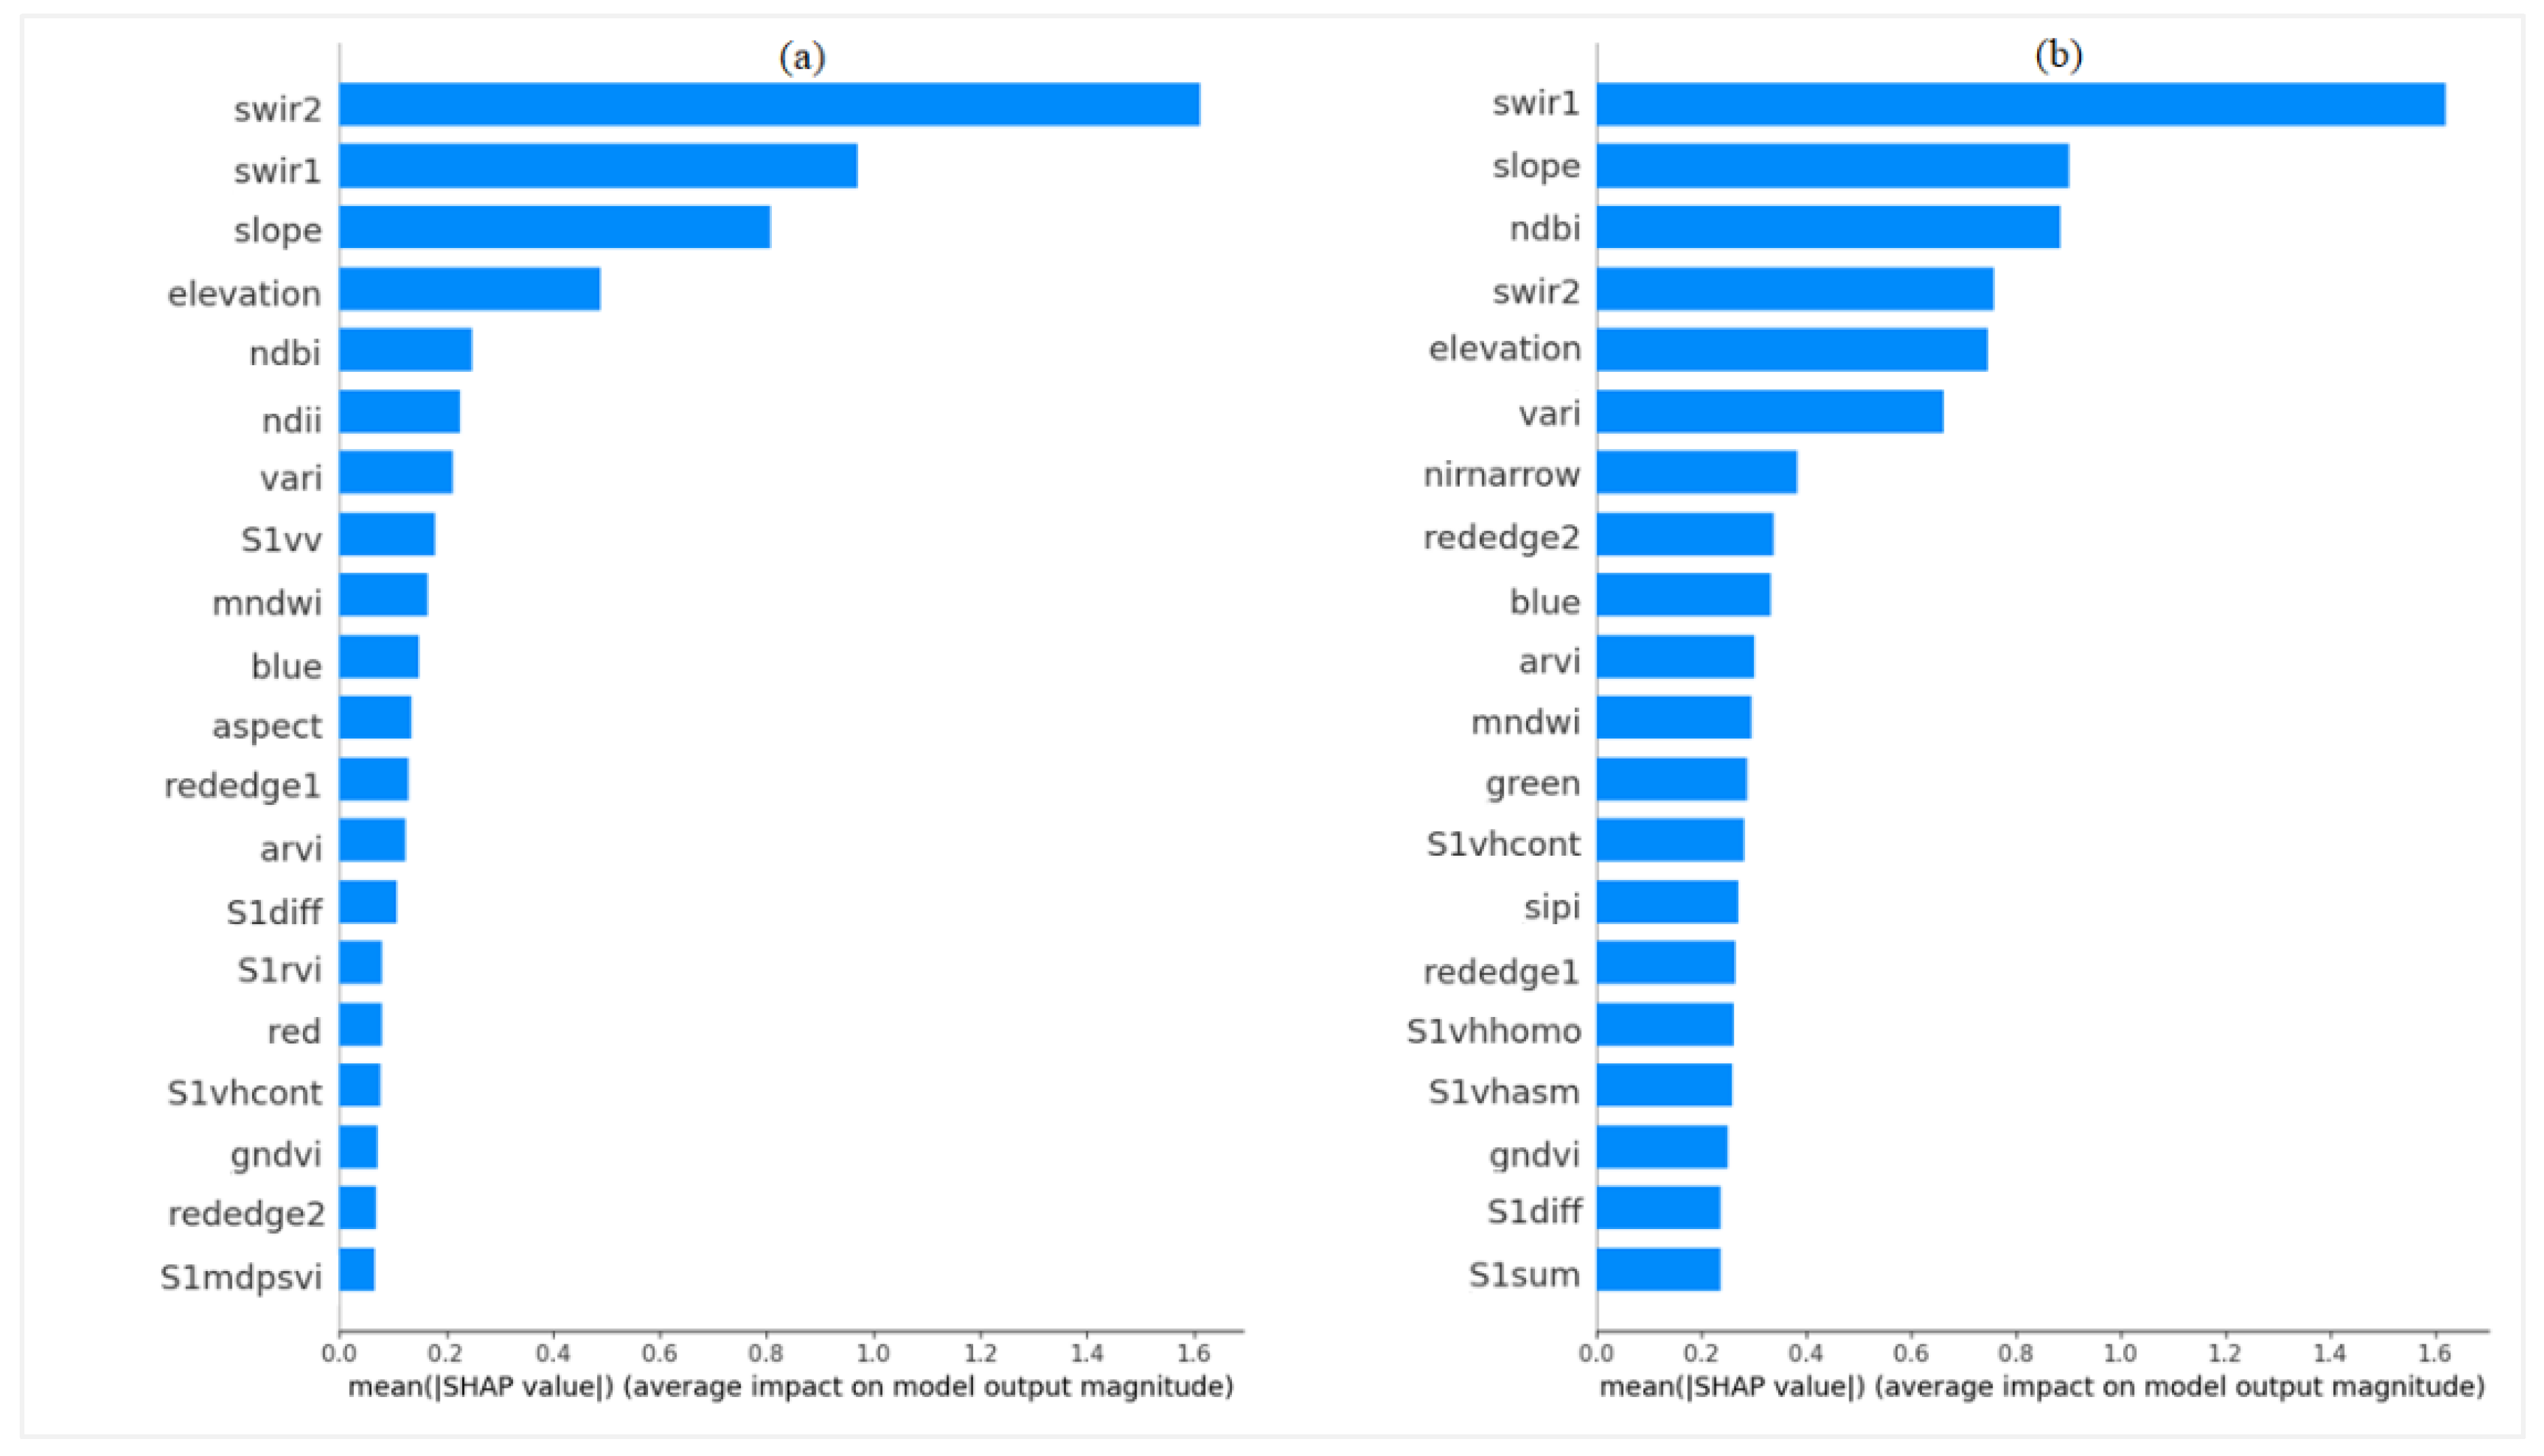
Figure 7.
Importance of features evaluated with SHAP with respect to height prediction with RF (a) and XGBoost (b) algorithms. Variable abbreviations are defined in
Table 2 (
Section 2.4).
Figure 7.
Importance of features evaluated with SHAP with respect to height prediction with RF (a) and XGBoost (b) algorithms. Variable abbreviations are defined in
Table 2 (
Section 2.4).
Figure 8.
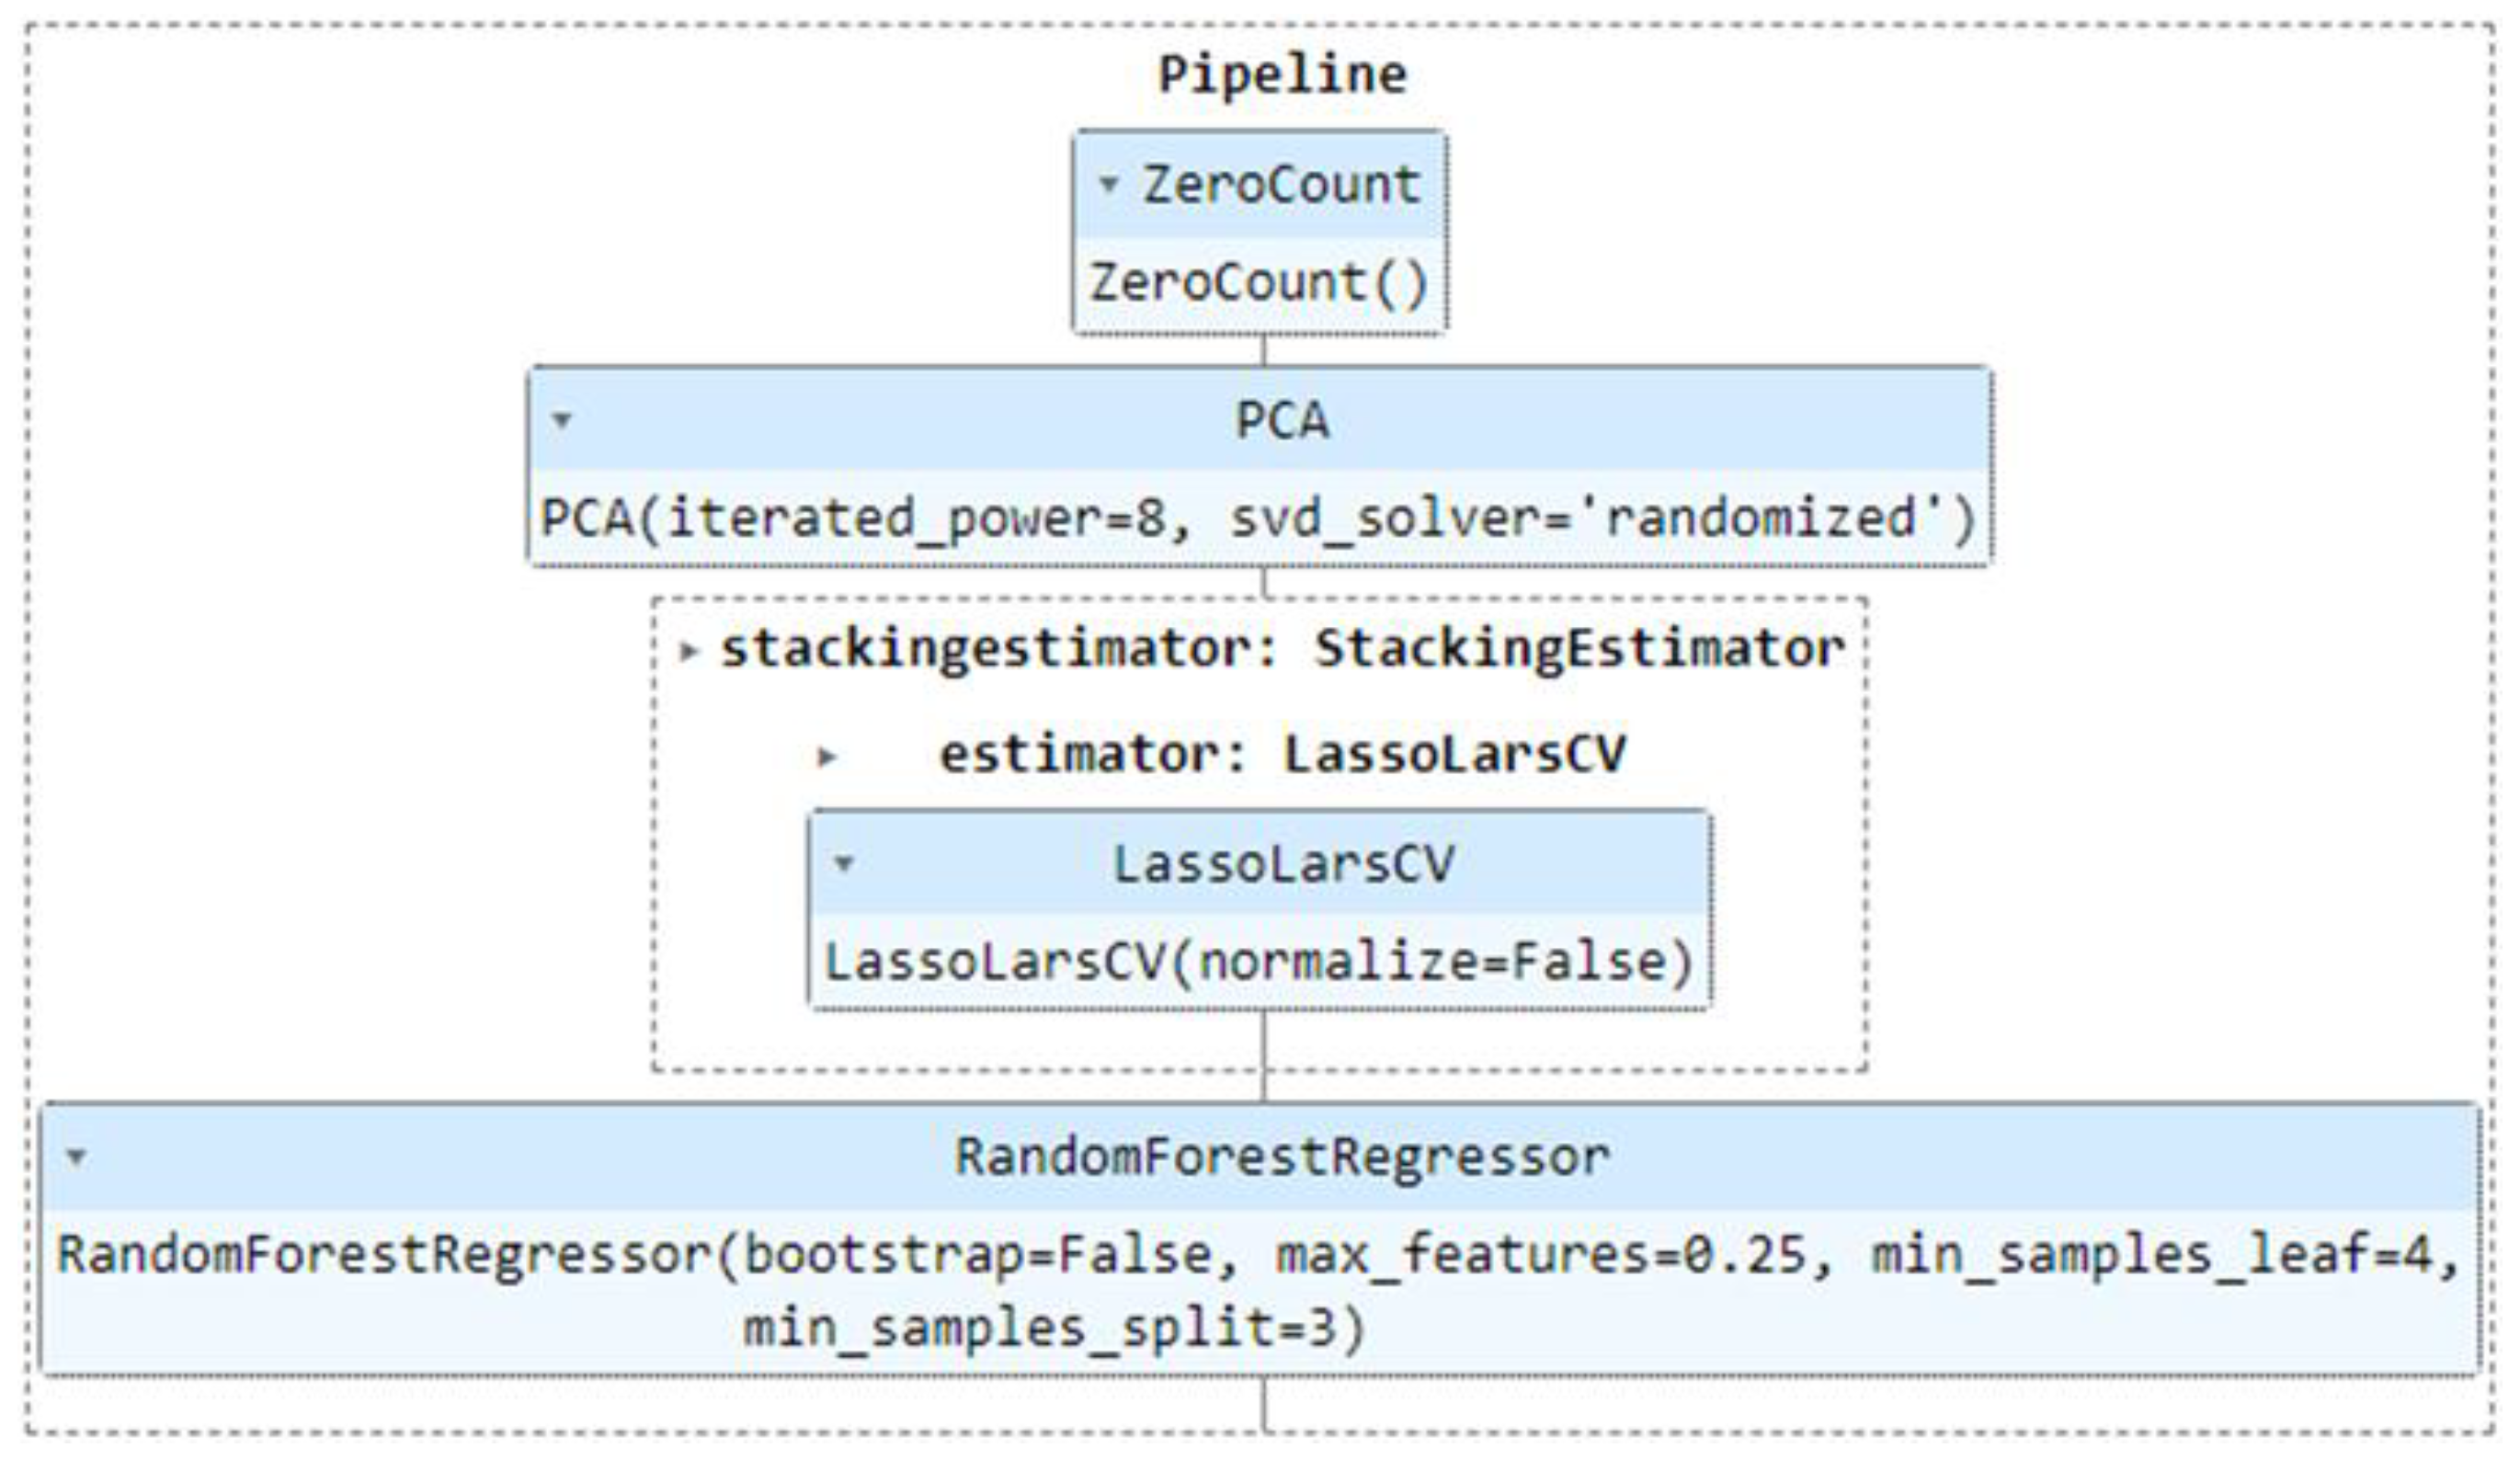
Processing chain for the choice of the prediction model with ICESat-2 data.
Figure 8.
Processing chain for the choice of the prediction model with ICESat-2 data.
Figure 9.
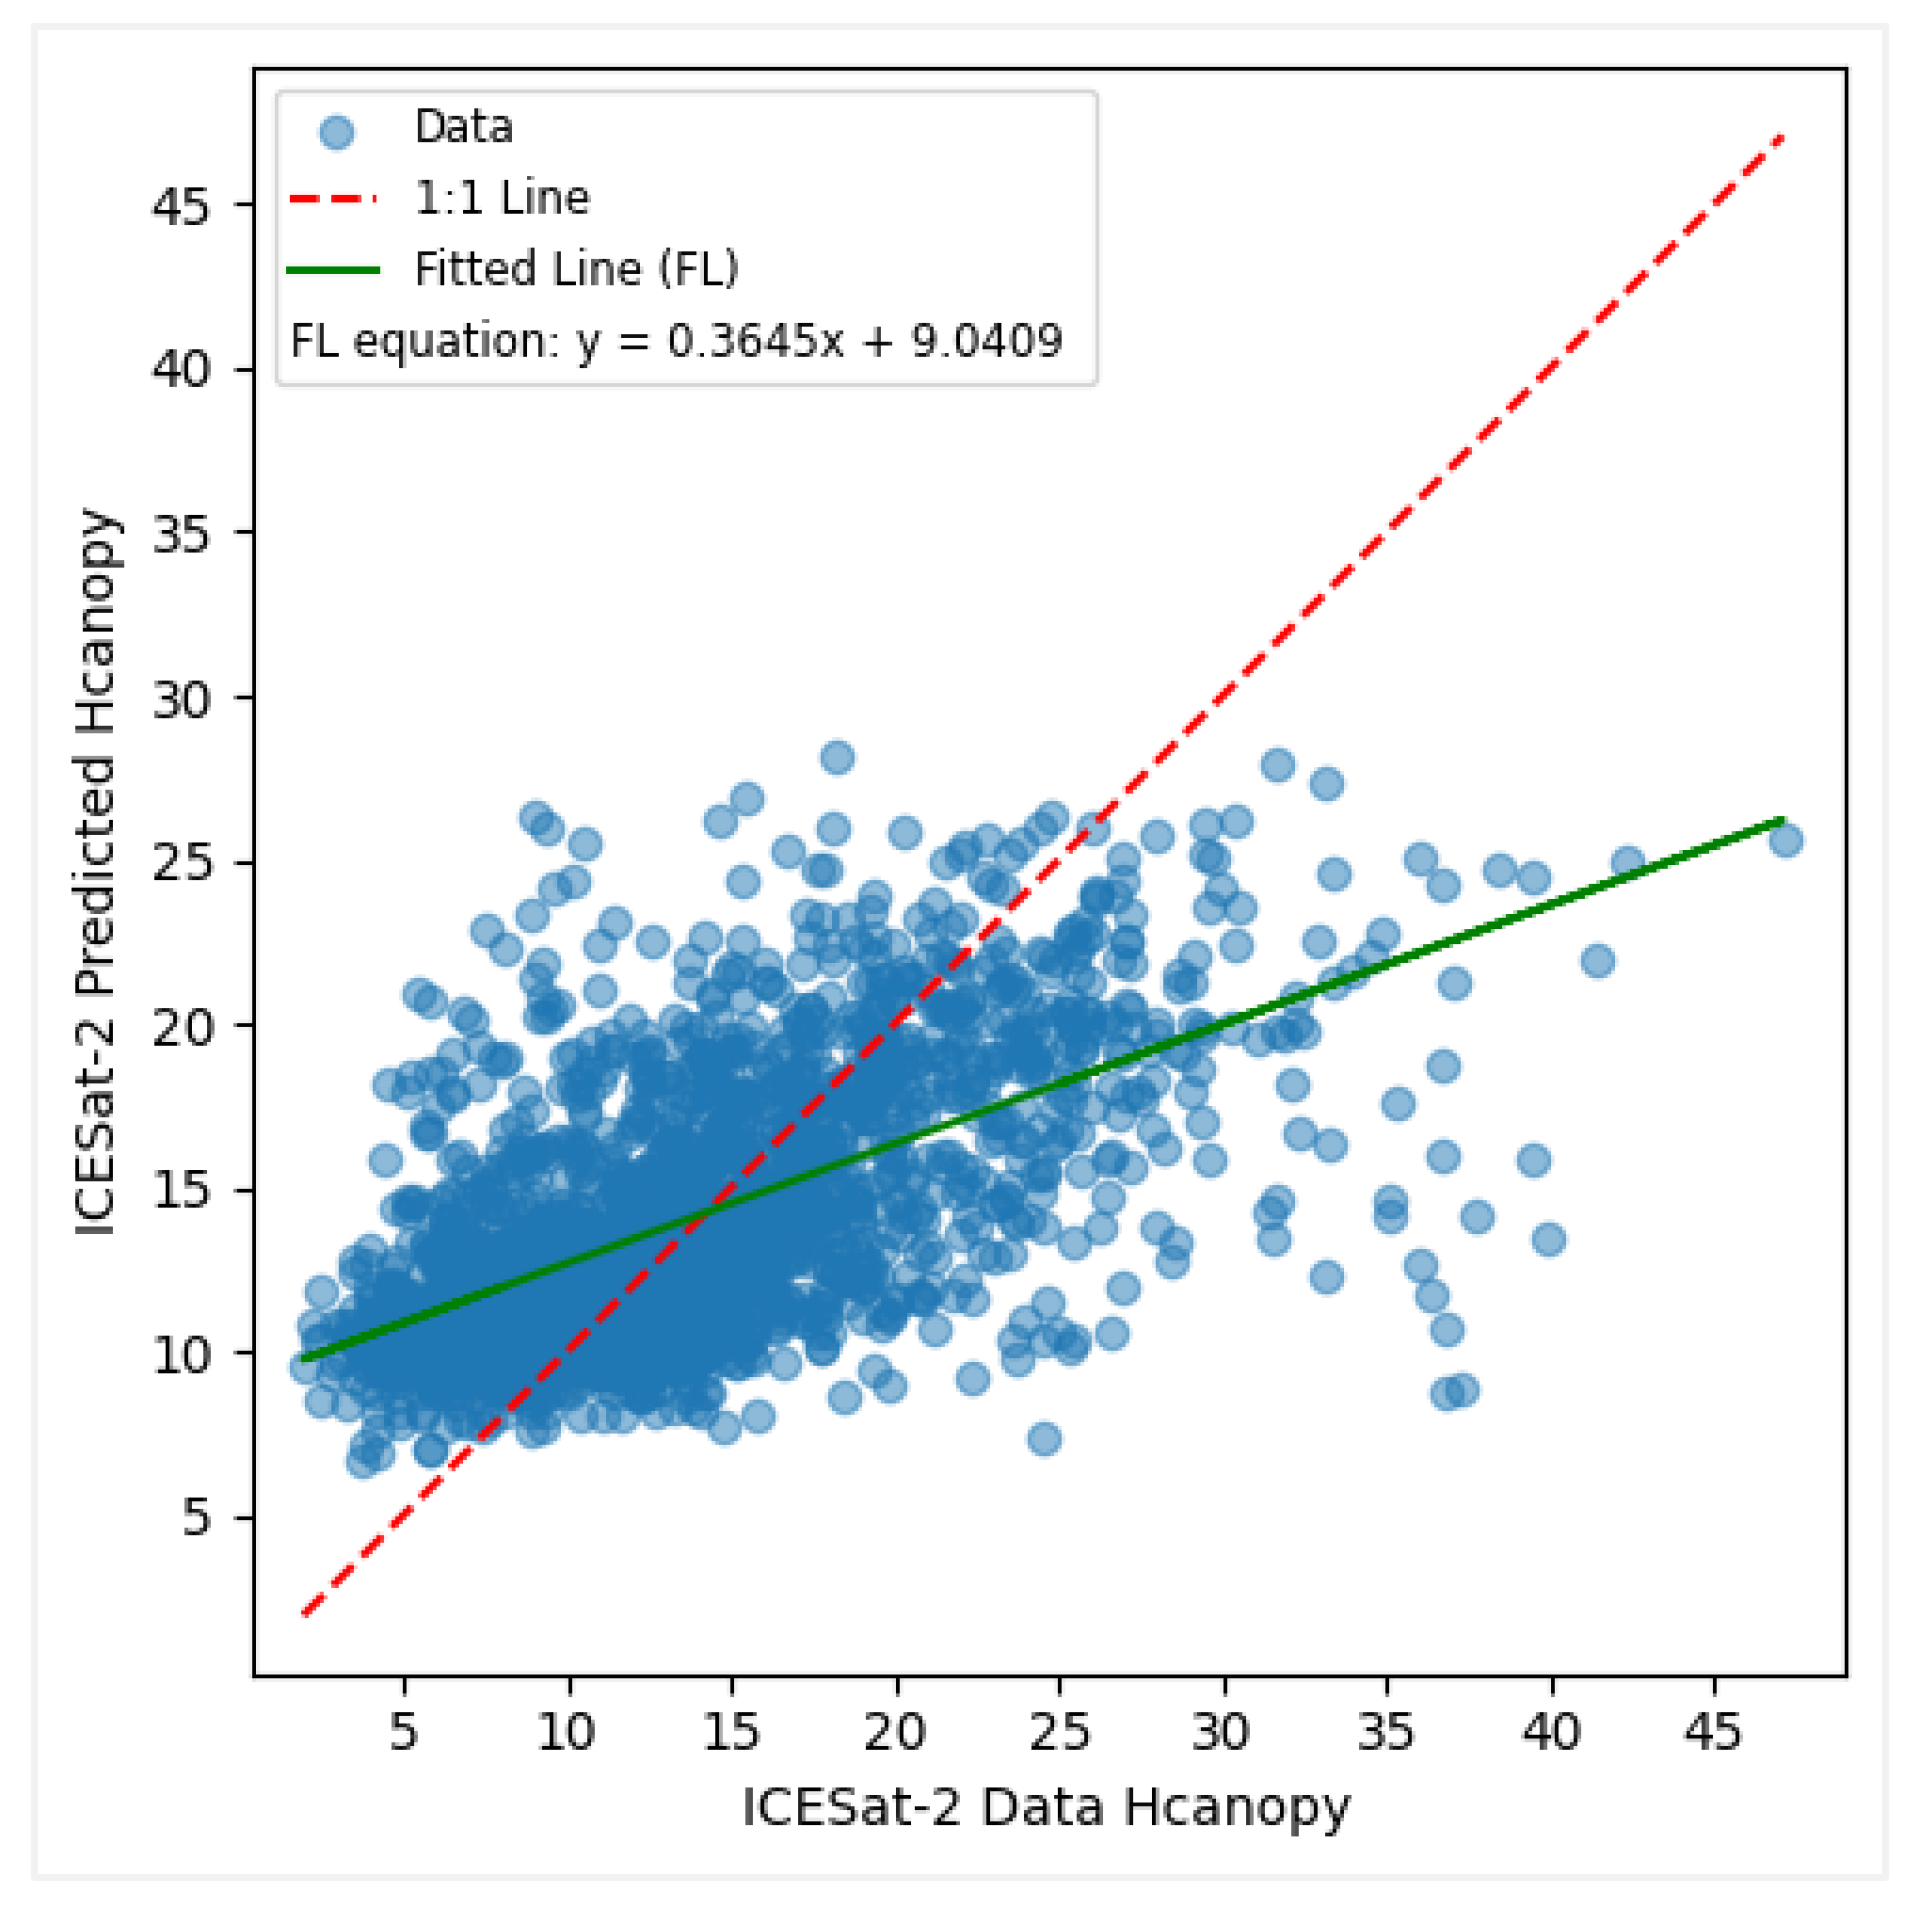
Predicted vs observed values when modelling canopy height with ICESat-2 data.
Figure 9.
Predicted vs observed values when modelling canopy height with ICESat-2 data.
Figure 10.
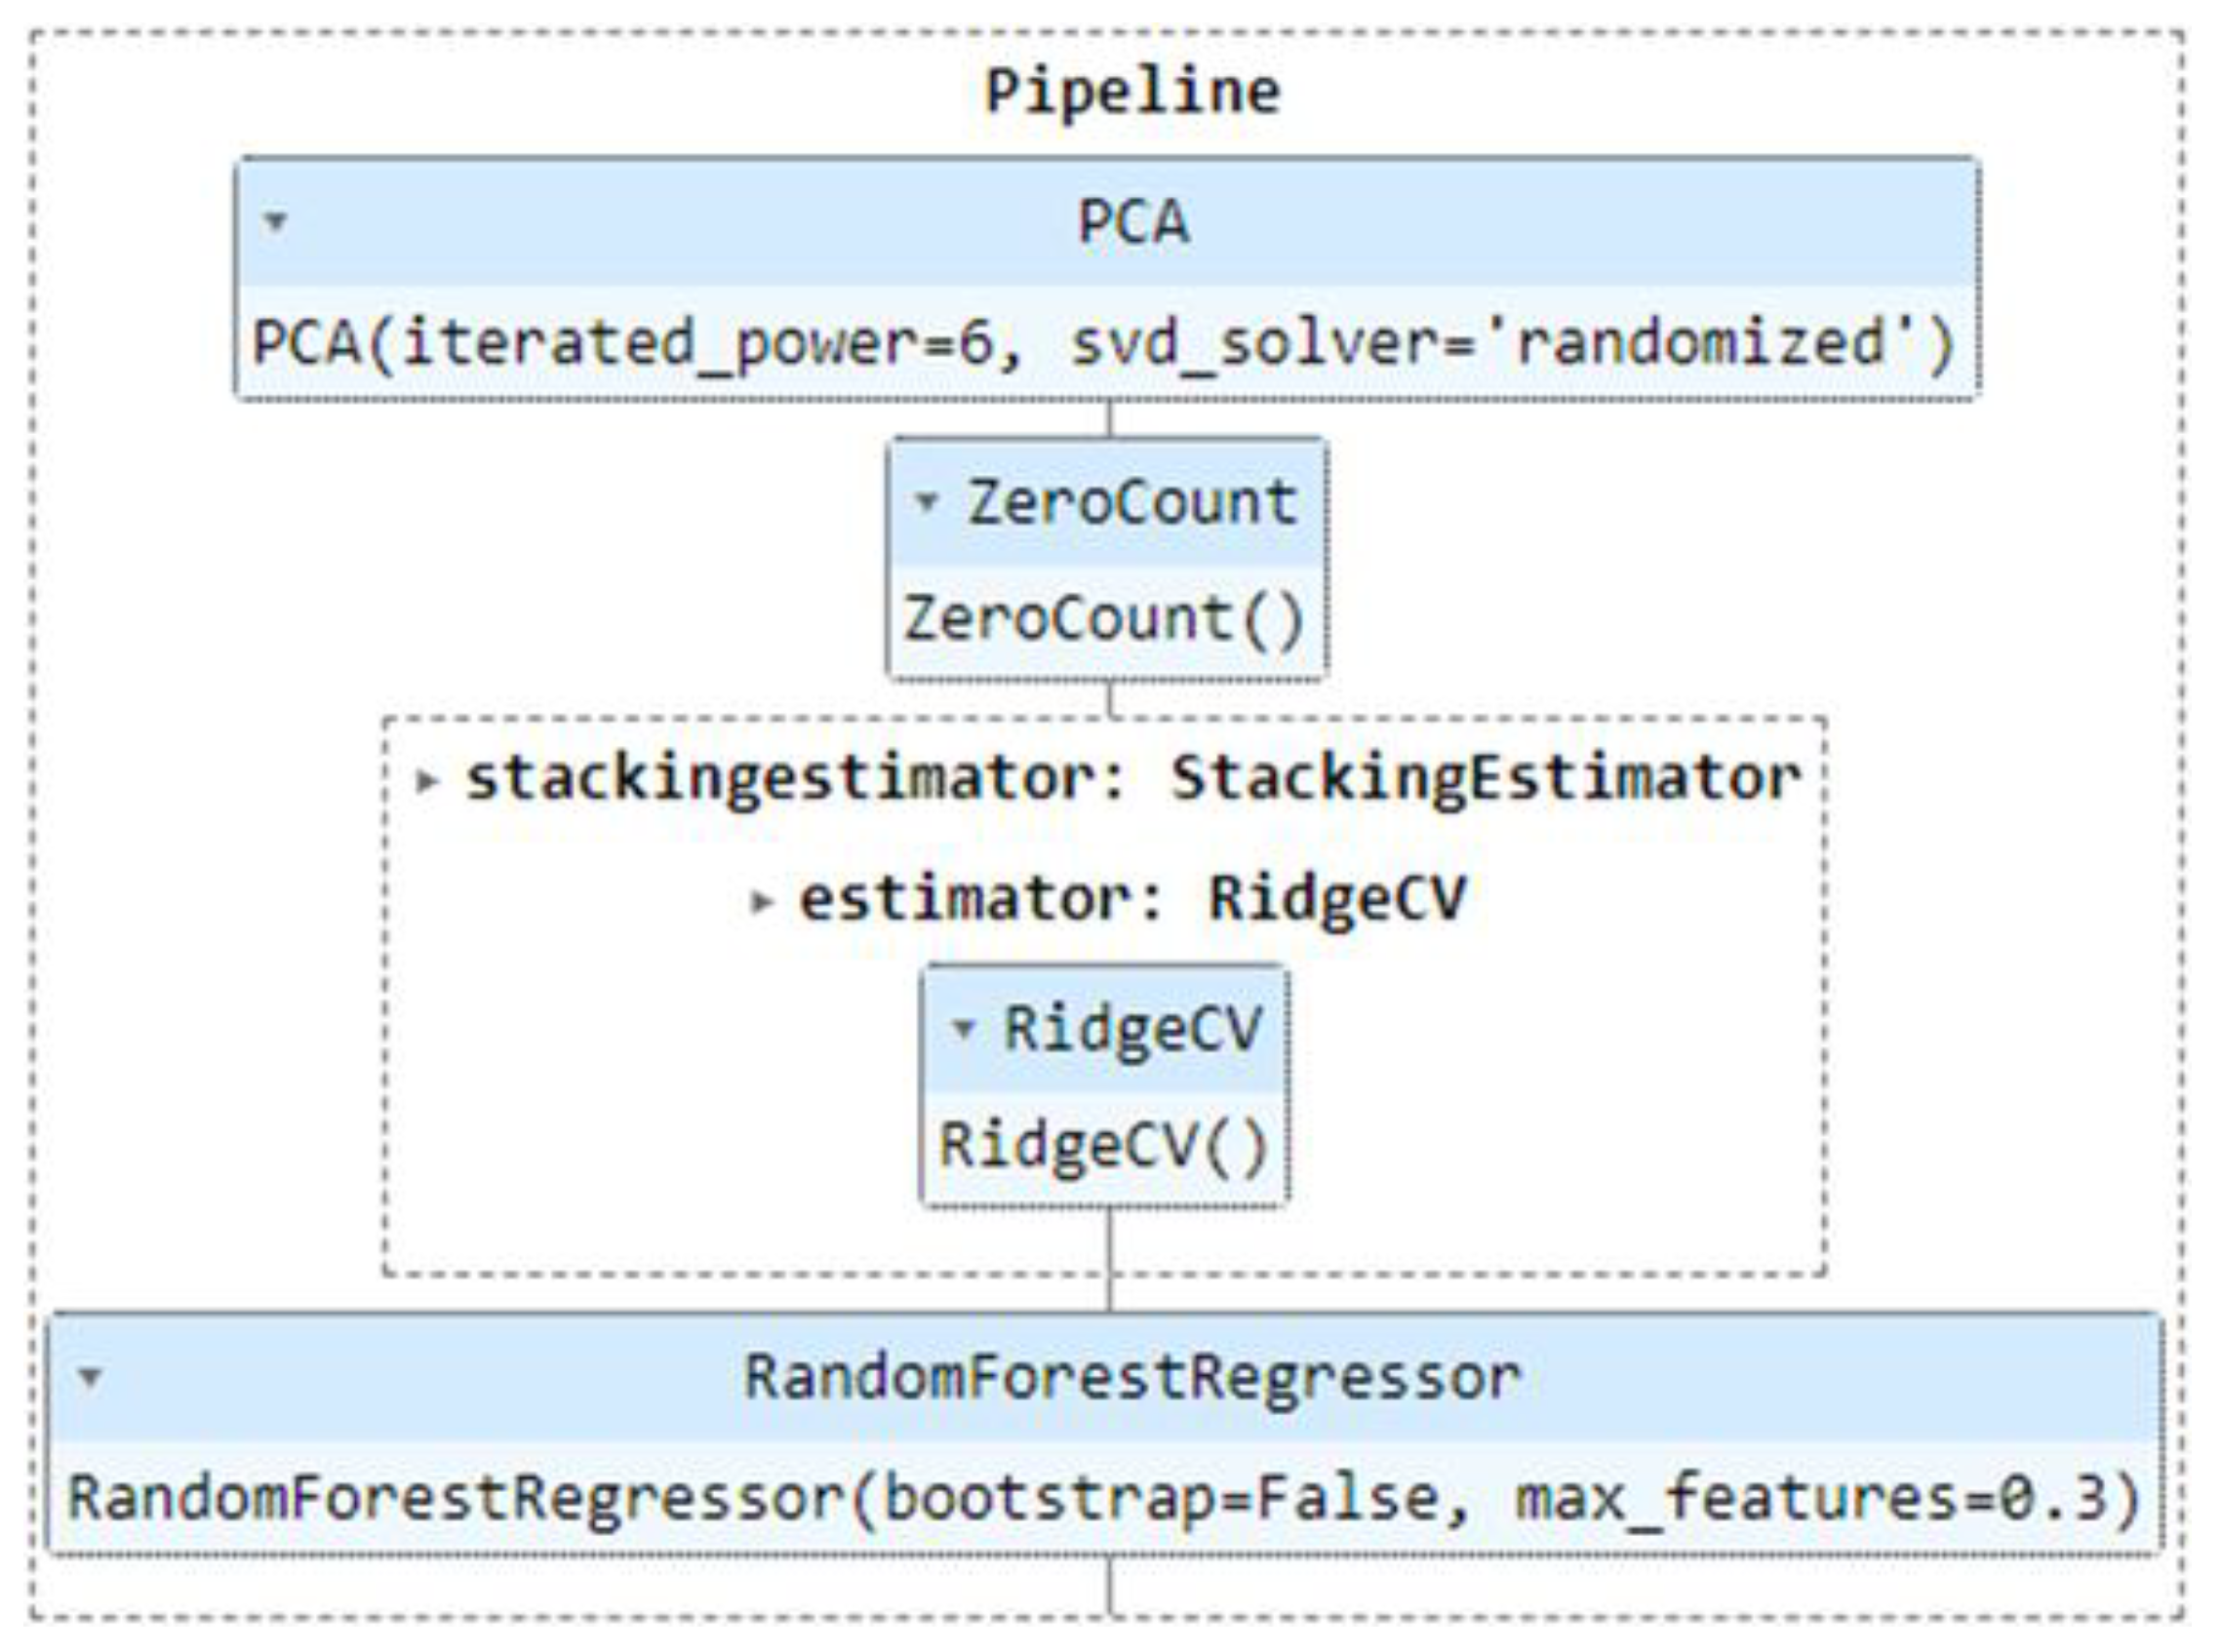
Processing chain for the best prediction model with GEDI data.
Figure 10.
Processing chain for the best prediction model with GEDI data.
Figure 11.
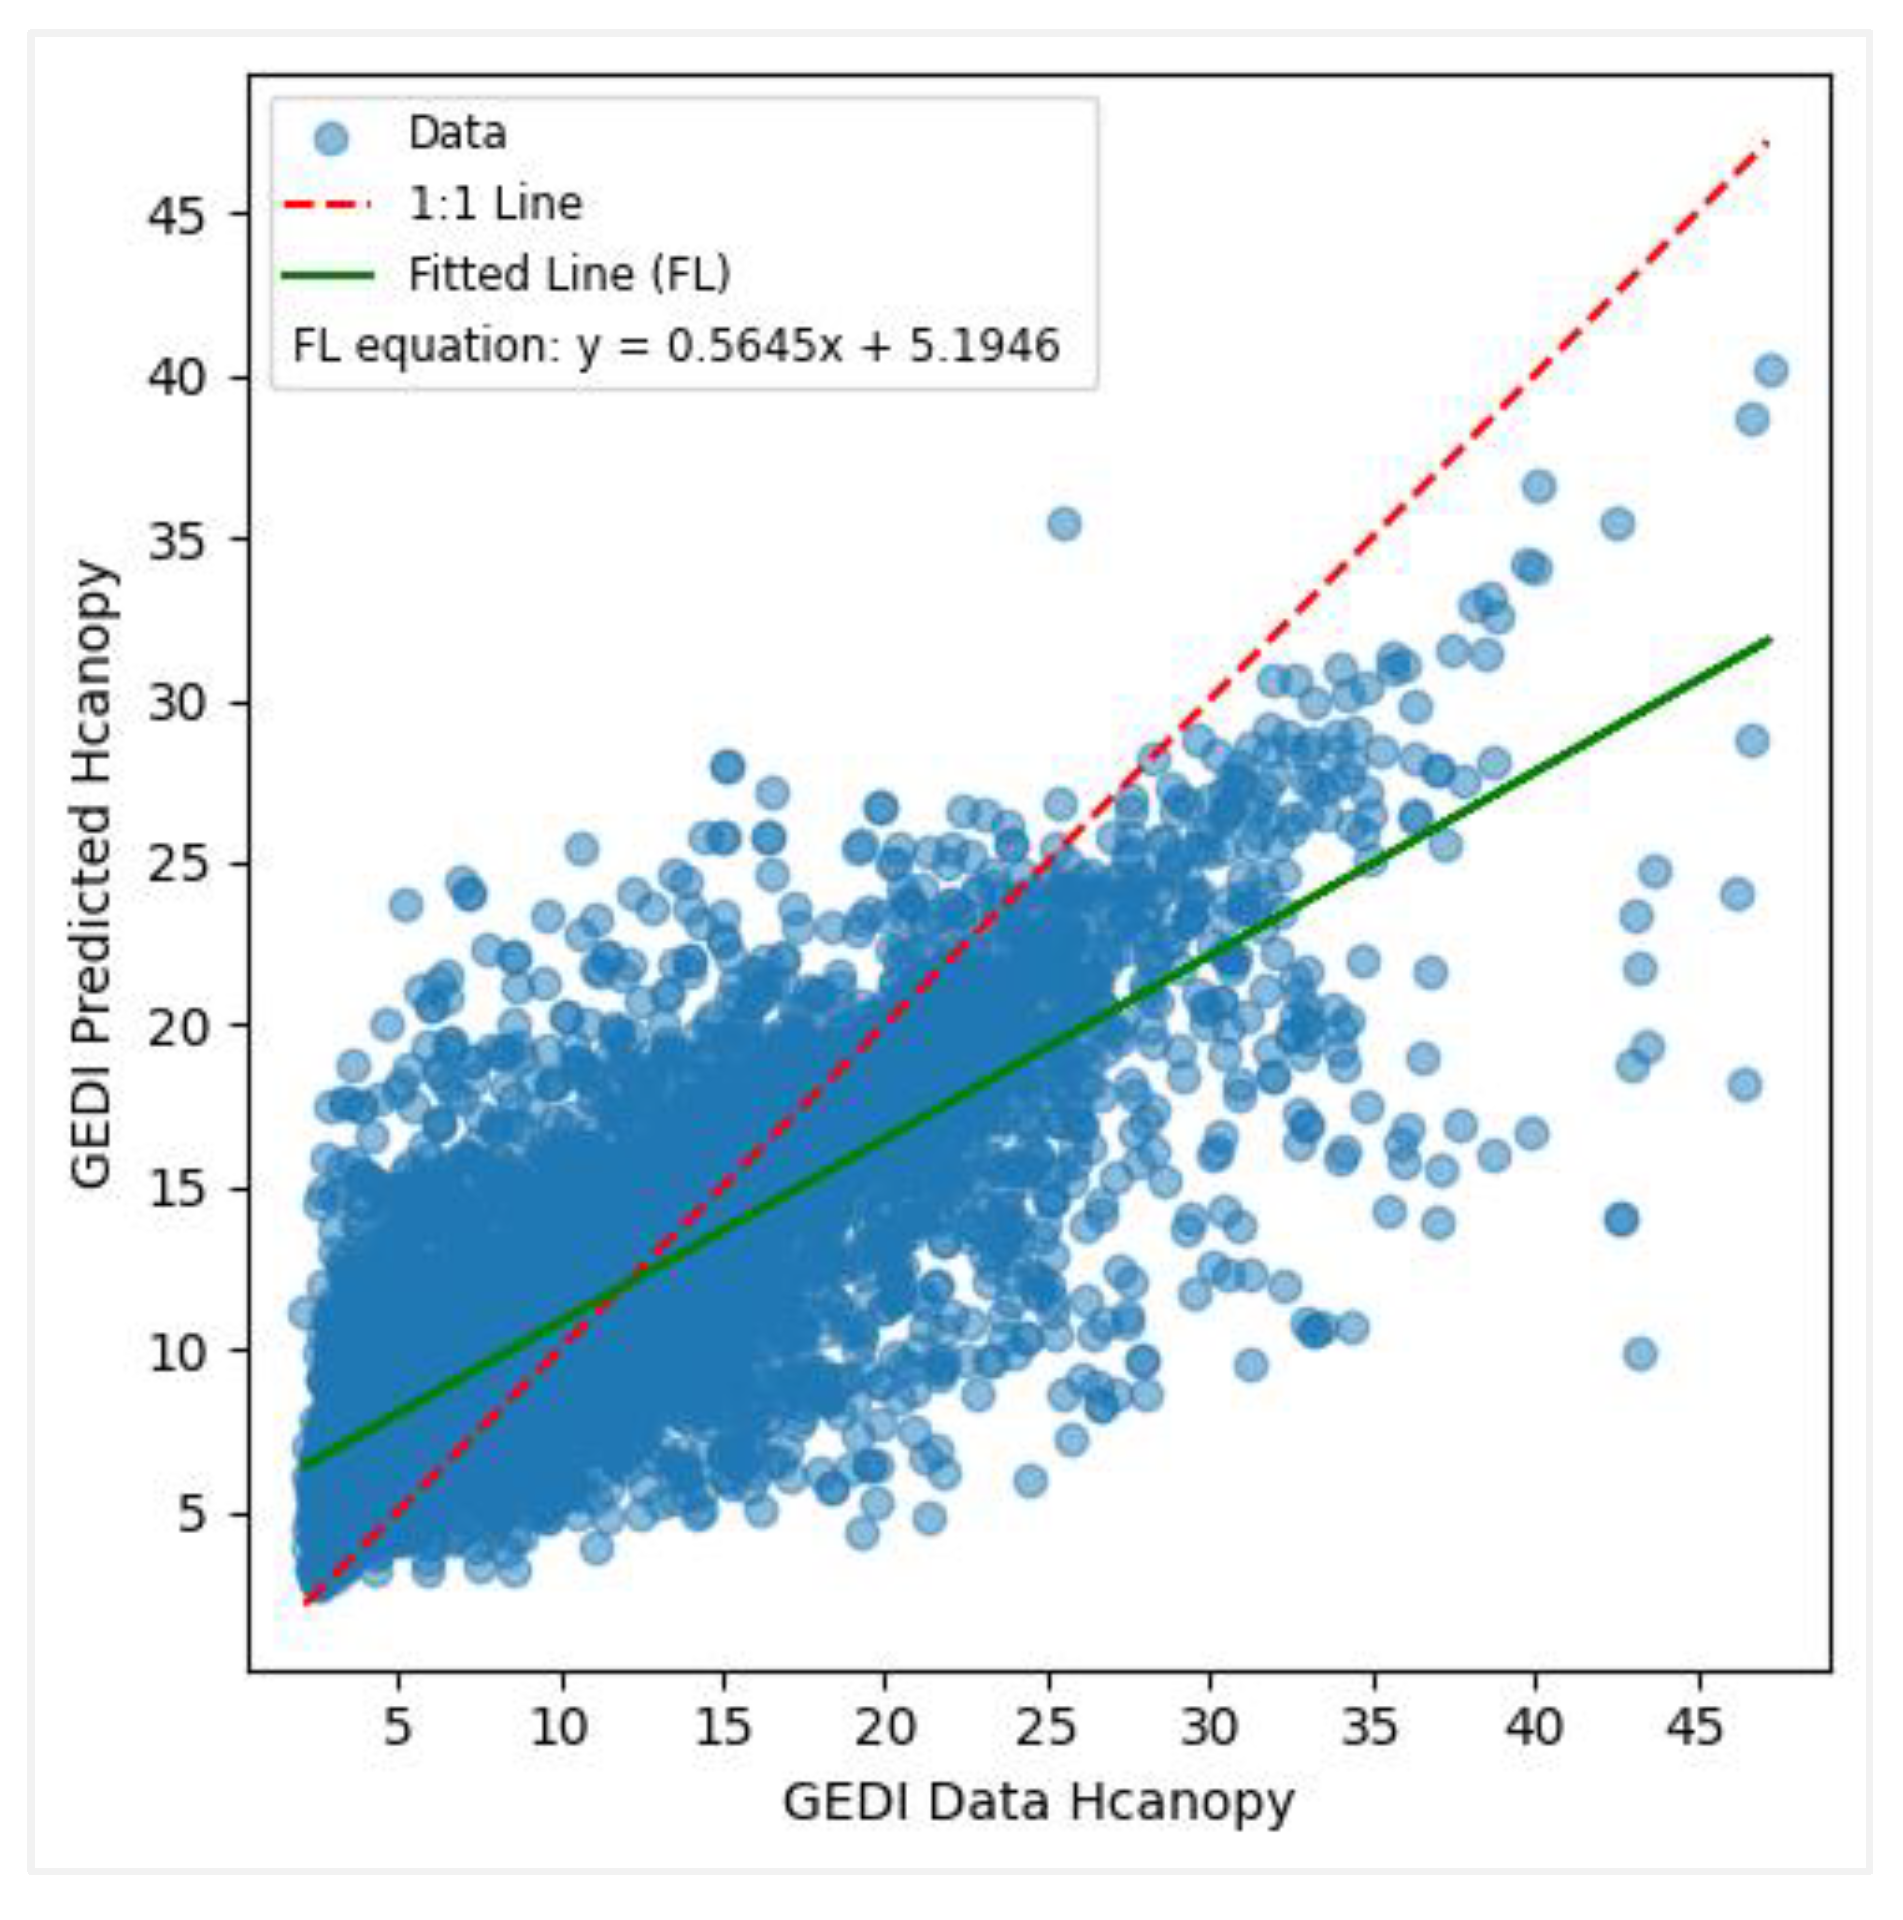
Predicted vs observed values when modelling canopy height with GEDI data.
Figure 11.
Predicted vs observed values when modelling canopy height with GEDI data.
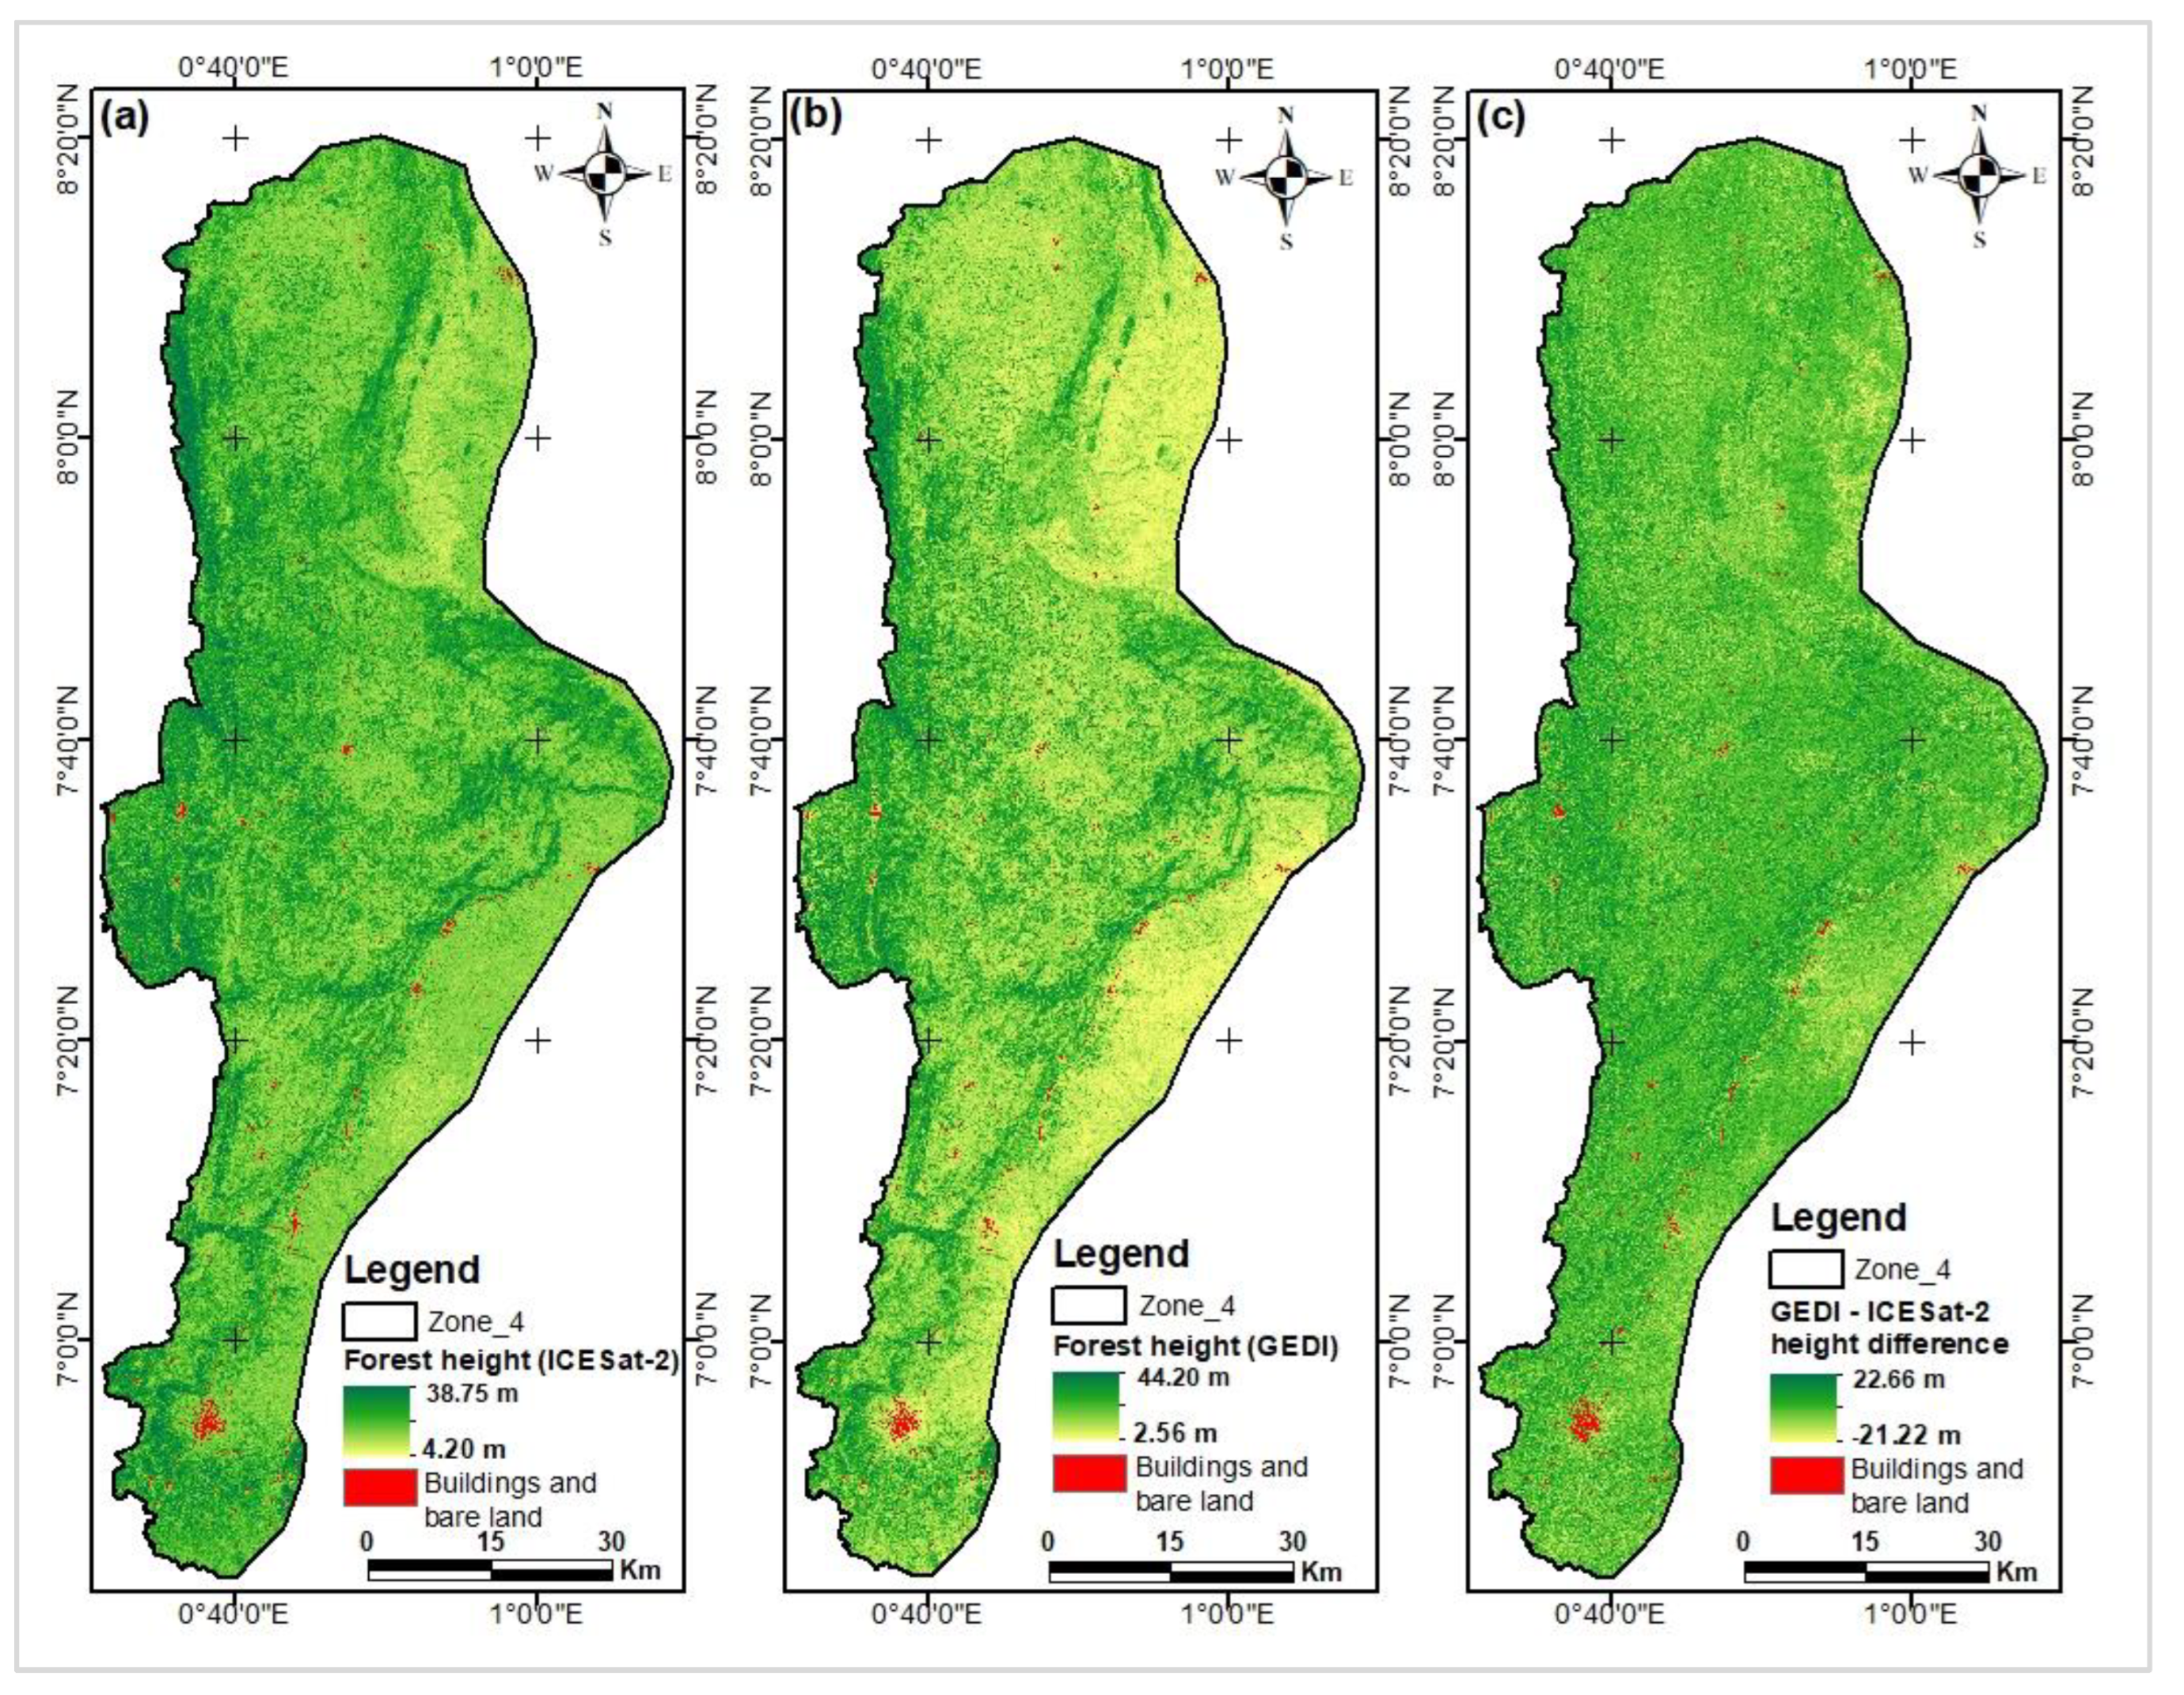
Figure 12.
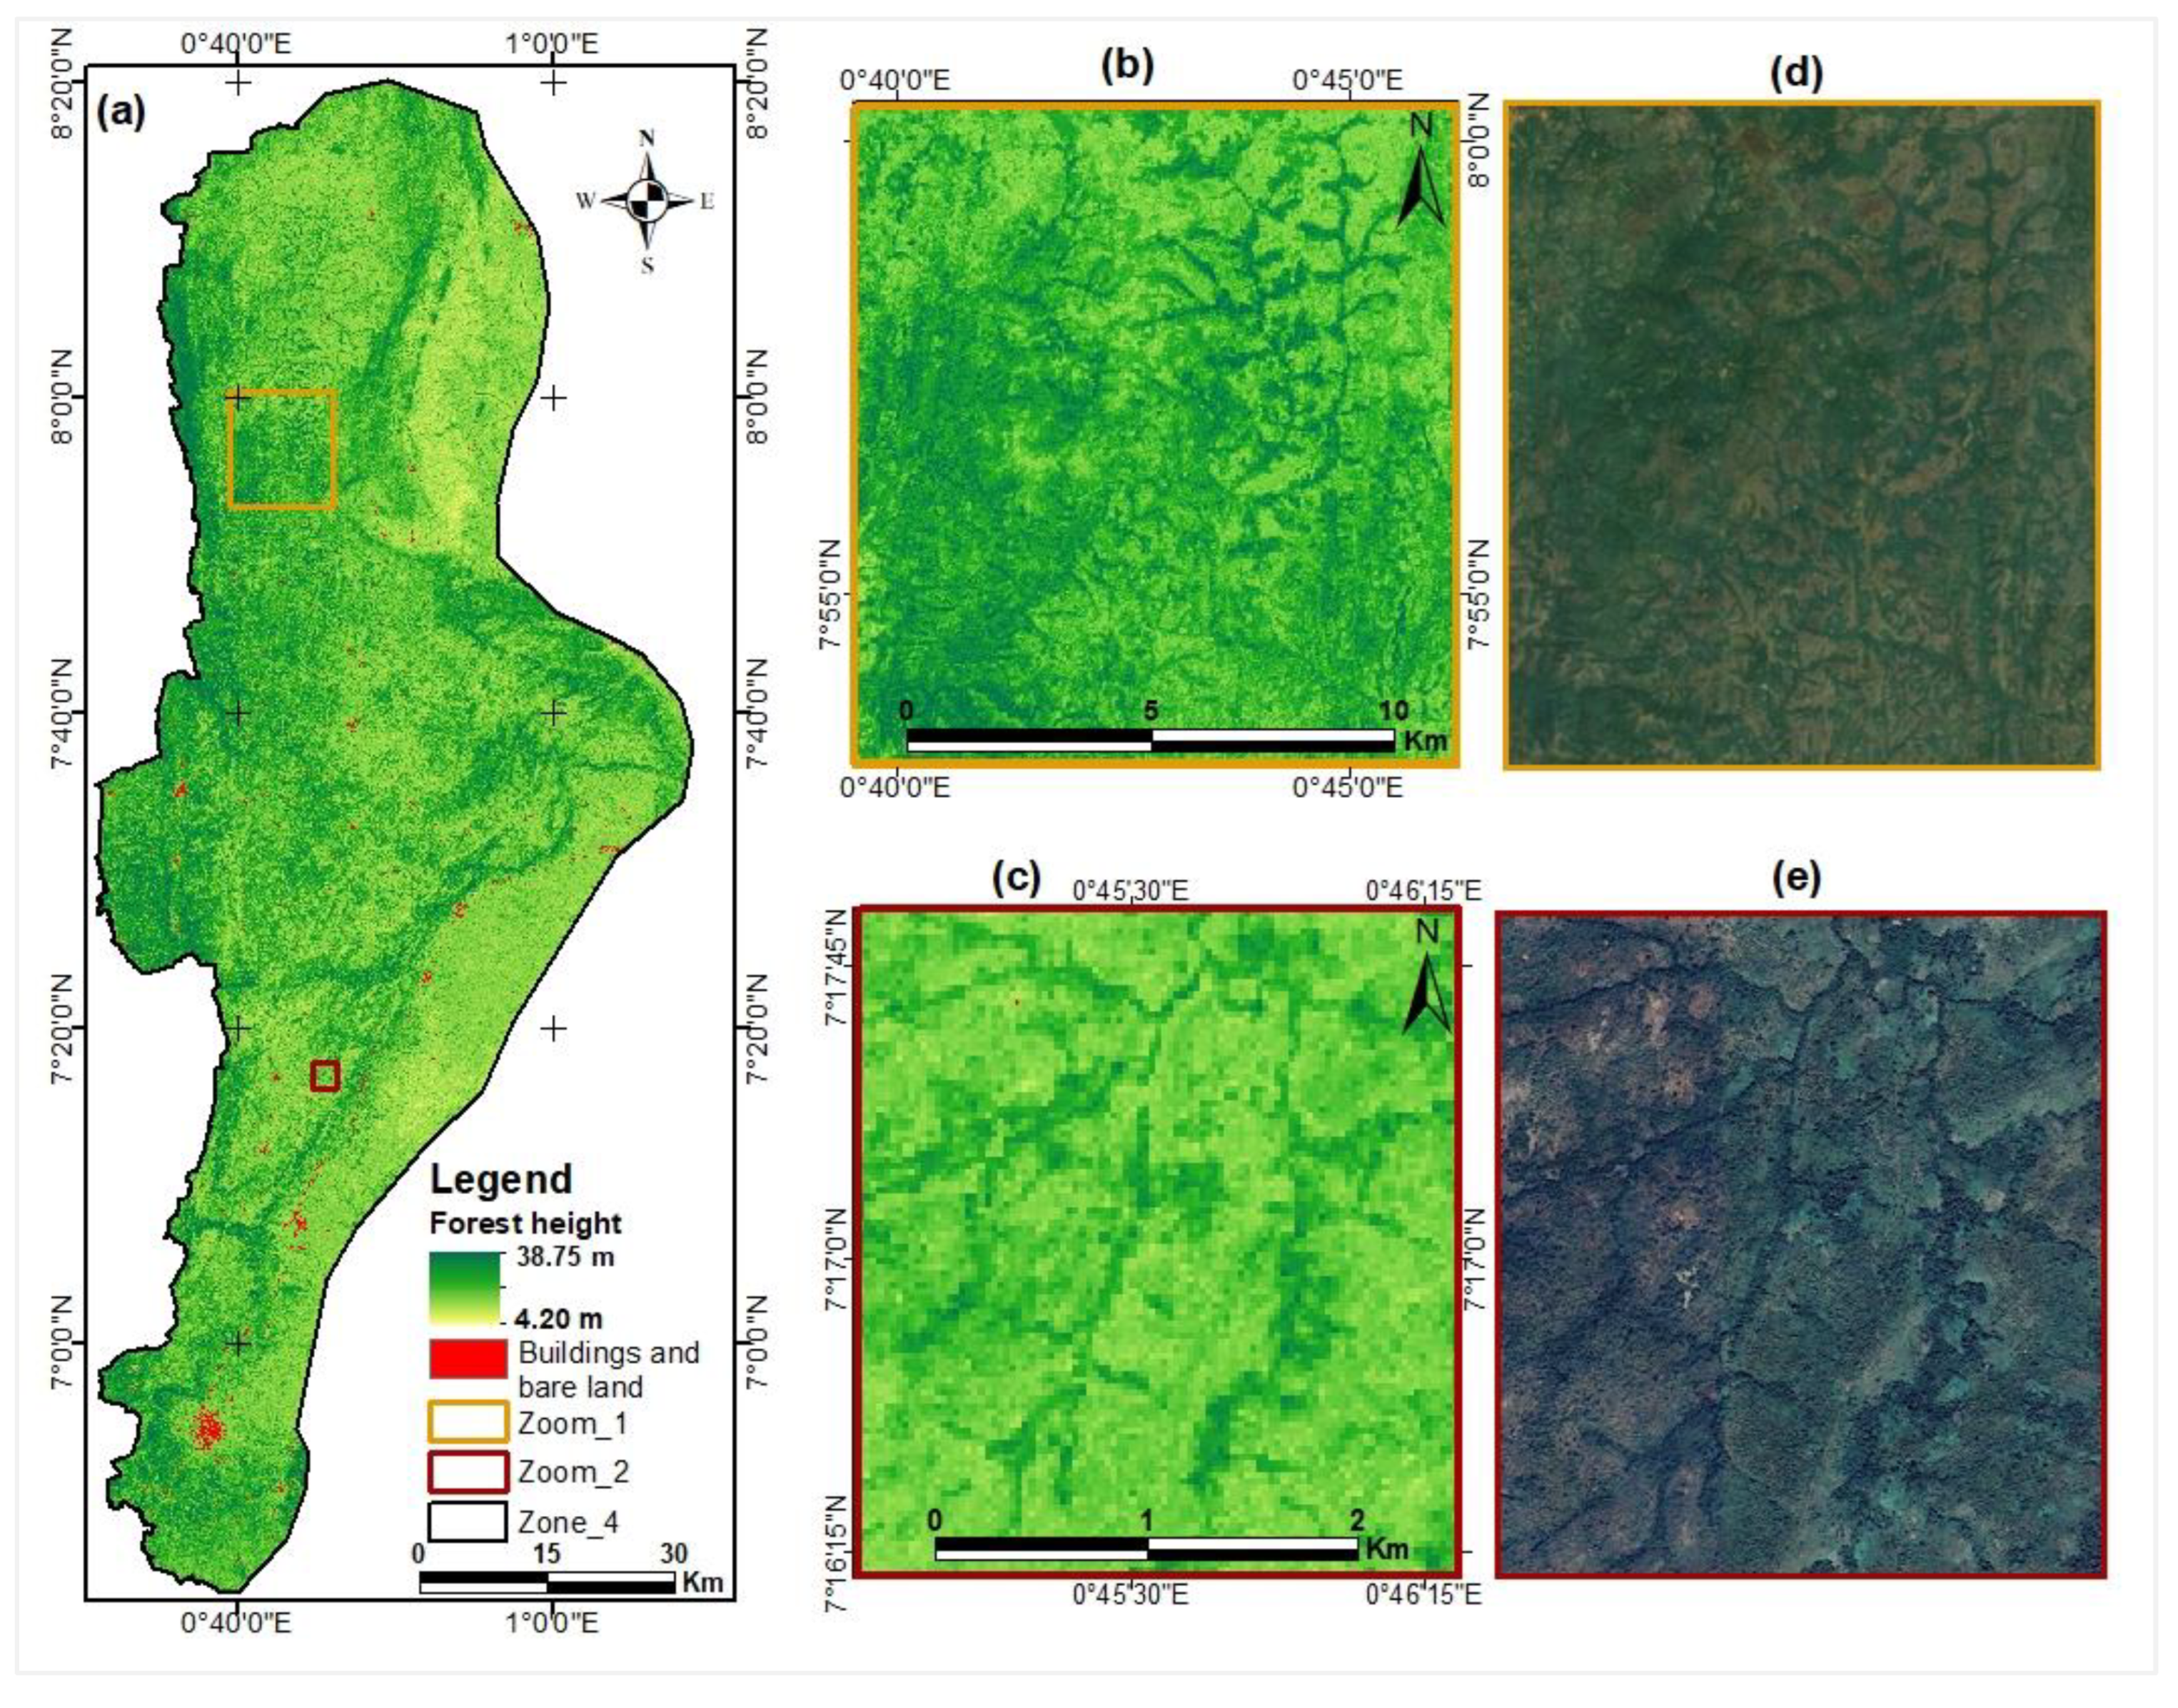
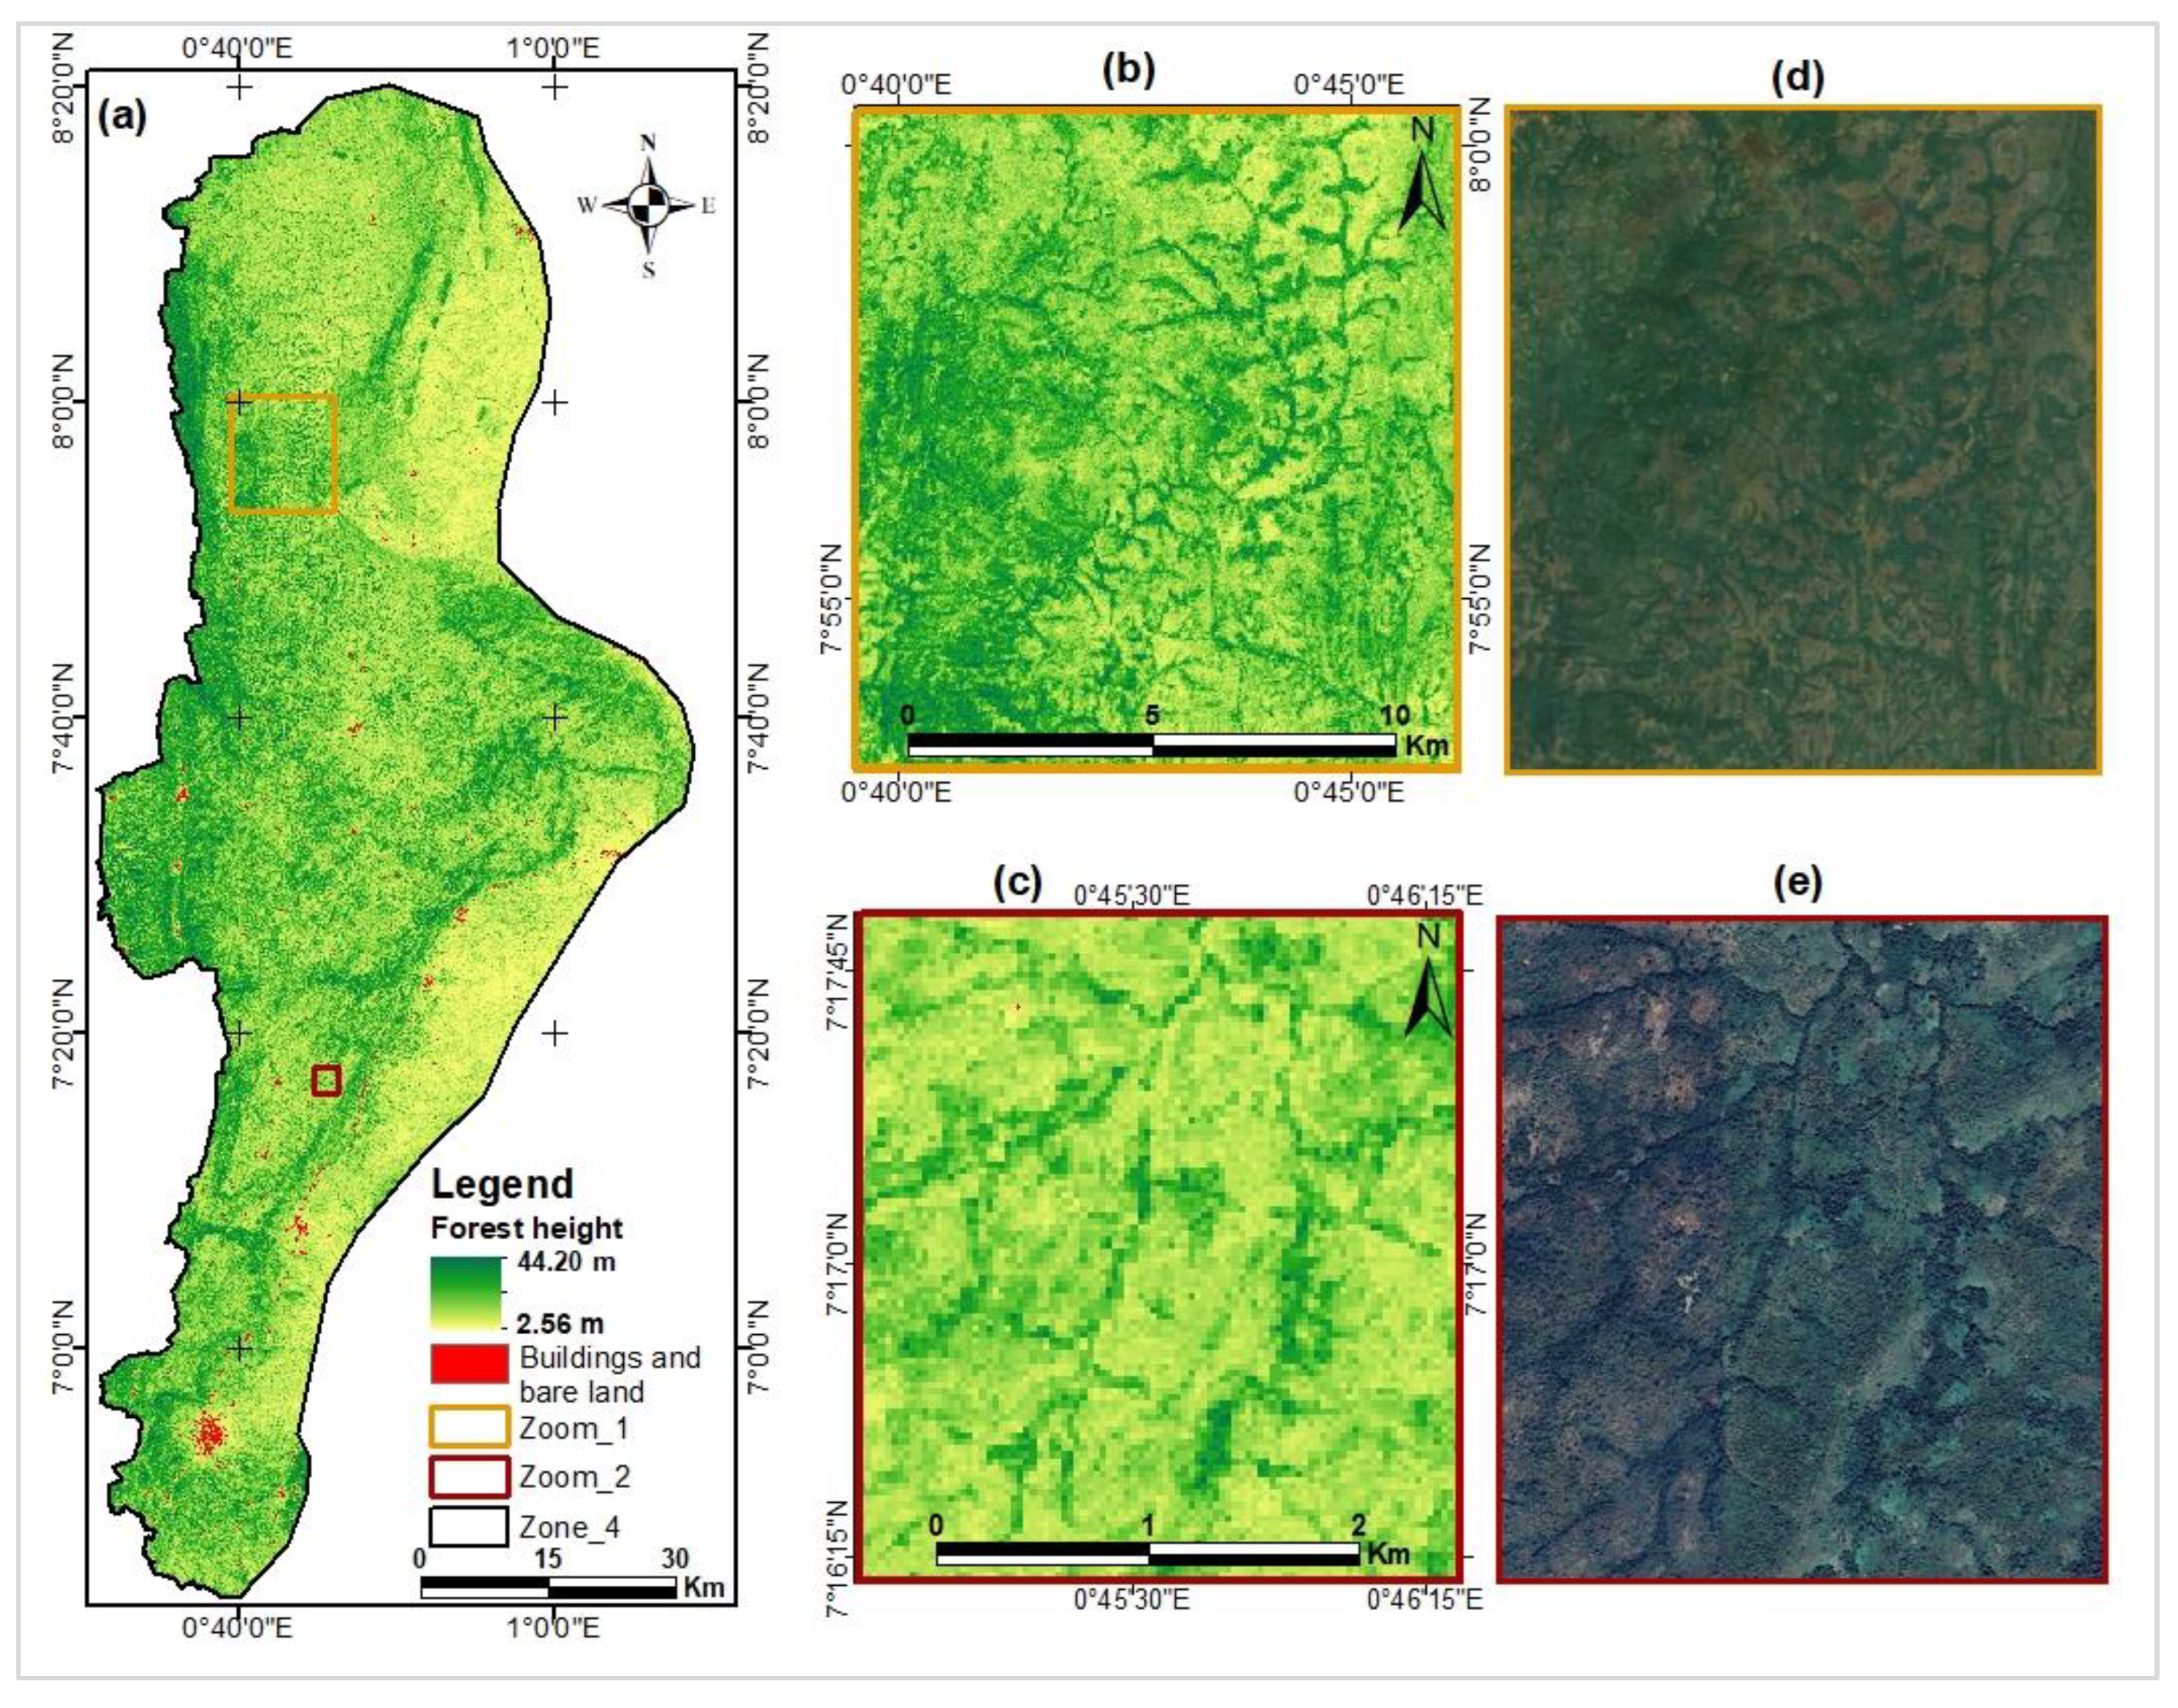
Map of canopy heights estimated from ICESat-2 data.
Figure 12.
Map of canopy heights estimated from ICESat-2 data.
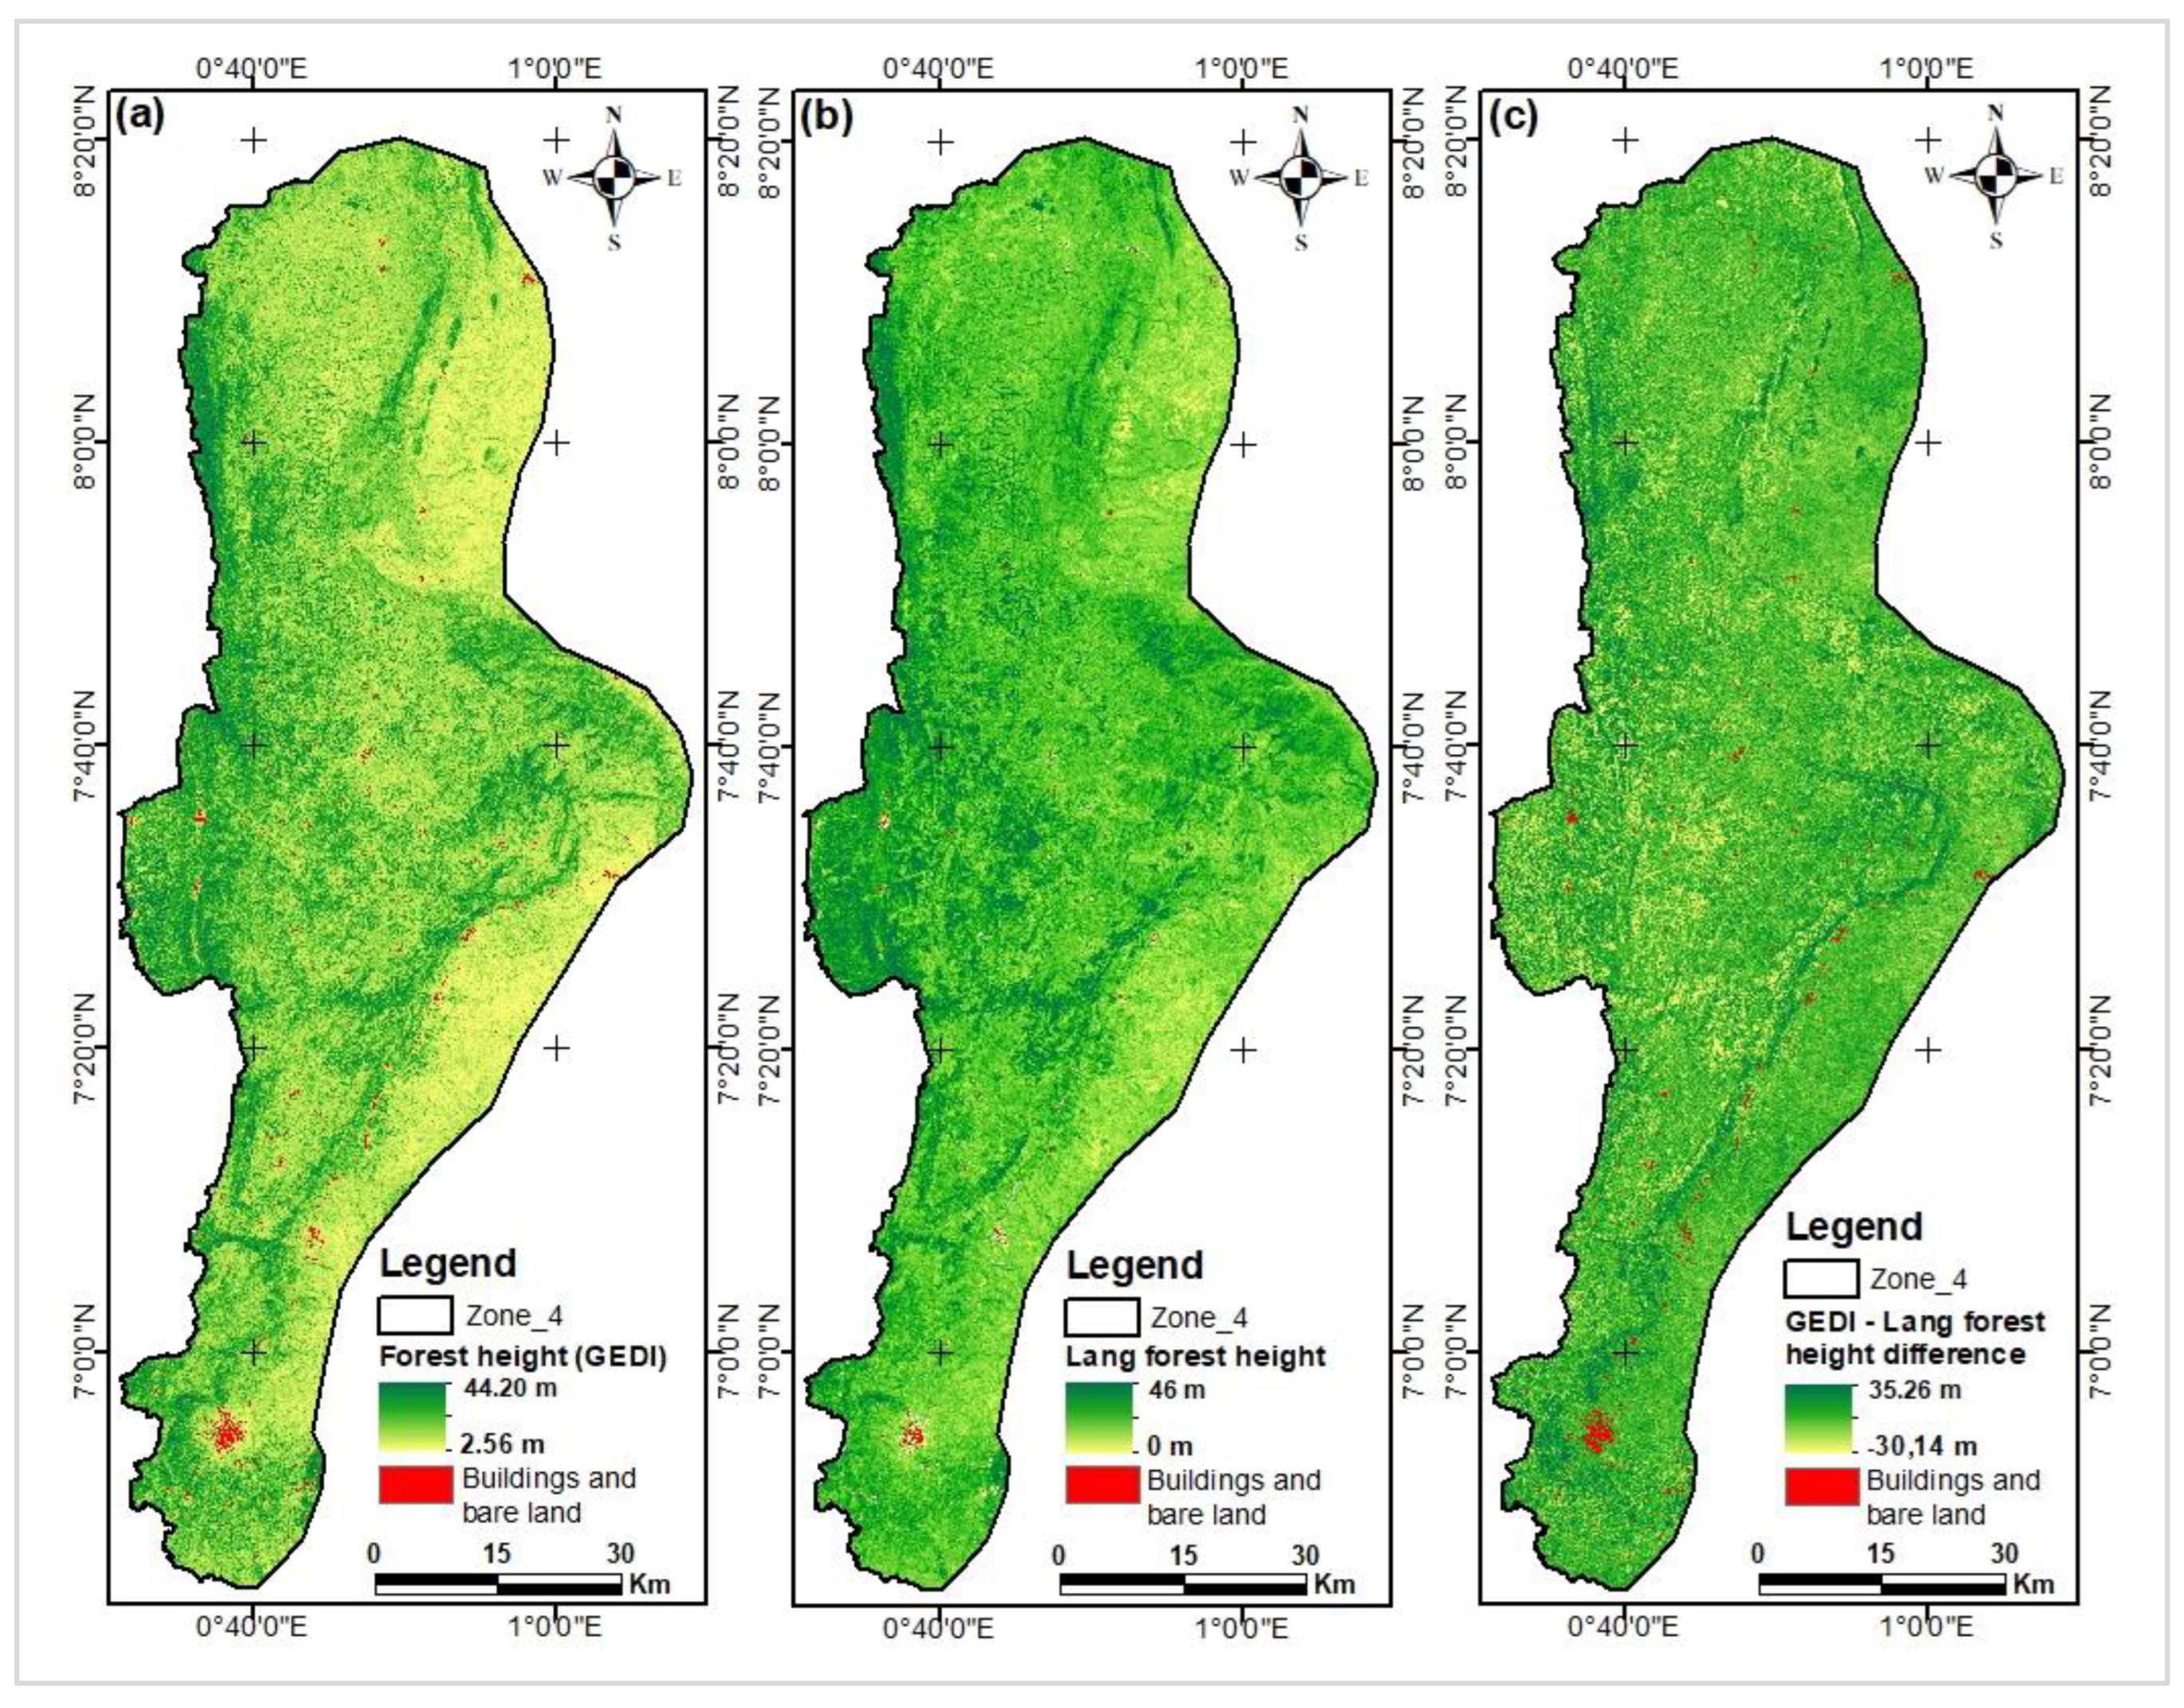
Figure 13.
Map of canopy heights estimated from GEDI data.
Figure 13.
Map of canopy heights estimated from GEDI data.
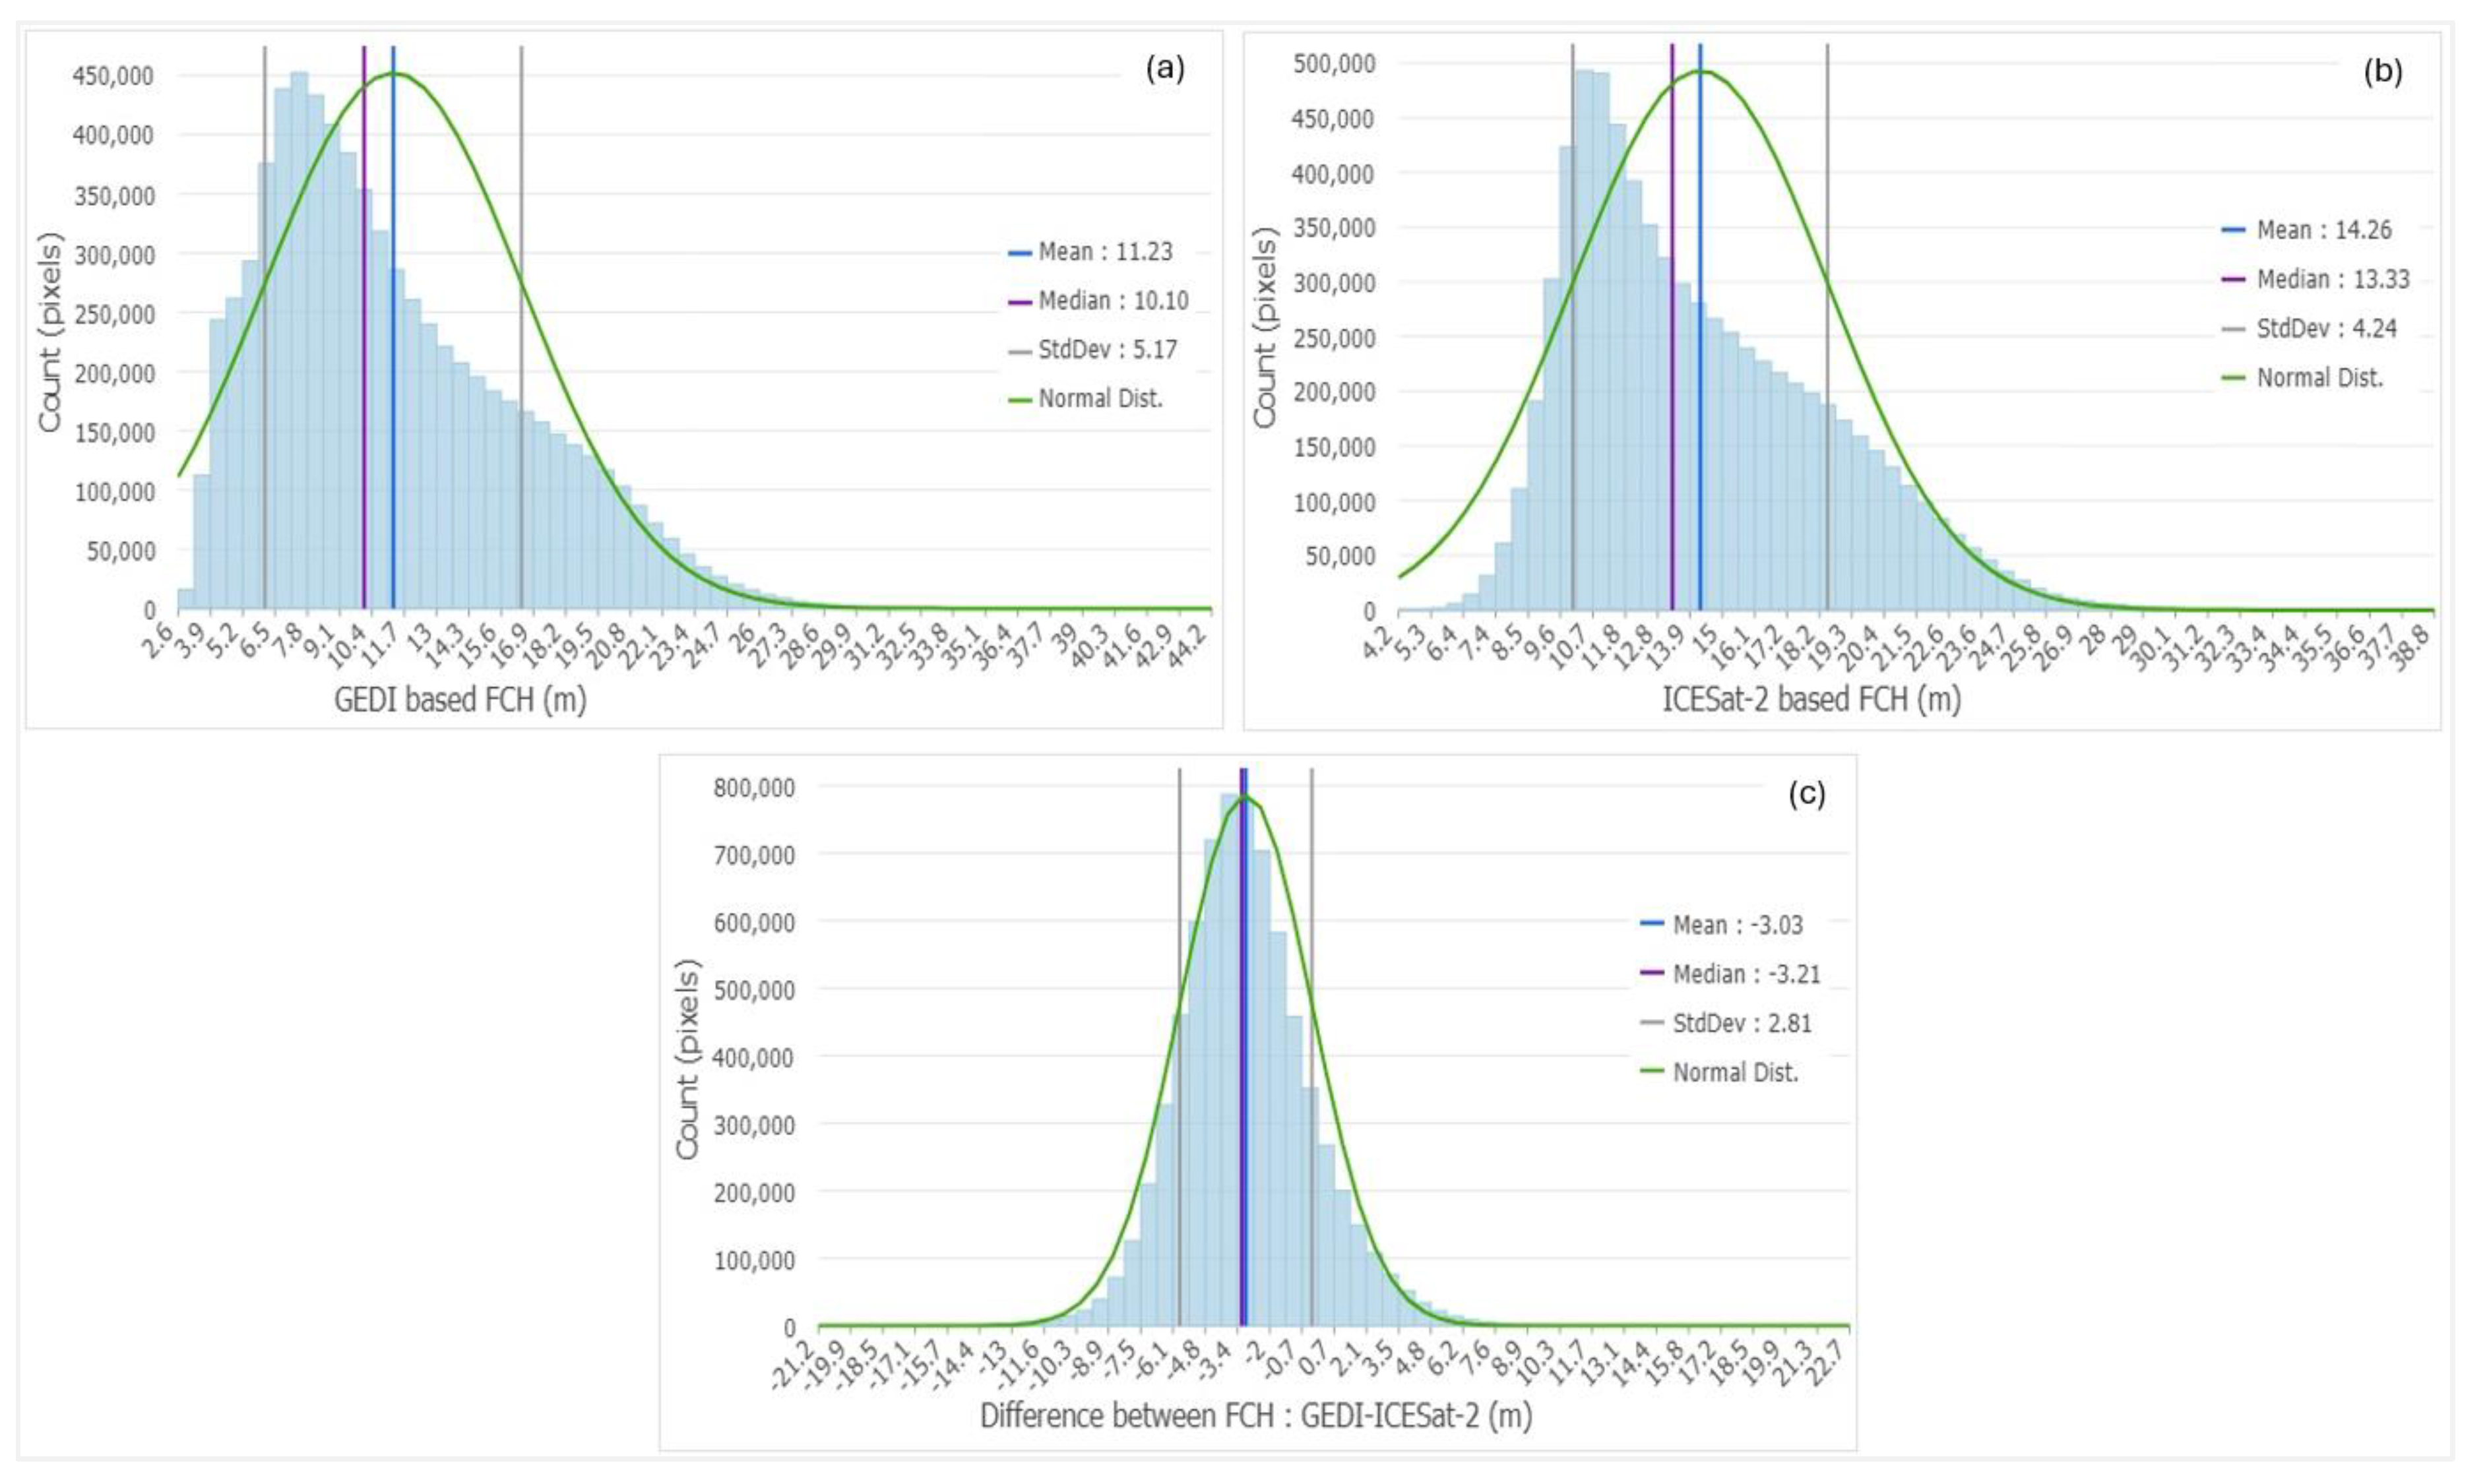
Figure 14.
Histograms of GEDI-based (a) and ICESat-2-based (b) maps, and the difference between GEDI/ICESat-2 maps (c).
Figure 14.
Histograms of GEDI-based (a) and ICESat-2-based (b) maps, and the difference between GEDI/ICESat-2 maps (c).
Figure 15.
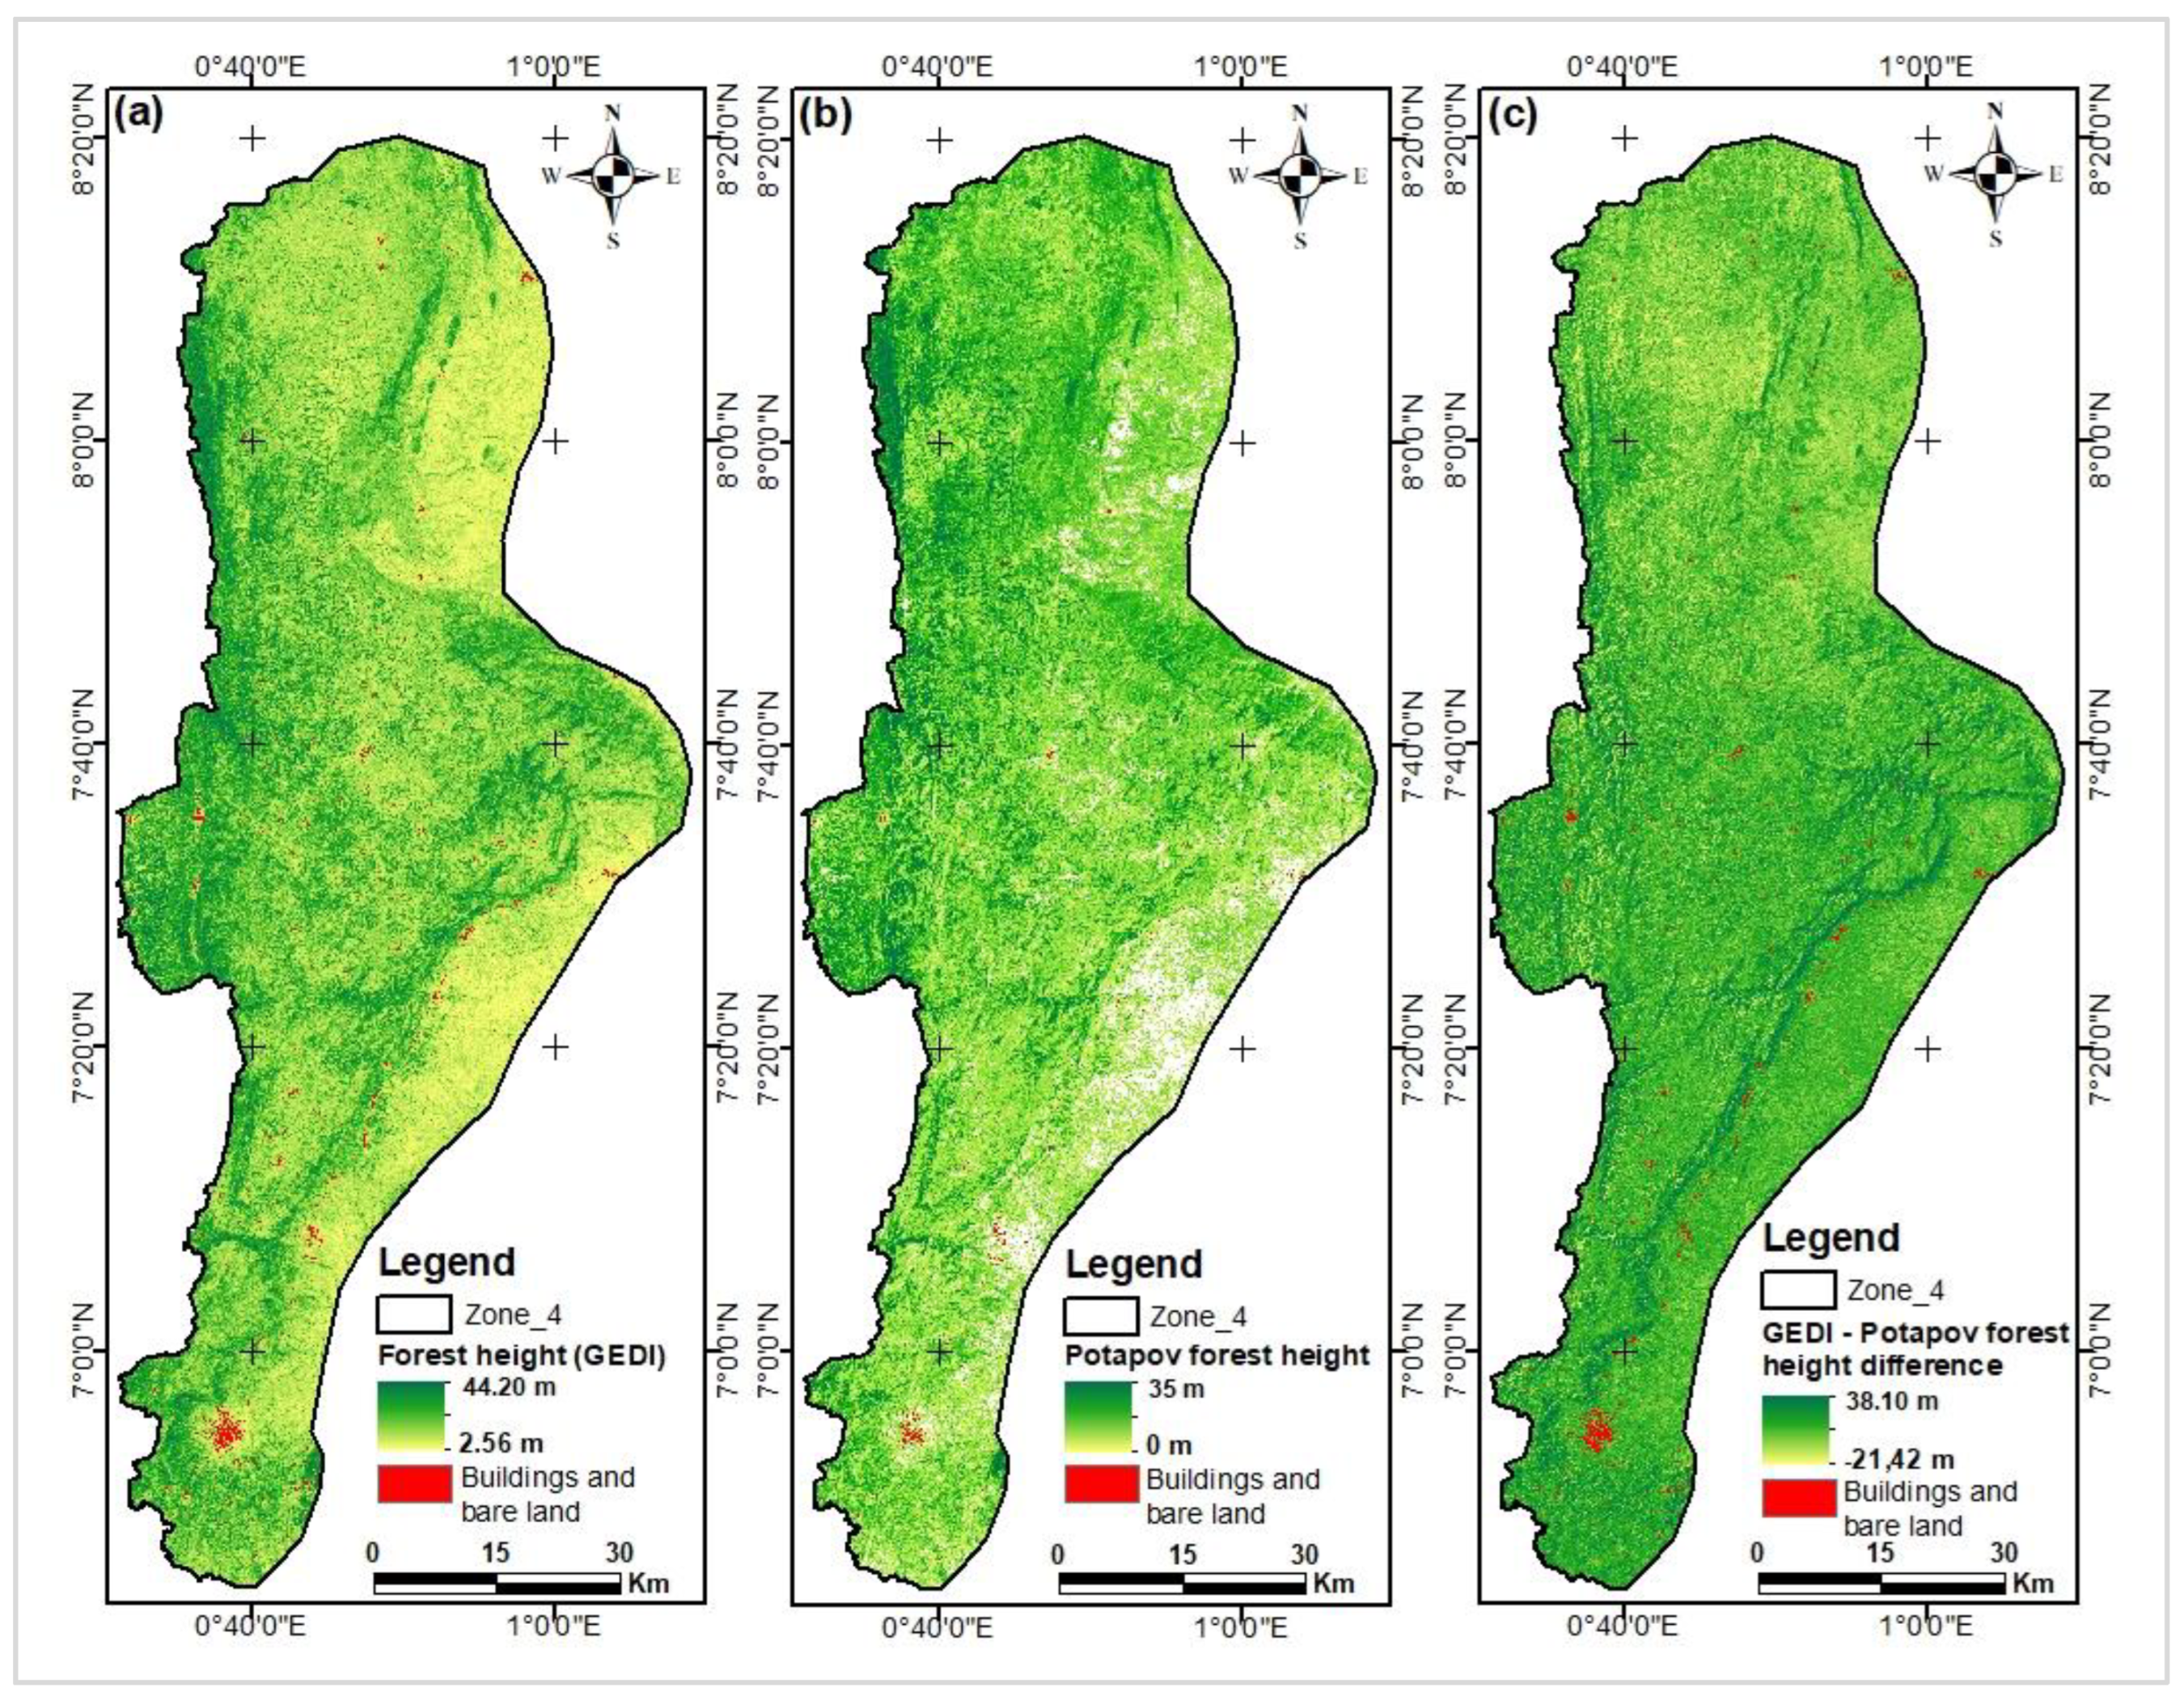
Histograms of difference maps between GEDI/Lang (a) & GEDI/Potapov (b) maps.
Figure 15.
Histograms of difference maps between GEDI/Lang (a) & GEDI/Potapov (b) maps.
Table 1.
Data used in the research.
Table 1.
Data used in the research.
| Data source |
Type of data |
Year |
Spatial resolution |
Brief description |
| GEDI |
Satellite LiDAR |
2020 |
25 m diameter |
GEDI02_A granules containing relative canopy heights and other variables |
| ICESat-2 |
Satellite LiDAR |
2020 |
17 m x 100 m |
ATL08 products containing relative canopy heights and other variables |
| Sentinel 1 |
Radar |
2020 |
10 m x 10 m |
Synthetic Aperture Radar (SAR) images from the Sentinel-1A satellite |
| Sentinel 2 |
Optical |
2020 |
10 m x 10 m,20 m x 20 m |
Multi-spectral images from the Sentinel-2A satellite |
| SRTM |
Altimetry |
2000 |
30 m x 30 m |
Digital Terrain Model |
| Field plots &NFI2 plots |
Dendrometry |
2020 2021 |
17 m x 100 m, &40 m diameter |
Individual tree height & diameters at breast height (DBH) |
| Land use map |
Cartography |
2020 |
30 m x 30 m |
Existing land use map based on Landsat 8 data |
Table 2.
Covariates extracted from Sentinel 1, Sentinel 2, and SRTM data.
Table 2.
Covariates extracted from Sentinel 1, Sentinel 2, and SRTM data.
| Sentinel 1 |
Description |
Sentinel 2 |
Description |
SRTM |
Description |
| S1vv |
Sentinel1 Vertical transmit, Vertical receive polarisation |
blue |
Sentinel2 B2 |
aspect |
SRTM aspect |
| S1vh |
Sentinel1 Vertical transmit, Horizontal receive polarisation |
green |
Sentinel2 B3 |
elevation |
SRTM elevation |
| S1diff |
Sentinel1 Bands difference between VV and VH |
red |
Sentinel2 B4 |
slope |
SRTM slope |
| S1mdpsvi |
Sentinel1 Modified Dual Polarimetric Sar Vegetation Index |
rededge1 |
Sentinel2 B5 |
|
|
| S1npdi |
Sentinel1 Normalized Polarization Difference Index |
rededge2 |
Sentinel2 B6 |
|
|
| S1prod |
Sentinel1 Bands product between VV and VH |
rededge3 |
Sentinel2 B7 |
|
|
| S1rept |
Sentinel1 Bands report between VV and VH |
nir |
Sentinel2 B8 |
|
|
| S1rvi |
Sentinel1 Ratio Vegetation Index |
nirnarrow |
Sentinel2 B8A |
|
|
| S1sum |
Sentinel1 Bands sum between VV and VH |
swir1 |
Sentinel2 B11 |
|
|
| S1vhasm |
Sentinel1 VH GLCM Angular Second Moment |
swir2 |
Sentinel2 B12 |
|
|
| S1vhcont |
Sentinel1 VH GLCM Contrast |
arvi |
Atmospherically Resistant Vegetation Index |
|
|
| S1vhcorr |
Sentinel1 VH GLCM Correlation |
bsi |
Bare Soil Index |
|
|
| S1vhdiss |
Sentinel1 VH GLCM Dissimilarity |
evi |
Enhanced Vegetation Index |
|
|
| S1vhener |
Sentinel1 VH GLCM Energy |
gndvi |
Green Normalized Difference Vegetation Index |
|
|
| S1vhent |
Sentinel1 VH GLCM Entropy |
mndwi |
Modified Normalized Difference Water Index |
|
|
| S1vhhomo |
Sentinel1 VH GLCM Inverse Difference Moment (Homogeneity) |
msavi |
Modified Soil Adjusted Vegetation Index |
|
|
| S1vhmax |
Sentinel1 VH GLCM Maximum |
mtvi |
Modified Triangular Vegetation Index |
|
|
| S1vhmean |
Sentinel1 VH GLCM Mean |
ndbi |
Normalized Difference Built-up Index |
|
|
| S1vhvar |
Sentinel1 VH GLCM Variance |
ndii |
Normalized Difference Infrared Index |
|
|
| S1vvasm |
Sentinel1 VV GLCM Angular Second Moment |
ndvi |
Normalized Difference Vegetation Index |
|
|
| S1vvcont |
Sentinel1 VV GLCM Contrast |
osavi |
Optimized Soil Adjusted Vegetation Index |
|
|
| S1vvcorr |
Sentinel1 VV GLCM Correlation |
rdvi |
Renormalized Difference Vegetation Index |
|
|
| S1vvdiss |
Sentinel1 VV GLCM Dissimilarity |
rvi |
Ratio Vegetation Index |
|
|
| S1vvener |
Sentinel1 VV GLCM Energy |
savi |
Soil Adjusted Vegetation Index |
|
|
| S1vvent |
Sentinel1 VV GLCM Entropy |
sipi |
Structure Insensitive Pigment Index |
|
|
| S1vvhomo |
Sentinel1 VV GLCM Inverse Difference Moment (Homogeneity) |
sr |
Simple Ratio |
|
|
| S1vvmax |
Sentinel1 VV GLCM Maximum |
vari |
Visible Atmospherically Resistant Index |
|
|
| S1vvmean |
Sentinel1 VV GLCM Mean |
vsi |
Vegetation Structure Index |
|
|
| S1vvvar |
Sentinel1 VV GLCM Variance |
|
|
|
|
Table 3.
Selection configurations for GEDI data footprints for modelling.
Table 3.
Selection configurations for GEDI data footprints for modelling.
| Configurations |
Sensitivity |
Quality_flag |
Beam type |
Acquisition time |
| Config1 |
All beams |
All beams |
All beams |
All beams |
| Config2 |
≥ 0 |
1 |
Power |
Day |
| Config3 |
≥ 0 |
1 |
Power |
Night |
| Config4 |
≥ 0 |
1 |
Coverage |
Day |
| Config5 |
≥ 0 |
1 |
Coverage |
Night |
| Config6 |
≥ 0.9 |
1 |
Power |
Day |
| Config7 |
≥ 0.9 |
1 |
Power |
Night |
| Config8 |
≥ 0.9 |
1 |
Coverage |
Day |
| Config9 |
≥ 0.9 |
1 |
Coverage |
Night |
Table 4.
Different scenarios for combining LiDAR variables with other multisource variables.
Table 4.
Different scenarios for combining LiDAR variables with other multisource variables.
| Scenarios |
Variable combinations |
Number of variables |
| S1 |
Optical |
28 |
| S2 |
Radar |
29 |
| S3 |
Topographic |
03 |
| S4 |
Optical - Radar |
57 |
| S5 |
Optical - Topographical |
31 |
| S6 |
Radar - Topographical |
32 |
| S7 |
Optical - Radar - Topographical |
60 |
Table 5.
ICESat-2 Data Validation Correlation Matrix.
Table 5.
ICESat-2 Data Validation Correlation Matrix.
| |
Min. |
1st Qu. |
Med |
Mean |
Max. |
RH50 |
RH55 |
RH60 |
RH65 |
RH70 |
RH75 |
RH80 |
RH85 |
RH90 |
RH95 |
RH98 |
h_canopy |
| Min. |
1 |
|
|
|
|
|
|
|
|
|
|
|
|
|
|
|
|
| 1st Qu. |
0.76 |
1 |
|
|
|
|
|
|
|
|
|
|
|
|
|
|
|
| Med |
0.65 |
0.92 |
1 |
|
|
|
|
|
|
|
|
|
|
|
|
|
|
| Mean |
0.64 |
0.88 |
0.95 |
1 |
|
|
|
|
|
|
|
|
|
|
|
|
|
| Max. |
0.23 |
0.4 |
0.48 |
0.67 |
1 |
|
|
|
|
|
|
|
|
|
|
|
|
| RH50 |
0.65 |
0.92 |
1 |
0.95 |
0.48 |
1 |
|
|
|
|
|
|
|
|
|
|
|
| RH55 |
0.61 |
0.89 |
0.99 |
0.96 |
0.5 |
0.99 |
1 |
|
|
|
|
|
|
|
|
|
|
| RH60 |
0.58 |
0.87 |
0.98 |
0.96 |
0.52 |
0.98 |
0.99 |
1 |
|
|
|
|
|
|
|
|
|
| RH65 |
0.56 |
0.83 |
0.95 |
0.96 |
0.54 |
0.95 |
0.97 |
0.99 |
1 |
|
|
|
|
|
|
|
|
| RH70 |
0.53 |
0.8 |
0.93 |
0.96 |
0.56 |
0.93 |
0.95 |
0.97 |
0.99 |
1 |
|
|
|
|
|
|
|
| RH75 |
0.5 |
0.77 |
0.91 |
0.95 |
0.58 |
0.91 |
0.93 |
0.95 |
0.98 |
0.99 |
1 |
|
|
|
|
|
|
| RH80 |
0.47 |
0.73 |
0.87 |
0.94 |
0.63 |
0.87 |
0.9 |
0.92 |
0.95 |
0.97 |
0.98 |
1 |
|
|
|
|
|
| RH85 |
0.45 |
0.69 |
0.83 |
0.94 |
0.68 |
0.83 |
0.86 |
0.89 |
0.92 |
0.93 |
0.95 |
0.98 |
1 |
|
|
|
|
| RH90 |
0.42 |
0.65 |
0.78 |
0.91 |
0.75 |
0.78 |
0.81 |
0.83 |
0.86 |
0.88 |
0.9 |
0.94 |
0.97 |
1 |
|
|
|
| RH95 |
0.37 |
0.56 |
0.68 |
0.85 |
0.83 |
0.68 |
0.71 |
0.73 |
0.75 |
0.78 |
0.8 |
0.84 |
0.88 |
0.94 |
1 |
|
|
| RH98 |
0.31 |
0.49 |
0.59 |
0.78 |
0.92 |
0.59 |
0.62 |
0.64 |
0.66 |
0.69 |
0.71 |
0.76 |
0.81 |
0.87 |
0.96 |
1 |
|
| h_canopy |
0.11 |
0.23 |
0.32 |
0.41 |
0.49 |
0.32 |
0.33 |
0.34 |
0.36 |
0.39 |
0.41 |
0.42 |
0.45 |
0.5 |
0.52 |
0.53 |
1 |
Table 6.
Accuracy metrics of the prediction models for the seven scenarios.
Table 6.
Accuracy metrics of the prediction models for the seven scenarios.
| Models |
RF |
SVM |
XGBoost |
DNN |
| Scenarios |
S1 |
S2 |
S3 |
S4 |
S5 |
S6 |
S7 |
S7 |
S7 |
S7 |
| r |
0.53 |
0.26 |
0.28 |
0.56 |
0.57 |
0.46 |
0.62 |
0.53 |
0.57 |
0.57 |
| RMSE |
5.72 |
6.25 |
6.57 |
5.52 |
5.40 |
9.96 |
5.28 |
5.50 |
5.21 |
5.68 |
| MAE |
4.23 |
4.70 |
4.88 |
4.15 |
3.92 |
4.44 |
4.00 |
4.08 |
4.06 |
4.11 |
Table 7.
Canopy height prediction models from GEDI data.
Table 7.
Canopy height prediction models from GEDI data.
| Relative Height |
Config1 |
Config2 |
Config3 |
Config4 |
Config5 |
Config6 |
Config7 |
Config8 |
Config9 |
| |
Pearson Correlation Coefficient (r) |
| RH75 |
0.55 |
0.60 |
0.67 |
0.59 |
0.76 |
0.59 |
0.69 |
0.67 |
0.77 |
| RH80 |
0.57 |
0.54 |
0.69 |
0.67 |
0.78 |
0.56 |
0.69 |
0.67 |
0.78 |
| RH85 |
0.56 |
0.61 |
0.69 |
0.66 |
0.76 |
0.58 |
0.69 |
0.65 |
0.77 |
| RH90 |
0.56 |
0.61 |
0.71 |
0.62 |
0.77 |
0.54 |
0.70 |
0.63 |
0.77 |
| RH95 |
0.58 |
0.58 |
0.70 |
0.61 |
0.77 |
0.58 |
0.70 |
0.64 |
0.77 |
| RH98 |
0.58 |
0.61 |
0.70 |
0.67 |
0.77 |
0.58 |
0.71 |
0.68 |
0.80 |
| RH100 |
0.59 |
0.59 |
0.69 |
0.69 |
0.73 |
0.59 |
0.69 |
0.65 |
0.77 |
| |
Root Mean Squared Error (RMSE) |
| RH75 |
6.04 |
5.06 |
4.83 |
4.21 |
3.91 |
5.22 |
5.00 |
3.68 |
3.84 |
| RH80 |
6.17 |
5.75 |
5.03 |
3.91 |
4.01 |
5.66 |
5.09 |
3.83 |
4.01 |
| RH85 |
6.61 |
5.62 |
5.32 |
4.25 |
4.39 |
5.87 |
5.27 |
4.33 |
4.28 |
| RH90 |
6.90 |
5.97 |
5.57 |
4.48 |
4.51 |
5.90 |
5.45 |
4.48 |
4.53 |
| RH95 |
6.88 |
6.33 |
5.91 |
4.73 |
4.62 |
6.50 |
5.85 |
4.89 |
4.69 |
| RH98 |
7.19 |
6.70 |
6.10 |
4.56 |
4.71 |
6.83 |
6.09 |
4.48 |
4.42 |
| RH100 |
7.23 |
6.59 |
6.18 |
4.45 |
5.09 |
6.67 |
6.17 |
4.75 |
4.90 |
| |
Mean Absolute Error (MAE) |
| RH75 |
3.91 |
3.70 |
3.30 |
3.04 |
2.72 |
3.80 |
3.40 |
2.61 |
2.65 |
| RH80 |
4.07 |
4.20 |
3.51 |
2.80 |
2.84 |
4.20 |
3.53 |
2.89 |
2.83 |
| RH85 |
4.41 |
4.26 |
3.75 |
3.13 |
3.11 |
4.37 |
3.74 |
3.12 |
3.07 |
| RH90 |
4.63 |
4.51 |
4.03 |
3.35 |
3.30 |
4.48 |
3.95 |
3.31 |
3.24 |
| RH95 |
4.77 |
4.89 |
4.35 |
3.54 |
3.36 |
4.87 |
4.29 |
3.53 |
3.42 |
| RH98 |
4.95 |
5.03 |
4.55 |
3.36 |
3.43 |
5.24 |
4.51 |
3.40 |
3.15 |
| RH100 |
5.03 |
5.12 |
4.64 |
3.34 |
3.83 |
5.16 |
4.61 |
3.53 |
3.52 |
Table 8.
Effects of Auto-ML TPOT and AutoGluon on model performance.
Table 8.
Effects of Auto-ML TPOT and AutoGluon on model performance.
| Data |
Models |
r |
RMSE |
MAE |
| ICESat-2 |
RF |
0.61 |
5.40 |
3.81 |
| AutoGluon (RF) |
0.64 |
5.12 |
3.83 |
| TPOT (RF) |
0.65 |
5.10 |
3.80 |
| GEDI |
RF |
0.80 |
4.42 |
3.15 |
| AutoGluon (RF) |
0.83 |
4.16 |
2.65 |
| TPOT (RF) |
0.84 |
4.15 |
2.36 |
Table 9.
Correlations between extracted or existing data versus predicted data.
Table 9.
Correlations between extracted or existing data versus predicted data.
| No. |
Regression data |
r |
RMSE |
MAE |
| 1 |
ICESat-2_Data / Field_data |
0.53 |
4.85 |
3.84 |
| 2 |
ICESat-2_Model / Field_data |
0.54 |
3.11 |
2.54 |
| 3 |
ICESat-2_Data / Lang |
0.60 |
3.66 |
2.80 |
| 4 |
ICESat-2_Model / Lang |
0.71 |
3.38 |
2.55 |
| 5 |
ICESat-2_Data / Potapov |
0.52 |
3.15 |
2.39 |
| 6 |
ICESat-2_Model / Potapov |
0.62 |
3.80 |
2.93 |
| 7 |
ICESat-2_ Model / NFI2 |
0.55 |
3.65 |
2.98 |
| 8 |
GEDI_Data / Lang |
0.64 |
3.90 |
2.94 |
| 9 |
GEDI_Model / Lang |
0.65 |
5.50 |
4.17 |
| 10 |
GEDI_Data / Potapov |
0.54 |
4.11 |
3.15 |
| 11 |
GEDI_ Model / Potapov |
0.55 |
6.04 |
4.64 |
| 12 |
GEDI_ Model / NFI2 |
0.63 |
3.40 |
2.65 |
| 13 |
Lang / INFI2 |
0.64 |
3.96 |
3.09 |
| 14 |
Potapov / NFI2 |
0.46 |
4.21 |
3.28 |
