Submitted:
15 September 2024
Posted:
16 September 2024
You are already at the latest version
Abstract

Keywords:
1. Introduction
2. Materials and Methods
2.1. Isolation, characterization, and maintenance of isolates
2.2. Molecular race identification of Foc isolates
2.3. Pathogenicity assay of Fusarium isolates
2.4. Analysis of genetic diversity using ISSR markers
2.5. Data analysis
3. Results
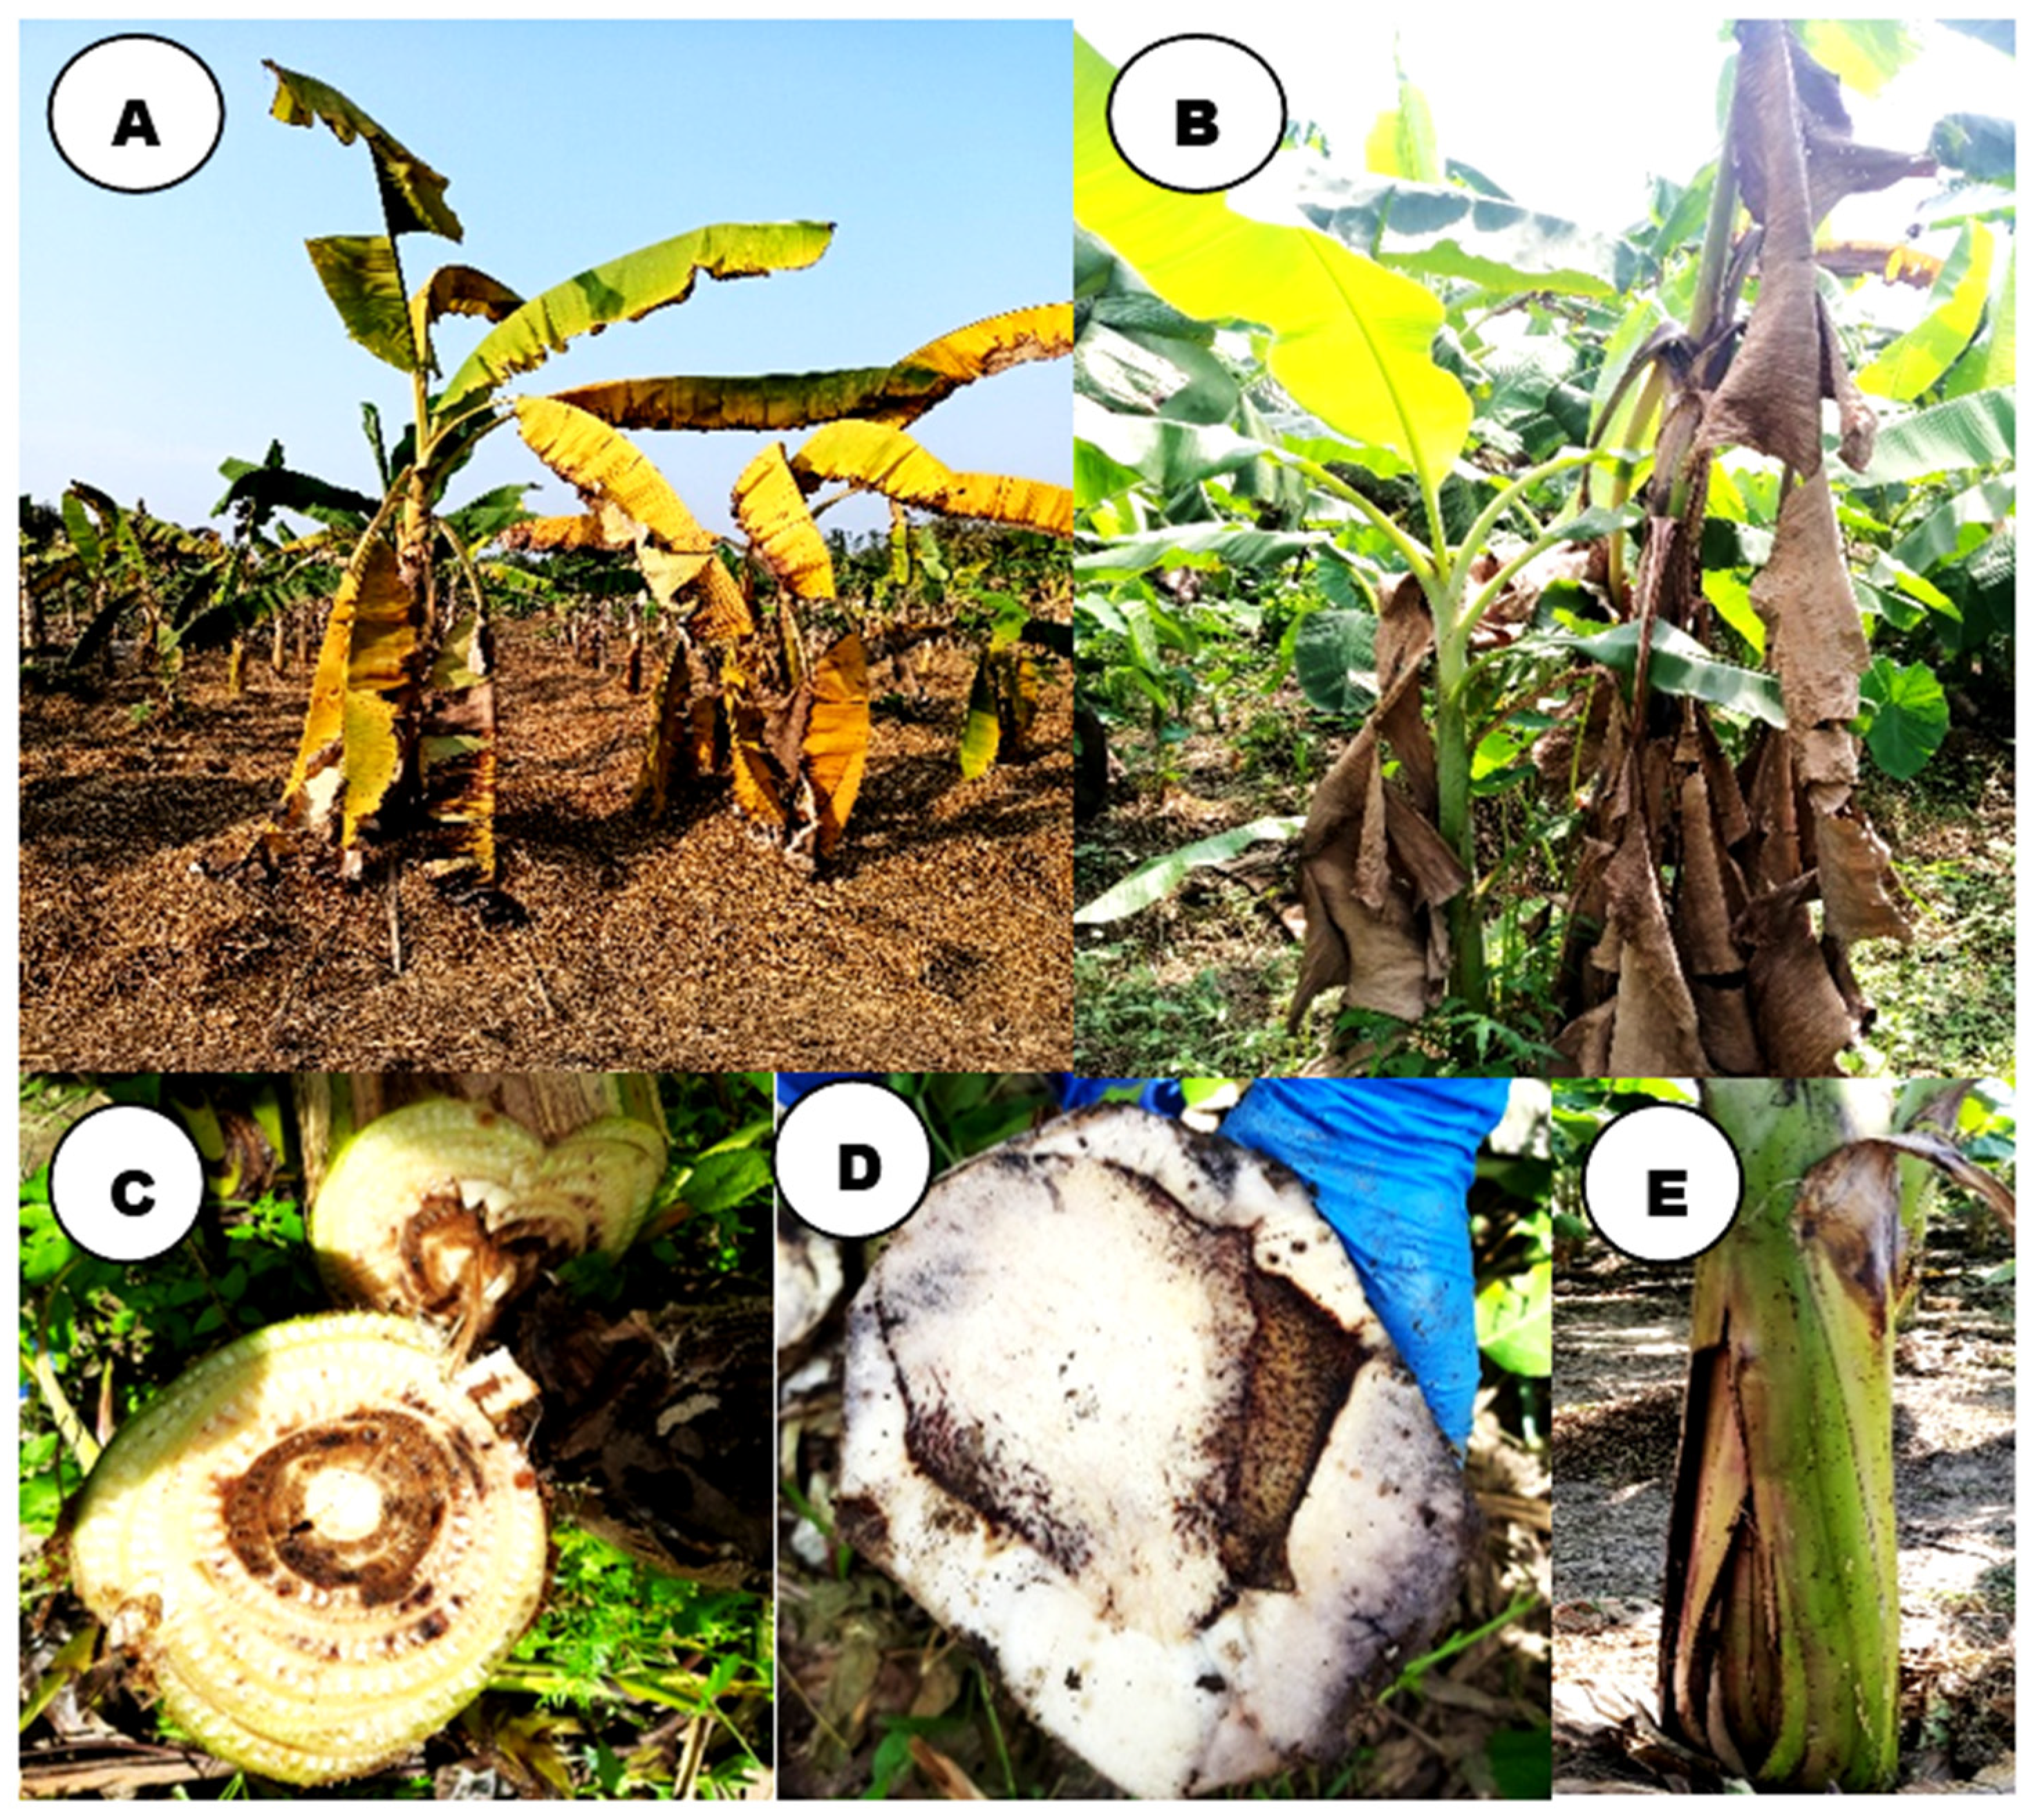
3.1. Wilt symptomatology:
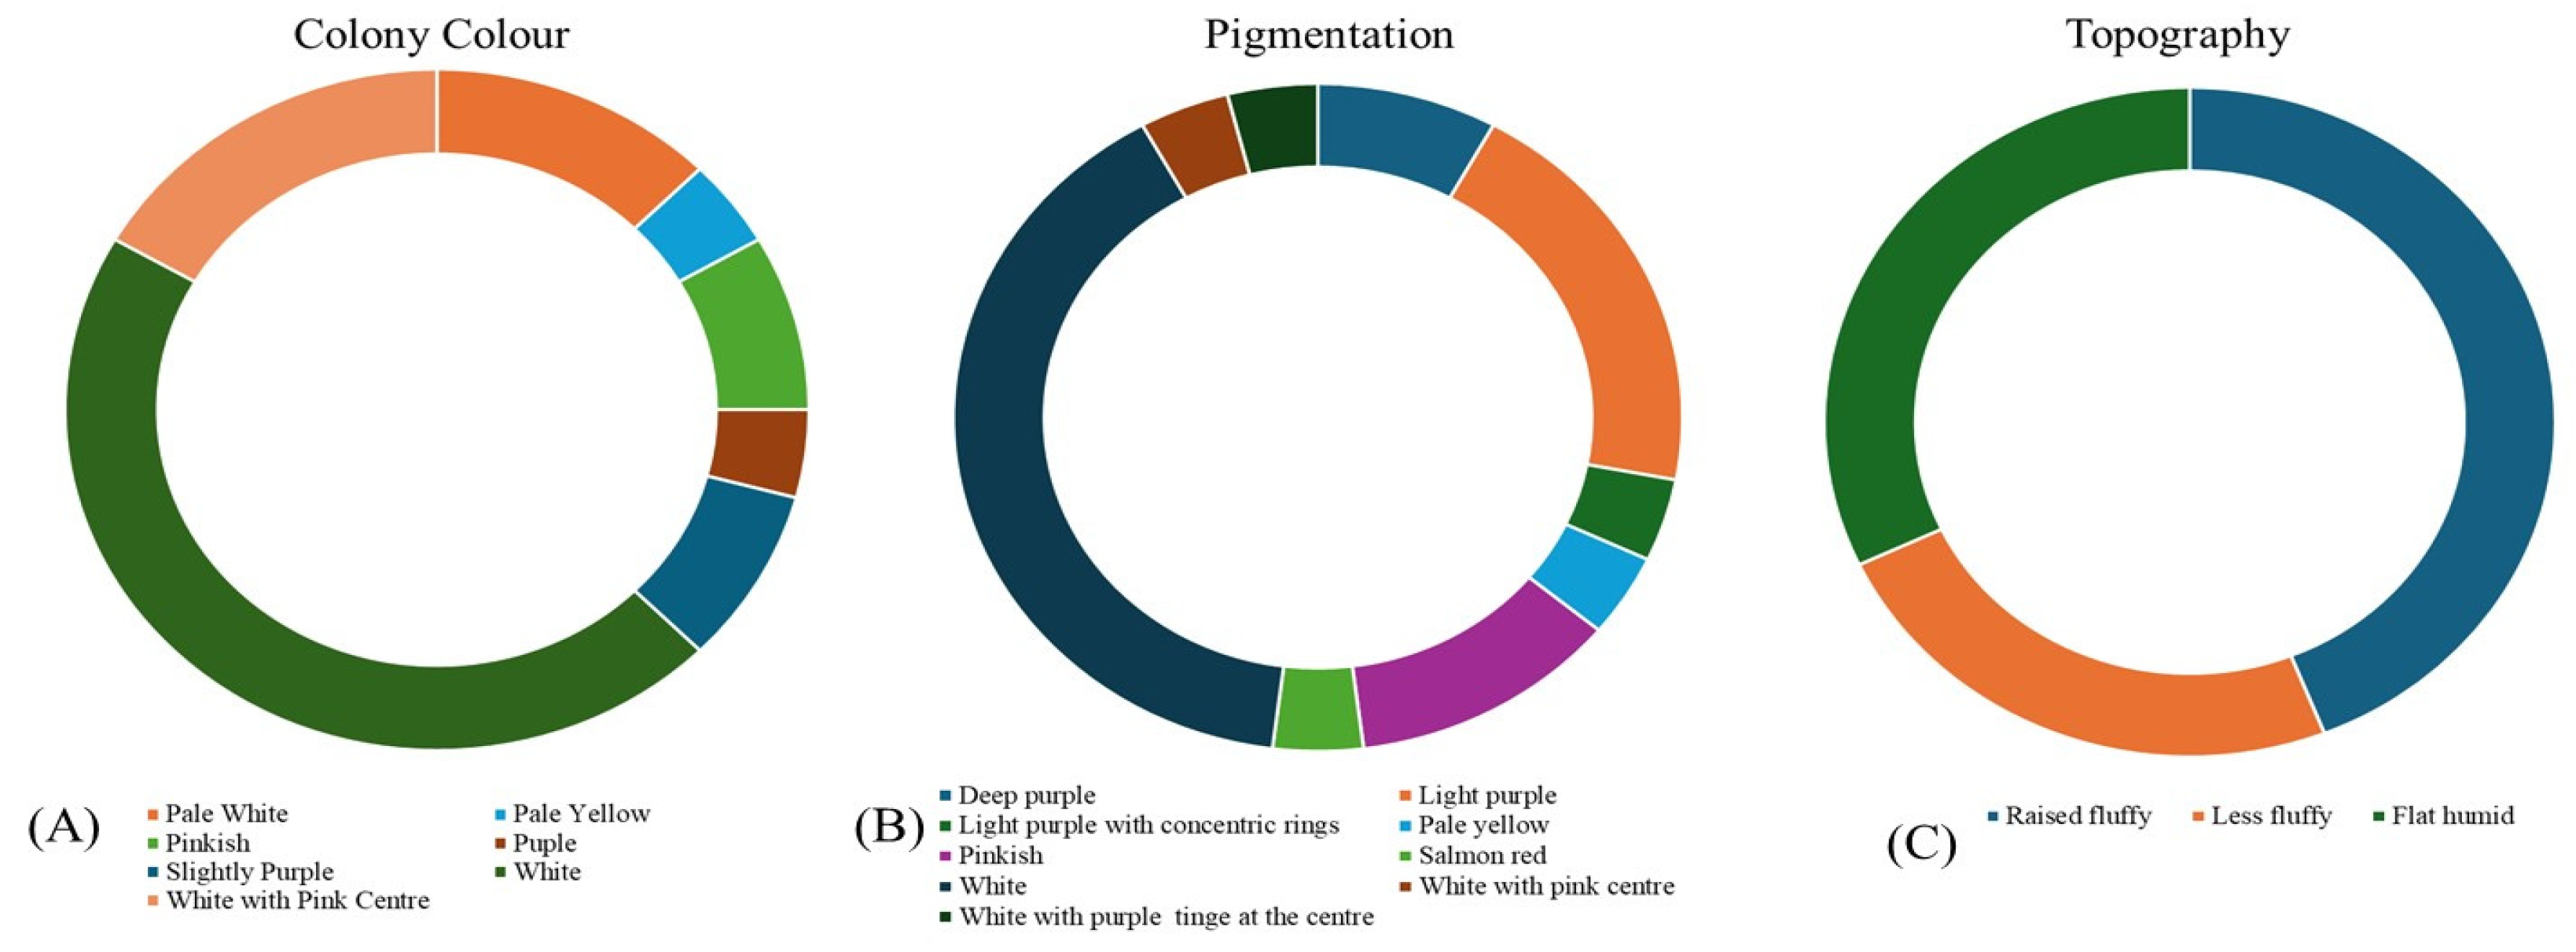
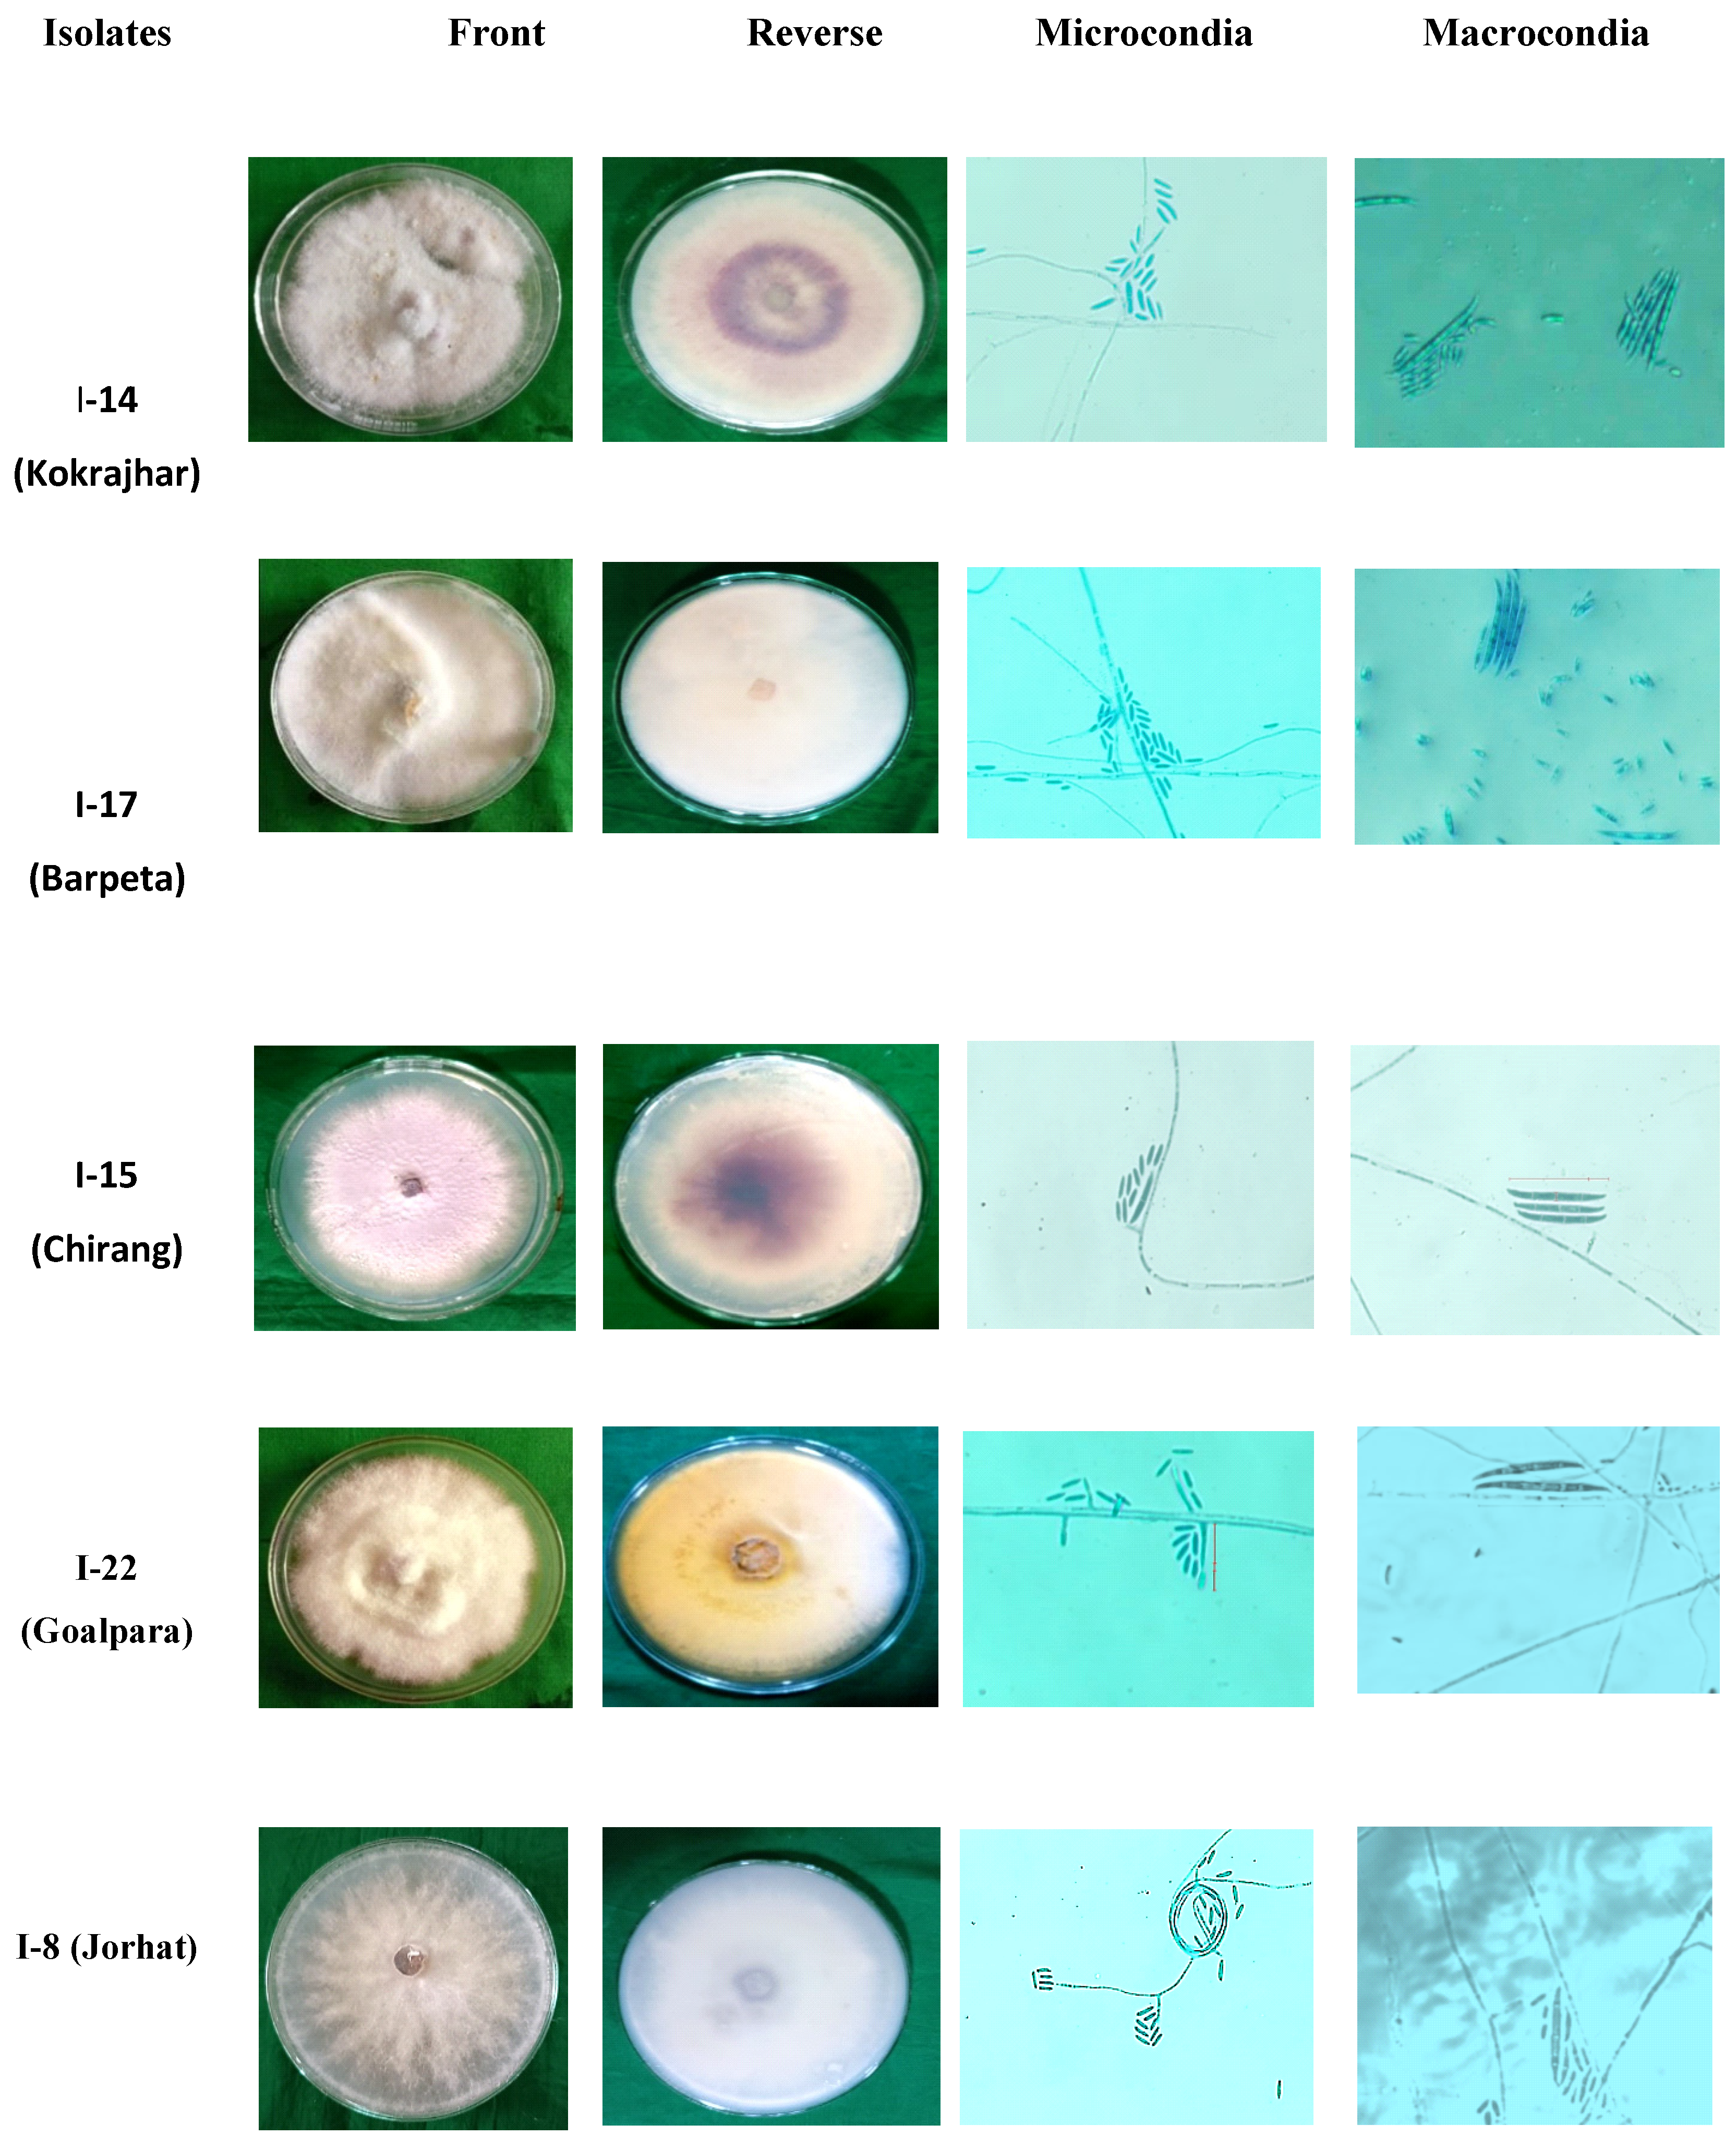
3.2. Isolation and morphological characterization of Foc isolates
3.3. Molecular identification of Foc isolates
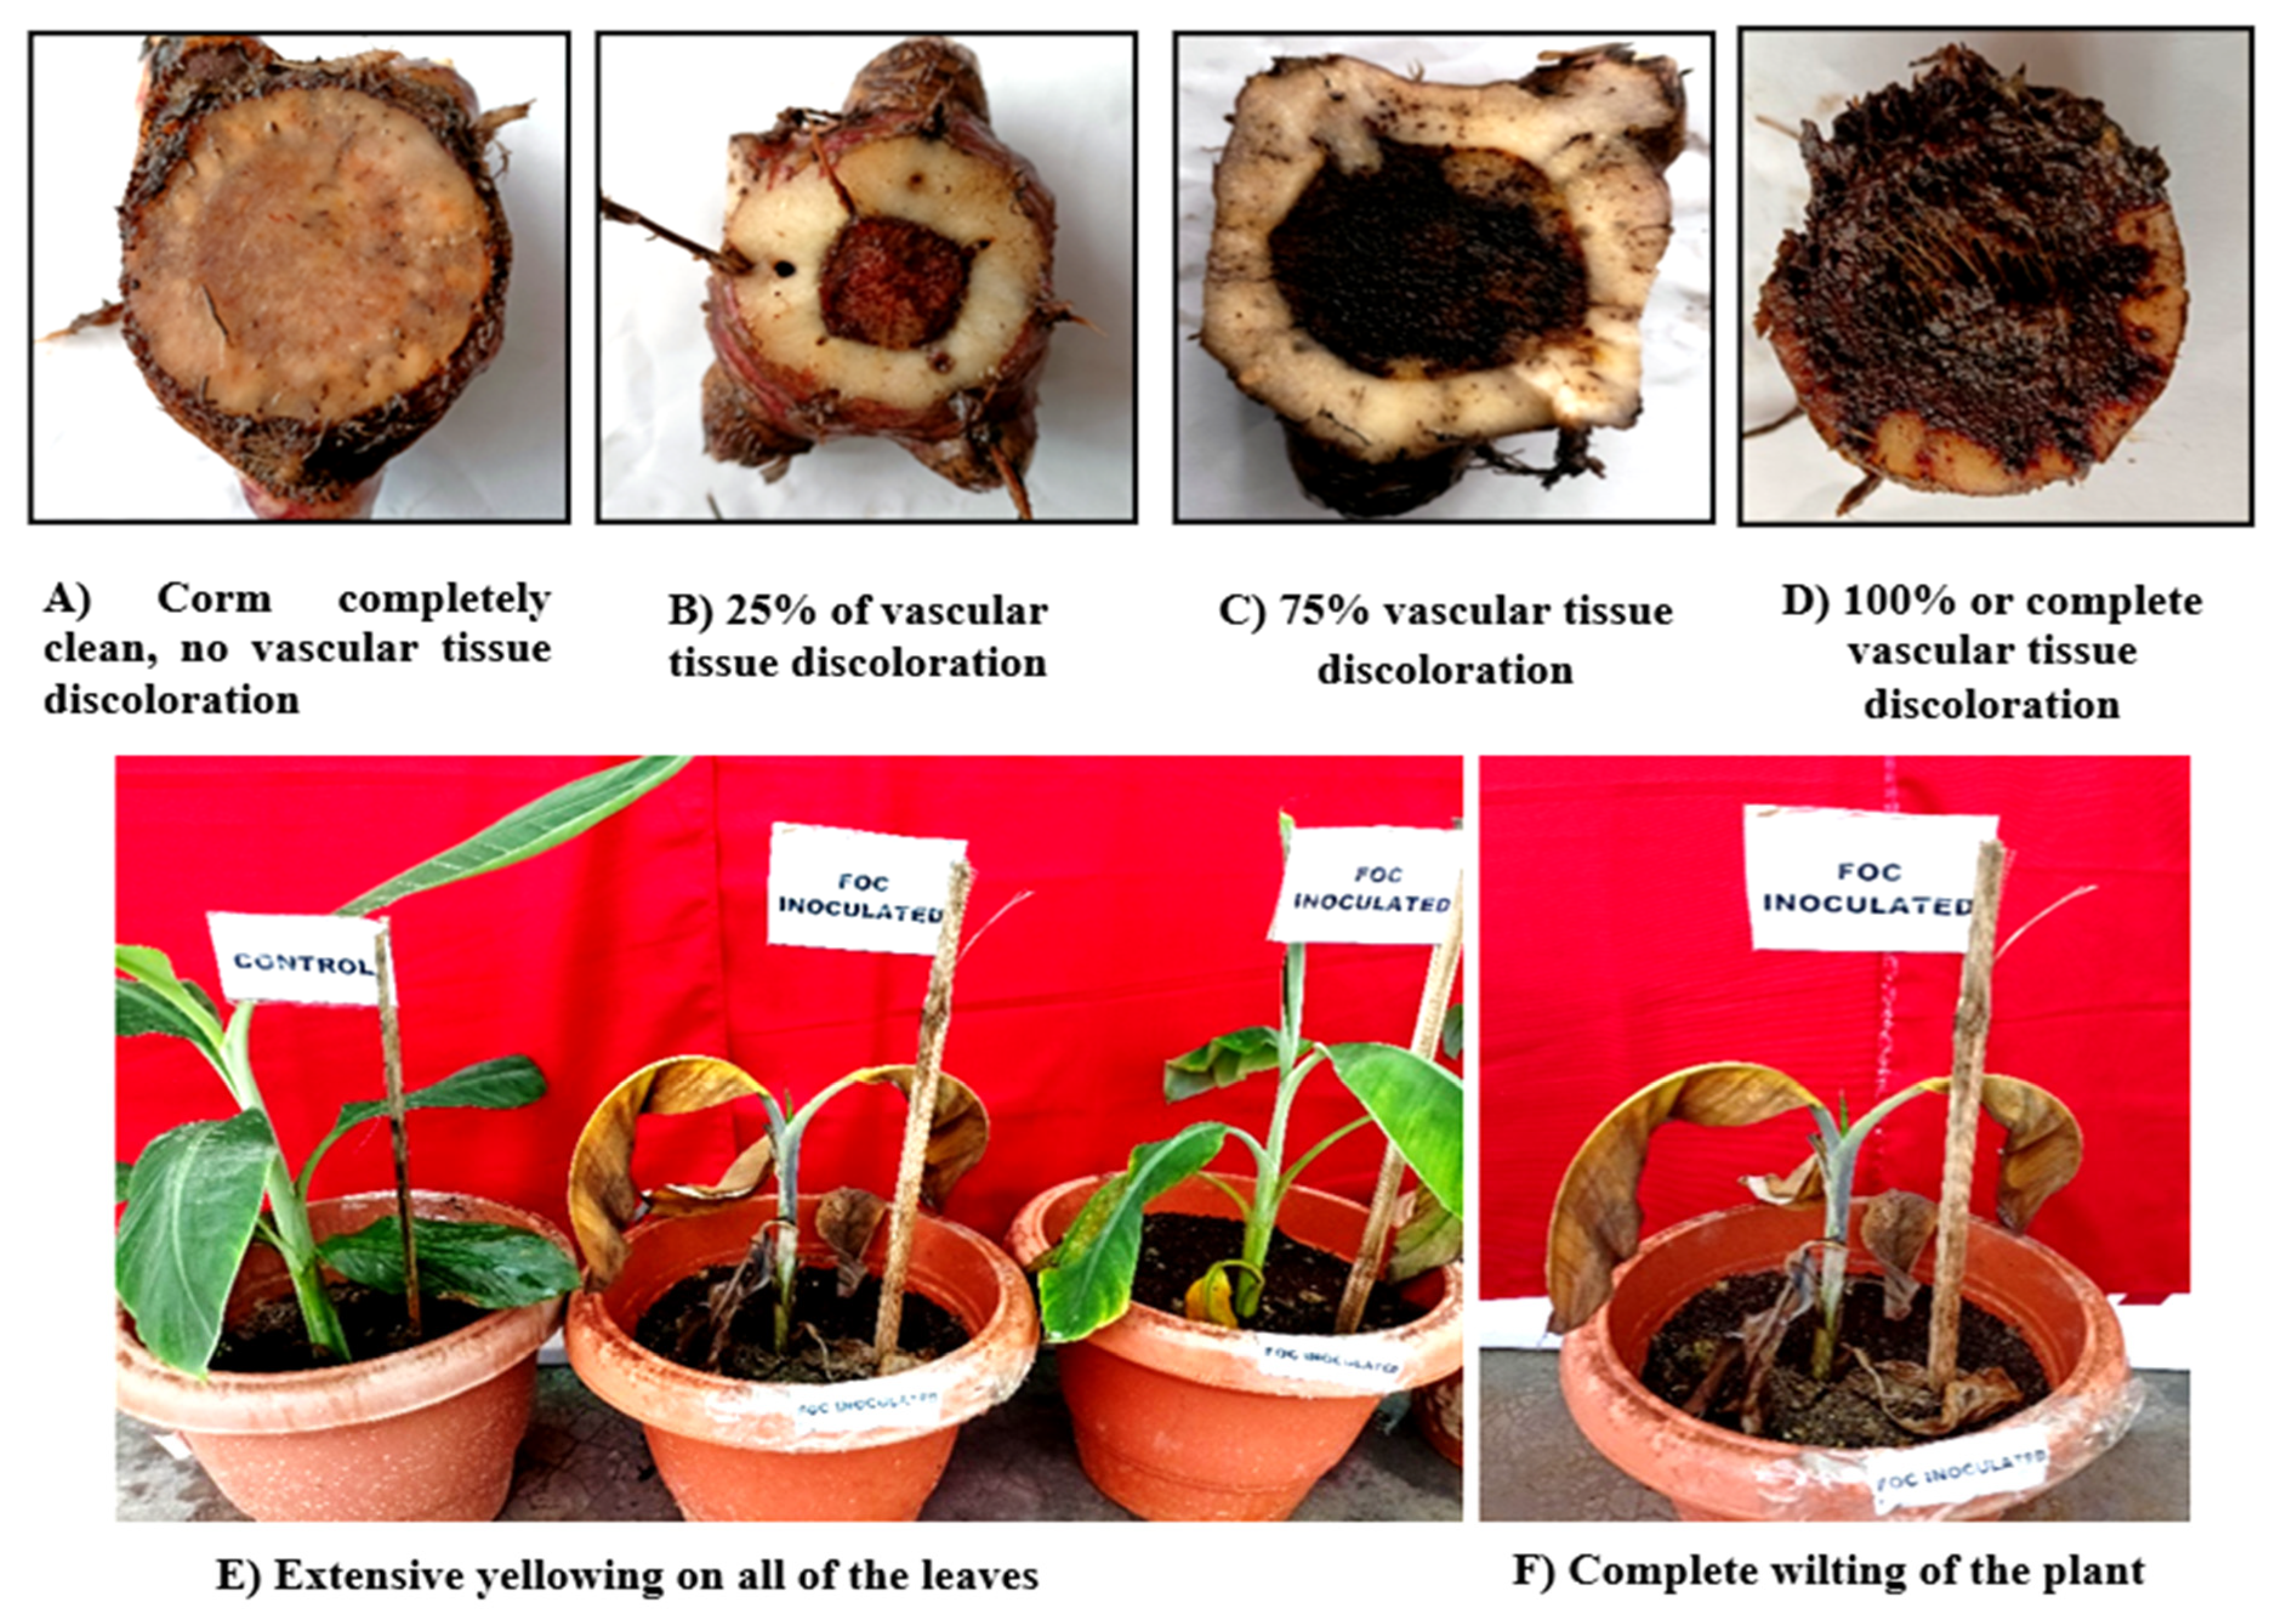
3.4. Pathogenicity of Foc isolates
3.5. Genetic diversity analysis using ISSR markers
3.6. Population structure
4. DISCUSSION
5. CONCLUSION
Supplementary Materials
Author Contributions
Funding
References
- Simmond, N.W.; Weatherup, S.T.C. Numerical taxonomy of the wild bananas (Musa), New Phytologist. 1990, 115, 567-571.
- Langhe, E. De.; Vrydaghs, L.; Maret, P.D.; Perrier, X.; Denham, T. Why Bananas Matter: An introduction to the history of banana domestication. Ethno. Res. and Appl. 2009, 7, 165–177.
- Zhang, P.; Whistler, R.L.; BeMiller, J.N.; Hamaker, B.R. Banana starch: production, physicochemical properties, and digestibility—a review. Carbo. poly. 2005, 59, 443-458.
- Sauco, V.; Robinson, J.C.; Tomer, E.; Daniells, J.W. Current situation and challenges of cultivating banana and other tropical fruits in the subtropics. Acta Hortic. 2012, 928, 19-30.
- Kamble, G.; Meenatai, A.; Singh, V.; Mishra, M.; Meghwal, K.; Prabhakar. Mass and surface modelling of green plantain banana fruit based on physical characteristics. Comput. and Electr. in Agric.2021, 186, 106194.
- Wardhan, H.; Das, S.; Gulati, A. Banana and Mango Value Chains. In: A. Gulati, K. Ganguly, H. Wardhan (eds) Agricultural Value Chains in India. India Studies in Business and Economics. Springer, Singapore. 2022.ISBN: 9789813342675,9789813342682.
- Singh, S.; Singh, N.; Kumar, V.; Datta, S.; Wani, A.B.; Singh, D.; Singh, J. Toxicity, monitoring and biodegradation of the fungicide carbendazim. Environ. Chemis. Lett.2016, 14, 317-329.
- Lassoudière, A. Le bananieretsa culture. editions Quae,2007,ISBN: 978-2-7592-0103-7.
- Langhe, E.; Vrydaghs, L.; Perrier, X.; Denham, T. Fahien reconsidered: Pleistocene exploitation of wild bananas and Holocene introduction of Musa cultivars to Sri Lanka. J. of Quarter. Sci. 2019, 1–5.
- FAOSTAT, www.faostat.fao.org,2021.
- https://oec.world.
- Thangavelu, R.; Saraswathi, M.S.; Uma, S.; Loganathan, M.; Backiyarani, S.; Durai, P.; Raj, E.E.; Marimuthu, N.; Kannan, G.; Swennen, R. Identification of sources resistant to a virulent Fusarium wilt strain (VCG 0124) infecting Cavendish bananas. Sci. reports. 2021, 11, 1-14.
- Hazarika, M.; Sarma, R.;Phukon, K.K. An analysis on area, production and productivity of banana in Assam. Agricul. Sci. digest –A Res. J. 2021, 41, 334-337.
- Anonymous (2018). Horticulture statistics at a glance. Govt. of India.
- Savani, A.K.; Bhattacharyya, A.; Baruah, A. Endophyte mediated activation of defense enzymes in banana plants pre-immunized with covert endophytes. Indian Phytopa.2020, 73, 433–441.
- Dita, M.; Barquero, M.; Heck, D.; Mizubuti,E.S.G.; Staver, C.P. Fusarium wilt of banana: Current knowledge on epidemiology and research needs toward sustainable disease management. Front. Plant Sci.2018,9, 1468.
- Deltour, P.; França, S.C.; Pereira, O.L.; Cardoso, I.; Neve, S. D.; Debode, J.; Hofte, M. Disease suppressiveness to Fusarium wilt of banana in an agroforestry system: influence of soil characteristics and plant community. Agricul. Ecosy. Environ.2017, 239, 173-181.
- Ploetz, R.C. Panama disease: A classic and destructive disease of banana. Online. Plant Health Progress.2000, 1, 1.
- Stover, R.H.; Simmonds, N.W. Bananas. 3rd Edn. London: Longmans. 1987, pp. 468.
- Ploetz, R.C. Fusarium wilt of banana, Phytopath. 2015a, 105, 1512–1521.
- Ploetz, R. C. Management of Fusarium wilt of banana: a review with special reference to tropical race 4. Crop Prot. 2015b, 73, 7–15.
- Stover,R.Fusarial wilt (Panama disease) of Bananas and other Musa species. Kew: Commonwealth Mycol. Instit.1962, pp. 177.
- Ploetz,R.C. Panama disease: An old nemesis rears its ugly head part 2. The Cavendish era and beyond.Pl. Health Prog. 2005, 23, 1–17.
- Ploetz,R.C.Fusarium wilt of banana is caused by several pathogens referred to as Fusarium oxysporum f. sp. cubense. Phytopath. 2006, 96, 653- 656.
- Basu, S.K. Report on the banana disease of Chinsurah. Quart. J. Dep. Agric. Bengal. 2011, 4, 196-198.
- Damodaran, T.; Mishra, V.K.; Jha, S.K.; Gopal, R.; Rajan, S.; Ahmed,I. First report of Fusarium wilt in banana caused by Fusarium oxysporum f. sp. cubense tropical race 4 in India. Plant Disease. 2019, 103, 1022-1022.
- Thangavelu, R.; Mostert, D.; Gopi, M.; Devi, P.G.; Padmanaban, B.; Molina, A.B.; Viljoen, A. First detection of Fusarium oxysporum f.sp. cubense tropical race 4 (TR4) on Cavandish banana in India.Euro. J. of Plant Pathol. 2019, 154, 777-786.
- Moore, N.Y.; Bentley, S. Characterization of a unique population of Fusarium oxysporum f. sp. cubense causing Fusarium wilt in Cavendish bananas at Carnarvon, Western Australia. Austral. J. of Agricul. Res. 1995,46, 167-178.
- Domsch, K.H.; Gams, W.; Anderson, T.H. Compendium of soil fungi. Volume 1. Academic Press (London) Ltd.1980.
- Nelson, P.E.; Toussoun, T.A.; Marasas, W.F.O. Fusarium species: an illustrated manual for identification. USA News.1983, 10, 38-41.
- Ploetz, R.C.; Correll, J.C. Vegetative compatibility among races of Fusarium oxysporum f. sp. cubense. Plant Dis.1988, 72, 325–328.
- Ploetz, R.C. Population biology of Fusarium oxysporum f. sp. cubense. Fusarium wilt of banana. 1990, 63-76.
- Moore,N.Y.; Pegg, K.G.; Allen, R.N.; Irwin, J.A.C. Vegetative compatibility and distribution of Fusarium oxysporum f. sp. cubense in Australia, Austral. J. of Experi. Agricul. 1993, 33, 797- 802.
- Ploetz, R.C.; Pegg, K.G. Fusarium wilt. In Diseases of banana, abaca and enset. ed D. Jones (Wallingford, UK: CABI Publishing).2000, 143- 159.
- Stover,R.H. Studies on Fusarium wilt of bananas: VIII. Differentiation of clones by cultural interaction and volatile substances. Canadian J. of Bot. 1962,40, 1467-1471.
- Koenig, R.L.; Ploetz, R.C.; Kistler, H.C.;Fusarium oxysporum f. sp. Cubenseconsists of a small number of divergent and globally distributed clonal lineages. Phytopath.1997, 87, 915-923.
- Bentley,S.; Pegg,K.G.;Dale, J.L. Genetic variation among a worldwide collection of isolates of Fusarium oxysporum f. sp. Cubenseanalysed by RAPD-PCR fingerprinting. Mycol. Res. 1995, 99, 1378-1384.
- Bentley, S.; Pegg, K. G.; Moore, N.Y.; Davis, R.D.; Buddenhagen, I.W.; Genetic variation among vegetative compatibility groups of Fusarium oxysporum f. sp. cubense analyzed by DNA fingerprinting. Phytopath. 1998, 88, 1283-1293.
- Groenewald, S.; Van Den Berg N.; Marasas, W.F.O.; Viljoen, A. Application of AFLP in Genetic Analysis of Fusarium oxysporum f. sp. cubense. In Papers 1st. International, 2004.
- Das, A.; Venkataramana, M.; Chandranayaka, S.; Murali, H.S.; Batra,H.V. Molecular characterization of Fusarium oxysporum f. sp. cubense isolates from banana. Pest Mang. Horticul. Ecosys.2012, 18, 171-178.
- Li, M.H.; Yu, X.T.; Wang, H.F.; Zhou, J.N.; Xi, P.G.; Jiang, Z.D. Rapid detection and identification of Fusarium oxysporum f. sp. cubense race 1 and race 4. Scientia Agricult. Sinica. 2012, 45, 3971–3979.
- Dita, M.A.; Waalwijk, C.; Buddenhagen, I.W.; Souza, M.T.; Kema, G.H.I.; A molecular diagnostic for tropical race 4 of the banana fusarium wilt pathogen. Plant Pathology. 2010, 59, 348-357.
- Damodaran, T.; Rajan, S; Muthukumar, M.; Gopal, R.; Yadav, K.; Kumar, S.; Jha, S.K. Biological management of banana Fusarium wilt caused by Fusarium oxysporum f. sp. cubense tropical race 4 using antagonistic fungal isolate CSR-T-3 (Trichoderma reesei). Fronti.in micro.2020, 11, 595845.
- Carlier, J.; Waele, D.; Escalant, J. Global Evaluation of Musa Germplasm for Resistance to Fusarium wilt, Mycosphaerella Leaf Spot Diseases and Nematodes; INIBAP; Bioversity International: Rome, Italy, 2002.
- Thangavelu, R.; Muthu, K.K.; Devi,P.G.; Mustafa, M.M.; Genetic diversity of Fusarium oxysporum f.sp. cubense isolates (Foc) of India by inter simple sequence repeats (ISSR) analysis. Mol.Biotechnol. 2012, 51, 203–211.
- Nei,M.; Li, W.H. Mathematical model for studying genetic variation in terms of restriction endonucleases. Proc. Natl. Acad. Sci. USA. 1979, 76, 5269–5273.
- Lewontin, R.C. "The Apportionment of Human Diversity". Evolutionary Biol. SpringerUS.1972, 6, pp. 381–398. ISBN 978-1-4684-9065-7. S2CID 21095796.
- Yeh, F.C.; Yang, R.C.; Boyle, T. POPGENE—ver. 1.32 (32 bit): a microsoft windows-based freeware for population genetic analysis.1997. Available from http://www.ualberta.ca/~fcyeh/. Accessed 15 Dec 2011.
- Peakall, R.; Smouse, P.E.GenAlEx 6.5: genetic analysis in Excel. Population genetic software for teaching and research—an update. Bioinfo.2012, 28, 2537–2539.
- Botstein, D.; White, R.L.; Skolnick, M.; Davis, R.W. Construction of a genetic linkage map in man using restriction fragment length polymorphism. Am. J. Hum. Genet.1980, 32, 314–331.
- Ploetz, R.C. Fusarium Wilt of Banana. Phytopatho.2015, 105, 1512-1521.
- Perez Vicente, L.; Dita, M.A.;Parte, E.M.I. Technical Manual: Prevention and diagnostic of Fusarium wilt (Panama disease) of banana caused by Fusarium oxysporum f.sp. cubense Tropical Race 4 (TR4). Proceedings of Regional workshop on the Diagnosis of Fusarium wilt (Panama disease) caused by Fusarium oxysporum f.sp. cubense. 2014, pp. 74.
- Altschul, S.F.; Gish, W.; Miller, W.; Myers, E.W.; Lipman, D.J. Basic local alignment search tool. J. of mol. Bol.1990, 215, 403-410.
- Wu, K.L.; Chen, W.Z.; Shuai, Y.A.N.G.; Ya,W. E. N.; Zheng, Y.R.;Anjago, W.M.; Wang, Z.H. Isolation and identification of Fusarium oxysporum f. sp. cubense in Fujian Province, China. J of Integ. Agricul. 2019, 18, 1905-1913.
- Pant,B.; Bai,T.; Du,C. Baidya, S.; Magar,P.B.; Manandhar, S.; Shrestha, J.; Dita,M.;Rouard, M.; Fu,G.; Zheng, S.J. Molecular Diagnosis and Vegetative Compatibility Group Analysis of Fusarium Wilt of Banana in Nepal. J. of Fungi. 2023,9, 208.
- Jamil, F.N.; Hashim, A.M.; Yusof, M.T.; Saidi, N.B. Analysis of soil bacterial communities and physicochemical properties associated with Fusarium wilt disease of banana in Malaysia. Sci. Rep.2022, 12, 999.
- Yi, U.; Zaharah, S.S.; Ismail, S.I; Musa, M.H. Effect of Aqueous Neem Leaf Extracts in Controlling Fusarium Wilt, Soil Physicochemical Properties and Growth Performance of Banana (Musa spp.) 2021. 13, 22, 12335.
- Oyesigye, E.; Tinzara, W.; Karamura, G.; Cosmas, W. Distribution and farmers’ knowledge on Fusarium wilt (Race 1) in cropping systems of Uganda. Afr. J. of Pl. Sci. 2021, 15, 277-287.
- Thangavelu, R.; Edwinraj, E.; Gopi, M.; Pushpakanth, P.; Sharmila, K.; Prabaharan, M.; Loganathan, M.; Uma, S. Development of PCR-Based Race-Specific Markers for Differentiation of Indian Fusarium oxysporum f. sp. cubense, the Causal Agent of Fusarium Wilt in Banana, J. of Fungi (Basel), 2022,8, 53.
- Ulilalbab, A.R.; Widinugraheni, S.; Masanto, M.; Subandiyah, S.; Wibowo, A. Expression of SIX1b and SIX1c effector genes and banana resistance genes during Foc TR4 infection on banana cultivars. Biodiv. J. of Bol. Div. 2022, 23.
- Yuan, X.; Hong, S.; Xiong, W.; Raza, W.; Shen, Z.; Wang, B.; Li, R.; Ruan, Y.; Shen, Q.; Dini-Andreote, F. Development of fungal-mediated soil suppressiveness against Fusarium wilt disease via plant residue manipulation. Microbiome. 2021, 9,200.
- Dong, X.; Ling, N.; Wang, M.; Shen, Q.; Guo, S. Fusaric acid is a crucial factor in the disturbance of leaf water imbalance in Fusarium-infected banana plants. Pl. Phy.and Bioche.2012, 60, 171-179.
- Dong, X.; Ling, N.; Wang, N.; Shen, Q.; Guo, S.; Fusaric Acid accelerates the senescence of leaf in banana when infected by Fusarium. World J. of Microbio. and Biotech.2014,30, 1399-1408.
- Effendi, Y.;Pambudi, A.; Pancoro, A. Metagenomic analysis of Fusarium oxysporum f.sp. cubense-infected soil in banana plantation, Sukabumi, Indonesia. Biodiversitas. 2019, 20, 1939-1945.
- Ding, Z.; Li, M.; Sun, F.; Xi, P.; Sun, L.; Zhang, L.; Jiang, Z. Mitogen-Activated Protein Kinases Are Associated with the Regulation of Physiological Traits and Virulence in Fusarium oxysporum f. sp. cubense. PLOS ONE. 2015, 10, e0122634.
- Roncero, M.I.;Di Pietro, A.; Ruiz-Roldán, M.C.; Huertas-González, M.D.; Garcia-Maceira, F.I.; Méglecz, E.; Jiménez, A.;Caracuel, Z.; Sancho-Zapatero, R.; Hera, C.; Gómez-Gómez, E.; Ruiz-Rubio, M.; González-Verdejo, C.I.; Páez, M.J. Role of cell wall-degrading enzymes in pathogenicity of Fusarium oxysporum. Rev Iberoam Micol. 2000, 17, 47-53.
- Zhang,L.; Yan,J.; Fu,Z.; Shi,W.;Ninkuu,V.; Li, G.; Yang, X.; Zeng, H. FoEG1, a secreted glycoside hydrolase family 12 protein from Fusarium oxysporum, triggers cell death and modulates plant immunity. Mol. plant Pathol. 2021, 22, 522-538.
- Perez-Vicente, L. Fusarium wilt (Panama disease) of bananas: an updating review of the current knowledge on the disease and its causal agent. In. Memorias de XV Reunion Internacional de ACORBAT (Oaxaca, MX). 2004, pp. 1-14.
- Nel, B.; Steinberg,C.; Labuschagne, N.; Viljoen, A. Evaluation of fungicides and sterilants for potential application in the management of Fusarium wilt of banana. Crop Prot.2007, 26, 697-705.
- Nel, B.; Steinberg, C.; Labuschagne, N.; Viljoen, A. The potential of nonpathogenic Fusarium oxysporum and other biological control organisms for suppressing fusarium wilt of banana. Plant Pathol.2006, 55, 217-223.
- Mongkutkarn, U.; Soytong, K.Isolation, identification and pathogenicity test from Fusarium oxysporum f. sp. cubense causing banana wilt. Int. J. of Agri. Technol.2012, 12, 2181.
- Li, M.; Xie, L.; Wang, M.; Lin, Y.; Zhong, J.; Kong, G.; Xi, P.; Li, H.; Ma, L.; Jiang, Z.FoQDE2-dependent milRNA promotes Fusarium oxysporumf. sp. cubense virulence by silencing a glycosyl hydrolase coding gene expression. PLoSPathog. 2022, 18, e1010157.
- Meldrum,R.A.; Fraser-Smith, S.; Tran-Nguyen, L.T.T.; Daly, A.M.; Aitken, E.A.B. Presence of putative pathogenicity genes in isolates of Fusarium oxysporum f. sp.cubensefrom Australia. Australasian Plant Pathol.2012, 41, 551-557.
- San, E.J.; Su, H.J. Rapid method for determining differential pathogenicity of Fusarium oxysporum f. sp. cubense using banana plantlets. Trop. Agri.1984, 61.
- Aguilar-Hawod, K.G.I.; Cueva, F.M.D.L.;Cumagun, C.J.R. Genetic diversity of Fusarium oxysporum f sp. cubense causing panama wilt of banana in the philippines. Pathogens. 2020, 9, 32.
- Cruz-Martín, M; Leyva, L.; Acosta-Suárez, M.; Pichardo, T.; Bermúdez-Caraballoso, I.; Alvarado-Capó, Y. Antifungal activity of Bacillus amyloliquefaciens against Fusarium oxysporum f. sp. cubense race 1. Agronomía Mesoamericana, 2021, 32, ISSN: 2215-3608.
- Lonsdale, D.; Gibbs, J. Effects of climate change on fungal diseases of trees. British Mycological Society Symposium Series. Cambridge University Press. 1996, pp. 1–19.
- Chittarath, K.; Nguyen, C.H.; Bailey, W.C.; Zheng, S.J.; Mostert, D.; Viljoen, A.;Tazuba, A.F.; Ocimati, W.; Kearsley, E.; Chi, T.Y.; Tho, N.T.; Hung, N.T.; Dita, M.; Shah, T. Karanja, M.; Mahuku, G.; Blomme,G. Geographical Distribution and Genetic Diversity of the Banana Fusarium Wilt Fungus in Laos and Vietnam. J. of Fungi (Basel), 2022, 8, 46.
- Summerell, B.A.; Laurence, M.H.; Liew, E.C.; Leslie, J.F. Biogeography and phylogeography of Fusarium: a review. Fungal Diversity, 2010, 44, 3-13.
- Sangalang, A.E.; Backhouse, D.; Burgess, L.W. Survival and growth in culture of four Fusarium species in relation to occurrence in soils from hot climatic regions. Mycol. Res. 1995, 99, 529-533.
- Hibar, K.; Daami-Remadi, M.; Jabnoun-Khiareddine, H.; Mahjoub, El.M.; Temperature Effect on Mycelial Growth and on Disease Incidence of Fusarium oxysporumf.sp. radices lycopersici. Plant Pathol. J.2006, 5, 233-238.
- Nazari, L.; Pattori, E.; Terzi, V.;Morcia, C.; Rossi, V. Influence of temperature on infection, growth, and mycotoxin production by Fusarium langsethiaeand F. sporotrichioides in durum wheat. Food Microbiology. 2014, 39, 19-26.
- Kaur, S.; Barakat, R.; Kaur, J.; Epstein, L. The effect of temperature on disease severity and growth of Fusarium oxysporum f. sp. apii races 2 and 4 in celery. Phytopath. 2022, 112, 364–372.
- Cruz, D.R.; Leandro,L.F.S.; Munkvold,G.P. Effects of Temperature and pH on Fusarium oxysporum and Soybean Seedling Disease. Plant Dis.103, 2019, 3234-3243. [CrossRef]
- Damodaran, T.; Rajan, S.; Mishra,V.K; Jha, S.K.; Gopal,R.; Ahmad,I. First report of Fusarium wilt in banana caused by Fusarium oxysporum f. sp. cubense tropical race 4 in India. Plant Dis. 2018, 103,10-22.
- Abdel-Mawgood,A.L. DNA based techniques for studying genetic diversity. Gen. div. in micro. 2012,95-122.
- Leong, S.K.; Latiffah,Z.; Baharuddin,S. Genetic diversity of Fusarium oxysporum f. sp. cubenseisolates from Malaysia. Afr. J. of Microb. and Res.2010, 4, 1026-1037.
- Sudisha, J.; Kumar,S.A.; Thakur, R.P.; Rao,V.P.; Shetty,H.S.Molecular characterization of Sclerosporagraminicola, the incitant of pearl millet downy mildew using ISSR markers. J. of phytopath. 2009, 157, 748-755.
- Qi, Y.; Xie, Y.; Zhang; Pu,J.; Zhang, H.; Huang, S.; Zhang,H. Molecular and pathogenic variation identified among isolates of Corynesporacassiicola. Mol. biotechnol. 2009, 41, 145-151.

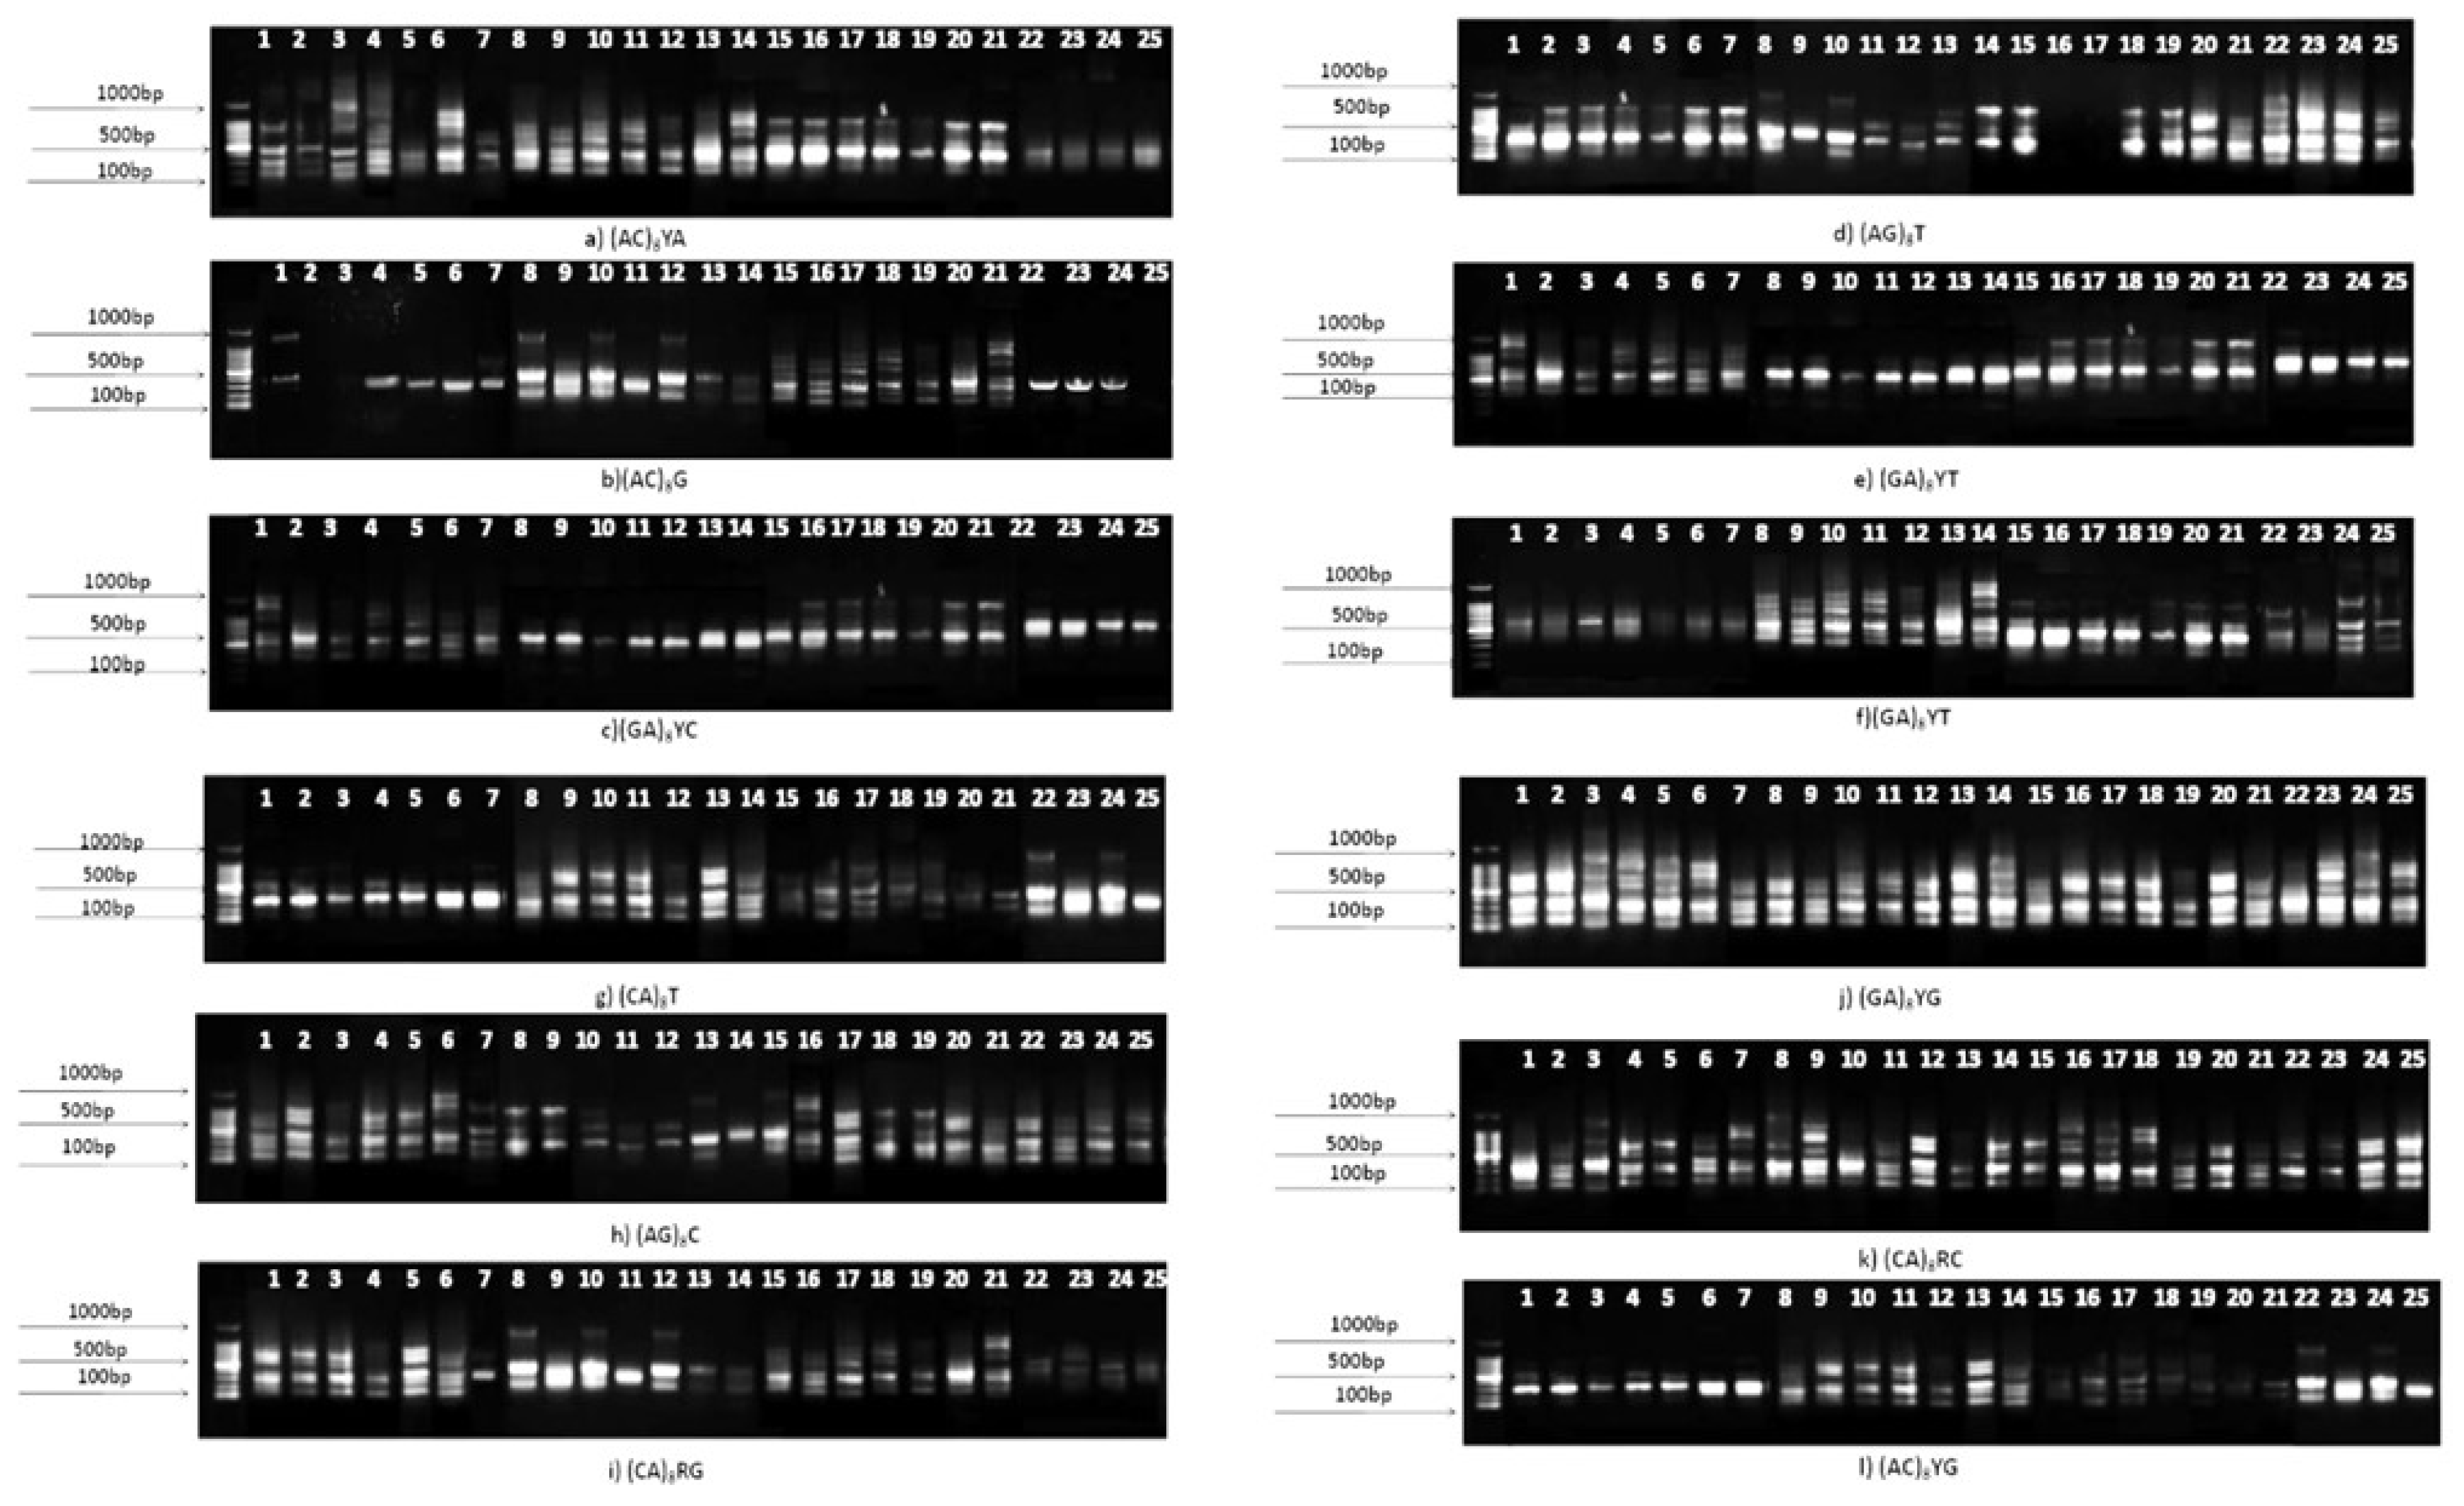
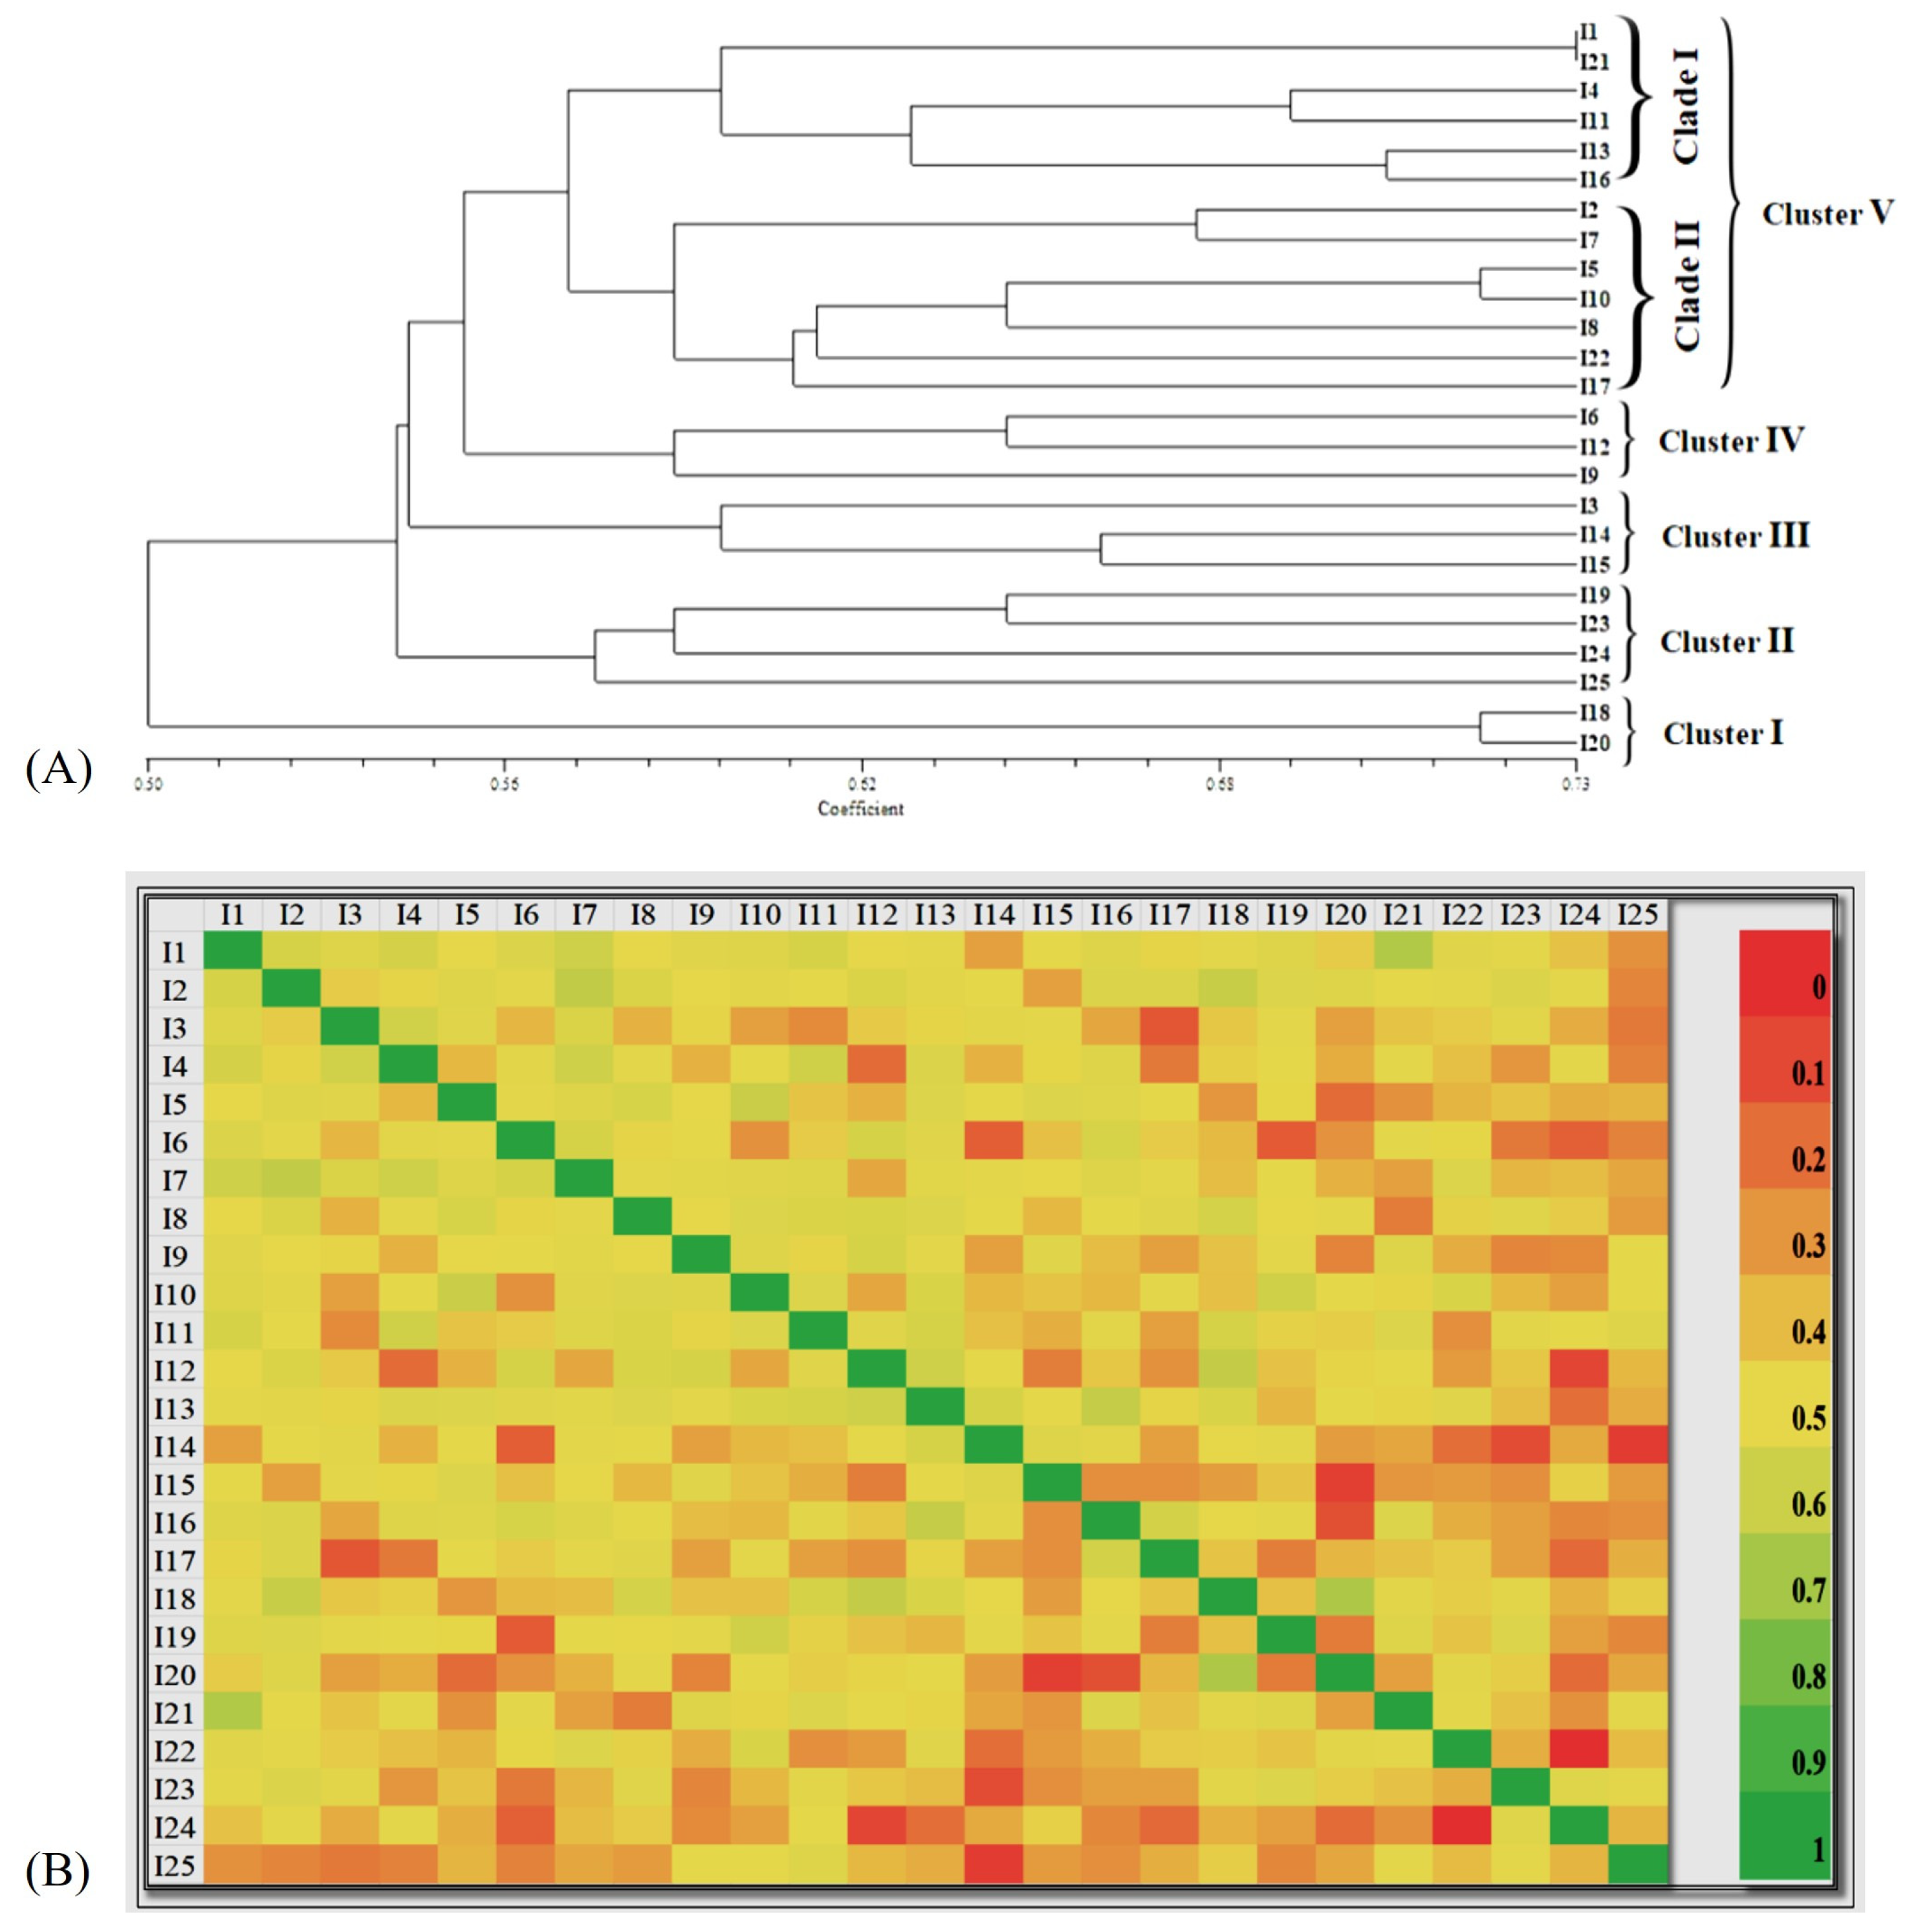
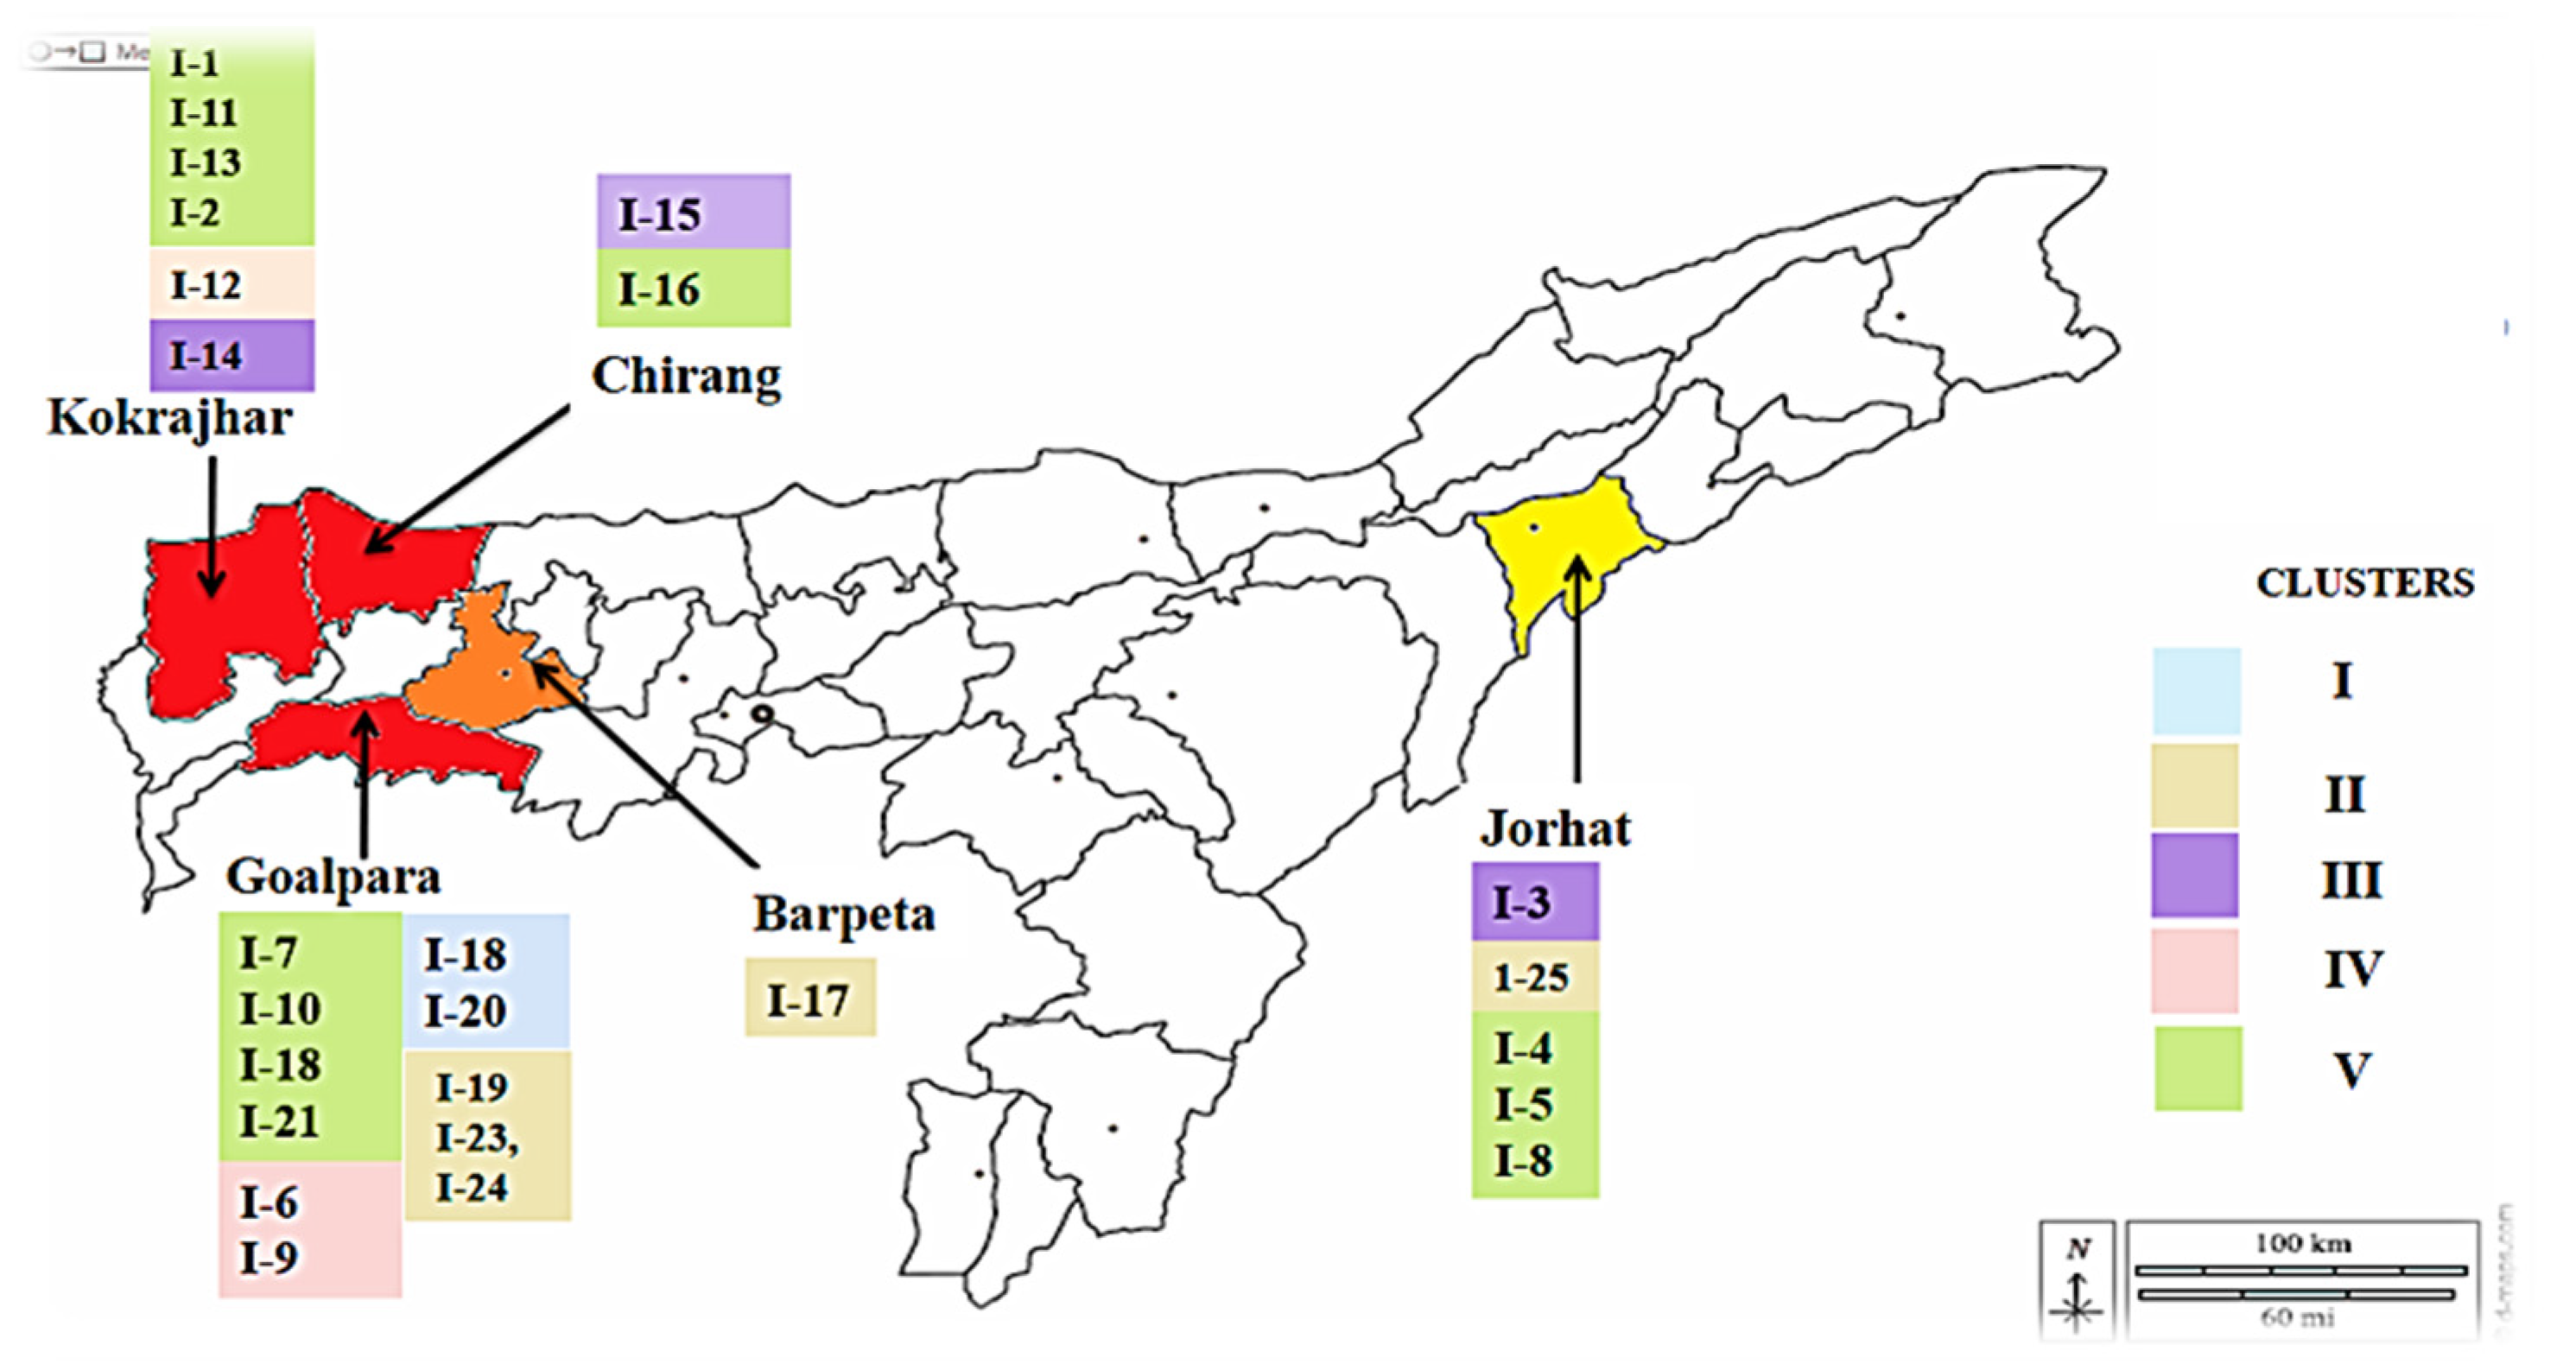
| Sl.No | Sample code | Locations | Latitude | Longitude | PDI (%) |
|---|---|---|---|---|---|
| 1. | I-1 (LBVZ) | Lakriguri, Gossaigaon, Assam, India | 26.597429˚N | 89.927368˚E | 46.00 |
| 2. | I-2 (LBVZ) | Khoksaguri-II, Gossaigaon, Asam, India | 26.50′76′′96˚N | 89.898279˚E | 76.00 |
| 3. | I-3 (UBVZ) | Horticulture experimental Farm, AAU, Jorhat, Assam,India | 26.726433˚N | 94.2046˚E | 18.00 |
| 4. | I-4 (UBVZ) | DakhinHatichungi, Jorhat, Assam, India | 26.67404˚N | 94.190131˚E | 12.00 |
| 5. | I-5 (UBVZ) | Assam Agricultural University, Jorhat, Assam, India | 26.726439˚N | 94.2021˚E | 20.00 |
| 6. | I-6 (LBVZ) | Dudhnoi, Assam,Assam, India | 25.975957˚N | 90.81605˚E | 31.00 |
| 7. | I-7 (LBVZ) | Fafal, Dudhnoi, Assam, India | 25.97548˚N | 90.815983˚E | 54.00 |
| 8. | I-8 (UBVZ) | Gohain Gaon, Jorhat, Assam, India | 26.481931°N | 94.162094°E | 17.00 |
| 9. | I-9 (LBVZ) | Dhanubhanga, Goalpara, Assam, India | 25.972059˚N | 90.980104˚E | 35.00 |
| 10. | I-10 (LBVZ) | Mandangpt-II, Assam, India | 25.940924˚N | 90.966416˚E | 29.00 |
| 11. | I-11(LBVZ) | BajugaonNo.1, Gossaigaon, Assam, India | 26.491766˚N | 89.899861˚E | 64.00 |
| 12. | I-12 (LBVZ) | Bajugaon, No1, Gossaigaon, Assam, India | 26.490674˚N | 89.899704˚E | 38.00 |
| 13. | I-13 (LBVZ) | BajugaonNo.2, Gossaigaon, Assam, India | 26.495045˚N | 89.903236˚E | 39.00 |
| 14. | I-14 (LBVZ) | BajugaonNo.3,Gossaigaon,Assam, India | 26.496353˚N | 89.902717˚E | 46.00 |
| 15. | I-15 (LBVZ) | Chirang, Assam, India | 26.545864˚N | 90.548317˚E | 29.00 |
| 16. | I-16 (LBVZ) | Chirang, Assam, India | 26.555215˚N | 90.527732˚E | 38.00 |
| 17. | I-17 (LBVZ) | Sulikata, Barpeta, Assam, India | 26.556428˚N | 90.848494˚E | 26.00 |
| 18. | I-18 (LBVZ) | Dahela, Goalpara, Assam, India | 26.030963˚N | 90.74946˚E | 22.00 |
| 19. | I-19 (LBVZ) | Karkashi, Goalpara, Assam, India | 26.029343˚N | 90.74946˚E | 31.00 |
| 20. | I-20 (LBVZ) | Dahela, Goalpara, Assam, India | 26.033461˚N | 90.747591˚E | 47.00 |
| 21. | I-21(LBVZ) | Karkashi, Goalpara, Assam, India | 26.034834˚N | 90.737234˚E | 19.00 |
| 22. | I-22 (LBVZ) | Kharamedhipara, Goalpara, Assam, India | 26.001823˚N | 90.794572˚E | 41.00 |
| 23. | I-23 (LBVZ) | Kharamedhipara, Assam, India | 26.001841˚N | 90.794601E | 30.00 |
| 24. | I-24 (LBVZ) | Mandang, Goalpara, Assam, India | 25.941226˚N | 90.966125˚E | 27.00 |
| 25. | I-25 (UBVZ) | AAU, Jorhat, Assam,India | 26.726433˚N | 94.2046˚E | 8.00 |
| Sl. No. | Primers | Sequence (5’-3’) | Primer length(bp) | Annealing temperature (°c) |
|---|---|---|---|---|
| 1. | (AC)8YA | ACACACACACACACACYA | 18 | 50 |
| 2. | (AC)8G | ACACACACACACACACG | 17 | 50 |
| 3. | (GA)8YC | GAGAGAGAGAGAGAGAYC | 18 | 50 |
| 4. | (AG)8T | AGAGAGAGAGAGAGAGT | 17 | 50 |
| 5. | (GA)8YT | GAGAGAGAGAGAGAGAYT | 18 | 52 |
| 6. | (GA)8YT | AGAGAGAGAGAGAGAGYT | 18 | 52 |
| 7. | (CA)8T | CACACACACACACACAT | 17 | 52 |
| 8. | (AG)8C | AGAGAGAGAGAGAGAGC | 18 | 52 |
| 9. | (CA)8RG | CACACACACACACACARG | 18 | 48 |
| 10. | (GA)8YG | GAGAGAGAGAGAGAGAYG | 18 | 48 |
| 11. | (CA)8RC | CACACACACACACACARC | 18 | 48 |
| 12. | (AC)8YG | ACACACACACACACACYG | 18 | 48 |
| Sl.No. | Isolates | Colony colour | Topography/Texture of mycelia | Margin | Shape | Pigmentation |
|---|---|---|---|---|---|---|
| 1. | I-1 | White | Abundant Raised fluffy cottony | Smooth | Circular | White |
| 2. | I-2 | White with pink centre | Flat humid | Smooth | Circular | Light purple |
| 3. | I-3 | Light purple | Raised fluffy | Smooth | Circular | Deep purple |
| 4. | I-4 | White | Flat humid | Irregular | Circular | White |
| 5. | I-5 | White with pink centre | Raised fluffy | Smooth | Circular | Light purple |
| 6. | I-6 | Pinkish | Less fluffy | Smooth | Irregular | Light purple |
| 7. | I-7 | White | Flat humid | Smooth | Circular | White |
| 8. | I-8 | Pale white | Flat humid | Smooth | Circular | White |
| 9. | I-9 | Purple | Flat humid | Smooth | Irregular | Deep purple |
| 10. | I-10 | White with pink centre | Raised fluffy | Smooth | Circular | Light purple |
| 11. | I-11 | White | Flat humid | Smooth | Circular | White with purple centre |
| 12. | I-12 | White | Less fluffy | Irregular | Circular | White with purple centre |
| 13. | I-13 | Pinkish | Raised fluffy | Smooth | Irregular | Salmon red |
| 14. | I-14 | White | Raised fluffy | Smooth | Circular | Light purple with concentric rings |
| 15. | I-15 | Slightly purple | Less fluffy | Smooth | Circular | Light purple |
| 16. | I-16 | White | Less fluffy | Irregular | Circular | White |
| 17. | I-17 | Pale white | Less fluffy | Smooth | Circular | White |
| 18. | I-18 | White | Raised fluffy | Smooth | Circular | White with purple centre |
| 19. | I-19 | White with pink centre | Flat humid | Smooth | Irregular | Light purple with concentric rings |
| 20. | I-20 | White | Raised fluffy | Smooth | Circular | White |
| 21. | I-21 | Pale white | Flat humid | Smooth | Circular | White |
| 22. | I-22 | Pale yellow | Less fluffy | Smooth | Circular | Pale yellow |
| 23. | I-23 | White | Raised fluffy | Smooth | Circular | White |
| 24. | I-24 | White | Raised fluffy | Smooth | Circular | White |
| 25. | I-25 | White | Raised fluffy | Smooth | Circular | White |
| Foc isolates |
Microconidia* | Macroconidia* | Chlamydospores | ||||||||
|---|---|---|---|---|---|---|---|---|---|---|---|
| Size (µm) |
No. of septations | Shape | Size (µm) |
No. of septations | Shape | Size (µm) |
Shape | ||||
| I-1 | 10×2.5 | 1 | Oval | 28×3.4 | 3 | Falcate | 7.7 | Oval | |||
| I-2 | 10×2.4 | 0 | Oval | 28×3.4 | 3 | Falcate | 7.5 | Oval | |||
| I-3 | 11×2.5 | 0 | Oval | 30×3.5 | 3 | Falcate | 8.2 | Round | |||
| I-4 | 11×2.4 | 2 | Oval | 30×3.3 | 3 | Falcate | 8.3 | Oval | |||
| I-5 | 12×2.5 | 1 | Oval | 29×3.5 | 3 | Falcate | 9.0 | Round | |||
| I-6 | 11×2.6 | 1 | Oval | 28×3.6 | 3 | Falcate | 8.5 | Round | |||
| I-7 | 11×2.8 | 1 | Oval | 27×3.2 | 3 | Falcate | 8.0 | Round | |||
| I-8 | 11×3.0 | 1 | Oval | 30×3.5 | 3 | Falcate | 9.0 | Oval | |||
| I-9 | 11×2.6 | 2 | Oval | 29×3.5 | 3 | Falcate | 8.8 | Oval | |||
| I-10 | 11×3.0 | 0 | Oval | 28×3.2 | 3 | Falcate | 9.5 | Round | |||
| I-11 | 11×2.4 | 1 | Oval | 27×3.4 | 3 | Falcate | 8.1 | Oval | |||
| I-12 | 12 ×3.0 | 0 | Oval | 30×3.5 | 3 | Falcate | 8.5 | Oval | |||
| I-13 | 11×3.0 | 1 | Oval | 30×3.6 | 3 | Falcate | 9.0 | Oval | |||
| I-14 | 12×2.4 | 1 | Oval | 28×3.5 | 3 | Falcate | 8.7 | Round | |||
| I-15 | 12×2.5 | 2 | Oval | 28×3.5 | 3 | Falcate | 8.9 | Oval | |||
| I-16 | 11×2.5 | 1 | Oval | 29×3.4 | 3 | Falcate | 9.1 | Oval | |||
| I-17 | 10×2.2 | 0 | Oval | 29×3.5 | 3 | Falcate | 9.2 | Oval | |||
| I-18 | 12×2.5 | 1 | Oval | 27×3.6 | 3 | Falcate | 8.1 | Round | |||
| I-19 | 11×3.0 | 2 | Oval | 30×3.4 | 3 | Falcate | 8.6 | Round | |||
| I-20 | 11×2.6 | 1 | Oval | 28×3.5 | 4 | Falcate | 8.2 | Oval | |||
| I-21 | 10×2.5 | 0 | Oval | 30×3.6 | 3 | Falcate | 9.0 | Oval | |||
| I-22 | 10×2.4 | 0 | Oval | 30×3.5 | 3 | Falcate | 9.1 | Round | |||
| I-23 | 11×2.5 | 1 | Oval | 29×3.5 | 3 | Falcate | 8.3 | Oval | |||
| I-24 | 12×2.5 | 1 | Oval | 29×3.4 | 4 | Falcate | 8.7 | Round | |||
| I-25 | 11×3.0 | 1 | Oval | 28×3.5 | 3 | Falcate | 9.0 | Oval | |||
| Sl. No | Isolate Code | Days after first appearance of the symptoms | Leaf symptoms index | Vascular discoloration rating |
|---|---|---|---|---|
| 1. | I-1 | 26 | 7 | 7 |
| 2. | I-2 | 27 | 9 | 11 |
| 3. | I-3 | 30 | 7 | 9 |
| 4. | I-4 | 33 | 9 | 9 |
| 5. | I-5 | 27 | 7 | 7 |
| 6. | I-6 | 26 | 5 | 5 |
| 7. | I-7 | 32 | 9 | 9 |
| 8. | I-8 | 29 | 7 | 7 |
| 9. | I-9 | 30 | 3 | 3 |
| 10. | I-10 | 30 | 5 | 5 |
| 11. | I-11 | 28 | 9 | 11 |
| 12. | I-12 | 31 | 3 | 3 |
| 13. | I-13 | 26 | 9 | 9 |
| 14. | I-14 | 28 | 9 | 11 |
| 15. | I-15 | 32 | 5 | 5 |
| 16. | I-16 | 29 | 3 | 3 |
| 17. | I-17 | 33 | 7 | 7 |
| 18. | I-18 | 27 | 7 | 7 |
| 19. | I-19 | 29 | 3 | 3 |
| 20. | I-20 | 30 | 5 | 5 |
| 21. | I-21 | 32 | 9 | 11 |
| 22. | I-22 | 33 | 5 | 9 |
| 23. | I-23 | 29 | 5 | 5 |
| 24. | I-24 | 26 | 9 | 11 |
| 25. | I-25 | 27 | 5 | 5 |
| Primer | Number of PL* | Percentage of PL (%) | PIC† | h** | I†† |
|---|---|---|---|---|---|
| (AC)8YA | 25 | 100 | 0.41 | 0.4735 | 0.6660 |
| (AC)8G | 25 | 100 | 0.47 | 0.4672 | 0.6592 |
| (GA)8YC | 25 | 100 | 0.43 | 0.4480 | 0.6385 |
| (AG)8T | 25 | 100 | 0.43 | 0.4288 | 0.6178 |
| (GA)8YT | 24 | 96 | 0.36 | 0.3904 | 0.5701 |
| (AG)8YT | 13 | 52 | 0.44 | 0.2600 | 0.3604 |
| (CA)8T | 23 | 92 | 0.44 | 0.4160 | 0.5916 |
| (AG)8C | 24 | 96 | 0.47 | 0.4333 | 0.6166 |
| (CA)8RG | 22 | 88 | 0.40 | 0.3700 | 0.5367 |
| (GA)8YG | 25 | 100 | 0.47 | 0.4675 | 0.6596 |
| (CA)8RC | 25 | 100 | 0.39 | 0.4032 | 0.5902 |
| (AC)8YG | 24 | 96.00 | 0.42 | 0.4224 | 0.6047 |
| Source | Degrees of Freedom (df) | Sum of Squares | Mean Square | Estimated Variance | % variation | P value |
|---|---|---|---|---|---|---|
| Among Pops | 4 | 65.520 | 16.380 | 0.608 | 4% | <0.001 |
| Within Pops | 20 | 266.800 | 13.340 | 13.340 | 96% | <0.001 |
| Total | 24 | 332.320 | 29.72 | 13.948 | 100% | <0.001 |
Disclaimer/Publisher’s Note: The statements, opinions and data contained in all publications are solely those of the individual author(s) and contributor(s) and not of MDPI and/or the editor(s). MDPI and/or the editor(s) disclaim responsibility for any injury to people or property resulting from any ideas, methods, instructions or products referred to in the content. |
© 2024 by the authors. Licensee MDPI, Basel, Switzerland. This article is an open access article distributed under the terms and conditions of the Creative Commons Attribution (CC BY) license (http://creativecommons.org/licenses/by/4.0/).


