1. Introduction
Atherosclerosis is a chronic inflammatory disease characterized by the accumulation of lipids, inflammatory cells, and fibrous elements within the arterial wall, leading to plaque formation and vascular obstruction. It is a leading cause of morbidity and mortality worldwide, significantly contributing to conditions such as coronary artery disease (CAD), stroke, and peripheral arterial disease (PAD) [
1]. Despite advances in therapeutic interventions, early detection and prevention remain critical, especially in younger populations who may present with subclinical disease yet are at increased risk of future cardiovascular events.
Inflammation plays a pivotal role in the initiation and progression of atherosclerosis. Various inflammatory indices, such as the Systemic Inflammatory Response Index (SIRI), Systemic Inflammation Index (SII), Neutrophil-Lymphocyte Ratio (NLR), Platelet-Lymphocyte Ratio (PLR), and Monocyte-Lymphocyte Ratio (MLR), have emerged as potential biomarkers for cardiovascular risk assessment [
2,
3]. These indices reflect the balance between pro-inflammatory and anti-inflammatory cells, offering insights into the systemic inflammatory status of individuals and their potential risk for atherogenesis.
In addition to inflammation, lipid abnormalities are central to the pathogenesis of atherosclerosis. Lipid-related biomarkers like Lipoprotein(a) [Lp(a)], Angiopoietin-like protein 3 (ANGPTL3), Lipoprotein-associated Phospholipase A2 (Lp-PLA2), and Apolipoprotein B (ApoB) have been implicated in the development and progression of atherosclerotic plaques [
4,
5]. Elevated levels of low-density lipoprotein cholesterol (LDL-C) and total cholesterol (TC) are well-established risk factors, while high-density lipoprotein cholesterol (HDL-C) is considered protective [
6].
Understanding the interplay between inflammatory markers and lipid biomarkers is crucial for identifying individuals at high risk of developing atherosclerosis. This study aims to explore these relationships in a young patient cohort, providing insights that could contribute to targeted prevention strategies and personalized medicine approaches.
2. Materials and Methods
We conducted a cross-sectional study involving 89 patients aged between 18 and 55 years. The inclusion criteria were patients who were stable without signs of acute coronary syndrome and had no severe chronic diseases, systemic, or rheumatological conditions. All participants had preserved left ventricular ejection fraction and normal renal function. The study population was divided into two groups: the main group consisted of 62 patients with atherosclerosis detected in the coronary, carotid, or lower limb arteries (some exhibiting multiple localizations), while the control group included 27 healthy individuals without signs of hemodynamically significant atherosclerosis.
Comprehensive data were collected for each participant, including demographic information (gender, smoking history, presence of diabetes and arterial hypertension, family history of cardiovascular diseases) and medication usage (statins, aspirin, P2Y12 inhibitors). Imaging data provided a segment-by-segment description of the coronary arteries, indicating the degree of stenosis, as well as the maximum degree of stenosis in the carotid and peripheral arteries.
Laboratory parameters were obtained through blood tests, including complete blood counts (neutrophil, lymphocyte, monocyte, and platelet counts), fibrinogen, creatinine, and lipid profiles TC, LDL-C, HDL-C, TG]. Specific atherosclerosis-related biomarkers were also measured, such as Lp(a), ANGPTL3, Lipoprotein-associated PhosLp-PLA2, and Apolipoprotein ApoB.
Inflammatory indices were calculated using the following formulas:
SIRI: (Neutrophil count × Monocyte count) ÷ Lymphocyte count
SII: (Neutrophil count × Platelet count) ÷ Lymphocyte count
AISI: (Neutrophil count × Monocyte count × Platelet count) ÷ Lymphocyte count
NLR: Neutrophil count ÷ Lymphocyte count
PLR: Platelet count ÷ Lymphocyte count
MLR: Monocyte count ÷ Lymphocyte count
Ethical approval was obtained from the institutional review board, and all participants provided informed consent before enrollment in the study.
Data were analyzed using Python with relevant statistical libraries, including Pandas, NumPy, SciPy, scikit-learn, and Matplotlib. Continuous variables were tested for normality using the Shapiro-Wilk test, and due to non-normal distribution, non-parametric tests were employed. Outliers were identified using box plots and Z-scores, and log transformations were applied where necessary.
Pearson correlation coefficients were calculated to assess relationships between variables within the main group. Group comparisons between the main and control groups were performed using the Mann-Whitney U test, and effect sizes were calculated using Cohen’s d. Logistic regression modeling was conducted to identify predictors of atherosclerosis, with the presence of atherosclerosis as the dependent variable and selected biomarkers and inflammatory indices as independent variables. Model performance was evaluated using accuracy, confusion matrix, precision, recall, and F1-score.
Feature importance analysis was carried out using Random Forest and Gradient Boosting classifiers to assess which biomarkers and indices had the strongest influence on the prediction of atherosclerosis. Receiver Operating Characteristic (ROC) curves were plotted, and the Area Under the Curve (AUC) was calculated to evaluate model performance. Optimal thresholds for key biomarkers were determined using Youden’s Index, which maximizes the difference between true positive and false positive rates. Clustering analysis using K-means clustering was applied to the dataset to identify distinct patient subgroups based on their biomarker profiles.
3. Results
3.1. Correlation Analysis
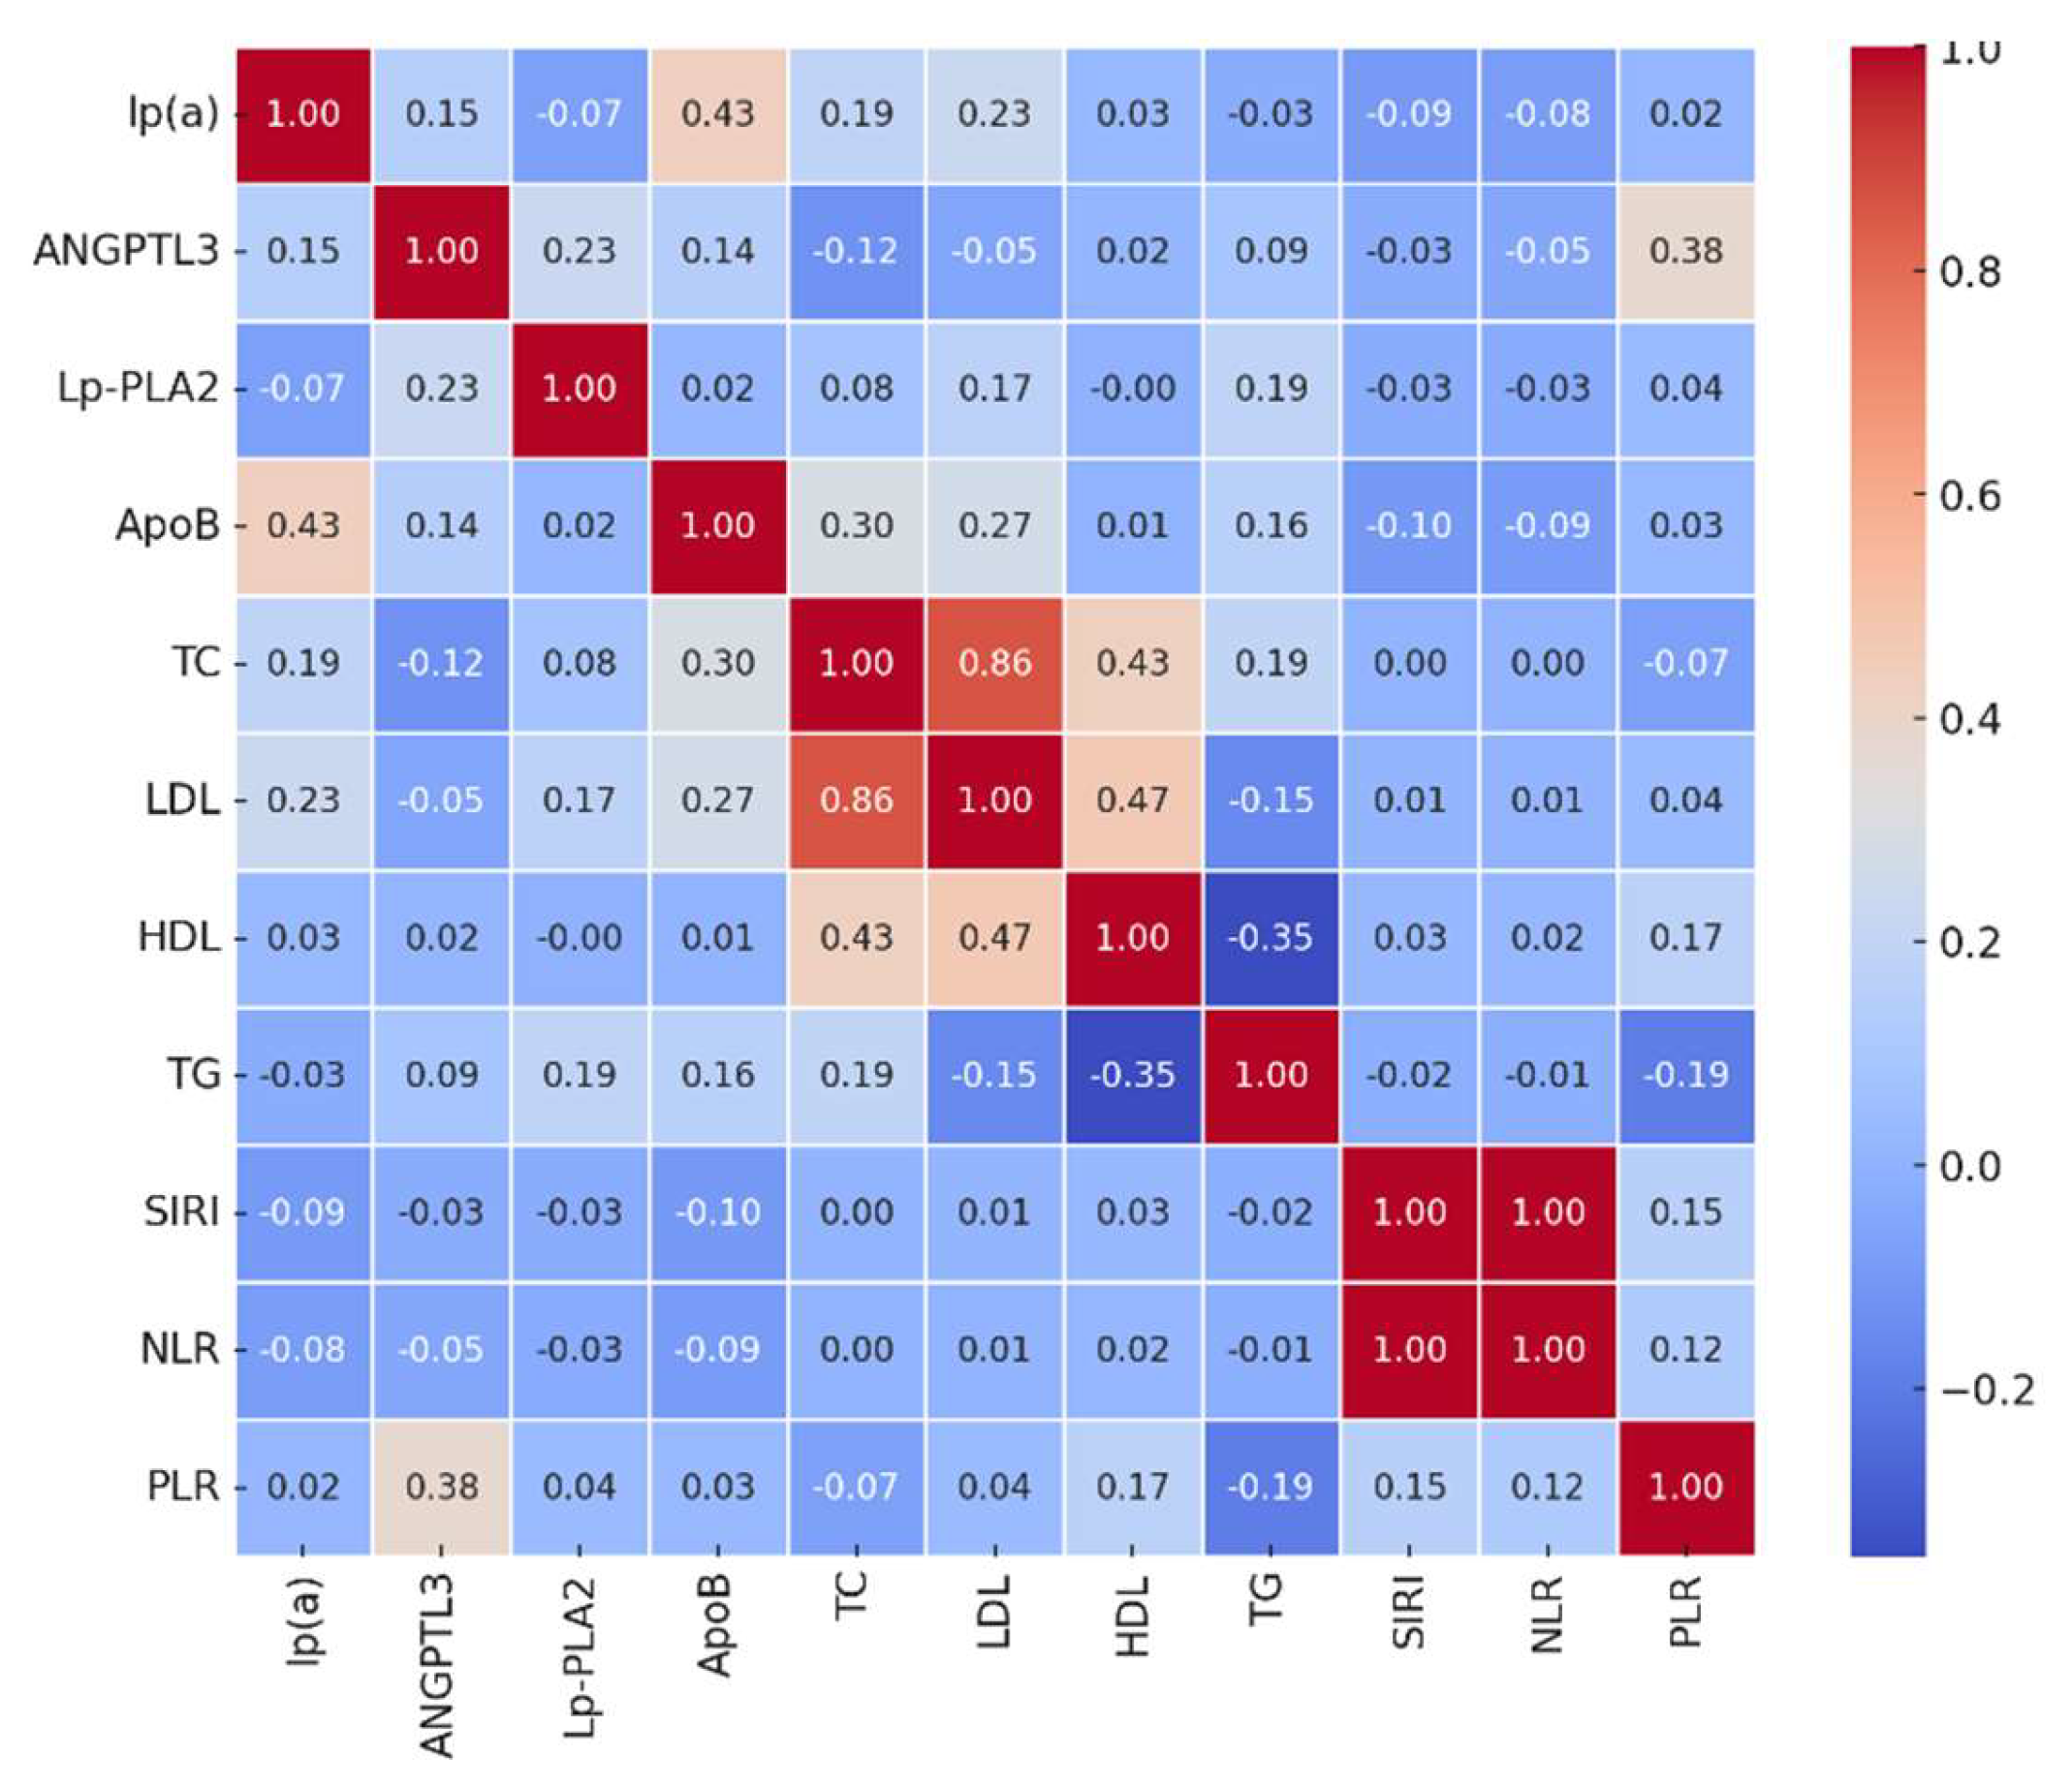
In the main group of patients with atherosclerosis, significant correlations were observed among various biomarkers and inflammatory indices.
Figure 1 illustrates the correlation heatmap of the main biomarkers.
Key findings include:
Lp(a) showed a moderate positive correlation with ApoB (r = 0.43, p < 0.01), suggesting that higher levels of Lp(a) are associated with elevated ApoB levels.
ANGPTL3 correlated positively with PLR (r = 0.38, p < 0.01), indicating a potential link between angiogenic factors and platelet-driven inflammation.
Lp-PLA2 had a mild correlation with TG (r = 0.19, p = 0.05), consistent with its role in lipid metabolism.
ApoB correlated with TC (r = 0.30, p < 0.01) and LDL-C (r = 0.27, p < 0.01), reflecting its involvement in the formation of atherogenic lipoprotein particles.
Interestingly, inflammatory indices such as SIRI, NLR, and PLR did not show strong correlations with most lipid biomarkers, suggesting that inflammation and lipid metabolism may contribute to atherosclerosis through independent but potentially synergistic pathways.
3.2. Group Comparisons
The Mann-Whitney U test revealed significant differences between the main and control groups.
Table 1 summarizes the median values and p-values for key variables.
These findings suggest that patients with atherosclerosis exhibit a heightened inflammatory state and lipid profile abnormalities compared to healthy controls.
3.3. Logistic Regression Modeling
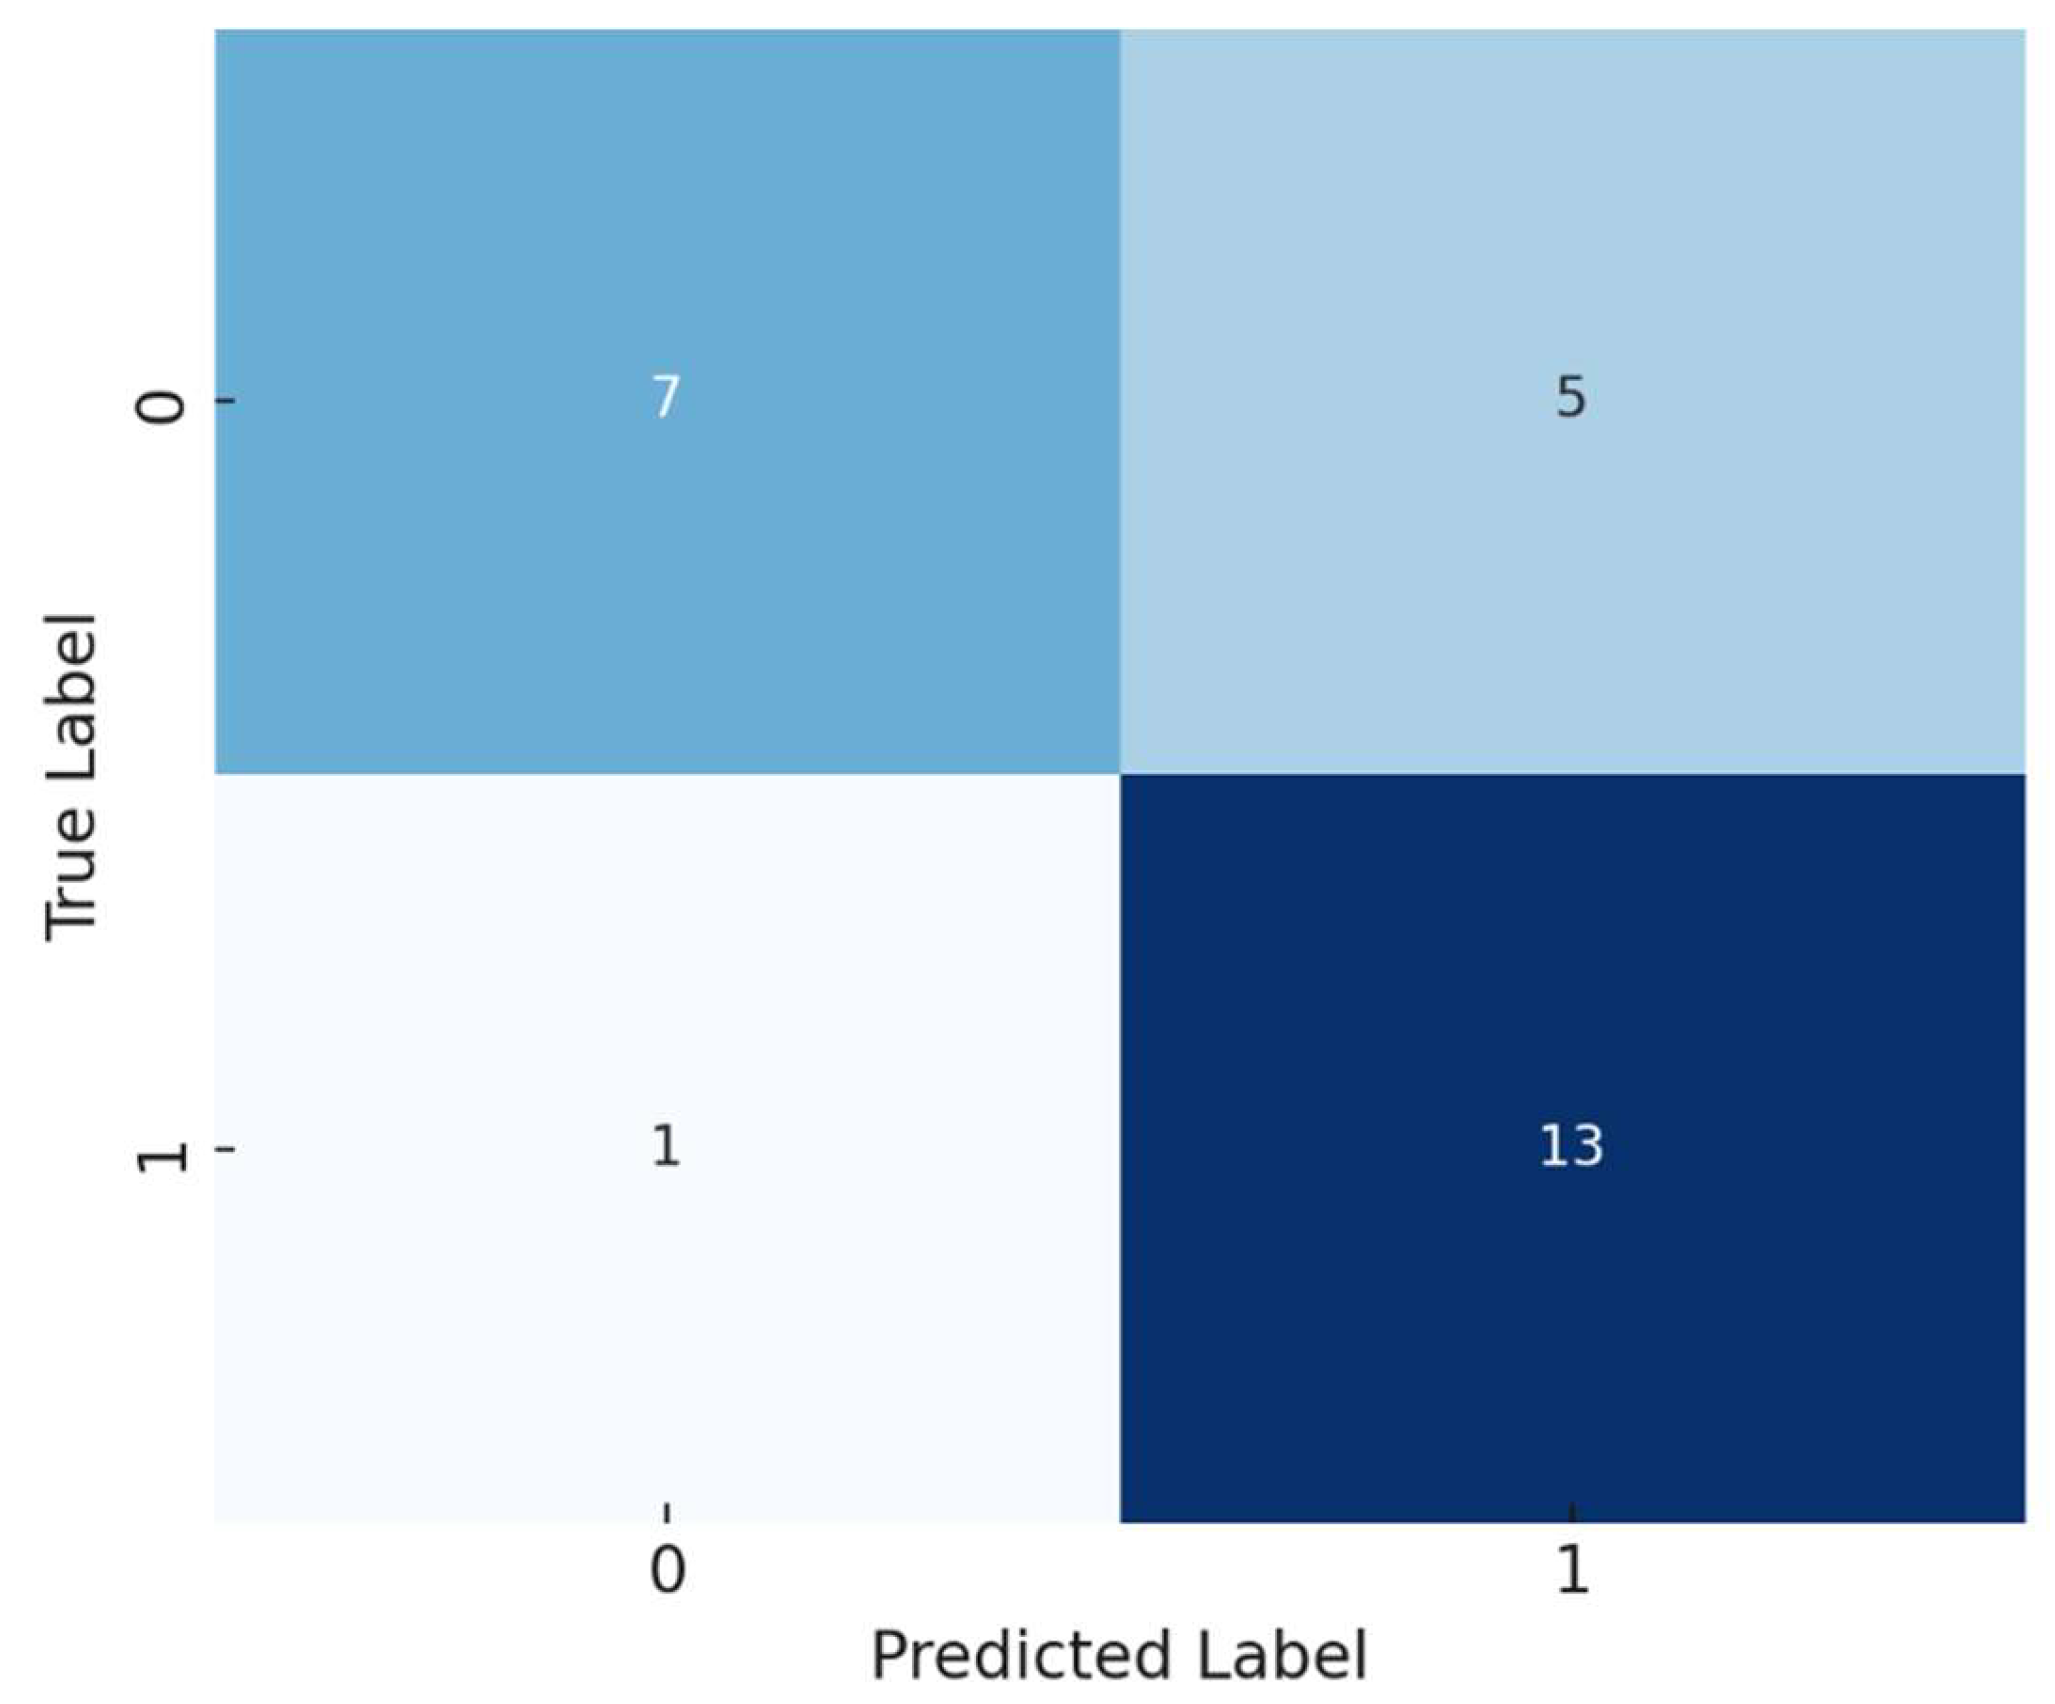
A logistic regression model was developed to predict the presence of atherosclerosis based on selected biomarkers and inflammatory indices. The model demonstrated an accuracy of 77%. The confusion matrix showed that the model correctly predicted 13 out of 14 cases of atherosclerosis but misclassified some control group members as having the disease.
Figure 2 shows the confusion matrix of the model.
Precision (Positive Class): 0.72
Recall (Positive Class): 0.93
F1-Score (Positive Class): 0.81
The model exhibited good sensitivity (ability to identify true positives) but moderate specificity (ability to identify true negatives).
3.4. Feature Importance Analysis
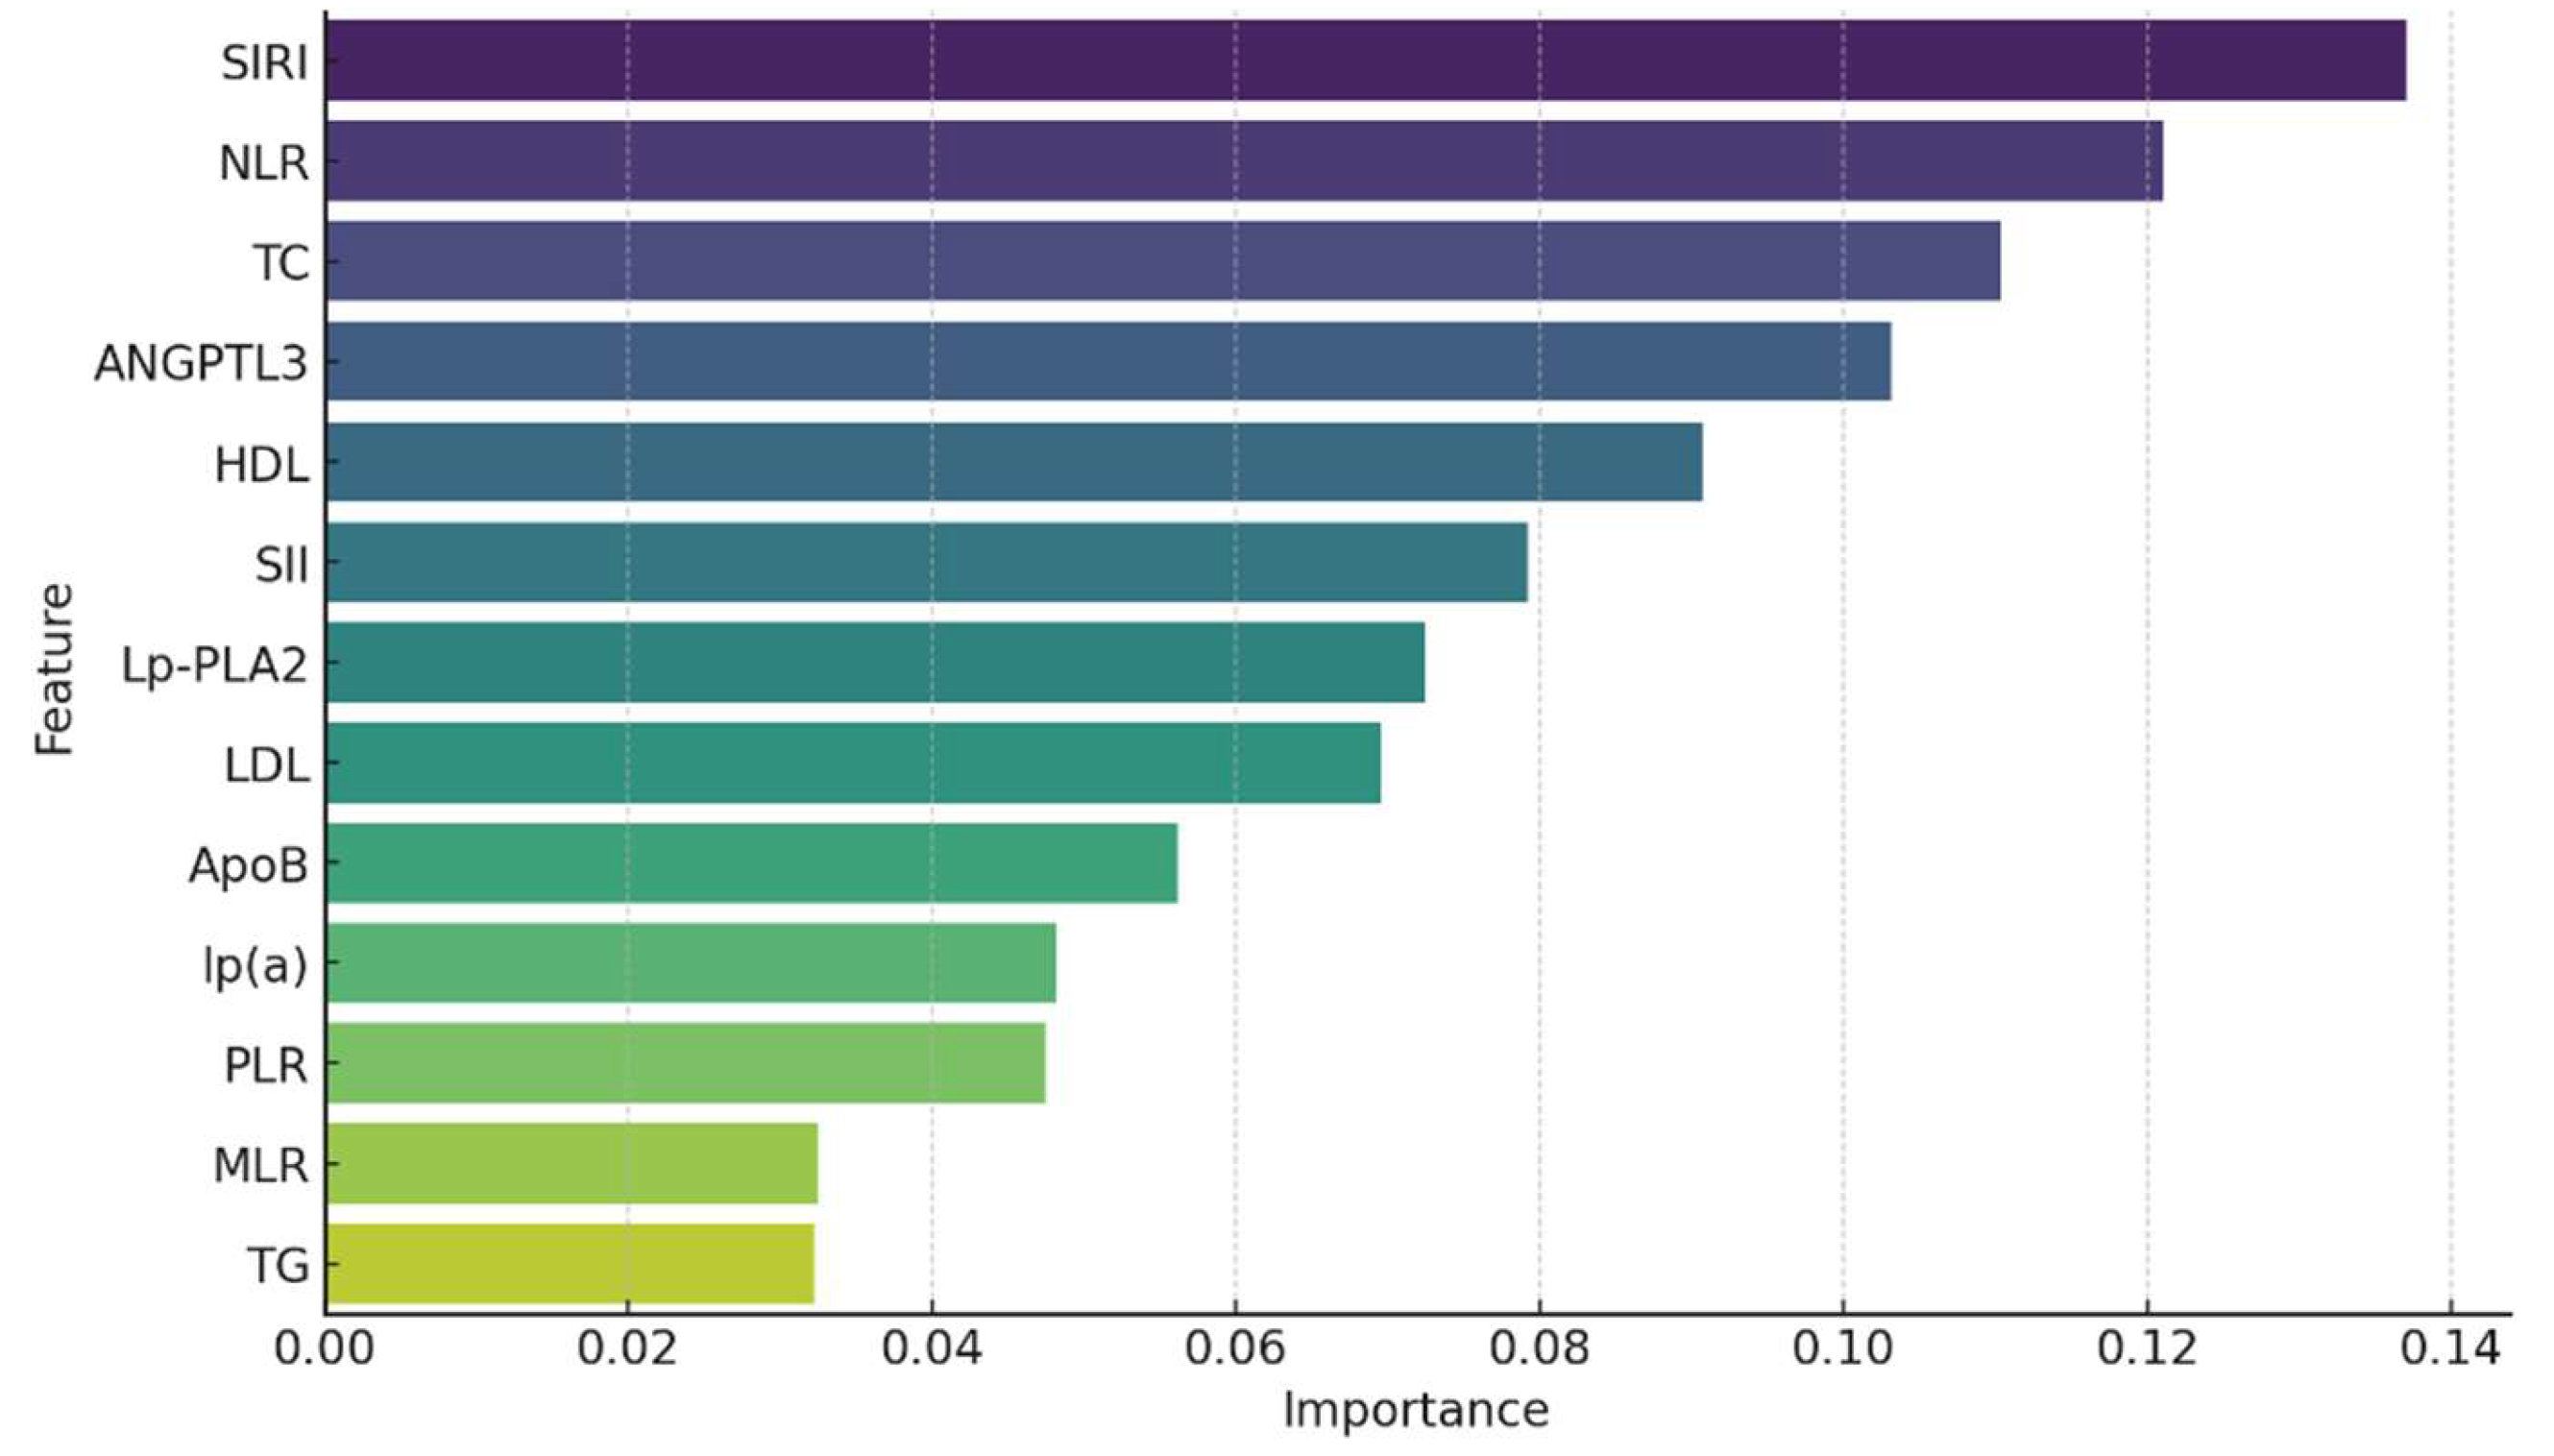
Feature importance analysis using Random Forest and Gradient Boosting classifiers identified the most significant predictors of atherosclerosis.
Figure 3 presents the feature importance derived from the Random Forest model.
The top predictors of early atherosclerosis identified in our Random Forest feature importance analysis were SIRI, NLR, TC, ANGPTL3, and HDL-C. Notably, NLR ranked higher than LDL-C, which traditionally is considered a key marker of atherosclerosis. This highlights the potentially stronger role of inflammatory responses in this cohort, as reflected by NLR, in contrast to lipid-related factors like LDL-C
These results underscore the importance of both inflammatory indices and lipid biomarkers in predicting early atherosclerotic disease.
3.5. ROC Curve and AUC
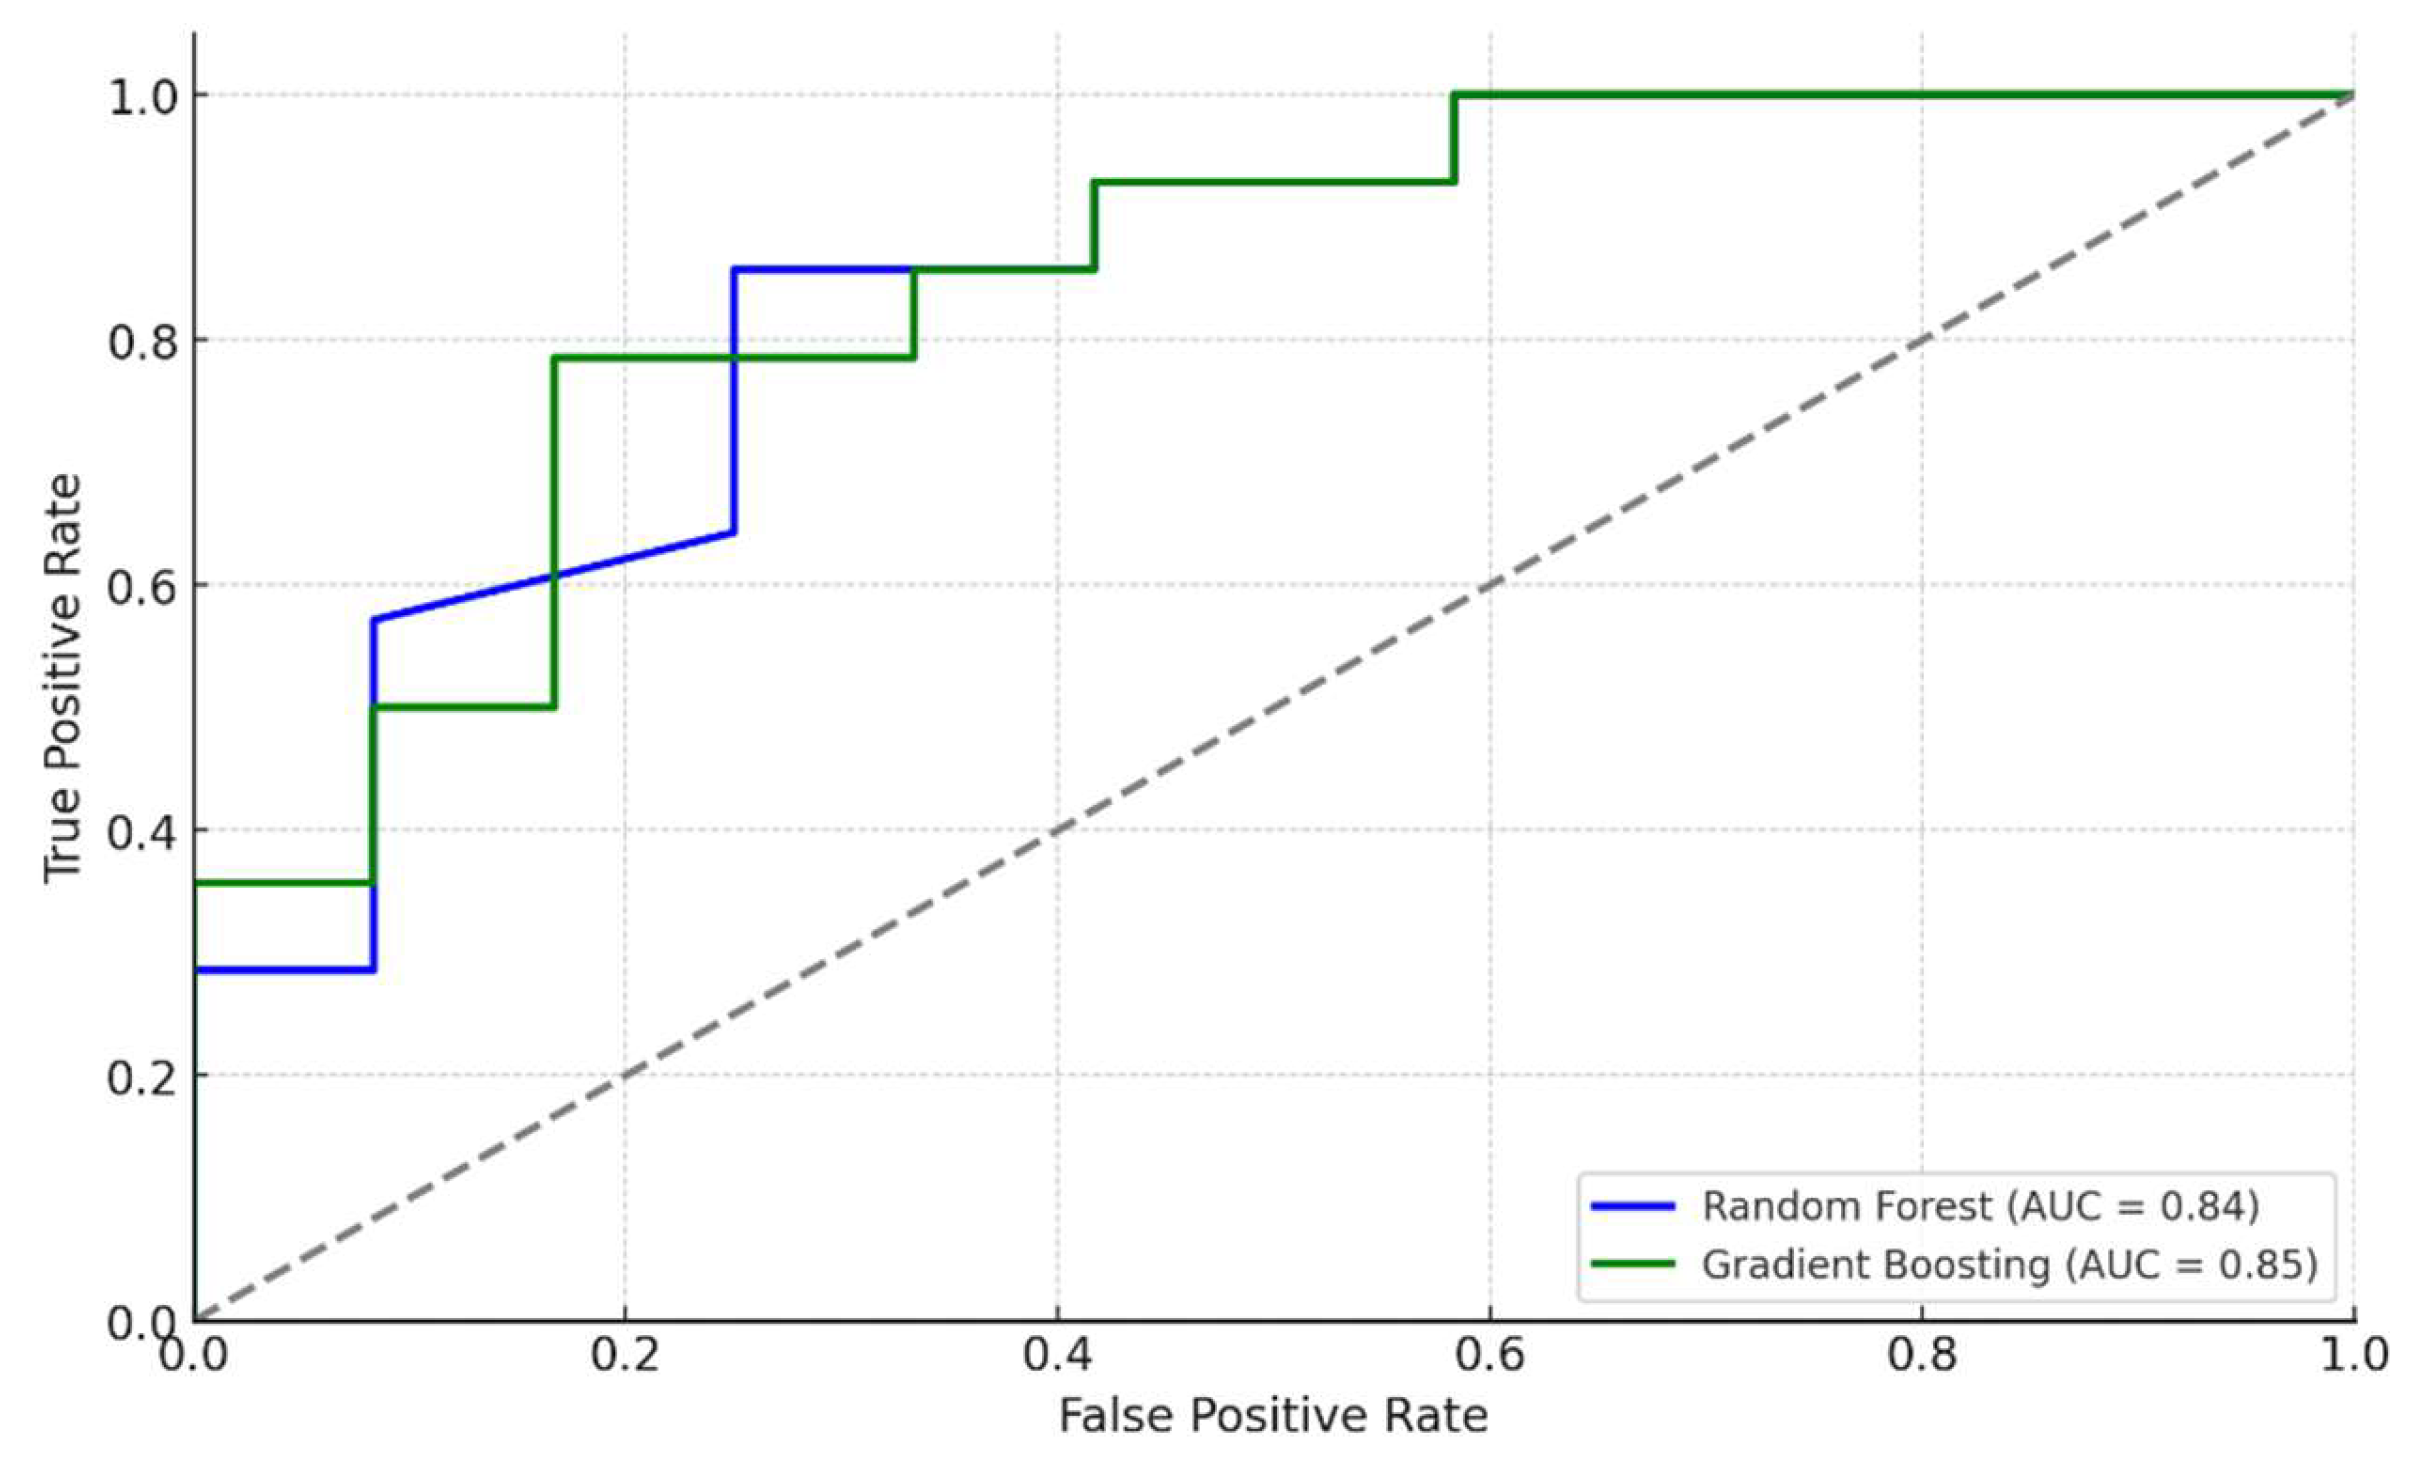
The ROC curves for the Random Forest and Gradient Boosting models demonstrated strong discriminatory ability.
Figure 4 displays the ROC curves for both models.
An AUC greater than 0.80 indicates excellent model performance in distinguishing between patients with and without atherosclerosis.
3.6. Optimal Thresholds
Using Youden’s Index, optimal thresholds for key biomarkers were determined.
Table 2 lists the thresholds along with sensitivity and specificity.
These thresholds may serve as clinical cut-off points for risk stratification.
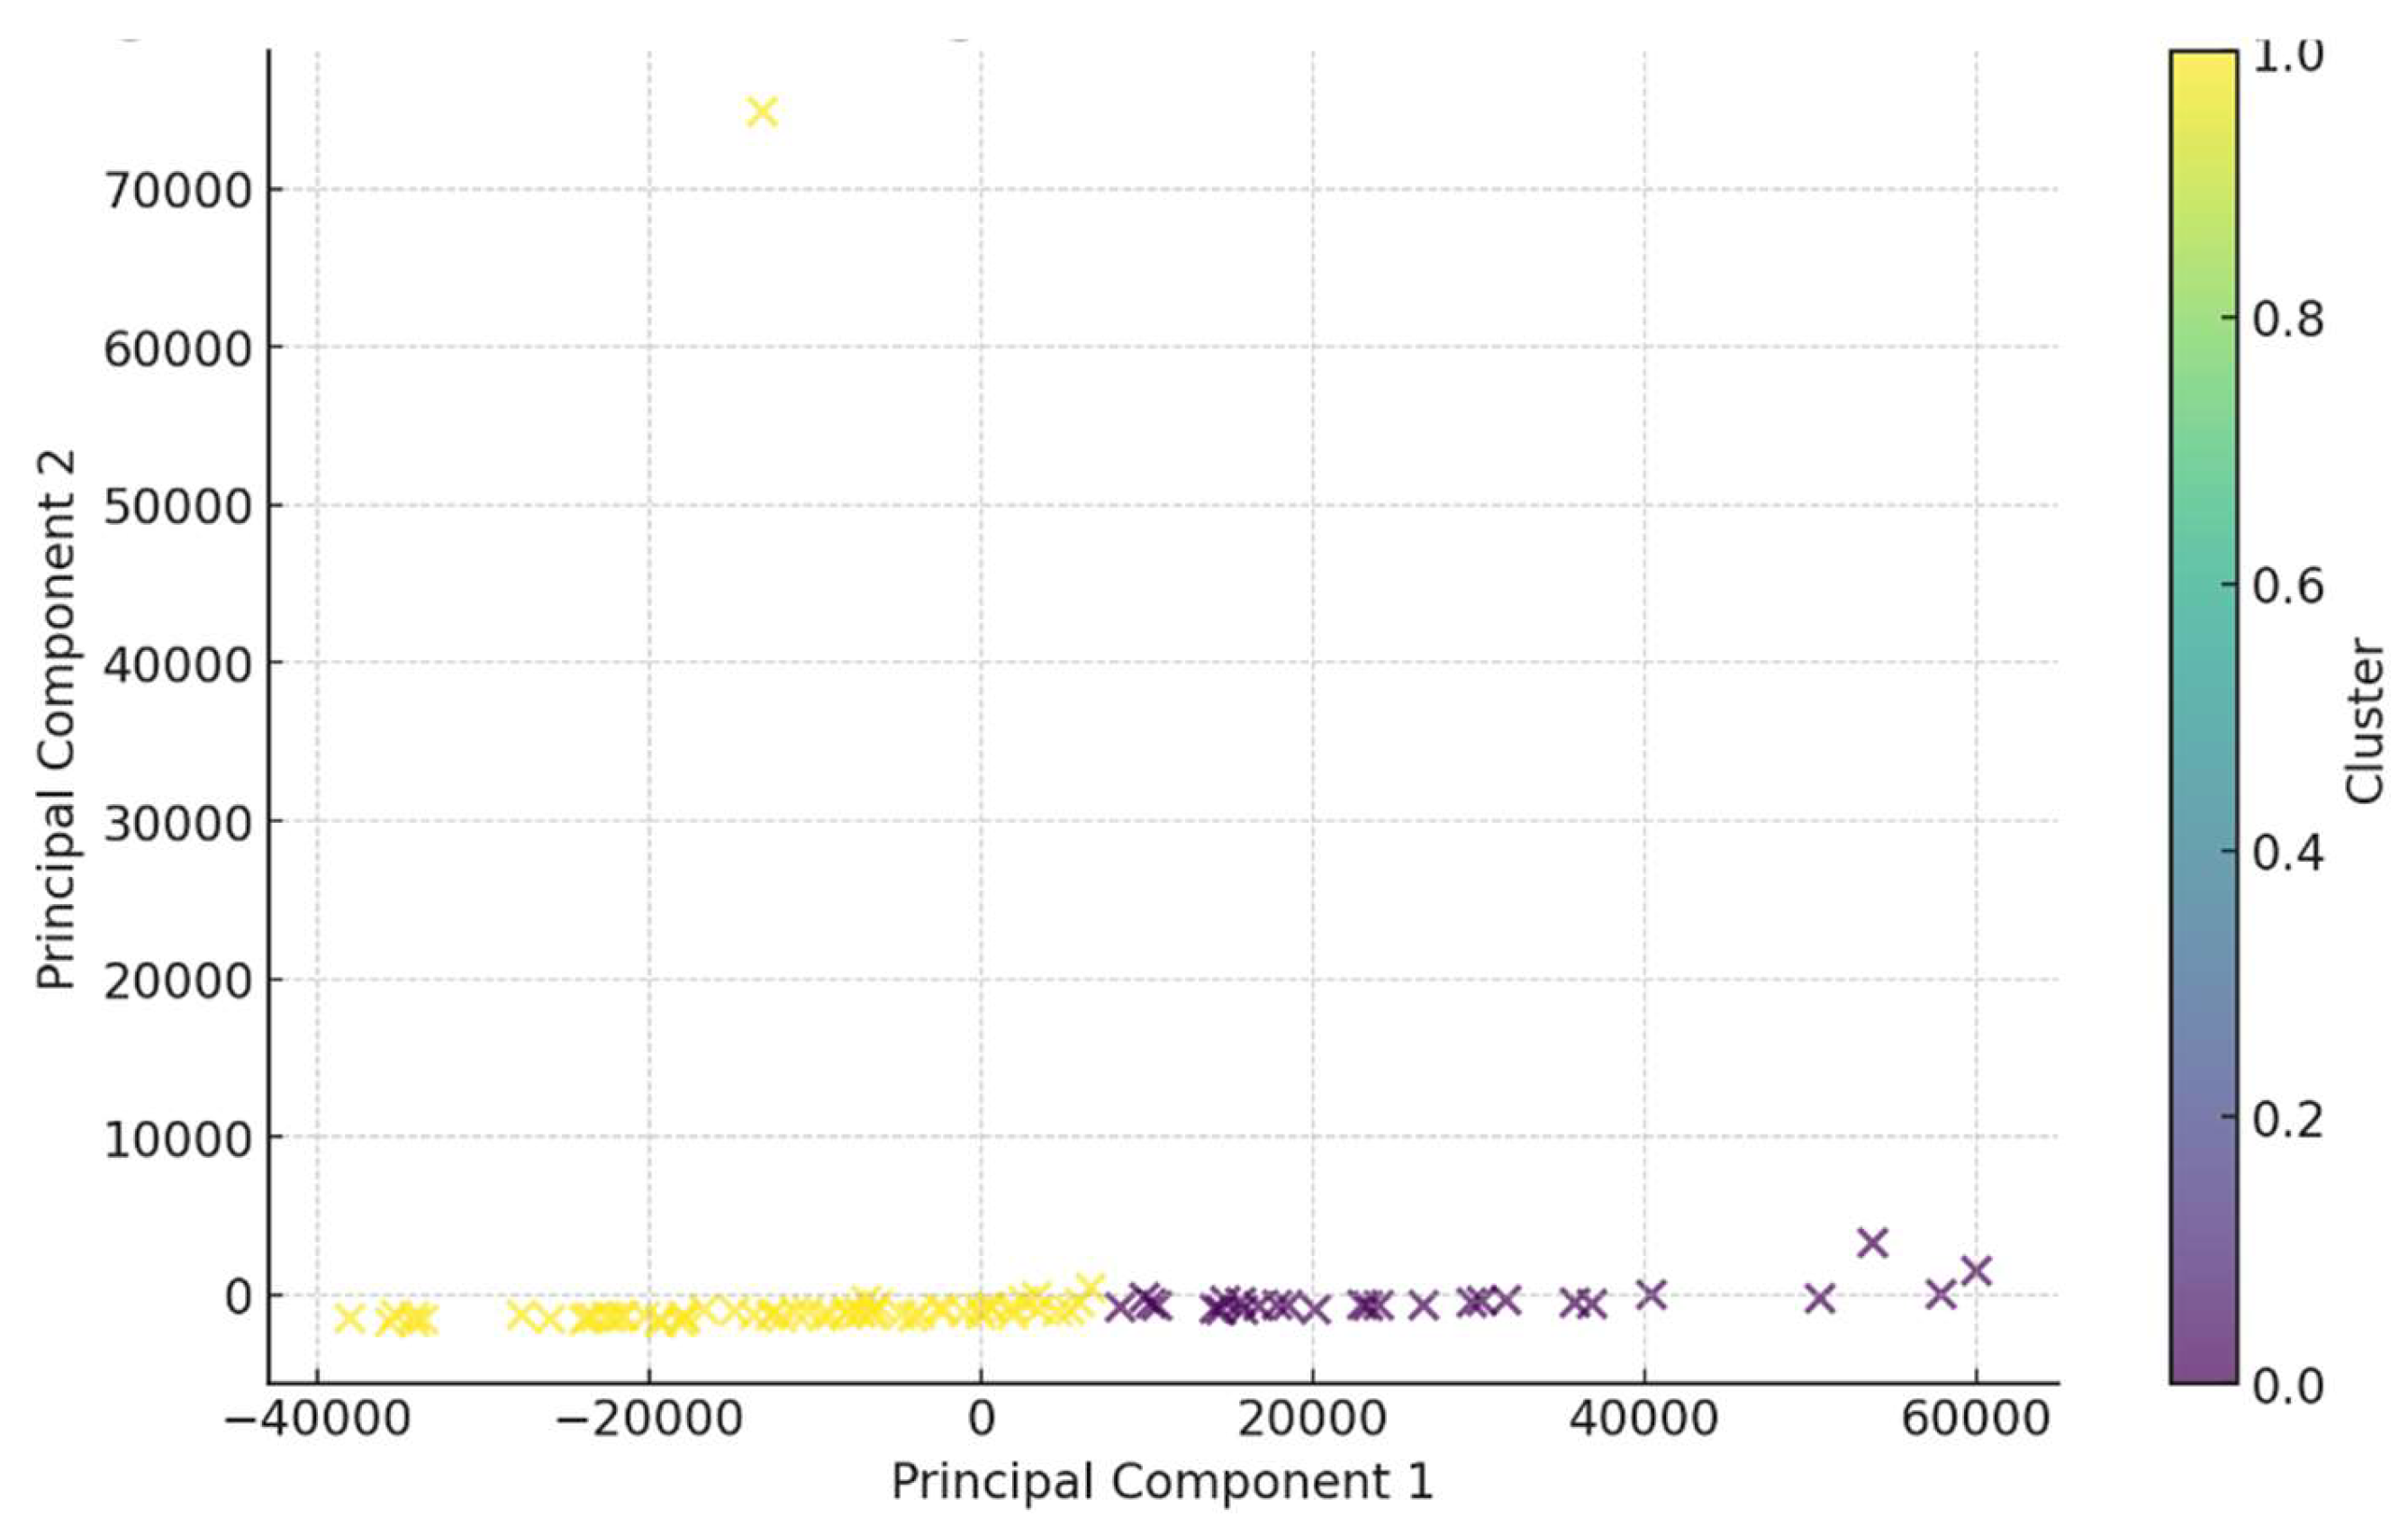
3.7. Clustering Analysis
K-means clustering identified two distinct patient subgroups.
Figure 5 illustrates the clustering of patients based on biomarker profiles.
Cluster 0 (n = 59): Characterized by higher inflammatory indices (NLR, SII, SIRI).
Cluster 1 (n = 27): Exhibited higher levels of ANGPTL3 but lower inflammatory indices.
This suggests heterogeneity among patients with atherosclerosis, with some exhibiting a predominant inflammatory profile and others showing lipid metabolism disturbances as the primary feature.
4. Discussion
The present study provides a comprehensive analysis of the relationships between inflammatory indices, lipid biomarkers, and atherosclerosis in a young patient cohort. Our findings highlight the significant roles of both systemic inflammation and lipid abnormalities in the early stages of atherosclerotic disease.
4.1. Inflammatory Indices as Predictors of Atherosclerosis
Elevated inflammatory indices such as SIRI, NLR, MLR, and SII were observed in patients with atherosclerosis compared to healthy controls. SIRI emerged as the most significant predictor in both logistic regression and machine learning models. These indices reflect the balance between different leukocyte populations, which play critical roles in inflammation and immunity.
The NLR and MLR are indicators of neutrophil and monocyte-mediated inflammatory responses, respectively. Neutrophils contribute to atherogenesis by releasing reactive oxygen species and proteolytic enzymes that damage the endothelium [
7]. Monocytes migrate into the arterial wall, differentiate into macrophages, and take up oxidized LDL, forming foam cells that constitute the lipid-rich necrotic core of atherosclerotic plaques [
8].
Our findings are consistent with previous studies demonstrating that higher NLR and MLR are associated with increased cardiovascular risk and adverse outcomes [
9,
10]. SIRI, which incorporates neutrophils, monocytes, and lymphocytes, may provide a more comprehensive assessment of systemic inflammation. Elevated SIRI has been linked to poor prognosis in various cardiovascular conditions [
11].
Moreover, the lack of strong correlations between inflammatory indices and lipid biomarkers suggests that inflammation and lipid metabolism may contribute to atherosclerosis through independent but possibly synergistic pathways. This underscores the multifactorial nature of atherosclerosis and the importance of addressing both inflammation and dyslipidemia in prevention and treatment strategies.
4.2. Lipid Biomarkers and Their Clinical Significance
Lipid abnormalities are central to the pathogenesis of atherosclerosis. Elevated levels of TC and LDL-C were observed in the main group, while HDL-C levels were lower. LDL-C is well-known for its atherogenic potential, contributing to plaque formation when oxidized and taken up by macrophages [
6]. HDL-C exerts protective effects by facilitating reverse cholesterol transport and possessing anti-inflammatory properties [
12].
Lp(a) levels were significantly higher in patients with atherosclerosis. Lp(a) is structurally similar to LDL but contains an additional apolipoprotein(a) component, which imparts pro-atherogenic and pro-thrombotic properties [
13]. Elevated Lp(a) is an independent risk factor for cardiovascular disease, and its levels are largely genetically determined [
14,
15]. Therapeutic options to lower Lp(a) are limited, but novel agents are under investigation [
16].
ANGPTL3 emerged as a key lipid biomarker in our study. It inhibits lipoprotein lipase and endothelial lipase, leading to increased plasma levels of triglycerides and LDL-C [
17]. The positive correlation between ANGPTL3 and PLR suggests an interplay between lipid metabolism and platelet-driven inflammation. Recent studies have identified ANGPTL3 as a potential therapeutic target, with monoclonal antibodies and antisense oligonucleotides showing promise in lowering lipid levels [
18].
The identification of optimal thresholds for lipid biomarkers provides practical cut-off points for clinical use. For instance, an LDL-C threshold of 1.97 mmol/L showed high sensitivity and could be used to identify individuals who may benefit from early lipid-lowering interventions.
4.3. Machine Learning Models and Predictive Insights
The application of machine learning models, such as Random Forest and Gradient Boosting classifiers, provided valuable insights into the predictive capabilities of various biomarkers. SIRI and ANGPTL3 were consistently identified as top predictors, highlighting their importance in early atherosclerosis detection.
While LDL-C is widely recognized as a major risk factor for atherosclerosis, our feature importance analysis found NLR to be a stronger predictor of early atherosclerosis in this cohort. This finding underscores the central role of inflammation in atherogenesis, particularly in younger patients or those without advanced lipid abnormalities. The higher ranking of NLR suggests that inflammatory mechanisms, as reflected by the ratio of neutrophils to lymphocytes, may contribute significantly to early plaque formation. Although LDL-C remains important, this result emphasizes the need to consider both lipid management and inflammation control in early atherosclerosis prevention strategies.
The high AUC values (>0.80) indicate excellent model performance. These models can handle complex, non-linear relationships and interactions between variables, making them suitable for biomedical data [
19]. Incorporating machine learning approaches in clinical settings could enhance risk stratification and personalized medicine.
However, it is important to consider that machine learning models require validation in larger, independent cohorts before being implemented in clinical practice. Additionally, the interpretability of such models is crucial for clinician acceptance, and efforts should be made to develop explainable AI tools.
4.4. Clustering Analysis and Patient Stratification
Clustering analysis revealed two distinct patient subgroups:
Inflammation-Dominant Cluster: Patients with higher inflammatory indices may benefit from anti-inflammatory therapies. This aligns with studies like the CANTOS trial, where targeting inflammation with canakinumab reduced cardiovascular events [
2,20].
Lipid Metabolism Cluster: Patients with elevated ANGPTL3 and lipid abnormalities may benefit from lipid-lowering therapies targeting specific pathways. Novel agents targeting ANGPTL3 could offer therapeutic benefits [
18].
Understanding these subgroups supports the move towards personalized medicine, tailoring interventions based on individual risk profiles and underlying pathophysiological mechanisms. For example, patients in the inflammation-dominant cluster might be prioritized for interventions targeting inflammation, while those in the lipid metabolism cluster might benefit more from aggressive lipid-lowering strategies.
4.5. Clinical Implications and Future Directions
The identification of optimal thresholds for SIRI, ANGPTL3, and lipid parameters provides actionable insights for clinical practice. Implementing these biomarkers in routine practice could improve early detection of atherosclerosis in young adults and guide preventive strategies.
4.6. Strengths and Limitations
This study has several strengths, including a comprehensive analysis of both inflammatory and lipid biomarkers and the use of advanced statistical and machine learning techniques. However, there are limitations to consider. The cross-sectional design limits the ability to establish causality. The sample size is relatively small, and participants were from a single center, which may affect the generalizability of the results. Potential confounders such as diet, physical activity, and socioeconomic factors were not accounted for and could influence biomarker levels. Additionally, we did not assess other emerging biomarkers and genetic factors that may contribute to atherosclerosis risk.
5. Limitations
Sample Size and Diversity: The relatively small and homogeneous sample may limit the applicability of the findings to broader populations.
Cross-Sectional Nature: The study design does not allow for causal inferences or assessment of temporal relationships.
Unmeasured Confounders: Factors like diet, exercise, and genetic predispositions were not controlled for, which could impact the results.
Single-Center Study: Findings may not reflect variations in other settings or regions.
Biomarker Variability: Biological variability and measurement errors could affect biomarker levels.
6. Main Findings
In this study, we conducted a comprehensive analysis of the relationships between inflammatory indices, lipid biomarkers, and the presence of atherosclerosis in young patients aged 18 to 55 years.
Correlation Analysis revealed significant associations among biomarkers. Lp(a) showed a moderate correlation with ApoB (r = 0.43, p < 0.01), indicating a link between Lp(a) and ApoB levels. ANGPTL3 exhibited a positive correlation with the PLR (r = 0.38, p < 0.01), suggesting possible interactions between angiogenic factors and platelet-mediated inflammatory processes.
Group Comparisons using the Mann-Whitney U test demonstrated significant differences between the main and control groups. Patients with atherosclerosis had elevated inflammatory indices such as SIRI, NLR, MLR, and SII (p < 0.01). Additionally, lipid profile abnormalities were observed: increased levels of TC and LDL-C, and decreased levels of HDL-C (p < 0.05). Lp(a) levels were significantly higher in the main group (p < 0.001).
Logistic Regression indicated that SIRI and ANGPTL3 were the most significant predictors of atherosclerosis presence. The model demonstrated high accuracy (77%), high sensitivity (93%), and moderate specificity (72%).
Feature Importance Analysis using Random Forest and Gradient Boosting models confirmed the significance of SIRI and ANGPTL3, as well as traditional lipid biomarkers (LDL-C, TC, HDL-C) in predicting atherosclerosis. This highlights the importance of both inflammatory and lipid factors in disease development.
ROC Analysis showed high discriminatory ability of the models, with an AUC of 0.84 for Random Forest and 0.85 for Gradient Boosting, indicating their effectiveness in distinguishing between patients with and without atherosclerosis.
Clustering Analysis identified two subgroups of patients: one with predominant inflammatory markers and another with pronounced lipid metabolism disturbances. This underscores the heterogeneity of atherosclerosis pathophysiological mechanisms and the need for personalized approaches to treatment and prevention.
7. Conclusion
This study underscores the integral roles of systemic inflammation and lipid abnormalities in the early development of atherosclerosis among young adults. SIRI and ANGPTL3 emerged as potent biomarkers for predicting disease presence, with machine learning models demonstrating high predictive accuracy. The identification of distinct patient subgroups highlights the potential for personalized medicine approaches. Further research with larger, diverse cohorts and longitudinal follow-up is warranted to validate these findings and explore targeted interventions.
Author Contributions
A.M. was responsible for the conceptualization, study design, and writing of the manuscript. K.K. contributed to patient recruitment for the study. O.M. also contributed to patient recruitment for the study. All authors have read and agreed to the published version of the manuscript.
Funding
The research is carried out with the financial support of the Kuban Science Foundation in the framework of the scientific project Num. МФИ-20.1/63
Institutional Review Board Statement
The study was conducted in accordance with the Declaration of Helsinki
Informed Consent Statement
Informed consent was obtained from all subjects involved in the study.
Conflicts of Interest
The authors declare no conflicts of interest
References
- Libby P, Hansson GK. Inflammation and immunity in diseases of the arterial tree: players and layers. Circ Res. 2015;116(2):307-311. [CrossRef]
- Ridker PM, Everett BM, Thuren T, et al. Antiinflammatory therapy with canakinumab for atherosclerotic disease. N Engl J Med. 2017;377(12):1119-1131. [CrossRef]
- Fawzy MS, Toraih EA, Elgazzaz MG, et al. Neutrophil-to-lymphocyte ratio and monocyte-to-lymphocyte ratio as predictors of adverse outcomes in patients with acute coronary syndrome. Clin Appl Thromb Hemost. 2019;25:1-9. [CrossRef]
- Toth PP, Romeo GR, Patterson AB. Lipoprotein(a): recent insights and approaches to atherothrombotic disease risk management. Atherosclerosis Suppl. 2018;32:1-9. [CrossRef]
- Mach F, Baigent C, Catapano AL, et al. 2019 ESC/EAS Guidelines for the management of dyslipidaemias: lipid modification to reduce cardiovascular risk. Eur Heart J. 2019;41(1):111-188. [CrossRef]
- Ference BA, Ginsberg HN, Graham I, et al. Low-density lipoproteins cause atherosclerotic cardiovascular disease. 1. Evidence from genetic, epidemiologic, and clinical studies. Eur Heart J. 2017;38(32):2459-2472. [CrossRef]
- Soehnlein O, Libby P. Targeting inflammation in atherosclerosis—from experimental insights to the clinic. Nat Rev Drug Discov. 2021;20(8):589-610. [CrossRef]
- Moore KJ, Tabas I. Macrophages in the pathogenesis of atherosclerosis. Cell. 2011;145(3):341-355. [CrossRef]
- Gibson PH, Croal BL, Cuthbertson BH, et al. Neutrophil-lymphocyte ratio and its association with survival after cardiac surgery. Heart. 2007;93(5):645-646. [CrossRef]
- Imtiaz F, Shafique K, Mirza SS, et al. Neutrophil to lymphocyte ratio as a measure of systemic inflammation in prevalent chronic diseases in Asian population. Int Arch Med. 2012;5(1):2. [CrossRef]
- Zahorec R. Neutrophil-to-lymphocyte ratio: past, present, and future perspectives. Bratisl Med J. 2021;122(7):474-488. [CrossRef]
- Barter PJ, Caulfield M, Eriksson M, et al. HDL cholesterol, very low levels of LDL cholesterol, and cardiovascular events. N Engl J Med. 2007;357(13):1301-1310. [CrossRef]
- Tsimikas S. A test in context: lipoprotein(a): diagnosis, prognosis, controversies, and emerging therapies. J Am Coll Cardiol. 2017;69(6):692-711. [CrossRef]
- Clarke R, Peden JF, Hopewell JC, et al. Genetic variants associated with Lp(a) lipoprotein level and coronary disease. N Engl J Med. 2009;361(26):2518-2528. [CrossRef]
- Paré G, Çaku A, McQueen M, et al. Lipoprotein(a) levels and the risk of myocardial infarction among 7 ethnic groups. Circulation. 2019;139(12):1472-1482. [CrossRef]
- Viney NJ, Yeang C, Yang X, et al. Antisense oligonucleotides targeting apolipoprotein(a) in people with raised lipoprotein(a): two randomised, double-blind, placebo-controlled, dose-ranging trials. Lancet. 2016;388(10057):2239-2253. [CrossRef]
- Musunuru K, Pirruccello JP, Do R, et al. Exome sequencing, ANGPTL3 mutations, and familial combined hypolipidemia. N Engl J Med. 2010;363(23):2220-2227. [CrossRef]
- Dewey FE, Gusarova V, O’Dushlaine C, et al. Genetic and pharmacologic inactivation of ANGPTL3 and cardiovascular disease. N Engl J Med. 2017;377(3):211-221. [CrossRef]
- Kavakiotis I, Tsave O, Salifoglou A, Maglaveras N, Vlahavas I, Chouvarda I. Machine learning and data mining methods in diabetes research. Comput Struct Biotechnol J. 2017;15:104-116. [CrossRef]
|
Disclaimer/Publisher’s Note: The statements, opinions and data contained in all publications are solely those of the individual author(s) and contributor(s) and not of MDPI and/or the editor(s). MDPI and/or the editor(s) disclaim responsibility for any injury to people or property resulting from any ideas, methods, instructions or products referred to in the content. |
© 2024 by the authors. Licensee MDPI, Basel, Switzerland. This article is an open access article distributed under the terms and conditions of the Creative Commons Attribution (CC BY) license (http://creativecommons.org/licenses/by/4.0/).
