1. Introduction
Hydrates form in subsea gas transport pipelines under favourable conditions such as temperature, pressure, flow agitation, changes in pipeline geometry, and the presence of restrictions along the pipeline, such as collapse and buckling. Studies on hydrate formation in gas-dominant pipelines in the literature [
1,
2,
3,
4], suggest that hydrates form and deposit in an annular profile along the length of the pipeline once favourable conditions exist. The annular flow pattern in a horizontal pipeline has been extensively discussed in the literature [
5]. Further research on hydrate risk suggests a higher presence of hydrates in the annular-mist flow pattern [
6]. Visual inspections during experimental runs indicate that an annular-dispersed flow pattern is prevalent during hydrate formation and deposition. In previous studies, this flow pattern was considered in modelling efforts to accurately predict hydrate behaviour in pipelines.
In an annular flow pattern, the liquid film flows along the walls of the pipe, while a gas phase occupies the core. The interface between the liquid film and the gas is relatively smooth, with minimal liquid droplets being carried by the gas phase. The liquid film can be continuous and stable, especially in horizontal pipelines. Comparatively, annular-mist or annular-dispersed flow pattern is similar to annular flow, but with a significant presence of liquid droplets suspended within the gas core. These droplets, or mist, are entrained by the gas phase and carried along the pipeline. The liquid film on the pipewall is thinner and more disturbed due to the high gas velocity and turbulence, leading to the formation of more mist. Annular-mist flow typically occurs at higher gas velocities, where the shear forces are strong enough to break up the liquid film into droplets.
The flow-related differences between annular and annular-mist flow influence the modelling of hydrate formation using analytical or CFD methods. Literature evidence suggests that approximately 50% of the hydrates deposited are formed in the dispersed water within the gas phase [
7]. The implication is that a significant portion of hydrate formation occurs within the dispersed water phase in the primary continuous gas phase, thus highlighting the importance of considering this aspect when modelling and mitigating hydrate risks in gas-dominated pipelines. The results of hydrate prediction flow loop experiments in the literature [
8,
9,
10,
11,
12,
13,
14,
15], have served as the theoretical foundation for validating and interpreting hydrate-related CFD models.
Previous CFD studies on hydrate deposition rates and pipe wall shear stress, using the Eulerian-Eulerian multiphase framework, have focused on enhancing gas-water interfacial interactions [
4,
16,
17]. Neto et al. (2016) [
16] demonstrated that two key regions for hydrate formation develop along the pipeline. The first region is near the inlet, where the reaction rate is high, and the methane concentration dissolved in the liquid phase is low. This region is primarily influenced by mass transfer mechanisms. The second region is closer to the outlet, where the dissolved methane concentration remains constant and reaches its equilibrium value, resulting in the hydrate formation process being governed by reaction kinetics.
Wang et al (2017) [
7] suggest two stages of hydrate formation in an annular-mist gas-liquid flow pattern. The first stage occurs in the liquid film due to higher interfacial interaction, while the second stage takes place in the dispersed liquid phase within the primary gas phase. The study shows that hydrate formation during the first stage is greater than in the second stage. The outcome agrees with the findings of Neto et al. (2016), where the first stage occurs near the inlet of the hydrate-forming section of the pipeline, while the second stage occurs subsequently.
Umuteme et al. (2022) [
4] conducted several CFD simulations using the Eulerian-Eulerian model, and incorporating mass and energy source user-defined functions (UDFs). These UDFs were developed based on the mass transfer model by Turner et al. (2005) [
19] and the incorporation of exothermic hydrate heat of formation in the literature [
13]. The model accurately predicted the hydrate deposition rate from the net gas mass flowrate across the fluid domain. Consequently, a model was now available that can infer hydrate risk in pipelines using the gas mass flowrate which mimicked the gas consumption rate during gas formation, agglomeration and deposition as suggested in previous studies [
11,
20].
Umuteme et al. (2023) [
21] developed a mathematical model for estimating hydrate density, which showed favourable comparison with the results obtained by Li et al. (2013) [
23]. Thus, the work corroborates the positions that the resulting fluctuations in water-induced shear stress along the pipe during hydrate wall shedding, as suggested by Liu et al. (2019) [
24], and the relatively constant gas-induced shear stress during hydrate sloughing, as assumed by Di Lorenzo et al., (2018) [
1] are essential to understanding hydrate behaviour.
Also, the literature [
26] suggests that hydrate sloughing is predominant at lower gas velocities, occurring over a longer distance along the hydrate-forming section until the pipeline is plugged. The study introduces the "sloughing angle" as a new term, indicating that a steeper profile of deposited hydrates at higher velocities corresponds to a higher plugging risk at lower velocities. Lower sloughing angles result in longer sloughing events, leading to a gentler profiling of the hydrate layer over an extended section of the hydrate-forming gas pipeline. Further analytical modelling suggests that pipeline plugging flow time decreases as the hydrate deposition rate increases. Additionally, the transient pressure drop and plugging flow time increase along the length of the pipeline, highlighting the critical impact of hydrate formation on pipeline operations [
27]. Ma et al. (2024) [
28] recently conducted a simulation of a CFD deposition modelling experiment, using hydrates as a discrete phase.
These findings provide a comprehensive framework for understanding hydrate formation, deposition, and the associated risks in gas-dominated pipelines, with significant implications for CFD modelling and industrial applications. By utilizing the validated model developed by Umuteme et al. (2022) [
4], this study enhances the prediction of flow characteristics—such as pressure, temperature, gas density, and phase behaviour—along the pipeline under hydrate-forming conditions. A four-quadrant approach was introduced as discussed later. The pattern suggested in this study enables the prediction of hydrates severity by plotting the water flowrate versus the gas flow rate. The curves were matched with the profile developed in Umuteme et al. (2022) [
4].
The CFD simulations adopted in this study is primarily based on the solubility of natural gas in water at higher pressure and low temperature as suggested in a previous study [
29]. The increase in the solubility of natural gas in water is prompted by thermal cooling at the pipe wall, which occurs due to rising sub-cooling temperatures from the surrounding environment [
4,
16,
19,
30]. The remaining sections of this paper will cover the adopted methodology, describe the Eulerian-Eulerian CFD model, outline the approach to data analysis, define the input variables and boundary conditions, present the results and discussion, and conclude with the major findings.
2. Materials and Methods
This study adopts the validated Eulerian-Eulerian CFD model for predicting the rates of hydrate formation, agglomeration and deposition rate in the literature [
2,
4]. The study is based on the following key theoretical assumptions:
The growth rate of hydrates is primarily influenced by the temperature driving force between the gas and water phases and the gas-water interfacial area [
2,
19].
A higher temperature gradient and larger interfacial area accelerate hydrate formation [
8,
9,
10,
31].
The thermal gradient between the temperature of the wet gas and the pipe wall is a critical factor in determining the induction time for hydrate initiation and growth. Lim et al., (2020) [
33] propose that a steeper thermal gradient results in a shorter induction time for hydrates formation.
Furthermore, the subcooling temperature within the pipeline environment drives thermal transfer by convection, particularly during the turbulent interaction between the water phase and the continuous gas phase [
2].
This thermal transfer enhances the solubility of natural gas in water, which is a precursor to hydrate formation [
2]. Thus, during the initial stages of hydrate formation, a decrease in temperature is observed until it stabilizes during hydrate agglomeration and deposition.
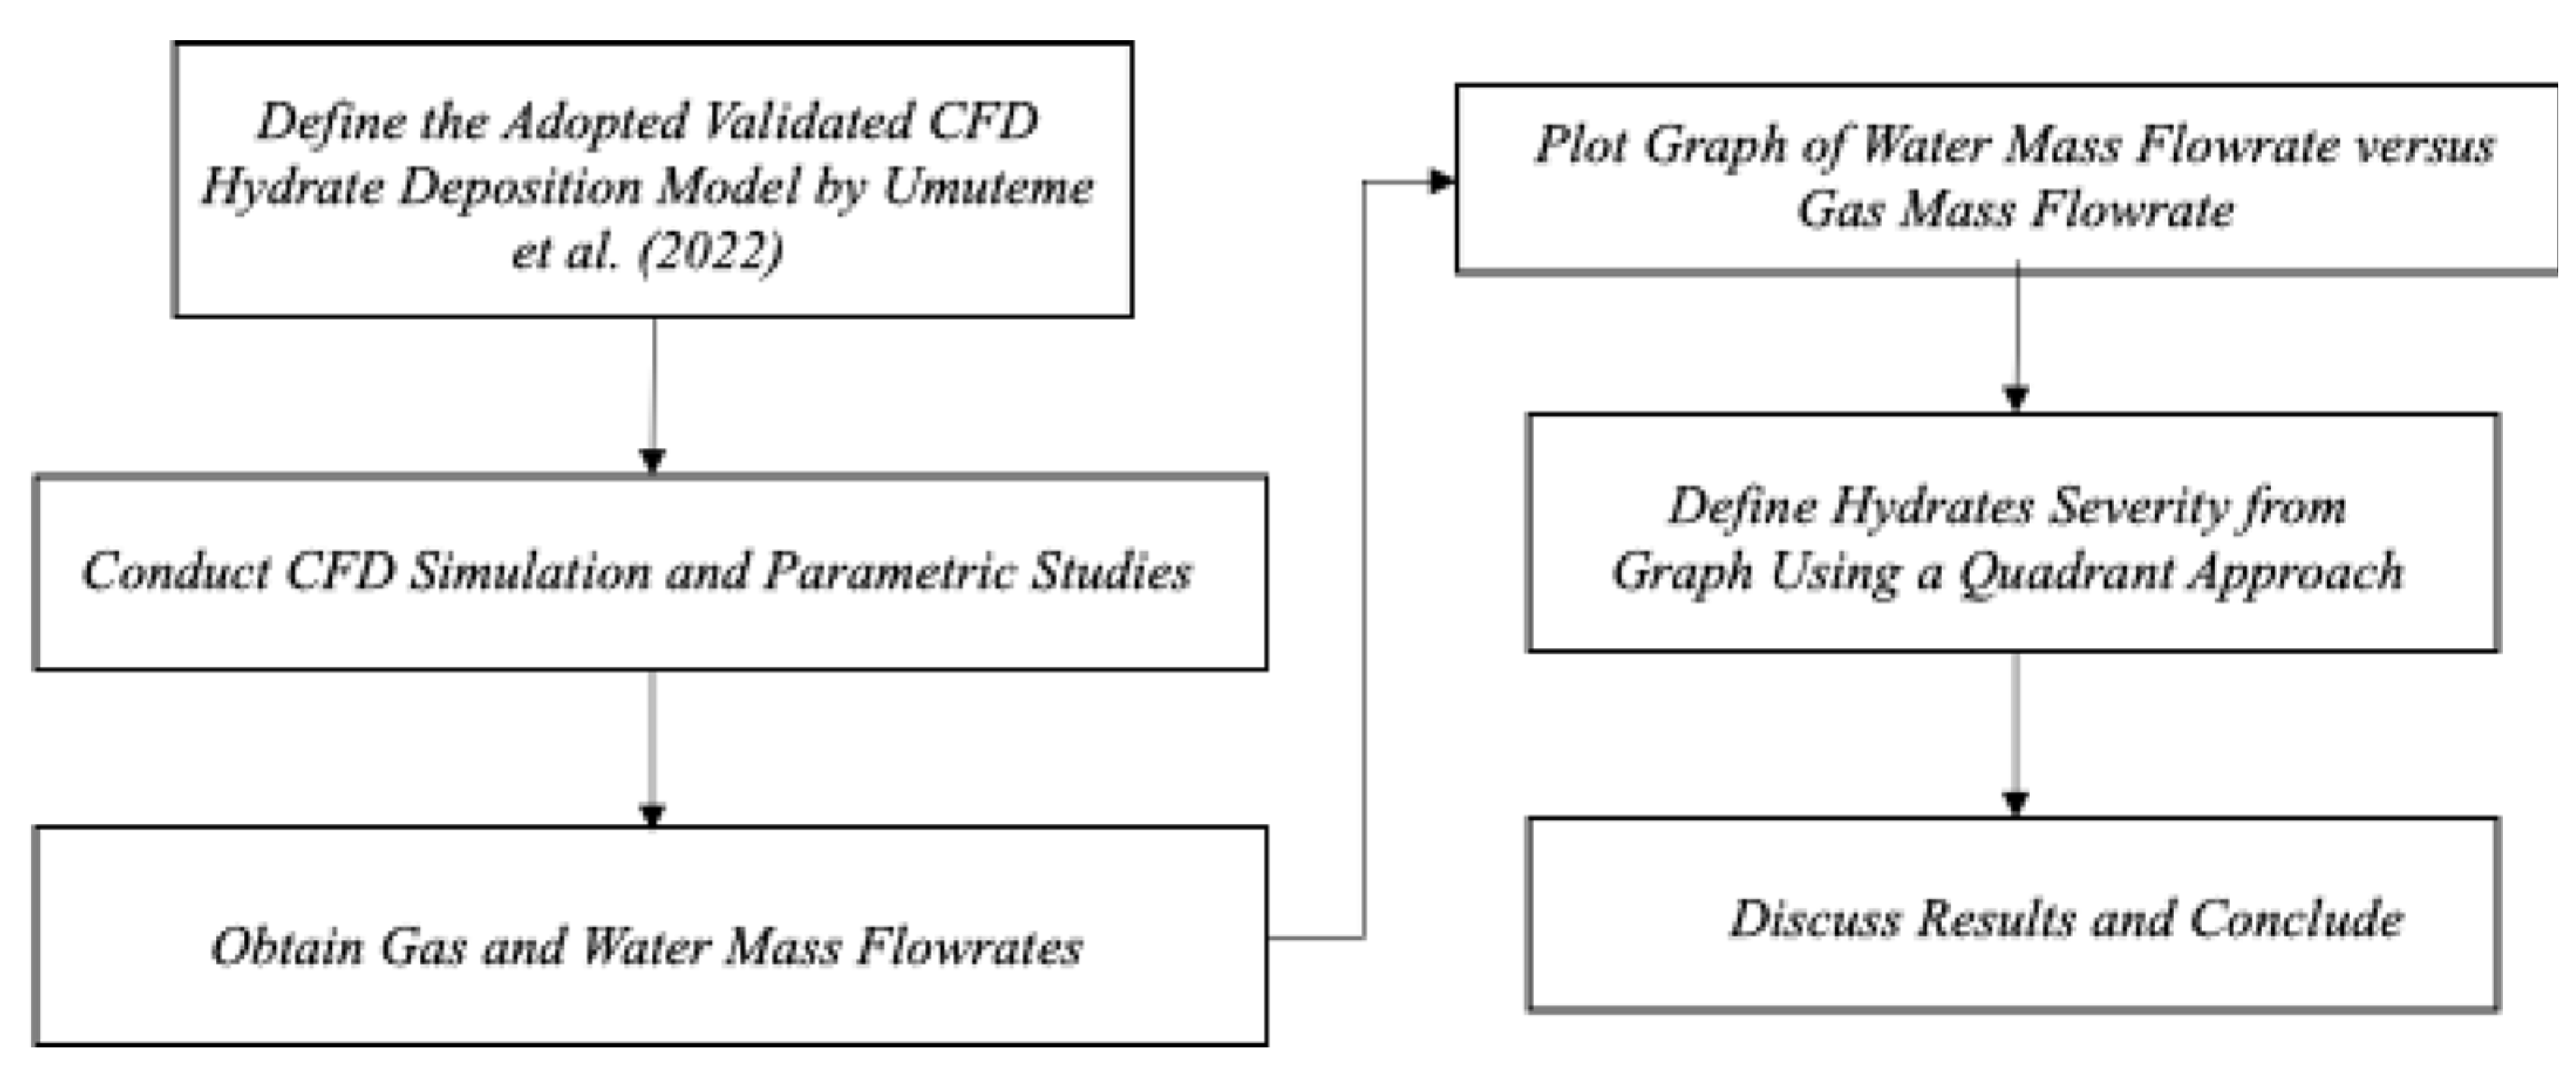
The stages of the adopted methodology are presented in
Figure 1, below.
2.1. CFD Model Description
The validated CFD model for predicting hydrate formation, agglomeration and deposition rates described in the literature [
2,
4] was designed to simulate hydrate deposition on the internal pipe wall by implementing the necessary boundary conditions for hydrate formation. This involved the use of two user-defined function (UDF) codes in Ansys Fluent: one for mass source and another for energy source. The UDF code, written in C++, is based on the gas consumption rate kinetics model proposed by Turner et al. (2005). The code includes a conditional statement to verify if the conditions align with the hydrate equilibrium pressure at the operating temperature, as detailed by Sloan and Koh (2007) [
34]. When these conditions are met, the code injects additional methane gas into the computational domain to enhance gas consumption similar to actual reality in the field. The energy source UDF, which calculates the energy based on the gas injection rate and the heat of hydrate formation [
2,
13], also includes a similar conditional statement. The UDF codes play an essential role in integrating source terms into the continuity and energy conservation equations, ensuring that gas is injected at the specified hydrate-forming temperature and pressure conditions during each simulation time step.
Each simulation case was run for 4.0 seconds with a fixed time step approach, divided into 40 steps of 0.1 seconds each. The gas injection rate, which correlates with the gas consumption rate during hydrate formation, decreases as hydrates deposit to reduce the pipe hydraulic diameter [
2,
4]. The temperature of the gas drops towards the pipe wall due to the sustained subcooling effect, which increases the gas density [
2]. The computational domain used was a 10-meter length by 0.0204-meter diameter smooth pipe section, with a numerical mesh consisting of 900,000 cells as discussed in our previous work [
4].
Figure 2.
2D Control Flow Domain.
Figure 2.
2D Control Flow Domain.
Figure 3.
3D computational domain with 900,000 meshed cells (Adapted from the literarture [
4]).
Figure 3.
3D computational domain with 900,000 meshed cells (Adapted from the literarture [
4]).
The simulated multiphase flow comprises methane gas as the primary phase and water as the secondary phase. The primary phase is the continuous fluid, occupying the majority of the flow volume, while the secondary phase is dispersed within the primary phase in smaller amounts. Empirical data indicate that the solubility of methane in water increases with decreasing temperature and increasing pressure [
29]. Under the simulated hydrate-forming conditions of 8.8 MPa pressure and temperatures below 292 K, methane gradually dissolves into the water, resulting in a methane-enriched solution. As the temperature continues to decrease and more methane dissolves, the solution becomes supersaturated with methane, leading to hydrate formation [
2,
4]. To further explore the impact of flow conditions on hydrate formation, the study varied the flow velocity, as increased flow agitation is known to enhance hydrate formation [
35]. This allowed the study to examine the response of the model to changes in velocity and subsequent impact on hydrates severity. A similar parametric study was carried on the effect of subcooling temperature and water volume fraction.
2.2. Equations
The following equations underpin the model’s conservative and turbulence equations:
Turbulence Models
The terms in the equations are defined in the attached nomenclature. Simulations were terminated when excessive transient pressure rise was observed. The average gas mass flow rate was monitored as an indicator of gas consumption for hydrate formation. Hydrate deposition was estimated based on the pressure drop profile outlined by Liu et al. (2020) and the hydrate curve profile suggested in Umuteme et al (2022). Further details on the adopted equations, input data, conversion of gas injection rate to hydrate deposition rate, and the effects of subcooling temperatures and gas velocity on hydrate formation, have been discussed in Umuteme et al. (2022).
2.3. Data Analysis
At the end of the simulation, transient pressure, temperature, and gas mass flowrate from where the hydrates severity curve was derived. From this point forward, mass flowrate and flowrate will be used interchangeably and mean the same phenomenon of gas or water flow. The temperature contour maps of the primary gas phase were analysed to characterize the predicted hydrate deposit profile on the pipe wall. The approach outlined in the literature (Umuteme, 2024; Umuteme et al., 2022) was adopted to interpret the transient hydrate graphs, based on the experimental profiles for pressure and temperature discussed in Liu (2020).
2.4. Input Variables, and Boundary Conditions
The simulations were conducted with pipe wall subcooling temperatures ranging from 2 - 8 K below the fluid inlet temperature of 292 K and velocities between 0.5 - 8.8 m/s. Water volume fraction ranges from 0.01 – 0.10. The natural gas operating pressure was set at 8.8 MPa for all simulations. The temperatures and pressures for gas injection are maintained by the mass and energy UDF codes at each time step. The outlet pressure is predicted by the simulation.
Mass and energy sources for the continuity and momentum equations are provided by the UDF codes, as previously described. The simulation at a higher velocity of 8 m/s and a subcooling temperature of 8 K is based on empirical evidence suggesting that increased hydrate deposition or sloughing is associated with higher subcooling temperature. Although the study does not replicate previous experiments, it builds upon existing research, with parameters for gas properties, flow velocities, temperature, and pressure derived from the literature [
8,
9,
10]. The water phase properties from Ansys Fluent software have been retained, and additional details regarding the conditions and properties of the gas and water used in the simulation can be found in the literature [
4].
3. Results
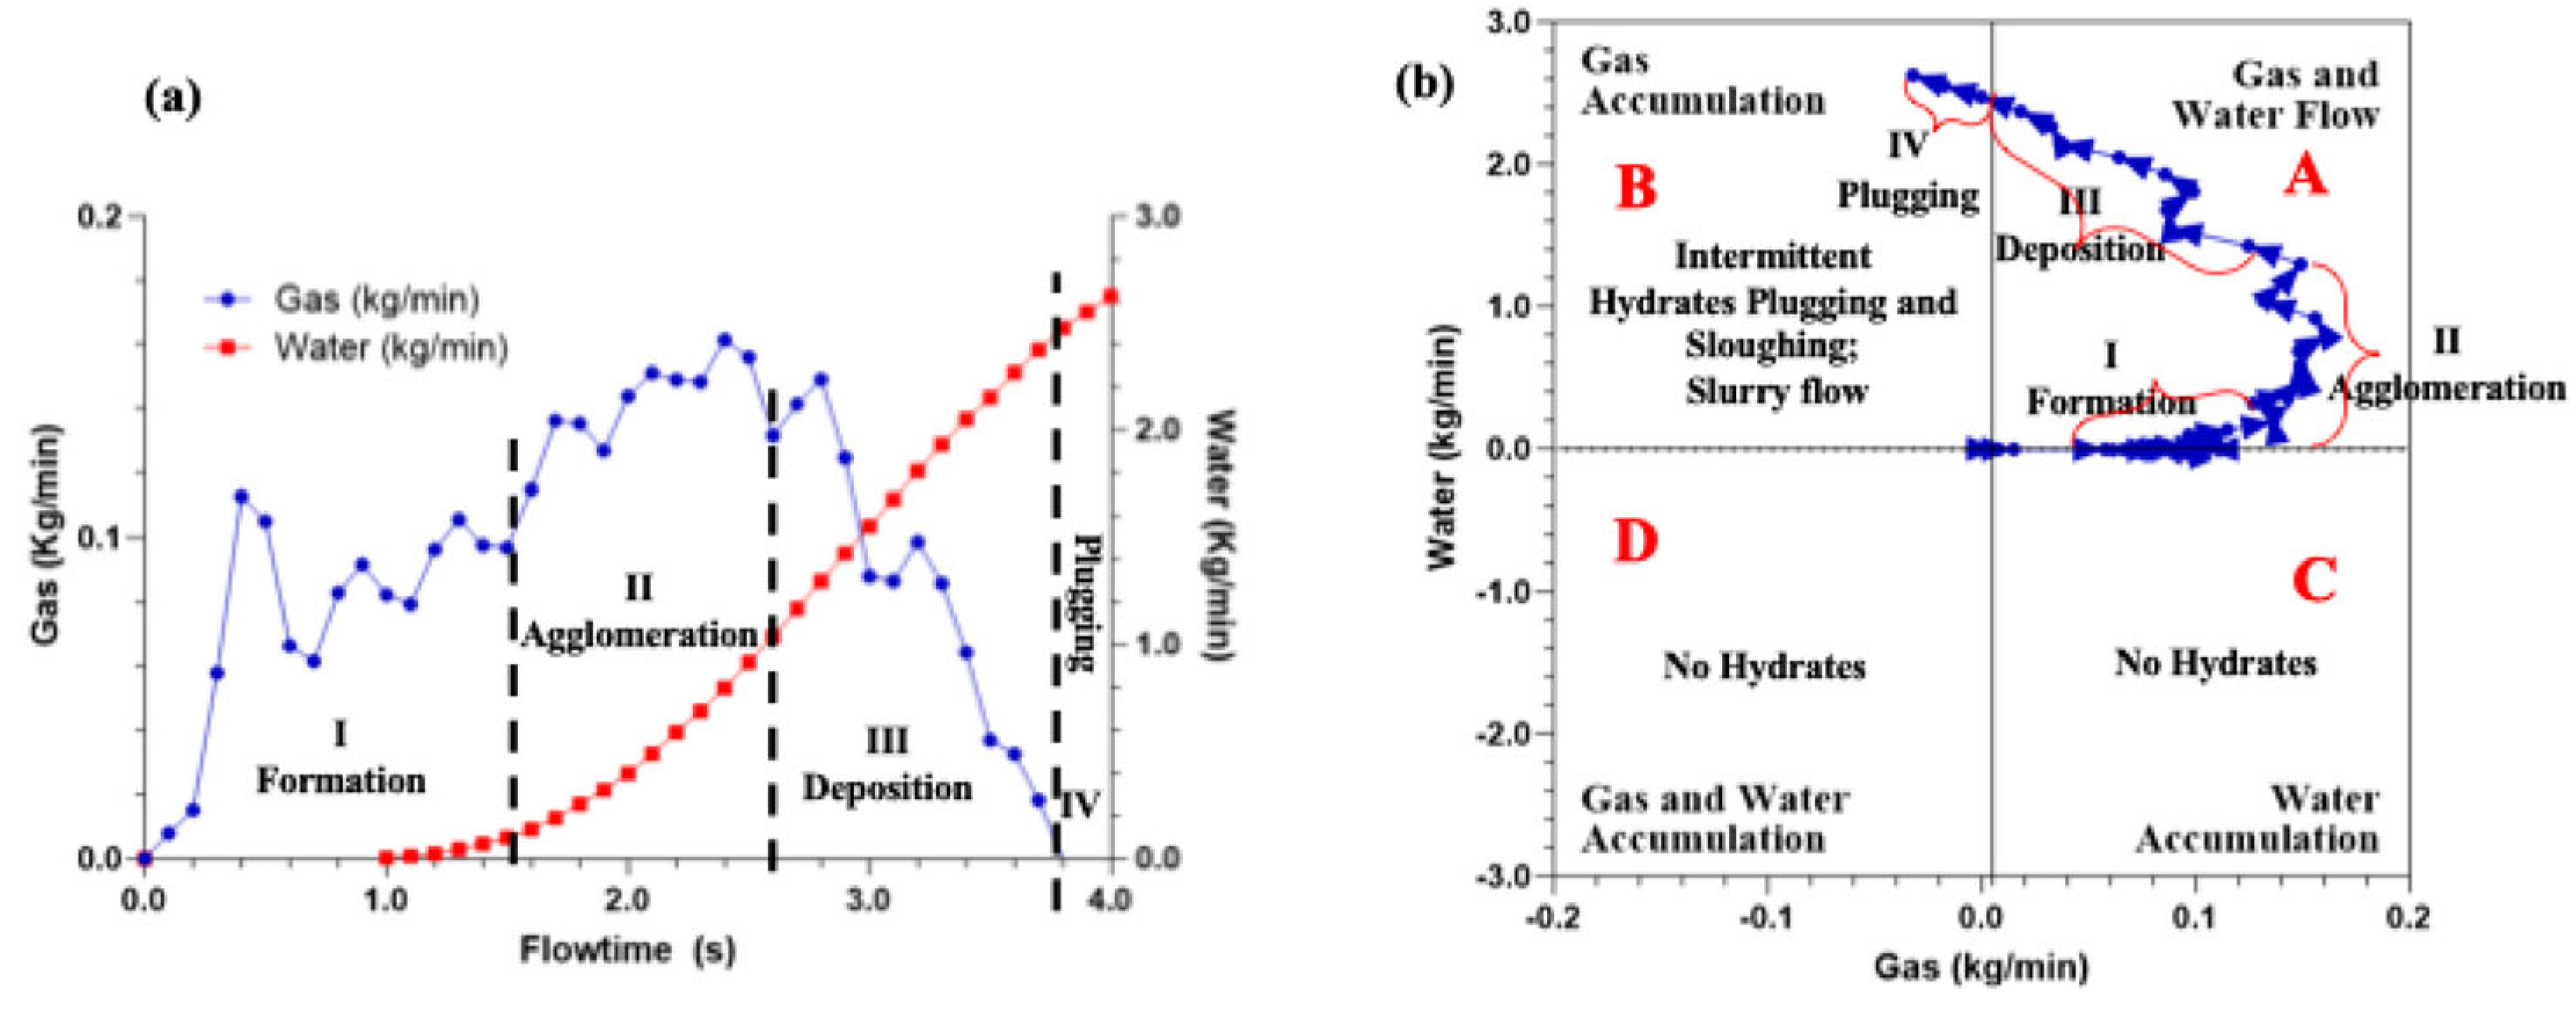
The outcome of plotting the resulting water flowrate on the vertical axis and the gas flowrate on the horizontal axis (
Figure 7b) provided a pattern that enabled the prediction of the severity of hydrates within the parametric corridor studied. Thermal contours were taken across the pipe length, and the effect of varying gas velocity and subcooling temperature shows the annular profile predicted in hydrate conditions along a gas pipeline.
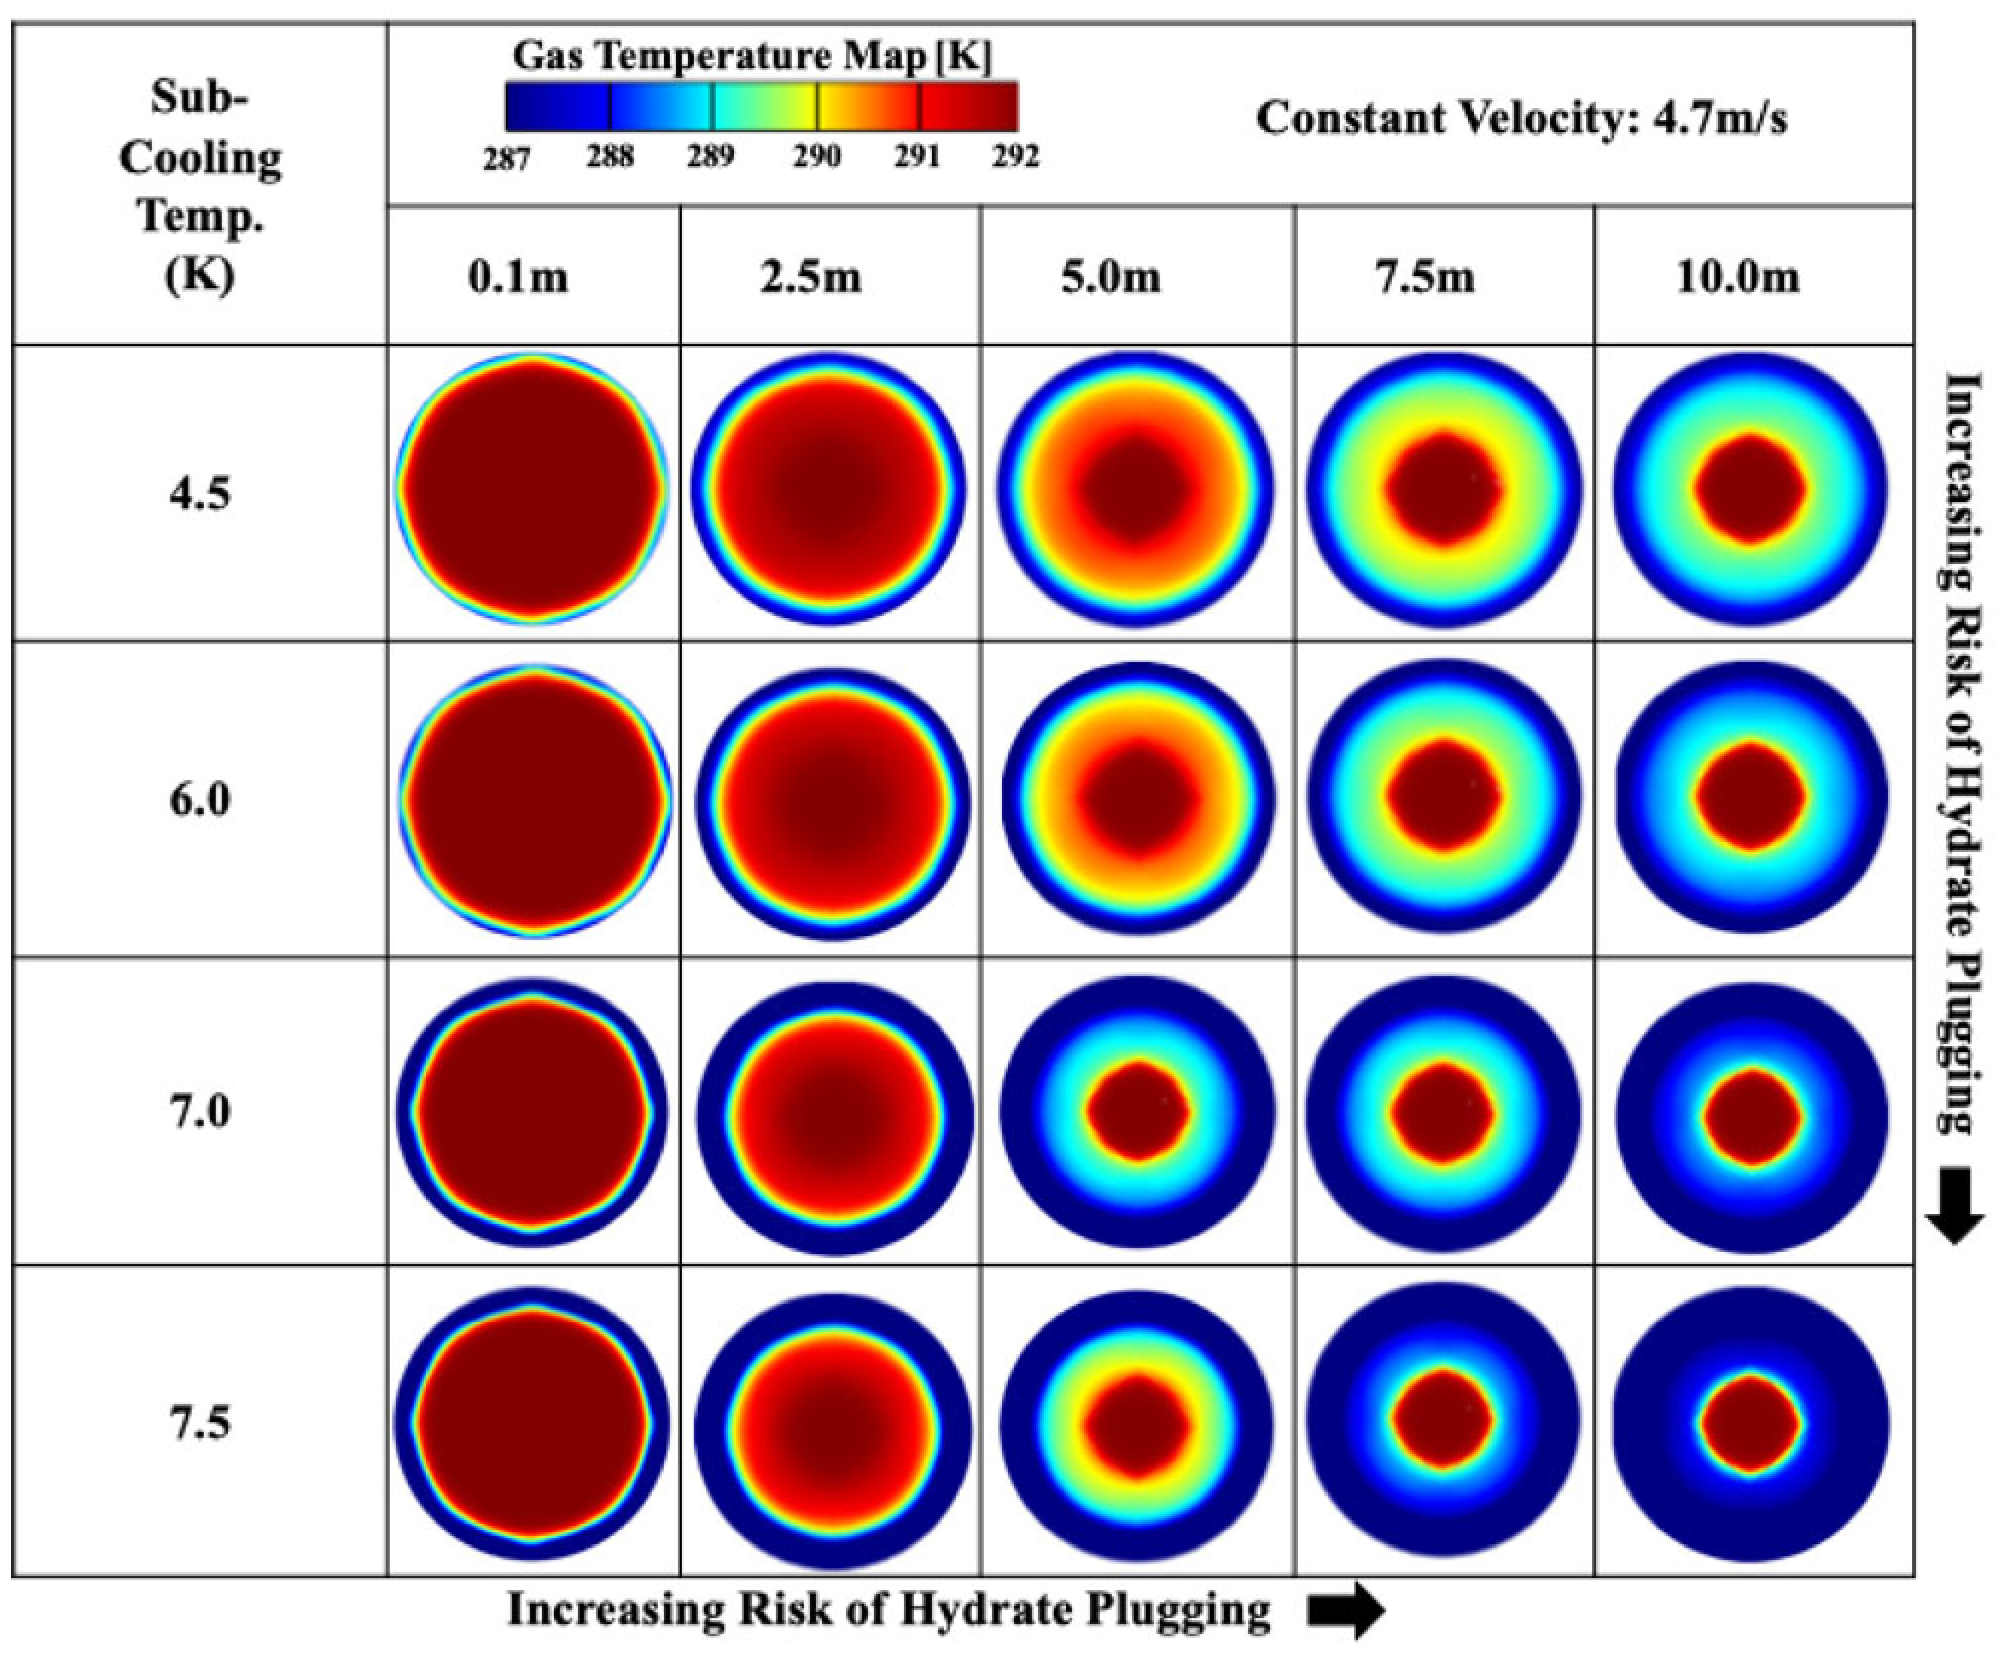
Figure 4 presents gas temperature contours in a pipeline at a constant gas velocity of 4.7 m/s under varying subcooling temperatures. The colour gradient, ranging from red to blue, represents different temperature levels, with red indicating higher temperatures of 292 K and blue representing lower temperatures of 287 K, as shown by the colour scale. Each row in
Figure 4 corresponds to a specific subcooling temperature, and each column represents progressive cooling stages along the length of the pipeline section experiencing hydrates. As the subcooling temperature increases, the gas temperature at the centre of the pipeline decreases more significantly (evidenced by the transition from red to blue). This pattern suggests that higher subcooling temperatures, leading to greater temperature gradients within the pipeline, influence hydrate formation and the likelihood of plugging. The progression from warm to cooler zones along the radial direction implies that heat transfer is occurring from the centre toward the walls of the pipe.
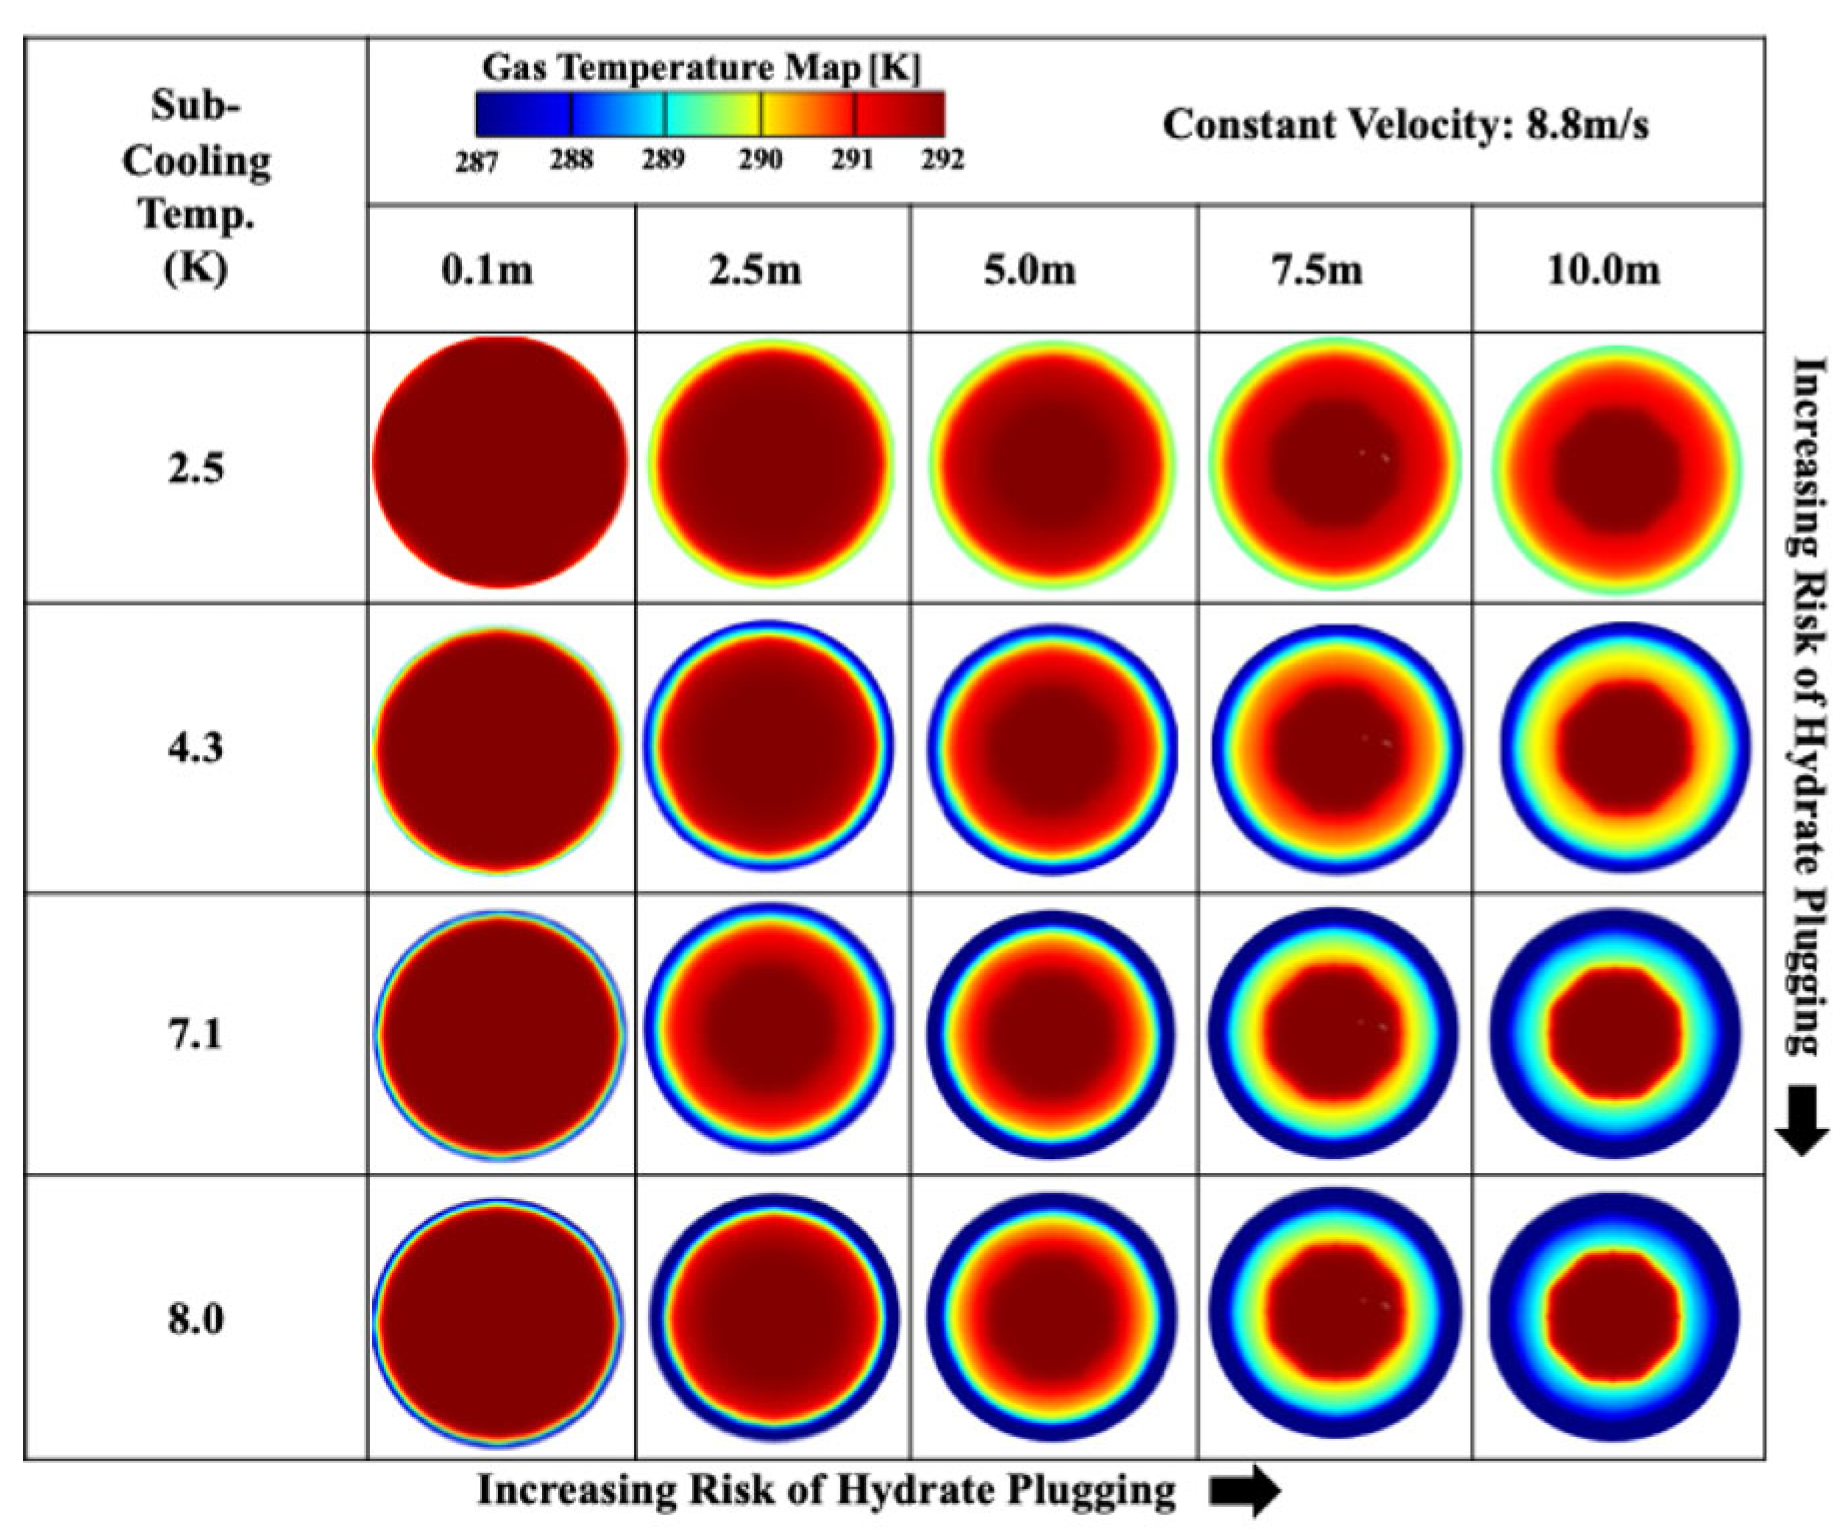
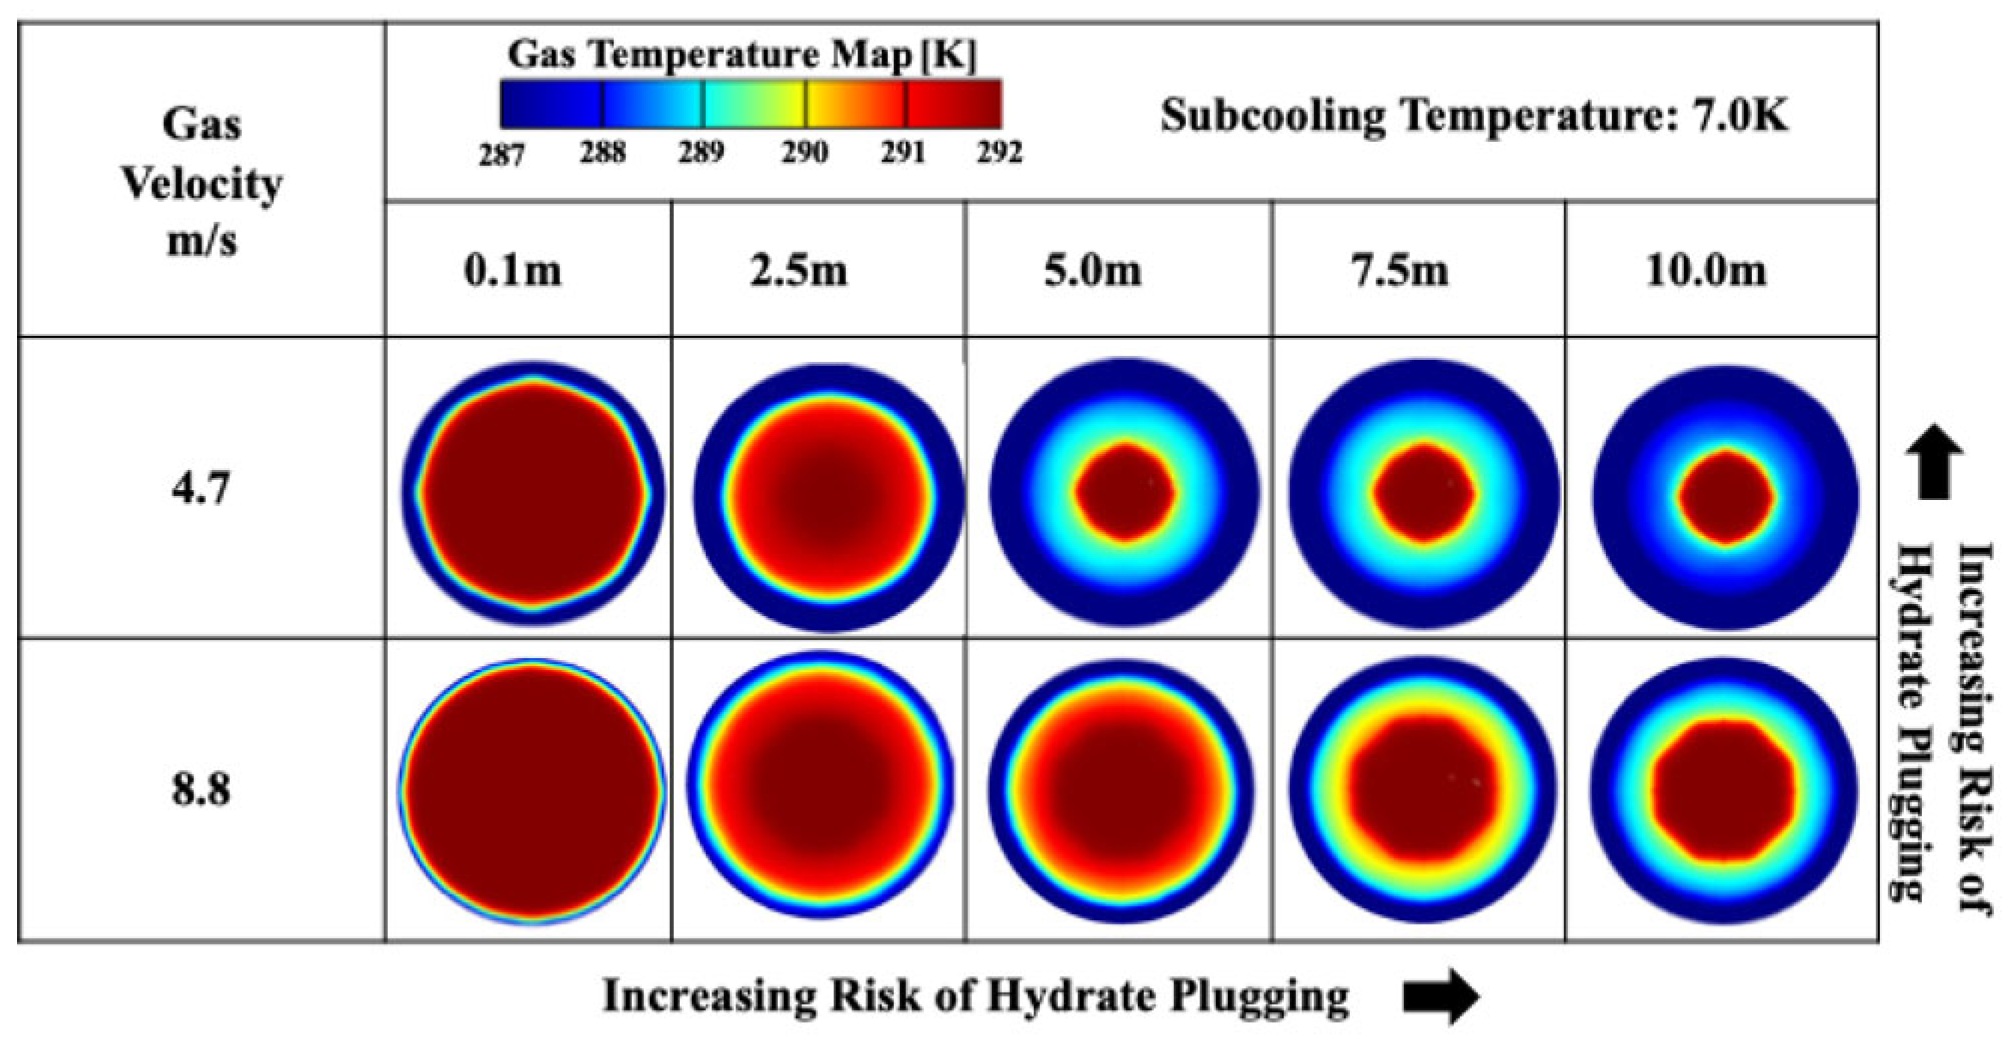
The above observation is similar at a higher gas velocity of 8.8 m/s. However, the cooling gradient is more pronounced at the lower gas velocity of 4.7 m/s as observed in
Figure 6.
Figure 5.
Gas Temperature Contours at Constant Gas Velocity of 8.8 m/s and Varying Subcooling Temperatures.
Figure 5.
Gas Temperature Contours at Constant Gas Velocity of 8.8 m/s and Varying Subcooling Temperatures.
Figure 6.
Comparison of Gas Temperature Contours at Low and High Gas Velocity at Constant Subcooling Temperature of 7.0 K.
Figure 6.
Comparison of Gas Temperature Contours at Low and High Gas Velocity at Constant Subcooling Temperature of 7.0 K.
Figure 7.
Gas and Water Mass Flowrates at Gas velocity of 8 m/s and Subcooling Temperature of 7.0 K: (a) Graph comparing gas and water mass flowrates; (b) Graph of water mass flowrate versus gas mass flowrates superimposed in a quadrant.
Figure 7.
Gas and Water Mass Flowrates at Gas velocity of 8 m/s and Subcooling Temperature of 7.0 K: (a) Graph comparing gas and water mass flowrates; (b) Graph of water mass flowrate versus gas mass flowrates superimposed in a quadrant.
The sign convention in
Figure 7b is defined as follows: positive flowrate suggests flow across the pipeline section, while negative flowrates suggest accumulation of the phase in the pipeline section. Flowrates in kg/min were obtained by multiplying the predicted values in kg/s by Ansys Fluent with (-60). The usual fluent sign convention is – positive imply flow accumulation within the fluid domain, while negative flowrate values suggest flow across the fluid domain.
The quadrants are labelled RED and defined as follows:
Quadrant-A: Gas-Water Flow
Once the natural gas hydrates conditions are met, hydrates start forming at the initial gas and water flowrate (kg/min) until the gas mass flowrate is reduced signifying hydrates agglomeration. During agglomeration, the water flowrate rises significantly reaching a maximum value which suggests the beginning of hydrates deposition along the hydrate forming section of the gas pipeline. During the hydrate agglomeration stage, the gas flowrate was relatively stable. The agglomeration period can be short-lived at higher gas velocity and lower subcooling temperatures. These observations are supported by experimental outcomes as discussed further afterwards. During hydrates deposition, the gas flowrate reduces significantly until no gas flow outside the pipeline, signifying the beginning of pipeline plugging by hydrates. The increase in water flowrate is also reduced during deposition. The hydrates forming, agglomeration and deposition within the “Gas-Water Flow” quadrant were mostly observed at a constant subcooling temperature of 7 K, gas flow velocity range of 2 – 6 m/s and water volume fraction of 0.06. Here, both water and gas are flowing (positive values for both water and gas).
Quadrant-B: Gas Accumulation
This quadrant predicts the severity of hydrates plugging depending on how the curve extends into the quadrant. The negative value of gas flowrate suggests gas accumulation, while the rise in water flowrate is determined by the subcooling temperature, water volume fraction and the availability of gas which is the career phase. Accumulation of gas increase the pressure in the pipeline which is a critical risk factor in the operation of hydrates-forming gas pipelines. Hydrates plugging in the gas pipeline was mostly favoured under the combined conditions of are higher gas flow velocity of 8 m/s or higher, subcooling temperature of 7 K or higher, and water volume fraction of 0.06 or higher. This quadrant represents conditions where water is flowing across the pipeline section (positive values) while gas is accumulating (negative values for gas flow).
Quadrant-C: Water Accumulation.
This quadrant had no hydrates, with an initial increase in gas flowrate reaching a maximum before reducing. Under this condition, water flowrate reduces accumulating water in the pipeline. The reduction in gas flowrate along the pipeline due to the increase in water volume fraction at a gas velocity below 1 m/s. In this study, this condition was favoured under the flow velocity of 0.2 – 0.5 m/s and water volume fraction of 0.1 – 0.2, and higher subcooling temperature of 8 K. This quadrant shows where water is accumulating (negative values for water flow) while gas is flowing (positive values for gas flow).
Quadrant-D: No-Flow
The flow condition in quadrant C, extends to Quadrant D, with a fully reduced outward flowrate of gas, leading to the accumulation of gas and water within he pipelines. The simulation conditions relating to this observation are similar to those of Quadrant C. This quadrant represents conditions where both gas and water are accumulating (negative values for both gas and water flow).
The interpretation of hydrates severity is based on the explanation provided for
Figure 7b.
3.1. Change in Gas Velocity at Constant Subcooling Temperature
The graph in
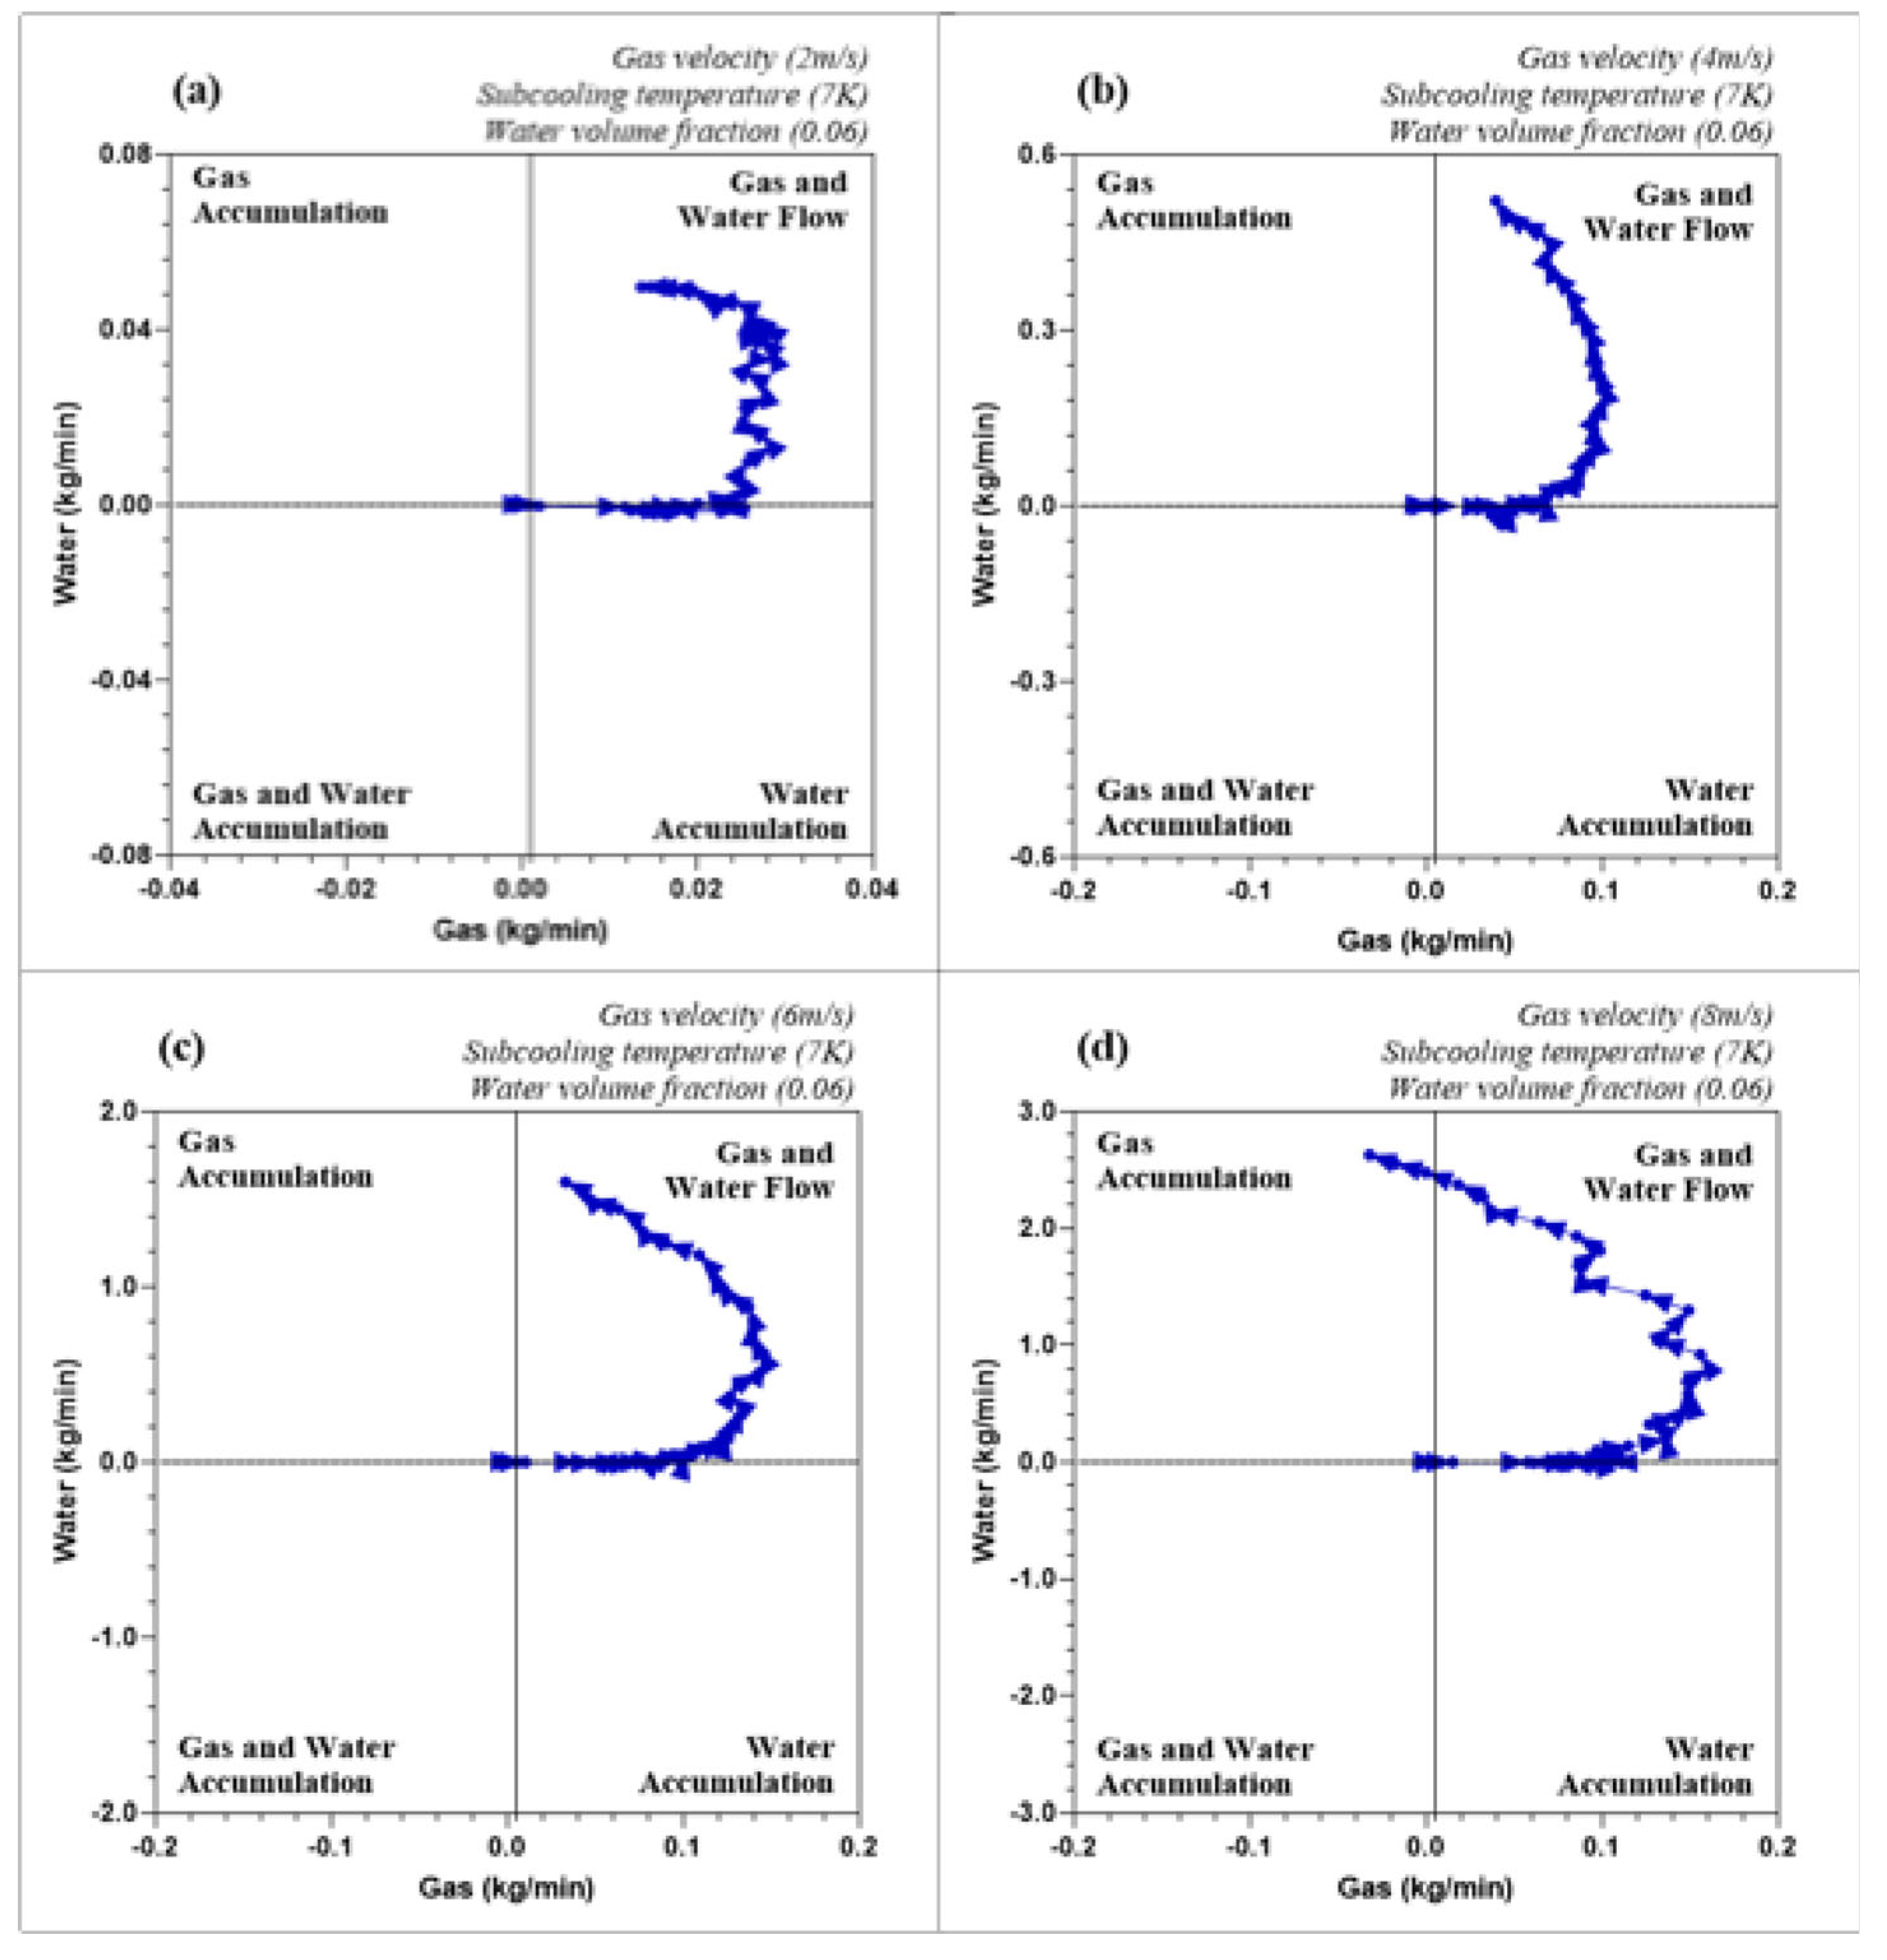
Figure 8a at a gas velocity is 2 m/s indicates a condition of extended agglomeration with reduced deposition. The extended agglomeration time coupled with the very low water flow rate also suggest a delay in pipeline hydrate plugging events. Also, the initial gas flowrate is very low, at at a maximum of 0.021 kg/min. Similarly, the graph in
Figure 8b at a gas velocity of 4 m/s shows comparable behaviour as in
Figure 8a, but with a higher magnitude of hydrates agglomeration and deposition. Under this condition, the gas flowrate reached a maximum of 0.08 m/s. Still there was no hydrates plugging risk. Extended deposition rate was observed at the gas velocity of 6 m/s in
Figure 8c, with a suggestion of higher hydrates deposition. Again, no hydrates plugging risk was observed. A higher hydrates plugging risk under the flow condition studied in this section was observed in
Figure 8d at the gas velocity of 8 m/s gas velocity, Thus,
Figure 8 shows that as the gas velocity increases from
Figure 8a–d, the graphs show a progression towards more risk of hydrate plugging in the pipeline.
Since higher gas velocity increased the risk of hydrates plugging, the next sensitivity was carried out at a higher gas velocity of 8.8 m/s.
3.2. Change in Subcooling at Constant Velocity 8.8 m/s
The four graphs in
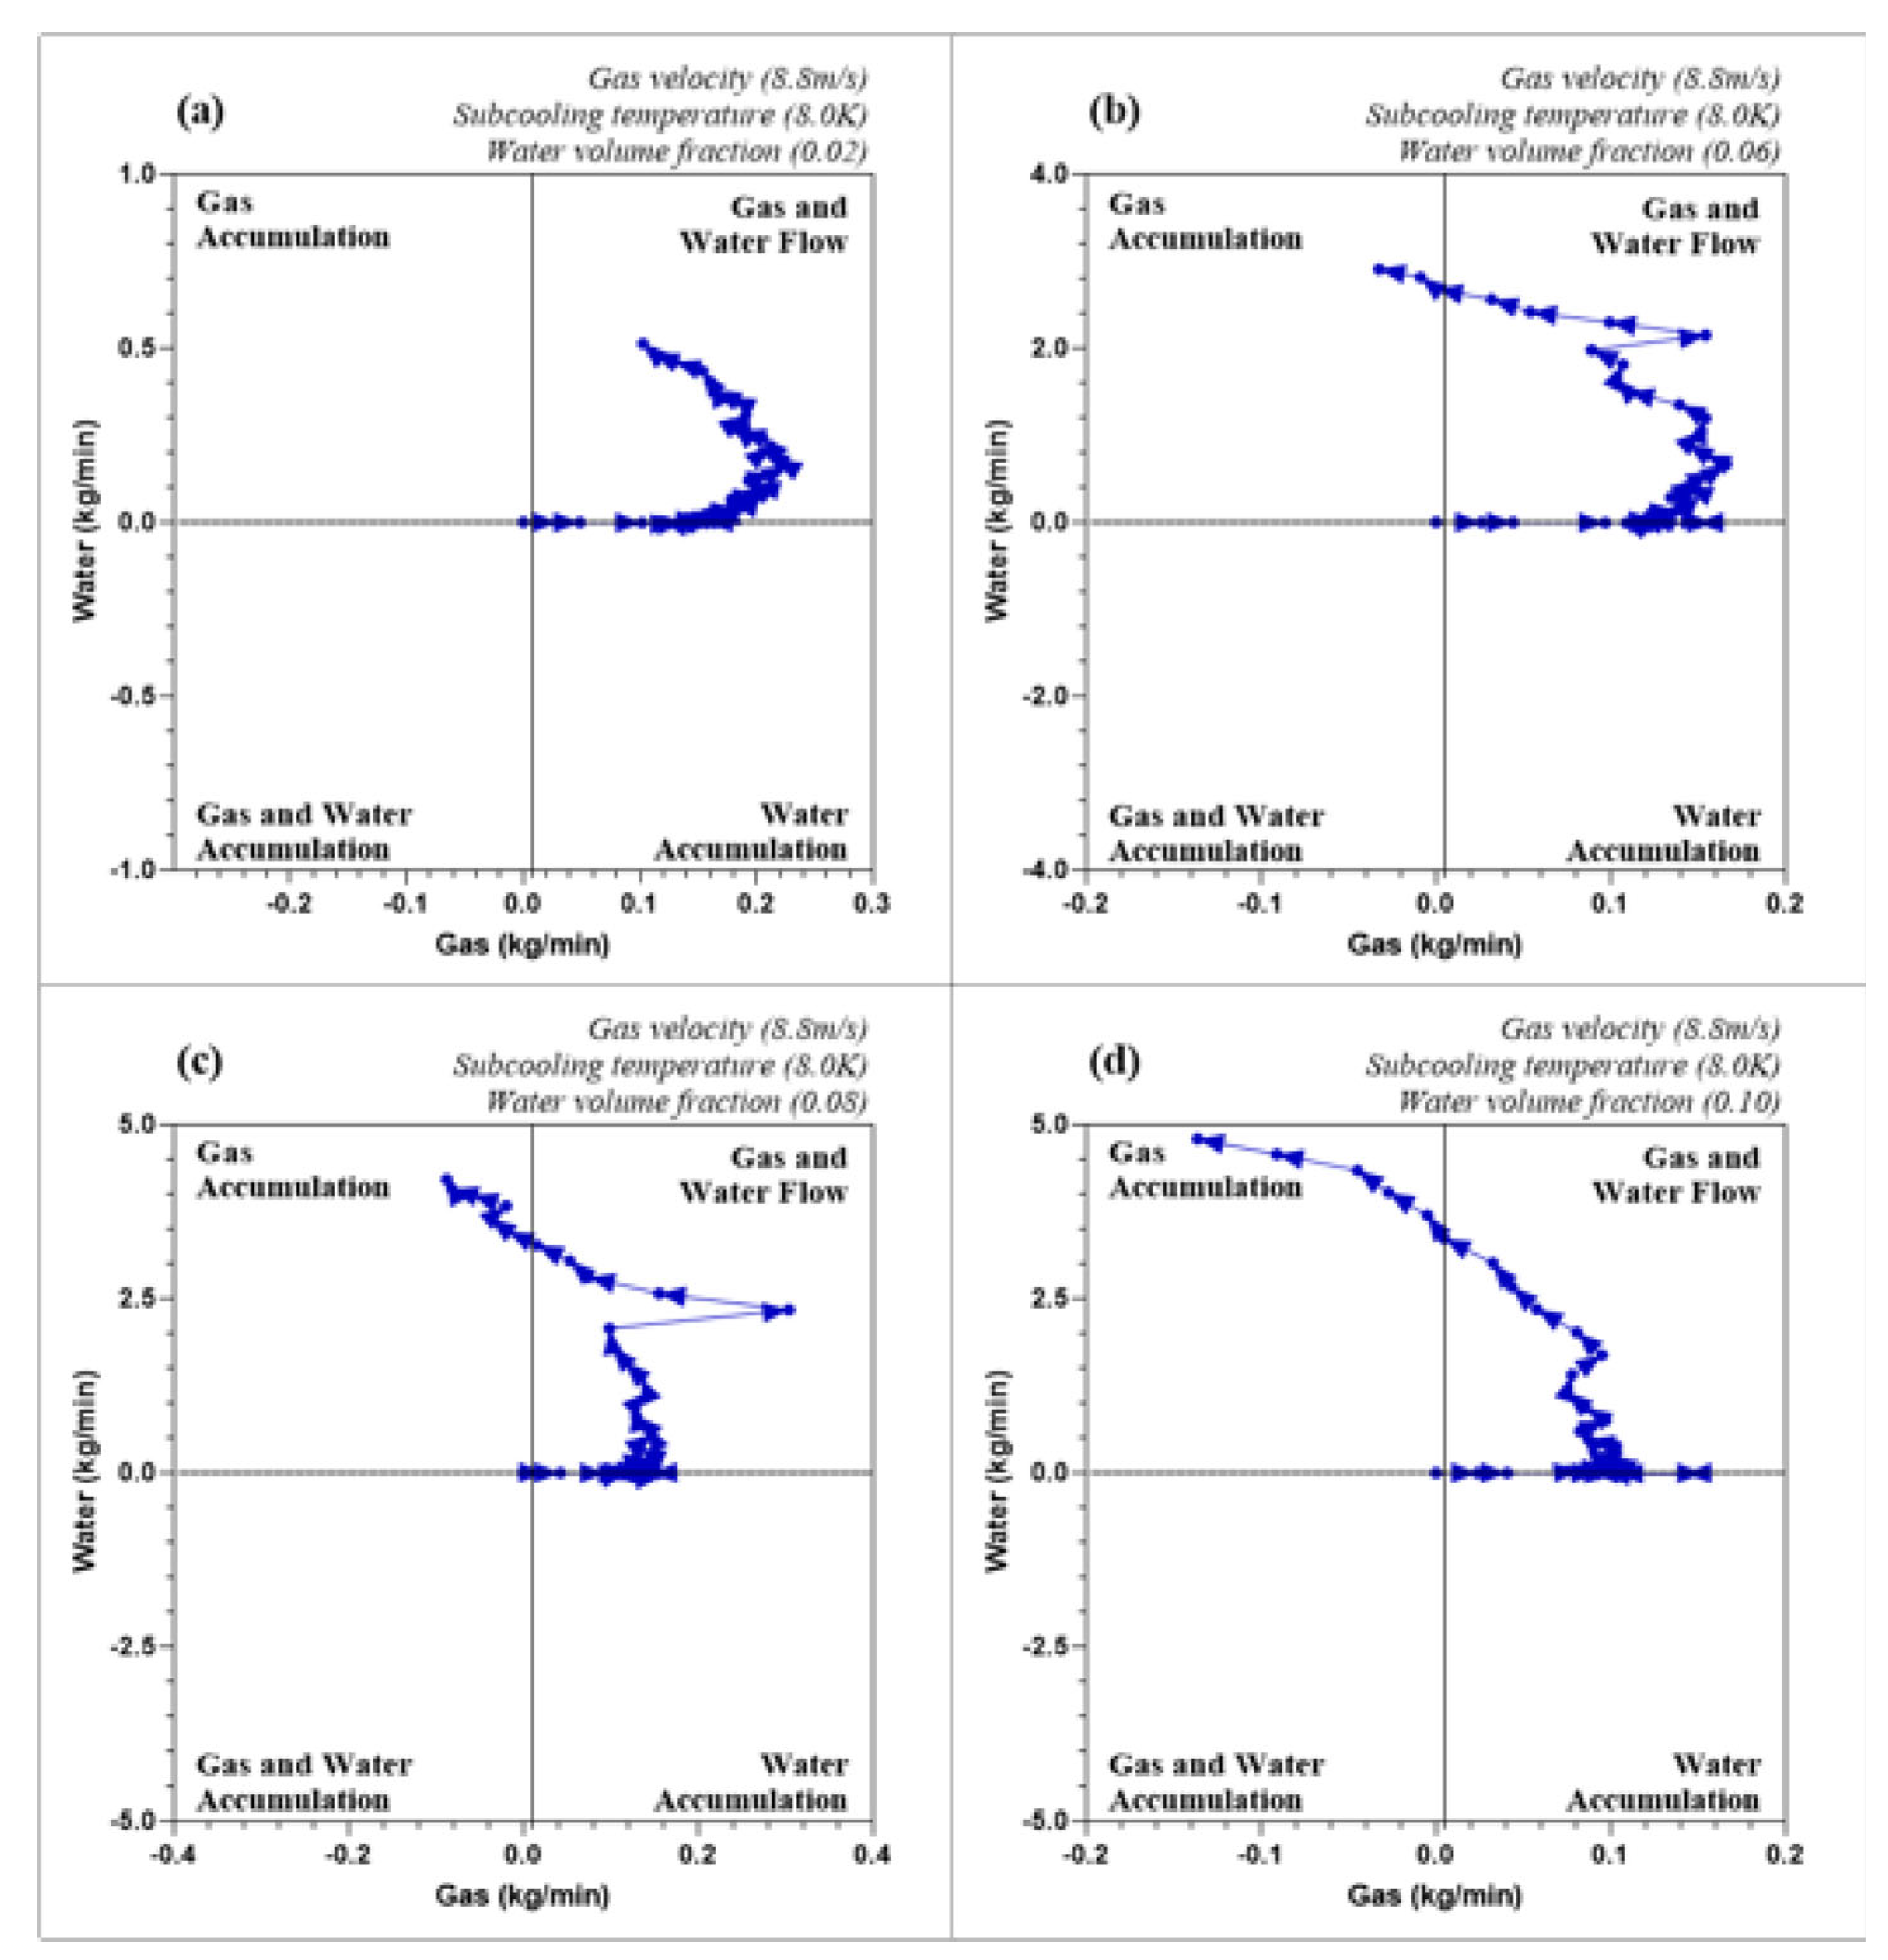
Figure 9a–d, depict the relationship between gas and water mass flowrates in a gas pipeline at different subcooling temperatures of 2.5, 4.3, 7.1 and 7.5 K and constant gas velocity of 8.8 m/s and water volume fraction of 0.06. At the subcooling temperature of 2.5 K (
Figure 9a), the plot shows an initial gas flow increases to a maximum value of 0.1 kg/min, which corresponds with the onset of hydrates formation as described in
Figure 7b. Thereafter, agglomeration and deposition occurred simultaneously with increasing water flowrate and reduced gas flowrate. As the water flowrate increased to 0.05 kg/min, the pipeline started experiencing hydrates plugging events in Quadrant B, where gas accumulation occurred. Gas accumulation increases to a maximum of 0.18kg/min, which can increase sloughing and lower the risk of plugging.
Similarly, at 4.3 K, the gas flowrate increased until 0.1 kg/min with the inset of hydrates formation, and thereafter hydrates agglomeration and deposition happened simultaneously. The onset of pipeline plugging is also evident when gas flowrate was 0 kg/min, before the commencement of gas accumulation in the pipeline because of the obstruction created at the pipe exit by the depositing hydrates on the pipeline wall growing into the annulus (Umuteme et al, 2023b). Again, gas accumulation increased to a maximum of 0.15kg/min, which can increase sloughing and lower risk of plugging. However, compared with the subcooling temperature of 2.5 K, the hydrates plugging risk is higher at subcooling temperature of 4.3 K because of the lower maximum gas accumulation rate.
As the subcooling temperature increases to 7.1 K and 8.0 K, the agglomeration section as described in
Figure 7b is more pronounced. Thus, suggesting that agglomeration and deposition are two distinct events at higher subcooling temperatures, which is evident from
Figure 8a–d, discussed earlier. Specifically,
Figure 9c,d suggest that the agglomeration period increases as the subcooling temperature increases. This occurrence supports literature evidence that hydrates plugging risks increase with increasing subcooling temperature at constant gas velocity and water velum fraction. The plugging risk at the subcooling temperature of 8.0 K is higher because of the lower rate of maximum gas accumulation of 0.03 kg/min, when compared with the subcooling temperature of 7.1 K with a maximum gas accumulation rate of 0.08 kg/min.
Figure 9.
4-Quadrant Definition of Hydrates Severity at Constant Gas Velocity of 8.8 m/s and Water Volume Fraction of 0.06, and Varying Subcooling Temperature.
Figure 9.
4-Quadrant Definition of Hydrates Severity at Constant Gas Velocity of 8.8 m/s and Water Volume Fraction of 0.06, and Varying Subcooling Temperature.
The indications in
Figure 9a–d, suggest that agglomeration and deposition are instantaneous at lower subcooling temperature, resulting in a lower hydrate plugging risk. Hence, the study proposed that hydrates plugging risk increases when the gas accumulation rate after initial plugging is low. The resulting compression of gas during plugging can increase sloughing and reduce the early loss of hydraulic diameter.
3.3. Increasing Water Volume Fraction at Constant Gas Velocity and Subcooling Temperature
The parametric analysis conducted in this section is to mimic the reality of increasing water production during gas processing, as the subsequent transportation in subsea gas pipelines can hinder flow assurance. Water volume fraction was increased from 0.02 to 0.1. For each increase, the gas and water flowrates were observed. Limited agglomeration and deposition was observed in
Figure 10a, when the water volume fraction was 0.02, but there was no hydrates plugging events in the pipeline. This can be attributed to the higher gas velocity of 8.8 m/s which was able to provide the inertia that transported the deposited hydrates by sloughing and pipewall shedding. As the water volume fraction increased to 0.06, in
Figure 10b, an extending period of agglomeration was observed as the gas velocity was relatively constant, before reducing during deposition. Again, hydrates deposition was extensive in
Figure 10c at a water volume fraction of 0.06 when compared to a lower water volume fraction of 0.02. An increase in plugging risk was observed at a water volume fraction of 0.08, where hydrates agglomeration and deposition were also noticed to have increased. The observation in
Figure 10d, at a water volume fraction of 0.10 was similar with that in
Figure 10c, except that plugging period was extensive. However, the increased accumulation of gas predicts a lower hydrates plugging risk.
The indication from the observations in
Figure 10a–d, provide an understanding of the flow of hydrate slurries at higher water volume fractions. Thus, hydrates plugging risk is higher at water volume fractions of 0.06 and 0.08. Implying that there is an optimum level of water volume fraction. Before and after this value, hydrate plugging risk is reduced in a gas pipeline.
3.4. Low Flow Velocity and Higher Water Volume Fraction
This parametric study was conducted with the following inputs:
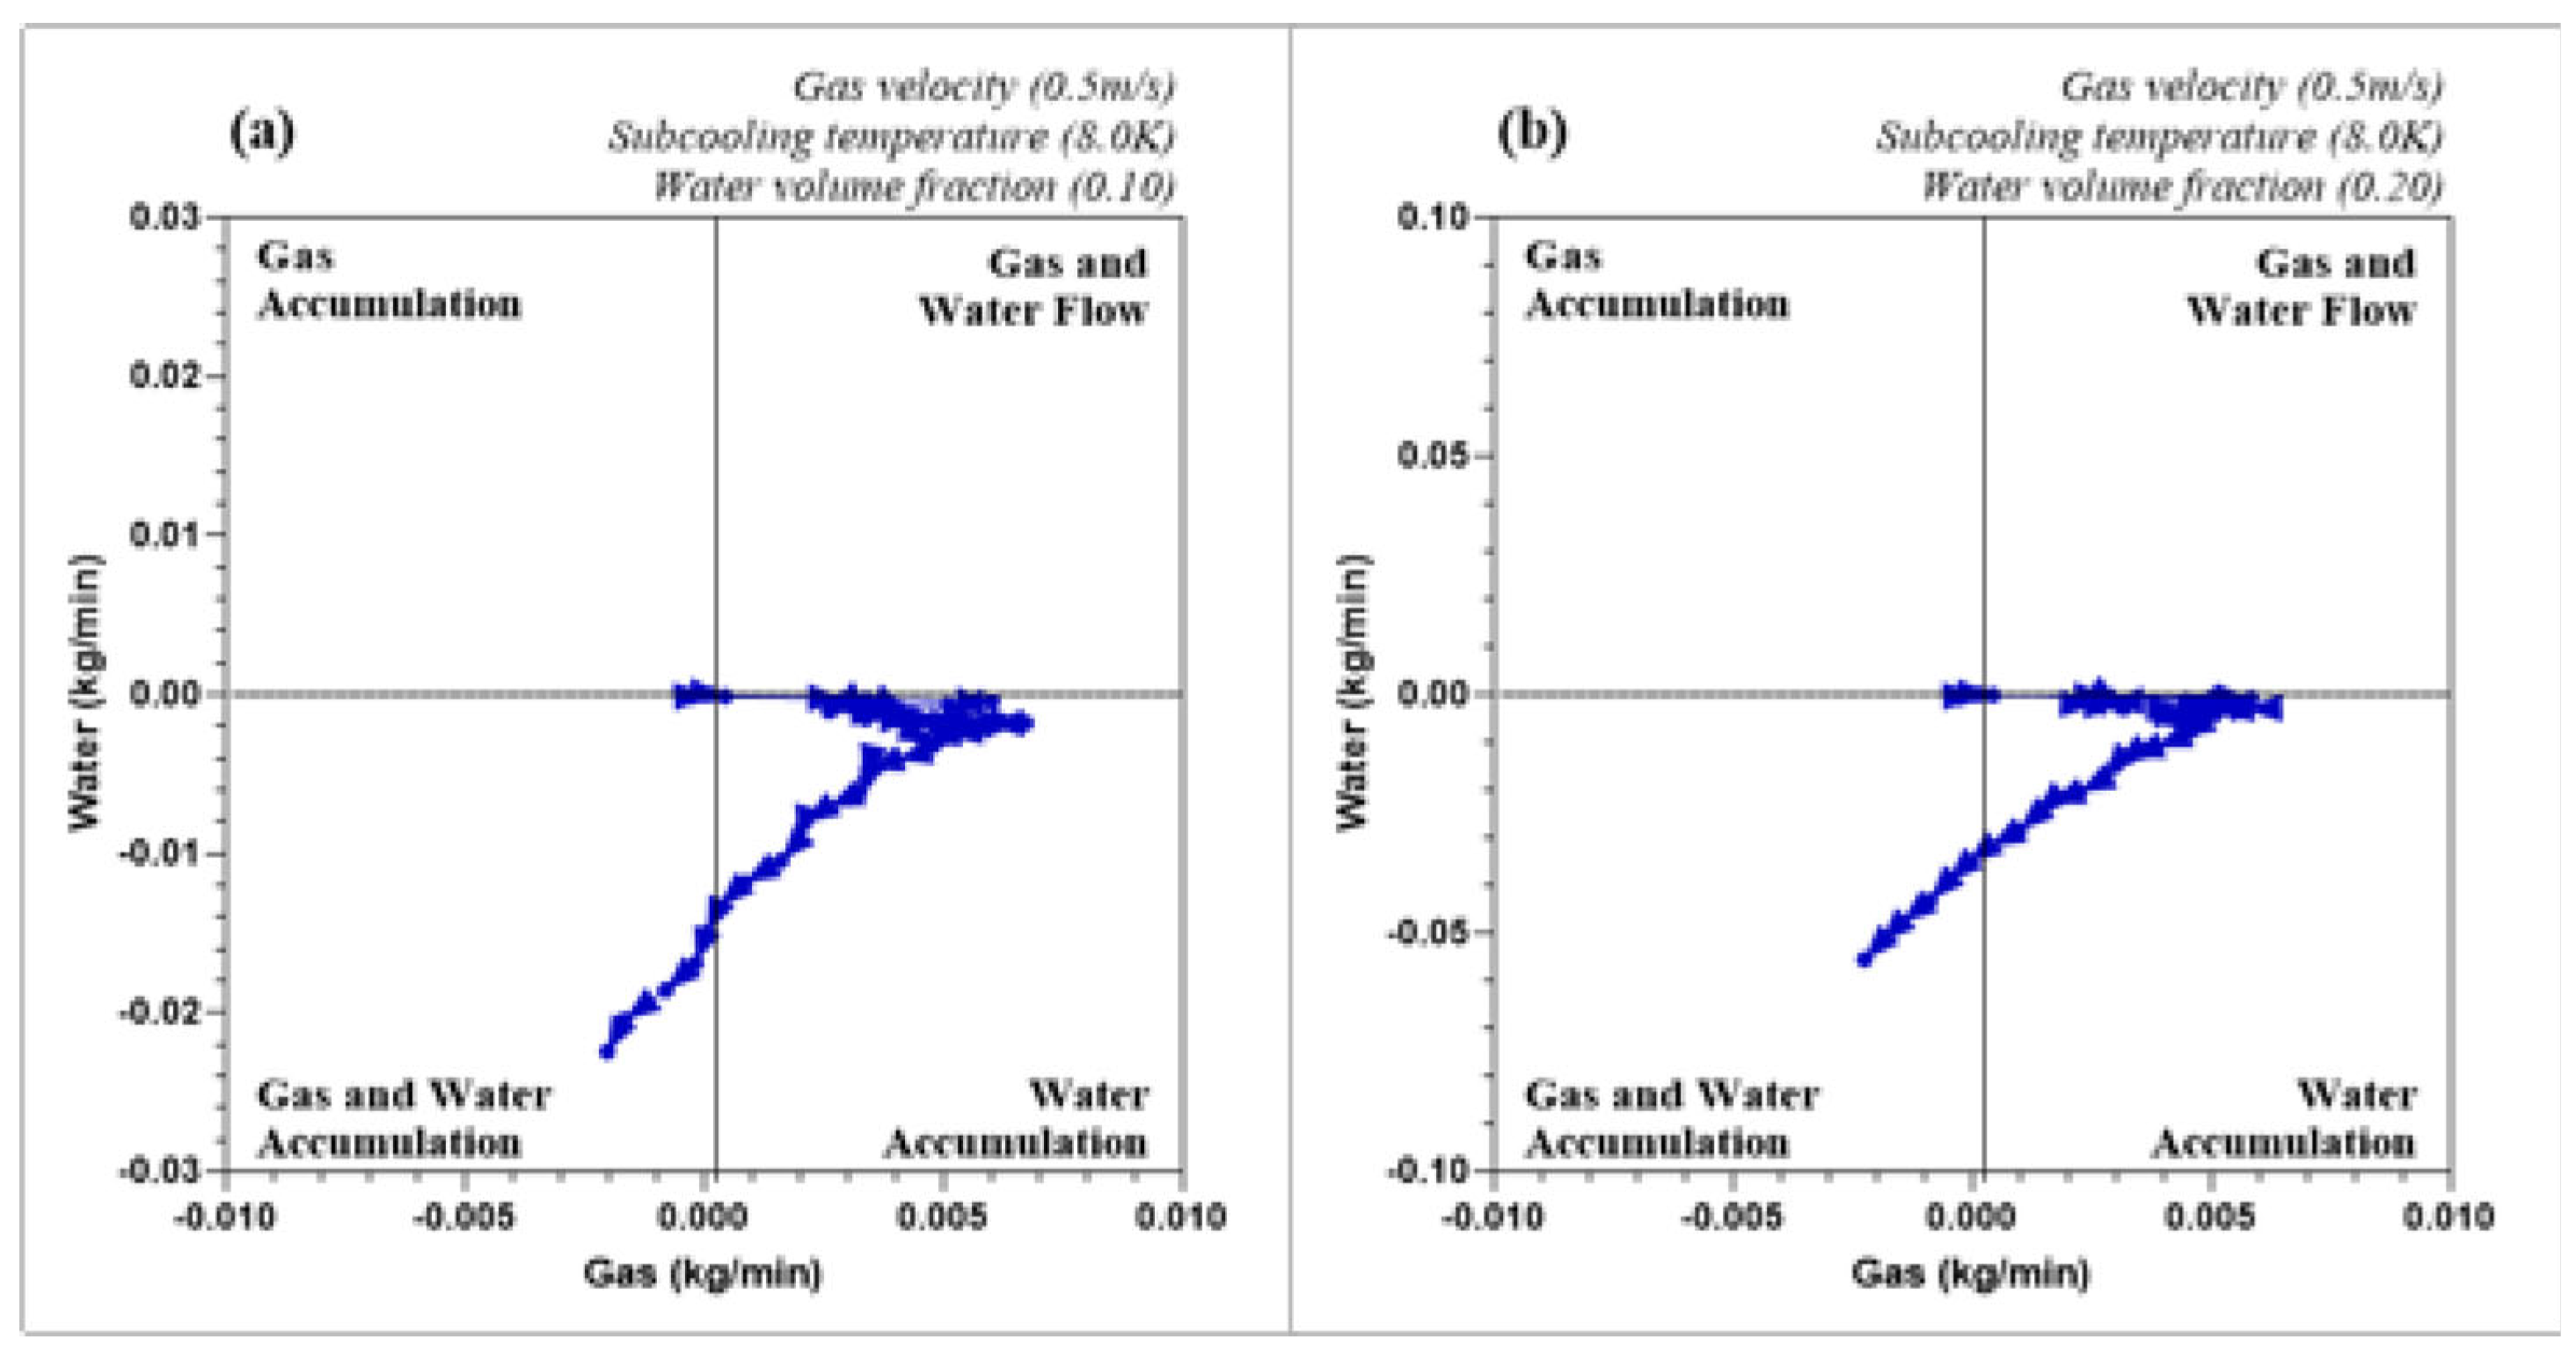
Figure 11a - gas velocity: 0.5 m/s, subcooling temperature: 8.0 K and water volume fraction: 0.10; and
Figure 11b - gas velocity: 0.5 m/s, subcooling temperature: 8.0 K and water volume fraction: 0.20. In both figures, the gas flowrate increases to a maximum of 0.007kg/min. The lower gas flowrate led to a reduction in liquid carrying capacity into the primary gas phase, hence an accumulation of water in the pipeline. Higher gas velocity can enhance the entrainment of water droplets, promoting more efficient water removal along with the gas phase. Mitigation will demand adjusting the gas flow rate to a higher velocity. This can be done by increasing the pressure driving the gas flow or using a compressor. The data points in both graphs are in the
Water Accumulation and
Gas and Water Accumulation quadrants, indicating that under the simulated flow conditions of low gas flow velocity of 0.5 m/s and higher water volume fraction of 0.1 and 0.2 water is more likely to accumulate, in the presence of limited simultaneous gas and water flow across the pipeline.
As observed in
Figure 11, the downward direction of the curve towards the water flowrate negative axis and the reduction of the gas flow rate towards the negative horizontal axis is an indication of reduction in inertia. The literature suggest that increase in inertia is an important factor in hydrates formation (Umuteme et al., 2023b).
4. Discussion
The analysis of gas pipeline operations based on changes in subcooling, water volume fraction, and gas velocity offers important insights into flow assurance, particularly in relation to hydrate formation and plugging risks. Based on the parametric studies, the key discussions are as follows:
-
At a gas velocity of 8.8 m/s and varying subcooling temperatures (2.5 K, 4.3 K, 7.1 K, and 7.5 K), the relationship between gas and water mass flow rates reveals key operational characteristics in gas pipeline systems. As subcooling increases, the risk of hydrate formation also increases. Specifically, the graphs in
Figure 9 highlight that:
At 2.5 K, initial gas flowrate increases until hydrate formation begins, resulting in a simultaneous process of agglomeration and deposition. With water flowrate increase, plugging events begin, but gas accumulation in the pipeline reduces the risk of plugging due to the sloughing of hydrates. The plugging risk here is relatively low because of the sufficient gas accumulation and flow.
At 4.3 K, while the overall trend is similar, the plugging risk is higher compared to 2.5 K due to a lower rate of gas accumulation. This suggests that higher subcooling temperatures reduce gas accumulation, increasing the risk of plugging as hydrates block the flow path more effectively.
For higher subcooling temperatures (7.1 K and 7.5 K), agglomeration and deposition become more distinct processes. These higher temperatures result in an extended agglomeration period, which leads to a higher plugging risk. The lower gas accumulation rates at these temperatures, particularly at 8.0 K, further exacerbate the issue, as lower accumulation implies reduced sloughing of hydrates, which is critical in mitigating plugging.
The scientific implication of these observations is that subcooling temperature is a critical parameter in gas pipeline operations. Increasing subcooling results in enhanced hydrate formation, and as gas accumulation reduces, the pipeline becomes more prone to blockages. Therefore, in real-world pipeline operations, maintaining optimal subcooling conditions is essential to balance between efficient gas transport and the mitigation of hydrate risks.
-
Increasing water volume fractions in gas pipelines introduces another layer of complexity in maintaining flow assurance. The analysis of water volume fractions from 0.02 to 0.1 at a constant gas velocity of 8.8 m/s shows that:
At lower water volume fractions (0.02), there is limited agglomeration and deposition, with no noticeable plugging events. This suggests that higher gas velocities are capable of overcoming the hydrate formation by carrying deposited hydrates along the pipeline through sloughing.
At a water volume fraction of 0.06, the period of agglomeration extends, and significant deposition occurs, indicating an increased risk of hydrate formation. However, the plugging risk remains manageable at this stage, as gas flow can still slough hydrates off the pipeline wall.
When the water volume fraction reaches 0.08, the plugging risk sharply increases, with agglomeration and deposition processes becoming more frequent. At a fraction of 0.10, plugging persists for a longer period, yet the gas accumulation rate is higher, which somewhat mitigates the plugging risk.
The findings suggest that there exists an optimal water volume fraction where hydrate formation and plugging risks are balanced. Below this level, hydrate formation is minimal, while above it, the risk of blockage increases. Understanding and managing this threshold is critical for real-world pipeline operations. Operators must ensure that water fractions are maintained within manageable limits to prevent extensive hydrate plugging, especially as subsea pipelines are more susceptible to variations in water volume fractions during gas production.
-
The parametric study of gas flow velocity and water volume fraction at subcooling temperatures of 8.0 K reveals a significant impact on hydrate formation and plugging risks. When the gas velocity is low (0.5 m/s) and the water volume fraction increases to 0.1 or 0.2, the following observations were made:
Low gas velocity reduces the liquid-carrying capacity of the gas phase, leading to water accumulation in the pipeline. This water accumulation creates favourable conditions for hydrate formation, as the inertial forces required to transport both gas and water are reduced. Hydrate slurries are more likely to form under such conditions, as the water and gas accumulate in the pipeline, reducing the flow’s ability to slough off hydrates.
The downward trend in gas flowrate towards the negative axis indicates that inertia decreases as gas velocity decreases. This observation aligns with literature that identifies inertia as a key factor in hydrate formation. In this case, low inertia makes it difficult for the gas to entrain water droplets and prevent the formation of hydrate slurries.
In terms of practical implications, low gas velocities combined with high water volume fractions represent a significant operational risk. To mitigate this, gas pipeline operators should consider increasing gas velocity, either through higher driving pressure or the use of compressors. By increasing gas velocity, the entrainment of water droplets improves, reducing water accumulation and hydrate formation.
5. Conclusions
This study builds upon the validated CFD model to enhance the prediction of critical flow characteristics—such as pressure, temperature, gas density, and phase behaviour—under hydrate-forming conditions in gas pipelines. The introduction of a four-quadrant approach for analyzing gas and water flow rates offers a valuable method for predicting hydrate severity. By matching these flow patterns with the profiles established in previous research, the study reaffirms existing literature on the influence of subcooling, water volume fraction, and gas velocity on hydrate formation and plugging risks.
Remarkably, this study provides a framework for using both transient and steady-state hydraulic simulators to predict hydrate formation in subsea pipelines or other systems prone to hydrates. The observed flow patterns offer deeper insights into how hydrate formation, agglomeration, and deposition affect gas availability for transportation. These findings have practical implications for improving flow assurance in gas pipelines, mitigating hydrate risks, and ensuring efficient, uninterrupted gas transport in hydrate-prone environments. From a scientific and engineering perspective, the findings outlined above underscore several critical aspects of gas pipeline operations:
Subcooling and Gas Accumulation: Managing subcooling temperatures is crucial. Excessive subcooling can increase hydrate formation and reduce gas accumulation, making pipelines more susceptible to plugging. Gas pipeline operators must strike a balance between temperature control and flow efficiency to avoid excessive hydrate risk.
Water Volume Fraction Management: Controlling water production is equally important. As water volume fraction increases, the risk of hydrate formation escalates, particularly when gas velocity is not sufficient to carry hydrates along the pipeline. Maintaining water fractions within an optimal range is essential to reducing plugging events.
Flow Velocity Optimization: Gas velocity plays a vital role in flow assurance. Higher velocities prevent water accumulation and hydrate formation by maintaining sufficient inertia. Conversely, low velocities exacerbate hydrate risk, making it necessary to optimize flow conditions either through mechanical adjustments or system redesign.
Author Contributions
Conceptualization, O.M.U. and S.Z.I.; Methodology, O.M.U.; Software, O.M.U.; Validation, O.M.U.; Investigation, O.M.U.; Data curation, O.M.U.; Writing – original draft, O.M.U.; Writing – review & editing, S.Z.I., M.H. and A.K.; Visualization, O.M.U.; Supervision, S.Z.I., M.H. and A.K. All authors have read and agreed to the published version of the manuscript.
Funding
This research received no external funding.
Data Availability Statement
The data presented in this study are available on request from the corresponding author.
Acknowledgments
The authors are grateful to the School of Engineering, Robert Gordon University, Aberdeen, United Kingdom, for supporting this research.
Conflicts of Interest
The authors declare no conflicts of interest.
Nomenclature
|
Interfacial area (m2) |
|
Turbulent viscosity constant (-) |
|
and |
Constants (-) |
|
Diameter of the pipe section prone to hydrate formation (m) |
|
Turbulent kinetic energy production term per phase (-) |
|
The phase specific enthalpy (J/kg) |
|
Interphase enthalpy (J/kg) |
|
and |
Constants (-) |
|
Turbulent kinetic energy rate (m2s−3) |
|
Turbulent kinetic energy (J/kg) |
|
Methane gas consumption rate () (Kg/s) |
|
Hydrate deposition rate (m3/s) |
|
Velocity of the primary continuous gas phase (m/s) |
|
Velocity vector of the phase in the control volume (m/s) |
|
Source/sink term: gas consumption rate or source energy rate (Kg/s-m3 or J/s-m3) |
|
Hydrate formation equilibrium temperature (K) |
|
System temperature (K) |
References
- Di Lorenzo, M.; Aman, Z.M.; Kozielski, K.; Norris, B.W.E.; Johns, M.L.; May, E.F.; DiLorenzo, M.; Kozielski, K.; Aman, Z.M.; Norris, B.W.E.; Johns, M.L.; May, E.F. Modelling Hydrate Deposition and Sloughing in Gas-Dominant Pipelines. Journal of Chemical Thermodynamics 2018, 117, 81–90. [Google Scholar] [CrossRef]
- Umuteme, O.M. Predicting Hydrates Plugging Risk in Subsea Gas Pipelines: CFD, Analytical and Regression Modelling. Doctoral, Robert Gordon University, Aberdeen, 2024.
- Umuteme, O.M.; Islam, S.Z.; Hossain, M.; Karnik, A. Computational Fluid Dynamics Simulation of Natural Gas Hydrate Sloughing and Pipewall Shedding Temperature Profile: Implications for CO2 Transportation in Subsea Pipeline. Gas Science and Engineering 2023, 116, 205048. [Google Scholar] [CrossRef]
- Umuteme, O.M.; Islam, S.Z.; Hossain, M.; Karnik, A. An Improved Computational Fluid Dynamics (CFD) Model for Predicting Hydrate Deposition Rate and Wall Shear Stress in Offshore Gas-Dominated Pipeline. J Nat Gas Sci Eng 2022, 107. [Google Scholar] [CrossRef]
- Weisman, J. Two-Phase Flow Patterns. Handbook of Fluids in Motion 1983, 409–425. [Google Scholar]
- Liu, W.; Hu, J.; Sun, F.; Sun, Z.; Li, X. Study on the Correlation between the Hydrate Formation-Blockage Risk and Gas-Liquid Flow Pattern in Horizontal Pipelines. Society of Petroleum Engineers - Abu Dhabi International Petroleum Exhibition and Conference 2019, ADIP 2019 2019. [CrossRef]
- Wang, Z.; Zhang, J.; Sun, B.; Chen, L.; Zhao, Y.; Fu, W. A New Hydrate Deposition Prediction Model for Gas-Dominated Systems with Free Water. Chem Eng Sci 2017, 163, 145–154. [Google Scholar] [CrossRef]
- Aman, Z.M.; Di Lorenzo, M.; Kozielski, K.; Koh, C.A.; Warrier, P.; Johns, M.L.; May, E.F. Hydrate Formation and Deposition in a Gas-Dominant Flowloop: Initial Studies of the Effect of Velocity and Subcooling. J Nat Gas Sci Eng 2016, 1–9. [Google Scholar] [CrossRef]
- Di Lorenzo, M.; Aman, Z.M.; Soto, G.S.; Johns, M.; Kozielski, K.A.; May, E.F. Hydrate Formation in Gas-Dominant Systems Using a Single-Pass Flowloop. Energy and Fuels 2014, 28(5). [Google Scholar] [CrossRef]
- Di Lorenzo, M.; Aman, Z.M.; Kozielski, K.; Norris, B.W.E.; Johns, M.L.; May, E.F. Underinhibited Hydrate Formation and Transport Investigated Using a Single-Pass Gas-Dominant Flowloop. Energy and Fuels 2014, 28(11). [Google Scholar] [CrossRef]
- Liu, Z.; Vasheghani Farahani, M.; Yang, M.; Li, X.; Zhao, J.; Song, Y.; Yang, J. Hydrate Slurry Flow Characteristics Influenced by Formation, Agglomeration and Deposition in a Fully Visual Flow Loop. Fuel 2020, 277, 118066. [Google Scholar] [CrossRef]
- Bbosa, B.; Ozbayoglu, E.; Volk, M. Experimental Investigation of Hydrate Formation, Plugging and Flow Properties Using a High-Pressure Viscometer with Helical Impeller. J Pet Explor Prod Technol 2019, 9(2), 1089–1104. [Google Scholar] [CrossRef]
- Meindinyo, R.T. Gas Hydrate Growth Kinetics: Experimental Study Related to Effects of Heat Transfe. 2017. [Google Scholar]
- Sinquin, A.; Cassar, C.; Teixeira, A.; Leininger, J.P.; E, G.D.F.S. OTC-25905-MS Hydrate Formation in Gas Dominant Systems Experimental Device , Procedure and Products. In Offshore Technology Conference This; Houston, Texas, 2015. 1–15.
- Rao, Y.; Liu, Z.; Wang, S.; Li, L. Experimental Study on Hydrate Safe Flow in Pipelines under a Swirl Flow System. ACS Omega 2022, 7(19), 16629–16643. [Google Scholar] [CrossRef] [PubMed]
- Neto, E.T.; Rahman, M.A.; Imtiaz, S.; Ahmed, S. Numerical Flow Analysis of Hydrate Formation in Offshore Pipelines Using Computational Fluid Dynamics (CFD). In Proceedings of the International Conference on Offshore Mechanics and Arctic Engineering - OMAE; ASME: Busan, South Korea, 2016; Vol. 8. [Google Scholar] [CrossRef]
- Berrouk, A.S.; Jiang, P.; Safiyullah, F.; Basha, M. CFD Modelling of Hydrate Slurry Flow in a Pipeline Based on Euler-Euler Approach. Progress in Computational Fluid Dynamics 2020, 20(3), 156–168. [Google Scholar] [CrossRef]
- Neto, E.T.; Rahman, M.A.; Imtiaz, S.; Ahmed, S. Numerical Flow Analysis of Hydrate Formation in Offshore Pipelines Using Computational Fluid Dynamics (CFD). In Proceedings of the International Conference on Offshore Mechanics and Arctic Engineering - OMAE; ASME: Busan, South Korea, 2016; Vol. 8. [Google Scholar] [CrossRef]
- Turner, D.; Boxall, J.; Yang, D.; Kleehamer, C.; Koh, C.; Miller, K.; Sloan, E.D.; Yang, S.; Xu, Z.; Mathews, P.; Talley, L. Development of a Hydrate Kinetic Model and Its Incorporation Into the OLGA2000®Transient Multi-Phase Flow Simulator. Proceedings of the 5th International Conference on Gas Hydrates 2005, No. July 2015.
- Odutola, T.O.; Ajienka, J.A.; Onyekonwu, M.O.; Ikiensikimama, S.S. Fabrication and Validation of a Laboratory Flow Loop for Hydrate Studies. American Journal of Chemical Engineering. Special Issue: Oil Field Chemicals and Petrochemicals 2017, 5(1), 28–41. [Google Scholar] [CrossRef]
- Umuteme, O.M.; Islam, S.Z.; Hossain, M.; Karnik, A. Analytical Modelling of the Hydraulic Effect of Hydrate Deposition on Transportability and Plugging Location in Subsea Gas Pipelines. Proc Inst Mech Eng C J Mech Eng Sci 2023. [Google Scholar] [CrossRef]
- Li, W.; Gong, J.; Lü, X.; Zhao, J.; Feng, Y.; Yu, D. A Study of Hydrate Plug Formation in a Subsea Natural Gas Pipeline Using a Novel High-Pressure Flow Loop. Pet Sci 2013, 10(1), 97–105. [Google Scholar] [CrossRef]
- Li, W.; Gong, J.; Lü, X.; Zhao, J.; Feng, Y.; Yu, D. A Study of Hydrate Plug Formation in a Subsea Natural Gas Pipeline Using a Novel High-Pressure Flow Loop. Pet Sci 2013, 10(1), 97–105. [Google Scholar] [CrossRef]
- Liu, W.; Hu, J.; Wu, K.; Sun, F.; Sun, Z.; Chu, H.; Li, X. A New Hydrate Deposition Prediction Model Considering Hydrate Shedding and Decomposition in Horizontal Gas-Dominated Pipelines. Pet Sci Technol 2019, 37(12), 1370–1386. [Google Scholar] [CrossRef]
- DiLorenzo, M.; Kozielski, K.; Aman, Z.; Norris, B.; Johns, M.; May, E. Modelling Hydrate Deposition and Sloughing in Gas-Dominant Pipelines. Journal of Chemical Thermodynamics 2018, 117. [Google Scholar] [CrossRef]
- Umuteme, O.M.; Islam, S.Z.; Hossain, M.; Karnik, A. Computational Fluid Dynamics Simulation of Natural Gas Hydrate Sloughing and Pipewall Shedding Temperature Profile: Implications for CO2 Transportation in Subsea Pipeline. Gas Science and Engineering 2023, 116, 205048. [Google Scholar] [CrossRef]
- Umuteme, O.M.; Islam, S.Z.; Hossain, M.; Karnik, A. Analytical Modelling of the Hydraulic Effect of Hydrate Deposition on Transportability and Plugging Location in Subsea Gas Pipelines. Proc Inst Mech Eng C J Mech Eng Sci 2023. [Google Scholar] [CrossRef]
- Ma, N.; Wang, Z.; Zhang, J.; Li, Z.; Kong, Q.; Sun, B. Hydrate Deposition Characteristics Analysis and Structural Optimization Design of Reduced-Diameter Pipe Based on an Improved Model. Ocean Engineering 2024, 291, 116437. [Google Scholar] [CrossRef]
- Lekvam, K.; Bishnoi, P.R. Dissolution of Methane in Water at Low Temperatures and Intermediate Pressures. Fluid Phase Equilib 1997, 131(1–2), 297–309. [Google Scholar] [CrossRef]
- Song, G.; Li, Y.; Wang, W.; Jiang, K.; Shi, Z.; Yao, S. Numerical Simulation of Hydrate Slurry Flow Behavior in Oil-Water Systems Based on Hydrate Agglomeration Modelling. J Pet Sci Eng 2018, 169, 393–404. [Google Scholar] [CrossRef]
- Zhang, P.; Wu, Q.; Mu, C. Influence of Temperature on Methane Hydrate Formation. Sci. Rep. 2017, 7(1). [Google Scholar] [CrossRef] [PubMed]
- Lim, V.W.S.S.; Metaxas, P.J.; Stanwix, P.L.; Johns, M.L.; Haandrikman, G.; Crosby, D.; Aman, Z.M.; May, E.F. Gas Hydrate Formation Probability and Growth Rate as a Function of Kinetic Hydrate Inhibitor (KHI) Concentration. Chemical Engineering Journal 2020, 388(January). [Google Scholar] [CrossRef]
- Lim, V.W.S.S.; Metaxas, P.J.; Stanwix, P.L.; Johns, M.L.; Haandrikman, G.; Crosby, D.; Aman, Z.M.; May, E.F. Gas Hydrate Formation Probability and Growth Rate as a Function of Kinetic Hydrate Inhibitor (KHI) Concentration. Chemical Engineering Journal 2020, 388(January). [Google Scholar] [CrossRef]
- Sloan, D.E.; Koh, C.A. Clathrate Hydrates of Natural Gases, 3rd ed.; CRC Press: Boca Raton, FL, USA, 2007. [Google Scholar]
- Carroll, J. Natural Gas Hydrates: A Guide for Engineers, 3rd ed.; Gulf Professional Publishing: Waltham, MA 02451, USA, 2014. [Google Scholar]
|
Disclaimer/Publisher’s Note: The statements, opinions and data contained in all publications are solely those of the individual author(s) and contributor(s) and not of MDPI and/or the editor(s). MDPI and/or the editor(s) disclaim responsibility for any injury to people or property resulting from any ideas, methods, instructions or products referred to in the content. |
© 2024 by the authors. Licensee MDPI, Basel, Switzerland. This article is an open access article distributed under the terms and conditions of the Creative Commons Attribution (CC BY) license (https://creativecommons.org/licenses/by/4.0/).


