1. Introduction
Orofacial diseases are among the pathological conditions that most affect the quality of life in the world. Notably, temporomandibular disorder (TMD) is a group of conditions that cause symptoms like maxillary pain, headache, and facial pain [
1]. Another painful condition is oral mucositis (OM), a complication of chemotherapy or head and neck radiotherapy causing soreness, redness and smoothness on oral tissues early after treatment onset [
2]. Management of TMD and OM related pain may require opioid analgesia, which may cause addiction and other side effects. Photobiomodulation Therapy (PBMT) is a safer alternative solution that uses lasers or other light sources to stimulate therapeutic biological responses including analgesic and anti-inflammatory effects, and also promoting healing and tissue repair. Clinical applications of PBMT have been found in diverse conditions such as neuromuscular pathologies, musculoskeletal pain, dermatological conditions, oral irritation and in different areas in dentistry. The PBMT is considered a non-thermal and non-ablative treatment, since the energy density levels associated with this therapeutic regimen are typically below the threshold associated with irreversible cell damage [
3]. Highly penetrating red or near-infrared light must be absorbed by the target cells, specifically by cytochrome C oxidase that lies within mitochondria. A modulation of oxidative stress is then promoted through the release of nitric oxide which increases adenosine triphosphate production, and regulation of reactive oxygen species [
4].
The successful application of PBMT relies on the choice of optimal treatment parameters from which wavelength, energy density expressed as
(dose), number of points of application and their location, and treatment frequency and duration are among the most relevant. They should combine to obtain an effective penetration of light through different skin layers to reach the intended target tissue. For example, the laser can be applied intra- or extra-orally and this has implications in the choice of laser wavelength and delivered dose [
5]. Since there is a great variability in patient morphological and physiological characteristics, individual laser dosimetry planning may be recommended.
The layers of facial tissues are commonly categorized into five levels, progressing from outer to inner: (1) the dermis, (2) the subcutaneous layer, (3) the musculoaponeurotic layer, (4) the spaces and retaining ligament, and (5) the deep fascia. Bone and periosteum are disregarded since they can be avoided during extraoral PBMT administration, preventing additional dose attenuation. From a photobiological standpoint, simplifying the orofacial tissue layers into skin, fat, and muscle is feasible. Each of these layers displays distinct optical characteristics. Among the three tissues, the skin acts as the most absorptive layer, playing a significant role in light absorption and scattering due to the melanin chromophore.
In the case of PBMT for pain relief, light has to penetrate to as deep as the muscle layer to deploy a therapeutic effect. For this purpose, red and infrared light wavelengths can be used due to their longer mean-free-path. However, darker skin phototypes may still absorb a significant portion of the incident light and cause discomfort or even burn wounds in the patient. On the other hand, reducing the laser power to comply with safety regulations will also reduce the amount of light reaching the target sites, thus compromising the effectiveness of the intended treatment. To model the effect of skin tone, some quantitative assessment method that can be easy to implement in a clinical setting is preferable. Currently, the Fitzpatrick’s skin type classification scale is the preferred method [
6]. It indicates not only the individual’s skin color but also their perception of the tendency to burn or tan or the risk of developing skin cancer when exposed to sunlight. Another factor affecting the amount of light delivered to the target tissue is the thickness of the upper layers. Particularly, the thickness of subcutaneous fat has to taken into account due to its high scattering coefficient at therapeutic wavelengths. The quantitative assessment of skin layers and underlying tissues thicknesses can be done using ultrasonography [
7] or
in vivo Harmonic Generation Microscopy (HGM) [
8]. However, in most clinical settings these instruments may not be available, which makes the evaluation of body mass index (BMI) a much easier and practical tool. Thus, the correlation between BMI and tissue thickness [
9] can be useful in laser treatment planning.
Monte Carlo (MC) techniques have been extensively used to model the propagation of light in biological tissues for the purpose of predicting the outcomes of therapeutic procedures and the sensitivity of diagnosis methods . These two main groups of applications share important methodological aspects with respect to the modeling of skin structure and physiological features, so some attention will be dedicated to both in the following overview.
In a recent paper, a MC analysis of the effect of skin tone and obesity on the photoplethysmography signal in wearable devices used by volunteers, with a body mass index range of 20 to 45 and a Fitzpatrick scale between I and VI, was described [
10]. They reported significant changes leading to a loss on the reflected optical signal from visible light emiting diodes (LEDs) (
) and near infrared LEDs (
) and penetrating the wrist skin from individuals with increased BMI and skin pigmentation.
Recent experimental studies on the effect of skin color and layer thickness on reflectance, transmittance and skin temperature at two different wavelengths (
and
nm) revealed important changes in these quantities [
11]. The authors concluded that skin thickness and color must be accounted for when selecting laser parameters such as energy dose and wavelength for successful therapeutic outcomes at the target tissue. It would be interesting to verify if these changes can be predicted using MC simulations since it would help developing a validation tool for laser dosimetry.
A validation study of a MC model for extraoral photobiomodulation dosimetry planning was carried out with a limited number of volunteers [
12]. Interestingly, the role of individual’s cheek morphology on laser penetration using Magnetic Resonance Imaging and extraoral light transmission measurements at
nm was addressed. No appreciable dependence was observed between the measured transmittance and the skin type, while total cheek thickness produced variations of over
across the four volunteers.
The primary objective of this study is to develop a PBMT dosimetry model specific of cheek and oral cavity tissues, in external application mode, than can be adapted to patient’s morphological and physiological characteristics, with a focus on skin optical properties and layer structure. The model is built upon three main stages. First, an optical model relates skin optical properties with a widely used phototype classification scale using literature information. Tissue structure is modeled according to updated references reporting facial measurements of skin layer thicknesses that can be associated with different BMI values. Second, a laser treatment setup is simulated with fixed beam spatial configuration and irradiance, targeted at an efficacious dose of delivered to the masseter muscle, as reported in previous studies, by varying the treatment duration. Care is taken to limit the incident irradiance to the maximum permissible exposure (MPE) for skin at the selected 660 nm and 808 nm laser wavelengths. The simulations are performed with the Monte Carlo method in order to predict the laser fluence at the muscle layer and compute the treatment duration required to achieve the therapeutic dose for a wide range of skin phototypes and BMIs. Finally, a third stage aims at amplifying the usability of Monte Carlo simulations and assess the importance of patient specific parameters to the dosimetry model, by using machine learning techniques. In this study, a bi-target multiple regression model, trained with the MC simulations, is designed to compute estimates of muscle and epidermal energy density deposition, so that efficacious dose conditions are met and, at the same time, laser safety considerations are warrantied. The model is able to predict dose parameters for a new set of features that lie within the parameter space covered by the MC simulations, in a much faster but nevertheless reliable way.
2. Materials and Methods
The dosimetry model is based upon empirically derived energy density values that have been found to deploy biological responses when laser light is used in PBMT for pain relief in orofacial tissues. According to [
13], an efficacious dose of about
at the target tissue, the muscle in this case, defines the onset of therapeutic effects. Thus, the aim of the planning model is to predict how the laser power and treatment duration time should be adjusted to insure the right dose for a fixed laser setup (wavelength and spatial profile) and the individual physiological/morphological characteristics of a given patient. While a short treatment duration is preferred for clinical management reasons, care must be taken not to exceed the skin maximum permissible exposure (MPE) for the selected wavelength. Here, the guidelines of ANSI z136.1 standard [
14] the are followed, for continuous wave lasers in the red-infrared region:
where,
(
) is the incident irradiance and
(nm) is the laser wavelength. The correction factor is defined as
for
nm, and
for
nm.
2.1. Tissue Structure and Optical Properties
The propagation of light inside a biological tissue depends on its morphological as well as optical/physiological characteristics. Given that the spectral region of interest lies within the therapeutic window, the muscle layer is also included in the simulated tissue model. The facial tissue model consists of four layers, namely, the epidermis, dermis, subcutaneous fat and muscle.
Skin Thickness
The variability of skin thickness at various facial locations can be assessed using diverse methods, such as in vivo ultrasound analysis, 3D structured light scanning, biopsy, and computerized or histological measurements. Skin thickness is directly influenced by factors like sex, age, and race, impacting both the epidermal and dermal layers. Accurate estimation of topographic skin thickness is crucial for optimizing medical and cosmetic outcomes while minimizing potential adverse events during facial photobiomodulation procedures.
Drawing upon a diverse population sample, a compendium of recent studies has employed the aforementioned techniques to ascertain skin thickness in regions comprising the head, cheek, and neck. Employing these data as a foundation, it has been observed that the average thickness of the epidermis in the cheek region is approximately 0.2 mm, while the dermis has an average thickness of 1.4 mm. Additionally, the subcutaneous layer exhibits an average thickness of 10 mm and the muscle layer 5 mm in this specific facial area. It becomes feasible to estimate the thickness of each skin layer, as delineated in
Table 1, where specific range values can be found, according to [
15]. Considering the great variability of thickness values, we chose values consistent with recent publications employing four layer models, including muscle layer, targeting dosimetry applications [
12,
15,
16].
Absorption Coefficient
We follow a model for the optical properties described in the work of Steven Jacques [
17], where the spectrally dependent absorption coefficient of each layer can be computed given variable amounts of its main absorbing chromophores according to the formula:
where,
B is the average blood volume fraction,
S is the oxygen saturation,
W is the fractional water content,
F is the fat content, and finally
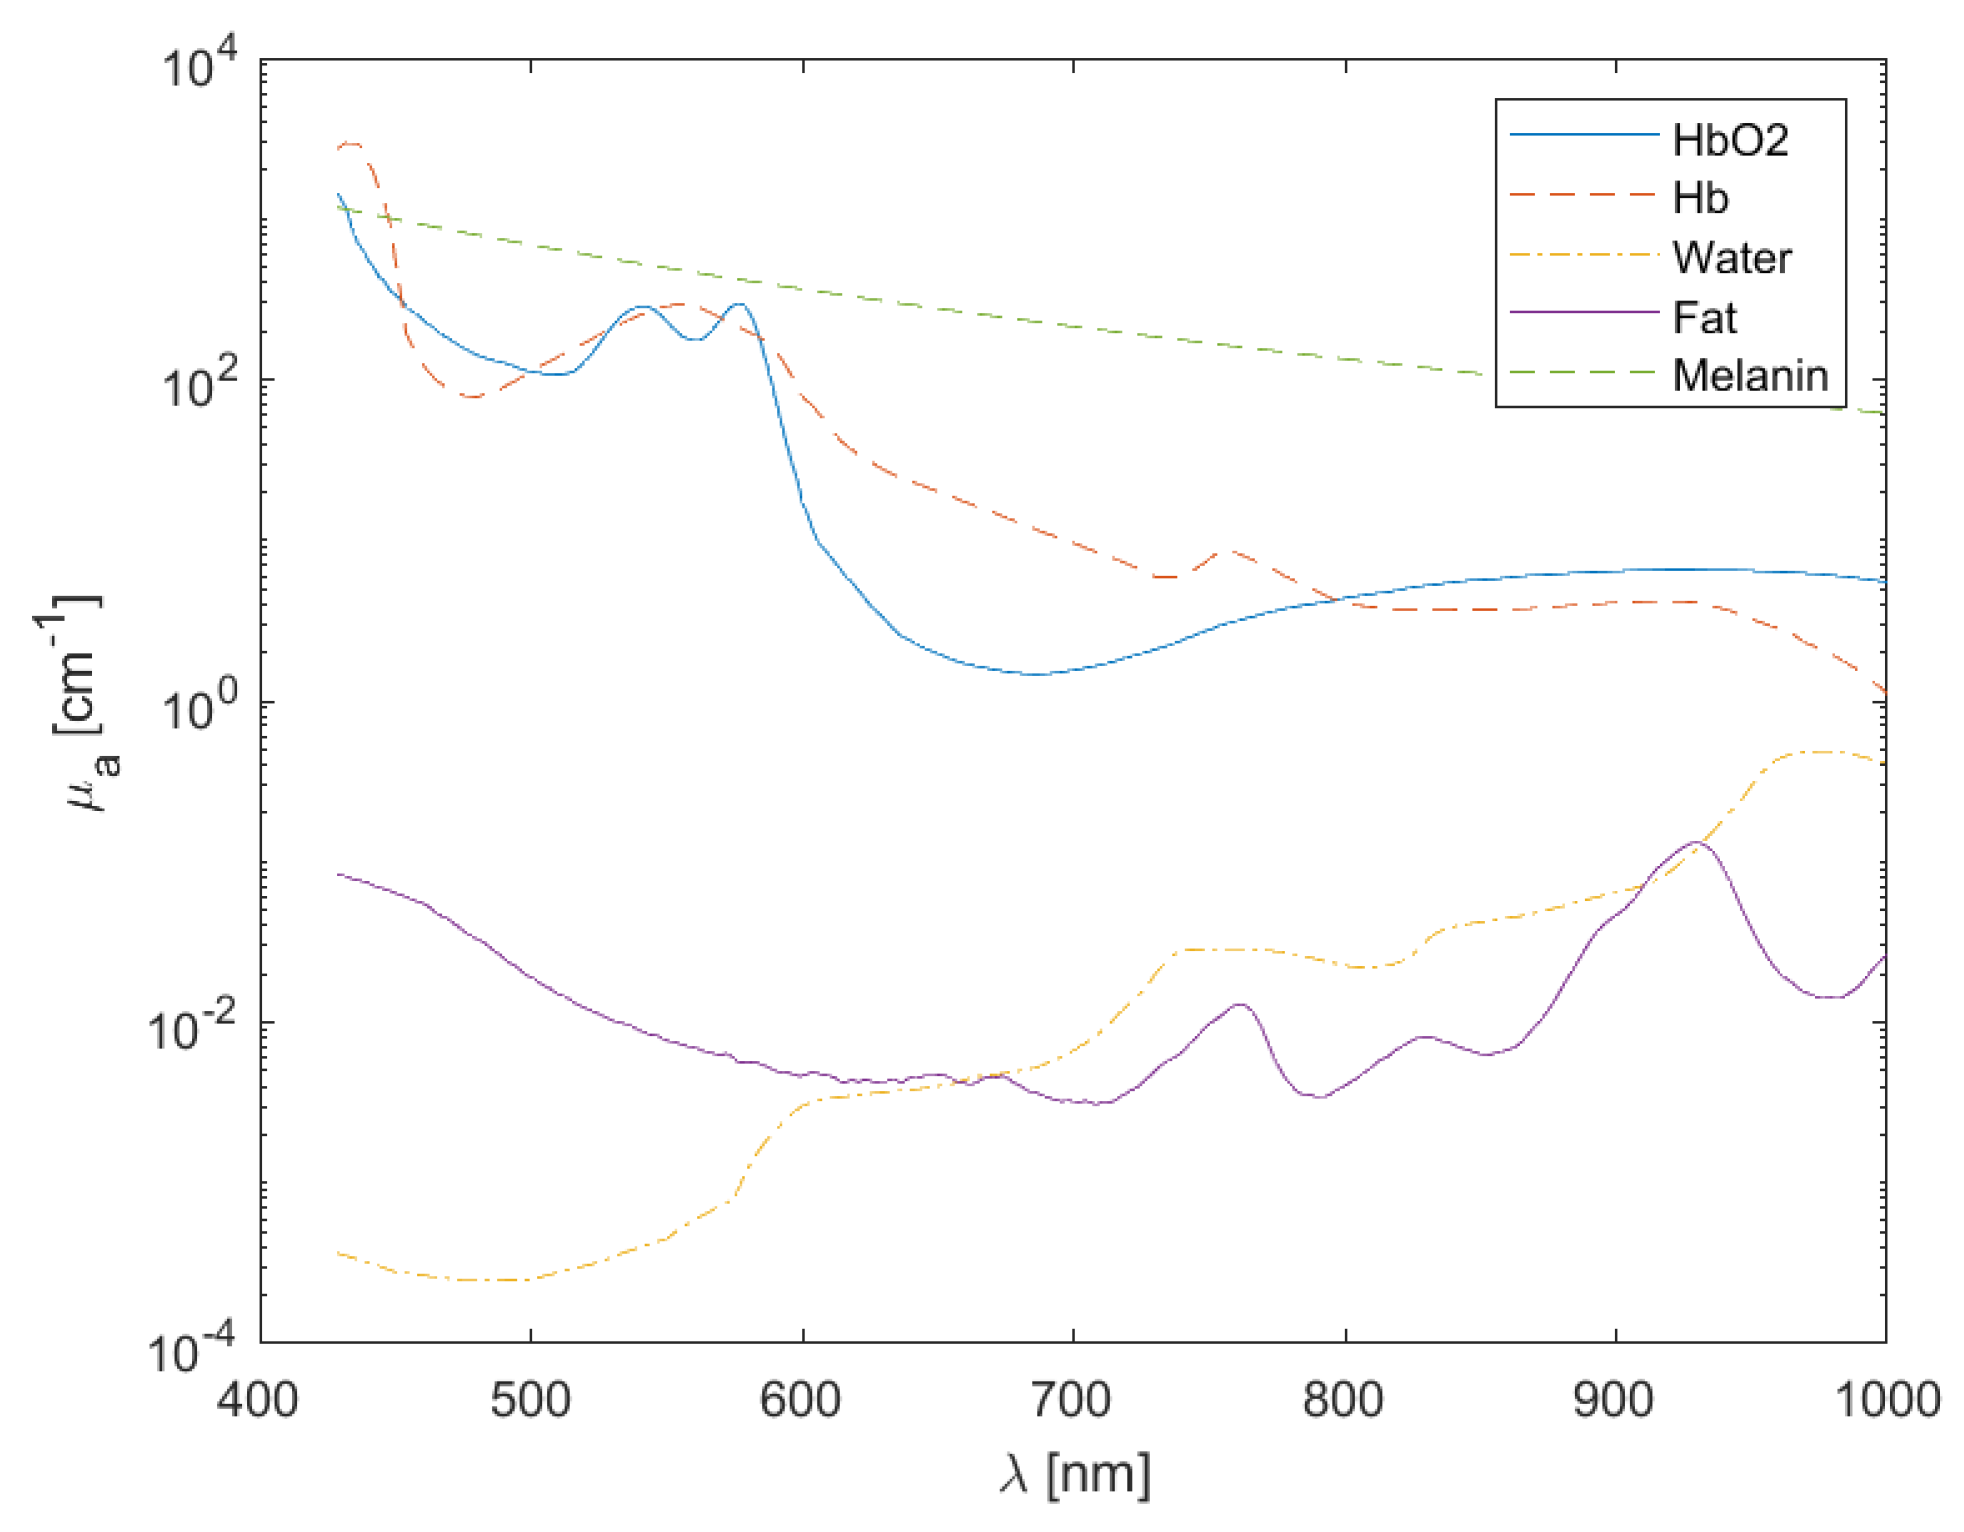
M is the melanosome volume fraction. Each absorbing chromophore has its own spectral signature, as illustrated in
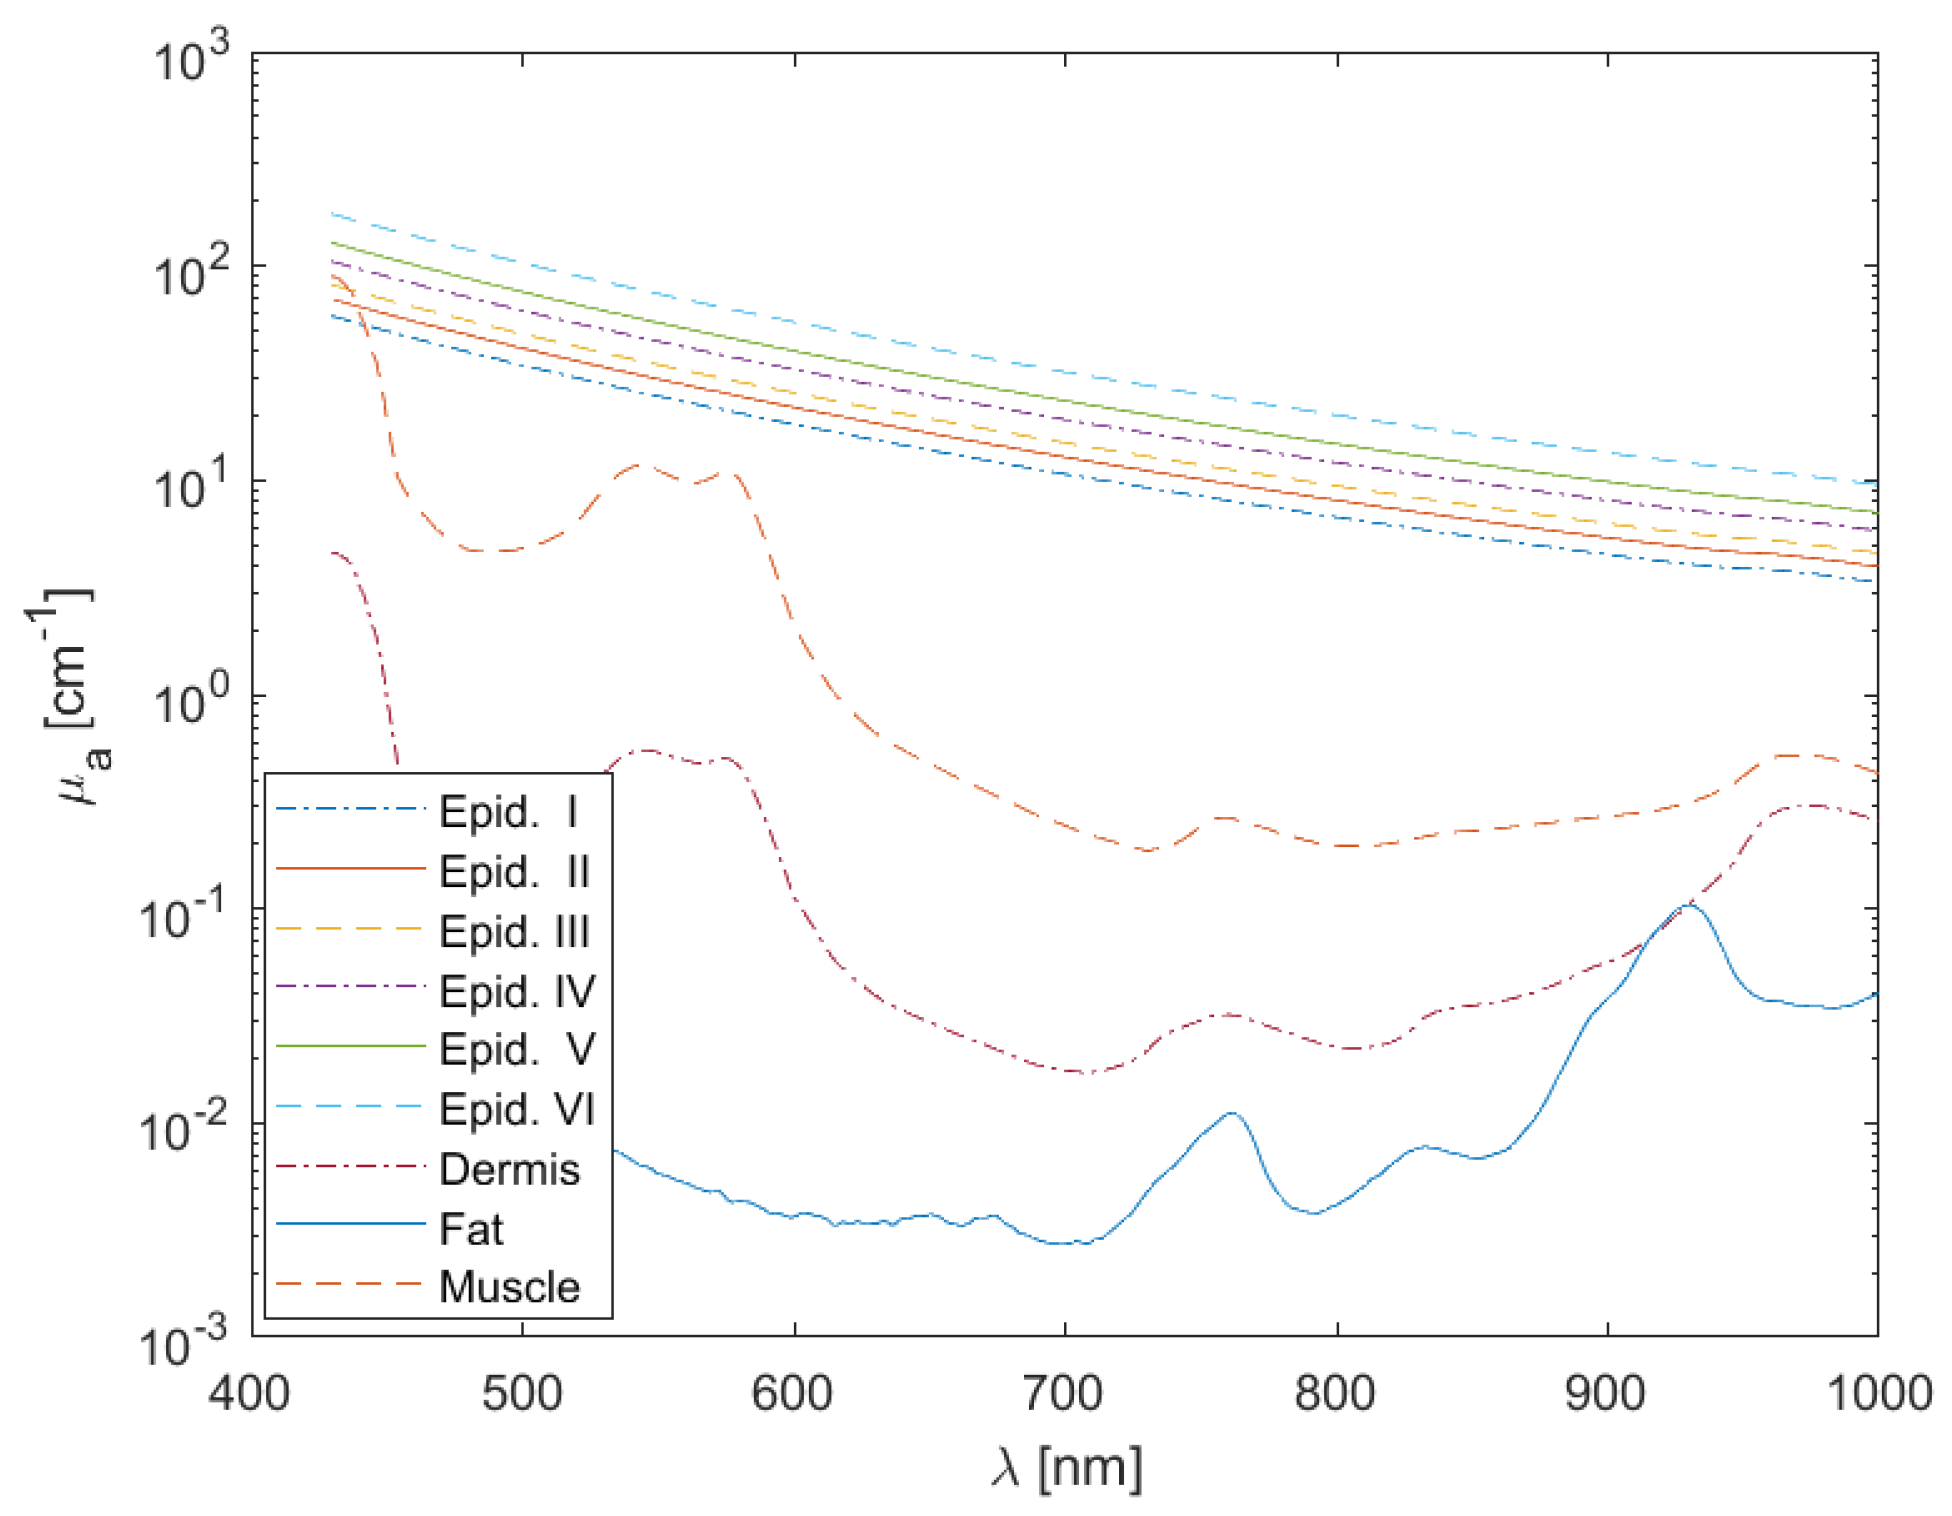
Figure 1, from which the total absorption for each layer can be estimated (
Figure 2).
The optical absorption coefficient of blood varies with oxygen saturation and can be calculated from its components
and
, where
and
, in
, are the deoxy-hemoglogin and oxy-hemoglobin molar extinction coefficients, respectively. Due to the variation of blood fraction in a given tissue, the apparent molar concentrations,
and
, in
, also vary. Considering pure blood with a concentration given by
, the blood volume fraction B in a tissue is defined by
In turn, the concentration of oxy-hemoglobin relates to oxygen saturation,
S, as follows:
Here, we are assuming a value of for the hemoglobin concentration in the bloodstream and using as the molecular weight of hemoglobin.
Melanine is the most absorbing chromophore present in the epidermis and it’s produced by specialized organelles called melanosomes which are present in melanocytes. Human skin color is classified according to the widely used Fitzpatrick Scale [
18], ranging from I to VI levels, also known as phototypes. The correspondence between the skin phototypes and melanosome volume fraction
M inside the epidermis has been studied by several authors, but there is a certain lack of agreement between the adopted models. For example, Colas et al [
19] adapted the results from Karsten et al [
20] where four different melanosome volume fraction classes of values were selected: Very fair to fair skin (phototypes I-II) have
, moderately fair skin types (phototype III) contain about
and dark skin (phototype IV) has about
of melanosome volume fraction. On the other hand, some authors refered a wider span of melanosome fraction values, establishing a correspondence between the six Fitzpatrick classes and the values
,
,
,
,
and
[
21]. In vivo measurements in dorsal forearm and volar arm, using both multiphoton microscopy and spatial frequency domain spectroscopy, gave smaller volume fraction results, between
(skin type I) and
(skin type VI) [
22]. The latter results proved to be consistent, since a comparison between two modern measurement techniques for in vivo melanine inspection were assessed, and as such, they were adopted in this work.
A single dermal layer, comprising the papillary dermis and the reticular dermis, was considered. To simplify the model, the total amounts of oxy-hemoglobin and deoxy-hemoglobin molar concentrations, as well as fat and water fractions, were kept constant with average values as in [
17].
Subcutaneous fat was considered a bloodless layer, with variable thickness representing different BMIs, as mentioned above. A small fraction of water, , and a larger part of fat, was defined in this model.
Finnaly, a muscle layer with of water and for both the oxy-hemoglobin and deoxy-hemoglobin molar concentrations was included.
Table 1 shows the chromophore contents of each layer, defining the respective absorption coefficients.
Scattering, Anisotropy and Refractive Index
The scattering coefficient has an important role in the distribution of fluence within the tissue. The reduced scattering coefficient
is defined by the following empirical formula [
17]:
with the wavelength
in nm. This equation is parameterised by the scaling factor
, in units of cm
−1, and the dimensionless scattering power
b. The parameters specifying
in each tissue layer are given in
Table 2. For the epidermis and dermis,
a and
b were fitted to the data found in [
23]. Fat parameters are based on average values compiled by [
17] from several authors. Muscle parameters
a and
b were fitted to ex-vivo data from [
24] for the spectral range of
nm. The anisotropy coefficient
g for epidermis and dermis for wavelengths in the range
nm, was found in the comprehensive review of [
25]
where a
contribution of isotropic scattering at
nm is assumed and the wavelength
is given in nanometers. The muscle spectral dependence of
g assumes a different shape:
This formula was also obtained from [
25] (
Table 2) and is valid for the spectral range of
nm. In the absence of a specific formula for subcutaneous adipose tissue, a continuity of the upper layer behavior, expressed by Eq. (
7), is assumed.
2.2. Monte Carlo Model
The propagation of light in biological tissue can be simulated by different approaches depending on tissue properties for the spectral characteristics of the laser radiation. The red-infrared portions of the spectrum can penetrate deeper into the tissue and be significantly scattered, in which case the Monte Carlo method offers the most versatile and accurate approach to solving the radiative transfer equation. In this method, a large number of photon packets travel through the medium in a random walk fashion and are allowed to suffer events of scattering, absorption and reflection/transmission at layer boundaries. Such events occur at a rate that depend on the local optical properties of the medium as well as its morphological structure. Since the early 80’s, many MC algorithms have been developed for different diagnosis and therapeutic applications. The MC implementation used in this study is based on the code MCMatlab, a user friendly version of Steven Jacques’ "mcxyz.c" [
26] developed by Marti et
al. for MATLAB users [
27].
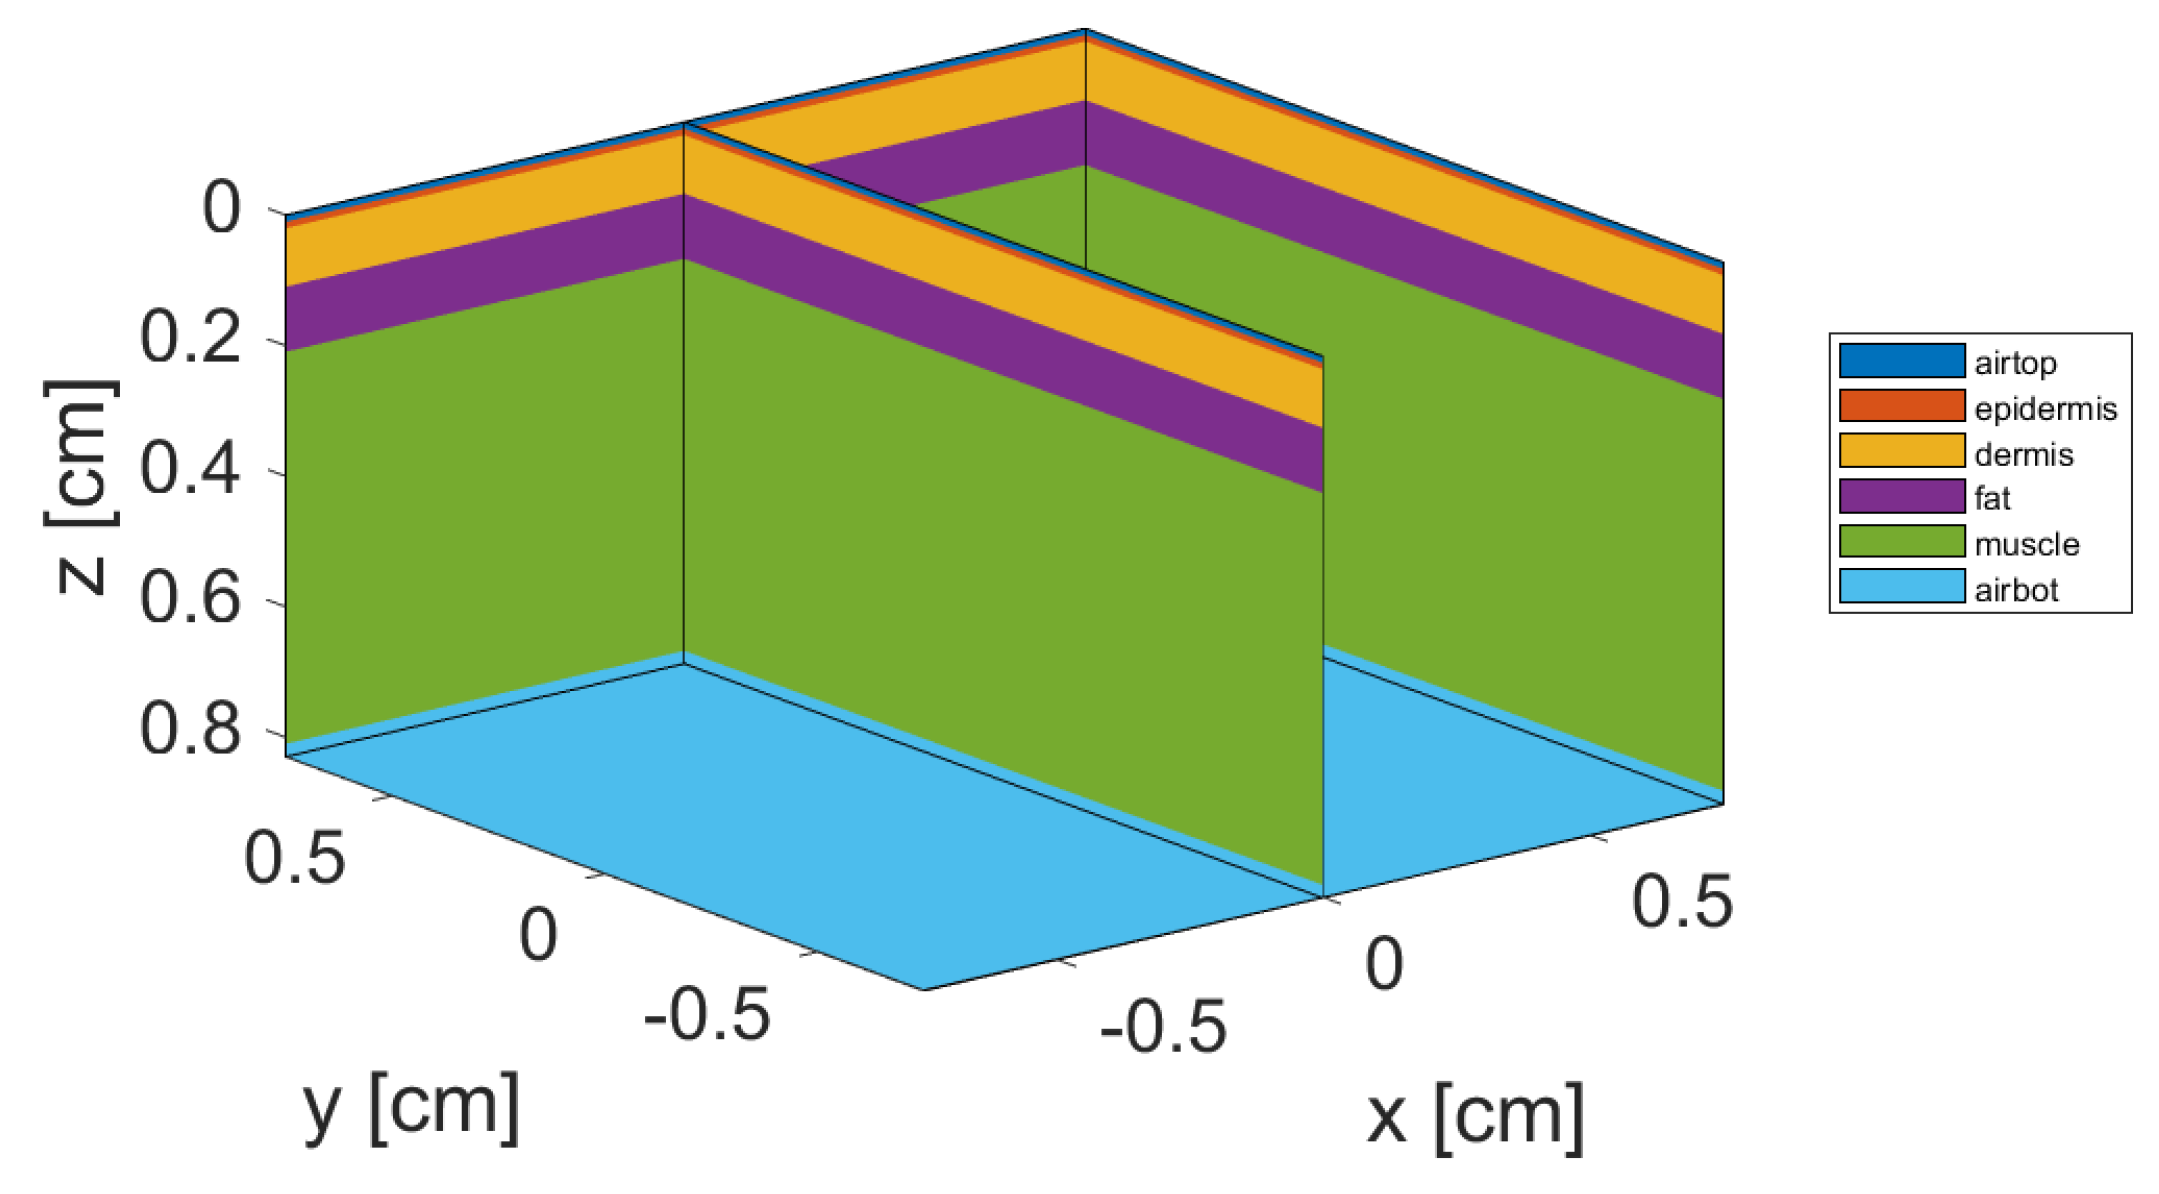
The geometry of our MC implementation is illustrated in
Figure 3. It consists of a tissue block of
cm
2 wide, and variable thickness (up to
cm), obtained by summing up the thickness of each layer presented in
Table 1. There are up to
voxels for the thickest simulated tissue, where
photon packets are launched and tracked while propagating through the tissue. The software ran on a GPU-accelerated configuration using a I7 CPU and a NVIDIA GeForce RTX 4080 graphics card.
Data Set
The machine learning predictive model (MLPM) is designed to provide estimates of the epidermal and muscle average fluence. The reason underlying this choice is two-fold: on one hand it is desirable to assess the treatment times to deliver an efficacious dose to the muscle and its dependence on the individual phototype and BMI; on the other hand, the epidermal energy deposition should be studied as well to make sure that safe levels of laser radiation are employed and no significant temperature rise occurs during the treatment time interval.
A data set representing a range of phototype levels between I and IV and BMI values between 20 and 45 was set up by varying the melanin fraction between
and
in
intervals and letting the fat layer and muscle layer thicknesses vary in the ranges
cm and
cm, with
cm spacing, respectively. The data set yielded 1680 samples for each simulated wavelength, 660 and 808 nm, corresponding to a total number of 3360 MC simulations obtained in this study.
Table 3 presents absorption coefficients for the epidermal layers at the selected wavelengths and median melanosome fractions (M) for each Fitzpatrick skin type, to give an idea of the influence of skin color on optical properties used in the current work’s simulations.
2.3. Predictive Model of Average Dose
Several MLPMs were constructed and tested within the scope of this study, as multiple regression problems with three features: (1) melanine fraction, (2) fat thickness, and (3) muscle thickness; and two response variables: epidermal and muscle energy incident fluences. For the purpose of estimating both variables, what could be understood as a bi-target regression problem is, in fact, decomposed into two independent single-target regression problems. Here, predictions of one parameter value from the predictor values are obtained from ground truth MC simulations with known parameters, as presented in
Table 1 and described above. These allowed the analysis of feature importance, using feature selection algorithms, to further simplify the regression procedure. Considering the characteristics of epidermal and muscle fluence plots observed in preliminary analysis of the MC simulations, the most appropriate candidate MLPM models were Decision Trees for regression and linear regression models. The most promising results were obtained applying linear regression to the logarithm of epidermal fluence and of muscle fluence. The details of the MLPM approach are described hereafter.
Design of the Predictive Model
The predictive model for each single-target task fits a linear model with a set of coefficients to minimize the residual sum of squares between the observed targets in the data set, and the targets predicted by the linear approximation. To train the model, we use LinearRegression from
Scikit-Learn [
28].
Validation and Testing
The data is divided into a training set (
) and a test set (
). To select optimal parameters and assess model performance during the training phase, 5-fold cross validation (CV) is performed. The predictive performance is assessed using the test set. For each fluence model
j, the corresponding root-mean-squared error (
) is calculated as follows:
where,
is the predicted value of the response variable (epidermis or muscle) for sample number
i from the test set, and
is the corresponding true value, assuming a test set with a total of
N samples.
The relationship between the predicted and true energy density values is quantified by calculating the coefficient of determination
for each single-target regression task
:
where,
is the mean true response variable value. Note that, ideally,
should approximate 1 for the best model.
3. Results and Discussion
3.1. Monte Carlo Simulation Results
A preliminary literature survey of the optical and morphological parameters of a diversity of subject characteristics allowed the construction of a model of the skin in the orofacial regions suitable for conducting realistic Monte Carlo simulations of laser treatment protocols. An extensive simulation study was conducted for laser light sources with gaussian cross-sectional distribution, an aperture diameter of cm, and 660 nm and 808 nm laser wavelengths. Incident laser radiant power and treatment duration was selected in a way that it would a total dose of J at skin surface, while respecting the maximum permissible exposure (MPE) for each wavelength. The total dose was selected as a reference configuration for a given tissue model ( cm, cm and - Fitzpatrick I), with minimal epidermal melanin influence, where an efficacious dose of would be achieved at the fat/muscle interface. This configuration combined with the most penetrating wavelength of this study, nm, gives a treatment time of min for a safe laser radiant flux adjusted to , and an incident irradiance of , which is bellow the skin MPE () for this wavelength. Then, the treatment time was computed using this incident irradiance and the fluence rates at muscle interface obtained from the MC simulations for each combination of thickness and optical parameters. The procedure described above was replicated for the wavelength 660 nm, where the skin MPE has a lower value (). This led to a laser radiant flux of , and an incident irradiance of for safe exposure levels, increasing the treatment time to 10 min when a total dose of J at skin surface is to be delivered.
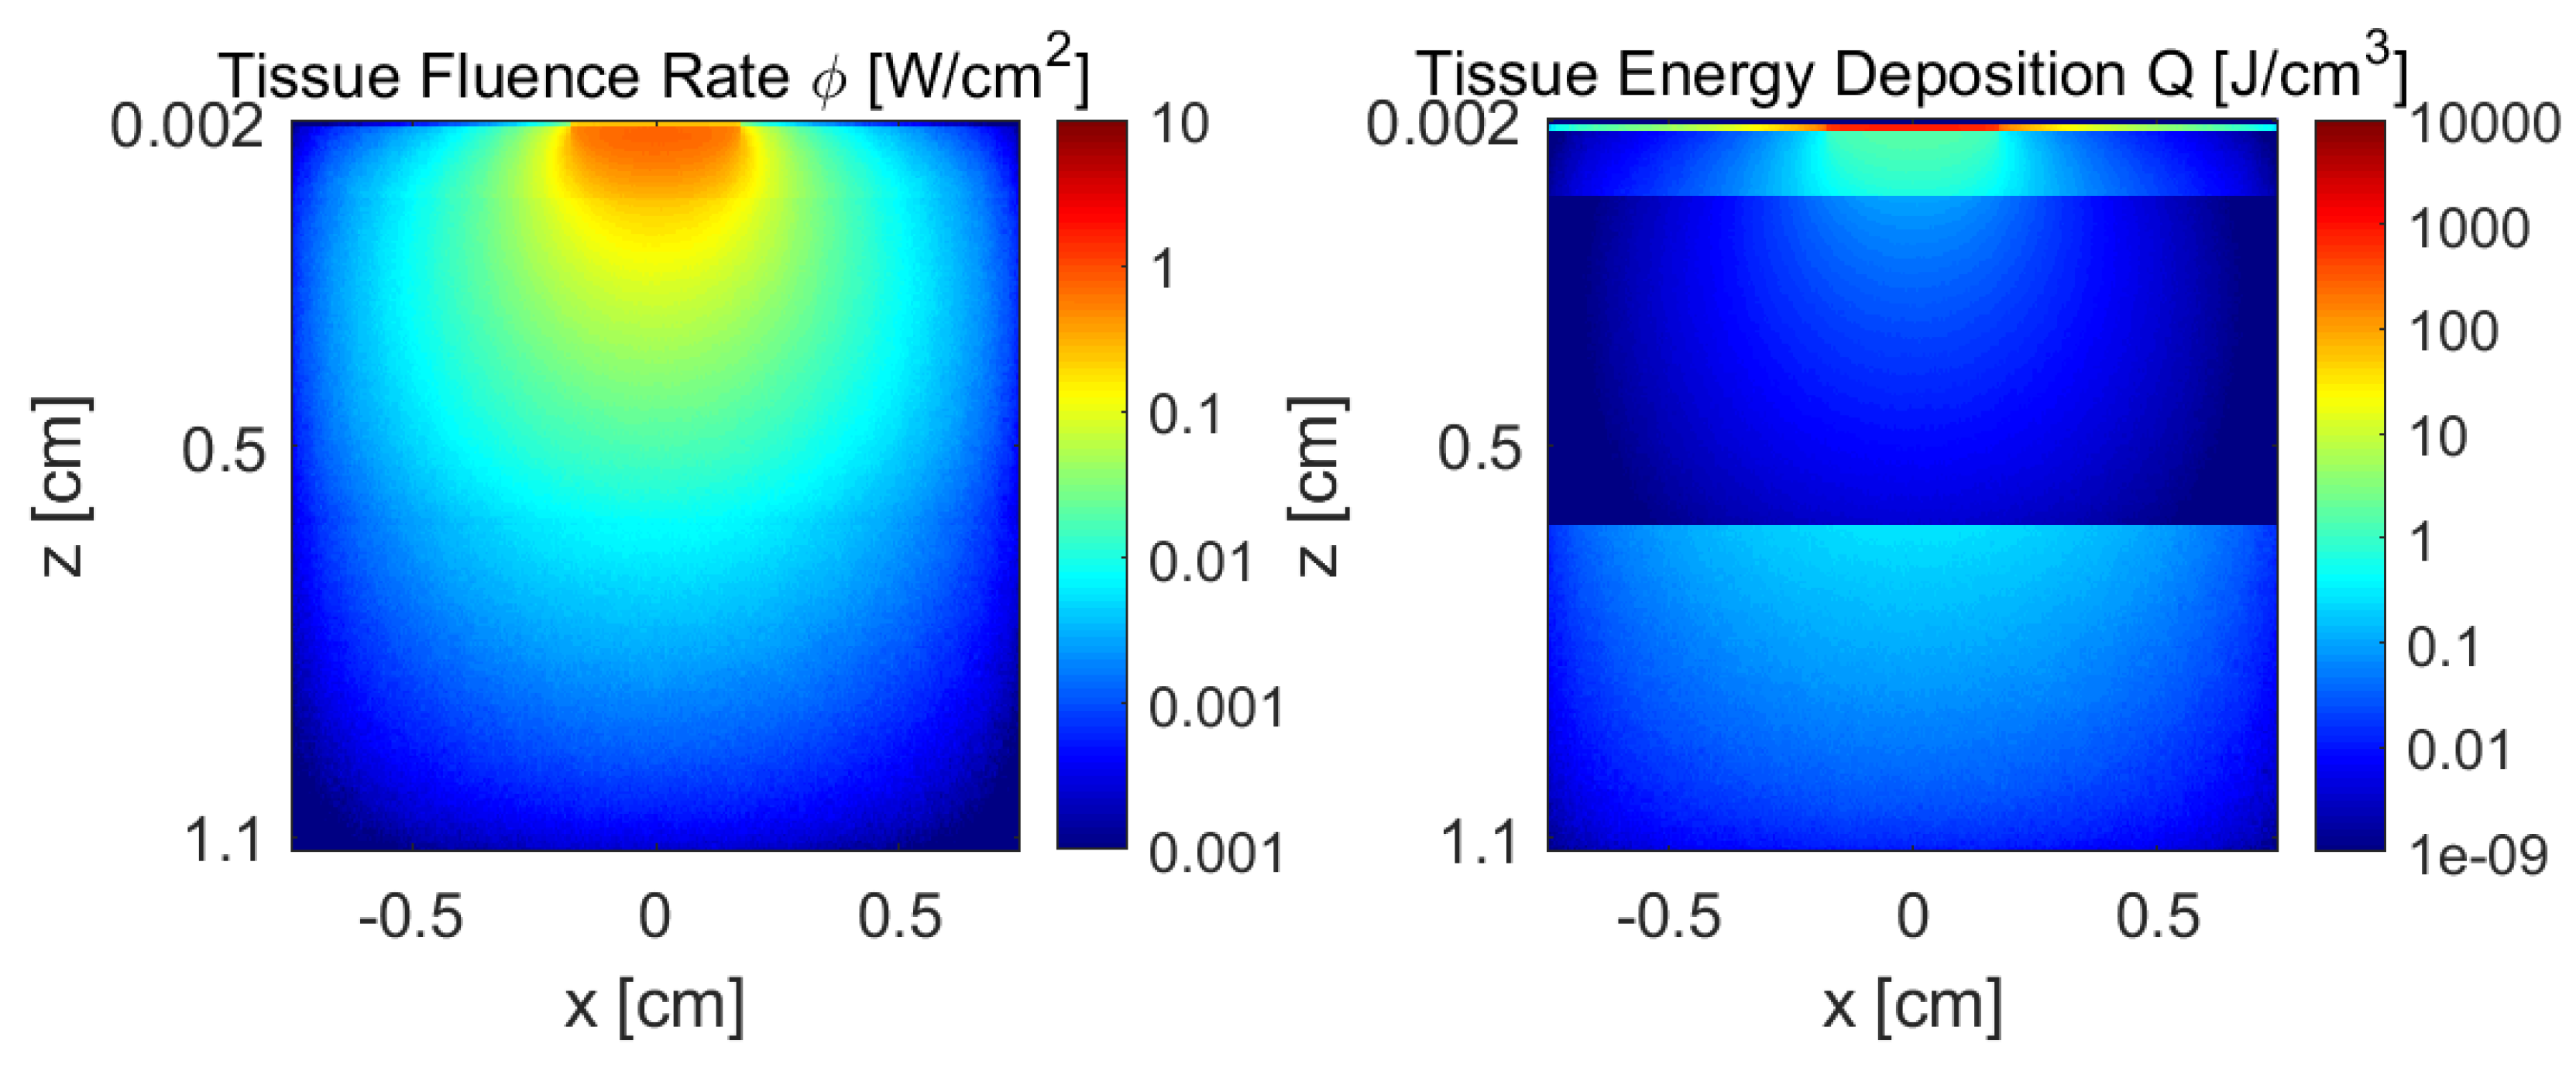
Figure 4 illustrates the fluence rate (
) and absorbed energy (
) density distributions for a laser with a wavelength of 808 nm, across a cheek tissue section (
) with model parameters:
,
cm, and
cm. The differences between absorbed energy and incident fluence show that the influence of a high absorption at the thin epidermal layer should be analyzed in comparison with a much more translucent but thicker fat layer. Both layers have a high impact in the amount of light that reaches the muscle layer. When the fat layer thickness is
cm, the melanine fraction a high influence on muscle dose.
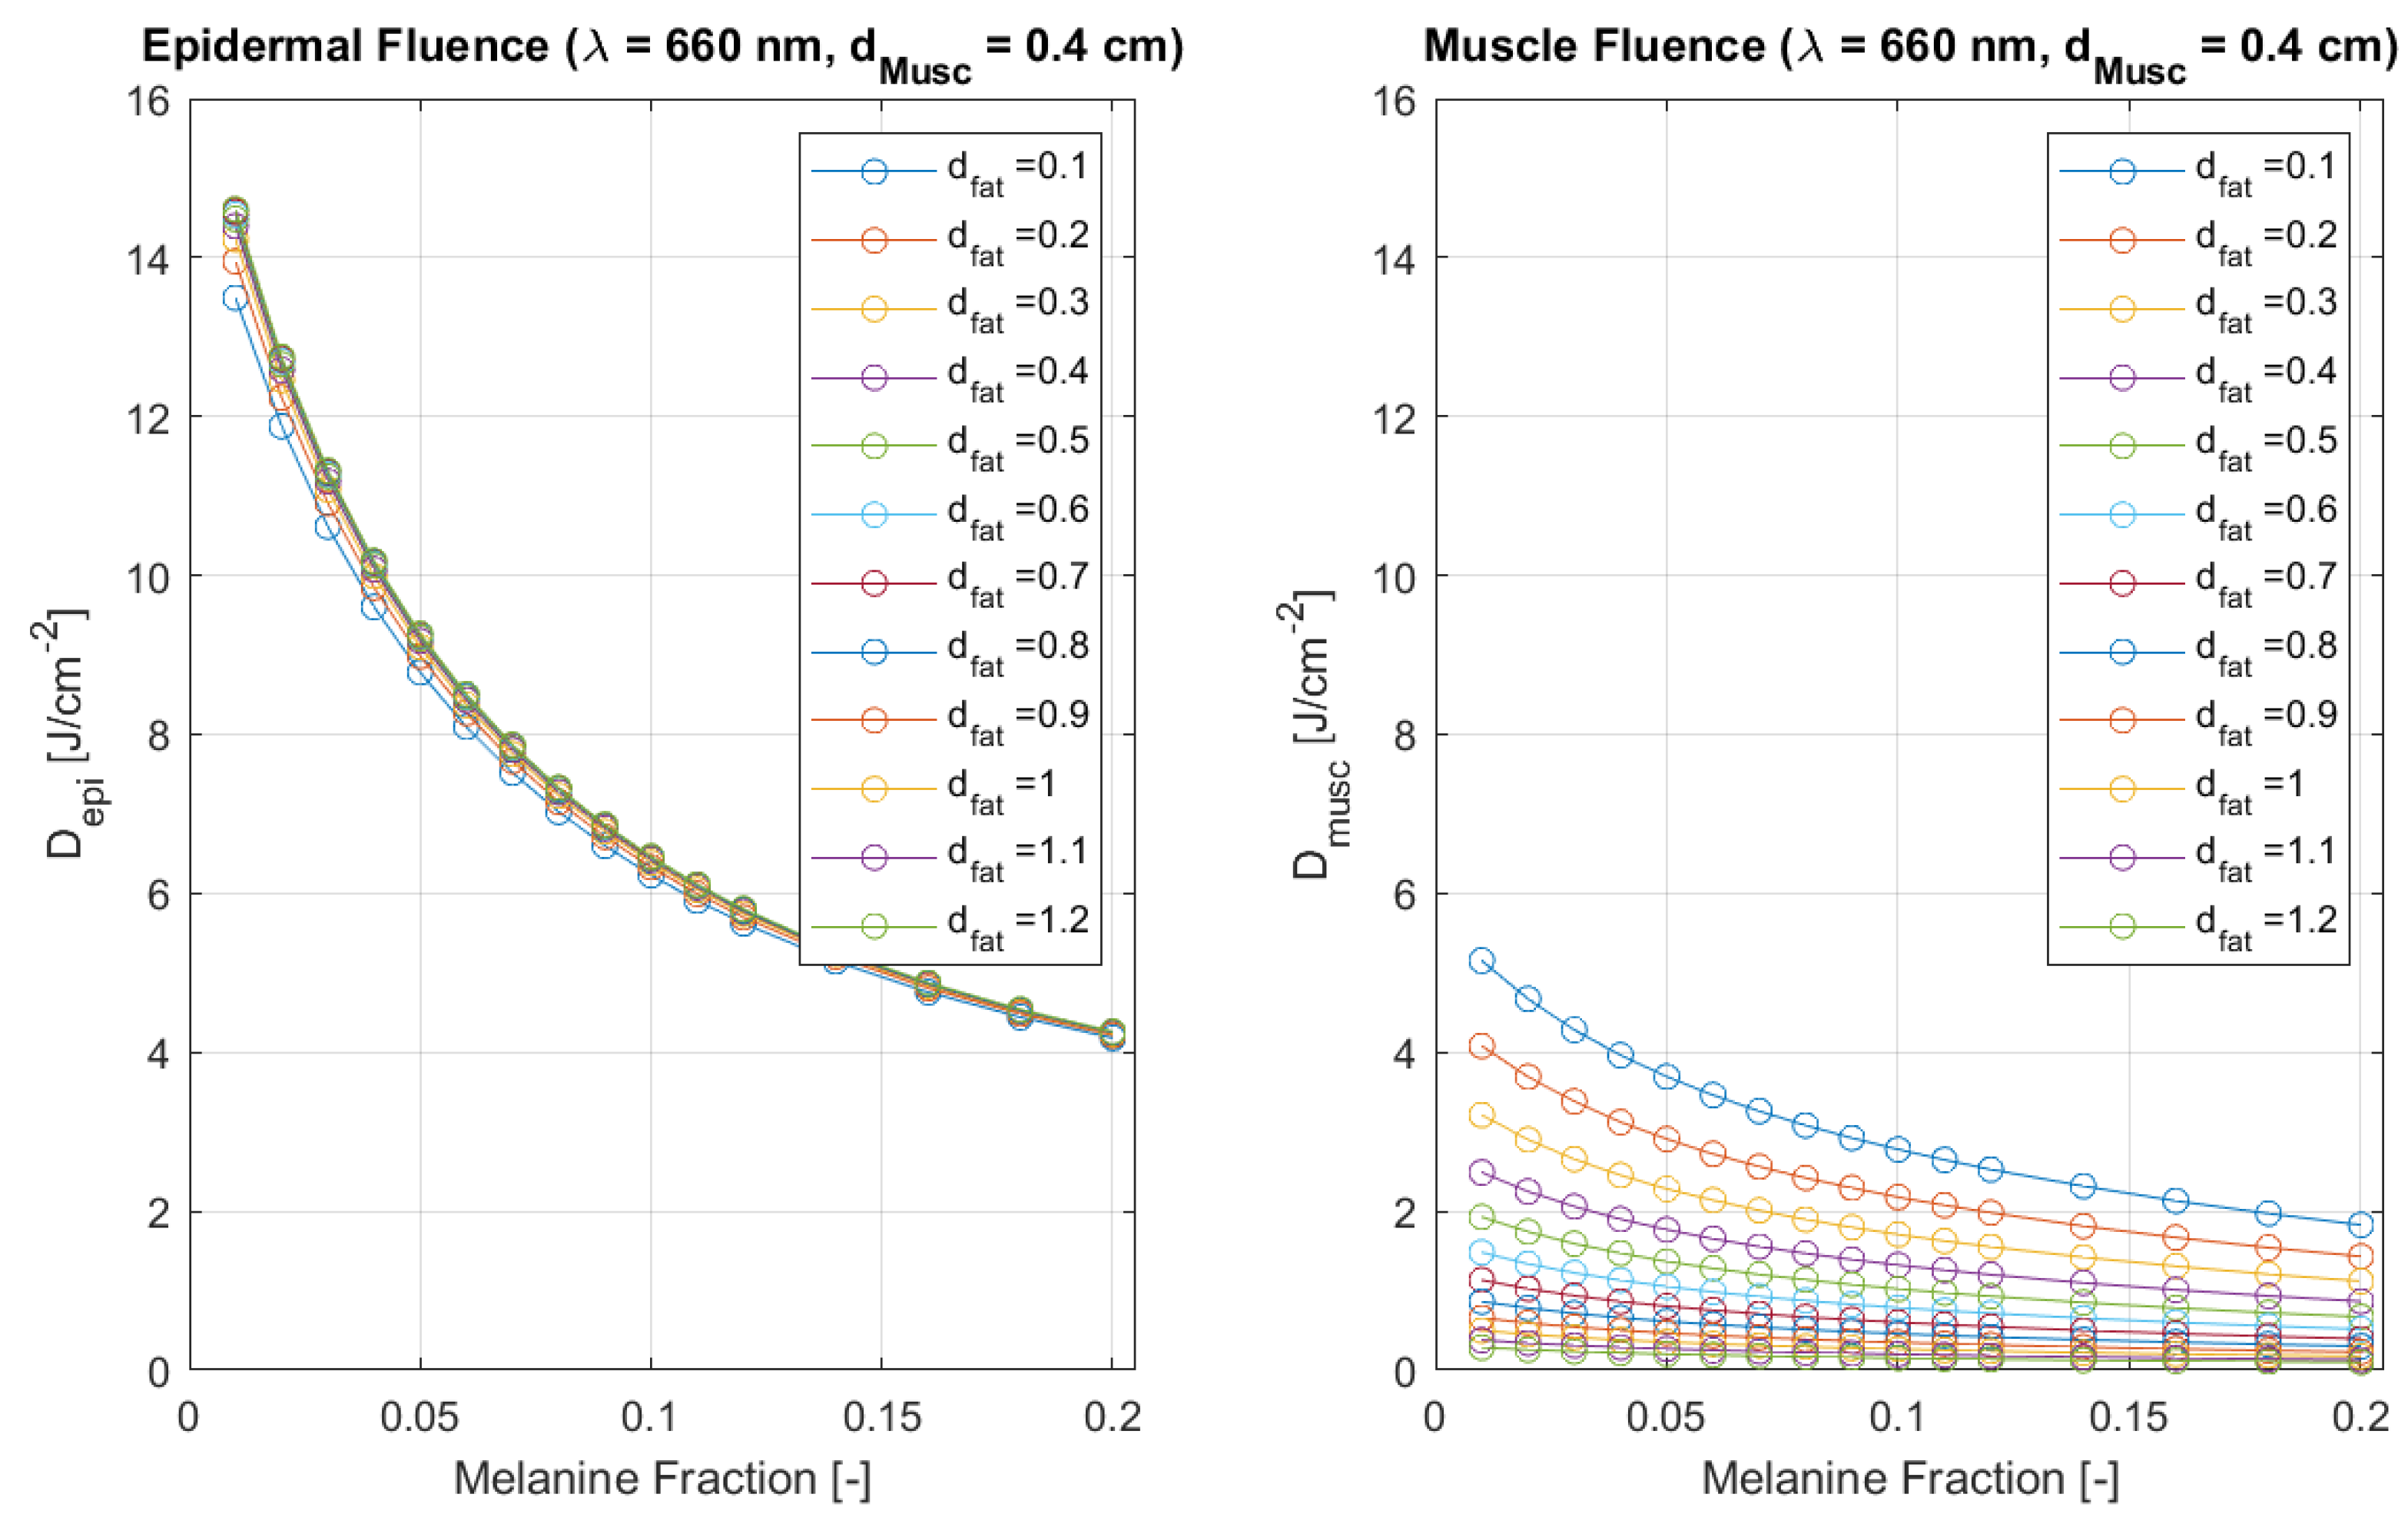
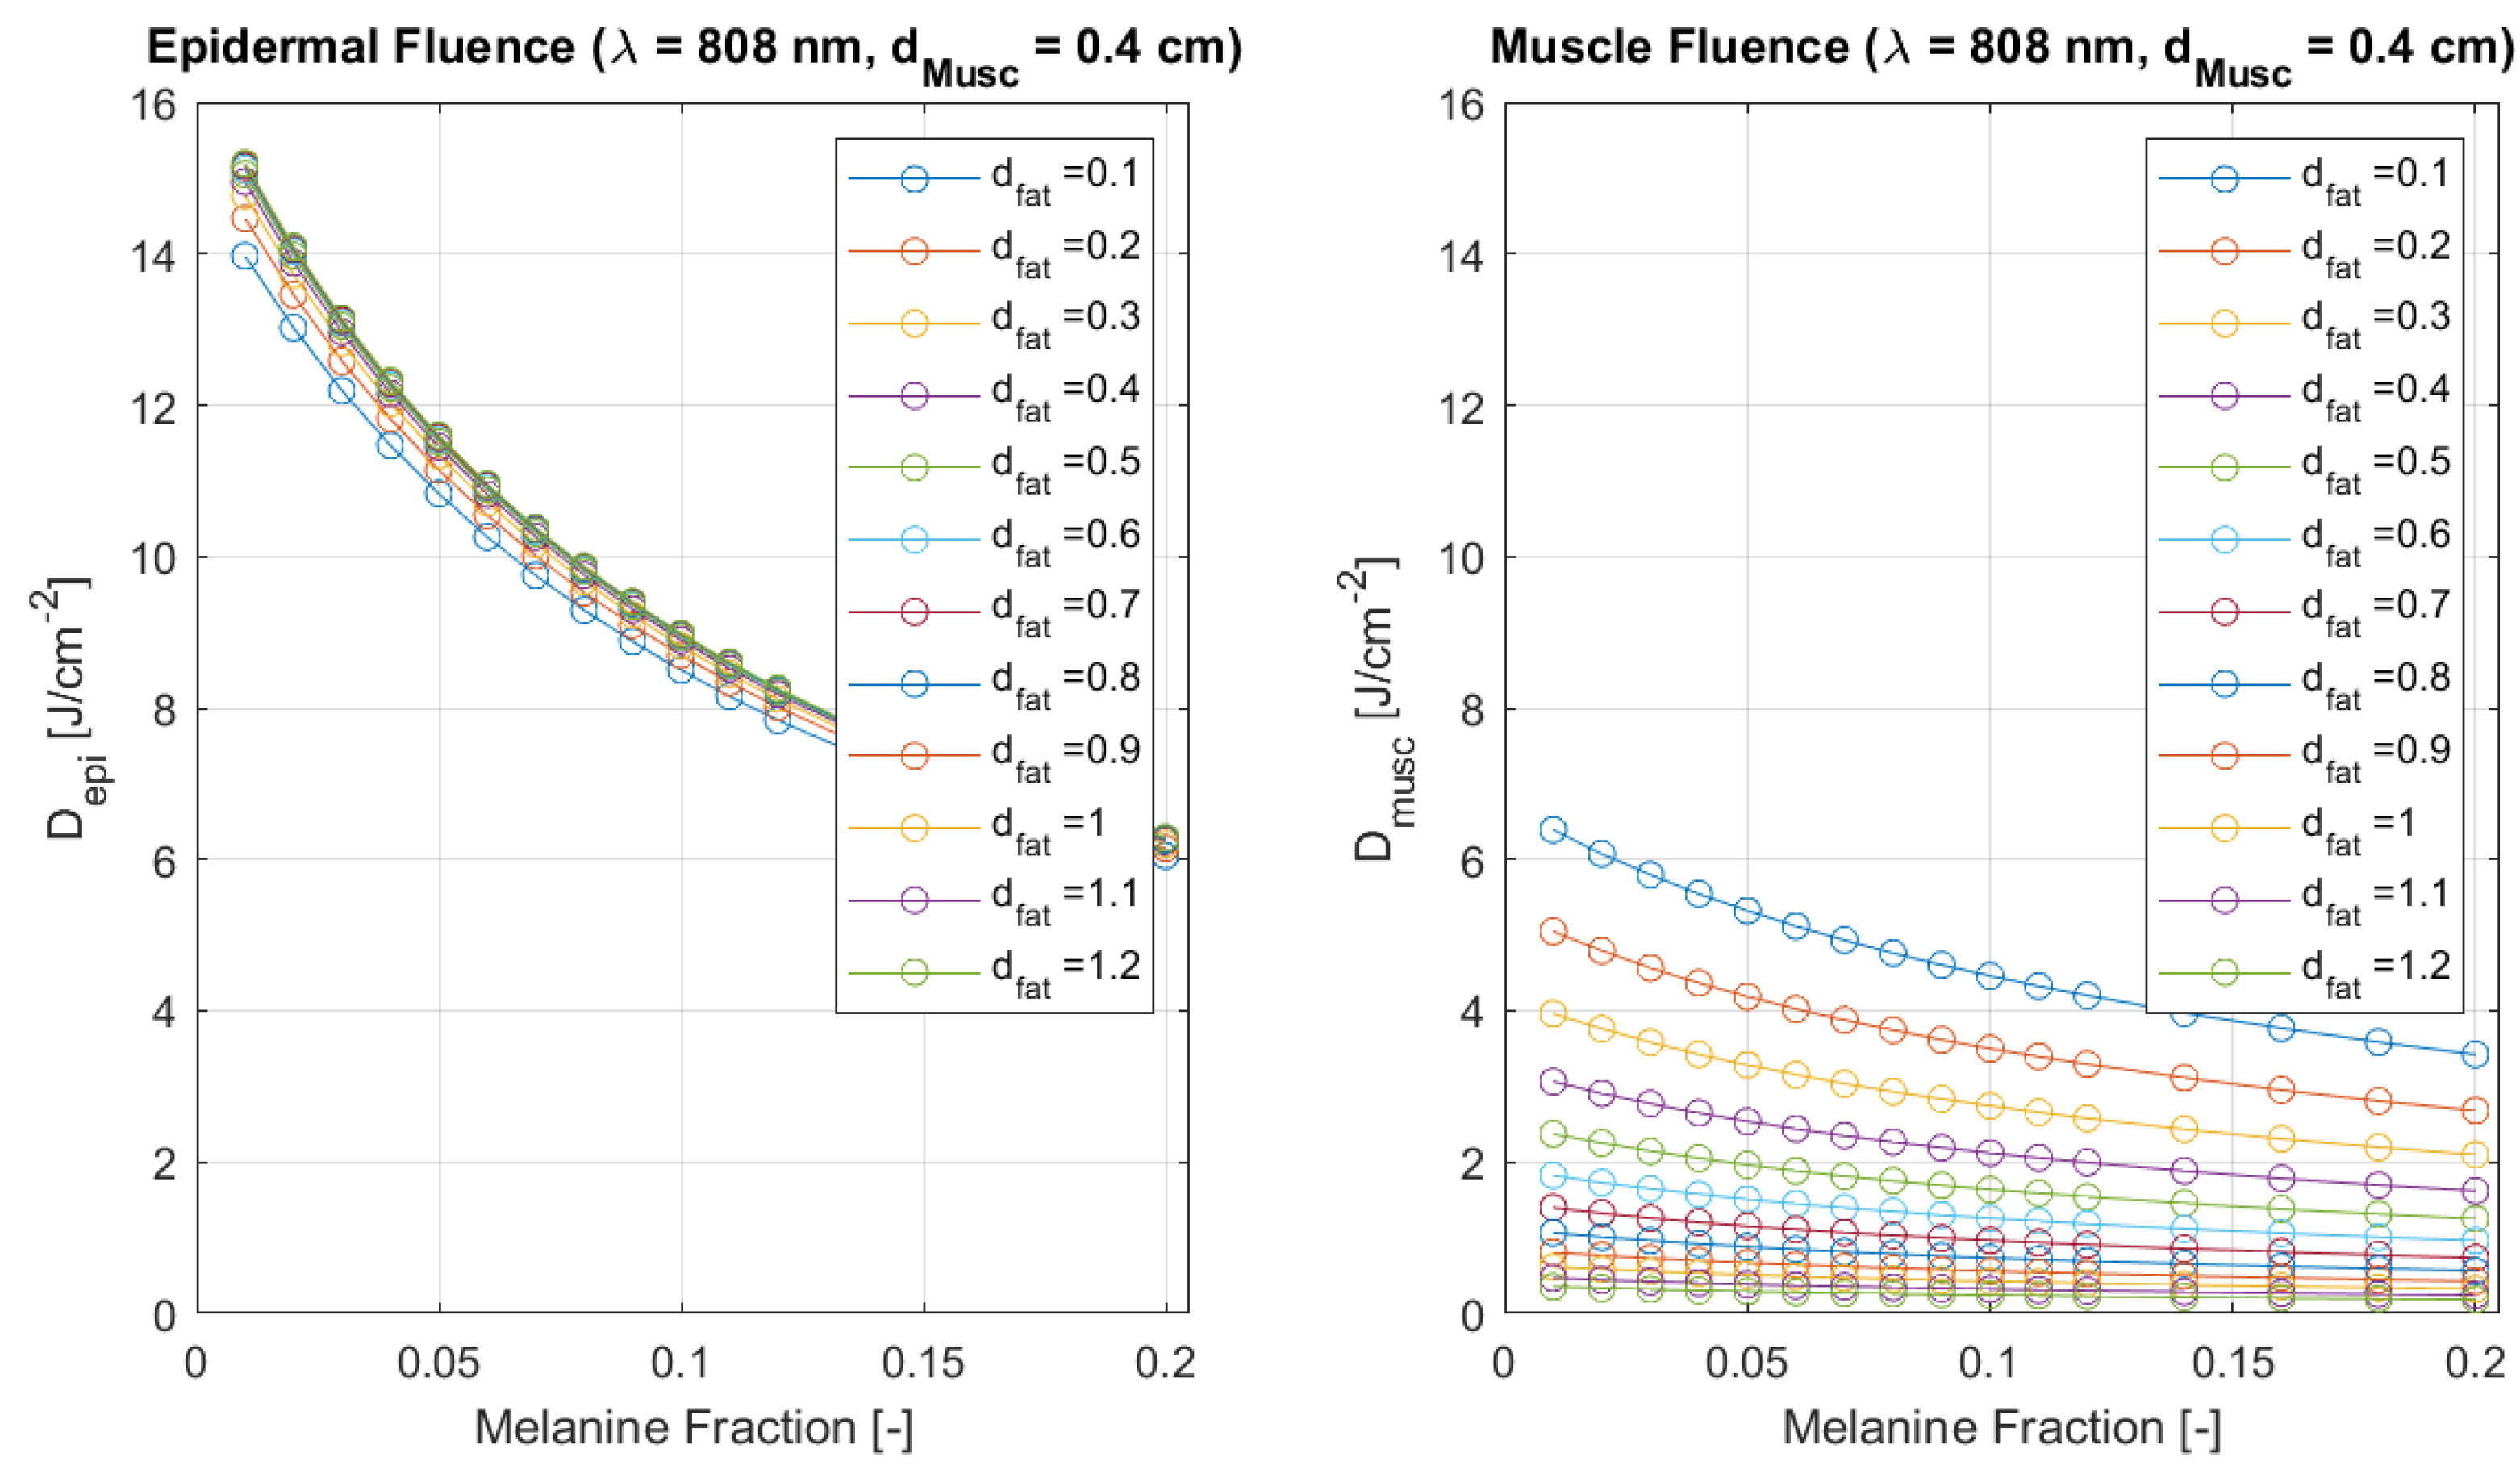
Fluence (or delivered dose) is compared in
Figure 5 and
Figure 6 between the beginning of epidermal and muscle layers for each wavelength and a reference tissue model. In
Figure 6, a variation of over
(from about
to
) is observed when
M varies across
to
. Similar relative decays are obtained for the remaining fat thickness values. However, fixed melanin values and varying fat thickness, between
and
cm, have a higher impact on muscle dose: when
, a variation of over
occurs (from about
to
), and similar decays are found for the remaining melanin fractions. This happens because the fat layer has a large scattering coefficient and a much larger thickness than the epidermal layer, spreading the laser beam away from the target tissue. The behaviour for 660 nm is similar with respect to fat thickness and melanin variation. However, fluence is already slightly lower at epidermal top when compared to 808 nm light, since absorption is larger at 660 nm. That difference accentuates as light is propagating inside the tissue, increasing the difference in muscle delivered dose. It becomes evident that treatment time will have to be increased when using a 660 nm laser. For example, using a 10 mW laser, 10 min will be necessary to deliver a total dose of 6 J at the skin surface. However, only
will be available at muscle surface for this laser, so the time should be increased to
min to achieve a dose of
for the onset of PBM effects (or even higher, for analgesia responses). It can be compared to a treatment time of about
min when similar conditions are used for a 808 nm wavelength. These simulations, combined with the machine learning prediction model, allow the computation of the treatment time for any combination of tissue parameters within the simulation domain, as will be described in the following section.
Figure 5.
Monte Carlo simulation results of epidermal (left) and muscle (right) fluence () as a function of melanine fraction, for wavelength 660 nm, in a cheek tissue with cm, and varying fat thicknesses. Results for a safe incident laser power of and an extra-oral delivered dose of J.
Figure 5.
Monte Carlo simulation results of epidermal (left) and muscle (right) fluence () as a function of melanine fraction, for wavelength 660 nm, in a cheek tissue with cm, and varying fat thicknesses. Results for a safe incident laser power of and an extra-oral delivered dose of J.
Figure 6.
Monte Carlo simulation results of epidermal (left) and muscle (right) fluence () as a function of melanine fraction, for wavelength 808 nm, in a cheek tissue with cm, and varying fat thicknesses. Results for a safe incident laser power of and an extra-oral delivered dose of J.
Figure 6.
Monte Carlo simulation results of epidermal (left) and muscle (right) fluence () as a function of melanine fraction, for wavelength 808 nm, in a cheek tissue with cm, and varying fat thicknesses. Results for a safe incident laser power of and an extra-oral delivered dose of J.
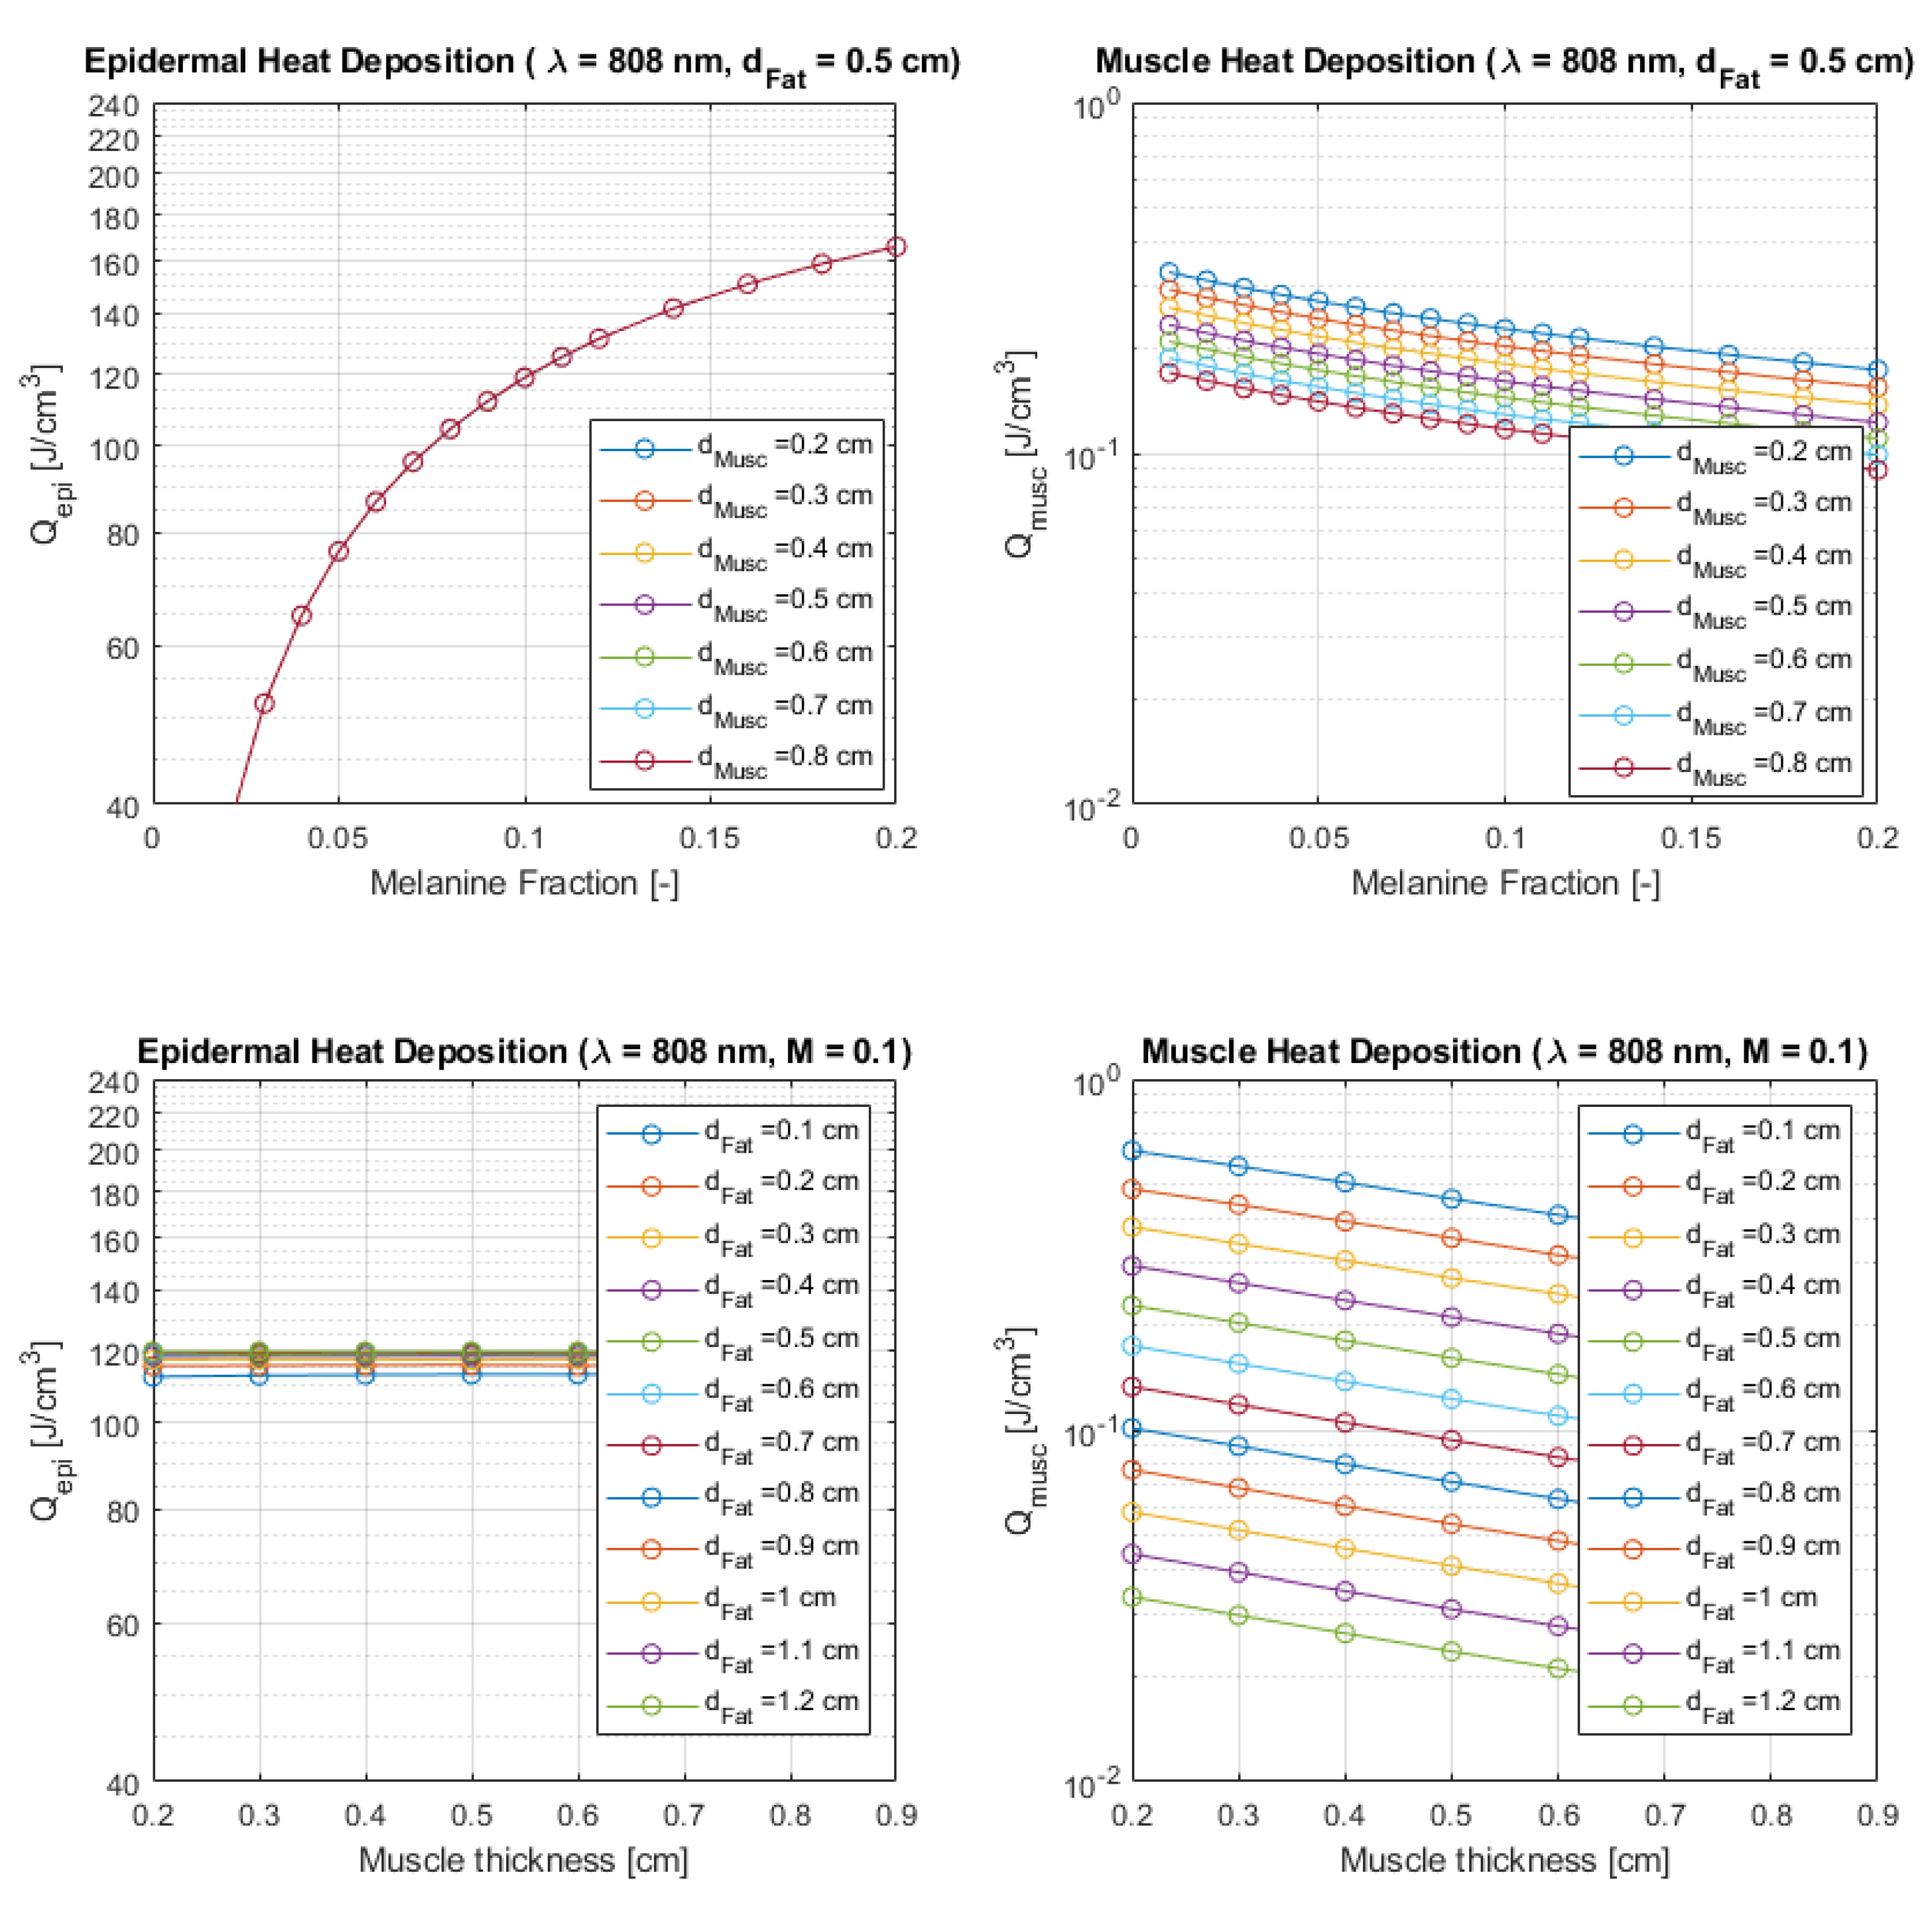
Figure 7.
Comparing laser energy density deposition at epidermis and muscle for a wavelength of 660 nm and an incident laser power of 10 mW ( J delivered dose). Plots A and B - Curves of variable melanin fraction for different muscle thicknesses, and a fat thickness of cm. Plots C and D - Curves of variable muscle thicknesses for different fat thicknesses, and a melanin fraction of .
Figure 8.
Comparing laser energy density deposition at epidermis and muscle for a wavelength of 808 nm, an incident laser power of 30 mW and a treatment time of min ( J delivered dose). Plots A and B - Curves of variable melanin fraction for different muscle thicknesses, and a fat thickness of cm. Plots C and D - Curves of variable muscle thicknesses for different fat thicknesses, and a melanin fraction of .
3.2. Predictive Model Results
The predictive model has been trained with the data set described above. To illustrate its potential as a tool for dosimetry planning, the average muscle dose was predicted for a range of typical melanin fractions related to phototype levels as listed in
Table 3. Fat layer and muscle layer thickness values were selected in the ranges
cm and
cm, with
cm spacing, respectively, in accordance to the domain of MC simulated values.
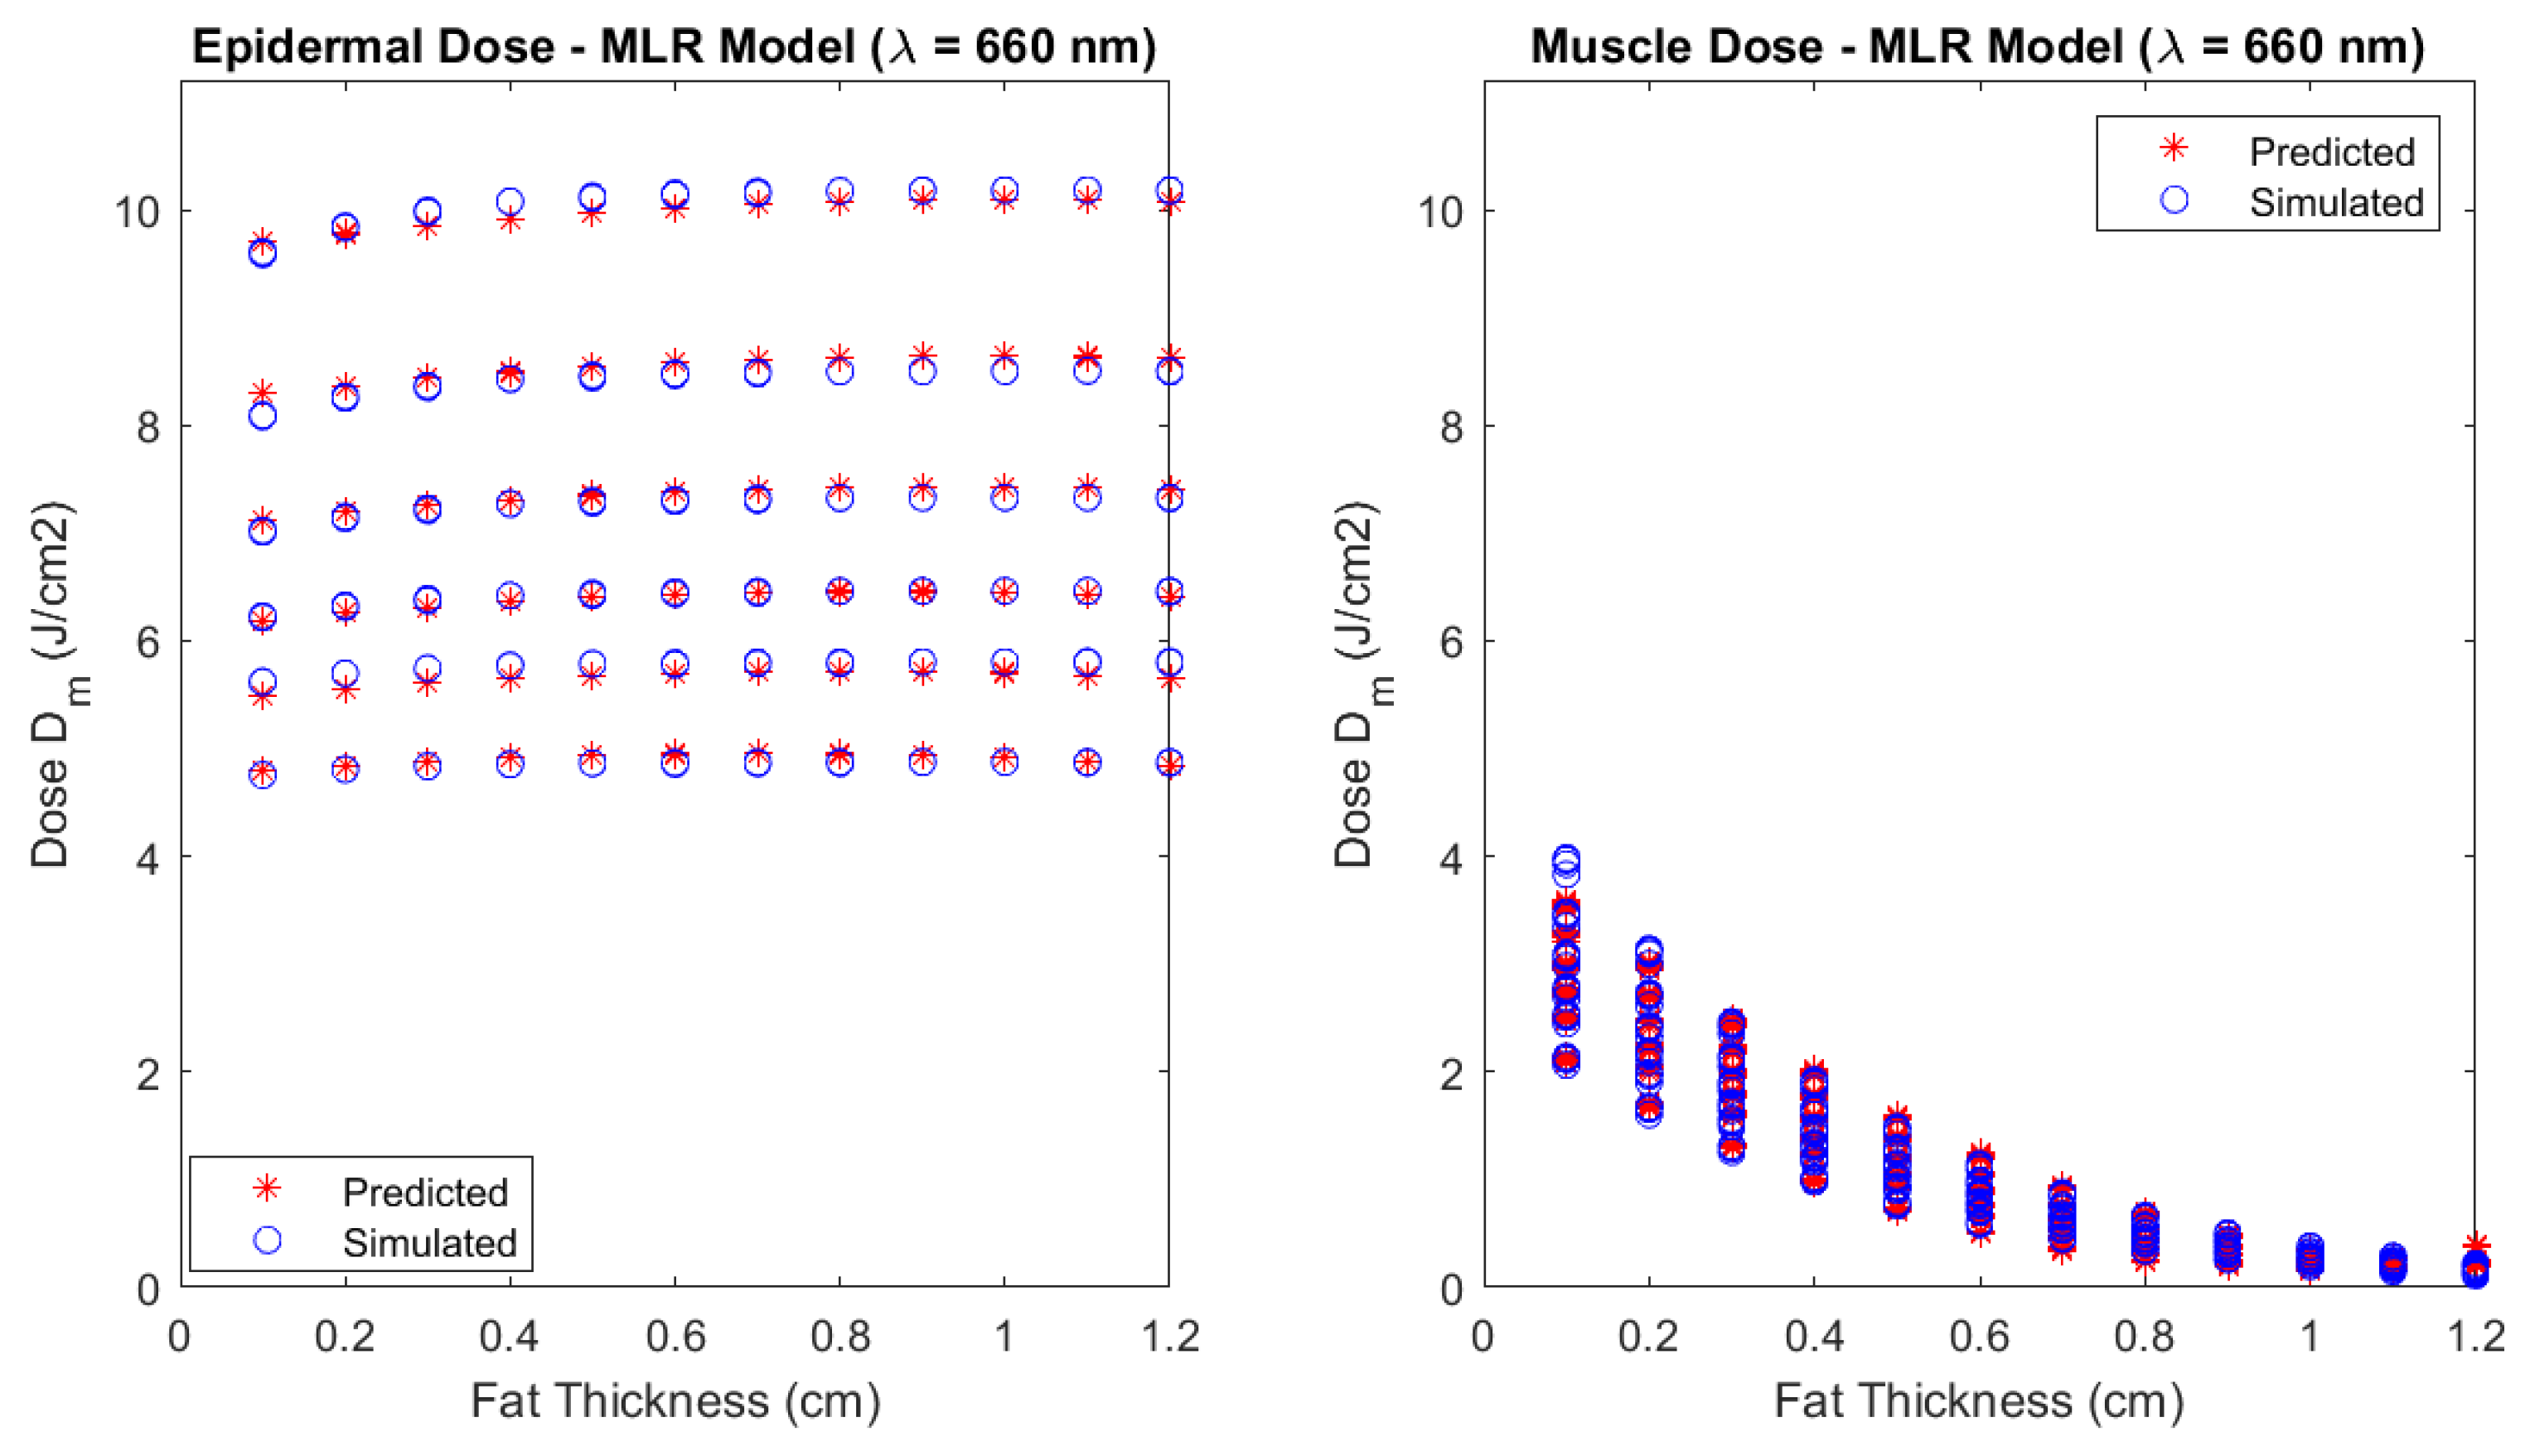
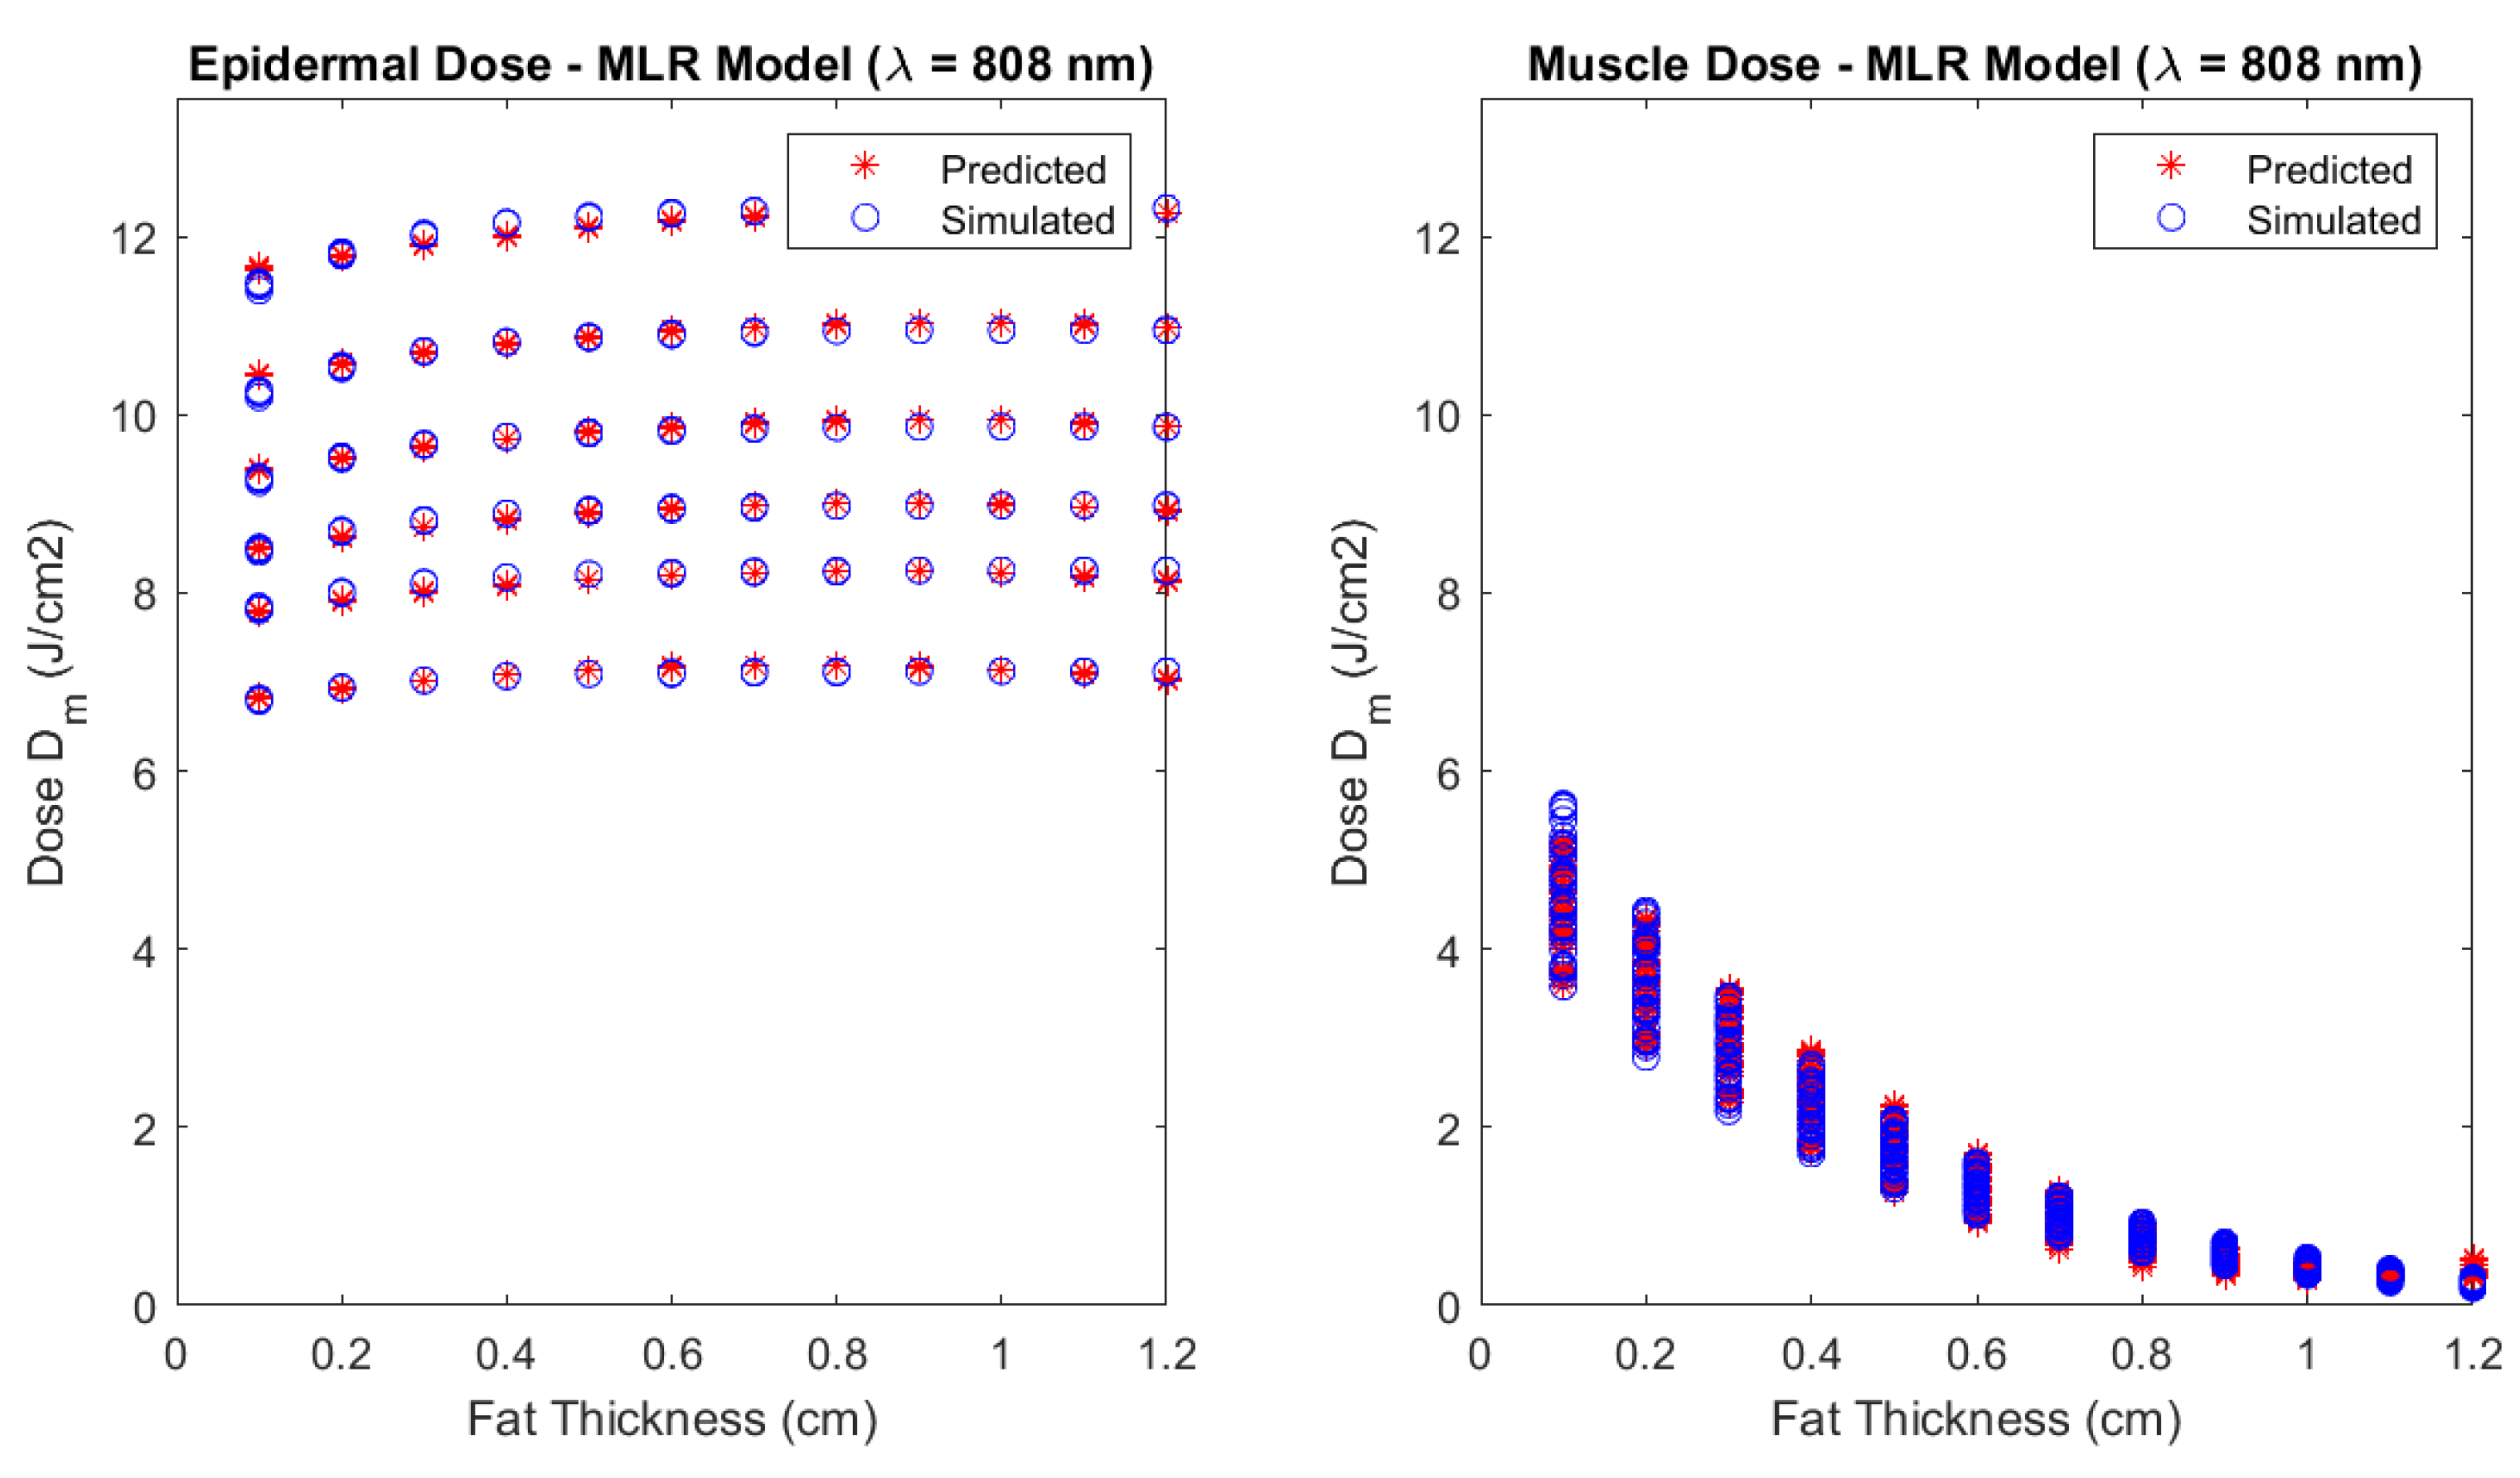
Figure 9 and
Figure 10 show the comparison between the predicted doses and the respective MC simulations for these conditions. The laser power is adjusted according to safety exposure considerations mentioned before (10 min duration for a power of 10 mW at 660 nm; and 3 min duration for a power of 30 mW at 808 nm) and total delivered dose at skin surface remains at 6 J. The plots represent the variation across the fat thickness , since the predictive model revealed that fat thickness is more important than phototype for muscle dose calculation. Epidermal dose is also given for comparison and safety considerations.
Predicting the Treatment Duration
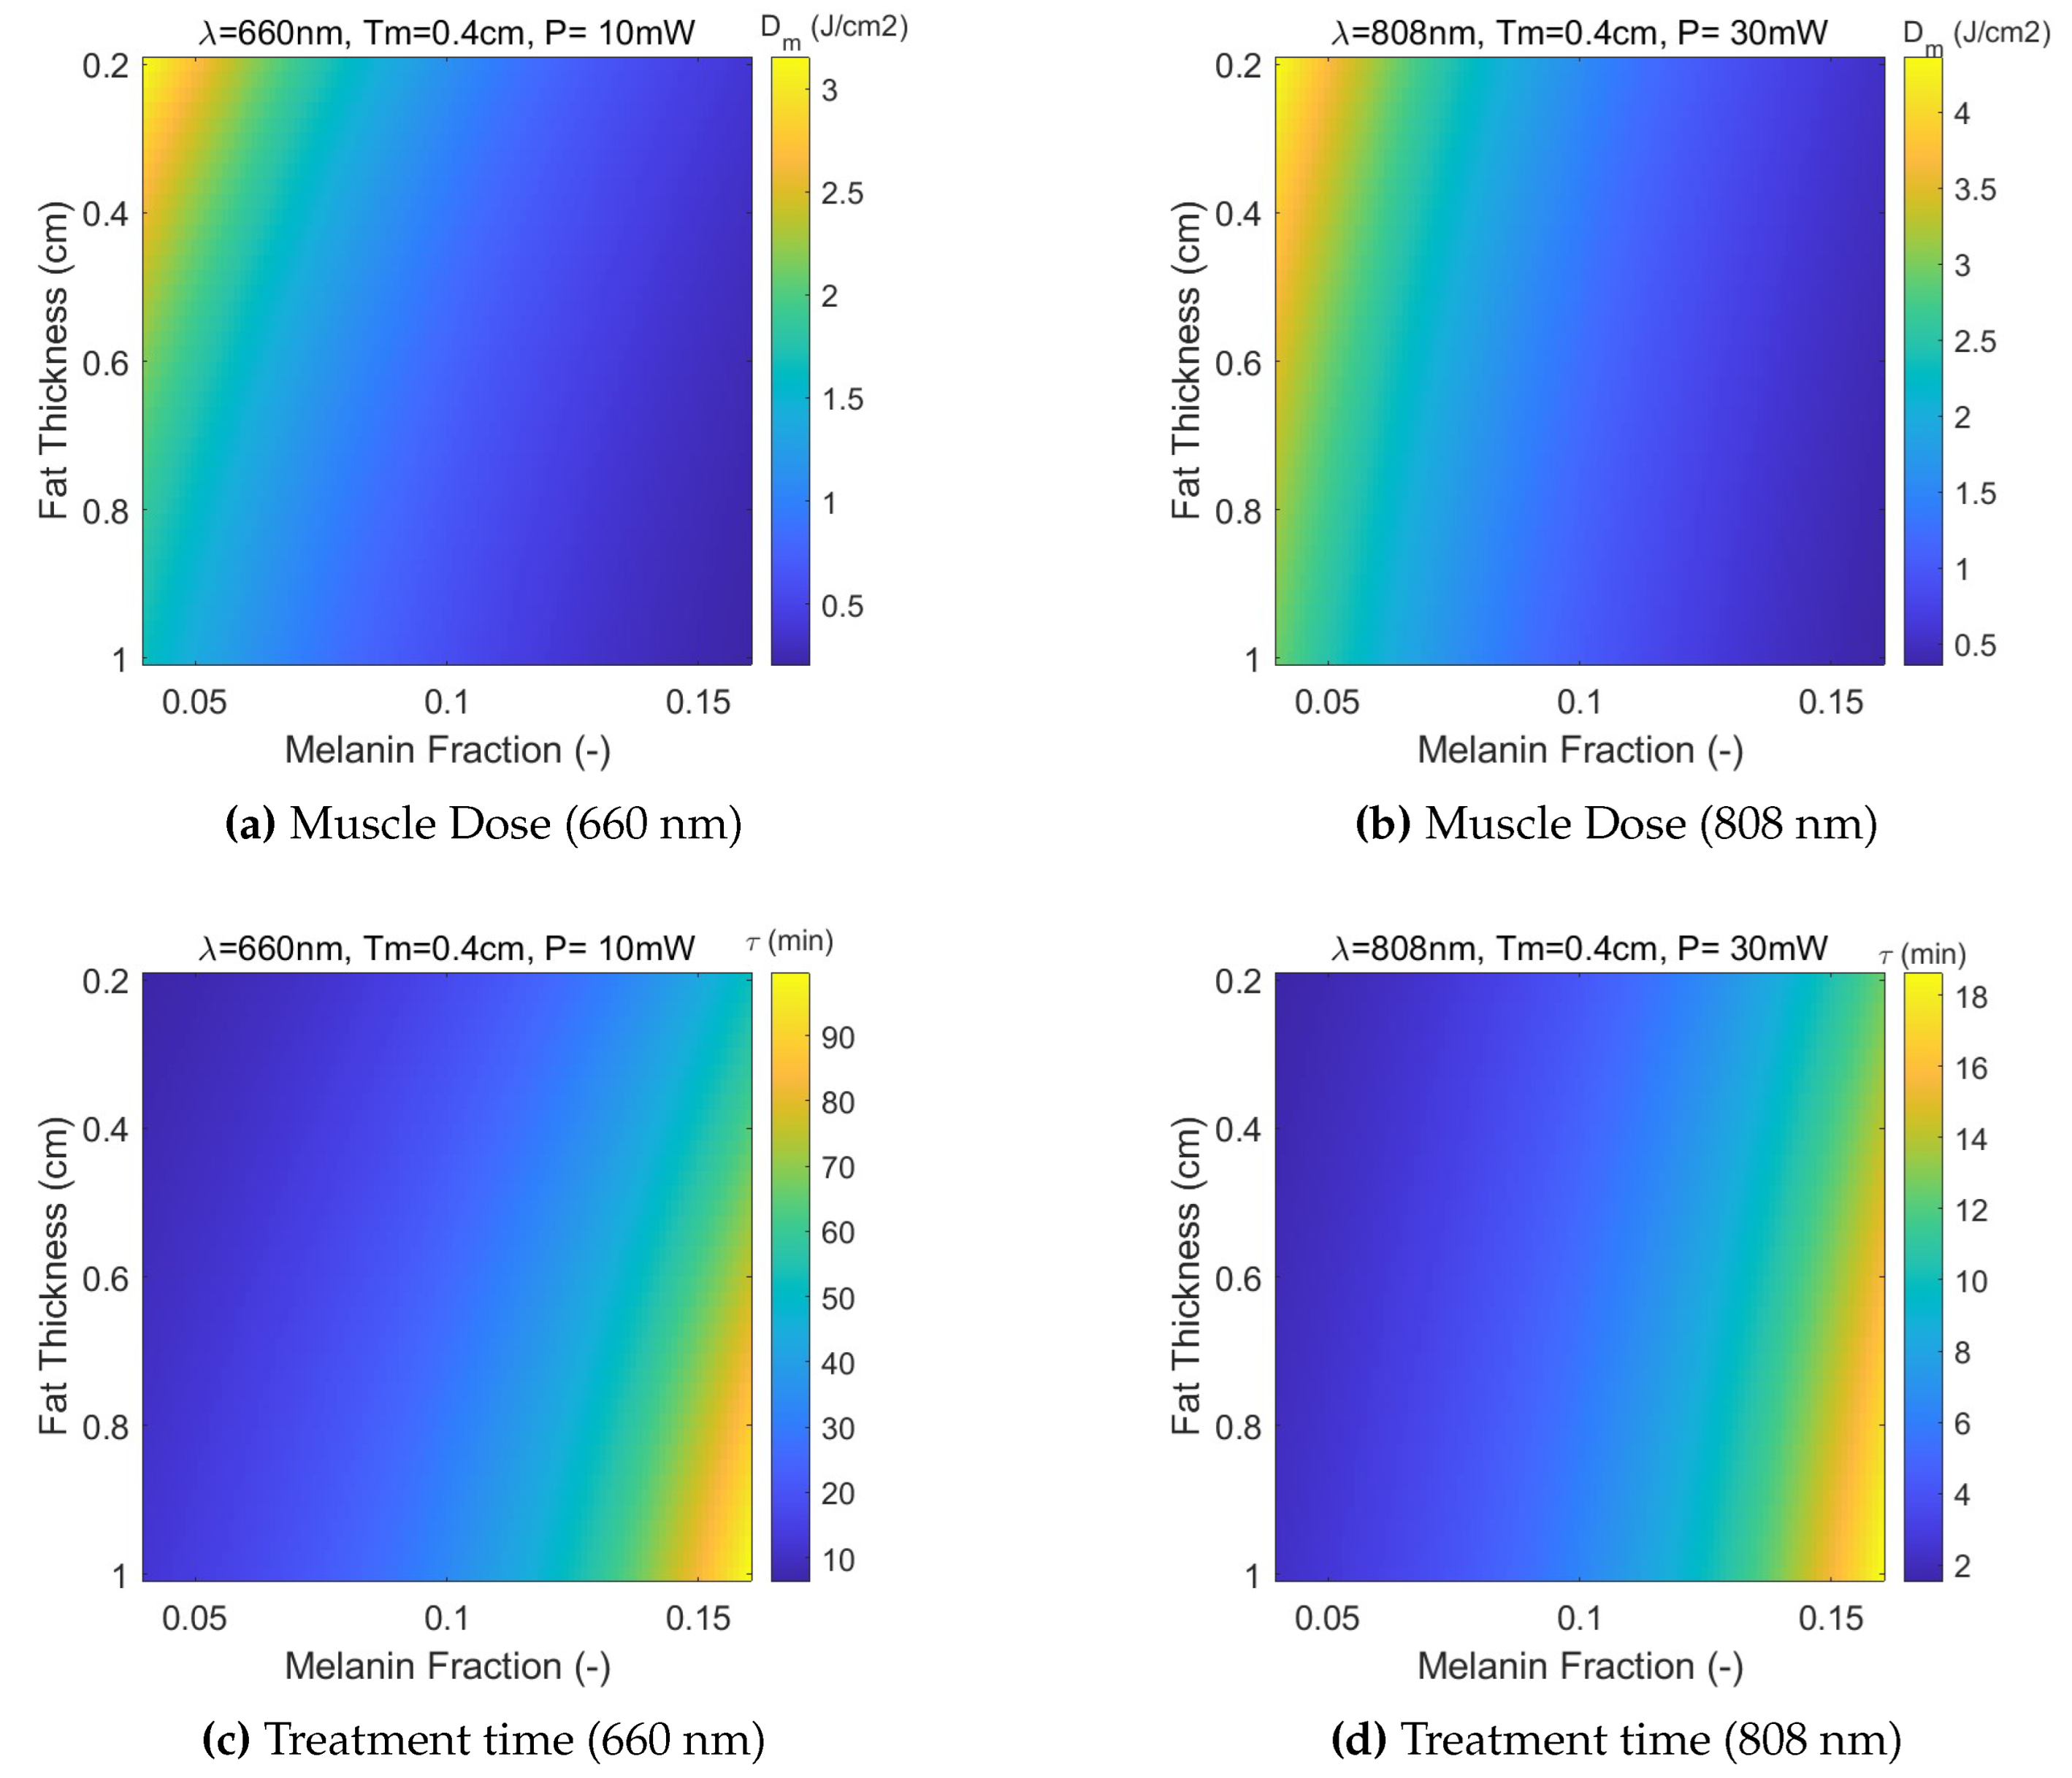
Figure 12 (a) and (b) represent maps of delivered dose at the entrance of muscle layer, for laser wavelengths 660 nm and 808 nm, respectively. Note that, although laser powers are different across wavelengths for laser safety considerations, the delivered fluences are the same. This is so in order to focus on the elicited biological response, herein,
, taken as the onset of PBM, as reported by literature. That can be achieved by adjusting the treatment time (and incident total dose at skin surface) in a way that the muscle dose remains equal to the aimed dose. Thus, conversion of these maps to treatment time maps is quite straightforward, as depicted in
Figure 12 (c) and (d), for illustration of the time scales involved in this study.
3.3. Discussion and Outlook
A Monte Carlo based dosimetry model for extraoral PBMT of temporomandibular disorders was designed and comprehensively evaluated for two laser wavelengths in the red-infrared region.
Although the emphasis of this study is on muscle dose for treatment planning, the epidermal delivered dose is also presented. Here, the phototype is more important than BMI, as expected, and although the mean incident dose decreases with melanin fraction due to increasing levels of absorption, leaving less back-scattered for underneath tissues, the plots presented in
Figure 9 and
Figure 10 must be interpreted in conjunction with MC simulated heat deposition energy density plots displayed in
Figure 7 and
Figure 8. In fact, epidermal delivered dose decreases with phototype level, but the absorbed energy increases which may require taking measures regarding to laser duration and frequency to avoid patient discomfort or unwanted biological responses at epidermal surface, since absorbed energy densities can be above
in darker skin types.
In a related study [
12], a Monte Carlo based dosimetry model was applied to PBMT for OM. Their study included measurement of collimated transmittance through the check in four volunteers, using a 850 nm light emitting diode. Similarly, the authors found a larger effect of tissue thickness when compared to skin phototype, but the latter had a negligible impact on laser fluence rate, contrarily to what was found in our study. A subsequent study [
16], with a larger sample, reported fluence rate variations up to
, which agree better with our findings regarding muscle delivered dose variations with melanin fraction. However, significant difference separates this study from our, since the optical model and measurement setup is not the same. Absorption coefficients are lower than those presented herein, and the relation between optical parameters and melanin concentration remains unclear. Collimated transmitted fluence rate was measured (and simulated) at the cheek mucosa, while in our case, it made more sense to predict the delived dose (fluence) at the fat/muscle interface so that the results could be interpreted more easily in relation to the current evidence regarding biological responses and optimum dose selection.
A recent review on PBMT for TMDs [
1] reported laser wavelengths between 635 and 980 nm, fluences in the range
, and treatment times between 9 s to 15 min in each treatment section. Our results indicate that, while 808 nm light allows treatment times within
min, across all skin types and a median fat thickness, which in within the reported range, less penetrating 660 nm light takes much longer to be effective. Only phototypes I and II allow for treatment times under 15 min, rising up to around 90 min at thicker cheek tissues, while for 808 nm it can take at most 18 min. In another study [
29], wavelengths ranging from 790 to 905 nm, with low doses of 3 to
, showed the best results in TMDs. This study reported laser power in the range of 25 to 120 W for these doses, but no mention if made to the phototype and laser beam spatial profile, which leads to the question of whether safe levels can be observed. This is a concern specially for darker skin types.
A limitation of the proposed approach could be the absence of statistically modeled data that takes real data measured from patients, where the interactions between features can be unveiled. For example, it can be argued that the correlations between fat and muscle layer thicknesses should be taken into account when comparing the effects different BMIs. To minimize the uncertainties in this matter, the emphasis was placed on the delivered muscle dose, not the absorbed dose across the whole muscle layer, so that the influence of its thickness can be disregarded. However, more studies on the skin morphological consequences of BMI variability, particularly with respect to facial regions, would be useful to optimization of laser therapies.
4. Conclusion
The MC simulations revealed the trends for the dependence of laser fluence rate and dose delivered at the muscle on skin color and obesity. BMI had little impact on epidermal heat deposition. Both BMI and phototype had significant impact on muscle dose. However, fat thickness it is more important than phototype for muscle dose calculation. For a laser wavelength of 808 nm, muscle dose values decreased over across to cm fat thicknesses and considering phototype I, while they decreased less than across phototypes I to IV, for median fat/muscle thickness. Similar variations are obtained at 660 nm, but for this less penetrating red light, the treatment time (for an efficacious dose of ) can be 4 to 5 times longer, rendering the treatment less practical for extra-oral treatments.
The predictive model is much faster than Monte Carlo and allows the selection of laser parameters, based on patient-specific morphological and physiological characteristics, to ensure therapeutic effectiveness at the target muscle tissue, while preventing unwanted biological responses at superficial layers. Once the fluence rate maps have been simulated and used to train the predictive model, at a reference total dose value delivered at cheek skin surface (), they can be used to adjust the treatment time for patient specific parameters and other laser powers within the safe limits, since the target mean delivered dose at the muscle is proportional to the initial simulated value. This is useful for planning the dosimetry in function of the type of desired PBM response, whether it is healing or pain related.
In the future, the simulation results will be experimentally tested, having in mind the validation of the laser dosimetry planning tool.
Author Contributions
A.C.: conceptualization, methodology, visualization, investigation, writing—original draft preparation; L.M: conceptualization, investigation, writing—review and editing; P.F.: project administration, funding acquisition, visualization, writing—review and editing; E.F.: conceptualization, methodology, investigation, software, writing—original draft preparation, supervision.
Funding
The authors are very grateful for the support granted by the Research Unit of Fiber Materials and Environmental Technologies (FibEnTech-UBI), through the Project reference UIDB/00195/2020, funded by the Fundação para a Ciência e a Tecnologia, IP/MCTES through national funds (PIDDAC), and DOI: 10.54499/UIDB/00195/2020.
Institutional Review Board Statement
Not applicable.
Informed Consent Statement
Not applicable.
Data Availability Statement
Data will be made available on request.
Conflicts of Interest
The authors declare no conflicts of interest.
References
- Farshidfar, N.; Farzinnia, G.; Samiraninezhad, N.; Assar, S.; Firoozi, P.; Rezazadeh, F.; Hakimiha, N. The Effect of Photobiomodulation on Temporomandibular Pain and Functions in Patients With Temporomandibular Disorders: An Updated Systematic Review of the Current Randomized Controlled Trials: Photobiomodulation in temporomandibular disorders. Journal of Lasers in Medical Sciences 2023, 14, e24. [Google Scholar] [CrossRef] [PubMed]
- Cronshaw, M.; Parker, S.; Anagnostaki, E.; Mylona, V.; Lynch, E.; Grootveld, M. Photobiomodulation and oral mucositis: a systematic review. Dentistry journal 2020, 8, 87. [Google Scholar] [CrossRef] [PubMed]
- Glass, G.E. Photobiomodulation: the clinical applications of low-level light therapy. Aesthetic surgery journal 2021, 41, 723–738. [Google Scholar] [CrossRef] [PubMed]
- Dompe, C.; Moncrieff, L.; Matys, J.; Grzech-Leśniak, K.; Kocherova, I.; Bryja, A.; Bruska, M.; Dominiak, M.; Mozdziak, P.; Skiba, T.H.I.; others. Photobiomodulation—underlying mechanism and clinical applications. Journal of clinical medicine 2020, 9, 1724. [Google Scholar] [CrossRef]
- Treister, N.S.; London, W.B.; Guo, D.; Malsch, M.; Verrill, K.; Brewer, J.; Margossian, S.; Duncan, C. A feasibility study evaluating extraoral photobiomodulation therapy for prevention of mucositis in pediatric hematopoietic cell transplantation. Photomedicine and laser surgery 2016, 34, 178–184. [Google Scholar] [CrossRef] [PubMed]
- Fitzpatrick, T.B. The validity and practicality of sun-reactive skin types I through VI. Archives of dermatology 1988, 124, 869–871. [Google Scholar] [CrossRef]
- Jeong, K.M.; Seo, J.Y.; Kim, A.; Kim, Y.C.; Baek, Y.S.; Oh, C.H.; Jeon, J. Ultrasonographic analysis of facial skin thickness in relation to age, site, sex, and body mass index. Skin Research and Technology 2023, 29, e13426. [Google Scholar] [CrossRef] [PubMed]
- Liao, Y.H.; Chen, S.Y.; Chou, S.Y.; Wang, P.H.; Tsai, M.R.; Sun, C.K. Determination of chronological aging parameters in epidermal keratinocytes by in vivo harmonic generation microscopy. Biomedical Optics Express 2012, 4, 77–88. [Google Scholar] [CrossRef] [PubMed]
- Kobayashi, R.; Haga, S.; Umehara, A.; Takakaze, M.; Akatsuka, K.; Nakano, H. Quantitative and qualitative evaluation of the masseter muscle by ultrasonography and correlation with whole body health status. Journal of Physical Therapy Science 2024, 36, 136–141. [Google Scholar] [CrossRef] [PubMed]
- Ajmal. ; Boonya-Ananta, T.; Rodriguez, A.J.; Le, V.N.D.; Ramella-Roman, J.C. Monte Carlo analysis of optical heart rate sensors in commercial wearables: the effect of skin tone and obesity on the photoplethysmography (PPG) signal. Biomed. Opt. Express 2021, 12, 7445–7457. [Google Scholar] [CrossRef]
- Souza-Barros, L.; Dhaidan, G.; Maunula, M.; Solomon, V.; Gabison, S.; Lilge, L.; Nussbaum, E.L. Skin color and tissue thickness effects on transmittance, reflectance, and skin temperature when using 635 and 808 nm lasers in low intensity therapeutics. Lasers in Surgery and Medicine 2018, 50, 291–301. [Google Scholar] [CrossRef]
- Yaroslavsky, A.N.; Juliano, A.F.; Adnan, A.; Selting, W.J.; Iorizzo, T.W.; Carroll, J.D.; Sonis, S.T.; Duncan, C.N.; London, W.B.; Treister, N.S. Validation of a monte carlo modelling based dosimetry of extraoral photobiomodulation. Diagnostics 2021, 11, 1–10. [Google Scholar] [CrossRef]
- Huang, Y.Y.; Chen, A.C.H.; Carroll, J.D.; Hamblin, M.R. Biphasic dose response in low level light therapy. Dose-response 2009, 7, dose. [Google Scholar] [CrossRef]
- ANSI Z136.1—2007. American National Standard for Safe Use of Lasers; Laser Institute of America, 2007.
- Weersink, R.; White, R.; Lilge, L. Light dosimetry for low-level laser therapy: accounting for differences in tissue and depth. Mechanisms for Low-Light Therapy II. SPIE, 2007, Vol. 6428, pp. 23–30.
- Yaroslavsky, A.N.; Iorizzo, T.W.; Juliano, A.F.; Adnan, A.; Carroll, J.D.; Sonis, S.T.; Duncan, C.N.; London, W.B.; Treister, N.S. Monte Carlo based dosimetry of extraoral photobiomodulation for prevention of oral mucositis. Scientific Reports 2023, 13, 20425. [Google Scholar] [CrossRef]
- Jacques, S.L. Optical properties of biological tissues: A review. Physics in Medicine and Biology 2013, 58. [Google Scholar] [CrossRef]
- Fitzpatrick, T.B. The Validity and Practicality of Sun-Reactive Skin Types I Through VI. Archives of Dermatology 1988, 124, 869–871. [Google Scholar] [CrossRef]
- Colas, V.; Blondel, W.; Khairallah, G.; Daul, C.; Amouroux, M. Proposal for a skin layer-wise decomposition model of spatially-resolved diffuse reflectance spectra based on maximum depth photon distributions: a numerical study. Photonics. MDPI, 2021, Vol. 8, p. 444.
- Karsten, A.E.; Smit, J.E. Modeling and verification of melanin concentration on human skin type. Photochemistry and photobiology 2012, 88, 469–474. [Google Scholar] [CrossRef]
- Boonya-Ananta, T.; Rodriguez, A.J.; Du Le, V.; Ramella-Roman, J.C.; others. Monte Carlo analysis of optical heart rate sensors in commercial wearables: the effect of skin tone and obesity on the photoplethysmography (PPG) signal. Biomedical optics express 2021, 12, 7445–7457. [Google Scholar]
- Saager, R.B.; Balu, M.; Crosignani, V.; Sharif, A.; Durkin, A.J.; Kelly, K.M.; Tromberg, B.J. In vivo measurements of cutaneous melanin across spatial scales: using multiphoton microscopy and spatial frequency domain spectroscopy. Journal of biomedical optics 2015, 20, 066005–066005. [Google Scholar] [CrossRef]
- Salomatina, E.; Jiang, B.; Novak, J.; Yaroslavsky, A.N. Optical properties of normal and cancerous human skin in the visible and near-infrared spectral range. Journal of biomedical optics 2006, 11, 064026–064026. [Google Scholar] [CrossRef]
- Simpson, C.R.; Kohl, M.; Essenpreis, M.; Cope, M. Near-infrared optical properties of ex vivo human skin and subcutaneous tissues measured using the Monte Carlo inversion technique. Physics in Medicine & Biology 1998, 43, 2465. [Google Scholar]
- Bashkatov, A.N.; Genina, E.A.; Tuchin, V.V. Optical properties of skin, subcutaneous, and muscle tissues: a review. Journal of Innovative Optical Health Sciences 2011, 4, 9–38. [Google Scholar] [CrossRef]
- Jacques, S.; Li, T.; Prahl, S. mcxyz. c, a 3D Monte Carlo simulation of heterogeneous tissues. omlc. org/software/mc/mcxyz.
- Marti, D.; Aasbjerg, R.N.; Andersen, P.E.; Hansen, A.K. MCmatlab: an open-source, user-friendly, MATLAB-integrated three-dimensional Monte Carlo light transport solver with heat diffusion and tissue damage. Journal of Biomedical Optics 2018, 23, 1. [Google Scholar] [CrossRef]
- Pedregosa, F.; Varoquaux, G.; Gramfort, A.; Michel, V.; Thirion, B.; Grisel, O.; Blondel, M.; Prettenhofer, P.; Weiss, R.; Dubourg, V.; Vanderplas, J.; Passos, A.; Cournapeau, D.; Brucher, M.; Perrot, M.; Duchesnay, E. Scikit-learn: Machine Learning in Python. Journal of Machine Learning Research 2011, 12, 2825–2830. [Google Scholar]
- de França, A.; Borges, A.G.; Daitx, R.B.; Ferrer, R.M.; Dohnert, M.B.; Durigan, J.L.Q. Photobiomodulation in Temporomandibular Dysfunction: a Systematic Review. Muscles, ligaments and tendons journal 2021, 11, 463. [Google Scholar] [CrossRef]
Figure 1.
Absorption coefficient spectra of main chromophores considered in the tissue model.
Figure 1.
Absorption coefficient spectra of main chromophores considered in the tissue model.
Figure 2.
Absorption coefficient spectra of the epidermis (phototypes I to VI), dermis, subcutaneous fat, and muscle.
Figure 2.
Absorption coefficient spectra of the epidermis (phototypes I to VI), dermis, subcutaneous fat, and muscle.
Figure 3.
Illustration of the geometry model of four-layer tissue structure representing a cheek cross-section.
Figure 3.
Illustration of the geometry model of four-layer tissue structure representing a cheek cross-section.
Figure 4.
Monte Carlo simulation results of fluence rate () and absorbed energy () density distribution of wavelength 808 nm in a cheek tissue section with model parameters: , cm, and cm.
Figure 4.
Monte Carlo simulation results of fluence rate () and absorbed energy () density distribution of wavelength 808 nm in a cheek tissue section with model parameters: , cm, and cm.
Figure 9.
Comparison of predicted and true fluence at epidermis and muscle layers, for a wavelength of 660 nm, and as functions of fat layer thickness. A J delivered dose is assumed. A muscle thickness of cm is selected.
Figure 9.
Comparison of predicted and true fluence at epidermis and muscle layers, for a wavelength of 660 nm, and as functions of fat layer thickness. A J delivered dose is assumed. A muscle thickness of cm is selected.
Figure 10.
Comparison of predicted and true fluence at epidermis and muscle layers, for a wavelength of 808 nm, and as functions of fat layer thickness. A J delivered dose is assumed. A muscle thickness of cm is selected.
Figure 10.
Comparison of predicted and true fluence at epidermis and muscle layers, for a wavelength of 808 nm, and as functions of fat layer thickness. A J delivered dose is assumed. A muscle thickness of cm is selected.
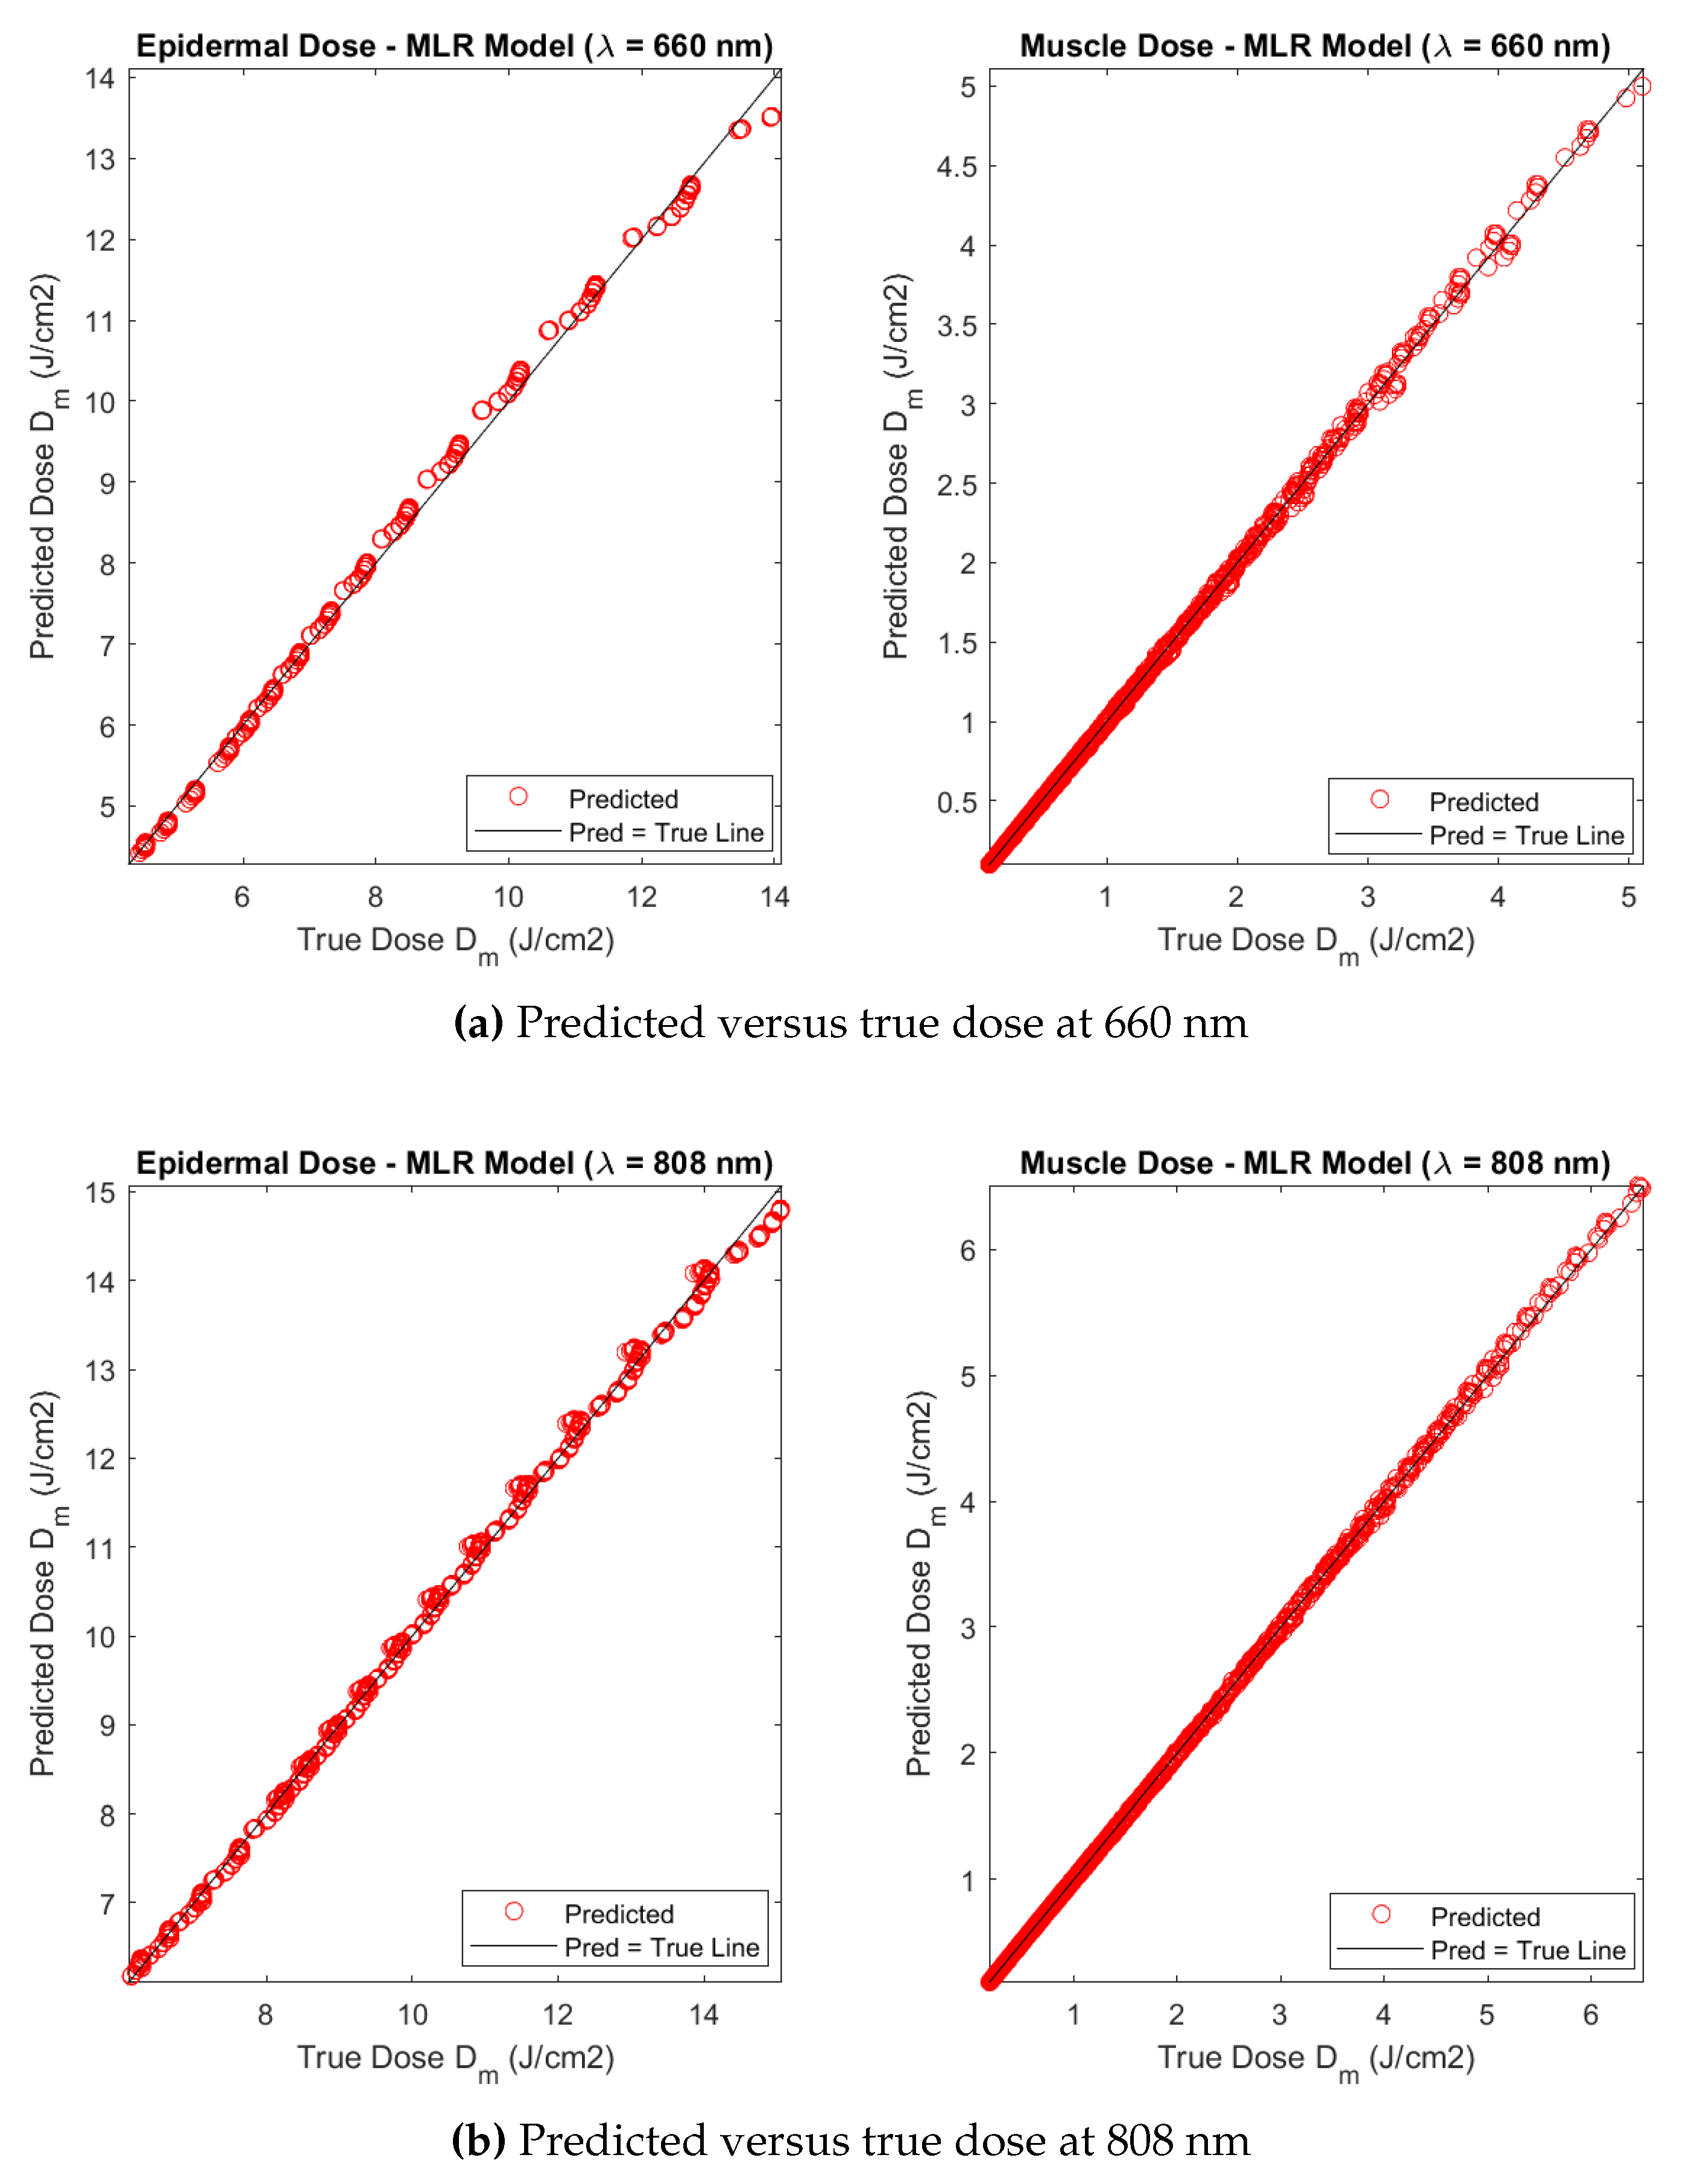
Figure 11.
Predicted versus the actual simulated fluences, as functions of fat layer thickness, at epidermis and muscle layers, for (a) a wavelength of 660 nm, and (b) a wavelength of 808 nm. A J delivered total dose is assumed. A muscle thickness of cm is selected.
Figure 11.
Predicted versus the actual simulated fluences, as functions of fat layer thickness, at epidermis and muscle layers, for (a) a wavelength of 660 nm, and (b) a wavelength of 808 nm. A J delivered total dose is assumed. A muscle thickness of cm is selected.
Figure 12.
The effect of variable fat layer thickness and skin color on: (a,b) - predicted average muscle dose (), and (c, d)- treatment time (min), at fat/muscle interface, for wavelengths 660 nm and 808 nm, respectively. A muscle thickness of cm and reference total delivered dose at skin surface, , are assumed.
Table 1.
Tissue layer structure and optical absorption defining chromophore composition.
Table 1.
Tissue layer structure and optical absorption defining chromophore composition.
| Layer |
|
|
|
W |
F |
M |
| Epidermis |
0.1 |
0 |
0 |
0.60 |
0.15 |
0.01-0.20 |
| Dermis |
1.0 |
2.87 |
1.83 |
0.60 |
0.17 |
0 |
| Fat |
0-12 |
0 |
0 |
0.05 |
0.75 |
0 |
| Muscle |
2-8 |
0.50 |
0.50 |
0.70 |
0 |
0 |
Table 2.
Tissue layer structure and other optical parameters: scattering coefficient, anisotropy and refractive index.
Table 2.
Tissue layer structure and other optical parameters: scattering coefficient, anisotropy and refractive index.
| Layer |
|
b |
g |
n |
| Epidermis |
68.7 |
1.161 |
|
1.4 |
| Dermis |
45.3 |
1.292 |
|
1.4 |
| Fat |
18.4 |
0.672 |
|
1.34 |
| Muscle |
11.6 |
1.045 |
|
1.4 |
Table 3.
Epidermis absorption coefficients at wavelengths 660 nm and 808 nm using median melanosome fractions (M) for each Fitzpatrick skin type.
Table 3.
Epidermis absorption coefficients at wavelengths 660 nm and 808 nm using median melanosome fractions (M) for each Fitzpatrick skin type.
| Phototype |
M |
|
|
| I |
0.05 |
13.1 |
6.5 |
| II |
0.06 |
15.7 |
7.8 |
| III |
0.07 |
18.3 |
9.1 |
| IV |
0.09 |
23.6 |
11.7 |
| V |
0.11 |
28.8 |
14.3 |
| VI |
0.15 |
39.3 |
19.4 |
Table 4.
Summary of results for predicting delivered doses to epidermal and muscle layers, at each wavelength, using the MLPM described herein.
Table 4.
Summary of results for predicting delivered doses to epidermal and muscle layers, at each wavelength, using the MLPM described herein.
Response
Variable |
|
|
| Val. |
Test |
Val. |
Test |
| Epidermis |
0.0075 |
0.0072 |
0.0032 |
0.0032 |
| Muscle |
0.0059 |
0.0059 |
0.0032 |
0.0028 |
Table 5.
Muscle doses at laser wavelengths 660 nm and 808 nm for reference delivered 6 J dose at skin surface, using six levels of Fitzpatrick skin type. Adjusted treatment time for delivering a dose of to the muscle.
Table 5.
Muscle doses at laser wavelengths 660 nm and 808 nm for reference delivered 6 J dose at skin surface, using six levels of Fitzpatrick skin type. Adjusted treatment time for delivering a dose of to the muscle.
| Phot. |
M |
|
|
|
|
| I |
0.05 |
1.39 |
14.4 |
1.98 |
3.4 |
| II |
0.06 |
1.30 |
15.4 |
1.91 |
3.5 |
| III |
0.07 |
1.22 |
16.4 |
1.84 |
3.6 |
| IV |
0.09 |
1.08 |
18.5 |
1.71 |
3.9 |
| V |
0.11 |
0.97 |
20.6 |
1.60 |
4.1 |
| VI |
0.15 |
0.81 |
24.8 |
1.42 |
4.7 |
|
Disclaimer/Publisher’s Note: The statements, opinions and data contained in all publications are solely those of the individual author(s) and contributor(s) and not of MDPI and/or the editor(s). MDPI and/or the editor(s) disclaim responsibility for any injury to people or property resulting from any ideas, methods, instructions or products referred to in the content. |
© 2024 by the authors. Licensee MDPI, Basel, Switzerland. This article is an open access article distributed under the terms and conditions of the Creative Commons Attribution (CC BY) license (http://creativecommons.org/licenses/by/4.0/).

