
Submitted:
13 September 2024
Posted:
16 September 2024
You are already at the latest version
Abstract
The development of fetal organs can be impacted by systemic changes in the mother's circulation, and the placenta is essential for pregnancy homeostasis and feeding. In clinical obstetrics, oxytocin (OXT) is used to induce labor. To further explore the placental homeostasis of OXT, we compared OXT levels in neonatal cord blood among newborns whose mothers either received OXT prenatally or underwent natural labor. Our previous study revealed that the oxytocin receptor (OXTR), a vital component of the neural retina that forms the blood-retina barrier, is expressed in the retinal pigment epithelium (RPE). We hypothesized that.
the formation of the neural retina and vessels within it may be impacted by perinatal OXT injection, which suggests that it may be used as a therapeutic intervention for developing eye illnesses such as retinopathy of prematurity (ROP). We first studied the amounts of OXT in neonatal cord blood. To investigate this subcellular activity, we administered OXT to mature RPE cells. With the aid of network analysis, our results suggest that perinatal administration of OXT may affect the growth of the neural retina and its corresponding retinal vessels, making it a potential therapeutic intervention for developmental eye diseases such as retinopathy of prematurity (ROP).
Keywords:
Preterm
; retinal vascularization
; retinopathy
; transcriptomic
; connectivity
; OXT
1. Introduction
The placenta is a temporary fetal organ that attaches to the uterine lining during pregnancy. It delivers oxygen and nutrients to the developing fetus. Disruptions in placental homeostasis can have significant implications for maternal and fetal health, highlighting the vital role of the placenta in a healthy pregnancy. Oxytocin (OXT) is a neuropeptide produced by the hypothalamus that is subsequently released into the bloodstream by the anterior pituitary gland. OXT is well known for its role in uterine contractions during labor in addition to milk letdown during lactation. Importantly, however, OXT is a multifaceted regulator that maintains the placental microenvironment and optimizes placental function throughout pregnancy and promotes fetal development. Given the key role of oxytocin in several placental functions, it is necessary to determine whether OXT crosses the placenta during gestation [1]. Malek et al. first noted the ability of OXT to cross the human placenta nearly 30 years ago. They determined that OXT crosses the placenta in both directions by simple diffusion, but the maternal-to-fetal direction was favored in their study [2]. However, it remains unclear whether the fetus solely produces endogenous OXT [3]. Understanding the sources of OXT during pregnancy is important because it is not only a signal for parturition but also impacts overall fetal growth and development, [4]. vascular proliferation, and organogenesis [5]. Notably, there is controversy surrounding the ability of OXT to cross the placenta and transfer to the fetus. Our study investigated the ability of OXT to cross the placenta and transfer to the fetus throughout gestation. Hence, we believe that our study may also reconcile the available literature regarding OXT’s ability to cross the placenta.
There is a reasonable correlation between human eye development and the morphological stages of fetal development throughout gestation [6].. OXT has been detected in both human fetuses and animal fetuses as early as 16 weeks of gestation and coincides with the retinal and retinal vessel formation that occurs during eye development. [6]. The sharp increase in OXT levels, which occurs in the last trimester of pregnancy, is synonymous with rapid retinal development and vascular growth. This relationship suggests that OXT may play a role in regulating retinal and retinal angiogenesis [1]. Development of the retina begins at 28 days of gestation, and the retina is completely vascularized by 40 weeks of gestation [2]. In preterm infants, abnormal development and vascularization of the retina can occur, leading to retinopathy of prematurity (ROP), a significant cause of blindness in this population. ROP is a disease caused by a combination of factors, including the cessation of normal retinal vascular growth and the suppression of growth-promoting factors following premature birth. Smith et al. proposed that deficiencies in developmental hormones and vascular growth factors may contribute to retinopathy pathogenesis [7]. Therefore, understanding the molecular action of OXT may provide a biomarker for retinal disorders or provide treatment options to prevent ROP.
In 1983, Gauquelin et al. first identified OXT in the human retina [7]. Despite these landmark findings, the literature rarely describes the role of OXT in healthy neural retinal development [5]. The retinal pigmented epithelium (RPE) is a vital component of the neural retina and is affected primarily by ROP. The RPE is a monolayer of polarized pigmented epithelial cells interposed between the neural retina and chorio-capillaries. It performs many vital functions to support the neural retina in maintaining normal and healthy vision, [8,9]. such as forming a blood‒retinal barrier, absorbing stray light, transporting nutrients and metabolites, performing retinoid recycling, and phagocytosing shed outer segments of photoreceptors (PRs). Although the RPE performs essential functions in healthy vision and OXT also regulates many other critical physiological processes, including neurophysiology (and much like the maternal–fetal barrier), it is unknown whether OXT crosses the blood‒retina barrier, altering physiology during health and disease. Another key yet unresolved aspect of the complex role of OXT in both fetuses and the potential role of OXT in retinal development has yet to be identified.
We previously identified oxytocin receptor (OXTR) mRNA and protein in the RPE of human retinas and rhesus monkey retinas and cultured human fetal RPE (HfRPE) cells [10]. Additionally, we detected OXT in the rhesus monkey retina. These findings suggest that OXT plays a crucial role in the signaling mechanisms responsible for regulating vascular growth in the retina. We believe that it may also have the potential to control the abnormal retinal vascular growth often observed in ROP. Thus, our current study has two main hypotheses. The first is that maternal OXT crosses the placenta and affects OXT concentrations within the fetal circulation. Second, systemic OXT within fetal circulation affects the RPE transcriptome in cultured HfRPE cells, indicating its potential role in retinal development and visual function regulation.
2. Methods:
2.1. Patient Recruitment
The clinical portion of this study was designed as a prospective cohort study. Preterm and term neonates were recruited from our birthing center, UnityPoint Health (UPH) Meriter Hospital, a Level III NICU in Madison, Wisconsin. The UPH Meriter Hospital Institutional Review Board approved the study. Neonates born at gestational ages ranging from 23-42 weeks via cesarean section or vaginal delivery were included. Neonates were excluded from the study if they were born at an outside hospital, had an umbilical cord anomaly, or had insufficient cord blood volume. The following information was obtained from each study participant: gestational age, sex, birth weight, presence of maternal illness, synthetic OXT administration to augment labor, intrapartum steroid administration, and need for oxygen during delivery resuscitation. No formal consent process was required to recruit participants, and all the data were stored, managed, and analyzed by researchers.
2.2. Oxytocin Extraction
Our group conducted a pilot study (unpublished), which determined that OXT plasma levels begin to decrease 5 days after delivery. Blood samples for OXT assays were collected at the time of birth from mixed umbilical artery and vein samples, placed into a prechilled 1.0 ml purple top ethylenediaminetetraacetic acid (EDTA) microcontainer tube and refrigerated for up to four days. The samples were subsequently centrifuged at 1000 × g for 15 minutes at 4°C to obtain plasma, which was subsequently stored in aliquots at -80°C. OXT immunoreactivity levels were quantified in duplicate via a commercial OXT ELISA kit (Enzo Life Sciences, Inc., Farmingdale, NY), as noted in a similar study [11]. Assayed OXT samples had 15.0 pg/ml sensitivity and inter- and intra-assay coefficients of variation less than 20.9% in this study.
Notably, high-quality plasma OXT extraction is difficult and often results in a significant loss of measurable OXT [12,13].. A commercially available OXT ELISA kit from Enzo Life, validated for cross-reactivity, accuracy, precision, and recovery, was used in this study. Given the labile nature of this critical gestational hormone, we followed a strict protocol (Thermo Fisher Scientific, 2007) to limit the rapid enzymatic breakdown of OXT.
Sample extraction was evaluated via two different methods: solid-phase extraction and solvent extraction. Solid-phase extraction was performed using 200 mg C18 Sep-Pak columns (Bachem, San Carlos, CA). The columns were equilibrated with 3 ml of acetonitrile and then with 3 ml of 0.1% trifluoroacetic acid (TFA) twice. Up to 1 ml of plasma was mixed with an equal volume of 0.1% TFA, the mixture was centrifuged at 17,000 × g for 20 minutes at 4°C, and then the acidified supernatant (plasma) was added to the column. OXT was eluted with 3 ml of 60% acetonitrile. The solvent was evaporated to dryness via a speed vacuum centrifugal concentrator.
Solvent extraction involved preparing samples with ELISA reagents and extrapolating the data on a microplate reader. Fetal OXT concentrations were recorded and plotted against a 4-parameter logistic (4PL) regression curve. All the measurements were performed to improve accuracy. We analyzed the data via MyAssays Analysis Software Solutions and Inkscape (version 0.92.3).
2.3. Data Analysis
We performed a quantitative analysis of the samples via a 4PL curve. All samples were compared to a set of known standard quantities to determine the amount of OXT in each sample. This data comparison generated a predicted standard curve and produced an ideal data curve. Once the standard curve was generated, the location of the sample was determined by the fit curve, and values were interpolated. Notably, a quadratic equation was used to fit the model data and produce a sigmoidal curve.
2.4. Statistical Analysis
Maternal and neonatal characteristics were summarized using medians and interquartile ranges (IQRs; range between the 25th and 75th percentiles) for continuous characteristics or with frequencies and percentages for categorical factors. Comparisons between groups (preterm neonates versus term neonates) were made via nonparametric rank-sum tests, chi-square tests of associations, or Fisher’s exact tests in instances where the expected frequency was less than five. Multiple linear regression was used to address whether the cord blood concentration of OXT was associated with one or more maternal or infant characteristics. Statistical significance was prespecified to 0.05, and no adjustment for multiple testing was made in this exploratory research.
Additionally, the cord blood concentration was log-transformed before analysis to improve symmetry. The means calculated for log-transformed data represent geometric means upon back transformation and serve as an estimator of the median response on the original scale. At the same time, differences between means on the log scale become multiplicative effects (i.e., fold changes) involving the estimated medians after back-transformation to original units [14].
2.5. Human Fetal RPE Cell Cultures
We obtained approval from the institutional review board at the University of Wisconsin–Madison to use commercial human fetal cell lines. Passage 2 cryopreserved primary Clonetics human RPE cells (HfRPE) (LONZA, Walkersville, WA, USA) were cultured in 75-cm2 flasks in an admixture of HfRPE culture media (MEM alpha base medium [Gibco, Grand Island, NY, USA]), N1 supplement, glutamine (Gibco), pen-strep (Gibco), MEM nonessential amino acids, taurine, hydrocortisone, and 3,3′,5-triiodothryonin + 10% fetal bovine serum (FBS) (Gibco) for 48 hours. At 70% confluence, the cells were exposed to 1X EDTA-trypsin (LONZA) for 4 minutes at 37°C in 5% CO2. The cells were then collected in HfRPE culture media supplemented with 8% FBS. The cells were subsequently seeded at a density of approximately 1 × 10⁴ cells/cm2 onto 24-well culture plates. Finally, the cells were cultured in HfRPE media + 8% FBS until they reached 95% confluence. At this point, the cells were maintained in HfRPE media + 0% FBS, and the media was changed every 2 days. Human fetal RPE cells cultured in plates for 4 to 5 weeks were treated with or without 10 μM OXT (Sigma‒Aldrich, St. Louis, MO) for 12 hours, and this experiment was repeated four times. The treated RPE cells were further assayed for gene expression.
2.6. RNA Sequencing and Data Analysis
RNA was extracted from cultured RPE cells via a RNeasy Mini Kit (Qiagen, Hilden, Germany) and treated with DNase according to the manufacturer’s instructions. The concentration of RNA was measured via a NanoDrop spectrophotometer (Thermo Fisher Scientific, Waltham, MA), and the integrity of the RNA was assessed via an Agilent 2100 Bioanalyzer (Agilent Technologies, Santa Clara, California). RNA sequencing was performed at the Gene Expression Center of the Biotechnology Center at the University of Wisconsin–Madison. The transcriptome libraries were sequenced on an Illumina HiSeq2500 platform in 1x100 base-pair mode. The sequence data were analyzed via the Bioinformatics Resource Center at the University of Wisconsin–Madison with the RNAseq pipeline v1.0. In this RNA-seq pipeline v1.0, the trimming software skewer removed adapters in the base call raw reads [15]. Genes with zero or low-abundance counts were filtered [16]. Low-abundance genes were defined as those with an average read count below a threshold of 1.0 in two or more samples. The sequence read counts for the experimental samples were normalized to the trimmed mean of the M values (TMM) [17]. The trimmed sequence reads were aligned against the hsapiens_gene_ensembl human genes’ (GRCh38.p10) reference genome sequence via STAR (Spliced Transcripts Alignment to a reference) [18]. Aligned and mapped reads for genes and transcripts were counted in each sample via RSEM (RNA-seq by expectation maximization) [19]. Analysis of differentially expressed genes (DEGs) was performed with GLM via the edger package [20]. The change in gene expression between the two groups was reported on a base 2-logarithmic scale of fold change: log2-fold change (FC). A gene was defined as differentially expressed when the adjusted p-value, false discovery rate (FDR), was ≤ 0.05, the FC between the treatment and control groups was ≥1.5, or the log2 (FC) was ≥ 0.585. Benjamini‒Hochberg correction was applied to control the FDR [21]. We identified 14 downregulated and 32 upregulated genes based on these thresholds.
Real-time PCR was carried out to validate the RNA transcriptomics findings. Some of the genes that were found to be upregulated, downregulated, and involved in cholesterol biosynthesis were validated independently via specific primer pairs via real-time PCR (Supplementary Tables S1-3). For this purpose, HfRPE cells were seeded in a 24-well plate and cultured for 4 to 5 weeks as mentioned earlier. Mature HfRPE cells were treated with various concentrations of OXT (0.01, 0.1, 1, or 10 µM) for 12 hours. Treated RPE cells were collected, and RNA was isolated via an RNeasy Plus Mini Kit (Qiagen). For gene expression analysis, RNA was converted to cDNA via a high-capacity cDNA reverse transcription kit (Applied Biosystems), and real-time PCR was performed via SYBR green PCR master mix on a QuantStudio 3 (Applied Biosystems). The GAPDH gene was used as an endogenous control in the relative quantification (∆∆Ct) method. The average Ct values of each target gene were normalized to the respective average Ct values of GAPDH to obtain the ∆Ct value (∆Ct = average Ct of the target gene - average Ct of GAPDH). The ∆∆Ct value was calculated as ∆Ct treated- ∆Ct untreated, and the fold change was calculated via the 2-∆∆Ct method. The untreated cells were used as a reference. The experiment was repeated three times. Student’s t test (paired two-tailed) was used to compare two groups, and ANOVA was used to compare multiple groups. The significance threshold (p value) was set at 0.05 and 0.001.
2.7. Functional Analysis of Differentially Expressed Genes
Gene Ontology (GO) term and pathway enrichment analyses were conducted for the DEGs via the g:Profiler platform [22]. GO covers three domains: molecular function, biological process, and cellular component. The Kyoto Encyclopedia of Genes and Genomes (KEGG) database was used for pathway enrichment analysis. FDR controlled by the Benjamini‒Hochberg procedure was used in multiple-testing correction enrichment analyses. An FDR ≤ 0.05 was considered to indicate significant enrichment. In addition, DEGs satisfying the FDR (≤ 0.05) and Log2FC (>1 or >-1) thresholds were subjected to enrichment analysis via the functional enrichment analysis tool (FunRich 3.1.3.exe) (http://funrich.org/index.html). The list of genes was uploaded as two different datasets (upregulated and downregulated) for functional enrichment and compared under six categories: clinical phenotype, cellular component, molecular function, biological process, biological pathway, and site of expression.
A network analysis was performed via the Cytoscape (version 3) plug-in GeneMANIA, a web interface for analyzing gene or protein lists and predicting gene function based on datasets collected from publicly available databases. These datasets include coexpression and colocalization data from the Gene Expression Omnibus (GEO), physical interaction data from BioGRID, predicated protein interaction data from Orthology I2D, and a consolidated protein interaction database (IRefIndex) [23]. In analyzing a long (five or more) query list of genes or proteins, GeneMANIA is likely to identify more genes or proteins similar to those noted in the list above, in addition to identifying physical or predicated physical interactions between proteins, coexpression, and networks of interactions among query genes or proteins [23]. We used the default GeneMANIA parameters and removed additional similar genes identified by GeneMANIA to find a network among the DEGs identified in our RNAseq analysis.
3. Results:
3.1. Study characteristics
The in vivo portion of our study included 74 infants, 54 (73%) of whom delivered at term, and Figure 1 depicts the study design. The average gestational age was 39 weeks, and the average birth weight was 3.4 kg. Figure 2 shows the results of the recruitment process. One hundred twenty neonatal samples (Table 1) were collected over 10 months; ten had missing data. We used samples that had complete information for OXT extraction. However, 36 samples did not yield an OXT measurement. As noted previously, because OXT is a volatile substance, obtaining high-quality measurable extracts has generally proven difficult for researchers. A total of 74 samples had measurable OXT extracted. Compared with term deliveries, preterm births were associated with more frequent labor, high blood pressure (HBP)/pre-eclampsia, diabetes, and maternal steroid use. There were no cases of chorioamnionitis. Placental abruptions or 5-minute Apgar scores less than 5 were rare. OXT was administered to mothers in 45% of the preterm deliveries and 30% of the term deliveries (p = 0.214). We did not find any associations between cord blood concentrations of OXT and gestational age (Figure 2, left panel) or birth weight (Figure 2, right panel; rs = −0.17, p = 0.16). There was also no correlation between cord blood OXT concentration and preterm versus term infants (p = 0.106; Table 1).
3.2. Maternal Oxytocin Administration Crosses the Placenta
Among preterm infants, maternal exposure to OXT before delivery resulted in a median cord blood OXT concentration 3.9 times greater (95% CI: 2.0–7.7, p<0.001) than that of infants whose mothers did not receive OXT. A similar effect was observed in full-term infants, with a median fold change of 2.8 (95% CI: 1.7–4.4, p<0.001). These effects, however, are not significantly different (p=0.42) and suggest that a modest increase in fetal OXT levels is associated with maternal OXT administration (Figure 3). After controlling for gestational age, the median cord blood OXT concentration among infants whose mothers received OXT was 3.1 times greater (95% CI: 2.1--4.5, p<0.001) than that among infants whose mothers did not receive OXT (186.2 pg/mL vs. 60.58 pg/mL).
3.3. Maternal Labor Affects Fetal OXT Concentrations
As shown in Figure 3, maternal OXT administration during labor resulted in significantly higher median cord blood OXT concentrations than did OXT administration alone (p<0.001). However, labor alone had no significant effect (p=0.108) on OXT concentrations. When both labor and maternal OXT administration were considered, the median cord blood OXT concentration was 2.53 times greater (95% CI: 1.68--3.81) than when only labor was present and 3.50 times greater (95% CI: 2.30--5.31) than that in the groups without labor and OXT administration (Figure 3, p < 0.001).
3.4. Identification of Key Pathway-Associated Genes by GO and KEGG Term Enrichment
From a molecular standpoint, RNA sequencing revealed a total of 14975 genes (unfiltered data), including upregulated (n=301), downregulated (n=123), and nonsignificant (n=14551) genes, in OXT-treated RPE cells compared with those in control cells. The data were filtered out on the basis of the Log2FC (<0.585) and FDR (≤ 0.05) thresholds, and 109 DEGs were subcategorized into upregulated (n=78) and downregulated genes (n=30). (Figure 4, Supplementary Tables S1 and S2). GO and KEGG term enrichment analyses were performed to understand the biological mechanisms of these DEGs in treated RPE cells. In the analysis of the upregulated DEGs, the enriched KEGG terms included metabolic pathways (KEGG:01100), steroid biosynthesis (KEGG:00100), terpenoid backbone biosynthesis (KEGG:00900), the PI3K-Akt signaling pathway (KEGG:04151), the calcium signaling pathway (KEGG:04020), the cAMP signaling pathway (KEGG:04024), the regulation of the actin cytoskeleton (KEGG:04810), the PPAR signaling pathway (KEGG03320), the ECM-receptor interaction (KEGG:04512), focal adhesion (KEGG:04510), and the phagosome (KEGG:04145) (Figure 5; supplementary Table S3). The enriched GO terms for the upregulated DEGs included membrane (GO:0016020), extracellular matrix (GO:0031012), focal adhesion (GO:0005925), cytoskeleton (GO:0005856), protein binding (GO:0005515), ion binding (GO:0043167), signaling receptor binding (GO:0005102), catalytic activity (GO:0003824), calcium ion binding (GO:0005509), extracellular matrix binding (GO:0050840), low-density lipoprotein particle receptor activity (GO:0005041), metabolic process (GO:0008152), signal transduction (GO:0007165), cholesterol biosynthetic process (GO:0006695), cellular component organization or biogenesis (GO:0017840), and cell adhesion (GO:0007155) (Figure 5; supplementary Tables S4, S5, and S6). The enriched KEGG terms of the downregulated DEGs included prostate cancer (KEGG:05215), EGFR tyrosine kinase inhibitor resistance (KEGG:01521), and the MAPK signaling pathway (KEGG:04010) (Supplementary Figure 1; Supplementary Table S7). The enriched GO terms for the downregulated DEGs included regulation of epithelial cell proliferation (GO:0050678) and cell migration (GO:0016477) (Supplementary Figure 1; supplementary tables S8, S9, and S10).
FunRich analysis of 14 downregulated and 32 upregulated genes (FDR: ≤ 0.05, Log2FC: >1 or >-1) revealed an enrichment analysis of the top 15 characteristics across the 6 categories (Figure 5). In the clinical phenotypes category, the most upregulated genes were associated with conjunctivitis, cataracts, corneal abrasions and scarring, eyelid ulcerations, and neoplasia. On the other hand, downregulated genes were found to be involved in microphthalmia, anophthalmia, postnatal growth retardation, and cardiovascular and neurological diseases. Some up- (33%) and downregulated genes (50%) were involved in common phenotypes related to hair, eyes, and growth. The upregulated genes in the mitochondrion, Golgi apparatus, integral-to-membrane, cytoskeleton, and cytoplasmic vesicle categories were enriched, whereas the downregulated genes in the endosome, extracellular matrix (ECM), and endoplasmic reticulum categories were enriched. A percentage of the up- and downregulated genes were also observed in the plasma membrane, nucleus, cytoplasm, exosomes, lysosomes, extracellular space, and nucleolus. Among the upregulated genes, genes related to molecular activity included chaperons, transaminases, transcription regulators, growth factors, G-protein coupled receptors, auxiliary transport proteins, and receptor signaling. Ion channels, transcription factors, ECM constitution, transporters, and catalytic activity were observed solely in the downregulated genes. Some molecular functions, such as calcium ion binding and metallopeptidase activity, were common among the up- and downregulated genes. Unlike downregulated genes, upregulated genes are involved in biological processes such as the regulation of exocytosis, hormone secretion, anti-apoptosis, and the immune response. However, genes in both the up- and downregulated categories belonged to biological processes such as metabolism, cell communication, signal transduction, energy pathways, cell growth and maintenance, regulation of nucleic acid metabolism, and transport. The upregulated genes were associated with biological pathways such as granulocyte–macrophage colony–stimulating factor (GMCSF)-mediated signaling, vascular endothelial growth factor (VEFG) signaling, signal transduction, integrin–cell surface interactions, peptide ligand-binding receptors, the immune system, transmission across synapses and G-protein coupled receptor (GPCR) signaling. Downregulated genes were associated with pathways such as smooth muscle contraction, transmembrane transport of small molecules, biological oxidations, multifunctional anion exchangers, and axon guidance. Both sets of genes were associated with metabolism and developmental pathways. The expression sites of the up- and downregulated genes included the kidney, plasma, skeletal muscles, brain, skin, heart, tears, dendritic cells, lacrimal glands, and embryonic stem cells. Unlike those of the downregulated genes, the expression sites of the upregulated genes included the cornea, eyes, macrophage lens, and blood vessels.
3.5. Protein Function Network Identified by the Cytoscape plug-in GeneMANIA
We further analyzed interactions among 14 downregulated and 32 upregulated genes (FDR: ≤ 0.05, Log2FC: >1 or >-1) (Supplementary Table S11) via the Cytoscape (version 3) plug-in GeneMANIA. This analysis identified these interactions and constructed an interaction network among genes from our query list and the genes predicted by GeneMANIA (Figure 6). We removed interactions among our list of genes with predicted genes to strengthen the network among our 46 genes of interest. The genes in our query lists were in a network based on various interactions, including coexpression, colocalization, and physical and predicted interactions. The resulting network revealed that coexpression accounted for 80.07%, physical interactions accounted for 9.51%, and colocalization accounted for 7.92% of the total network weights. Moreover, 2.49% of the interactions were predicted. Thus, coexpression was among the most common interactions shown in Figure 6.
Complex networking was observed among the up- and downregulated genes. A cluster of colocalization was formed between SLC14A1 and SMCO1, PDGFB and TGM2 and among PTPRB, ESM1, TMEM100, HBEGF, ITGA2, and MALL. The genes with physical interactions in our query list included IL7R and MALL, ITGA2 and MMP1, ANKRD1, ESM1, TRIM55, and DAPL1. A predicted interaction was observed between only ITGA2 and MMP1. A few genes (CLEC18C, CACNA1E, COL21A1, ARL2-SNX15, C11orf88, and NLRP10) did not interact with other genes in our query list. The remaining genes from our query list were found to be in complex networks based on their co-expression (Figure 6).
3.6. OXT Treatment of HfRPE Cells Induces Dynamic Modifications in the Expression Profile of Genes
whose expression is upregulated or downregulated, as identified via RNA sequencing, and the expression profiles of genes involved in cholesterol biosynthesis and metabolism pathways were further validated via real-time PCR. We selected 4 downregulated genes, 7 upregulated genes, and 13 genes that were previously reported to be involved in cholesterol biosynthesis (PMID: 35275950) to study their expression profiles in OXT-treated HfRPE cells. Our findings confirmed the significant downregulation of two genes (RNVU1-7, p<0.05 and FMO1, p<0.01) in 1, 0.1 and 0.01µM OXT-treated HfRPE cells, whereas two of the genes remained undetected (ANPEP and SLC14A1) in these cells (Figure 7A). These data support and align with the findings of RNA sequencing. In contrast to our RNA sequencing findings, only the MMP1 gene (p<0.05) was significantly upregulated, whereas two genes (XIRP1 and KISS1) were downregulated (p<0.05). A few of the genes (ESM1, IL7R, and CLEC18C) that were found to be upregulated by RNA sequencing were not detected by real-time PCR (Figure 7B). The GABBR2 gene presented different expression profiles in response to multiple doses of OXT. Significant downregulation (p<0.05) was observed with a higher dose (1 µM), whereas upregulation (p<0.05) was observed with lower doses (0.1 and 0.01 µM) of OXT (Figure 7B) (Supplementary Table S4).
We selected a list of genes involved in cholesterol biosynthesis and metabolism to study their OXT-induced expression modulation in HfRPE cells. We observed that, with the exception of two genes (CYP46A1 and LDLR), the expression of most of these genes was significantly altered with almost all the doses of OXT. Significant downregulation (p<0.05 or p<0.01) of almost all the genes (SRBII, ABCA1, ABCA4, RPE65, HMGCR, SREBP1, SREBP2, CYP11A1, and CYP27A1) was observed, whereas APOE was not detected in our treated or untreated HfRPE cells (Figure 7C) (Supplementary Table S4).
4. Discussion
This translational study revealed that OXT likely crosses the placenta and affects fetal OXT concentrations. Specifically, maternal exposure to OXT resulted in infant cord blood OXT levels 2–4 times higher than those in infants whose mothers were not exposed to synthetic OXT. These findings were statistically significant and strongly associated with the presence or absence of labor. Importantly, RNA sequencing revealed that 46 genes were differentially expressed in OXT-treated RPE cells. These up- and downregulated genes were related to vital metabolic and signaling pathways and critical cellular components.
Additionally, a complex cluster of co-expressed and predicted interaction networks was identified based on our query list of DEGs and the list of genes predicted by GeneMANIA, indicating that OXT also influences the RPE transcriptome. Many colocalizations occurred among the proteins of these genes as well. Our clinical and scientific findings suggest that OXT crosses the placenta and may have the ability to increase fetal OXT concentrations in addition to regulating retinal and retinal vascular growth. These findings suggest that OXT may be a potential early therapeutic intervention for ROP.
Notably, RPE cells undergo terminal differentiation early in development. However, they remain dormant and have little or no cell turnover throughout normal life [24,25]. Thus, maintaining structural, metabolic, and functional homeostasis among RPE cells is vital for decoding visual signals. In the present study, we revealed that OXT-regulated, transcribed genes function in metabolic pathways, cholesterol biosynthetic processes, phagosomes, focal adhesions, actin cytoskeleton regulation, PPAR signaling pathways, PI3K‒Akt signaling pathways, extracellular matrices, and ECM‒receptor interactions. These regulated pathways involve multiple cellular functions, including cell-membrane phagocytosis, cell survival and protection, and structural integrity of the ECM in RPE cells.
In this study, multiple GO and KEGG terms related to cholesterol biosynthesis were used to analyze the DEGs upregulated by OXT. Cholesterol is an essential constituent of the cell membrane. It regulates various cellular processes, including membrane trafficking, ligand binding, receptor recycling, and signal transduction [26,27]. The maintenance of cholesterol homeostasis is necessary for normal cell function and viability. These GO and KEGG terms included metabolic pathways, steroid biosynthesis, terpenoid backbone biosynthesis, metabolic processes, and cholesterol biosynthetic processes. Further analysis of those genes via the GeneMANIA network revealed a close cluster of genes involved in cholesterol biosynthetic pathways and regulation. Among this cluster of genes, eight are cholesterol biosynthetic enzymes: one is a receptor for the endocytosis of cholesterol, and the other is a transcription factor that suppresses cholesterol biosynthetic enzymes [26,27,28,29,30,31]. Our quantitative validation of the genes implicated in the synthesis, uptake, elimination, and regulation of cholesterol levels revealed significant downregulation. Most importantly, HMGCR, a rate-limiting enzyme of cholesterol biosynthesis, and CYP27A1, which helps eliminate cholesterol from the retina, were downregulated at the mRNA level. Thus, our data suggest that OXT affects cholesterol biosynthesis and homeostasis in RPE cells by modulating the transcript expression of various genes. When cholesterol homeostasis in the RPE is impaired, vision is affected by macular degeneration [32]. Zheng et al. demonstrated the presence of HMGCR in human and murine RPE cells via immunohistochemical analyses [33,34]. Ramachandra et al. studied the human induced pluripotent stem cell (iPSC)-derived RPE and reported active cholesterol biosynthesis [35]. Biswas et al. found cholesterol in an immortalized human RPE-derived cell line (ARPE-19) via the use of radiolabeled acetate [36].
We found that genes whose expression was upregulated by OXT treatment were involved in phagocytosis. These genes included those involved in focal adhesion, regulation of the actin cytoskeleton, phagosome formation, and calcium signaling. To understand the relevance of these findings, we reviewed the essential and functional components of the human retina. When photoreceptors are exposed to light, damaged proteins and lipids generate photooxidative radicals [37,38]. These toxic substances accumulate in the photoreceptor each day [37,38]. To maintain normal function, photoreceptors constantly remove these substances when their outer segments are renewed [37,38]. In this renewal process, a new portion of the photoreceptor outer segment (POS) is built, and the POS tip containing a high concentration of toxic substances is shed from every photoreceptor [37,38]. A critical role of the RPE is phagocytosis of the shed POS to maintain the structural and functional homeostasis of the photoreceptor [8,37]. Phagocytosis of the POS by the RPE is a sequence of events that includes binding of the POS to the RPE, ingestion of bound POS, maturation of the phagosome, enzymatic breakdown of macromolecules, and resolution of the RPE phagolysosome [8,37]. The αvβ5 integrin receptors are involved in the binding of POSs to the RPE [8,37,39,40] After binding, focal adhesion kinase (FAK) is activated, phosphorylating receptor tyrosine kinase c-mer (MerTK) and initiating subsequent events [8,37,39,40]. These events include the activation of intracellular inositol 1,4,5-trisphosphate (InsP3)/Ca2+ and the rearrangement of F-actin, which leads to the ingestion of bound POS [37,41,42,43].
Calcium signaling mediates phagosome maturation, which requires the fusion of phagosomes with endosomes and lysosomes [41]. FAK is the key kinase in focal adhesion. It mediates the POS ingestion process via the regulation and rearrangement of actin [37,39,44]. Phagosomes (or cellular compartments) are needed to remove toxic radicals and macromolecules from POSs [37,45]. Furthermore, RPE phagocytosis has circadian rhythms [46]. Calcium signaling mediates phagosome maturation and may be the driving force for POS-shedding rhythms [46]. Interestingly, OXT was found to regulate Tetrahymena phagocytosis [47].
This study revealed multiple enriched pathway terms with a protective function in the RPE from OXT-upregulated DEGs. These terms included the PI3K-Akt signaling pathway, the PPAR signaling pathway, and the cAMP signaling pathway. Previous studies have demonstrated that the PI3K-Akt and PPAR signaling pathways each mediate the protective actions of various factors and pharmacological inhibitors of oxidative stress in RPE cells, ultimately promoting cell survival [48,49,50,51,52]. Notably, RPE cells undergo constant oxidative stress from multiple sources.53-55 The RPE is located close to the choriocapillaris and receives high rates of blood flow that are well saturated with oxygen [53,54]. Long-term light exposure increases the interaction of light with endogenous chromophores in the RPE, causing excitation that results in a highly reactive state.53,54 Highly reactive chromophores rapidly interact with other molecules, including oxygen, generating reactive oxygen species (ROS) [53,54] Furthermore, a robust amount of metabolic activity occurs in the mitochondria of the RPE to meet its high-energy needs, which also generates a high concentration of ROS.53,54 These various sources of oxidative stress can elicit harmful effects on biomolecules and the RPE53-55 mitochondrial network. Thus, it is essential to protect the RPE from oxidative damage to preserve its integrity and function. In addition, mature human RPE cells undergo minimal proliferation and have a limited proliferative response to injury. Pathologic processes generally accompany marked proliferation in the human RPE [24,25] For this reason, controlling the proliferation of RPE cells is essential. Hecquet et al. reported that the cAMP signaling pathway inhibits RPE proliferation via the mitogen-activated protein kinase pathway [56]. Furthermore, the cAMP signaling pathway also plays a role in transducing the protective function of klotho, an aging-suppressor gene, in RPE cells [57].
Our study enriched GO and KEGG terms related to the extracellular matrix (ECM) from the upregulated genes. These terms included ECM-receptor interaction, extracellular matrix, and extracellular matrix binding. One of the critical functions of the RPE is transporting nutrients and metabolic waste products from photoreceptors across Bruch’s membrane (BrM). BrM houses RPE cells and is located between the RPE and choriocapillaris [8,9] Thus, maintaining both a stable interaction between the RPE and BrM and a stable or appropriate composition within BrM is essential [8,9,58]. Otherwise, alterations in these properties can lead to ocular pathogenesis [9,58] RPE cells produce ECM components within BrM and express the receptors that bind to the ECM [59]. Sugino et al. demonstrated that cell-deposited matrices promote the survival of the RPE on specimens of aged human BrM [60]. Several aspects of this fundamental study demonstrate that OXT may modulate BrM and the RPE and, in turn, the RPE-regulated interaction between BrM and the RPE.
Among those downregulated genes, the enriched terms included prostate cancer, EGFR tyrosine kinase inhibitor resistance, and the MAPK signaling pathway. Activating pathways included in these terms can lead to cellular proliferation, migration, and invasion. The MAPK signaling pathway is an essential pathway that mediates the proliferation of the RPE [56]. Downregulation of this pathway may have a protective effect on RPE cells [24,25]. OXT treatment activates, suppresses, or modulates various pathways that perform diverse functions. The findings from this study, similar to those of previous studies, indicate that OXT-regulated pathways mediate essential RPE functions, including cholesterol biosynthesis and homeostasis, phagocytosis, RPE protection, and Bruch’s membrane integrity (Figure 8).
For the clinical purpose of our study, we investigated whether OXT is transferred across the placenta. Our study included 74 near-term infants. Compared with term deliveries, preterm births were associated with more frequent episodes of spontaneous labor, high blood pressure (HBP)/preeclampsia, diabetes, and antenatal-steroid use. No significant associations were found between cord-blood OXT concentrations and gestational age or birth weight. However, the administration of OXT during labor resulted in significantly higher median cord blood OXT concentrations than did the absence of exogenous OXT. This finding suggests that OXT crosses the placenta and equilibrates between the mother and fetus. When both labor and OXT were present, the median cord blood OXT concentration was 2.53–3.50 times higher than when only one or none were present. Hence, it is likely that the administration of synthetic OXT during labor increases fetal OXT levels, regardless of gestational age. The presence of labor also showed a positive association with increased fetal OXT concentrations. This translational study represents a critical step in understanding the role of OXT in human gestation.
This aspect of our study is unprecedented: monitoring the transfer of OXT across the maternal–fetal barrier in vivo. Previous studies have shown that OXT crosses the placenta in in vitro models. Malek et al. investigated the transport of OXT and inulin in both directions across human placental tissues in vitro. He reported similar transfer rates across each placental circuit and concluded that OXT likely crosses the placenta via simple diffusion, with the permeability of both compounds being greater in the maternal-to-fetal direction than in the fetal-to-maternal transport direction [2].. Our results demonstrated that fetal OXT concentrations were significantly greater among mothers who received OXT before delivery. This finding strongly implies that OXT crosses the maternal–fetal barrier during human gestation.
Preterm and term neonates whose mothers underwent labor and received OXT before delivery had significantly higher OXT concentrations than those whose mothers did not undergo or receive OXT before delivery. This statistical significance was especially true among the preterm group, highlighting that many preterm neonates are likely born due to maternal preterm labor [61]. Furthermore, our findings imply that maternal OXT concentrations not only increase in the presence of labor or at birth but also likely cross the maternal–fetal barrier and contribute to surges in fetal plasma OXT levels. Additional findings included associations between preterm delivery and maternal illness. The frequency of deliveries involving diabetes and HBP/preeclampsia among preterm births was greater than that among term deliveries when maternal and infant birth characteristics were reviewed. Preterm births were also associated with the administration of antenatal steroids and the need for oxygen or advanced respiratory support during resuscitation.
The clinical arm of our study is the first to monitor OXT transfer across the maternal–fetal barrier in vivo and at several time points throughout human gestation (23–42 weeks). Research using in vitro models has shown that OXT can cross the placenta via simple diffusion [2]. Our study, which was conducted on the maternal–infant dyad in ‘real-time’, is consistent with these models and demonstrated significantly higher fetal OXT concentrations among mothers who received OXT before delivery (especially in the presence of labor). This is a significant strength of our study, and these findings strongly support the theory that maternal OXT not only crosses the placenta but also contributes to surges in fetal OXT levels.
Additionally, we aimed to achieve accurate and effective OXT extraction via an advanced protocol. While prior studies have only measured OXT via an in situ approach (to conserve blood volume), we successfully extracted OXT from whole blood volumes as small as 50 microliters [62,63]. This novel technique uses organic solvents and HPLC columns (solid-phase extraction) to increase the ability of ELISA kits to detect and extract highly volatile molecules such as OXT from their natural biological matrix (plasma).
Our study had several limitations. A primary factor is the considerable variation in fetal OXT concentrations. Although our findings strongly suggest that OXT crosses the placenta, our novel extraction protocol in this pilot study was likely subject to procedural error and varying concentrations. A more efficient protocol is needed for future studies to ensure that optimal OXT extraction occurs. Another study limitation was the small and unequal sample size between term and preterm infants. Our statistical methods of log transformation helped improve the symmetry between the 2 cohorts and allowed for improved statistical power. However, our study was not initially powered with equal control arms or an ideal number of study participants to identify the transplacental effects of OXT. We also recognize that RNA-seq-based approaches are accepted in the scientific community; technological improvements are seen to overcome some gene expression analysis shortfalls and do not account for the contributions of noncoding sequences.
This translational study, however, shows promise for further investigation of OXT as a gestational hormone essential for the normal development of the retina. As OXT likely transfers from mother to fetus, it is possible that OXT concentrations continually increase throughout human gestation while the retina matures, surging just before birth and in the presence of labor. If this effect is valid, OXT could affect certain vascular growth factors that are expressed during the pathologic and vasoproliferative stages of ROP. Future studies will need larger cohorts with infants at varying gestational ages to assess the specific trajectory of OXT among the maternal-infant dyad throughout human gestation. It may also be worthwhile to examine whether delivery methods play a role in transferring OXT across the maternal-fetal barrier.
5. Conclusion
Given our understanding of the significant role of OXT in extrauterine bonding between mothers and babies as well as its importance in parturition, our study offers compelling evidence that placental homeostasis of OXT may be vital to fetal development. The intricate mechanism underlying the regulation of OXT in the placenta supports the hypothesis that OXT is involved in fetal organogenesis, particularly in the retina. While focusing on the effect of OXT, specifically in cultured RPE cells, we determined that genes responsible for cellular proliferation, migration, and invasion were inhibited. The activated genes belong to the class that protects RPE cell survival and function. Thus, the transfer of placental OXT to the fetal circulation promotes cell survival and function during prenatal development. This research opens new avenues for exploring the physiological and pathological implications of OXT for placental function. These findings also identify potential therapeutic targets for disorders associated with placental dysfunction. Further investigations are warranted to elucidate the precise molecular pathways involved in the placental homeostasis of OXT and its implications for maternal and fetal well-being.
Supplementary Materials
The following supporting information can be downloaded at the website of this paper posted on Preprints.org.
Author Contributions
BRP, DMP, and COA created the concept and design. WL, NWY, COA, MK, and RIW conducted the experiments and analyses. BRP supervised all aspects of the study and acquired funding. All authors are responsible for the data analysis and interpretation, drafting of the manuscript, and revisions and edits.
Acknowledgments
Thank you to the patients and families of UnityPoint Health Meriter. This research was supported by the UnityPoint-Meriter Foundation, M.D. Matthews Professorship of Retina Research Foundation, University of Wisconsin School of Medicine and Public Health, and the University of Wisconsin-Madison Department of Pediatrics. We thank Michael Lasarev for assisting with the statistical analyses of the clinical data.
References
- Prevost, M. et al. Oxytocin in pregnancy and the postpartum: relations to labor and its management. Front Public Health 2, 1 (2014). [CrossRef]
- Malek, A., Blann, E. & Mattison, D. R. Human placental transport of oxytocin. J Matern Fetal Med 5, 245-255 (1996). [CrossRef]
- Schubert, F., George, J. M. & Bhaskar Rao, M. Vasopressin and oxytocin content of human fetal brain at different stages of gestation. Brain Research 213, 111-117 (1981). [CrossRef]
- Weiss, G. Endocrinology of parturition. J Clin Endocrinol Metab 85, 4421-4425 (2000). [CrossRef]
- Gimpl, G. & Fahrenholz, F. The oxytocin receptor system: structure, function, and regulation. Physiol Rev 81, 629-683 (2001). [CrossRef]
- O’Rahilly, R. The prenatal development of the human eye. Exp Eye Res 21, 93-112 (1975). [CrossRef]
- Gauquelin, G. et al. Presence of vasopressin, oxytocin and neurophysin in the retina of mammals, effect of light and darkness, comparison with the neuropeptide content of the neurohypophysis and the pineal gland. Peptides 4, 509-515 (1983). [CrossRef]
- Strauss, O. The retinal pigment epithelium in visual function. Physiol Rev 85, 845-881 (2005). [CrossRef]
- Sparrow, J. R., Hicks, D. & Hamel, C. P. The retinal pigment epithelium in health and disease. Curr Mol Med 10, 802-823 (2010). [CrossRef]
- Halbach, P. et al. Oxytocin expression and function in the posterior retina: a novel signaling pathway. Invest Ophthalmol Vis Sci 56, 751-760 (2015). [CrossRef]
- Zhong, S. et al. U-shaped relation between plasma oxytocin levels and behavior in the trust game. PLoS One 7, e51095 (2012). [CrossRef]
- Szeto, A. et al. Evaluation of enzyme immunoassay and radioimmunoassay methods for the measurement of plasma oxytocin. Psychosom Med 73, 393-400 (2011). [CrossRef]
- Leng, G. & Sabatier, N. Measuring Oxytocin and Vasopressin: Bioassays, Immunoassays and Random Numbers. J Neuroendocrinol 28 (2016). [CrossRef]
- Aitkin, M., Francis, B. & J., H. Statistical Modeling in GLIM4. 123-124 (2005).
- Jiang, H., Lei, R., Ding, S. W. & Zhu, S. Skewer: a fast and accurate adapter trimmer for next-generation sequencing paired-end reads. BMC Bioinformatics 15, 182 (2014). [CrossRef]
- Bourgon, R., Gentleman, R. & Huber, W. Independent filtering increases detection power for high-throughput experiments. Proc Natl Acad Sci U S A 107, 9546-9551 (2010). [CrossRef]
- Robinson, M. D. & Oshlack, A. A scaling normalization method for differential expression analysis of RNA-seq data. Genome Biol 11, R25 (2010). [CrossRef]
- Dobin, A. et al. STAR: ultrafast universal RNA-seq aligner. Bioinformatics 29, 15-21 (2013). [CrossRef]
- Li, B. & Dewey, C. N. RSEM: accurate transcript quantification from RNA-Seq data with or without a reference genome. BMC Bioinformatics 12, 323 (2011). [CrossRef]
- Robinson, M. D., McCarthy, D. J. & Smyth, G. K. edgeR: a Bioconductor package for differential expression analysis of digital gene expression data. Bioinformatics 26, 139-140 (2010). [CrossRef]
- Reiner, A., Yekutieli, D. & Benjamini, Y. Identifying differentially expressed genes using false discovery rate controlling procedures. Bioinformatics 19, 368-375 (2003). [CrossRef]
- Raudvere, U. et al. g:Profiler: a web server for functional enrichment analysis and conversions of gene lists (2019 update). Nucleic Acids Res 47, W191-W198 (2019). [CrossRef]
- Franz, M. et al. GeneMANIA update 2018. Nucleic Acids Res 46, W60-W64 (2018). [CrossRef]
- Fuhrmann, S., Zou, C. & Levine, E. M. Retinal pigment epithelium development, plasticity, and tissue homeostasis. Exp Eye Res 123, 141-150 (2014). [CrossRef]
- Stern, J. & Temple, S. Retinal pigment epithelial cell proliferation. Exp Biol Med (Maywood) 240, 1079-1086 (2015). [CrossRef]
- Ramachandra Rao, S. & Fliesler, S. J. Cholesterol homeostasis in the vertebrate retina: biology and pathobiology. J Lipid Res 62, 100057 (2021). [CrossRef]
- Pikuleva, I. A. & Curcio, C. A. Cholesterol in the retina: the best is yet to come. Prog Retin Eye Res 41, 64-89 (2014). [CrossRef]
- Goldstein, J. L. & Brown, M. S. Regulation of the mevalonate pathway. Nature 343, 425-430 (1990). [CrossRef]
- Yoshioka, H. et al. A key mammalian cholesterol synthesis enzyme, squalene monooxygenase, is allosterically stabilized by its substrate. Proc Natl Acad Sci U S A 117, 7150-7158 (2020). [CrossRef]
- Brown, M. S. & Goldstein, J. L. Receptor-mediated endocytosis: insights from the lipoprotein receptor system. Proc Natl Acad Sci U S A 76, 3330-3337 (1979). [CrossRef]
- Li, J., Takaishi, K., Cook, W., McCorkle, S. K. & Unger, R. H. Insig-1 “brakes” lipogenesis in adipocytes and inhibits differentiation of preadipocytes. Proc Natl Acad Sci U S A 100, 9476-9481 (2003). [CrossRef]
- Tsai, Y. T. et al. Impaired cholesterol efflux in retinal pigment epithelium of individuals with juvenile macular degeneration. Am J Hum Genet 108, 903-918 (2021). [CrossRef]
- Zheng, W. et al. Spatial distribution of the pathways of cholesterol homeostasis in human retina. PLoS One 7, e37926 (2012). [CrossRef]
- Zheng, W., Mast, N., Saadane, A. & Pikuleva, I. A. Pathways of cholesterol homeostasis in mouse retina responsive to dietary and pharmacologic treatments. J Lipid Res 56, 81-97 (2015). [CrossRef]
- Ramachandra Rao, S. et al. Compromised phagosome maturation underlies RPE pathology in cell culture and whole animal models of Smith-Lemli-Opitz Syndrome. Autophagy 14, 1796-1817 (2018). [CrossRef]
- Biswas, L., Zhou, X., Dhillon, B., Graham, A. & Shu, X. Retinal pigment epithelium cholesterol efflux mediated by the 18 kDa translocator protein, TSPO, a potential target for treating age-related macular degeneration. Hum Mol Genet 26, 4327-4339 (2017). [CrossRef]
- Kwon, W. & Freeman, S. A. Phagocytosis by the Retinal Pigment Epithelium: Recognition, Resolution, Recycling. Front Immunol 11, 604205 (2020). [CrossRef]
- Roehlecke, C. et al. Stress reaction in outer segments of photoreceptors after blue light irradiation. PLoS One 8, e71570 (2013). [CrossRef]
- Qin, S. & Rodrigues, G. A. Roles of alphavbeta5, FAK and MerTK in oxidative stress inhibition of RPE cell phagocytosis. Exp Eye Res 94, 63-70 (2012). [CrossRef]
- Finnemann, S. C. Focal adhesion kinase signaling promotes phagocytosis of integrin-bound photoreceptors. EMBO J 22, 4143-4154 (2003). [CrossRef]
- Nunes, P. & Demaurex, N. The role of calcium signaling in phagocytosis. J Leukoc Biol 88, 57-68 (2010). [CrossRef]
- Karl, M. O. et al. Endogenous Gas6 and Ca2+ -channel activation modulate phagocytosis by retinal pigment epithelium. Cell Signal 20, 1159-1168 (2008). [CrossRef]
- Müller, C., Charniga, C., Temple, S. & Finnemann, S. C. Quantified F-Actin Morphology Is Predictive of Phagocytic Capacity of Stem Cell-Derived Retinal Pigment Epithelium. Stem Cell Reports 10, 1075-1087 (2018). [CrossRef]
- Eleniste, P. P. & Bruzzaniti, A. Focal adhesion kinases in adhesion structures and disease. J Signal Transduct 2012, 296450 (2012). [CrossRef]
- Wavre-Shapton, S. T., Meschede, I. P., Seabra, M. C. & Futter, C. E. Phagosome maturation during endosome interaction revealed by partial rhodopsin processing in retinal pigment epithelium. J Cell Sci 127, 3852-3861 (2014). [CrossRef]
- Ikarashi, R. et al. Regulation of molecular clock oscillations and phagocytic activity via muscarinic Ca(2+) signaling in human retinal pigment epithelial cells. Sci Rep 7, 44175 (2017). [CrossRef]
- Kovacs, K., Kohidai, L., Pallinger, E. & Csaba, G. Effect of oxytocin and its analogs on the phagocytosis of Tetrahymena: outstanding impact of isotocin. Acta Protozoologica 41, 191-1 (2002).
- Wang, L., Chen, Y., Sternberg, P. & Cai, J. Essential roles of the PI3 kinase/Akt pathway in regulating Nrf2-dependent antioxidant functions in the RPE. Invest Ophthalmol Vis Sci 49, 1671-1678 (2008). [CrossRef]
- Yang, P., Peairs, J. J., Tano, R. & Jaffe, G. J. Oxidant-mediated Akt activation in human RPE cells. Invest Ophthalmol Vis Sci 47, 4598-4606 (2006). [CrossRef]
- Liao, R. et al. Insulin-like growth factor-1 activates PI3K/Akt signaling to protect human retinal pigment epithelial cells from amiodarone-induced oxidative injury. Br J Pharmacol 175, 125-139 (2018). [CrossRef]
- Sur, A. et al. Pharmacological protection of retinal pigmented epithelial cells by sulindac involves PPAR-alpha. Proc Natl Acad Sci U S A 111, 16754-16759 (2014). [CrossRef]
- Rodrigues, G. A. et al. Differential effects of PPARgamma ligands on oxidative stress-induced death of retinal pigmented epithelial cells. Invest Ophthalmol Vis Sci 52, 890-903 (2011). [CrossRef]
- Plafker, S. M., O’Mealey, G. B. & Szweda, L. I. Mechanisms for countering oxidative stress and damage in retinal pigment epithelium. Int Rev Cell Mol Biol 298, 135-177 (2012). [CrossRef]
- Bellezza, I. Oxidative Stress in Age-Related Macular Degeneration: Nrf2 as Therapeutic Target. Front Pharmacol 9, 1280 (2018). [CrossRef]
- Lu, L., Hackett, S. F., Mincey, A., Lai, H. & Campochiaro, P. A. Effects of different types of oxidative stress in RPE cells. J Cell Physiol 206, 119-125 (2006). [CrossRef]
- Hecquet, C., Lefevre, G., Valtink, M., Engelmann, K. & Mascarelli, F. cAMP inhibits the proliferation of retinal pigmented epithelial cells through the inhibition of ERK1/2 in a PKA-independent manner. Oncogene 21, 6101-6112 (2002). [CrossRef]
- Kokkinaki, M. et al. Klotho regulates retinal pigment epithelial functions and protects against oxidative stress. J Neurosci 33, 16346-16359 (2013). [CrossRef]
- Ardeljan, D. & Chan, C. C. Aging is not a disease: distinguishing age-related macular degeneration from aging. Prog Retin Eye Res 37, 68-89 (2013). [CrossRef]
- Aisenbrey, S. et al. Retinal pigment epithelial cells synthesize laminins, including laminin 5, and adhere to them through alpha3- and alpha6-containing integrins. Invest Ophthalmol Vis Sci 47, 5537-5544 (2006). [CrossRef]
- Sugino, I. K. et al. Cell-deposited matrix improves retinal pigment epithelium survival on aged submacular human Bruch’s membrane. Invest Ophthalmol Vis Sci 52, 1345-1358 (2011). [CrossRef]
- Romero, R., Dey, S. K. & Fisher, S. J. Preterm labor: one syndrome, many causes. Science 345, 760-765 (2014). [CrossRef]
- Weber, A., Harrison, T. M., Sinnott, L., Shoben, A. & Steward, D. Plasma and Urinary Oxytocin Trajectories in Extremely Premature Infants During NICU Hospitalization. Biol Res Nurs 19, 549-558 (2017). [CrossRef]
- Kuwabara, Y., Takeda, S., Mizuno, M. & Sakamoto, S. Oxytocin levels in maternal and fetal plasma, amniotic fluid, and neonatal plasma and urine. Arch Gynecol Obstet 241, 13-23 (1987). [CrossRef]
Figure 1.
Infant enrollment and recruitment for the study.
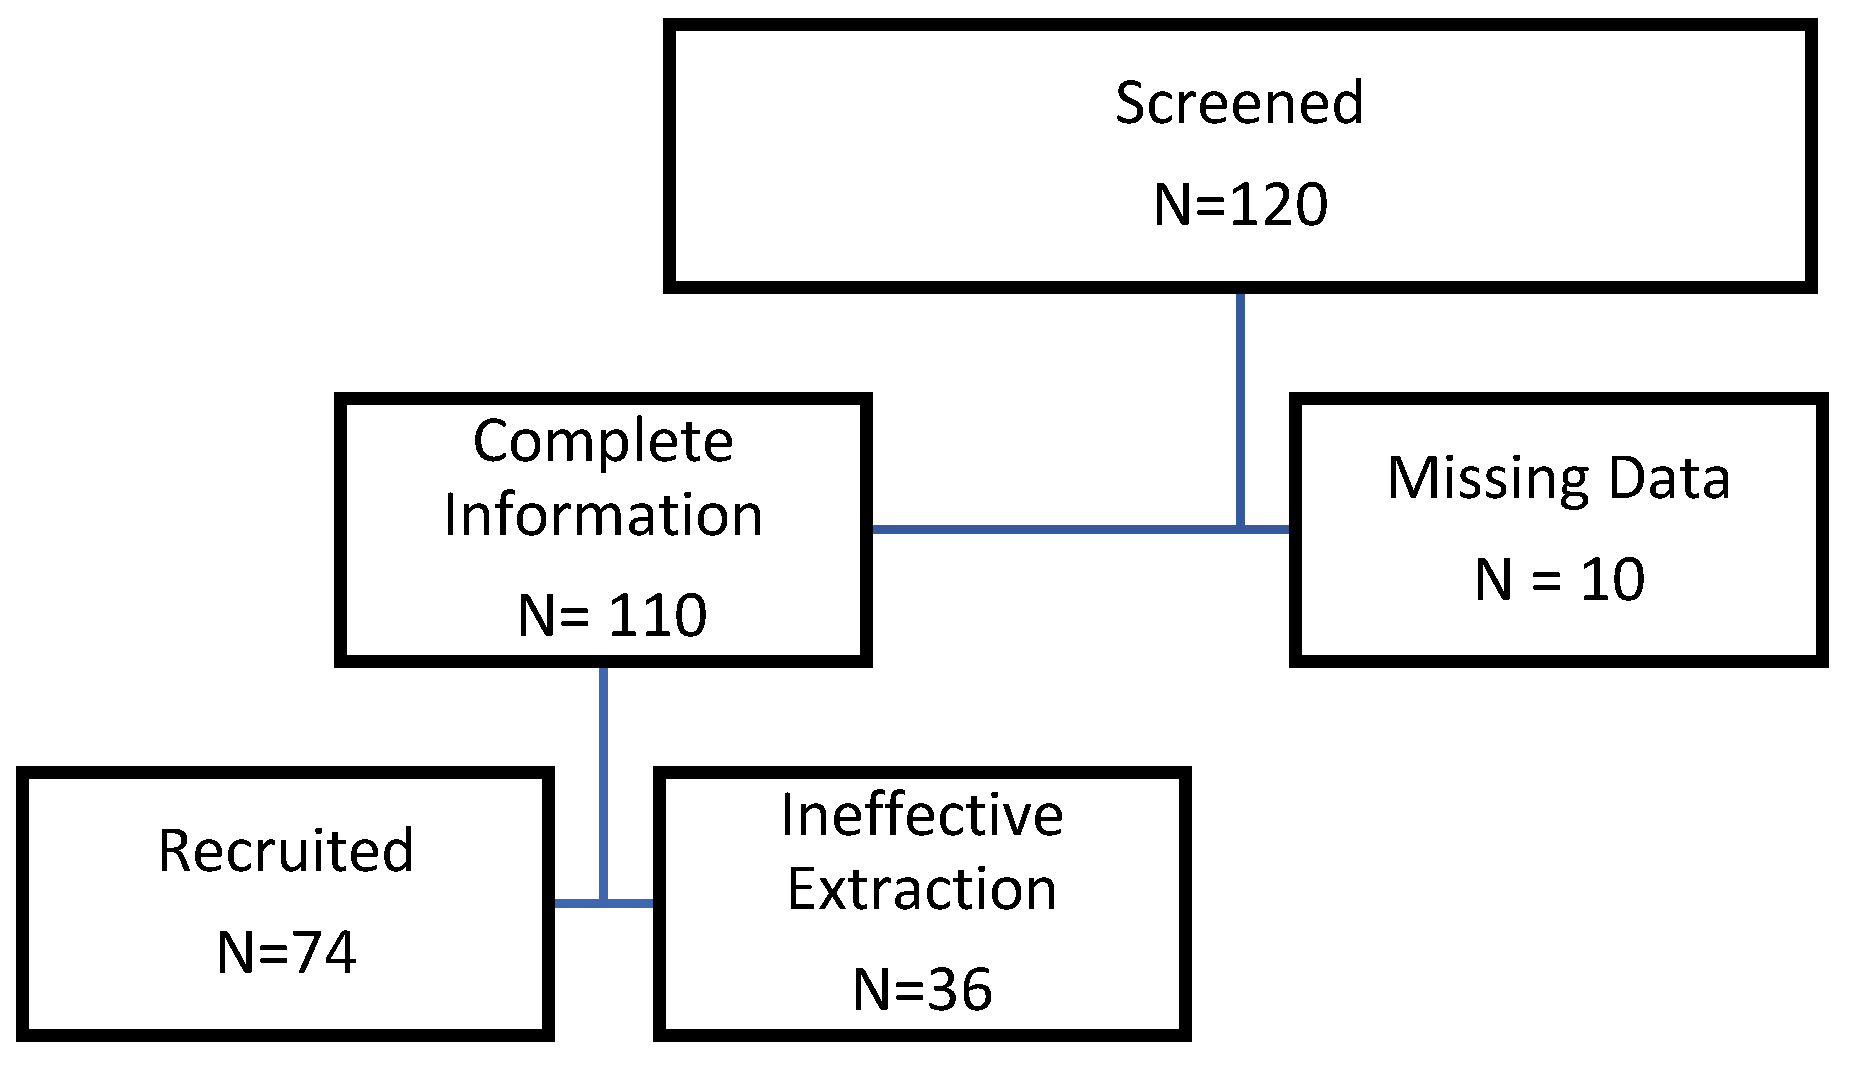
Figure 2.
Distribution of OXT concentration in the cord blood by gestational age and birth weight. The graphs are scatter plots of OXT concentrations vs. gestational age (left) and OXT concentration vs. birthweight (right). There was a predominance of term infants at 39 weeks with an average birth weight of 3.4 kg in our study. No association was found between cord blood concentration of OXT and either birth weight or gestational age.
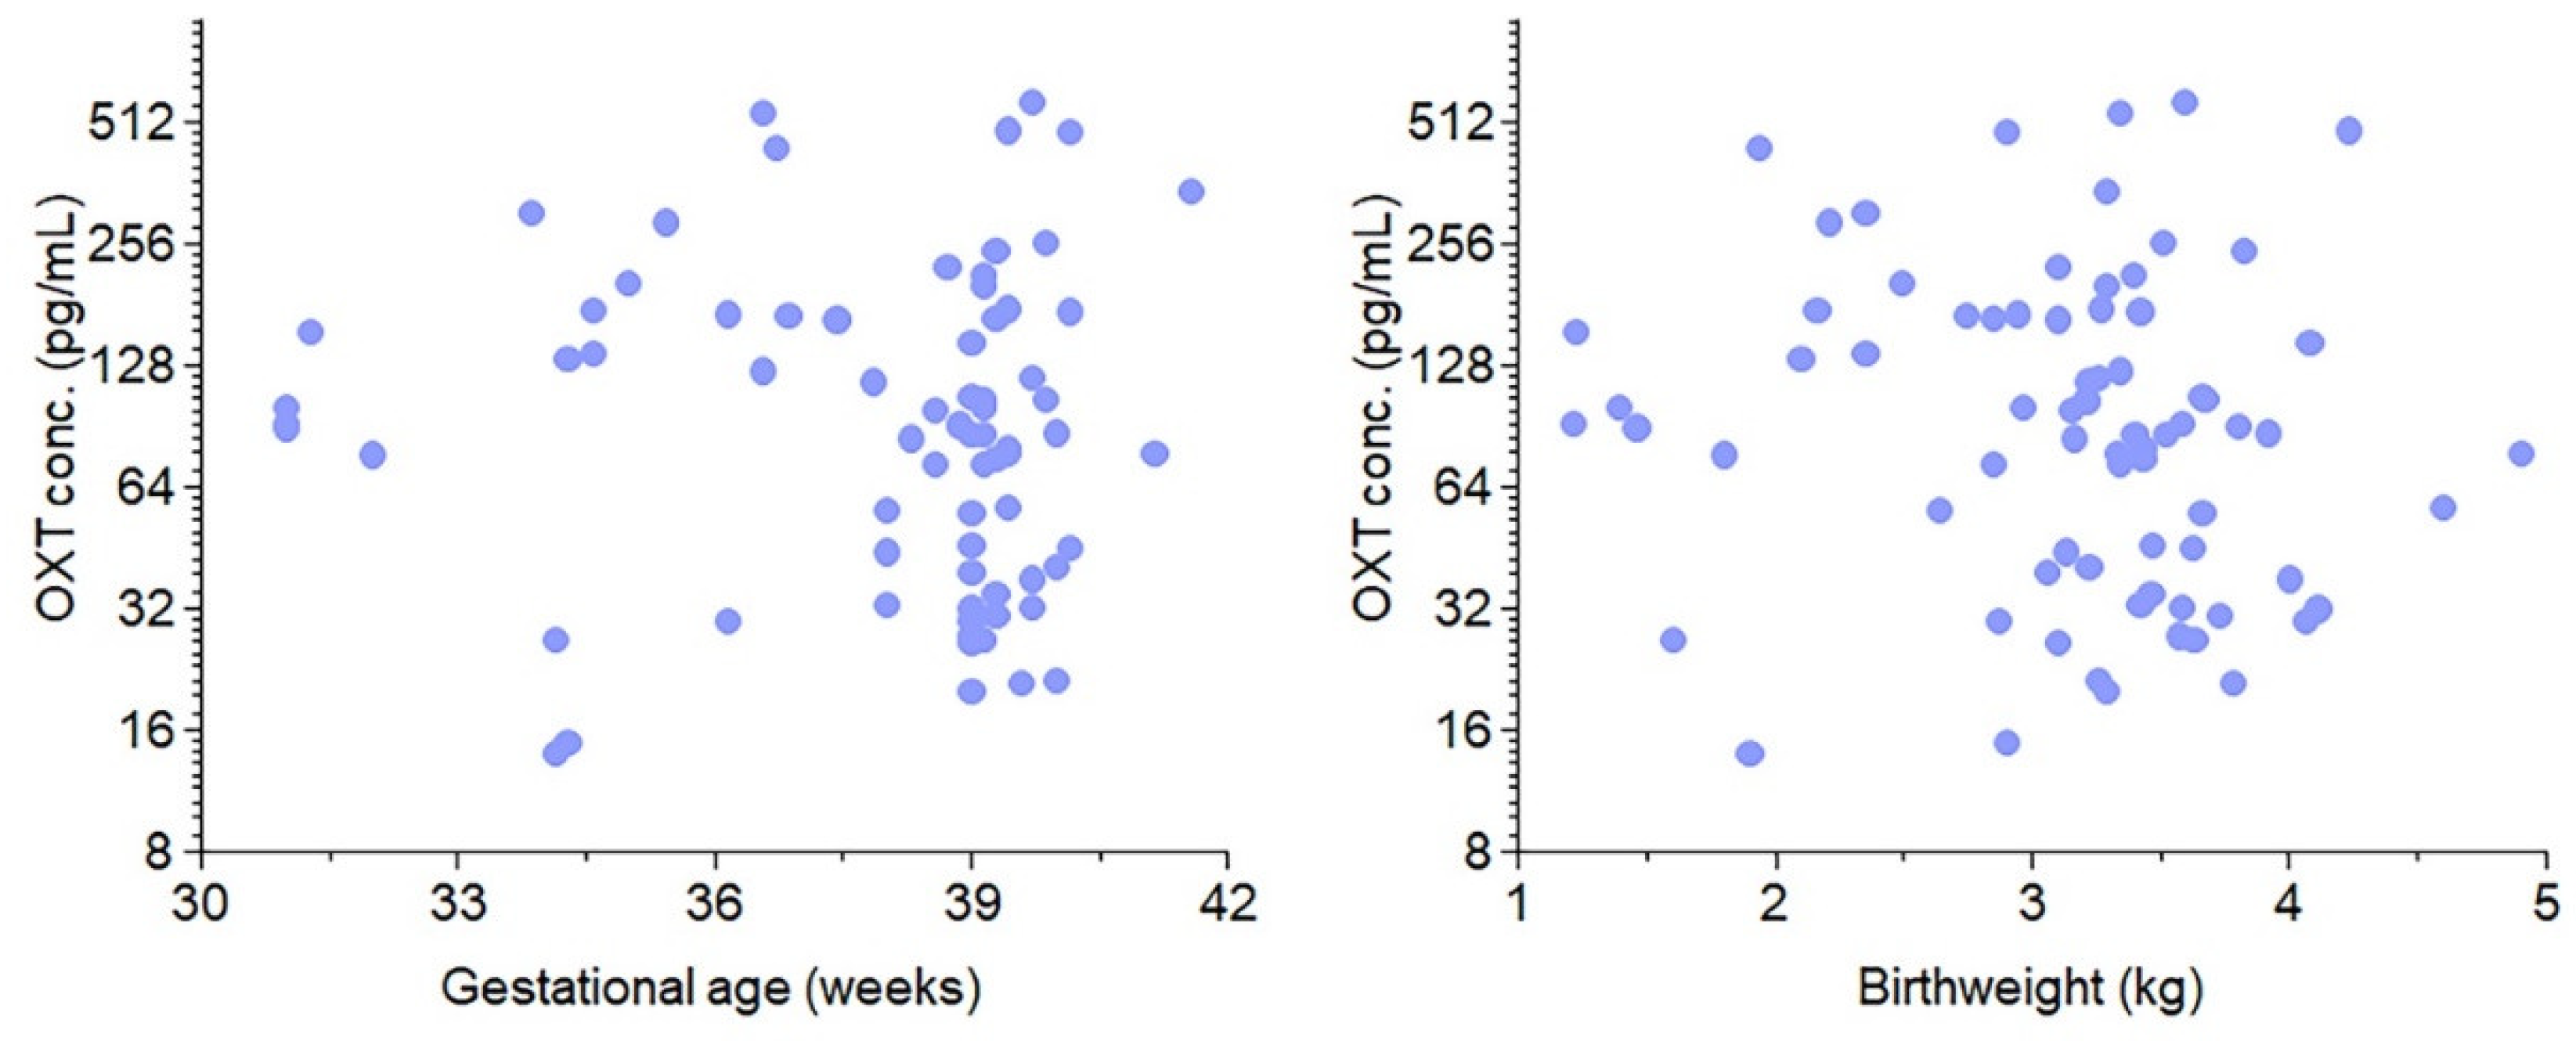
Figure 3.
Maternal OXT crosses the placenta and affects fetal OXT concentration in preterm and term infants and during labor. A. Concentration of OXT in the cord blood by Preterm without (green) and with (orange) OXT. Similarly, a comparison of the concentration of OXT in the cord blood by Full-term without (green) and with (Orange) OXT. B. Concentration of OXT in the cord blood by no labor without OXT (green), labor without OXT (orange), and labor with OXT (purple). Boxes represent the median, the bar within the box is the median, and the error bar represents the 1.5 interquartile range. Experimental data point distributions are all color-coded.
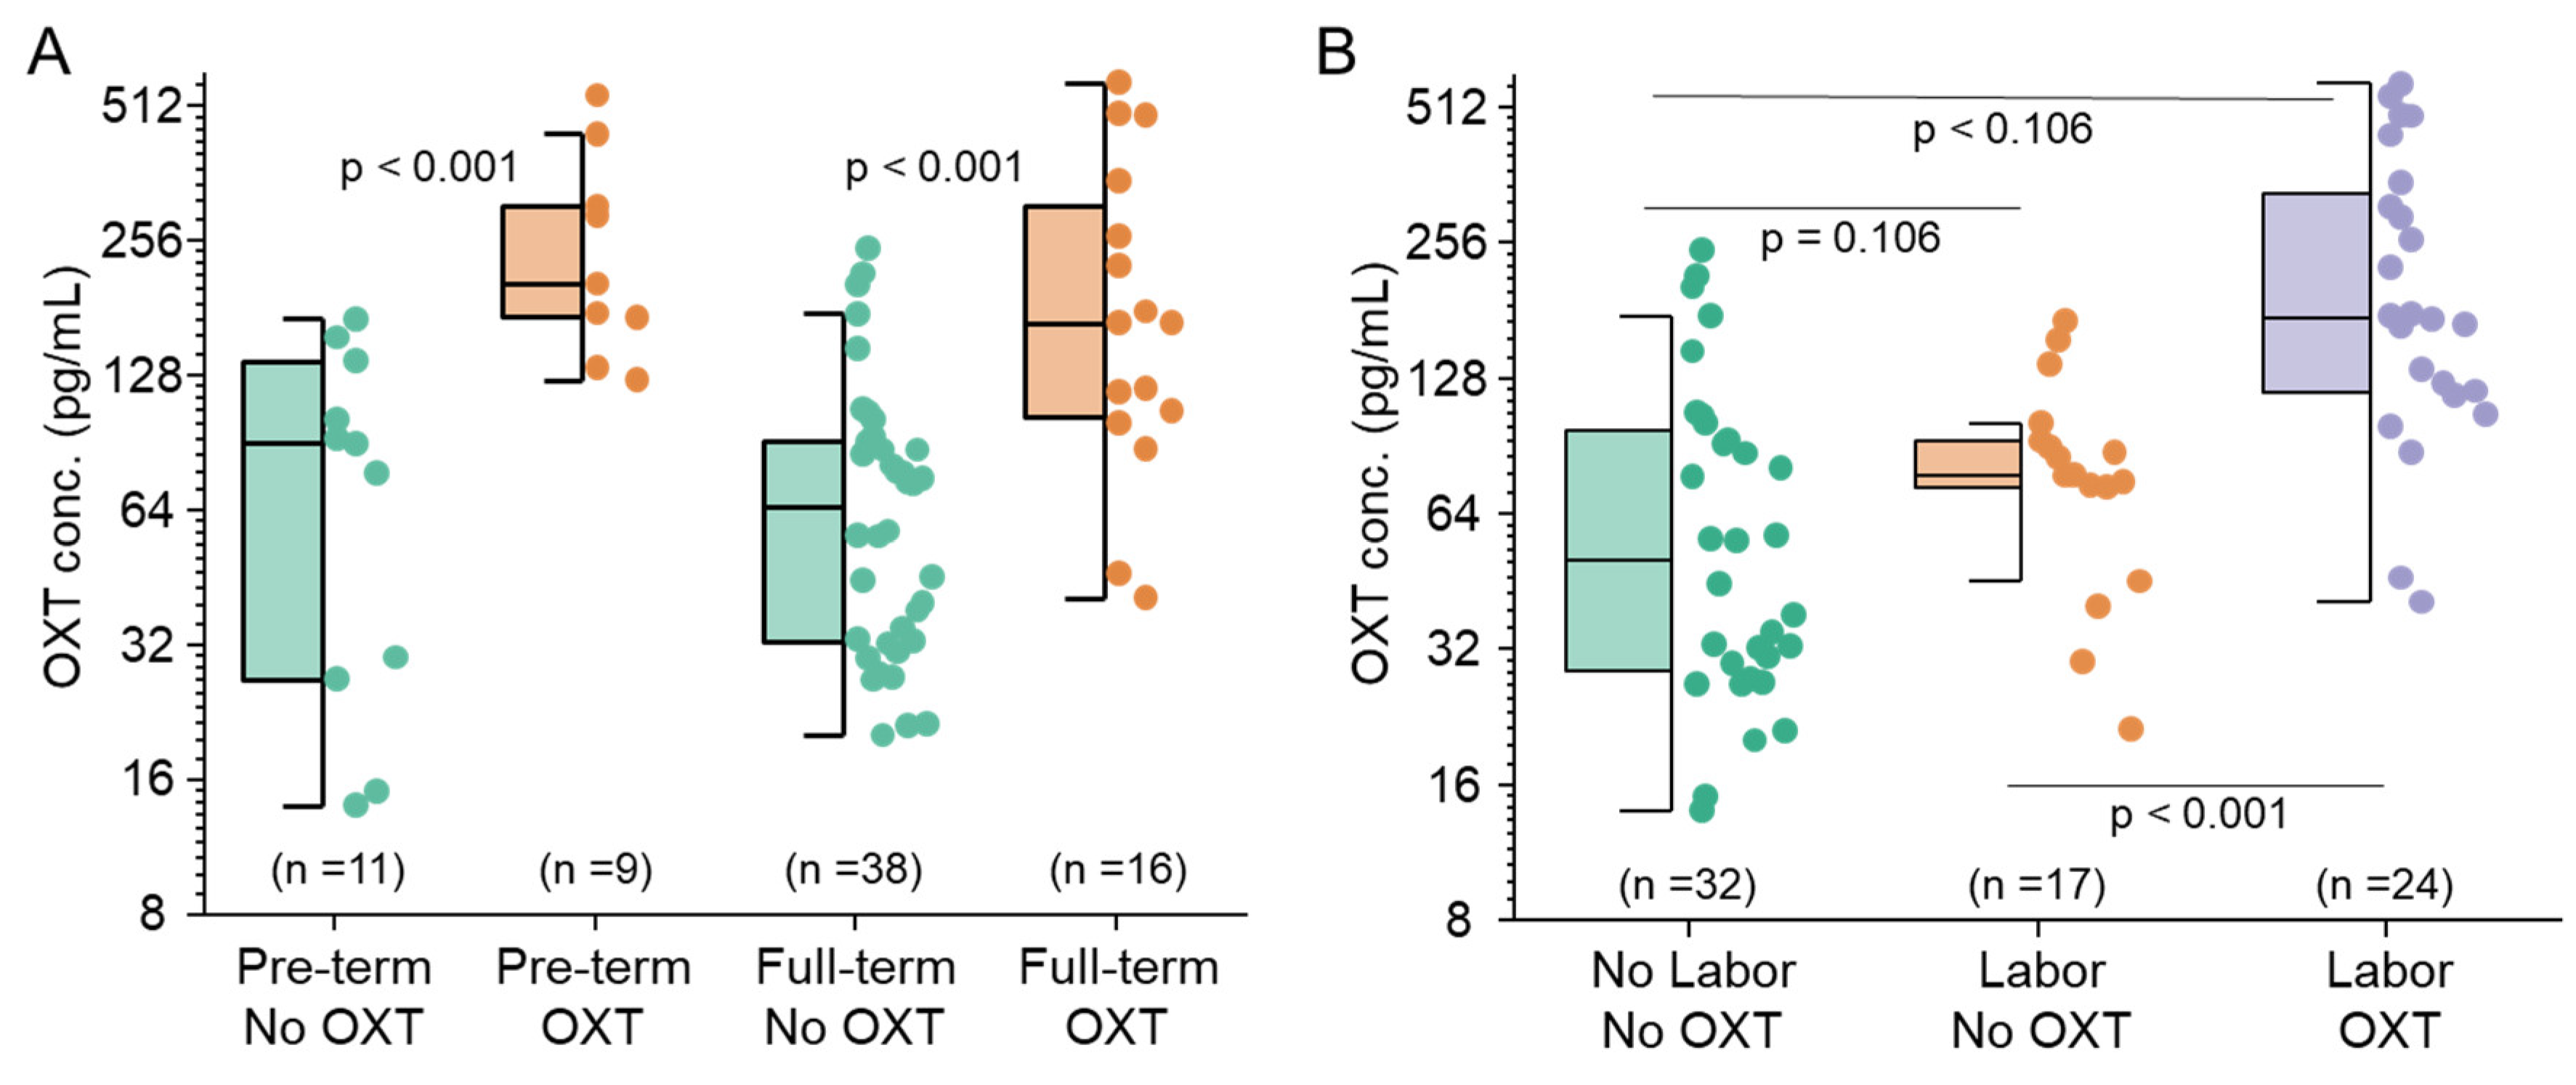
Figure 4.
OXT regulated gene expression profile. Volcano plot of gene expression scatter as a function of statistical significance. Genes are colored if they pass the thresholds for FDR and Log Fold Change (blue for downregulated and pink for upregulated). The top genes with a P value < 0.05 are labeled brown, and genes that did not meet our threshold are colored gray. Further segregation of downregulated (blue box) and upregulated (gray and orange boxes) genes are based on statistically significant fold changes.
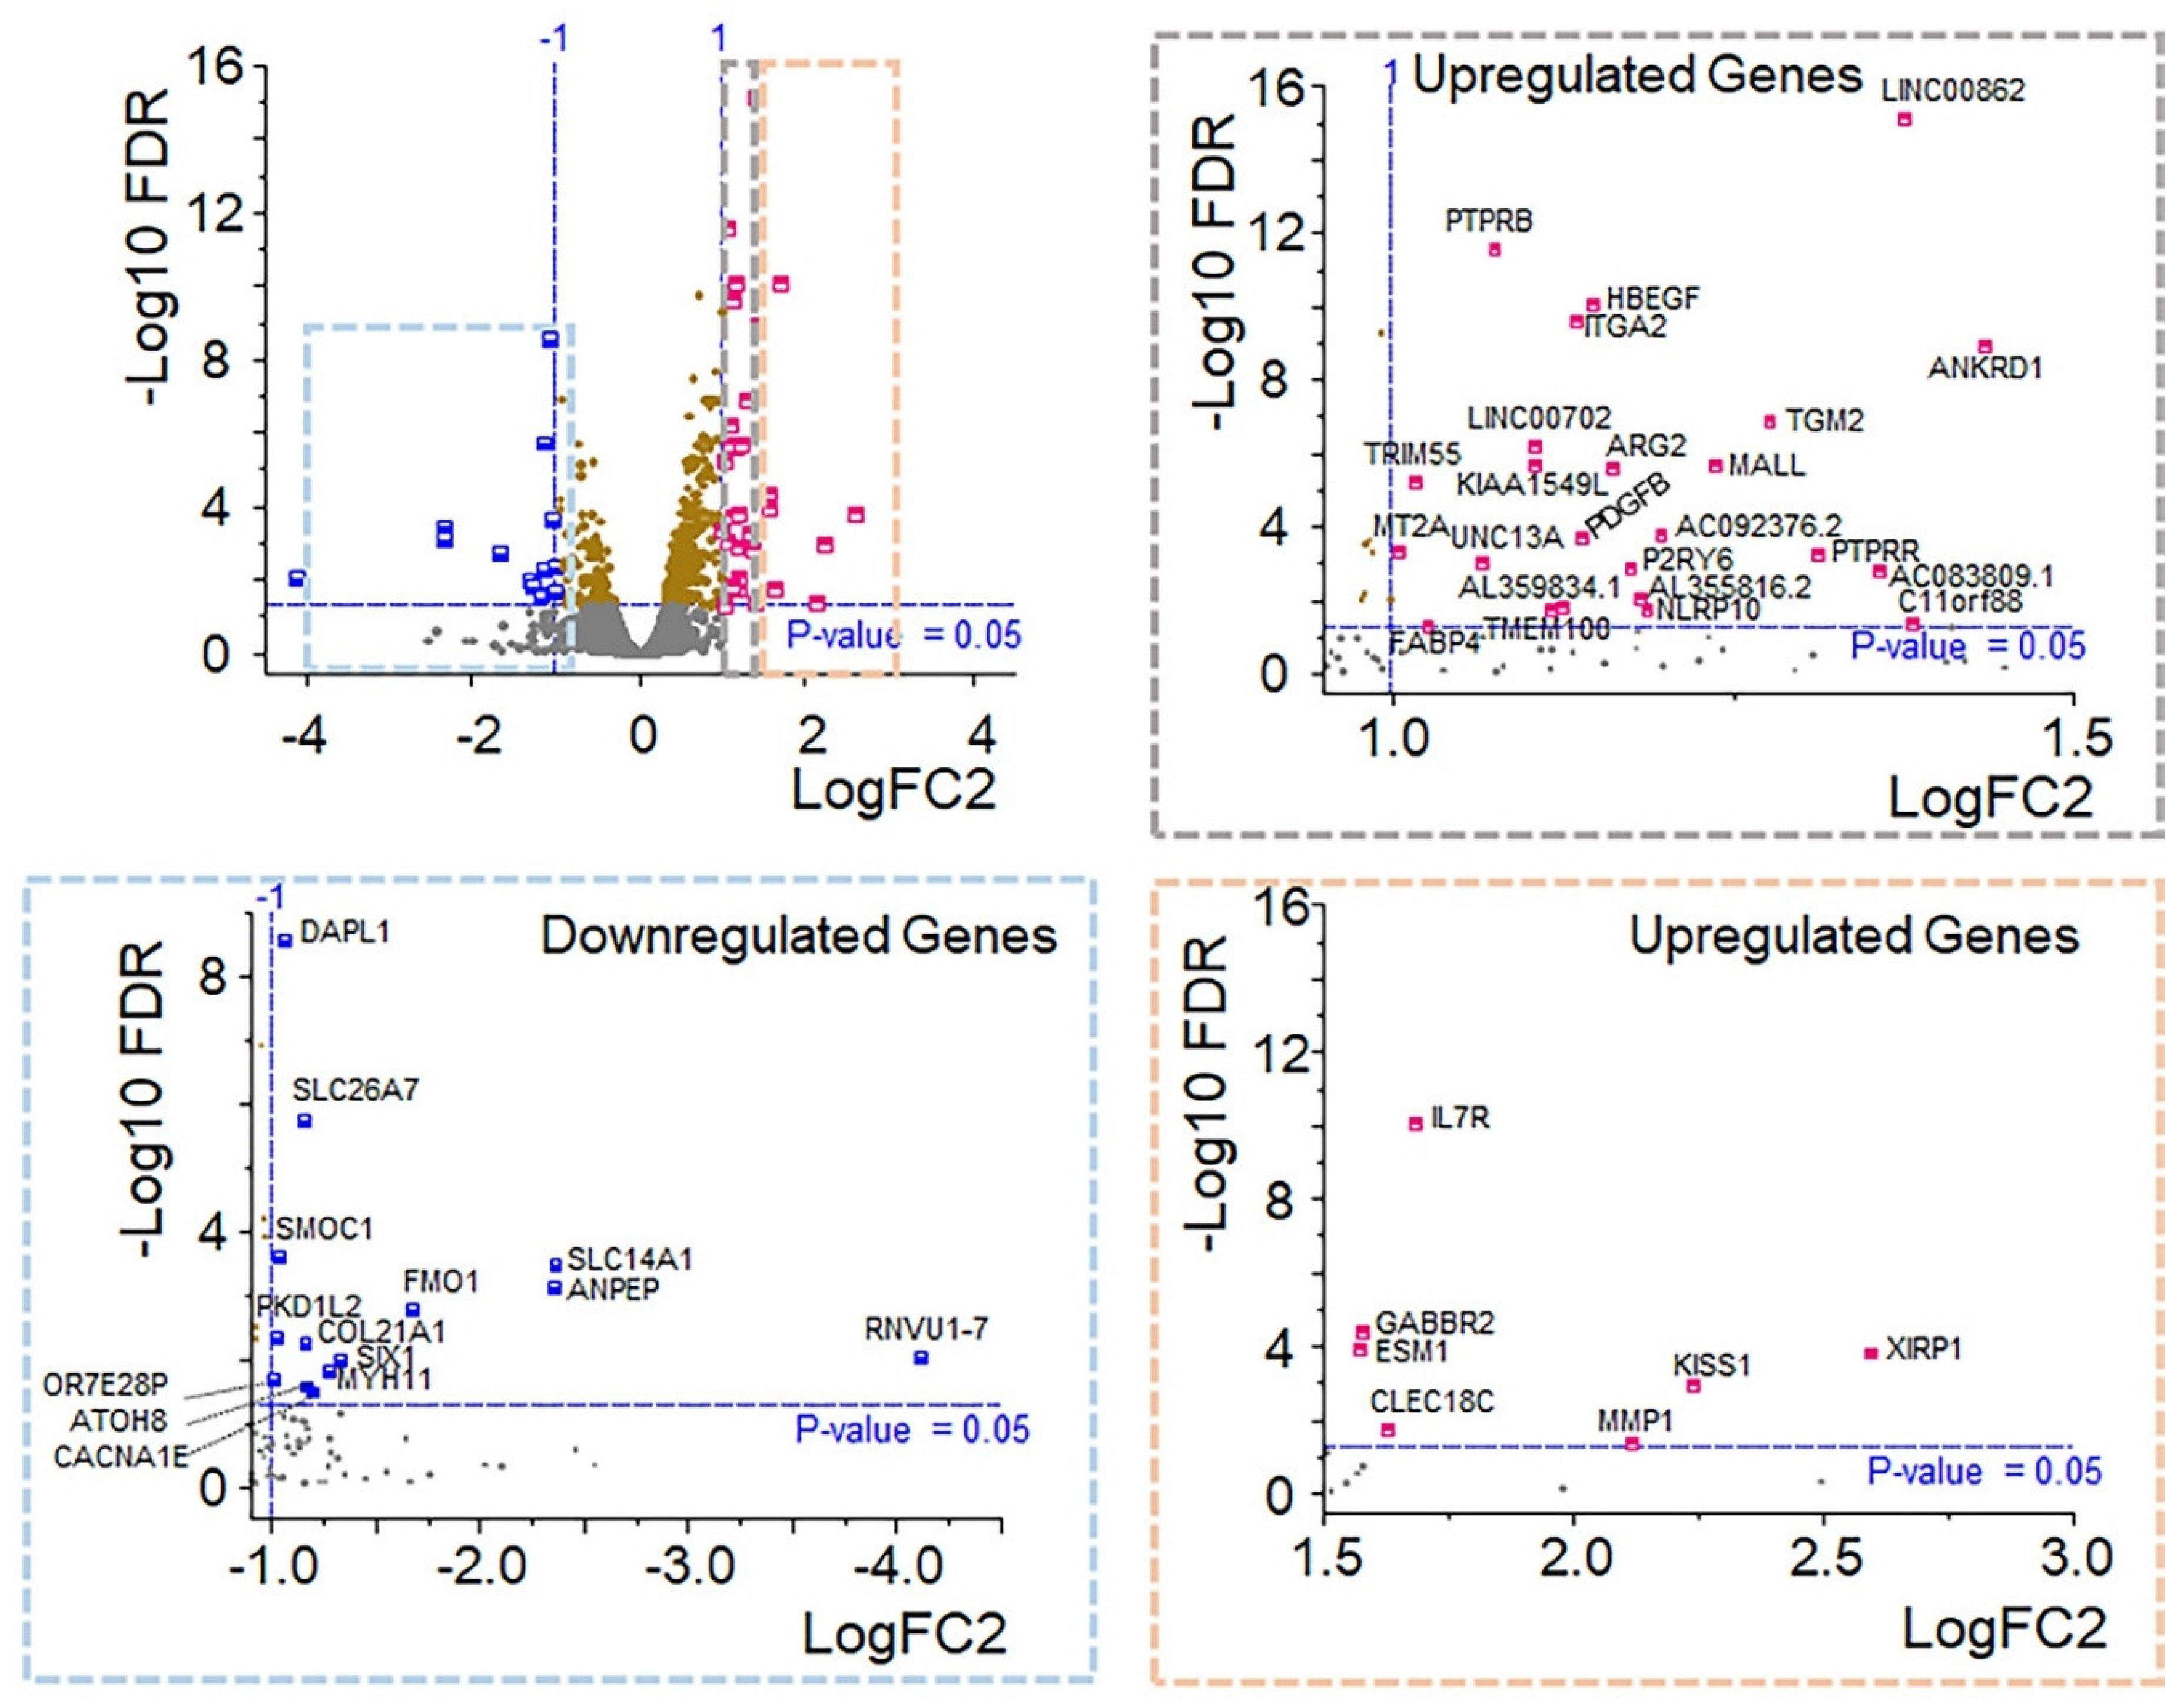
Figure 5.
Top 15 crucial biological coverage based on analyzed transcript datasets. Functional enrichment of down- (orange) and up- (blue) regulated genes following oxytocin treatment of human retinal pigment epithelial cells.
Figure 5.
Top 15 crucial biological coverage based on analyzed transcript datasets. Functional enrichment of down- (orange) and up- (blue) regulated genes following oxytocin treatment of human retinal pigment epithelial cells.
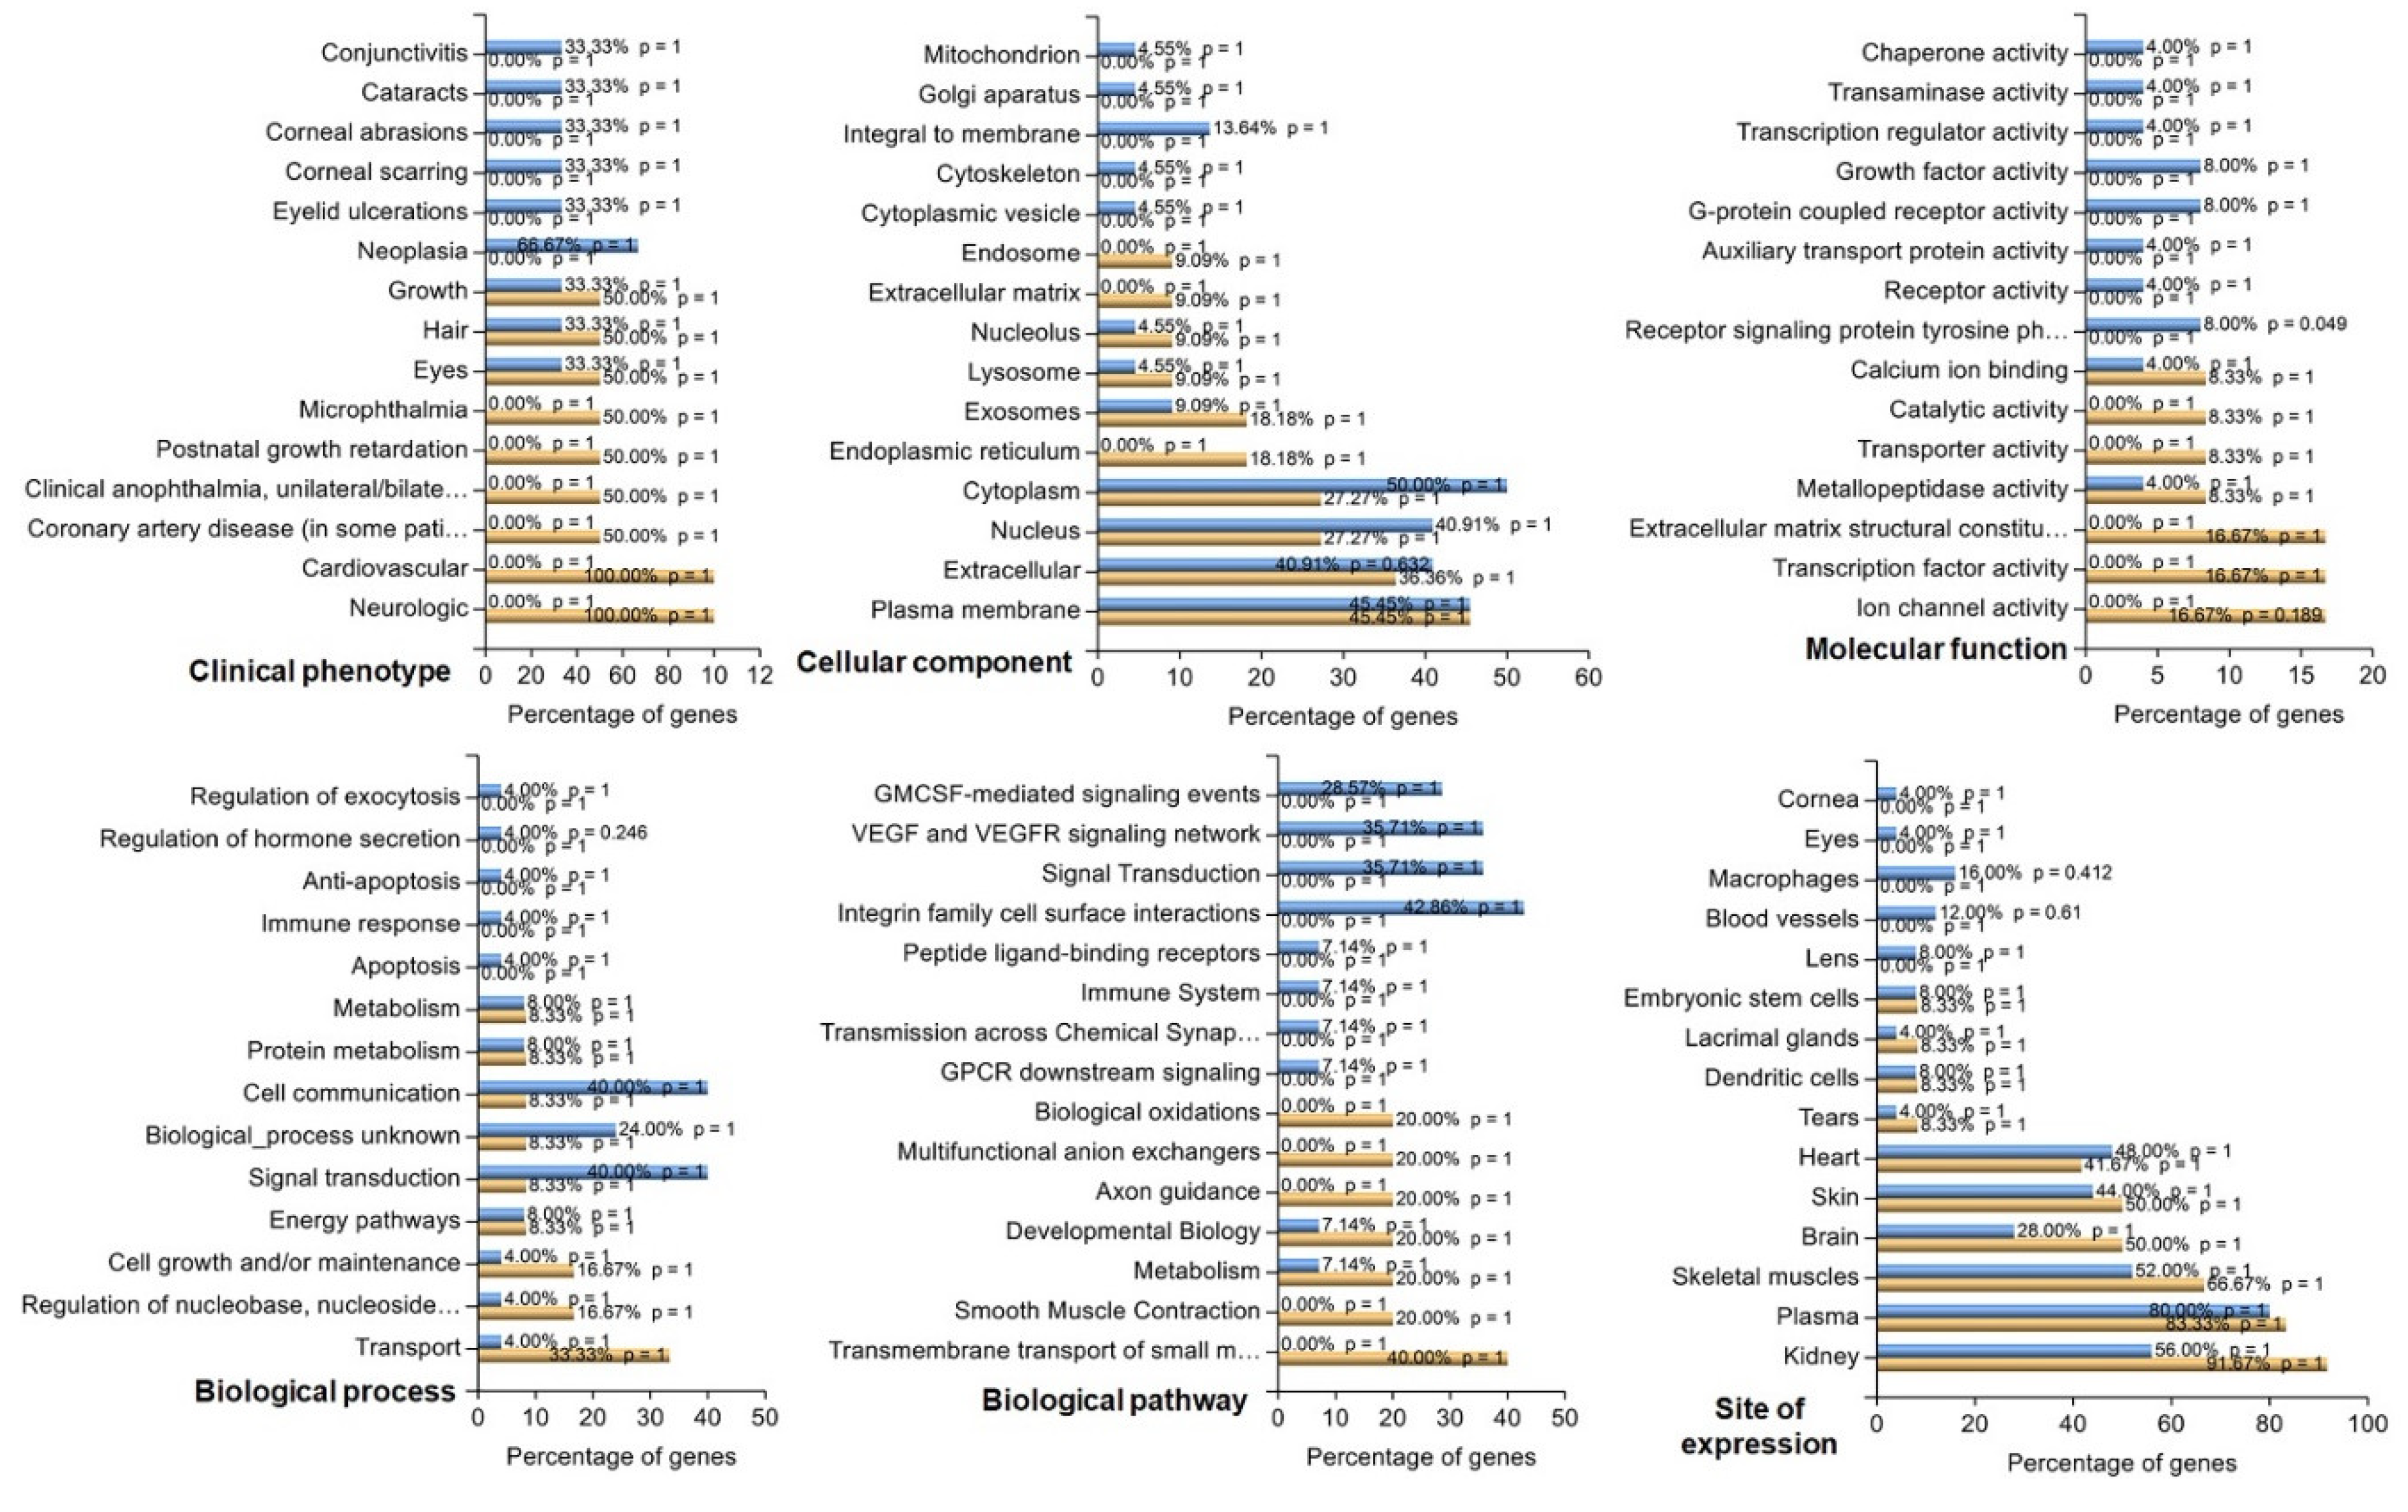
Figure 6.
GeneMANIA connectivity mapping of DEGs based on threshold. Black nodes are upregulated genes, and yellow nodes are downregulated genes detected in this study.
Figure 6.
GeneMANIA connectivity mapping of DEGs based on threshold. Black nodes are upregulated genes, and yellow nodes are downregulated genes detected in this study.

Figure 7.
OXT treatment induces dynamic modifications in the expression profile of genes in HfRPE cells. A. Expression profile of downregulated genes identified by RNA sequencing using Real-time PCR. B. Expression profile of some of the upregulated genes as identified by RNA sequencing using Real-time PCR.C. Expression profile of genes involved in cholesterol biosynthesis and metabolism. Fold change is presented as the mean ± SE. n=3 biological replicates and *: p≤ 0.05, **: p<0.001 using student’s T test.
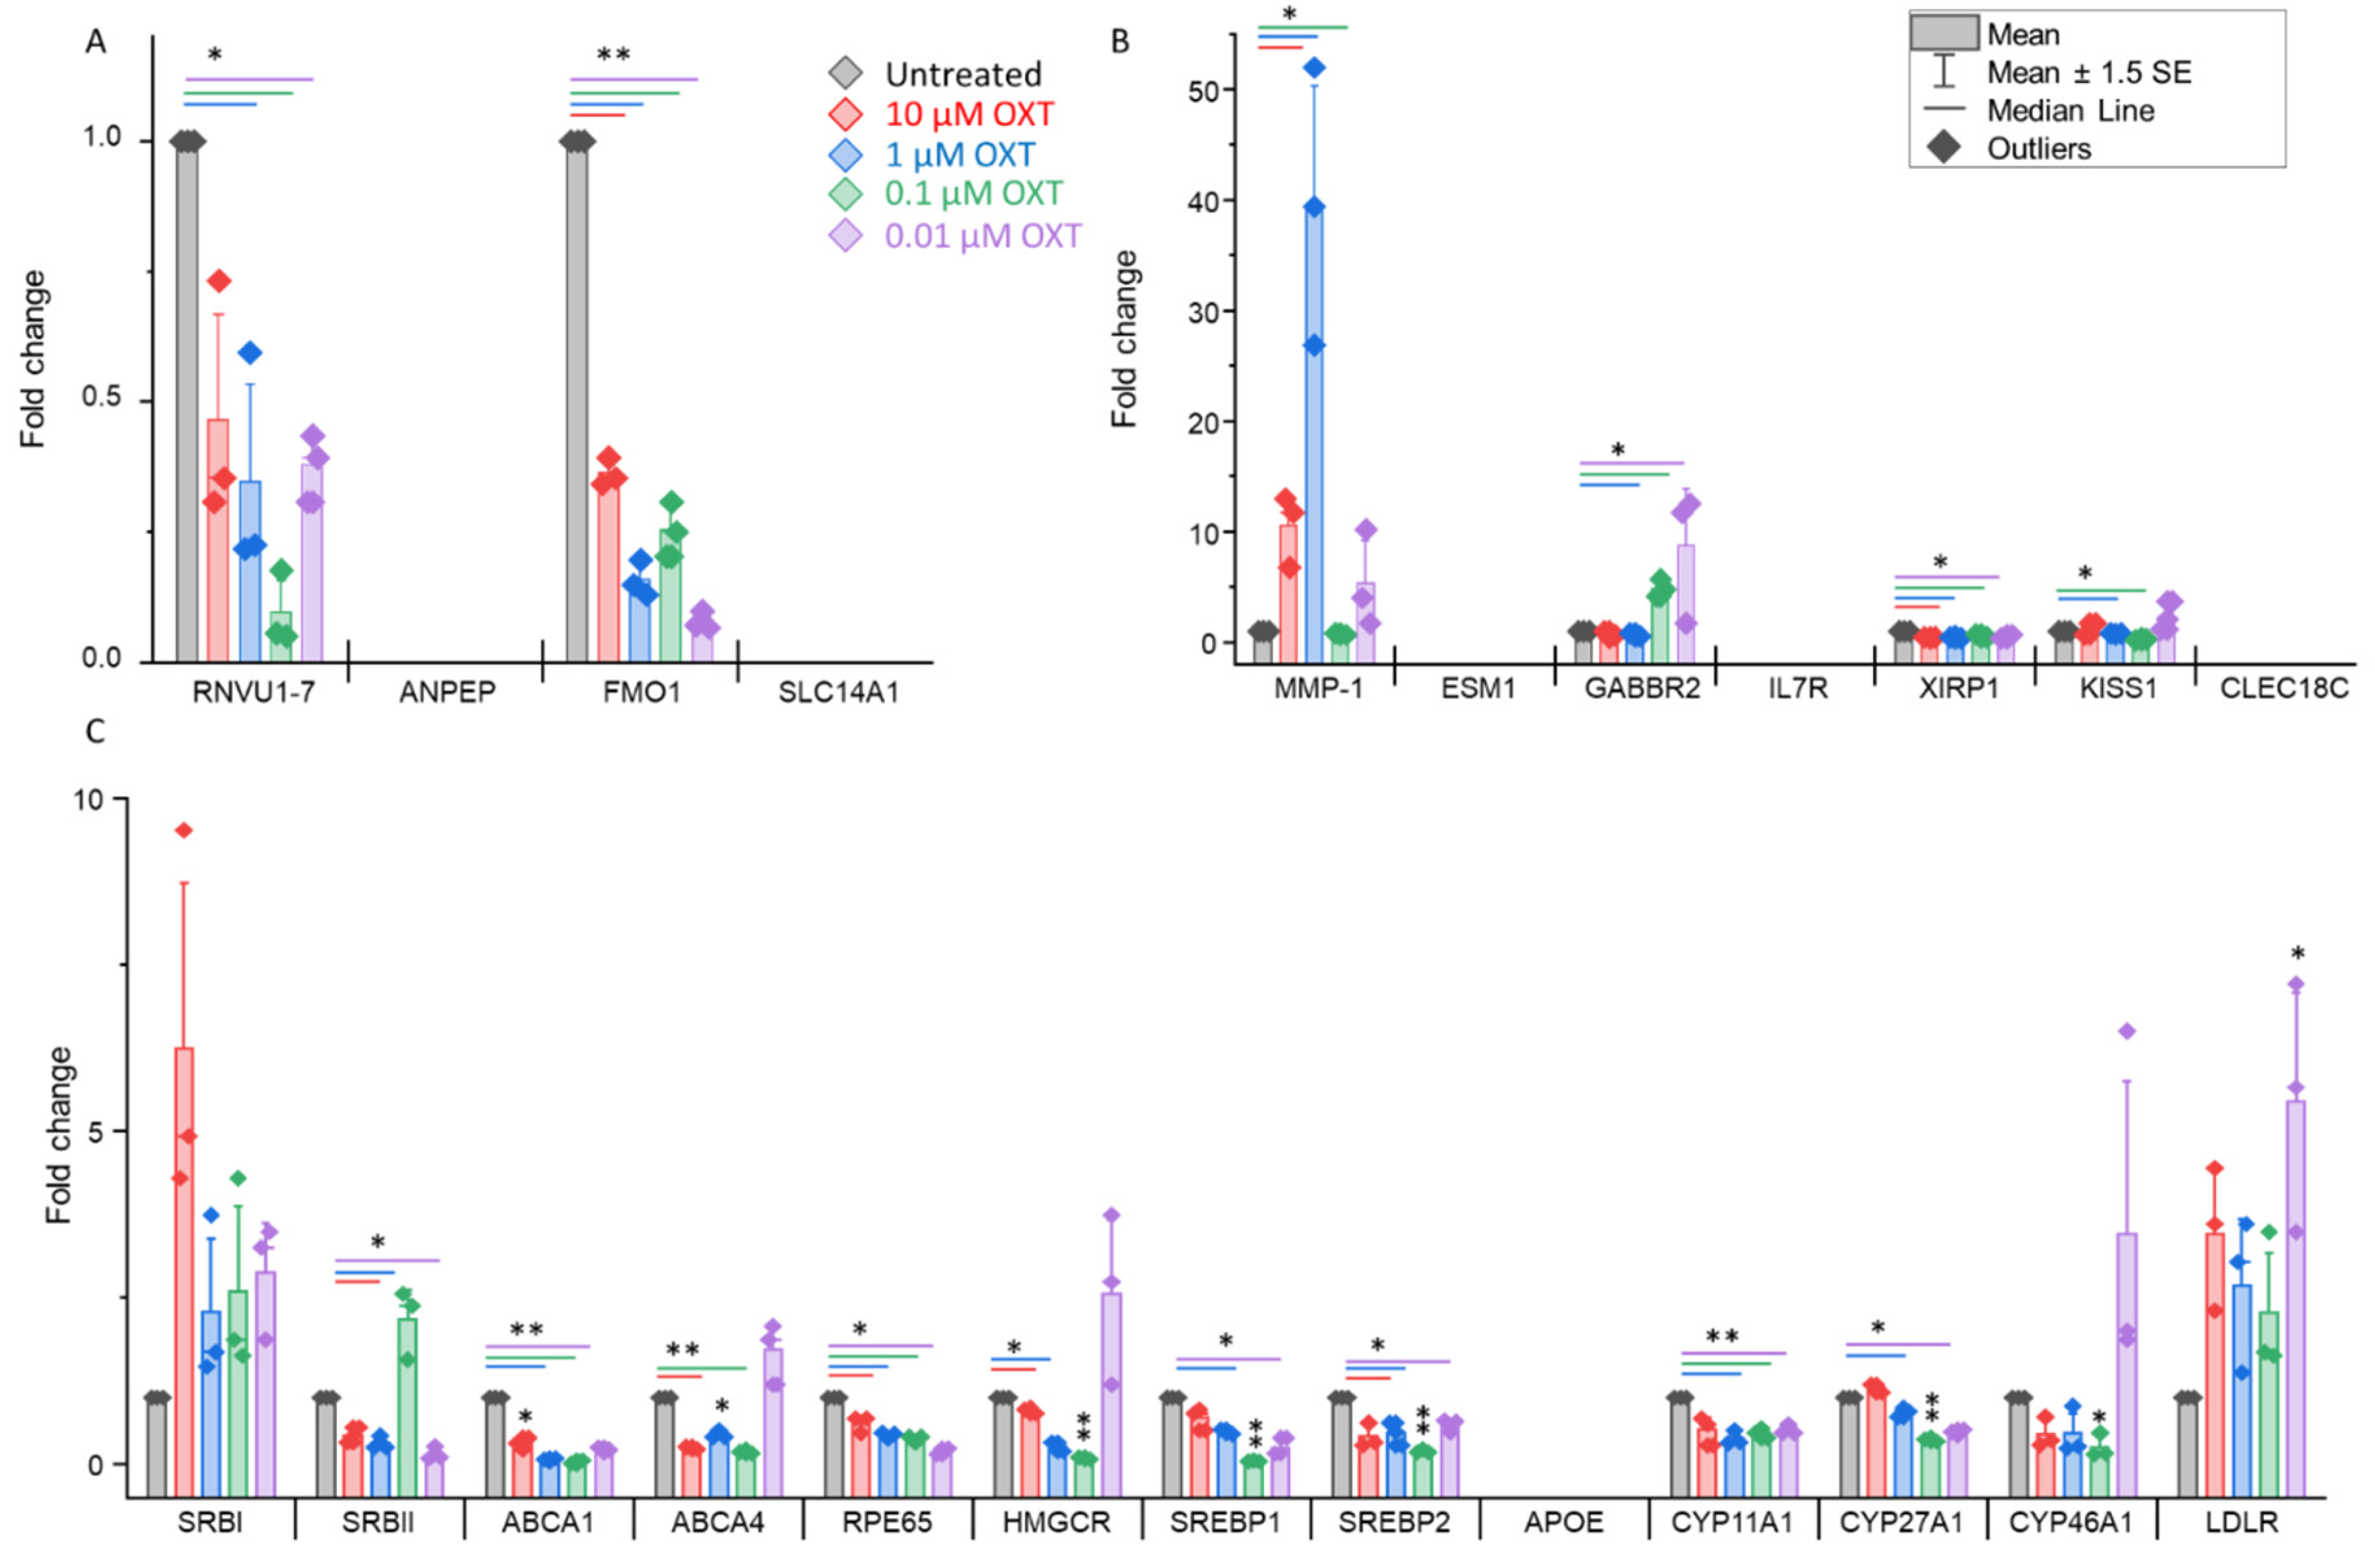
Figure 8.
Summary representation of the OXT signaling pathway that might control cellular function. Illustration of the art borrowed from Servier Medical Art.
Figure 8.
Summary representation of the OXT signaling pathway that might control cellular function. Illustration of the art borrowed from Servier Medical Art.
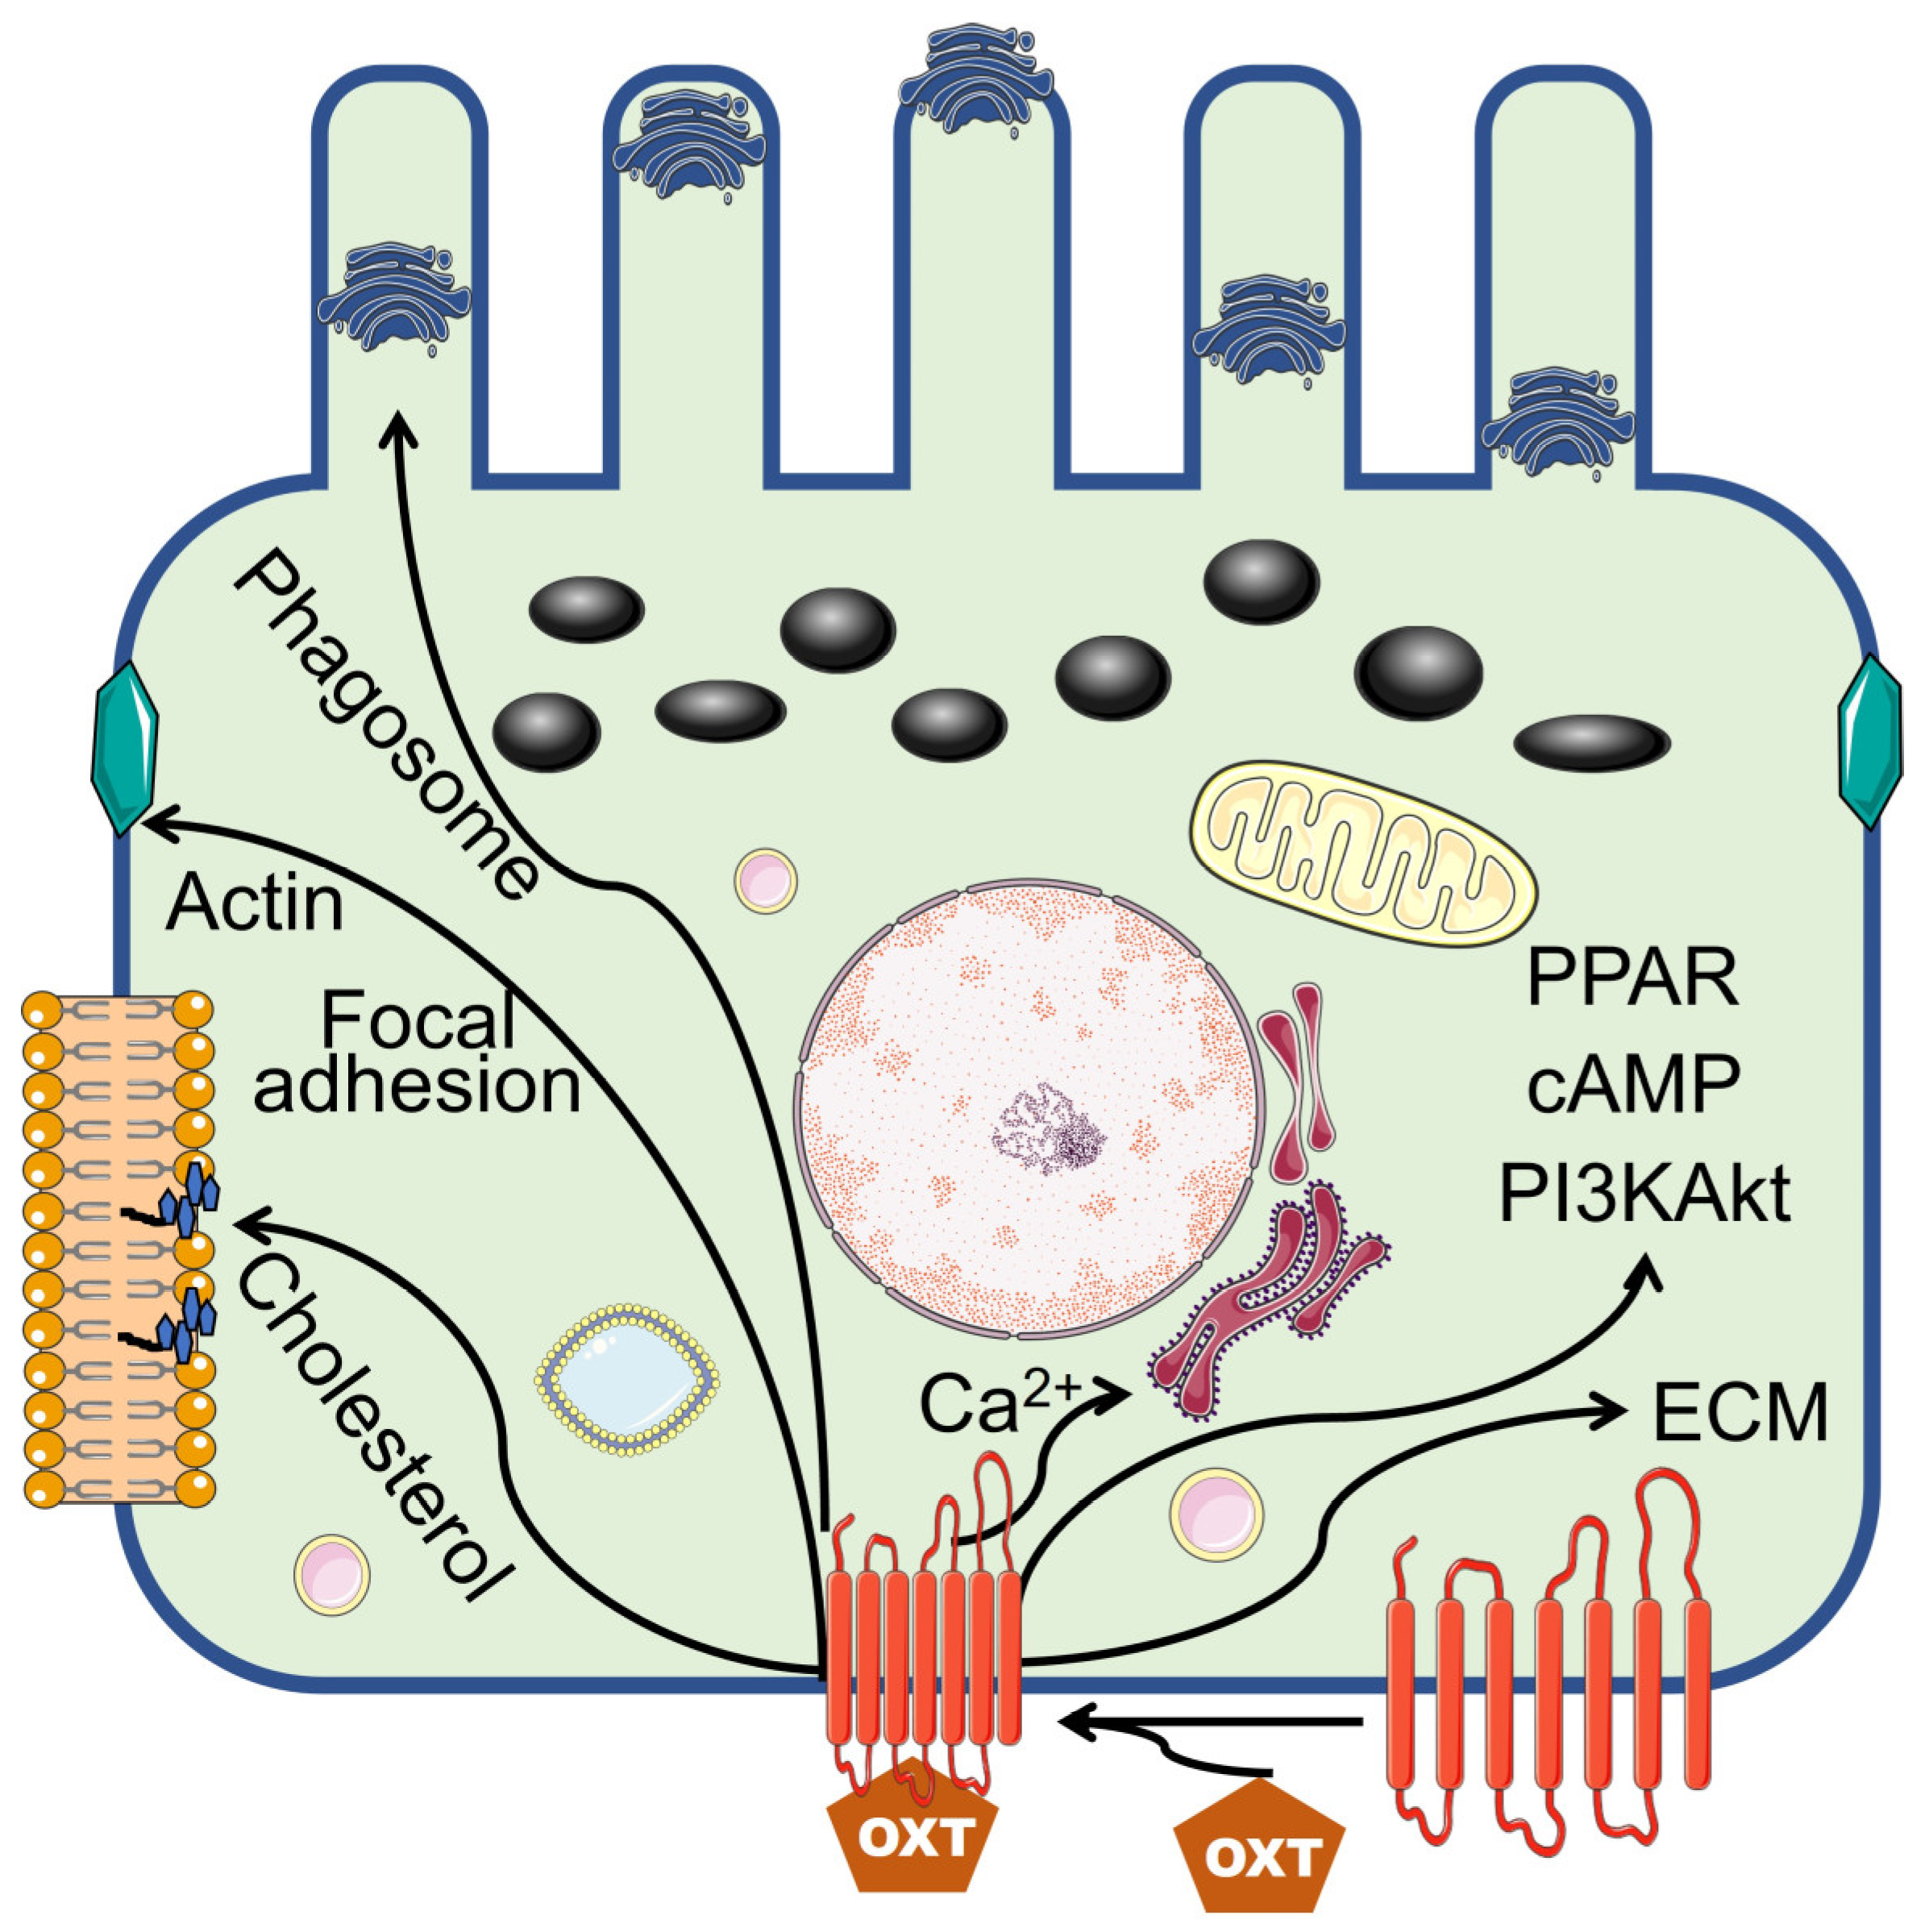

Table 1.
Maternal and infant perinatal and birth information, respectively.
| Preterm | Full-term | ||
|---|---|---|---|
| Characteristic | (n=20) | (n=54) | p value |
| Gest. Age, Weeks | |||
| Median [IQR] | 34.5 [32.7--36.0] | 39.2 [39.0--39.6] | |
| Birth weight, kg | |||
| Median [IQR] | 2.19 [1.68--2.74] | 3.43 [3.21--3.69] | |
| Labor, n(%) | 0.039 | ||
| No | 5 (25) | 28 (52) | |
| Yes | 15 (75) | 26 (48) | |
| Delivery, n(%) | 0.246 | ||
| C-Section | 10 (50) | 35 (65) | |
| Vaginal | 10 (50) | 19 (35) | |
| HBP/preeclampsia, n(%) | <0.001 | ||
| No | 8 (40) | 48 (89) | |
| Yes | 12 (60) | 6 (11) | |
| Abruption, n(%) | 0.070 | ||
| No | 18 (90) | 54 (100) | |
| Yes | 2 (10) | --- | |
| DM, n(%) | 0.001 | ||
| No | 11 (55) | 49 (91) | |
| Yes | 9 (45) | 5 (9) | |
| Maternal Steroid, n(%) | <0.001 | ||
| No | 11 (55) | 54 (100) | |
| Yes | 9 (45) | --- | |
| 5-min Apgar < 5 | 0.270 | ||
| No | 19 (95) | 54 (100) | |
| Yes | 1 (5) | --- | |
| FiO2 > 21% | 0.003 | ||
| No | 13 (65) | 51 (94) | |
| Yes | 7 (35) | 3 (6) | |
| Maternal OXT, n(%) | 0.214 | ||
| No | 11 (55) | 38 (70) | |
| Yes | 9 (45) | 16 (30) | |
| Cord blood [OXT], pg/mL | 0.106 | ||
| Median [IQR] | 137 [71.1--223] | 82.1 [40.3--146] |
Disclaimer/Publisher’s Note: The statements, opinions and data contained in all publications are solely those of the individual author(s) and contributor(s) and not of MDPI and/or the editor(s). MDPI and/or the editor(s) disclaim responsibility for any injury to people or property resulting from any ideas, methods, instructions or products referred to in the content. |
© 2024 by the authors. Licensee MDPI, Basel, Switzerland. This article is an open access article distributed under the terms and conditions of the Creative Commons Attribution (CC BY) license (http://creativecommons.org/licenses/by/4.0/).
Copyright: This open access article is published under a Creative Commons CC BY 4.0 license, which permit the free download, distribution, and reuse, provided that the author and preprint are cited in any reuse.


