Preprint
Article

Distribution Characteristics of Trichiurus japonicus and Its Relationship with Environmental Factors in Central and Southern East China Sea and Yellow Sea

Altmetrics

Downloads

53

Views

20

Comments

0

A peer-reviewed article of this preprint also exists.

Submitted:

16 September 2024

Posted:

17 September 2024

You are already at the latest version

Alerts
Abstract
Trichiurus japonicus is the most productive fish caught in our country. In order to understand the seasonal distribution of Trichiurus japonicus in the central and southern parts of the East China Sea and Yellow Sea, three species distribution models were adopted, namely Random Forest Model, K-nearest neighbor algorithm and gradient ascending decision Tree model, based on the data of trawling surveys in the central and southern parts of the East China Sea and Yellow Sea from 2008 to 2009. Combined with variance inflation factor and cross-check, the distribution model of Trichiurus japonicus was screened and constructed to analyze the influence of environmental factors on the distribution of Trichiurus japonicus in the central and southern parts of the East China Sea and the Yellow Sea. The results showed that the random forest model had the advantages of fitting effect and prediction ability among the three models. The analysis of this model showed that the water depth, bottom water temperature and surface salinity had a great influence on the habitat distribution of Trichiurus japonicus. The relative resources of Trichiurus japonicus increased with the increase of bottom water temperature and reached the maximum at 23.8℃, and first increased and then decreased with the increase of water depth and surface salinity, reaching the maximum at 72 m and 31.2‰, respectively. The random forest model was used to predict the spatial distribution of Trichiurus japonicus in the East China Sea and the central and southern Yellow Sea during 2008-2009, and the results showed that the predicted results were close to the actual situation. The research results can provide reference for the exploitation and protection of Trichiurus japonicus resources in the East China Sea and the central and southern Yellow Sea.
Keywords: 
Subject: Physical Sciences  -   Other

1. Introduction

Trichiurus japonicus belongs to the order Perciformes, family Trichiuridae, and genus Trichiurus. It is a warm-temperate species that typically forms schools near the seafloor. The single-species catch exceeded 1 million tons in 1995[1], making it one of the few marine species in China with over one million tons in landing. Currently, the main fishing methods in the East Yellow Sea include bottom trawling and seine netting. Trichiurus japonicus resources in the East China Sea have been exploited since the 1950s, with catches often ranking first among various species since the late 1950s. Consequently, Trichiurus japonicus is a key species in domestic fisheries research and management. Many resource management systems in the East China Sea, including fishing bans and protected areas, are based on research findings related to Trichiurus japonicus resources, primarily focusing on conserving traditional economic fish species, with Trichiurus japonicus being the primary target [2].
One of the hot topics in fishery ecology is the spatial distribution characteristics of species and their relationships with environmental factors[3]. The spatial distribution of fish populations is influenced by a variety of control factors, both external and internal, of which the external control, also known as environmental control, includes hydrological conditions, substrate types, etc., and is generally considered to be the main factor affecting the spatial distribution of fish populations[4]. On the other hand, population size, age structure, fish condition, diversity, and behavior, etc., internal control factors can also regulate the spatial distribution of fish populations through density-dependent, age-dependent habitat preference, migration ability differences, etc.[5]. The adaptability and limitation of fish to marine environment are one of the key factors determining their migration, distribution, and movement, and the study of the influence of environmental factors on the spatial distribution of fish populations is of great reference value for fishery analysis, fishing ground exploration, and rational use of fishery resources[6]. Species distribution model (SDM) is a mathematical model that uses environmental data to predict the spatial distribution of species according to their survival conditions, and has become one of the important methods in the application of conservation biology and ecology[7]. Widely used species distribution models in fisheries include generalized additive models and generalized linear models[8,9], with relatively fewer applications of machine learning methods. As automation and intelligence advance, machine learning algorithms increasingly predict fish abundance and distribution[10], identify populations[11], standardize catch per unit effort (CPUE)[12], and explore relationships between fishery resources and environmental factors[13,14], showing distinct advantages. For instance, Chen[15]developed a forecasting model for Indian Ocean yellowfin tuna fisheries using a random forest model, enhancing the forecasting capabilities of distant offshore fisheries. Hou[16] researched the modeling and forecasting of South Pacific yellowfin tuna fisheries using six ensemble learning models, improving the accuracy of their predictions. Gao[17] constructed a forecasting model for mackerel in the East and Yellow Seas employing gradient boosting decision trees, playing a crucial role in managing and protecting mackerel resources. Song built a forecasting model for bigeye tuna in the Atlantic tropical waters using K-nearest neighbors and gradient boosting decision trees, enhancing the accuracy of their model predictions. Currently, research utilizing species distribution models to examine the habitat distribution of ribbonfish remains scarce.
Based on the trawl survey data in the central and southern waters of the East China Sea and the Yellow Sea from 2008 to 2009, this study used random forest model, K-proximity algorithm and gradient lifting decision tree to analyze the distribution characteristics of Trichiurus japonicus and their relationship with environmental factors, and then compared and analyzed the fitting effect and prediction ability of the models. The habitat index was used to predict the distribution of Trichiurus japonicus in the East China Sea and the south of the Yellow Sea, so as to provide a basis for the rational utilization and scientific conservation of its resources, and provide a reference for fishery policy management.

2. Materials and Methods

2.1. Data Sources

The samples of belt fish in this study were collected from the fixed bottom trawl survey of the national science and technology support program "Investigation and Assessment of important fishery Resources in the Main fishing grounds of the East China Sea" conducted in May (spring), August (summer) and December (autumn) of 2008 and February (winter) of 2009 in the central and southern waters of the East China Sea and the Yellow Sea. The sea area covered 121°~126.5°E and 26°~35°N(Figure 1), with 119 stations. The survey ship uses a 6 m×80 target net, the width of the network port is 48 m, the mesh size of the bag net is 30 mm, the towing speed of the survey ship is 2.0 kn, and the towing time of each station is 1 h. The relative catch Y(g/h) was obtained by using trawling time of 1 h and trawling speed of 2 kn.
Sample processing and environmental factor measurements adhered to the "Ocean Survey Standards" [19]. Environmental data were collected using a shipborne synchronized CTD instrument, which measured Sea Water Depth (SWD), Sea Surface Temperature(SST), Sea Bottom Temperature(SBT), Sea Surface Salinity(SSS), and Sea Bottom Salinity(SBS).

1.2. Model Construction

Random Forest (RF), proposed by Breiman[20], is an ensemble learning method based on the classification and regression tree algorithm. This approach improves the predictive performance of models by combining multiple decision trees. Specifically, Random Forest achieves this through several steps: first, it randomly extracts multiple samples from the original dataset, known as bootstrap samples; next, it models decision trees for each bootstrap sample; finally, it aggregates the predictions from each decision tree, arriving at the final prediction through voting or averaging. This method exhibits high tolerance to noise and outliers, achieves high classification accuracy and predictive precision, shows a lower probability of overfitting, and possesses strong generalization capabilities[21,22].
The K-Nearest Neighbor (KNN) algorithm serves as a widely adopted classification method. The steps for classification are straightforward: First, compute the distance between an object, whose category is unknown, and every sample in the training set. Next, select the K most similar (nearest) samples within the feature space. Then, determine which category most of these K samples belong to. Finally, if the majority of samples fall into a specific category, classify the object into that category as well[23]. The fundamental concept behind the KNN algorithm is clear: if most of the K nearest samples reside in a particular category, the sample should be assigned to that category too[24]. KNN can facilitate both regression and classification by evaluating distances between various feature values. For any N-dimensional input vector, which correlates to a point in the feature space, the outcome is the category label or predicted value associated with that feature vector. While the concept remains simple and intuitive, the algorithm boasts significant maturity and stability[25,26,27].
Gradient Boosting Decision Tree (GBDT) is an enhanced ensemble learning model based on Classification and Regression Trees (CART) algorithm [28]. It is one of the important algorithms in the field of machine learning. This model combines multiple weak classifiers into strong classifiers by iterating continuously. In each iteration, based on the previous iteration, the loss function is calculated to obtain the pseudo-residual, and the iteration is obtained, and then a new decision tree is constructed. Then, all the generated decision trees are weighted and fused according to the weight of the decision tree through gradient descent [29]. The model can deal with nonlinear relations effectively, has good generalization performance and accuracy in many prediction studies, and can identify and correct errors in the modeling process. However, GBDT is sensitive to outliers, and in multiple iterations, GBDT models will try to fit outliers, which may lead to overfitting. Therefore, when applying this model, hyperparameter tuning should be performed on the imported data to obtain the optimal solution of parameters and reduce the risk of overfitting [30].

1.3. Factor Screening and Model Fitting

ln(Y+1) was obtained by natural logarithm conversion of the relative resource amount (Y) of ribbon fish as the response variable, and SWD, SST, SBT, SSS and SBS were selected as the explanatory variables. A significant correlation between two or more explanatory variables in a multicollinearity representation model can negatively affect the final result. In order to avoid such influence, variance inflation factor (VIF)[31] is used in this study to test the multicollinearity of the above five factors and screen out the factors that can be added to the model. In general, V I F <2 indicates that there is no multicollinearity, and explanatory variables that exceed the threshold need to be removed.

1.4. Evaluation of Model Prediction Ability

Compare the fitting effects and predictive capabilities of three models to select the optimal one. Analyze the relationship between the distribution characteristics of Trichiurus japonicus in the central-southern East China Sea and Yellow Sea and environmental factors. Subsequently, predict their distribution.
The prediction ability of the model was tested by the 50 fold cross-validation method. The total data set was randomly and equally divided into 5 sub-data sets. Each time, 4 sub-data sets were randomly selected as the training set, and the other one was used as the validation set for the accuracy evaluation of the model prediction. The calculation was repeated 100 times, and the average effect was taken for the accuracy evaluation of each model. According to the Mean Squared Error (MSE) and Coefficient of Determination (R2) obtained, the prediction ability of each model was determined.
MSE is the ratio of the square sum of the deviation between the predicted value and the true value and the number of observations n, which can reflect the degree of dispersion of the data set [32]. The smaller the MSE value, the higher the accuracy of the model prediction and the more accurate the description of the test data. is the proportion of the sum of squares caused by the independent variable X in the total sum of squares of the dependent variable Y [33], which can be used to evaluate the fitting degree of the prediction model. The closer is to 1, the higher the reference value of the model, which can well describe the trend and rule of the data set. The closer is to 0, the lower the reference value of the model, and the trend and rule of the data set cannot be well described [34].
The formulas for calculating MSE and R² are as follows:
M S E ( y , p ) = 1 n i = 1 n ( y i p i ) 2 2
R 2 ( y , p ) = 1 i = 0 n ( y i p i ) 2 i = 0 n ( y i y ¯ ) 2
In the formula: y represents the original value; p stands for the predicted value; and n denotes the sample size.

1.5. Mapping Habitat Distribution Prediction

The Habitat Suitability Index (HSI) was initially proposed in the 1980s [35] and is primarily utilized for assessing habitat quality, providing a more comprehensive depiction of the adaptation process of marine organisms to their environment. Currently, it has gained widespread application in the fields of biological spatial distribution and fishing ground forecasting [36,37,38]. In this study, after conducting comparisons, we selected the species distribution model with superior predictive performance. Subsequently, HSI values were calculated for each station and ArcGIS 10.2 software's spatial analysis module was employed to generate habitat distribution maps for Trichiurus japonicus during different seasons using Kriging interpolation based on an exponential semi-variance function [39].

2. Results and Analysis

2.1. Impact Factor Screening

Five factors (SWD, SST, SBT, SSS, SBS) were tested with multicollinearity using VIF, and their values were 1.78, 1.32, 1.51, 1.53 and 1.27, respectively. The results show that there is no multicollinearity between the factors and they can be added to the model.

2.2. Model Performance Evaluation

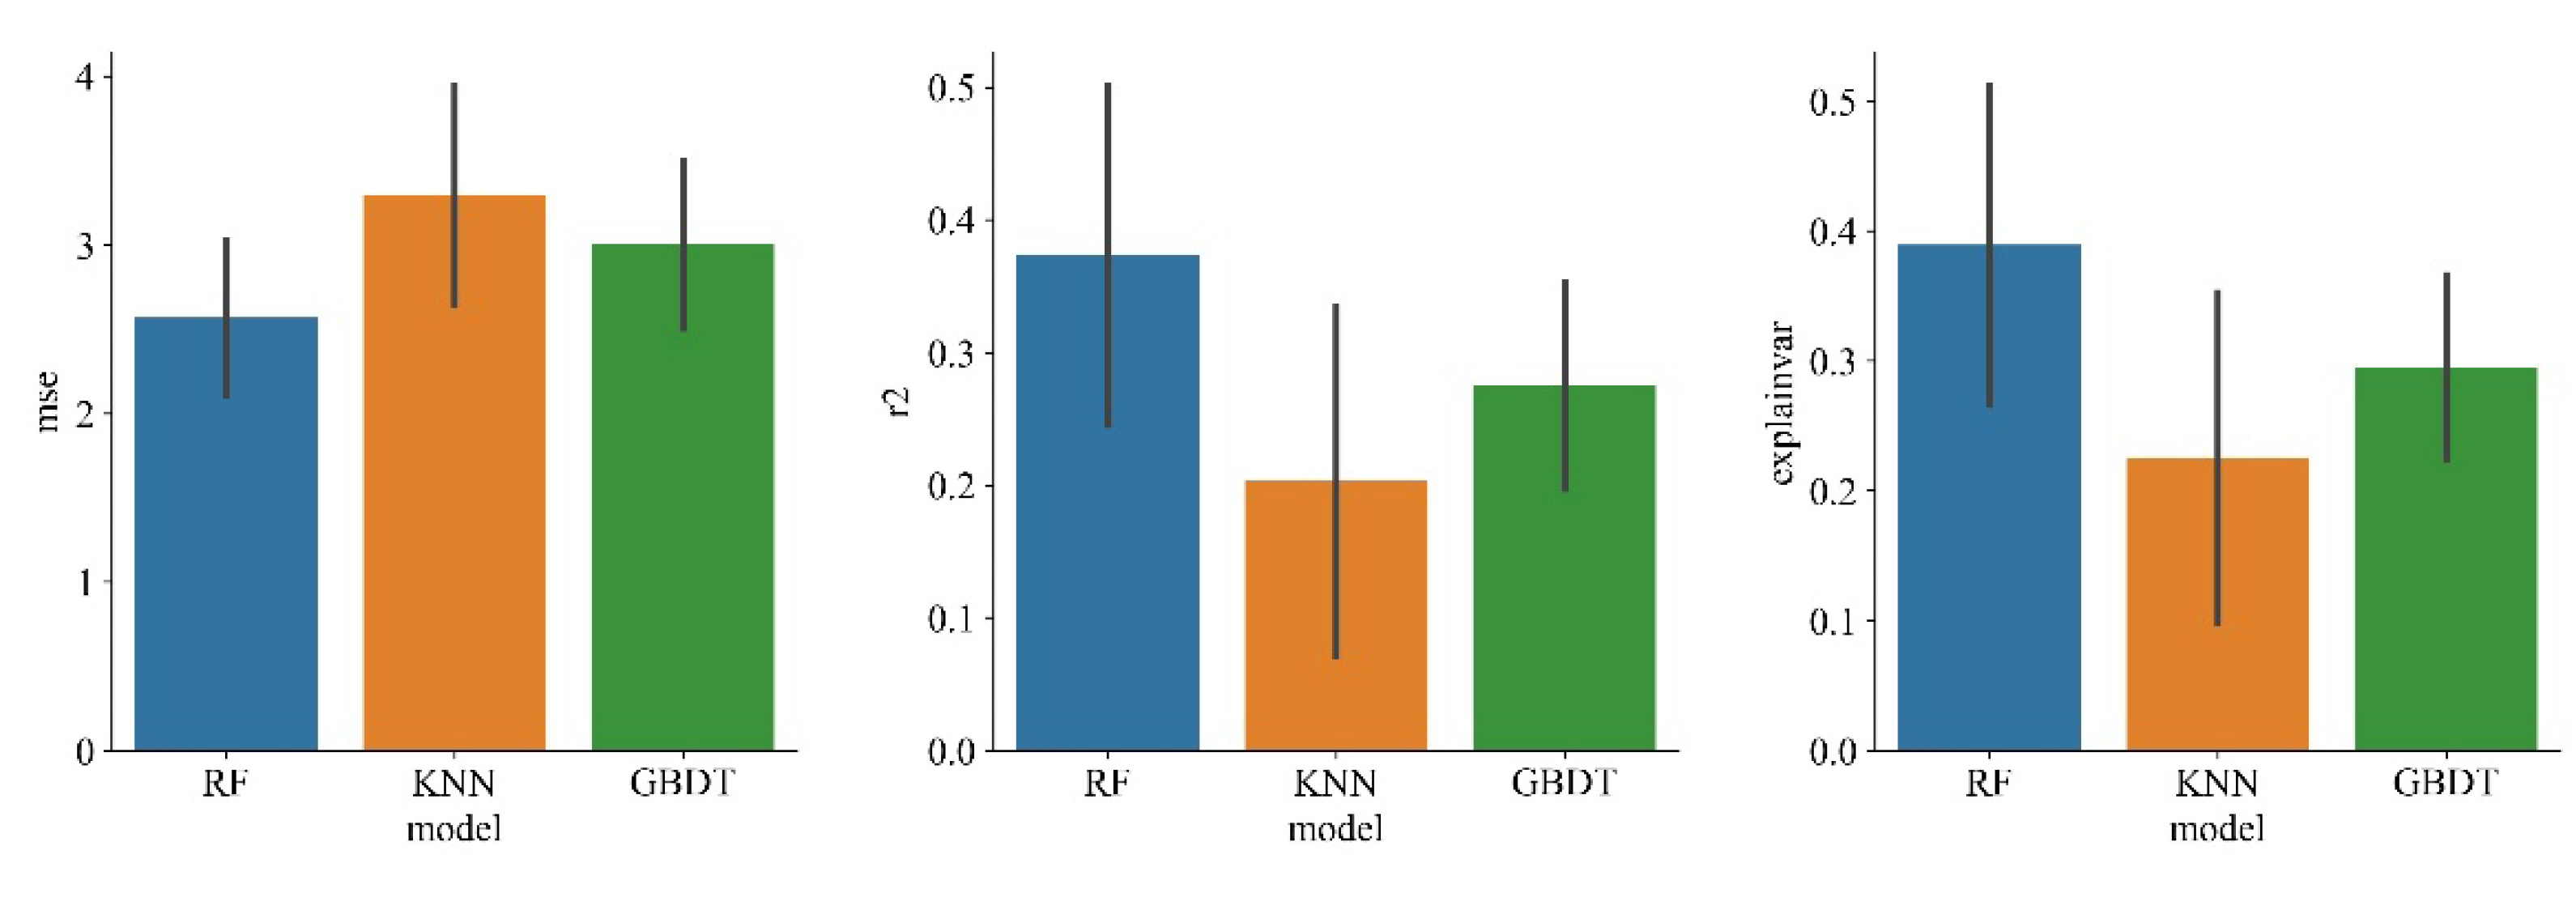
As can be seen from Table 1, after model fitting, MSE of random forest model is 0.348, which is smaller than KNN and GBDT models, and R2 is 0.919, higher than KNN and GBDT and closer to 1. Therefore, this model has the best fitting effect. The mean values of MSE and R2 of 100 model predictions and observations were obtained by cross-validation. The results show that the MSE of random forest is 2.566±1.734, smaller than KNN and GBDT, and its R2 is 0.373±0.563, higher than KNN and GBDT. The difference between the prediction results of random forest model and the observed values is smaller, so the prediction ability is the best. Therefore, the random forest model is superior to KNN and GBDT in all aspects, so the random forest model is adopted for follow-up research.
Figure 2. Performance comparison of three machine learning methods.
Preprints 118325 g002

2.3. Importance Ranking of Impact Factors

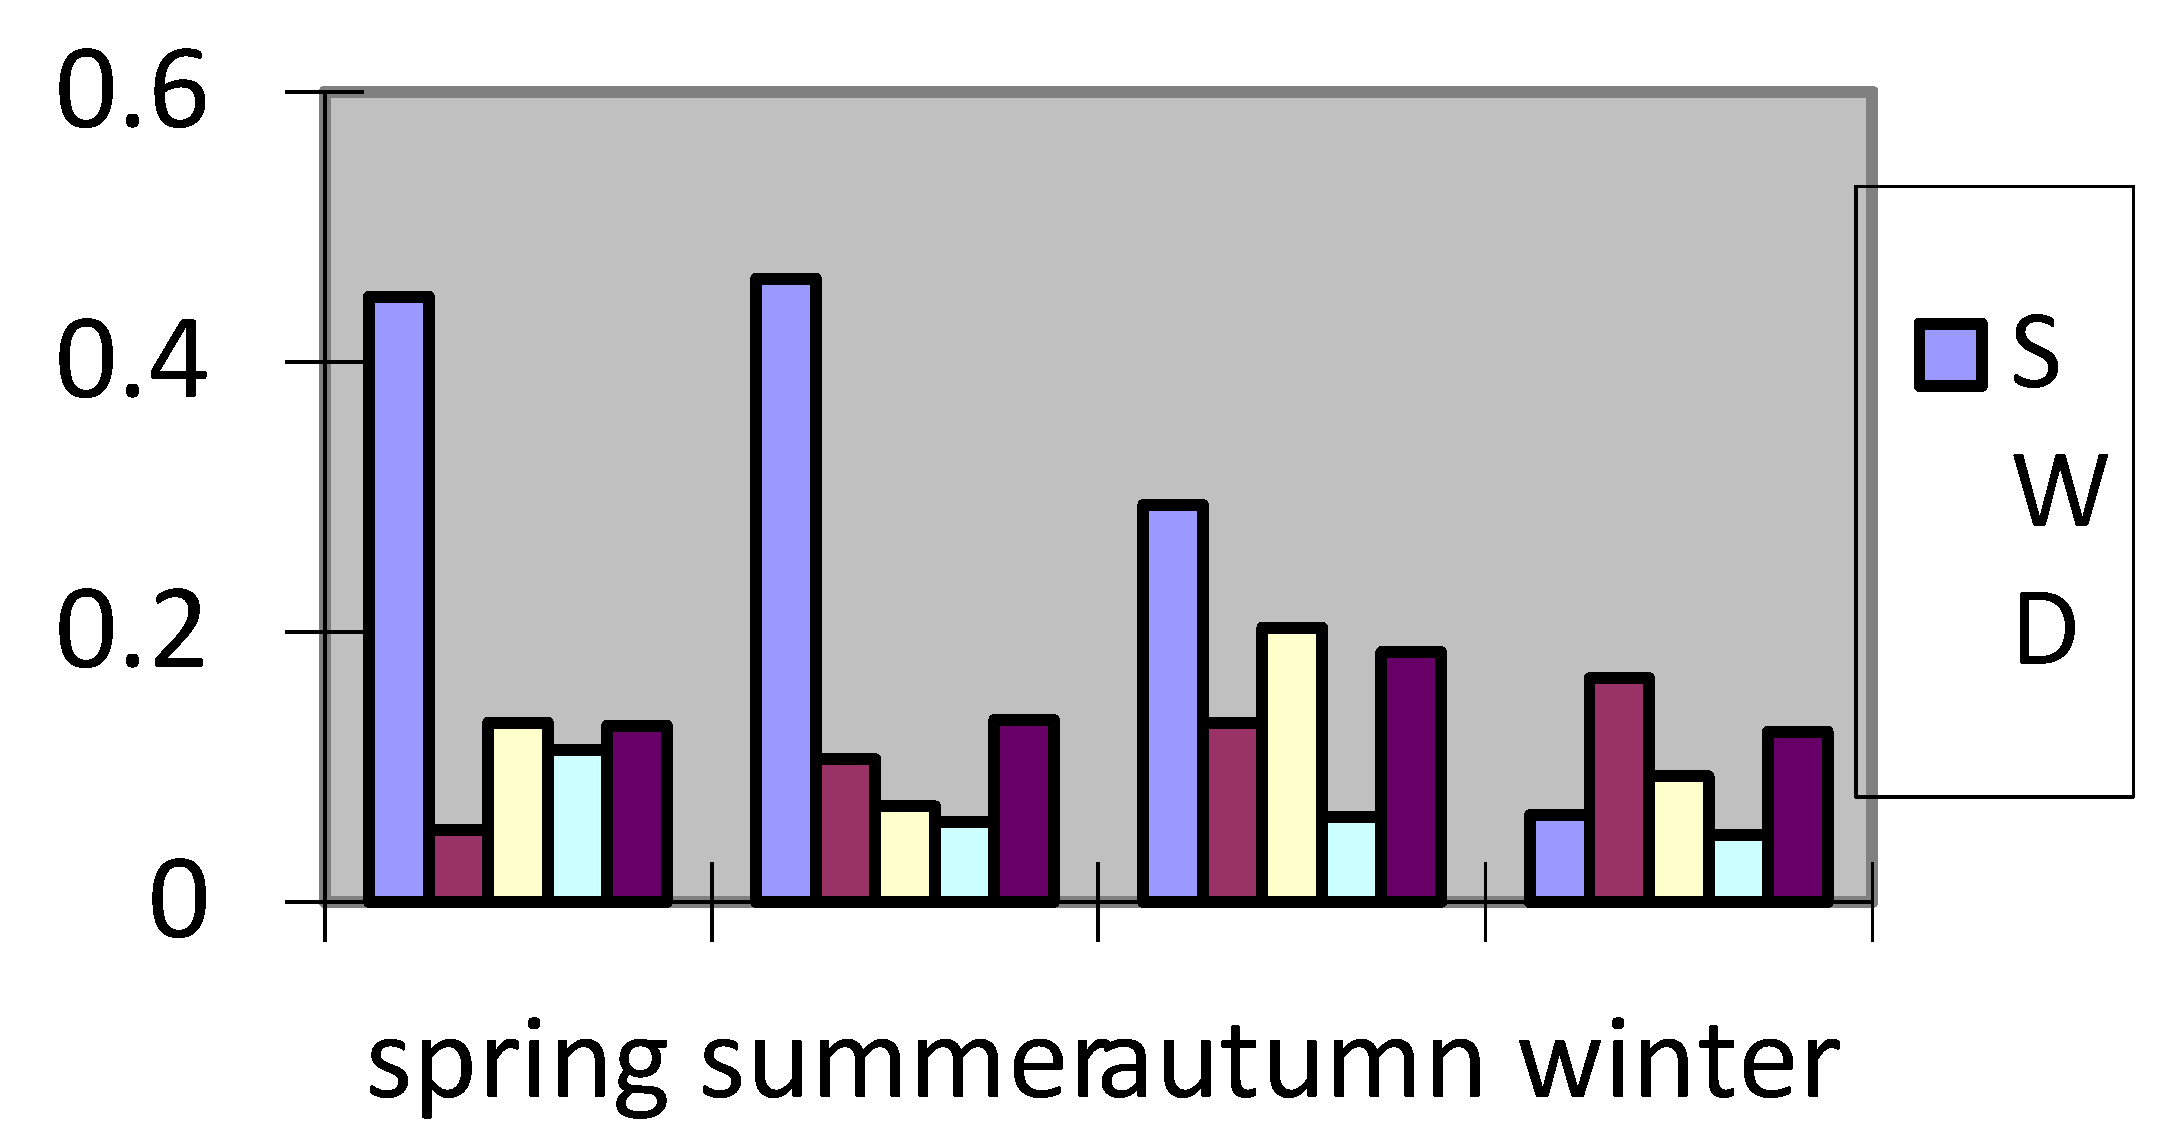
In RF, the contribution rate of a feature is usually calculated based on the number of node splits of the feature in the decision tree and the information gain obtained by splitting. The random forest model was constructed, and the input variables were SWD, SST, SBT, SSS, SBS, and the output variables were resource density. The results show that in the random forest model, the contribution rates of each impact factor to resource density in different months are shown in Figure 3.
The results show that SWD is the most important in May (spring), followed by SSS, SBT, SBS and SST;. SWD is the most important in August (summer), followed by SBT, SST, SSS and SBS;. SWD is the most important in November (autumn), followed by SSS, SBT, SST and SBS;. February (winter) SST is the most important, followed by SBT, SSS, SWD and SBS. It can be seen that among the five factors, SWD, SBT and SSS are relatively important.

2.4. Relationship between Trichiurus japonicus Distribution and Explanatory Variables

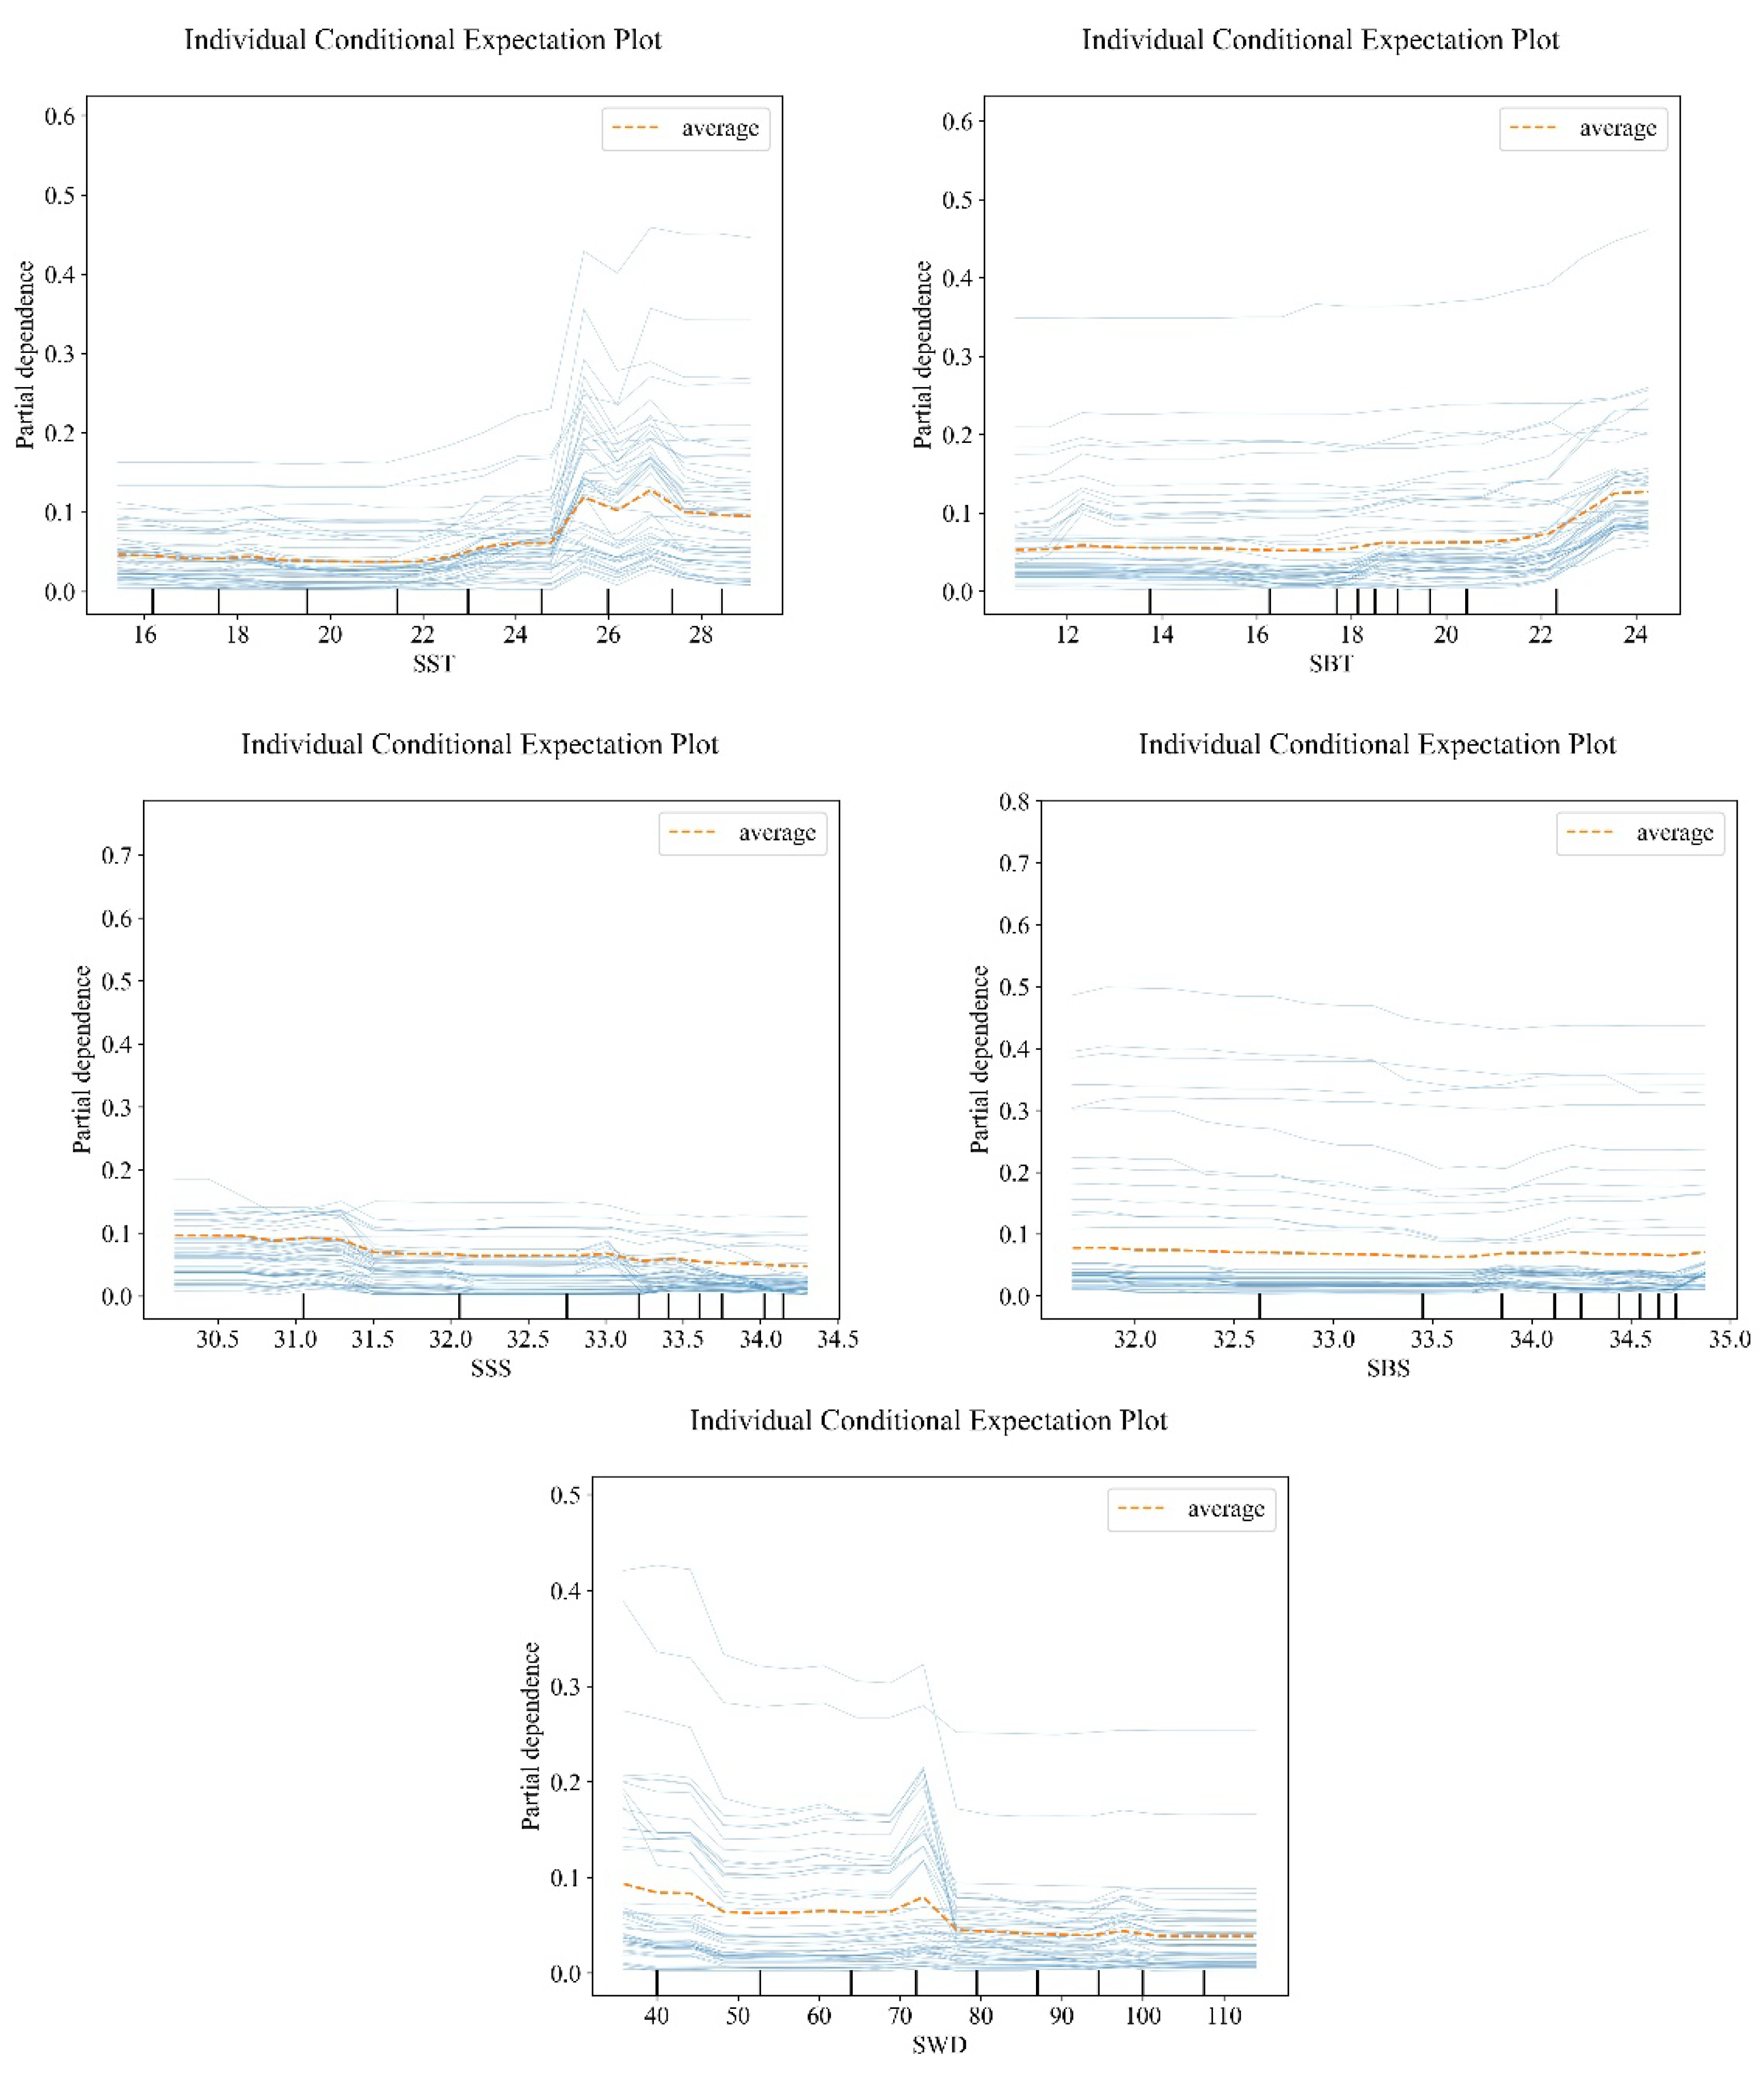
The influences of various factors on the relative resources of Trichiurus japonicus are shown in Figure 4. The relative resources of belt fish increased slowly when SST was less than 24.8℃, fluctuated after 24.8℃, and became stable after 27℃. The relative resources of Trichiurus japonicus increased slowly when the SBT was less than 22.2℃, and the increase rate increased after 22.2℃ and reached the maximum at 23.8℃, showing an overall increasing trend. The relative resources of Trichiurus japonicus increased when the SSS was less than 31.2‰, reached the maximum at 31.2‰, and decreased when the SSS was more than 31.2‰. The relative resource amount of Trichiurus japonicus showed a higher level when SBS was less than 33.3‰, and a lower level when SBS was more than 33.3‰, showing a decreasing trend in general. The relative resources of belt fish increased when SWD was less than 72 m, reached the maximum at 72 m, and decreased after 72 m.

2.5. Prediction of Habitat Distribution of Trichiurus japonicus in Central and Southern East China Sea and Yellow Sea

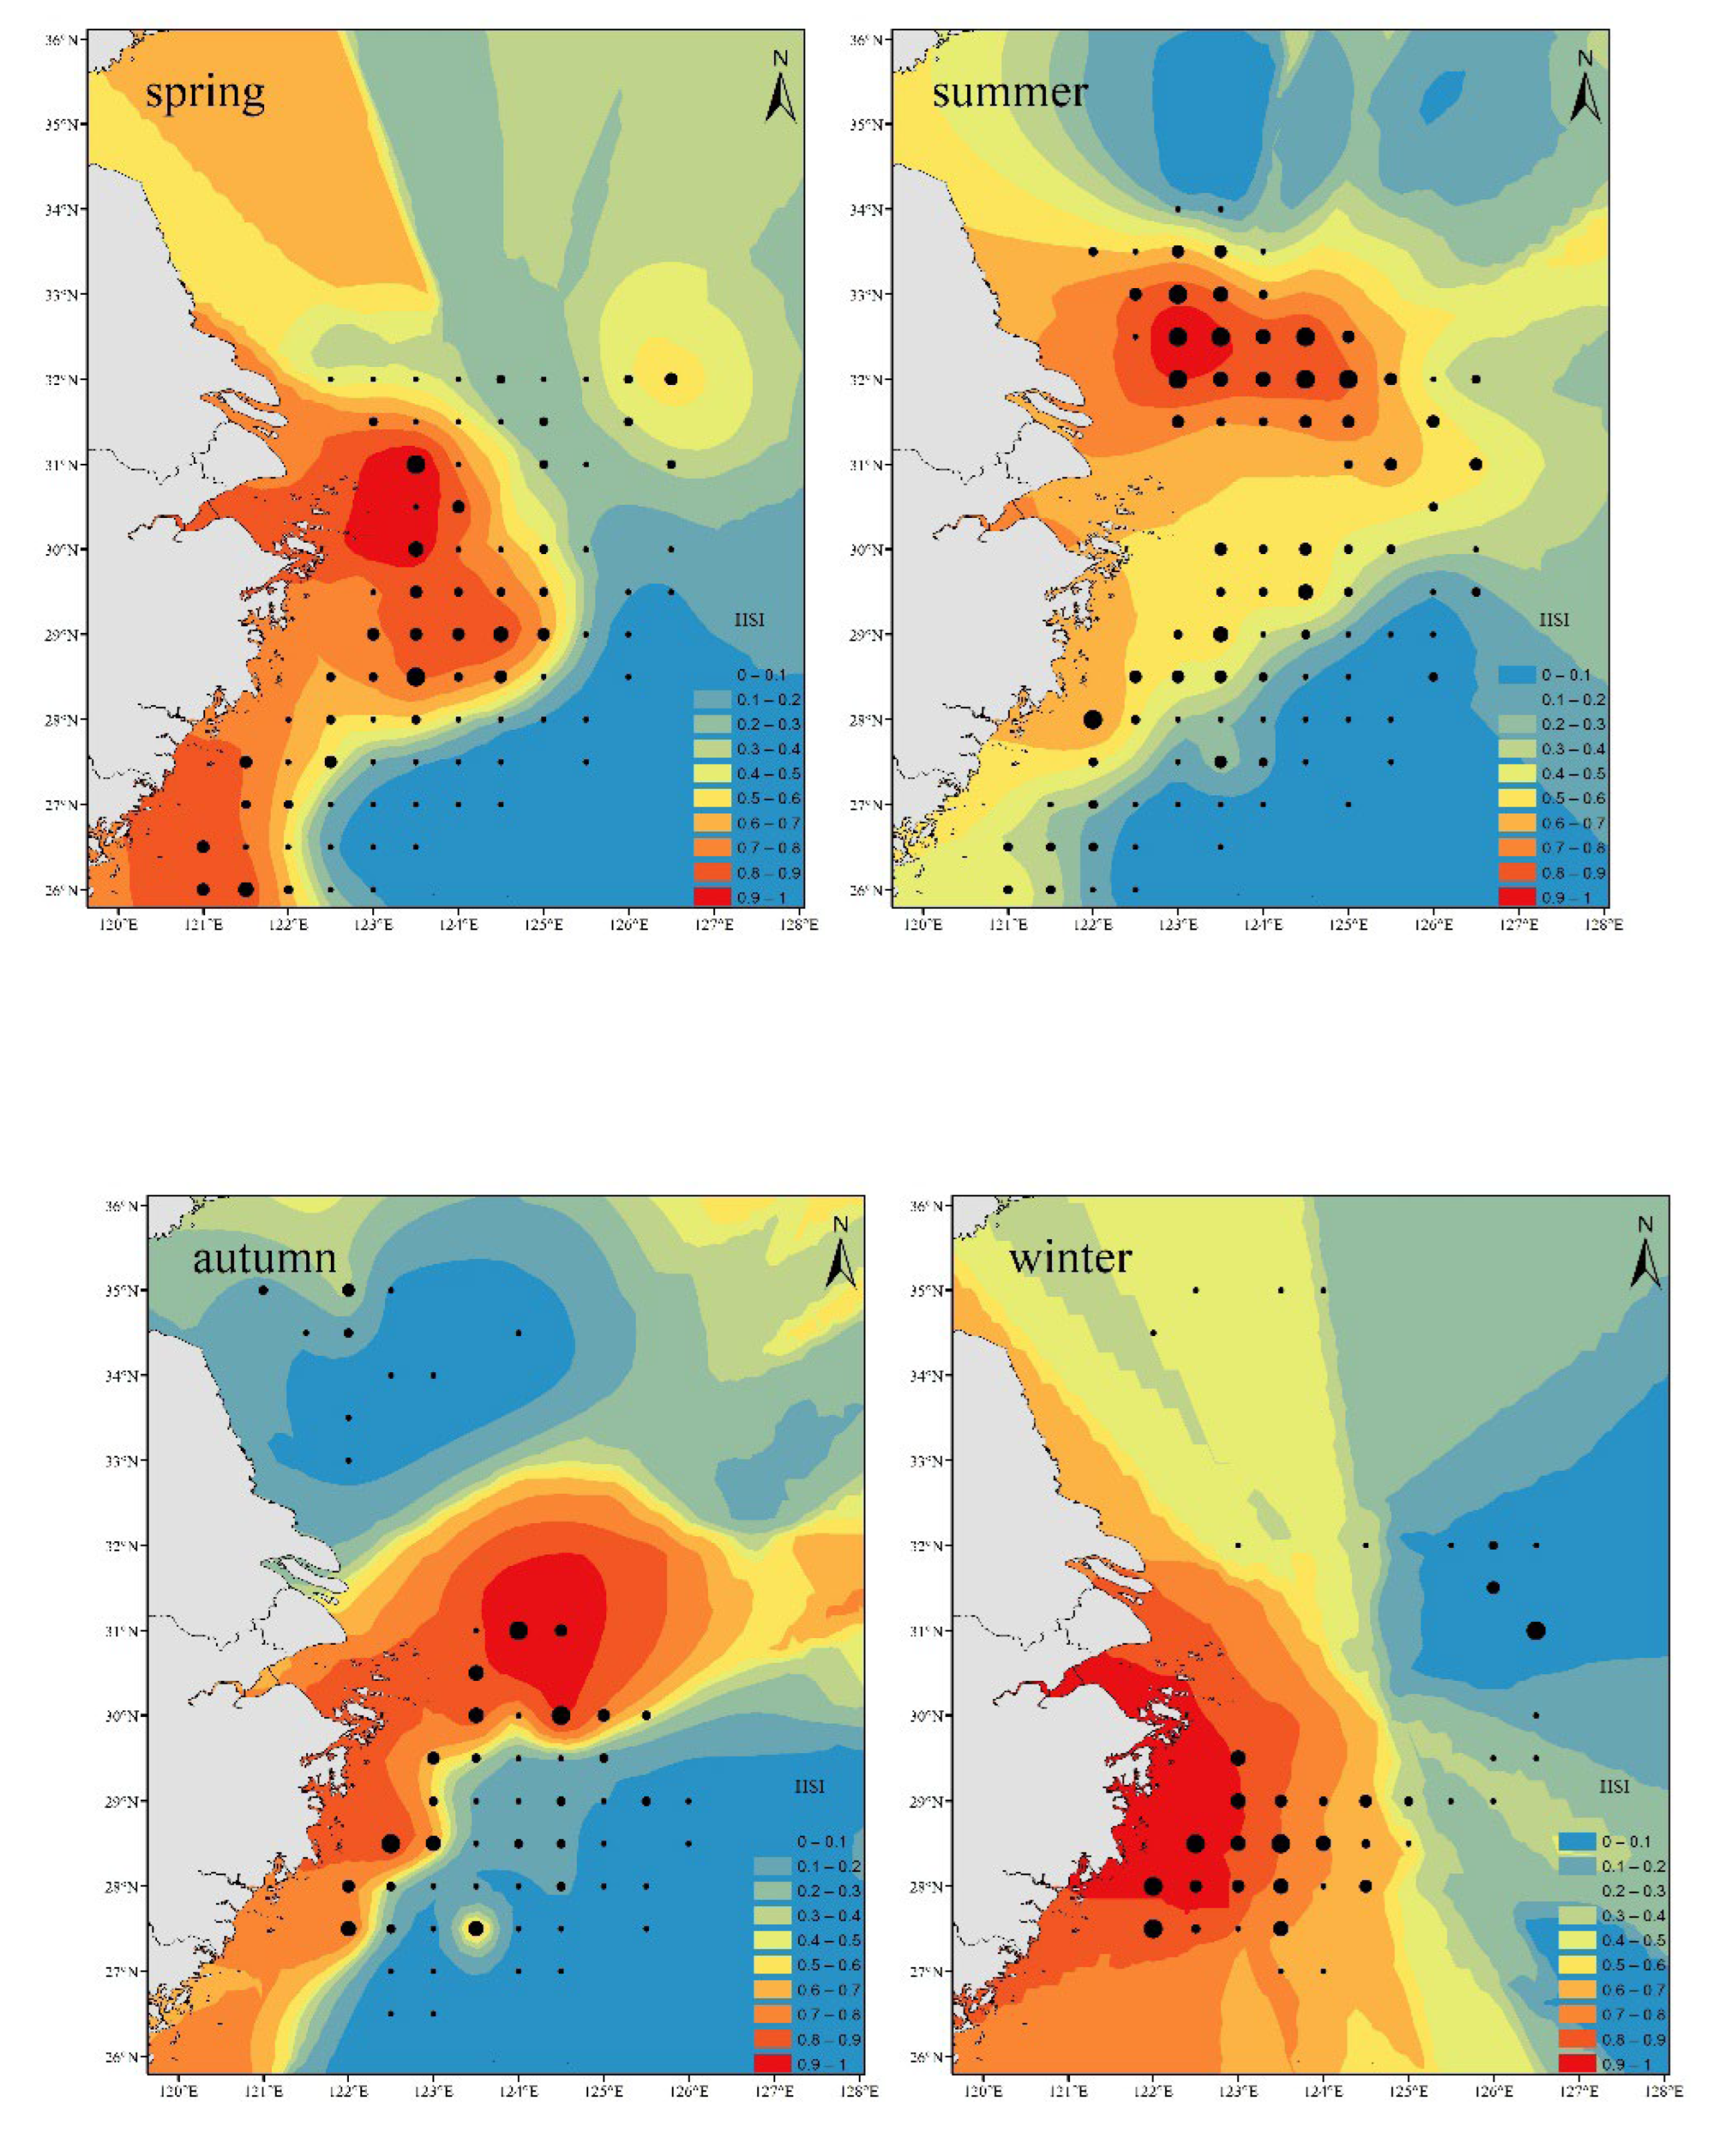
The prediction performance of the three models is compared, and it is found that the RF has the best prediction performance. The environmental data simulated by HSI is added to the random forest model for prediction, and the spatial distribution map is drawn. It is found that the abundance distribution of Trichiurus japonicus in May is high in the southwest and low in the northeast, mainly distributed in the sea areas of 25.5°~31.5°N and 119.5°~124°E; In August, the abundance of Trichiurus japonicus is mainly concentrated in the northwest waters, mainly distributed in the waters of 30.5°~33°N and 121°~125°E; In November, Trichiurus japonicus resources were mainly concentrated in the middle of the sea area, mainly distributed in the sea areas of 29 ~ 33 N and 122°~126°E; In February, the distribution of Trichiurus japonicus abundance showed the characteristics of high in the southwest sea area and low in the northeast sea area, mainly distributed in the sea areas of 27 ~ 30 N and 121°~124.5°E (Figure 5), which is consistent with the characteristics that Trichiurus japonicus likes to cluster in the warm environment near the bottom. In Figure 5, the predicted results are compared with the actual results, and it is found that the predicted results are close to the actual results, which shows that the predicted results have certain accuracy.

3. Discussion

3.1. Model Analysis

At present, there are few studies on the distribution of Trichiurus japonicus with species distribution model. Zhang [40] used GAM model to study the distribution characteristics of Trichiurus japonicus in Beibu Gulf from 2006 to 2018 and the relationship between its resource density and environmental factors. The results showed that the distribution of Trichiurus japonicus fishing grounds in Beibu Gulf was southwest-northeast, and the center of gravity of Trichiurus japonicus resources moved southwest-northeast and south-north in summer and autumn, respectively. Chlorophyll A affected the resource density and spatial distribution of Trichiurus japonicus, and abnormal values of water depth and longitude and sea surface temperature affected the resource density of Trichiurus japonicus but did not affect its spatial distribution. Liu[41] predicted the potential distribution areas of Trichiurus japonicus in the coastal waters of China in 2040-2050 and 2090-2100 by using nine species distribution models such as random forest based on the survey data of fishery resources from 1998 to 2000, and the prediction results showed that the distribution hotspots of Trichiurus japonicus tended to move to high latitudes, and the investigation stations in this study overlapped with those in this study, and the research simulation.
In this study, three machine learning models, RF, KNN and GLDT model, were compared, in order to choose the most suitable model to analyze the habitat distribution characteristics of Trichiurus japonicus in the central and southern parts of the East China Sea and the Yellow Sea and its relationship with environmental factors. The results show that the random forest model has good fitting effect and cross-validation result, which may be attributed to its advantages in data processing ability and algorithm. Firstly, random forest introduces the concept of randomness, and randomly selects training samples and feature subsets, thus effectively enhancing the classification ability and anti-noise ability, and reducing the possibility of over-fitting of random forest; At the same time, random forest can effectively deal with the situation of less data, lost features and unbalanced data sets, and has a high tolerance for outliers; In addition, the random forest model has the characteristics of integrated learning, and the accuracy of the results can be improved by constructing many different regression trees, avoiding the weak generalization ability of a single decision tree [21,22].
The utilization of the random forest model in the fisheries domain has been progressively increasing in recent years. In comparison to conventional species distribution models and other machine learning techniques, the random forest model can effectively capture the interaction between environmental variables through constructing a randomized decision tree [42]. Furthermore, it demonstrates greater robustness against outliers and random interference [20] during regression analysis. Luan[3] employed GLM, GAM, and the random forest model to evaluate the spatial distribution of Portunid crab across different seasons in Haizhou Bay in 2011. Liu[42] utilized both the random forest model and GAM model to analyze the relationship between krill catch per unit fishing effort and environmental factors in Antarctica. Cui[13] employed artificial neural network models, random forest models, and generalized enhanced regression models to predict and compare habitat distributions for Tetragnatha tetragnatha in Haizhou Bay. All the above results show that RF has good fitting effect and forecasting ability, and has certain advantages, which is similar to the results in this study.

3.2. The Influence of Environmental Factors on the Distribution of Trichiurus japonicus

The temporal and spatial differences of environmental factors are one of the main reasons for the temporal and spatial changes of fish resources, and fish usually distribute along the distribution characteristics according to environmental gradients [43]. In this study, the distribution characteristics of Trichiurus japonicus and its relationship with environmental factors were analyzed by random forest model. It was found that environmental factors have different effects on the distribution of Trichiurus japonicus in different seasons, and SWD, SSS and SBT are relatively important.
Water temperature is a very important environmental factor, which can directly affect the growth, development, reproduction, metabolism, migration and distribution of marine organisms and other ecological processes [44]. As a warm-temperate fish clustered near the bottom, the growth and reproduction of Trichiurus japonicus are directly affected by water temperature, so its distribution area will also be affected by water temperature [45,46,47]. Wang[45,46] found that the increase of water temperature is not only beneficial to the gonad development and maturity of Trichiurus japonicus, but also can increase the feed supply of Trichiurus japonicus. The fluctuation of Trichiurus japonicus catch in the East China Sea is significantly related to the sea surface temperature; Yuan[47] found that the hot spots of Trichiurus japonicus in the East China Sea will move adaptively with the first mode change of sea surface temperature, and they are all close to the left waters of the northern branch of Kuroshio; You[48] found that the bottom water temperature of the central fishing ground of Zhoushan fishing ground in summer flood was between 16℃ and 22℃, and the temperature at that time might be lower than now earlier in this research year, and this research only studied Trichiurus japonicus in summer flood, so the result was different from this research. It was found that the relative resources of Trichiurus japonicus were small when SST was less than 24.8℃, and obviously fluctuated and rose above 24.8℃, reaching the maximum at 27℃. SBT is small when it is less than 22.2 C, gradually increases when it is higher than 22.2 C, and reaches the maximum at 23.8 C, which indicates that Trichiurus japonicus has certain requirements on water temperature and is suitable for its survival in a certain temperature range. The relative resources of Trichiurus japonicus reached the maximum when SBT was 23.8℃, which indicated that the water temperature was suitable for Trichiurus japonicus survival. In the SBT range of 22.2 C ~ 24.2 C, the relative resources of Trichiurus japonicus are relatively large, and this temperature range is the suitable water temperature range for its life.
As one of the important environmental factors affecting the spatial and temporal distribution of marine life, salinity can affect the spatial distribution of marine life to a certain extent [49]. Previous studies have found that the fishing season of Trichiurus japonicus is directly affected by salinity [48,50]. You[48] found that the central fishing ground of Trichiurus japonicus in Zhoushan fishing ground is located near the 34‰ isosalinity line; Zhu[50] and others found that the zonal fluctuation of 34‰ isosalinity line was obviously related to the fishing ground in central Zhejiang in winter flood. Wang[51] found that sea surface salinity has a significant influence on the change of Trichiurus japonicus catch in Zhejiang sea area, and the Trichiurus japonicus catch shows a linear upward trend with the increase of sea surface salinity. The above research is earlier, which may lead to a gap between the results and the results of this study. This study found that the relative resources of Trichiurus japonicus were higher when SSS was less than 31.2‰, and lower after SSS was more than 31.2‰. It is higher when SBS is less than 33.3‰ and lower when SBS is more than 33.3‰, indicating that salinity will affect the distribution of Trichiurus japonicus resources. Too high or too low salinity in seawater may affect the osmotic pressure adjustment and oxygen consumption of Trichiurus japonicus, thus affecting its growth. The normal growth of Trichiurus japonicus needs to be carried out within a certain salinity range.
Water depth affects the changes of factors such as light, pressure and dissolved oxygen, and can indirectly affect the habitat distribution of marine life and its bait [13]. Water depth is closely related to water mass movement of fish community, processes related to fish life history (predation and competition) and bottom sediments [52]. Some studies have found that the depth of seawater directly affects the temporal and spatial changes of hydrological factors such as temperature, salinity and transparency, thus directly affecting the distribution of organisms and the aggregation of fish [18]. Hu[53] found that water depth is one of the main factors affecting the diversity of fish communities in Trichiurus japonicus reserve in spring and autumn; Zhang[54] found that water depth is one of the main environmental factors affecting the distribution of fish in the coastal waters of the Yangtze River Estuary, and the diversity of fish community and the distribution of fish may affect the feeding of Trichiurus japonicus, thus affecting the relative resources of Trichiurus japonicus to some extent. The above research results are similar to this study. In this study, the relative resources of Trichiurus japonicus showed an upward trend when SWD was less than 72 m, and a slow downward trend after SWD was higher than 72 m. This is consistent with Trichiurus japonicus's habit of clustering near the bottom, which shows that there is the most suitable habitat environment for Trichiurus japonicus in the sea area with water depth less than 72 m.

3.3. Habitat Distribution Characteristics of Trichiurus japonicus

The habitat distribution of Trichiurus japonicus in the central and southern parts of the East China Sea and the Yellow Sea is characterized by high resource density in the southwest coastal and central waters and low resource density in the southeast and northern waters in spring, mainly distributed in the waters of 27.5°~31°N and 122.5°~125°E; In summer, the coastal waters in the northwest and southwest are characterized by high resource density and low resource density in the southeast, which are mainly distributed in the sea areas of 28 ~ 30 N, 122°~124.5°E, 31.5°~33.5°N and 123°~125°E; In autumn, the resource density in the southwest coast and central sea area is high, while the resource density in the north and southeast sea area is low, mainly distributed in the sea areas of 27.5°~28.5°N, 121.5°~123.5°E, 30 ~ 31 N and 123.5°~125°E; In winter, the resource density in the southwest is high, and the resource density in other sea areas is low, mainly distributed in the sea areas of 27.5°~29.5°N and 122 ~ 124.5 E.. It can be found that with the increase of temperature, the distribution area of Trichiurus japonicus hotspots moves northward and outward, which is similar to the research conclusions of Yuan[47] and Zhu[50]. The distribution area of Trichiurus japonicus resource density hotspots spread to a certain extent with the seasonal changes and moved to the northern offshore, which is not only related to the rising water temperature in seasonal changes, but also related to the fact that the effective implementation of the summer fishing moratorium in the central and southern parts of the East China Sea and the Yellow Sea is beneficial to effectively replenish Trichiurus japonicus resources. According to the research of Yan[55], the summer fishing moratorium can protect the spawning groups and juveniles of major economic fish such as , reduce the fishing pressure, facilitate the cluster growth of Trichiurus japonicus, and make Trichiurus japonicus hotspots distributed. Using HSI index to predict the habitat distribution of Trichiurus japonicus in the East China Sea and the south-central Yellow Sea in four seasons can make up for some missing data.

4. Conclusions

By comparing three kinds of machine learning models, this study analyzed the habitat distribution characteristics of Trichiurus japonicus in the East China Sea and the central and southern Yellow Sea and its relationship with environmental factors. The following findings were found: (1) Random forest had better fitting effect and prediction ability in the three kinds of machine learning models; (2) Among the five environmental factors, SWD, SBT and SSS had a great impact on the habitat distribution of belt fish. The relative resources of belt fish increased with the increase of SBT, and increased first and then decreased with the increase of SWD and SSS. (3) Habitat index was used to predict the habitat of Trichiurus japonicus in the central and southern parts of the East China Sea and the Yellow Sea, and the predicted results were similar to the actual survey results. The study of the habitat distribution characteristics of Trichiurus japonicus in the East China Sea and the south Yellow Sea and its relationship with environmental factors can provide some reference for the sustainable utilization and scientific management of Trichiurus japonicus resources. In future studies, comparative statistical methods and machine learning methods can be tried to help explore models and methods that are more suitable for this species; In addition, this study only considered 5 environmental factors, namely SWD, SST, SBT, SSS and SBS, and did not involve other factors, such as dissolved oxygen, chlorophyll, pH, flow rate and mixed layer depth, which may affect the distribution of belt fish. More environmental factors and their effects on the habitat distribution of belt fish should be comprehensively analyzed. In order to understand the relationship between the habitat distribution characteristics and environmental factors of Trichiurus japonicus in the East China Sea and the Yellow Sea, and to provide reference for the protection and rational utilization of Trichiurus japonicus resources in the East China Sea and the Yellow Sea.

Author Contributions

Conceptualization, X.S. and W.Z.; methodology, W.Z.; writing—original draft preparation, X.S.; writing—review and editing, J.L. ,X.G and Z.K.; supervision, W.Z. and Z.W.; project administration, W.Z. and Z.L. All authors have read and agreed to the published version of the manuscript.

Funding

This study was supported by the National Key Research and Development Program of China(2019YFD0901505), Zhejiang Provincial Key R&D Program project(2018C02026) and Zhejiang Provincial Research Institutes Special Project(HYS-CZ-202405).

Institutional Review Board Statement

Not applicable.

Data Availability Statement

Data will be made available on request.

Acknowledgments

We thank the staff of Zhejiang Marine Fisheries Research Institute for their help and support in our experiment.

Conflicts of Interest

The authors declare that they have no competing interests.

References

  1. Zhang,Q.H.; Cheng, J.H.; Xu,H.X..Fishery Resources and Their Sustainable Utilization in The East China Sea. Shanghai:Fudan University Press. 2007,147-169.
  2. Cheng,J,H.; Yan,L.P.; Lin,L.S. Analyses on the fishery ecological effect of summer close season in the East China Sea region. Journal of Fishery Sciences of China. 1999, 4, 81-85.
  3. Luan,J.; Zhang;C.L.; Xu,B.D. Relationship between catch distribution of Portunid crab (Charybdis bimaculata)and environmental factors based on three species distribution models in Haizhou Bay.Journal of Fisheries of China. 2018, 42, 889-901.
  4. Jiang,Y.; Zhang,Y.L.; Pang,Z.W. Spatial distribution characteristics of sepia esculenta in haizhou bay and adjacent waters and their relationship with environmental factors. Acta Hydrobiologica Sinica. 2024, 48, 617-624.
  5. Planque B, Loots C, Petitgas P, et al. Understanding what controls the spatial distribution of fish populations using a multi-model approach. Fisheries Oceanography. 2011, 20, 1-17. [CrossRef]
  6. Chen,X.J. Fishery Resources and Fishery Oceanograghy. Beijing:China Ocean Press. 2014, 152-161.
  7. Guo,Y.L.; Zhao,Z.F.; Qiao,H.J. Challenges and development trend of species distribution model. Advances in EarthScience. 2020, 35, 1292−1305.
  8. Zhu,W,B.; Zhu,H.C.; Zhang,Y.Z. Quantitative distribution of juvenile Engraulis japonicus and the relationship with environmental factors along the Zhejiang coast. Journal of Fishery Sciences of China. 2021, 28, 1175-1183.
  9. Feng,B.; Chen,X.J.; Xu,L.X. Catch rate analysis of yellowfin tuna from longline fishery using generalized linear model in the Indian Ocean. Journal of Fishery Sciences of China. 2009, 16, 282-288.
  10. LI,Z.G.; WAN, R.; YE,Z.J. Use of random forests and support vector machines to improve annual egg production estimation. Fisheries Science. 2017, 83, 1-11. [CrossRef]
  11. HARALABOUS J; GEORGAKARAKOS S. Artificial neural networks as a tool for species identification of fish schools. ICES Journal of Marine Science. 1996, 53, 173-180. [CrossRef]
  12. Yang,S.L.; Zhang,Y.; Zhang,H. Comparison and analysis of different model algorithms for CPUE standardization in fishery. Transactions of the Chinese Society of Agricultural Engineering. 2015, 31, 259-264.
  13. Cui,Y.H.; Liu,S.D.; Zhang,Y.L. Habitat characteristics of Octopus ocellatus and their relationship with environmental factors during spring in Haizhou Bay, China.Chinese Journal of Applied Ecology. 2022, 33, 1686-1692. [CrossRef]
  14. Xu,M.Z.; Zhang,C.L.; Xue,Y. Relationship between species diversity and environmental factors in the fishery community of Shandong coastal waters. Journal of Fisheries of China. 2022, 46, 1008-1017.
  15. Chen,X.Z.; Fan,W.; Cui,X.S. Fishing ground forecasting of Thunnus alalung in Indian Ocean based on random forest. Acta Oceanologica Sinica(in Chinese). 2013, 35, 158-164.
  16. Hou,J.; Zhou,W.F.; Fan,W. Research on fishing grounds forecasting models of albacore tuna based on ensemble learning in South Pacific. South China Fisheries Science. 2020, 16, 42-50.
  17. Gao,F. Fishing ground forecasting of chub mackerel in the East China Sea and Yellow Sea using boosted regression trees.Shanghai Ocean University. 2016.
  18. Song,L.M.; Ren,S.Y.; Zhang,M. Fishing ground forecasting of bigeye tuna (Thunnus obesus) in the tropical waters of Atlantic Ocean based on ensemble learning. Journal of Fisheries of China. 2023, 47, 64-76.
  19. General Administration of Quality Supervision, Inspection and Quarantine of the People's Republic of China, Standardization Administration of China. Specification for Marine survey-Part 6:Marine biological survey. Beijing: Standards Press of China. 2008.
  20. Breiman L. Random forests. Machine Learning. 2001, 45, 5-32.
  21. Fang,K.N.; Wu,J.B.; Zhu,J.P. A Review of Technologies on Random Forests. Statistics & Information Forum. 2011, 26, 32-38.
  22. Dong.S.S.; Huang,Z.X. A brief theoretical overview of Random Forests. Journal of integration technology. 2013, 2, 1-7.
  23. Zhang,D. Vehicle logo recognition based on Convolutional Neural Network and K-Nearest Neighbor. Xidian University. 2015.
  24. Li,X.; Zhang,C.L. Analysis of LocalLDtree classification model based on K proximity algorithm.Silicon Valley. 2013, 6, 33+146.
  25. Ming,Y.S. Using clustering to improve the KNN-based classifiers for online anomaly network traffic identification. Journal of network and computer applications. 2011, 34, 722-730.
  26. Malunoud,M.; Chokri,B.A. Classification improvement of local feature vectors over the KNN algorithm. Multimedia tools and applications. 2013, 64, 197-218.
  27. Jagan,S.; Hanan,S.; Amitabh,V. A fast all nearest neighbor algorithm for applications involving large point clouds. Computers & amp; graphics. 2007, 31, 157-174.
  28. Friedman,J.H. Greedy functionapproximation:A gradient boosting machine. Annals of Statistics. 2001, 29, 1189-1232.
  29. Gao,J.X.; Zhang,W.; Gao,M. Material calculation time prediction model based on gradient boosting decision trees. Software Guide. 2024,23, 15-20.
  30. Zhu,Y.L.; Feng,X.Y.; Yan,Q.G. Spatial distribution and main controlling factors of soil organic carbon under cultivated land based on GBDT model in black soil region of Northeast China. China Environmental Science. 2024, 44, 1407-1417. [CrossRef]
  31. Kabacoff,R. R in Action:Data Analysis and Graphics with R. Greenwich: Manning Publications. 2011, 8, 126-131.
  32. Hyndman,R.J.; Koehler,A.B. Another look at measures of forecast accuracy. International Journal of Forecasting. 2006, 22, 679-688. [CrossRef]
  33. Li,J.W.; Chen,C.H.; Sun,Y. Total partial regression sum of squares method for variable selection in multiple linear regression models. Journal of Mathematical Medicine. 2007, 126-127.
  34. Xu,B.D.; Zhang,C.L.; Xue,Y. Optimization of sampling effort for a fishery-independent survey with multiple goals. Environmental Monitoring and Assessment. 2015, 187,252.
  35. Shim,J.S.; Kim,R.K.; Yoon,K.B. A basic research for the development of habitat suitability index model of Pelophylax chosenicus. Journal of the Korean Society of Environmental Restoration Technology. 2020, 23. 49 -62.
  36. Tian,S.Q.; Chen,X.J.; Chen,Y. Evaluating habitatsuitability indices derived from CPUE and fishing effortdata for Ommatrephes bratramii in the northwesternPacific Ocean. Fisheries Research. 2009, 95, 181-188.
  37. Gong,C.X.; Chen,X.J.; Gao,F. Review on habitat suitability index in fishery science. Journal of Shanghai Ocean University. 2011, 20, 260-269.
  38. Chen,F.; Li,N.; Fang,Z. Habitat distribution change pattern of Uroteuthis edulis during spring and summer in the coastal waters of Zhejiang Province. Journal of Shanghai Ocean University. 2021, 30, 847-855.
  39. Tanaka,K.; Chen,Y. Spatiotemporal variability of suitablehabitat for American lobster(Homarus americanus)Long Island Sound. Jpurnal of Shellfish Research. 2015. 34, 531-543.
  40. Zhang,M.; Wang,X.H.; Cai,Y.C. Spatial aggregation and dispersion characteristics of Trichiurus haumela in the Beibu Gulf, northern South China Sea. Journal of Fishery Sciences of China. 2022, 29, 1647-1658.
  41. Liu,X.Y. Study on the impacts of climate change on the potential suitable habitat of major commercial fish in offshore China. Zhejiang Ocean University. 2022.
  42. Liu,J.C.; Jia,M.X.; Feng,W.D. SpatialTemporal Distribution of Antarctic Krill (Euphausia superba)Resource and lts Association with Environment FactorsRevealed with RF and GAM Models. Periodical of Ocean University of China(Natural science edition). 2021, 51, 20-29.
  43. Prchalova,M.; Kubecka,J.; Vašek,M. Distribution patterns of fishes in a canyon shaped reservoir. Journal of Fish Biology. 2008, 73:54-78. [CrossRef]
  44. Zou,Y.Y.; Xue,Y.; Ma,Q.Y. Spatial distribution of Larimichthys polyactis in Haizhou BayBased on Habitat Suitability Index. Periodical of Ocean University of China(Natural science edition). 2016, 46, 54-63.
  45. Wang,Y.Z.; Jia,X.P.; Lin,Z.J. Responses of Trichiurus japonicus catches to fishing and climate variability in the East China Sea. Journal of Fisheries of China. 2011, 35, 1881-1889.
  46. Wang,Y.Z.; Qiu,Y.S. An analysis of interannual variations of hairtail catches in East China Sea. South China Fisheries Science. 2006, 16-24.
  47. Yuan,X.W.; Liu,Z.L.; Jin,Y. Inter-decadal variation of spatial aggregation of Trichiurus japonicus in East China Sea based on spatial autocorrelation analysis. Chinese Journal of Applied Ecology. 2017, 28, 3409-3416(in Chinese).
  48. You,H.B.; Xu,R. Relationship between central fishing ground and water temperature and salinity in summer season. Marine Fisheries. 1984, 165-167.
  49. Dai,L.B.; Chen,J.H.; Tian,S.Q. Prediction of fish species richness in the Yangtze River estuary using CART algorithm. Journal of Fishery Sciences of China. 2018, 25, 1082-1090. [CrossRef]
  50. Zhu,D.K.; Yu,C.G. The relation on the environment of fishing groundwith the occurrence of hairtail in winter offthe middle part of Zhejiang. Journal of Fishery Sciences of China. 1987, 195-203.
  51. Wang,T.Z.; Han,Q.; Luo,N.J. Catches of several major demersal fish species catches inhabiting Zhejiangsea area and their relationships with main influencing factors. Transactions of Oceanology and Limnology. 2021, 43, 77-85.
  52. Azevedo,M.; Araújo,F.; Cruz-Filho,A.; Pessanha,A.; Silva,M.; Guedes,A. Demersal fishes in a tropical bay in southeastern Brazil:Partitioning the spatial, temporal and environmental components of ecological variation. Estuarine, Coastal and Shelf Science, 75, 468-480.
  53. Hu,C.L.; Zhang,H.L.; Zhang,Y.Z. Fish community structure and its relationship with environmentalfactors in the Nature Reserve of Trichiurus japonicus. Journal of Fisheries of China. 2018, 42, 694-703.
  54. Zhang,Y.Q. Environmental impact on the fish assemblage structure s dissertation submitted to in Adjacent Sea area of the Yangtze River estuary.Graduate School of Oceanology, Chinese Academy of Sciences. 2012.
  55. Yan,L.P.; Liu,Z.L.; Li,S.F. Effects of new summer close season of traw l fisheries onfishery ecology and resource enhanca ent in East China Sea. Marine Fisheries. 2010, 32, 186-191.
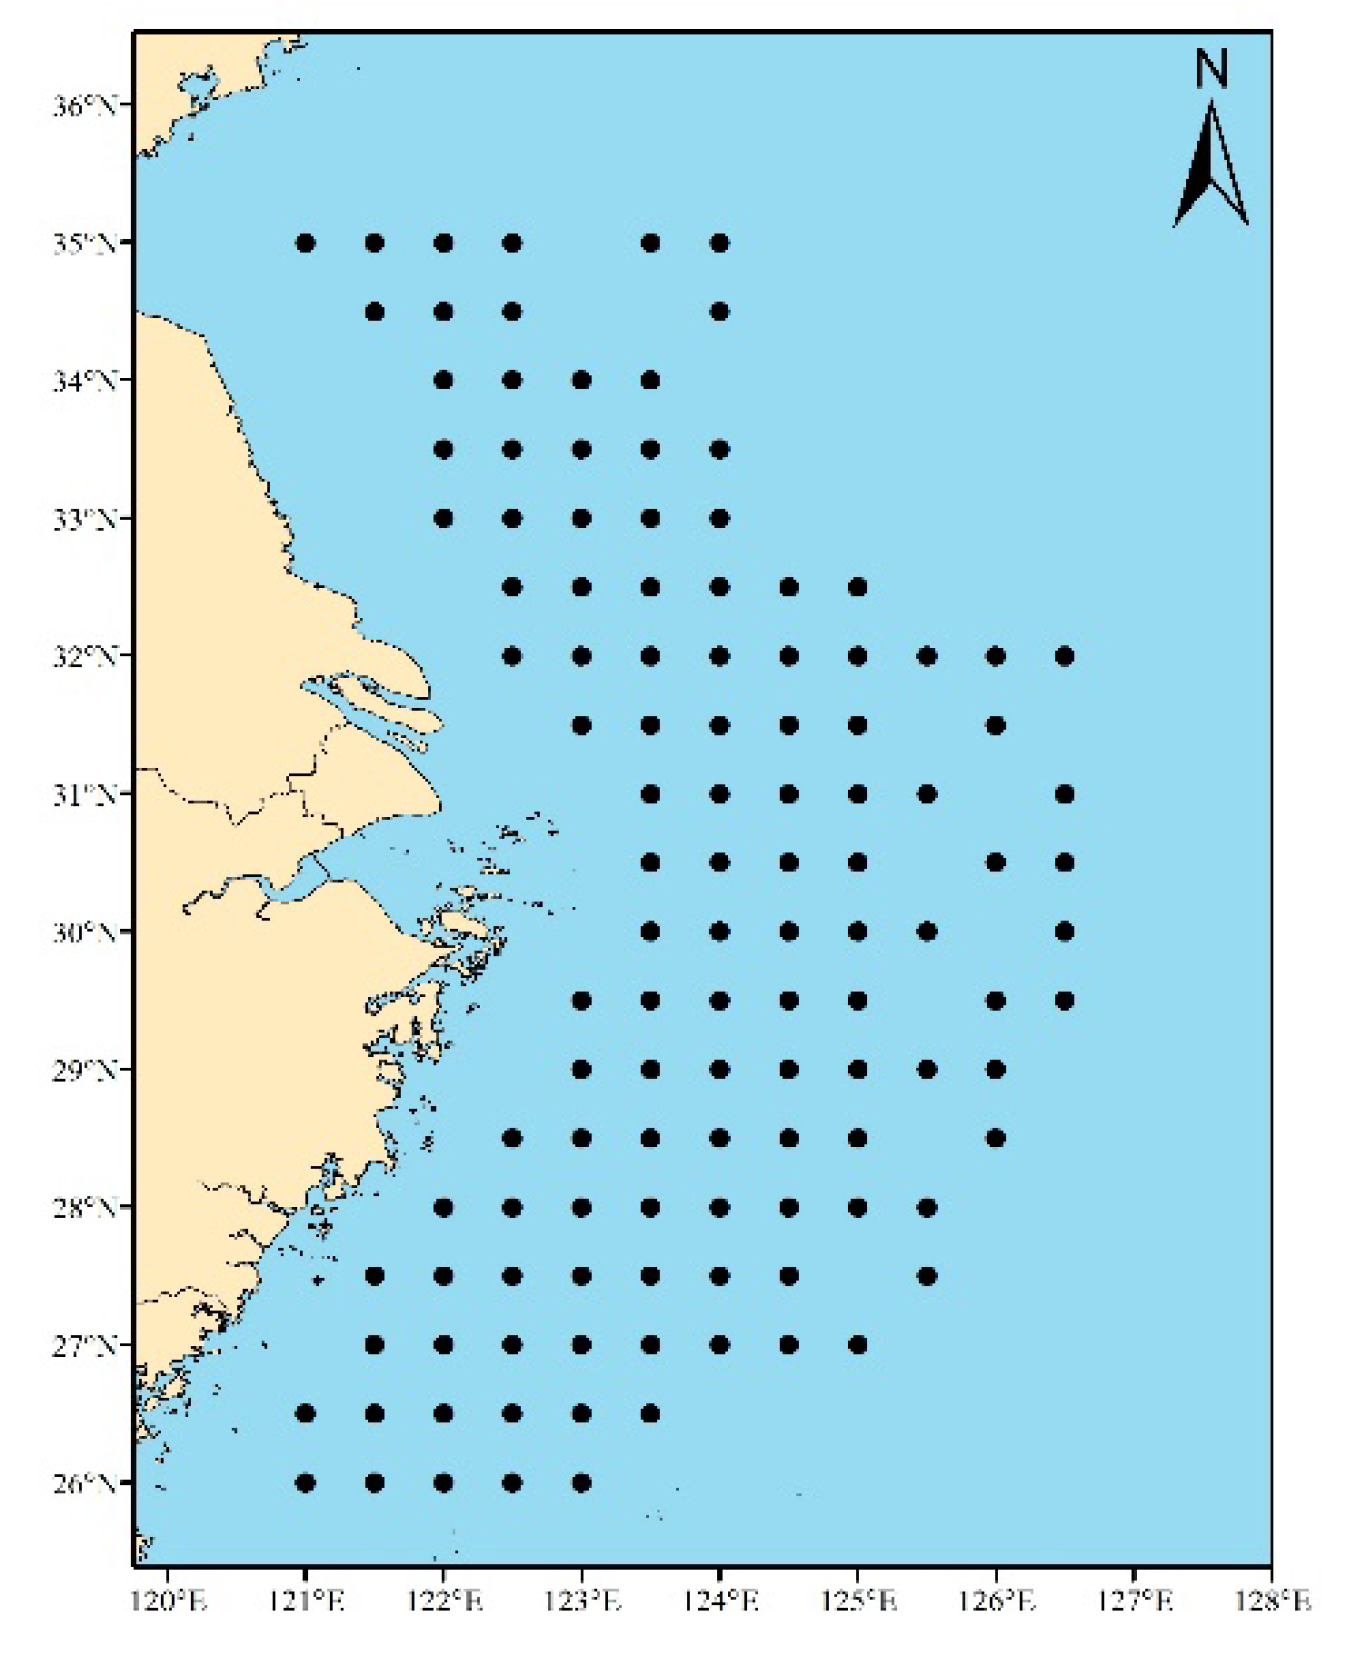
Figure 1. Survey stations.
Preprints 118325 g001
Figure 3. Importance ranking of factors affecting the density distribution of Trichiurus japonicus.
Preprints 118325 g003
Figure 4. Impact of environmental factors on the relative resource of Trichiurus japonicus.
Preprints 118325 g004
Figure 5. Simulated habitat and actual survey site of Trichiurus japonicus in different seasons.
Preprints 118325 g005
Table 1. Cross-validation comparison between three models.
Inspection method Statistical parameters RF KNN GBDT
Model fitting MSE 0.348 2.120 2.445
R2 0.919 0.506 0.431
Cross validation SE 2.566±1.734 3.295±2.161 3.004±1.264
R2 0.373±0.563 0.203±0.385 0.275±0.255
Disclaimer/Publisher’s Note: The statements, opinions and data contained in all publications are solely those of the individual author(s) and contributor(s) and not of MDPI and/or the editor(s). MDPI and/or the editor(s) disclaim responsibility for any injury to people or property resulting from any ideas, methods, instructions or products referred to in the content.
Copyright: This open access article is published under a Creative Commons CC BY 4.0 license, which permit the free download, distribution, and reuse, provided that the author and preprint are cited in any reuse.
Prerpints.org logo

Preprints.org is a free preprint server supported by MDPI in Basel, Switzerland.

Subscribe

© 2024 MDPI (Basel, Switzerland) unless otherwise stated