1. Introduction
The development of circadian clocks and the adaptation to the 24-hour light-dark cycle took place under natural conditions long before the invention of electricity and the use of light sources other than the sun. Circadian clocks are internal biological mechanisms that regulate the circadian rhythm of various physiological processes in living organisms, including humans. In fact, indoor work environments typically have significantly different lighting characteristics than outdoor environments [
1]. These differences co-determine the personal light exposure of occupants, which in turn can affect their health and well-being. Differences include temporal and spatial dynamics, spectrum, and intensity of light. Outdoors, we would be exposed to strong illuminance contrasts. Compared to static lighting indoors (static ~500 lx [
1,
2]), a sunny day at noon can be a hundred million times brighter than a moonless night. Numerous studies have verified the effects of light on physiology (e.g., sleep-wake timing, hormone release; [
3,
4,
5,
6], and metabolic processes [
7,
8]). Additionally, light influences behavioral functions such as alertness, mood, and cognitive performance [
9,
10,
11,
12,
13,
14,
15]. How the results of laboratory studies translate to the real world, however, is not yet fully understood since there is a lack of field studies investigating light effects on humans [
16]. Open questions include, if can we collect enough light with a bright “daylight shower” within a few minutes, or if we should collect lower but sufficient continuous light levels throughout the day to support a healthy lifestyle. Is it the time above certain thresholds, the total light dose (the AUC - area under the curve), the median, the mode, or the mean illuminance what matters? Although the full implications are still being explored, tracking light exposure over extended periods using wearable light loggers is crucial for gaining real-world insights and linking these patterns to physiological outcomes. Early evidence from field studies has shown that the availability of natural light can significantly impact sleep quality and sleepiness: Office workers with access to windows report better sleep quality than those without [
17]. Sleep quality tends to improve as daylight availability increases, particularly in summer when days are longer and brighter [
18]. More light during the day, especially for durations above certain thresholds such as 1 000 lx or 2 500 lx at eye level, was associated with better sleep quality [
19]. In addition, previous exposure to light for several hours was associated with less subjective sleepiness, with brighter light during the late sleep phase and after waking being associated with less early morning sleepiness [
20]. To be able to give better advice on lighting behavior, such as whether it is better to spend short periods outdoors in bright light or to spend the whole day in moderately high illuminance, we need to back up these findings with more evidence. Recently, the assessment of light history with light loggers has been recommended as a key step to improve the reproducibility of NIF (non-image-forming) effects on sleep and circadian measures [
21]. Recorded metrics should include the melanopic Equivalent Daylight Illuminance (mEDI) [
22] along with auxiliary data to identify periods of non-wear (e.g., tilt angle of the device) [
23].
Acceptance of light loggers is essential to ensure their correct and consistent use. If wearers find them uncomfortable, socially awkward to wear, or cumbersome, the likelihood of non-compliance increases, which in turn compromises data quality. While wrist-worn devices are less obtrusive, they have limited reliability for accurately assessing the light dose at the eye, which is critical for understanding the non-image-forming (NIF) effects of light. This discrepancy occurs because wrist-worn sensors capture light from a different plane [
24,
25,
26]. The accuracy of wrist-worn devices is not only affected by the different measurement positions but also by potential obstruction by clothing, leading to significant deviations from the actual light exposure at the eye [
27], partly dependent on climate and weather. This limitation is particularly important in the evening when small variations in ambient lighting can profoundly affect NIF effects [
28]. Therefore, to obtain the most relevant and reliable data, these devices must measure the light received as close as possible to the eye [
23,
29,
30].
While the accuracy of a measuring device is very relevant, acceptance as a non-functional requirement is also important. Regardless of its accuracy, if a device is not fully accepted by a participant or their environment, it may not be used consistently. A participant’s wear compliance, however, is also influenced by factors such as how the device was introduced to them and their motivation to participate in a study (e.g., intrinsic motivation or compensation). Light dosimeters attached to spectacle frames are highly visible, which can cause discomfort or self-consciousness in participants [
31]. This factor might be particularly important for people who do not normally wear glasses, as they may find devices attached to glasses even more cumbersome, leading to lower compliance rates. In addition, prolonged use in multi-day studies that require continuous wear of light dosimeters may result in higher dropout rates or non-compliance, compromising the integrity of the data collected. Understanding the challenges users face is essential for designing more universally acceptable devices. Researchers can design studies with better compliance strategies and improve data quality by understanding the likelihood of non-compliance and the specific challenges participants face. In this project, we systematically evaluated factors influencing the usability and acceptability of the light dosimeter “lido” [
29], focusing on its practical use in field studies. These factors provide evidence-based advice to researchers. In addition, the findings will inform future improvements in the design of light dosimeters to increase their convenience and usability for diverse participant groups. Although the cleaning of recorded light exposure data is a critical step when assessing personal light exposure, there is a notable lack of systematic studies investigating appropriate cleaning methods [
23]. In our study, we implemented four steps to clean the recorded data.
2. Results
2.1. Reasons for Not Wearing the Dosimeter
Reasons for not wearing a lido varied widely and were categorized using thematic analysis [
32]. The full list of reasons is provided in the supplement S1. Common reasons included for example attending public events such as business dinners, conferences, presentations, going out, and meetings (summarized as “public” below). Reasons for not wearing outside of sleeping and showering were:
Most participants (n=16) reported not wearing the device for few hours. Possible answers for non-wear time in the form were few minutes, few hours and several hours. The objectively assessed non-wear time for these participants was 51% of the total recording time (total recording time in this case includes the recording time during sleep). 10 participants reported removing the lido for only few minutes. The objectively assessed data shows that these participants did not wear the Lido for 41% of the total recorded time. Only three participants reported removing the lido for several hours. For these participants, the objective data shows that they did not wear a lido for 60% of the total recorded time.
Notably, none of the participants completely forgot to wear the light dosimeter. Participants provided specific reasons in their diaries when the devices were not worn. There was only one case where a participant forgot to document the period of non-wearing. Participants were diligent about wearing the dosimeter and pressing the trigger button when they removed the device. This was controlled through analysis of the tilt data, light measurements (e.g., the mEDI - melanopic Equivalent Daylight Illuminance), and the trigger events.
2.2. Feedback about the Usability of the Devices
Participants often noted that they received skeptical looks from bystanders in public, presumably because the device’s appearance resembled that of a camera, as participants reported. This led to privacy concerns and unwanted attention. On the positive side, some participants noted that the device sparked interest in the study, with some people expressing a desire to participate.
Many participants mentioned that the device (with a weight of 27 g) caused an imbalance when attached to their glasses, particularly when walking. This imbalance affected their comfort and ease of movement. Other aspects of wearing the device were generally well tolerated, although continuous wear over several days was challenging for some due to the lack of overall comfort (see supplement S1 for details). The thematic analysis revealed the following key aspects:
Many looks from others (18x)
Interest of others (15x)
Looks like a camera (14x)
Imbalance (5x)
Positive reactions from others (3x)
Does not look good (2x)
Glasses pinch (2x)
You get used to wearing it (1x)
LED flashes too bright in the dark (1x)
No reaction from strangers (1x)
Awareness of personal light exposure (1x)
Kelly & Gilbert (2018) [
33] applied the WEAR Score to collect data on the social acceptance of wearable devices, worn at different positions on the body, from participants in studies conducted in the Midwest and Silicon Valley, USA. The results of this study can be compared to those of Kelly & Gilbert (2016) [
34], although it is important to note the different Likert-type scales: Kelly & Gilbert (2018) used a 6-point scale, while this study uses a 5-point scale with a neutral midpoint of 3 = “neither”. As a result, a direct comparison of the WEAR Scores is only possible with certain limitations. The comparable, linearly transformed WEAR Score of this study into the 6-point scale is 3.50 (between 3 = “somewhat disagree” and 4 = “somewhat agree”, in other words neutral), versus 3.55 in Kelly & Gilbert (2018). However, this study’s standard deviation (SD) of the WEAR Score is significantly larger at 1.21, which can be attributed to a smaller sample size (n = 29).
For comparison with Balajadia et al. (2023), the WEAR Score of this study was also linearly transformed into the 7-point scale and resulted in 4.60 (between 4 = “neither agree nor disagree” and 5 = “somewhat agree”), which is significantly higher than the WEAR Score of 4.00 in Balajadia et al. (2023).
2.2. Recording Times and Wear Compliance
Due to technical issues, we recorded 3 031 h out of a potential 3 480 h (29 participants x 24 hours x 5 days). During that recorded time, lidos were worn for 1 569 h, representing 52% of the total recording time (total recording time includes ~ 8h recording during nighttime when the lido was placed next to the bed). During waking hours lidos were worn 89% of the recording time.
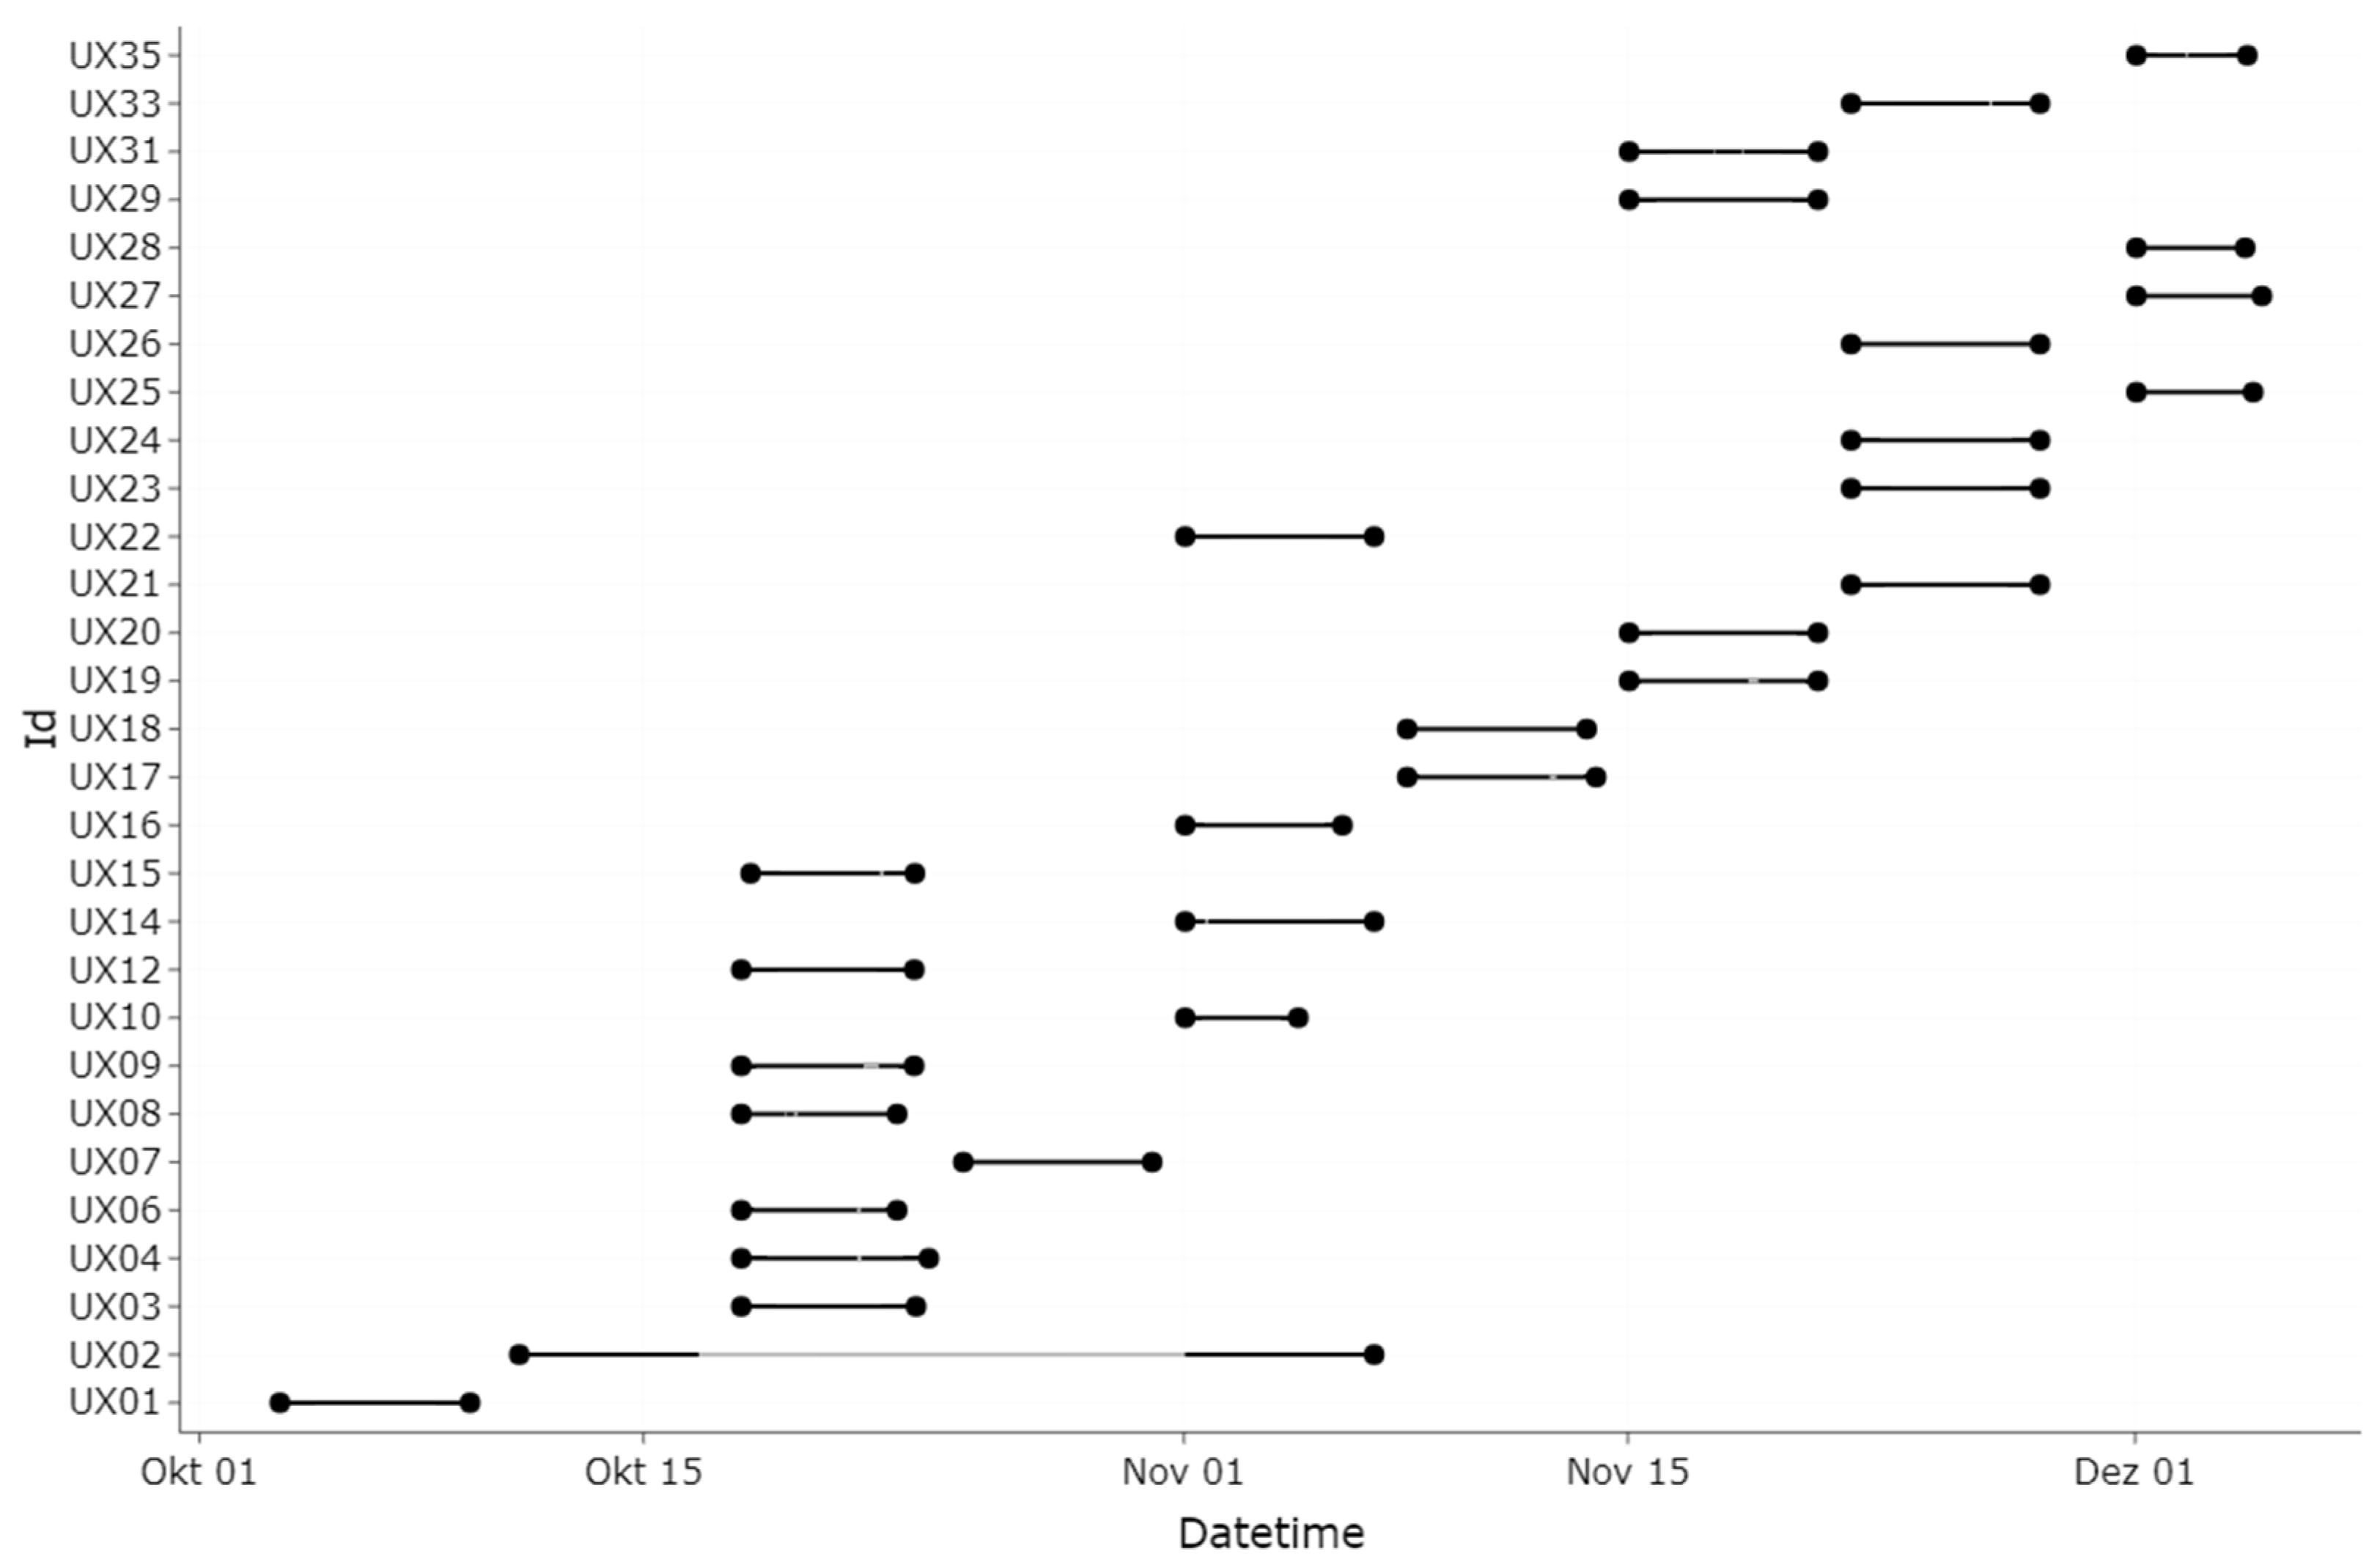
Figure 1 depicts an overview of the recording times and the wear compliance. The total wear time in the evening on weekdays was 164 hours of the 207 hours recording time (79%). The total recording time during the evening on weekends was 140 hours, of which the lidos were worn 115 h (82%). On weekdays, lidos were worn for 92% of the daytime recording time (836 h) from waking up to 3 hours before bedtime (the 3 hours before bedtime are referred to below as the evening). The total recording time during the week (Wednesday to Friday), including evenings and bedtime, was 1 777 hours. At weekends, lidos were worn for 78% of the daytime recording time (453 h). The total recording time during the weekend was 1 255 hours. Participants wearing glasses (N=20) wore lido for 52% of their total recording time, including evening and bedtime (1 090 h). Participants not normally wearing glasses (N=9) wore lido for 51% of their total recording time (479 h). Gender differences were minimal with women wearing lido for 52% and men for 51% of the total recording time. None of the moderate morning types (as assessed by the MEQ) wore the lido after midnight, and none of the moderate evening types wore the lido before 8:30 am. Participant UX7 did only wear the device for two days because of illness (
Figure 2). Towards the end of the experimental phase, participants UX25, 27, 28, and 35 wore the lido for 5 consecutive days (according to their diary). For unknown reasons, the lidos only recorded from Friday onwards, although they were programmed to record from Wednesday onwards.
2.3. Light Characteristics Received by Subjects Near the Plane of the Cornea
The overall median mEDI at the eye level while wearing the lido was 51 lx
mEDI, with a mean of 299 lx
mEDI, min 0 lx
mEDI, 1st quartile 11 lx
mEDI, 3rd quartile 138 lx
mEDI, and max 93 432 lx
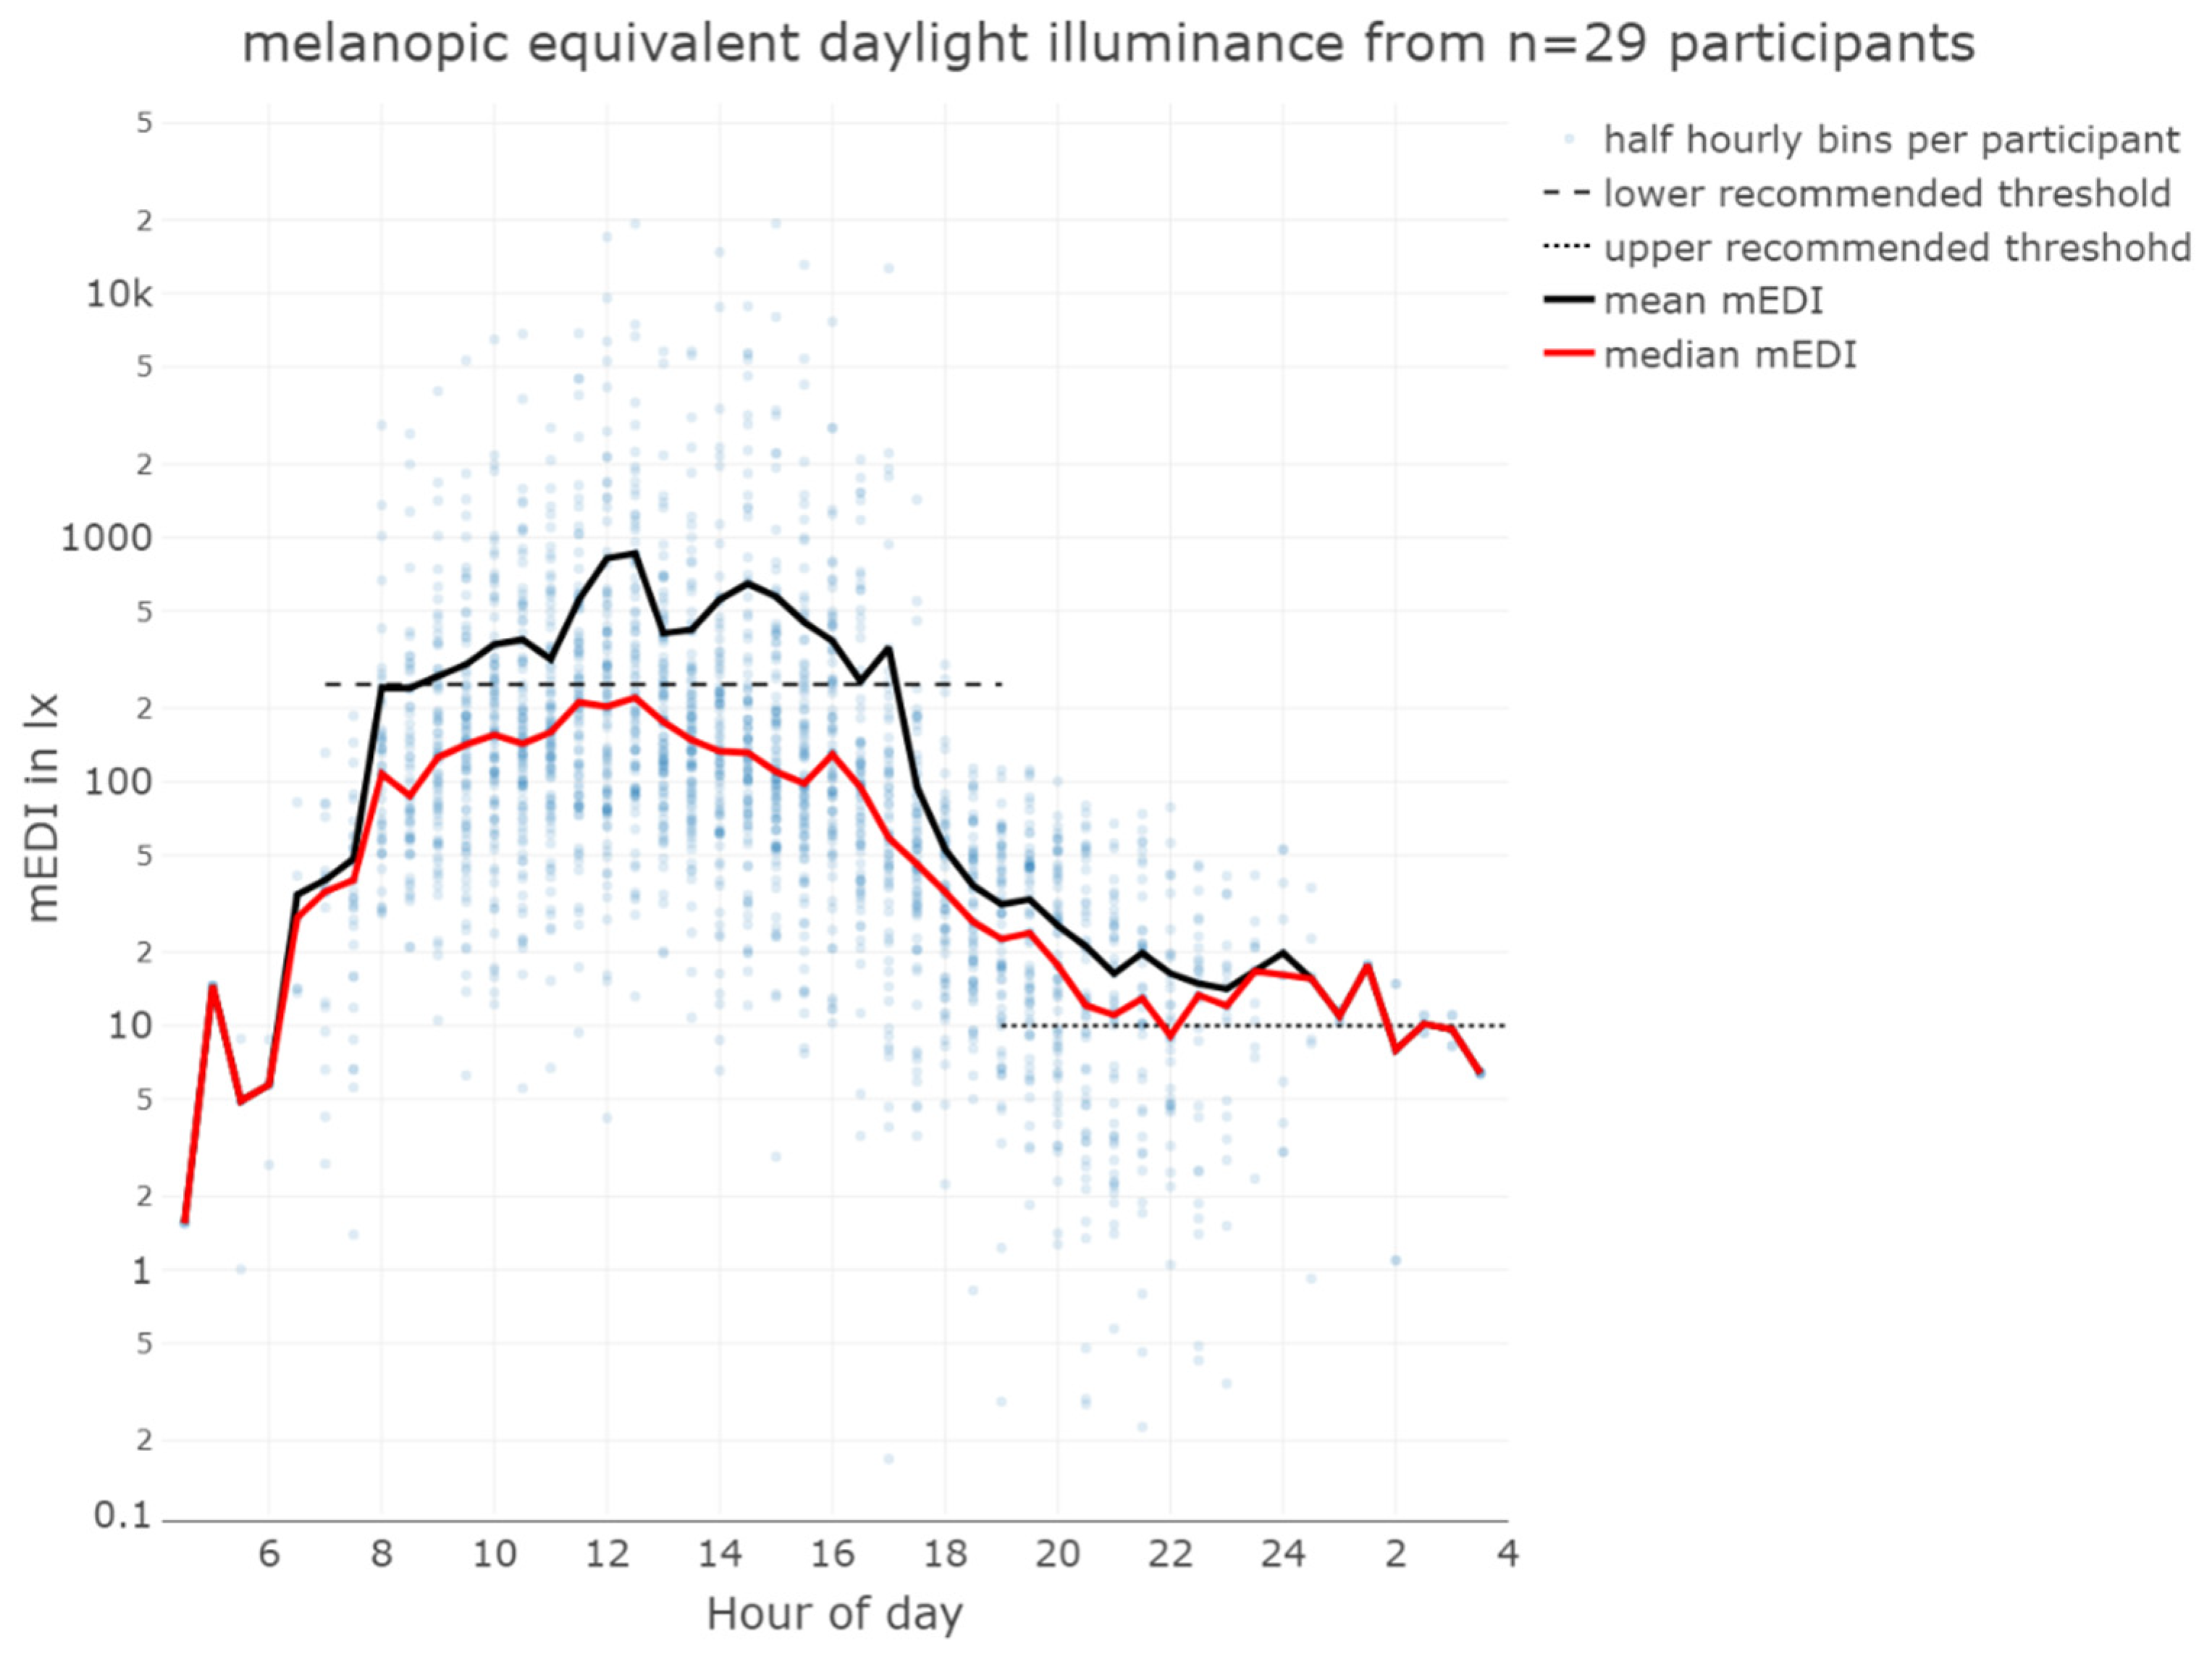
mEDI, indicating variability in light exposure among participants (see
Table 1 and
Figure 3). The very high illuminances, approaching 100 000 lx
mEDI, result in elevated mean illuminances that may not accurately represent the received light dose. In contrast, median illuminances, or the duration of illuminance above a certain threshold, may give a more accurate picture of cumulative light exposure history.
During daytime (excluding the evening), participants achieved light exposure levels above 250 lx
mEDI [
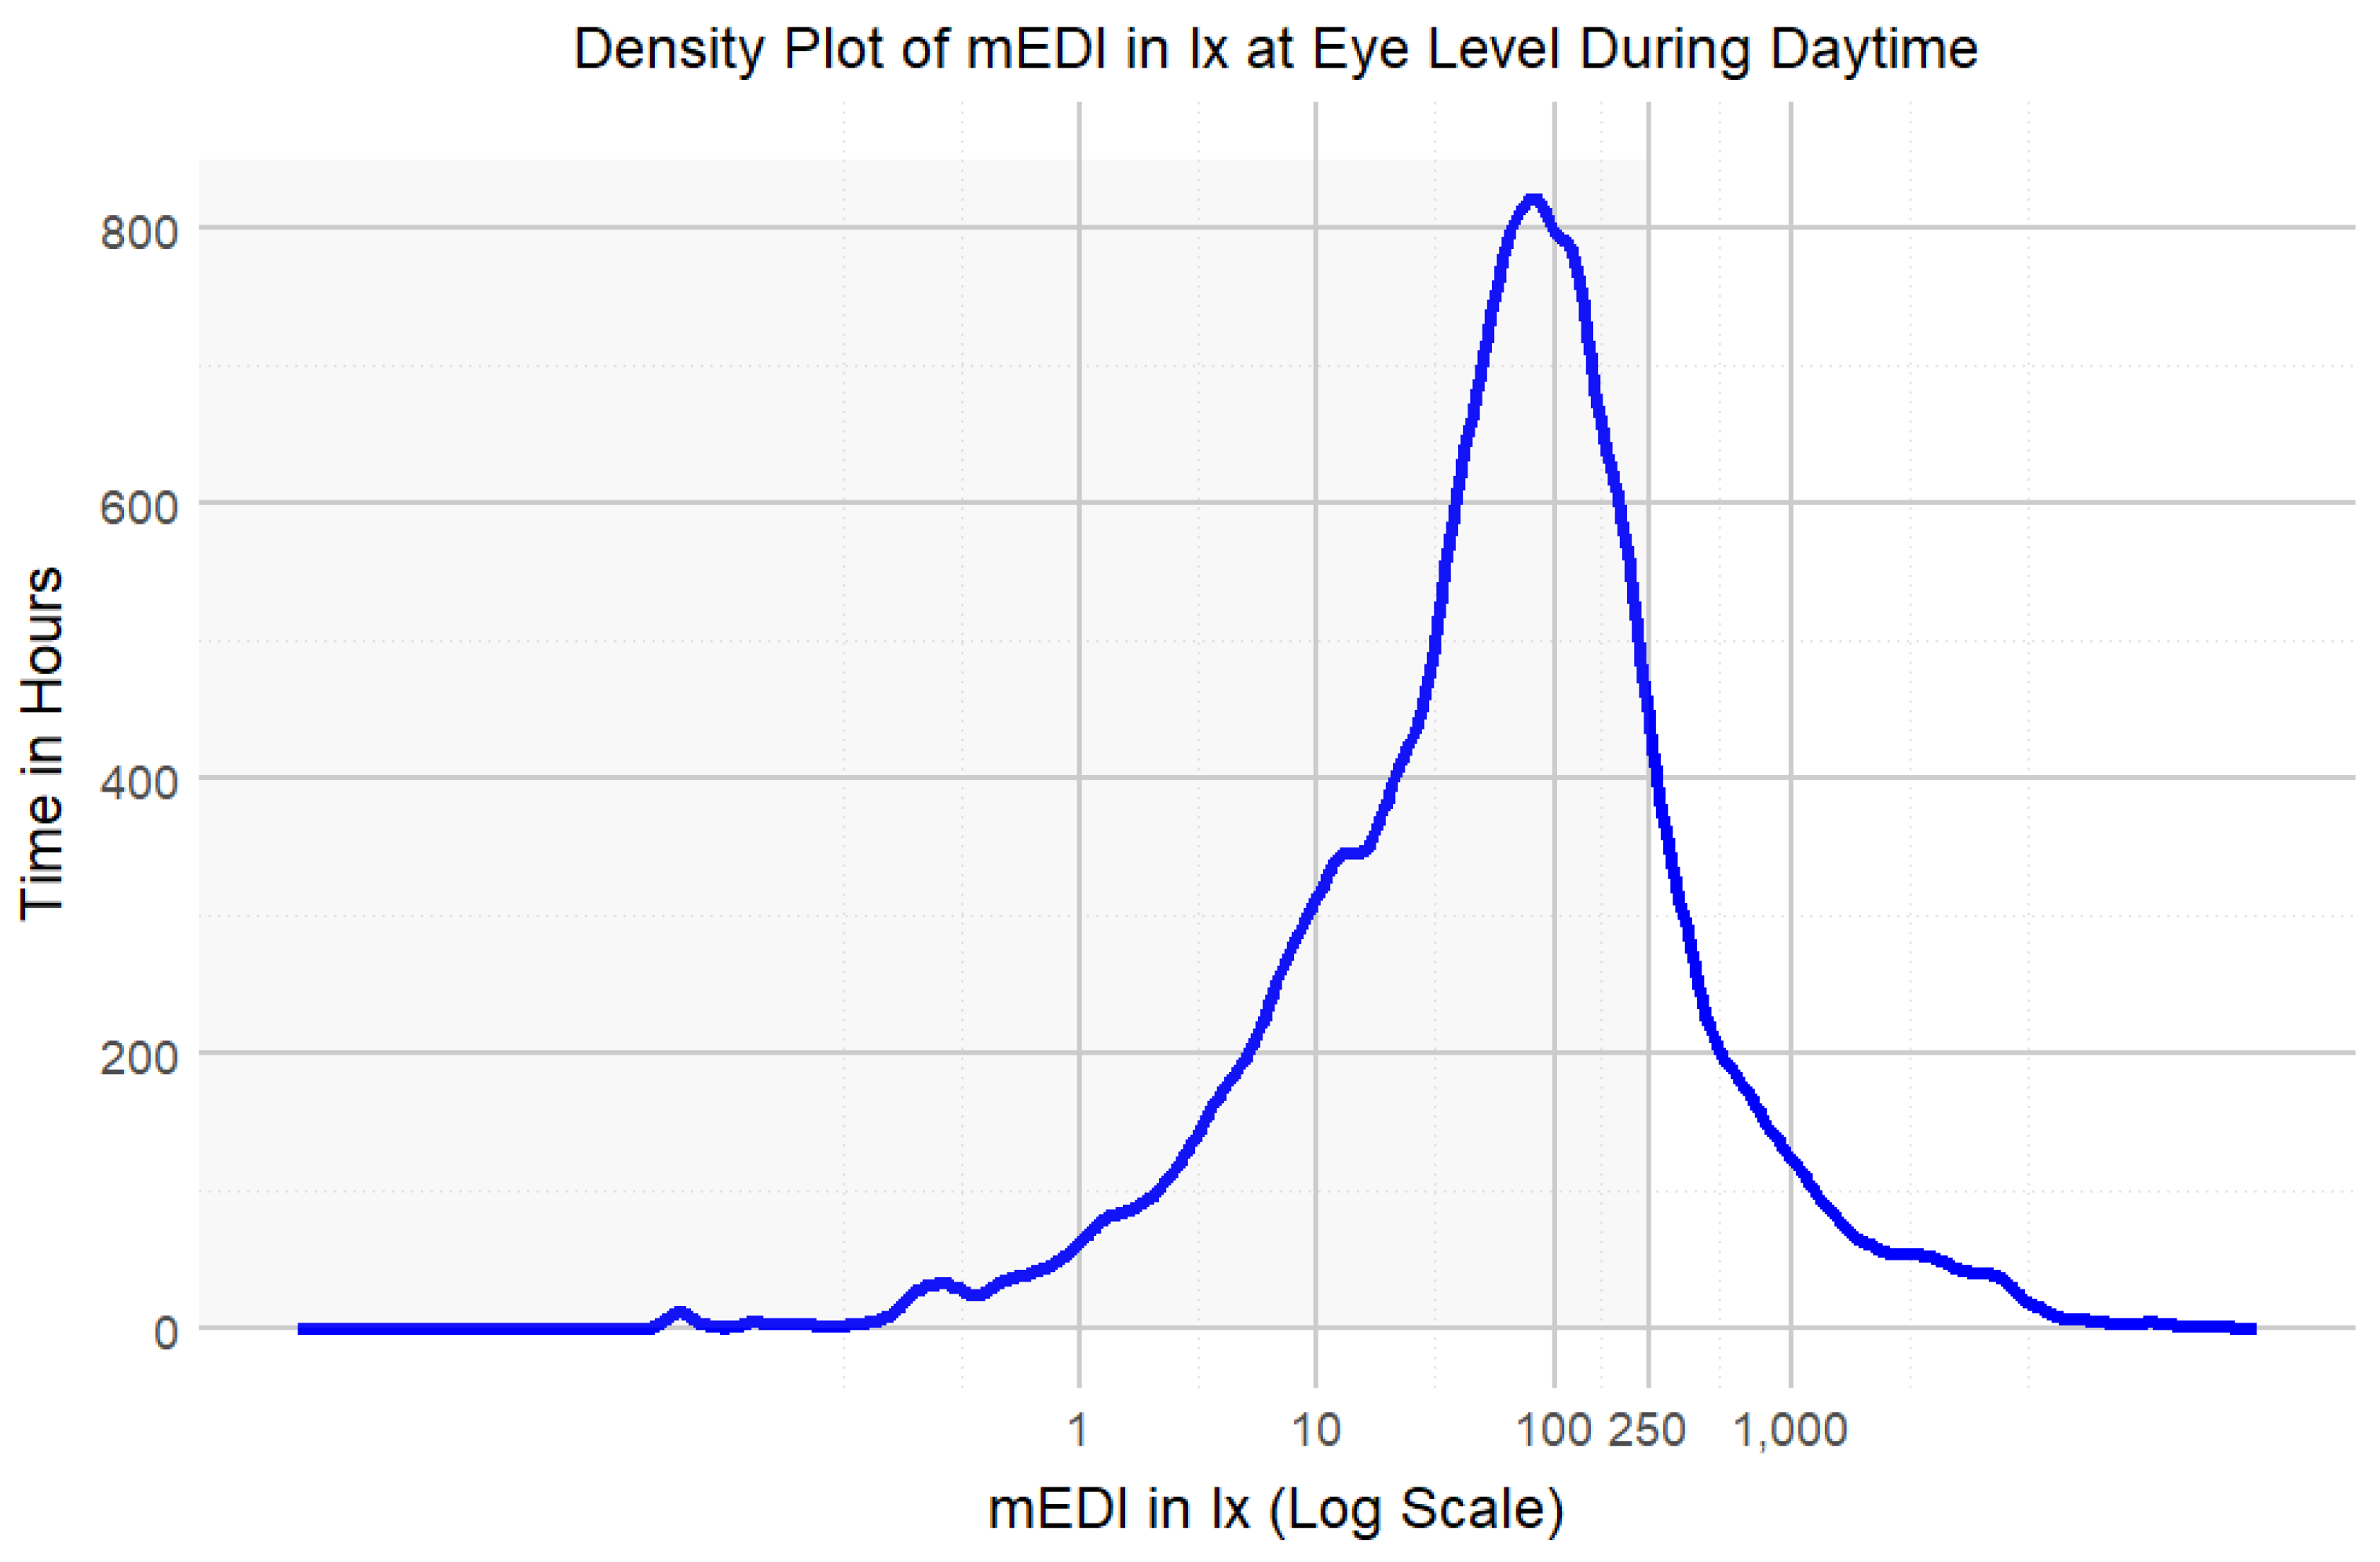
35] for only 14% (224 hours) of the total wearing time, with similar percentages on weekdays (15%) compared to weekends (13%). This highlights the need for increased exposure to recommended light levels. Time above 250 lx during wearing time (excluding sleep but including the evening) was 18% (132 hours) on weekdays and 17% (75 hours) on weekends. Most of the time, participants spent below a level of 100 lx
mEDI (
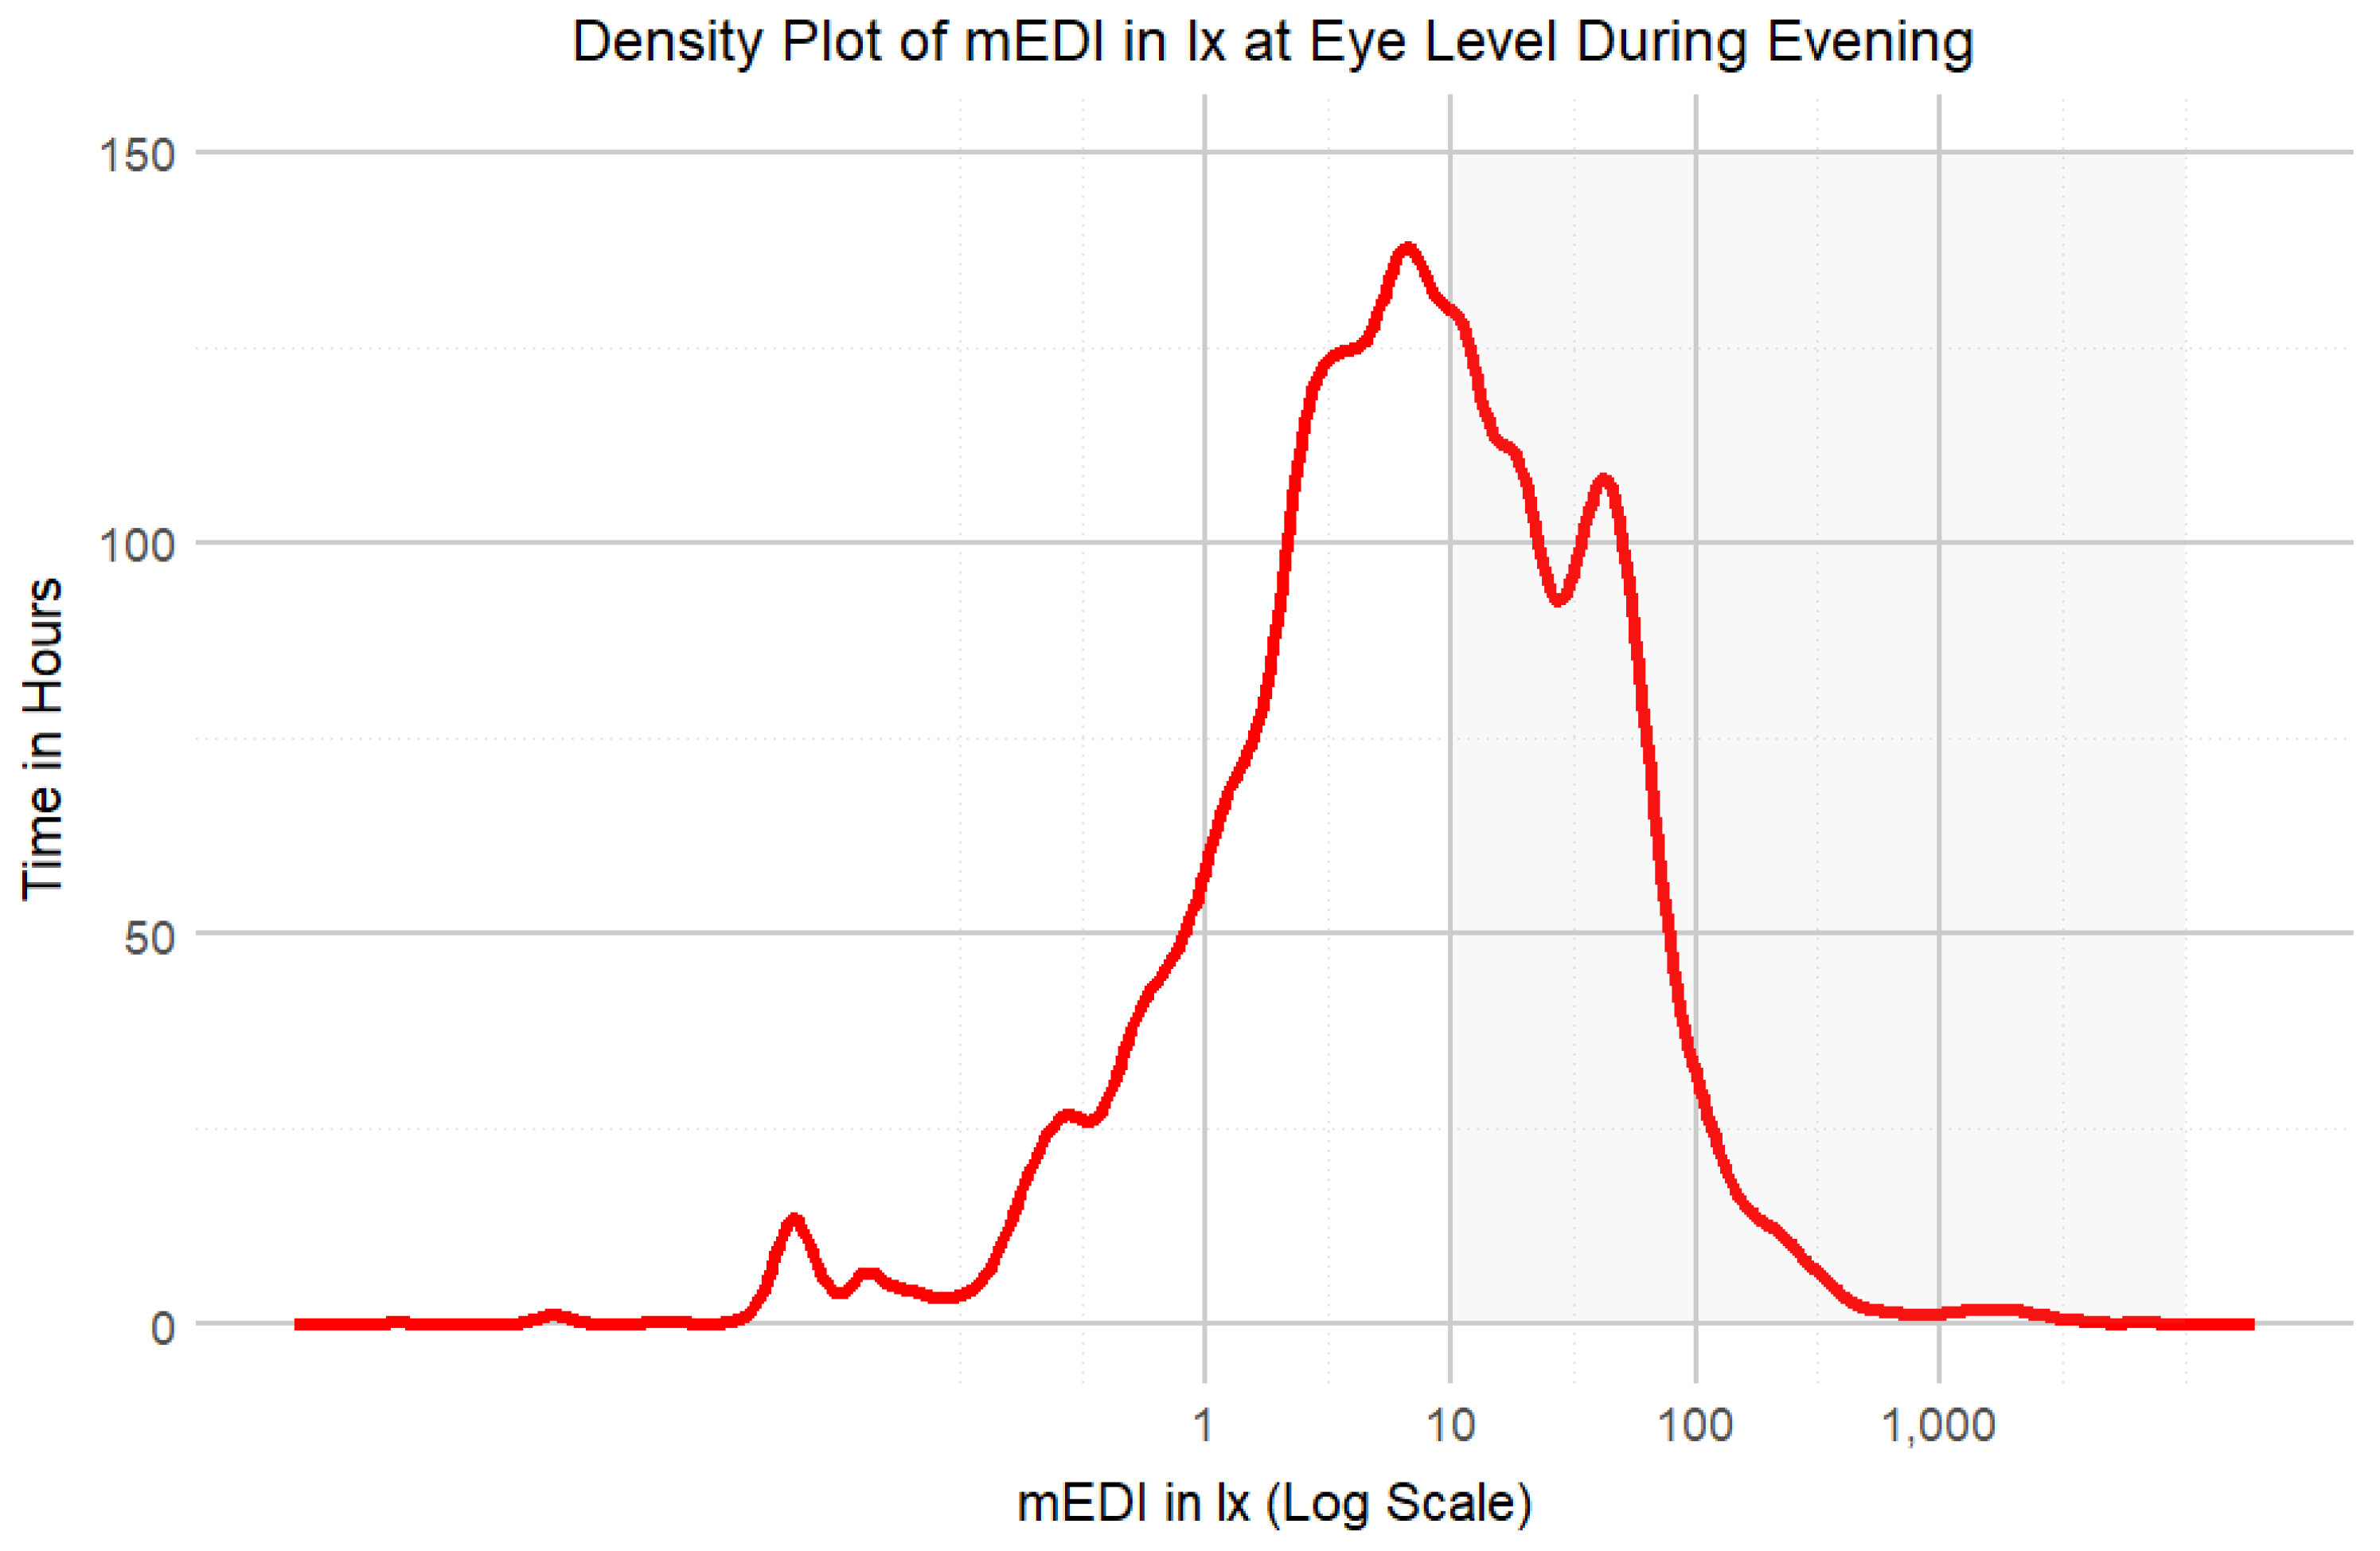
Figure 4). In the evening, participants’ light exposure was below the recommended 10 lx
mEDI for 57% (93 h) of the wear time on weekdays and 58% at weekends, in line with guidelines for reducing light exposure before sleep [
35] (
Figure 5,
Table 1).
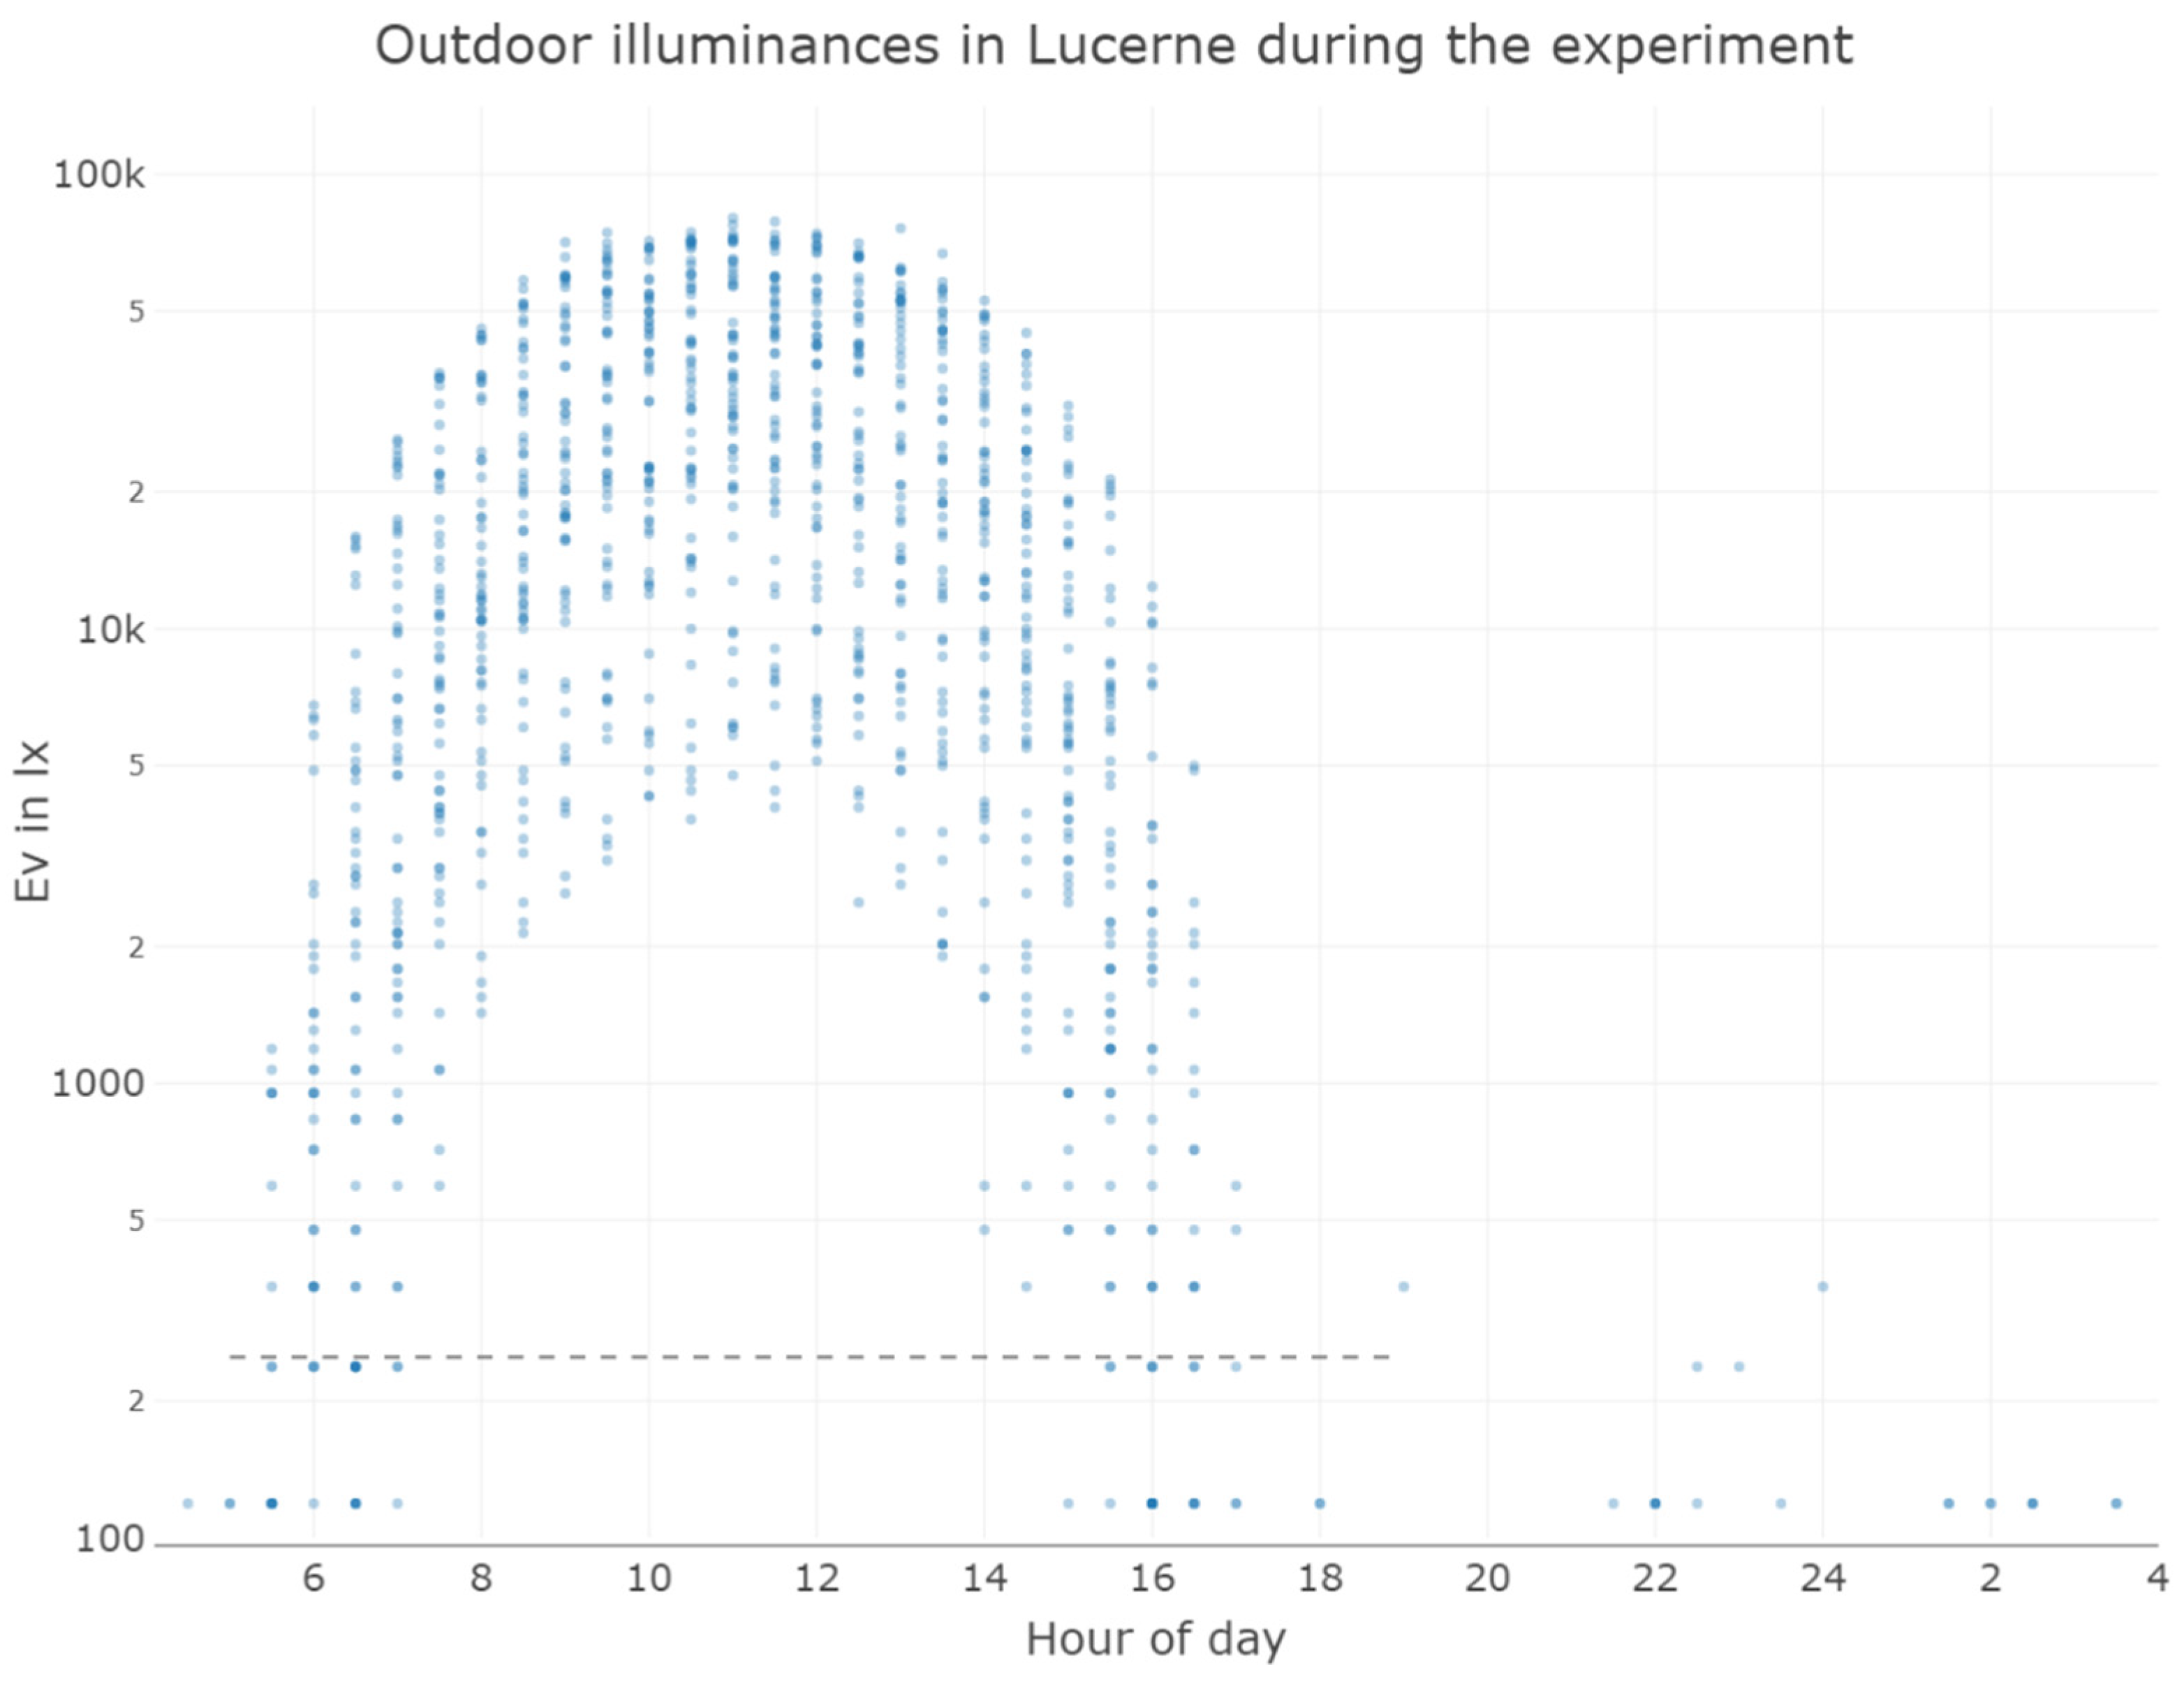
Figure 6 depicts the unobstructed outdoor light measurements in Lucerne during the study period. While participants might not have spent all their time in Lucerne and the outdoor light measurements cannot be correlated with individual participants, even during the autumn in Switzerland, outdoor illuminances are far above the recommended 250 lx
mEDI.
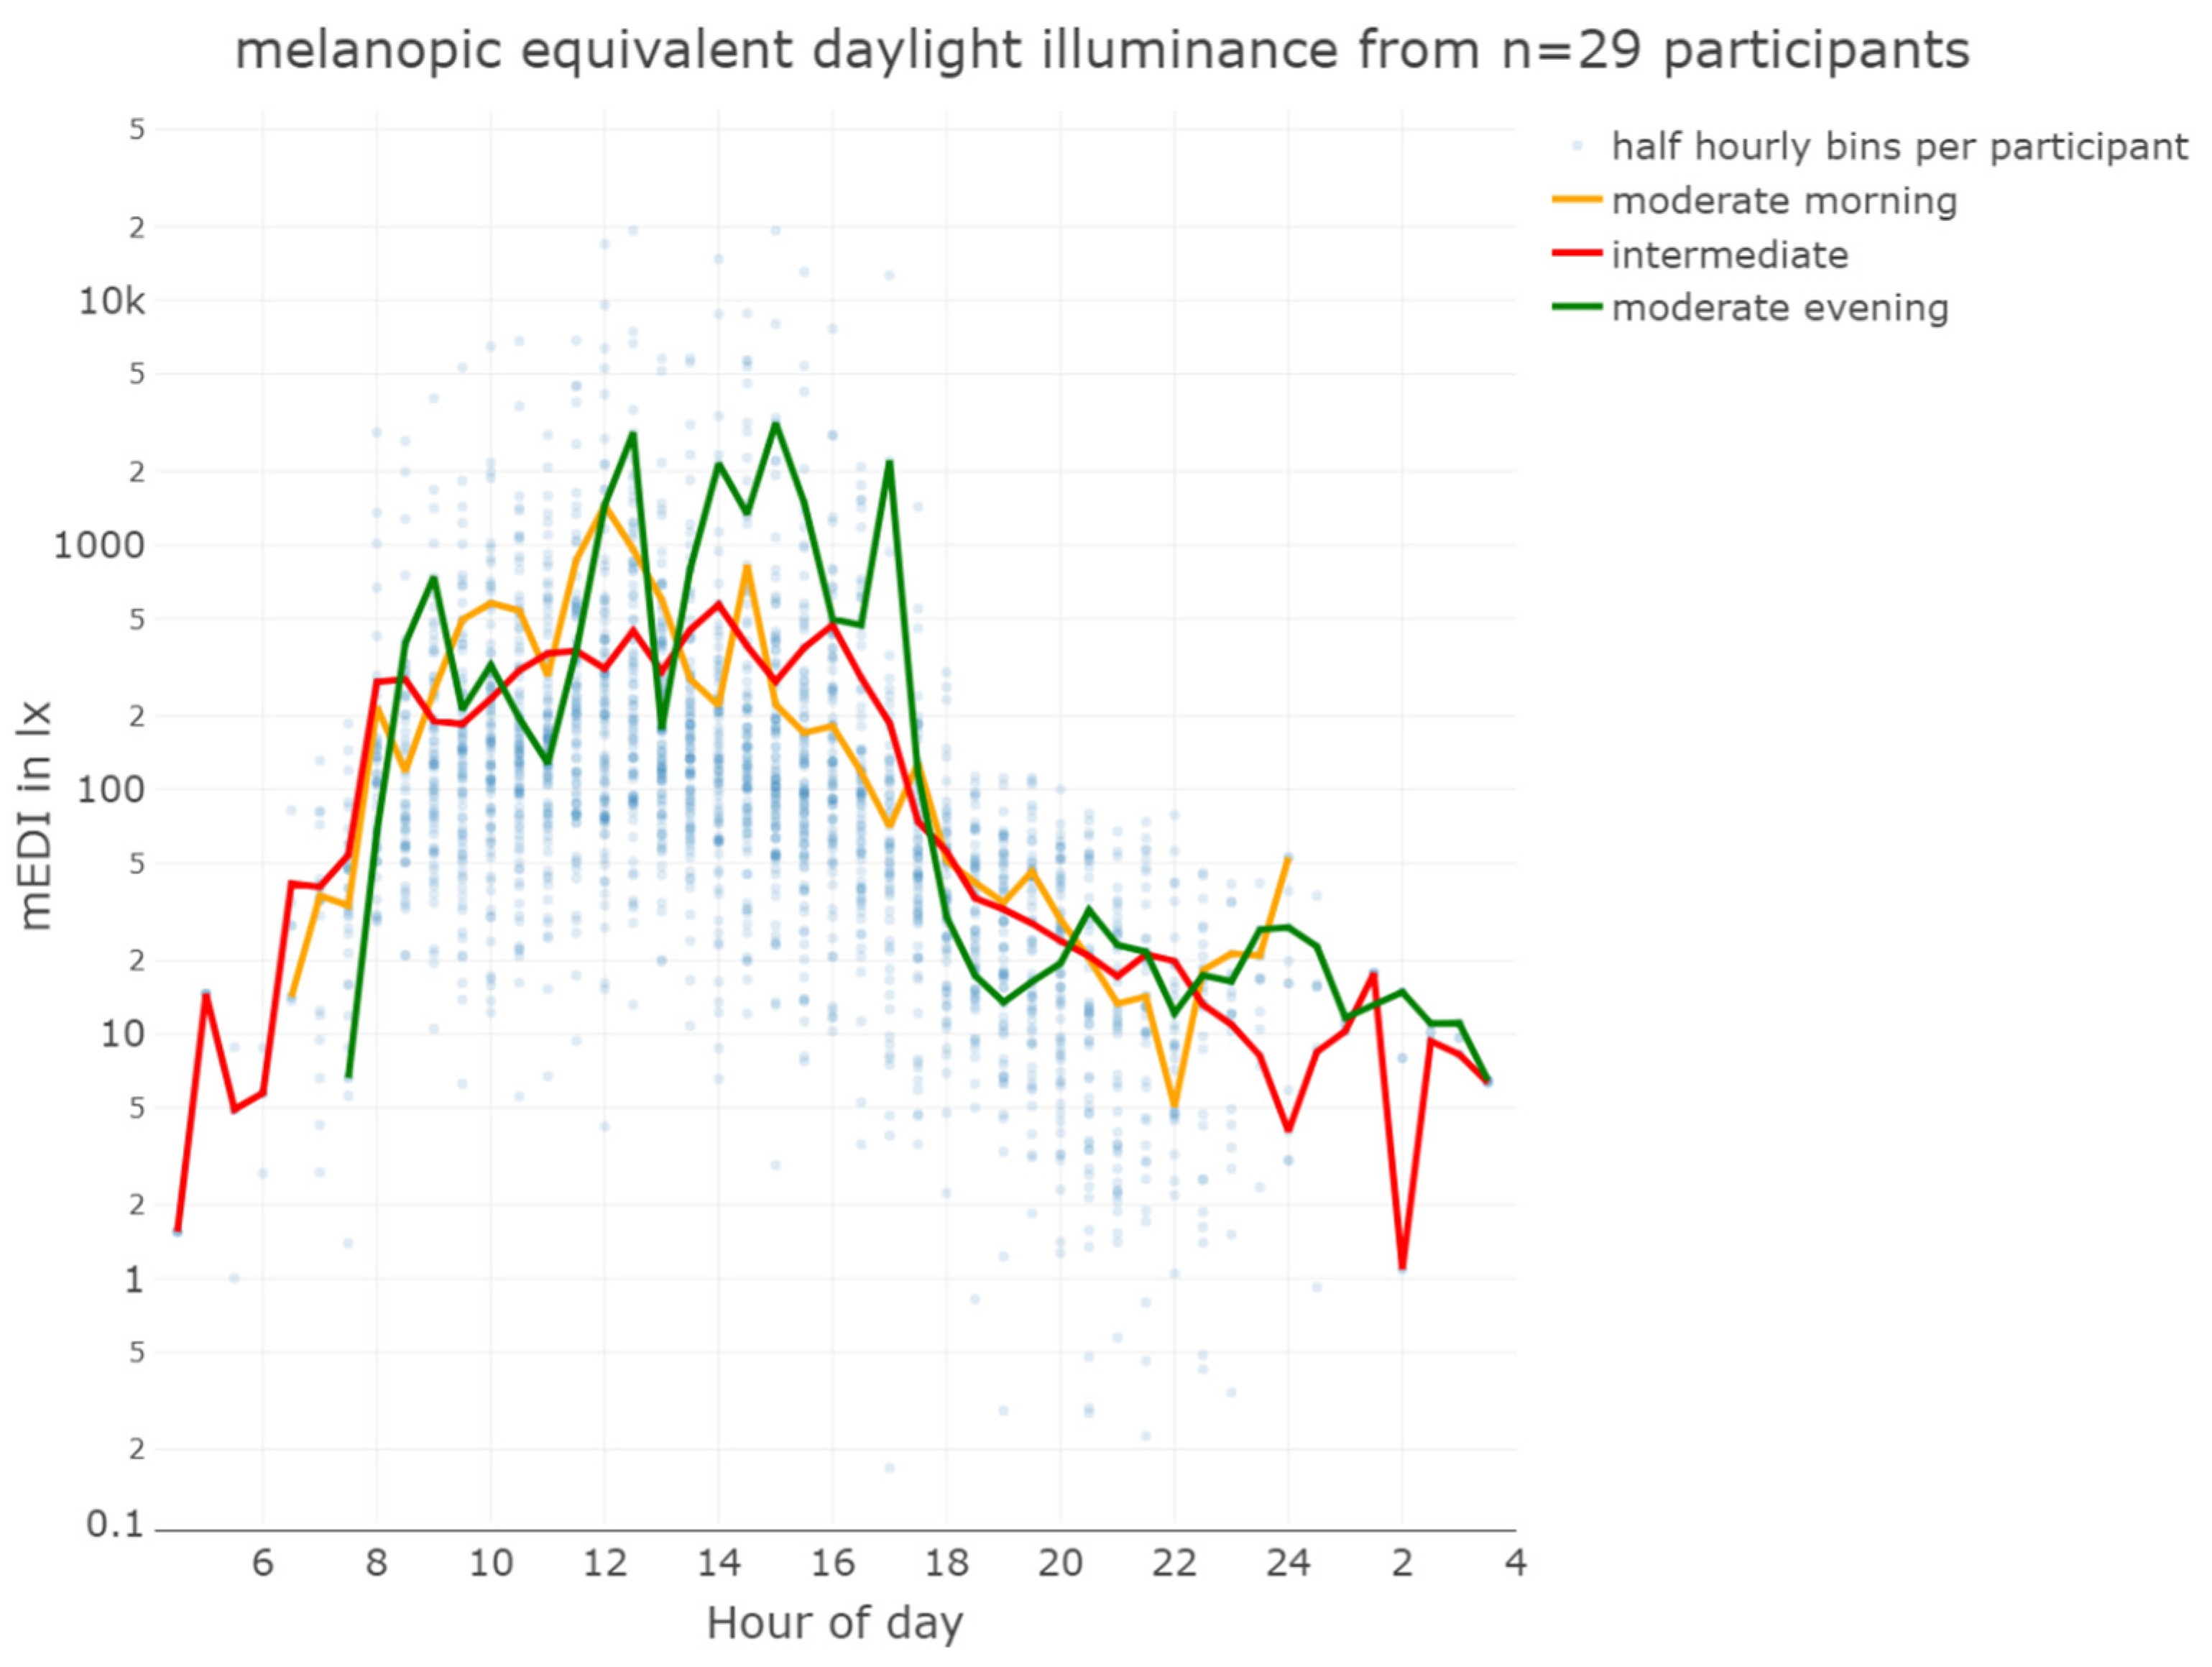
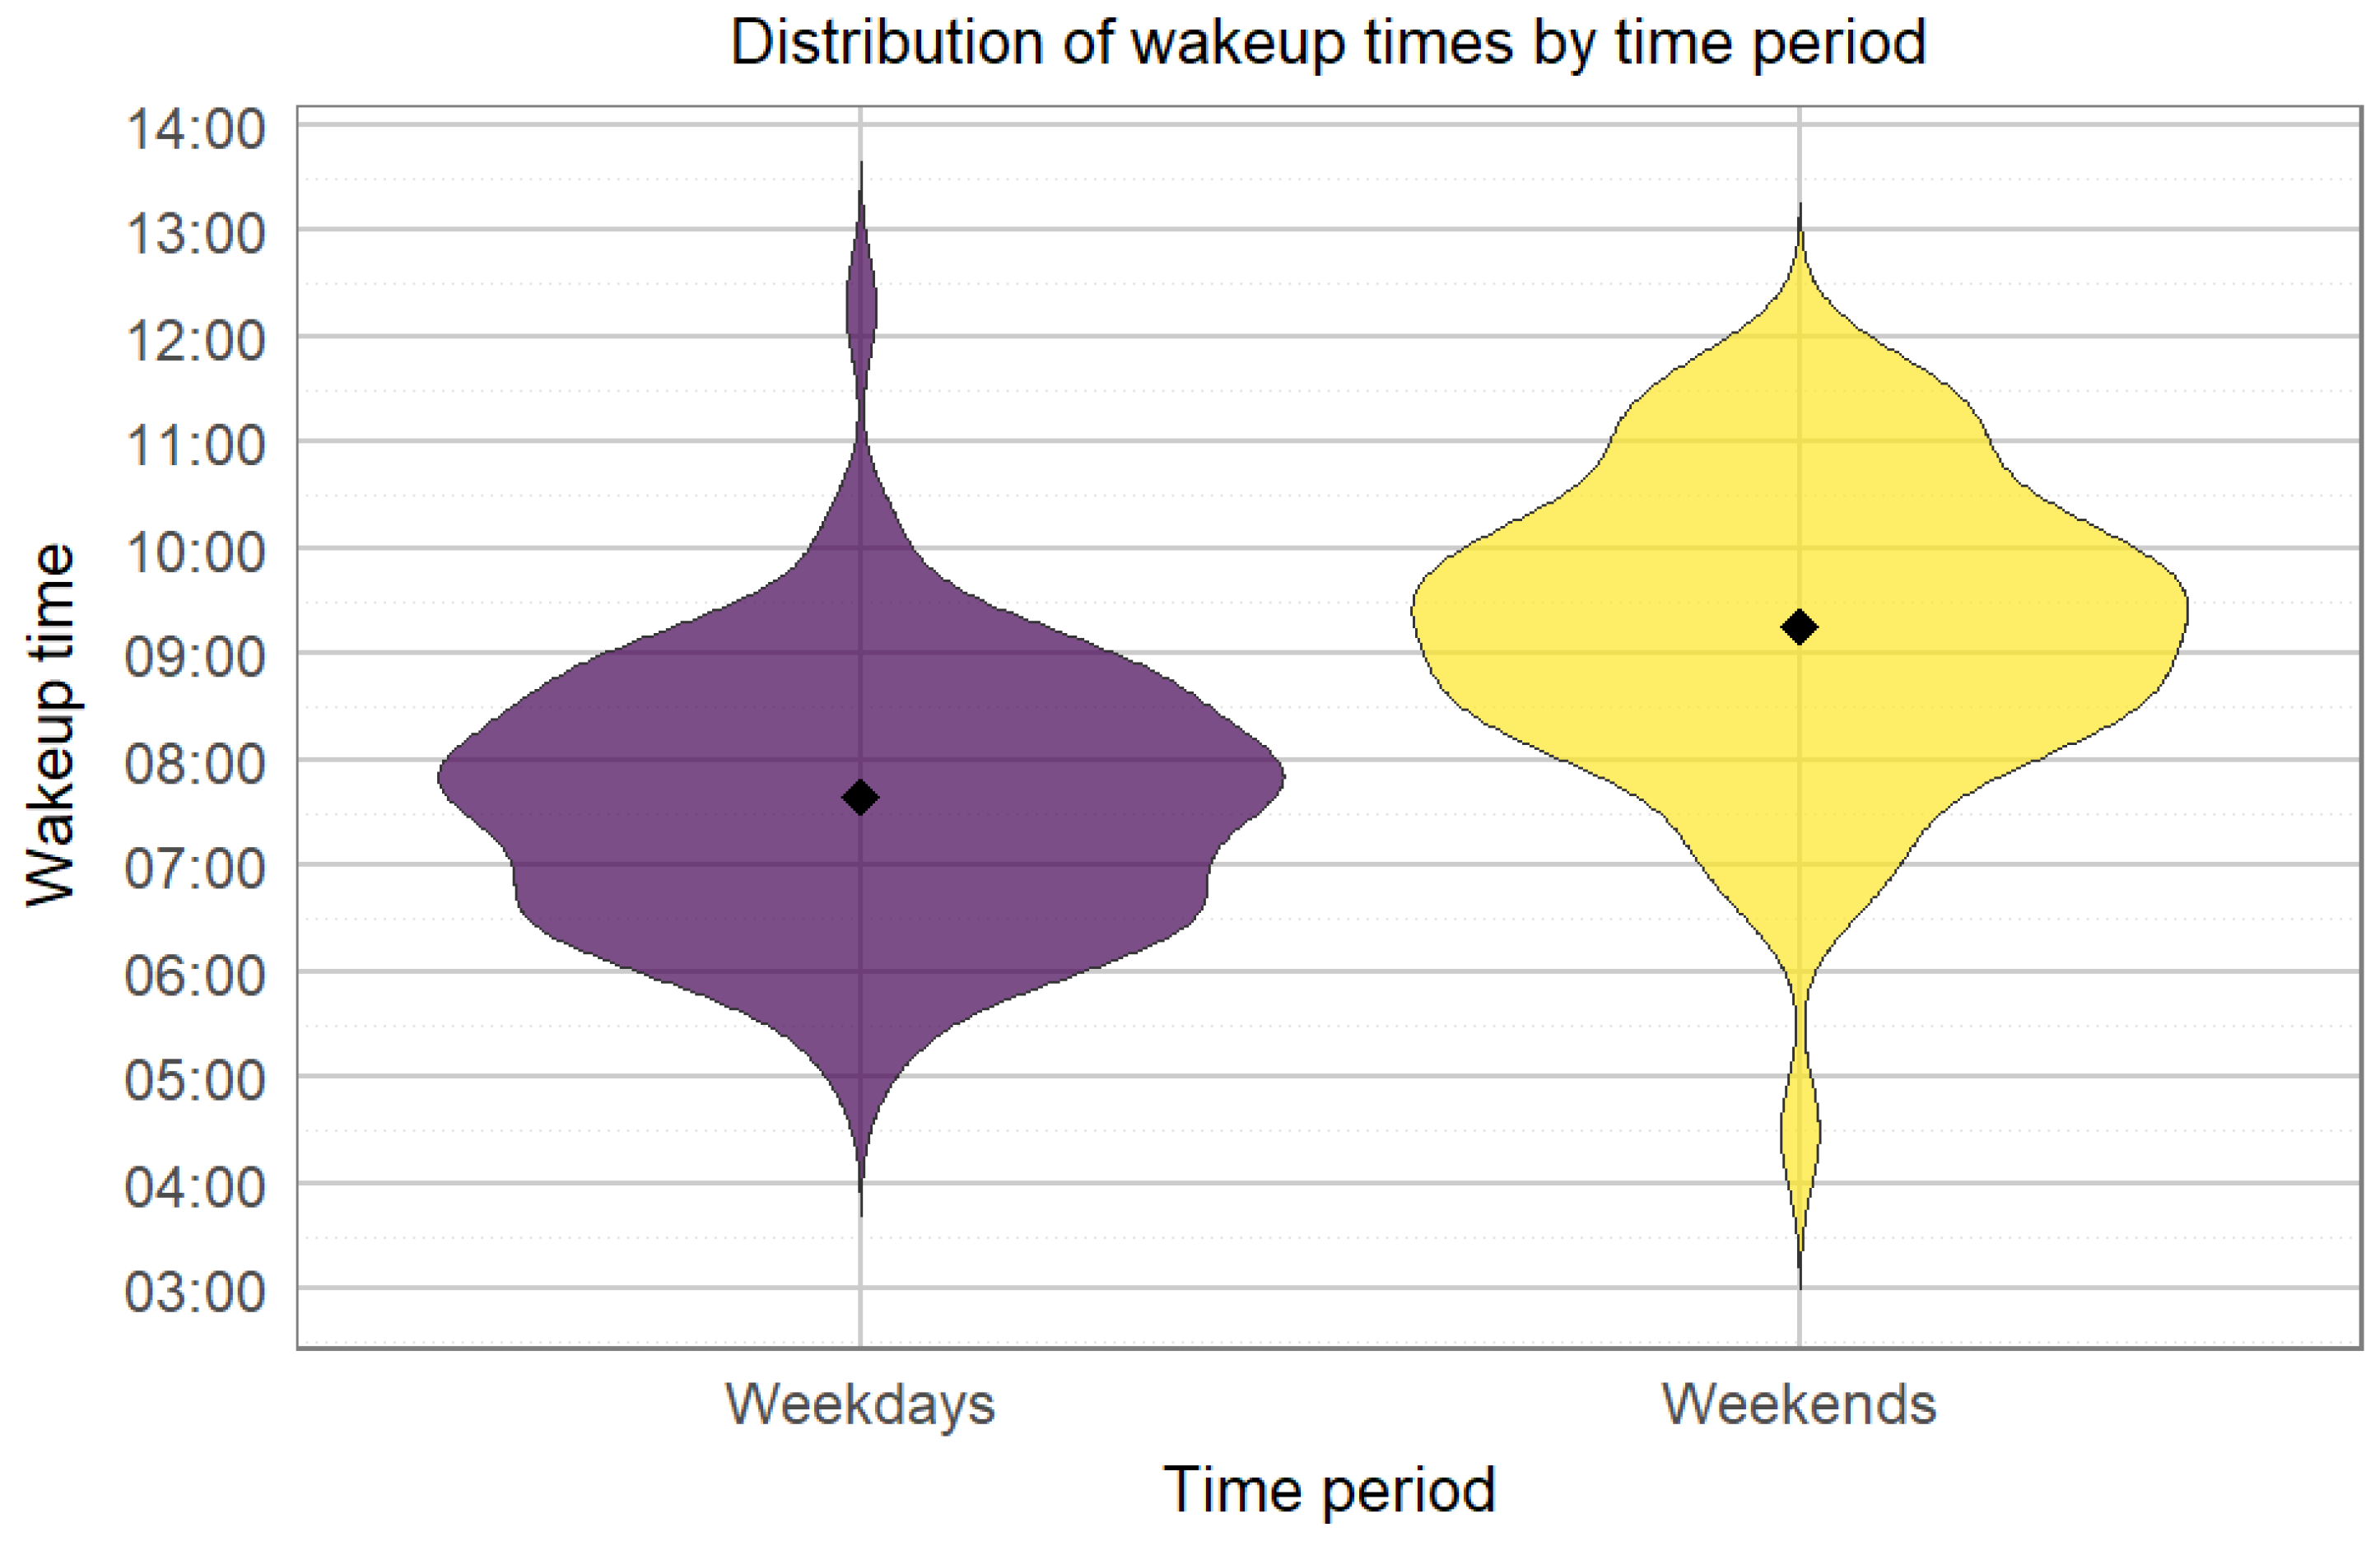
Figure 7 depicts the light conditions (mEDI) for the 3 different chronotypes of our study. The trend suggests more light for moderate evening types in the afternoon than moderate morning types. Still, statistical analysis revealed no significant difference between the daily light patterns of the chronotypes (see supplement S2 for details). Participants showed a significant difference in wake-up times (pick-up time of lido) between weekdays and weekends, with an average delay of 1 hour and 36 minutes on weekends (
Figure 8). The average first-wear time of the lidos after wake-up is 07:40 am during the week and 09:16 am at the weekend. There is a ca. 40 min standard deviation between participants and a standard deviation of ca. 41 min between weekend and week.
3. Discussion
After excluding the time spent sleeping, during which participants were not required to wear the device, compliance was notably high, with 89% wear time during waking hours. This high level of compliance is crucial for ensuring the quality and reliability of the data collected. No participant forgot to wear the device completely, and all were careful to document periods of non-wear and to press the trigger button when removing the device. Nevertheless, when wearing lido, participants often noticed skeptical looks from those passing by, which raised privacy concerns and caused unwanted attention. Furthermore, the device caused imbalance and sometimes even pain when attached to spectacles. Therefore, continuous wear over several days posed a challenge to some participants.
Despite participants reporting unwanted attention in public and significant discomfort while wearing the device, compliance rates during daytime hours were high, with participants wearing the lido for 92% on weekdays and 78% at weekends. This suggests robust overall adherence to the wear protocol. We attribute this high level of compliance not to the extrinsic motivation of avoiding a 40% reimbursement penalty for removing the dosimeter for more than six hours per day, but rather to the intrinsic motivation of contributing to scientific research, as emphasized during the briefing. It is worth noting that only one participant did not receive the full reimbursement as he could not wear the device due to illness.
The difference in wear time between weekends and weekdays suggests that participants’ routines and weekend activities lead to lower compliance, which could be addressed by targeted strategies to maintain consistency in wear time. There were negligible differences in compliance between participants who wore glasses and those who did not. Gender differences were also small, with women wearing the device 52% of the time compared to 51% for men.
The WEAR score, which measures the social acceptability of wearable devices, is comparable to the score reported by Kelly & Gilbert [
33]. However, it is significantly higher than the score in the Balajadia et al. [
31] study, indicating greater social acceptability in the current context. Several factors could contribute to the higher score, such as the greater technological affinity of students from a technical university (the majority of our cohort) compared to those from Oxford University, the motivational incentive of informing participants that the device was developed at their own university, and the extended period (5 days) that participants wore the device in our study, which allowed them to become accustomed to it. In addition, Balajadia’s use of a reduced set of 41 items compared to the original 50 items in our study may have introduced a more negative bias into their results. Our study cohort consisted entirely of young people, which may introduce a potential bias into the results. This age group may either be more concerned with their appearance or more open to adopting innovative devices than an older population. In addition, as Kelly & Gilbert [
33] notes, individuals who need a wearable device to support their health may have higher levels of acceptance. In their study, a head-worn device received a lower WEAR score of 3.25 when categorized as a fitness device, compared to a higher score of 3.76 when categorized as a medical device [
33]. As a result, our findings may not fully represent the attitudes and behaviors of other populations.
The significant variation in wake-up times between weekday and weekends (ca. 1,5 hours later at weekends) corroborates previous findings by Wittmann at al., namely “social jetlag” [
36]. Social jetlag refers to the misalignment between an individual’s internal biological clock and their socially imposed schedules, such as work, or other commitments. It occurs when a person’s natural sleep-wake cycle, dictated by their internal body clock, doesn’t align with the timing demands of their daily activities.
Analysis of the light exposure data from the study shows that there is considerable variability in the light exposure of the participants. While the (arithmetic) mean mEDI of almost 300 lxmEDI suggests that participants generally received adequate light during the day, the median mEDI of only 51 lxmEDI shows that most of the time, light exposure was much lower. This discrepancy is due to occasional very high maximum illuminances of almost 100 000 lxmEDI, which skew the (arithmetic) mean. The overall geometric mean with 50 lxmEDI, however, is less sensitive to extreme outliers, too. The geometric mean in the evening and during daytime was 6 and 57 lxmEDI respectively.
Given the potential importance of continuous light exposure at recommended thresholds, it is crucial to examine the duration of time participants spent above certain light thresholds. Recent recommendations [
35] suggest a minimum of 250 lx
mEDI during the day. Previous studies investigating photopic illuminance at the wrist, however, have shown that participants of different ages experienced illuminance levels below 100 lx for more than 50% of their waking hours [
37]. In our study, most of the day was spent below 100 lx
mEDI, indicating insufficient exposure to recommended light levels in line with the literature. Specifically, participants were exposed to light levels above 250 lx
mEDI for only 14% of their wearing time, with a slight increase on weekdays (15%) compared to weekends (13%). This suggests a need for strategies to increase light exposure. The data were collected during the autumn and winter months, which likely contributed to the low levels of light exposure observed. Light exposure is likely higher in summer, as other studies have reported increased light exposure during this season [
21,
38,
39,
40].
Looking at wear time excluding sleep but including evening periods, exposure to light above 250 lx
mEDI was slightly higher: 18% on weekdays and 17% at weekends. While this may seem like an improvement, it is problematic because the increase in light above this threshold occurred three hours before bedtime, a time when light levels should ideally be lower than 10 lx
mEDI. However, in the evening, participants were generally more likely to comply with recommendations to reduce light exposure before going to bed. Participants’ light exposure was below the recommended 10 lx
mEDI for 57% of the wearing time on weekdays and 58% on weekends, in line with guidelines aimed at minimizing light exposure before bedtime to support a healthier lifestyle [
35].
4. Materials and Methods
4.1. Participants and Procedure
The study procedures were approved by the local ethics committee and conducted in accordance with the Declaration of Helsinki. Written informed consent was obtained from all participants. We recruited 29 participants (17 female) aged between 18 and 35 years to wear lido devices for five consecutive days between 8 October and 4 December 2023. Of these participants, 20 were spectacle wearers. Participants could follow their daily routines and were instructed to wear the device as much as possible to accurately monitor their light exposure for scientific purposes. To further ensure compliance, the financial compensation was reduced by 40% if participants did not wear the device for more than six hours during the day (excluding nighttime when participants placed the lido next to their bed). Each participant began wearing the device on a Wednesday morning directly after wake-up. After five days of wearing the lido, participants received an email on Sunday evening with a link to answer questions about their experience wearing the device.
4.2. Instruments
The online questionnaire was created in Qualtrics and included standardized questionnaires such as the MEQ - Morning Evening Questionnaire [
41] and the WEAR - Wearable Acceptability Range scale [
34]. The Wearable Acceptability Range Scale (WEAR Scale) is an instrument used in consumer behavior research and product development to assess the social acceptability of wearable devices [
34,
42]. The original form of the WEAR scale consists of 50 items, each rated on a 6-point Likert-type scale ranging from 1 = “strongly disagree” to 6 = “strongly agree” [
34,
42]. In her dissertation, Kelly (2016) [
42] demonstrated that the 50 items of the original WEAR scale could be condensed into a construct known as the WEAR score, characterized by two factors: (1) “fulfillment of aspirational desires” (8 items) and (2) “absence of social anxiety” (6 items). The WEAR score ranges as well from 1 = “strongly disagree” to 6 = “strongly agree”, with a mean of 3.5.
Likert-type scale scores are adjusted based on context and specific questions. For example, Balajadia et al. (2023) [
31] used a 7-point WEAR scale in their study, ranging from 1 = “strongly disagree” to 7 = “strongly agree”. This modification introduced a neutral midpoint, 4 = “neither agree nor disagree”. The present study uses a 5-point WEAR scale, ranging from 1 = “agree” to 5 = ”disagree”, with a neutral midpoint of 3 = neither, to maintain consistency with other five-point Likert-type scales used in our research.
Table 2 gives an overview of the different Likert Scales used in the mentioned studies.
We further collected feedback from participants about their experiences with the light dosimeters, focusing on what worked well, what did not, and what could be improved. This feedback was analyzed thematically, following the steps proposed by Braun and Clarke [
32] to identify common themes and potential areas for improvement. To address our particular interest in the usability and acceptability of lido, we included the following open questions:
Please tell me when and where you mainly wore the lido.
What activities did you do while you were carrying it?
Aside from times when you slept and showered, how long did you not wear the lido when you could otherwise have worn it (time of the day)?
What were the possible reasons for not wearing the lido, apart from the times when sleeping and showering?
On which occasion did you find it particularly difficult to wear the lido?
What experiences (your own experience and possibly also the reactions of other people) have you had while wearing the device? Please briefly describe your observations!
When and where would you prefer to wear the lido?
4.3. Apparatus
The light dosimeter
lido [
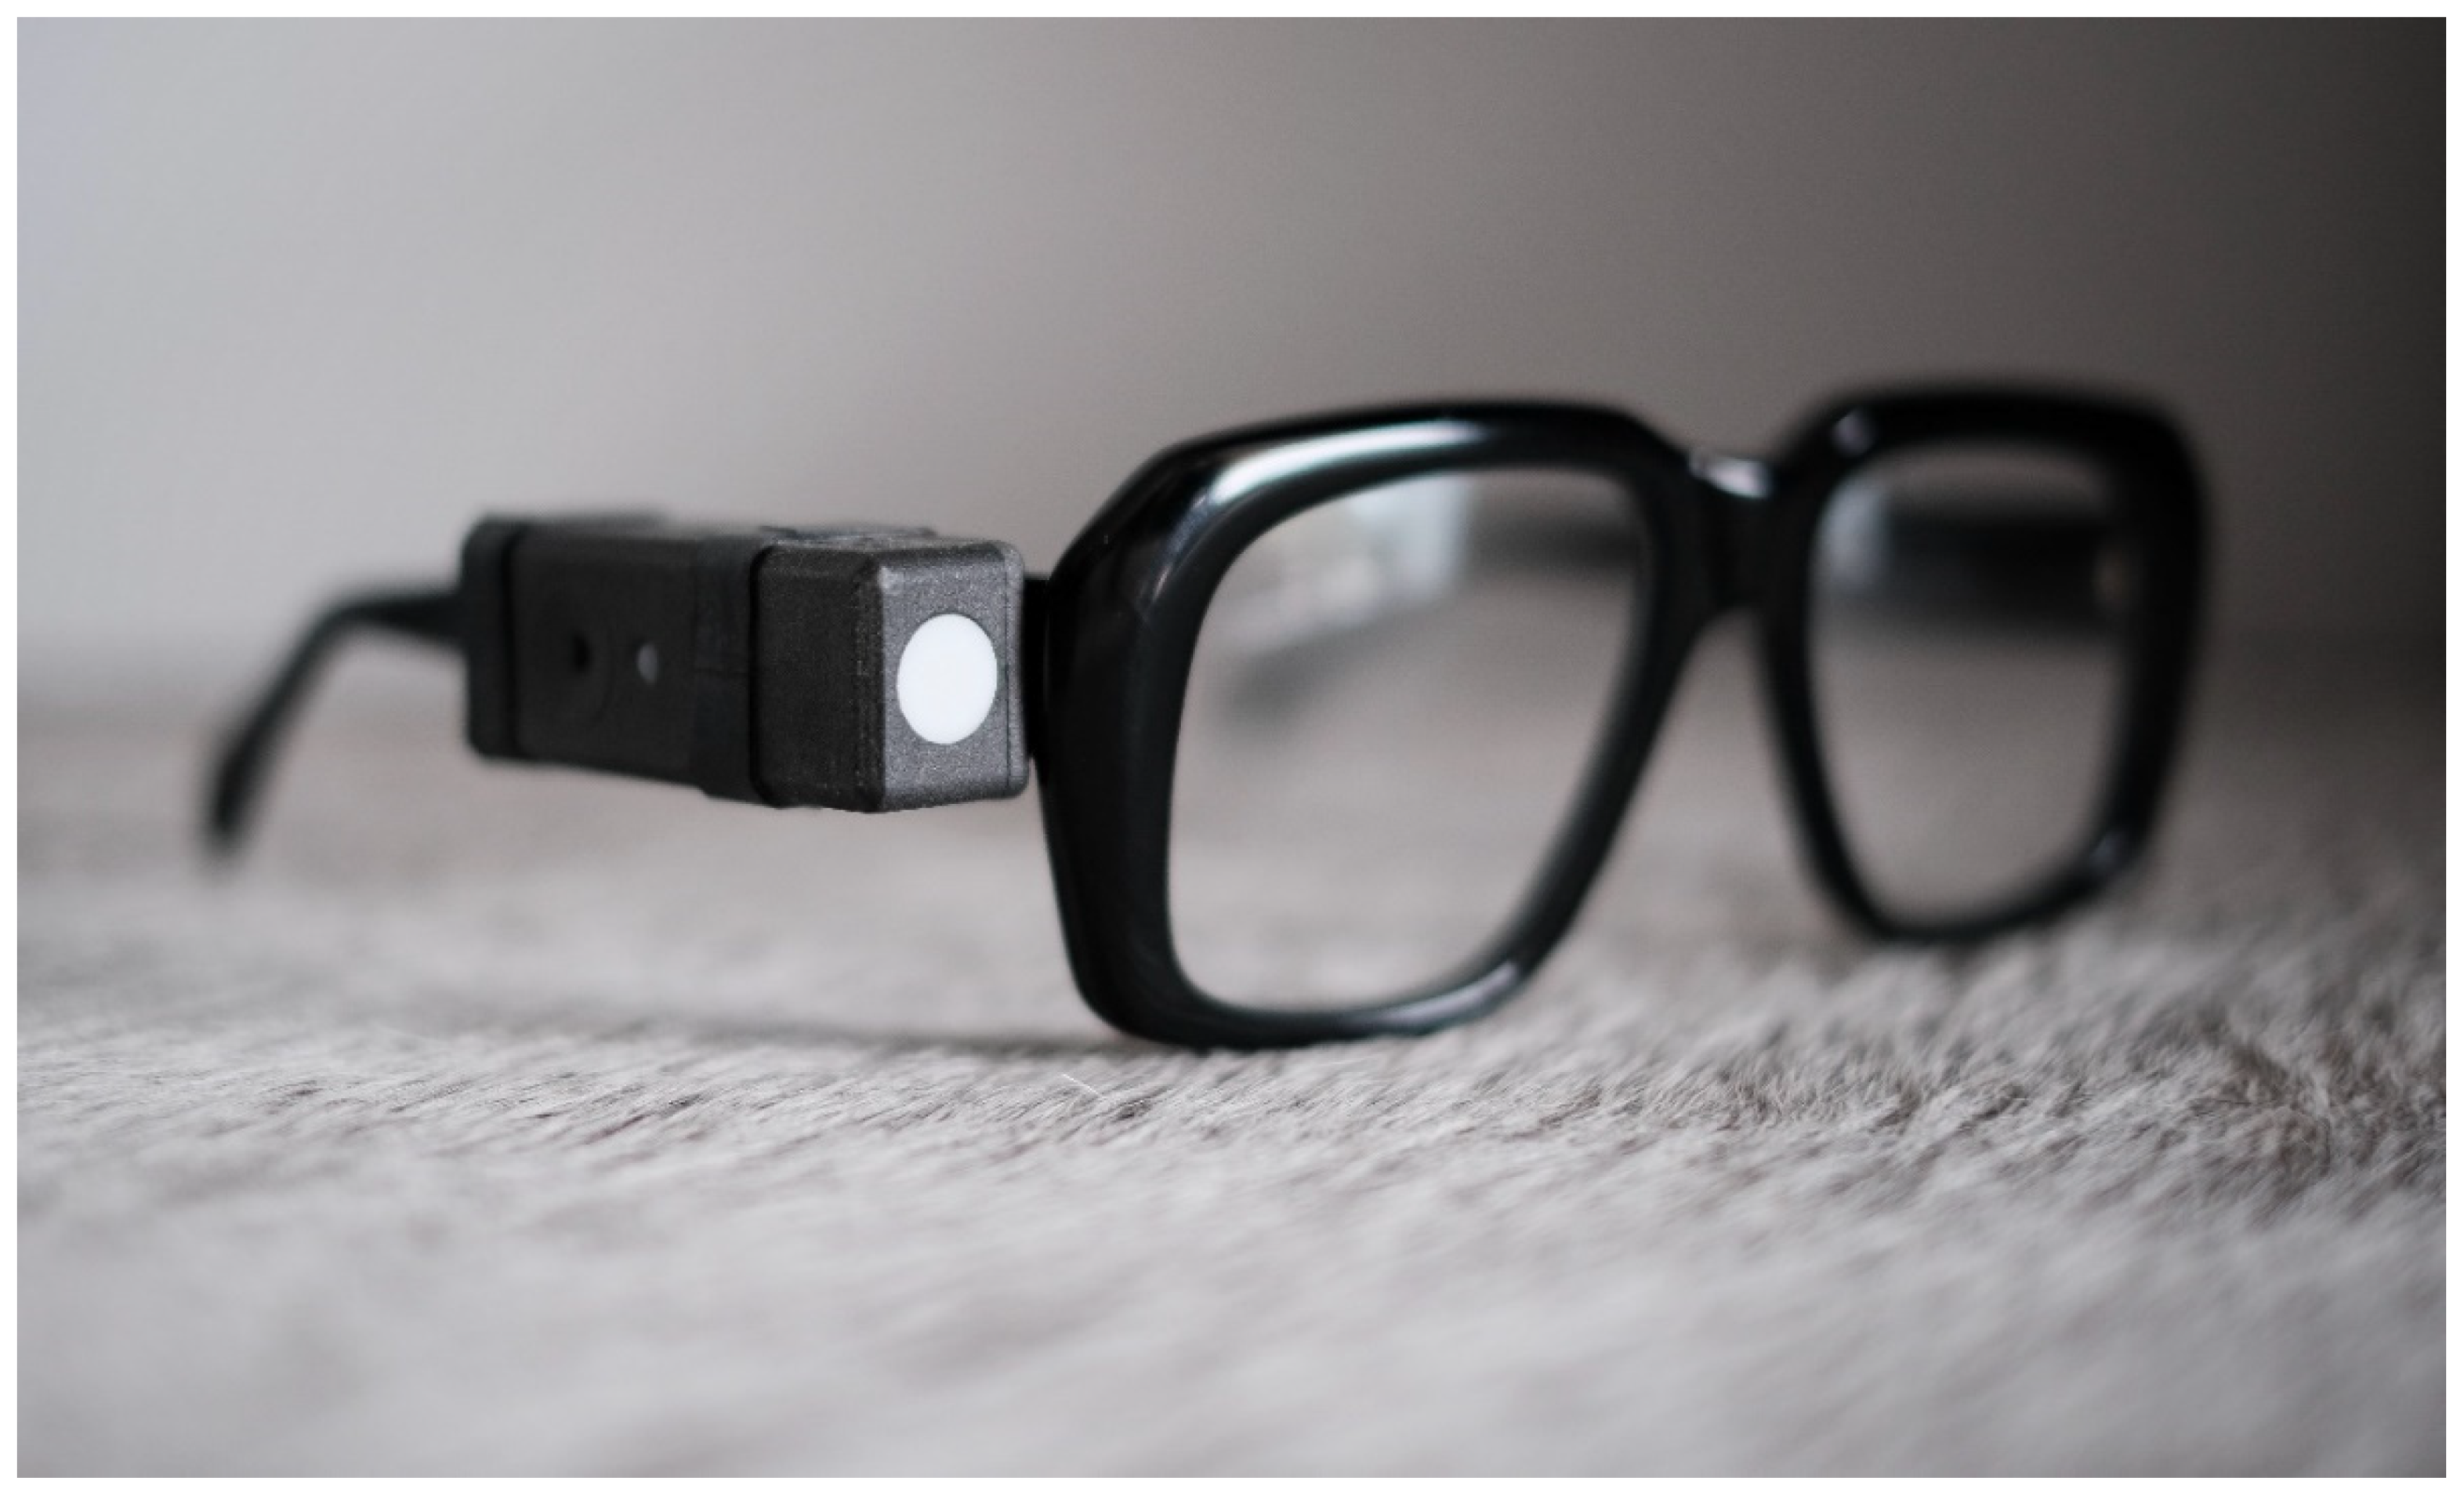
29] is a wearable instrument designed to assess non-visual responses to light (
Figure 9). When attached to a pair of eyeglasses, it captures time-series data (every 10 seconds) of light exposure in the near-corneal plane using the metrics defined in CIE S 026:2018 [
22]. The acquired data, e.g., the five α-opic EDIs (Equivalent Daylight Illuminances), can be processed directly in
LidoStudio (proprietary windows application specifically developed for the lido device) or exported as a comma-separated values (CSV) file for further analysis. The light dosimeters have been rigorously tested and validated by the Swiss Federal Institute of Metrology (METAS).
4.4. Data PRE-PROCESSING
THE DATA PRE-PROCESSING TO DETERMINE non-wear and sleep times was conducted in four steps, driven by a specific interest in quantifying the actual amount of light reaching participants’ eyes near the corneal plane:
1. Automated Tilt Angle Analysis for Non-Wear Detection: An automated method using R [
43] is utilized to infer non-wear periods based on the stability of the device’s tilt angle. This approach involves computing rolling averages of tilt angles over one-minute intervals, encompassing six measurements per interval. These rolling means are then compared with the actual tilt angles recorded. If the absolute difference between the rolling mean and the actual tilt angle remains under 3 degrees for a continuous period of at least three minutes, this stability is interpreted as an indication that the device was not worn, leading to the exclusion of these light measurements from further analysis.
2. Visual Inspection for Light Level Anomalies: The accuracy of wear-time analysis is enhanced through a visual inspection of light measurements. This process specifically targets and removes data where light levels are recorded at less than 1 lx during daylight hours. This step is crucial as algorithmic analysis may not identify instances where the device was stored in locations like a pocket or bag, which could mimic a wear situation.
3. Verification of Non-Wear Times Through Trigger Events and User Logs: Periods identified as non-wear are corroborated through a manual verification process that utilizes trigger times logged and detailed entries in user diaries. This involves a careful examination of reported times when the device was explicitly set aside, adding an additional layer of validation to the automated and visual inspection methods. All reported non-wear time ranges were removed manually if the automatic algorithms mentioned above had not yet removed them.
4. Estimation of Sleep Times Based on Last Known Movement: Sleep periods are estimated by analyzing the timestamps of the last recorded movement each day, coupled with entries from user diaries. If no movement is detected post 8 pm and the device is not picked up before 7 am the following morning, these intervals are categorized as sleep times. Records indicating that the device was set down before 8 pm without subsequent user interaction or diary notation to the contrary are considered implausible for sleep time and marked as ‘not applicable’ in the dataset.
The last three hours before each participant’s habitual bedtime were calculated individually and defined as evening. Daytime was determined individually from waking up until three hours before bedtime. Generally, the “melanopic Equivalent Daylight Illuminances” (mEDI) [
22,
44] is reported as this measure has been shown to be the best predictor of non-image-forming (NIF) effects of light [
45,
46,
47].
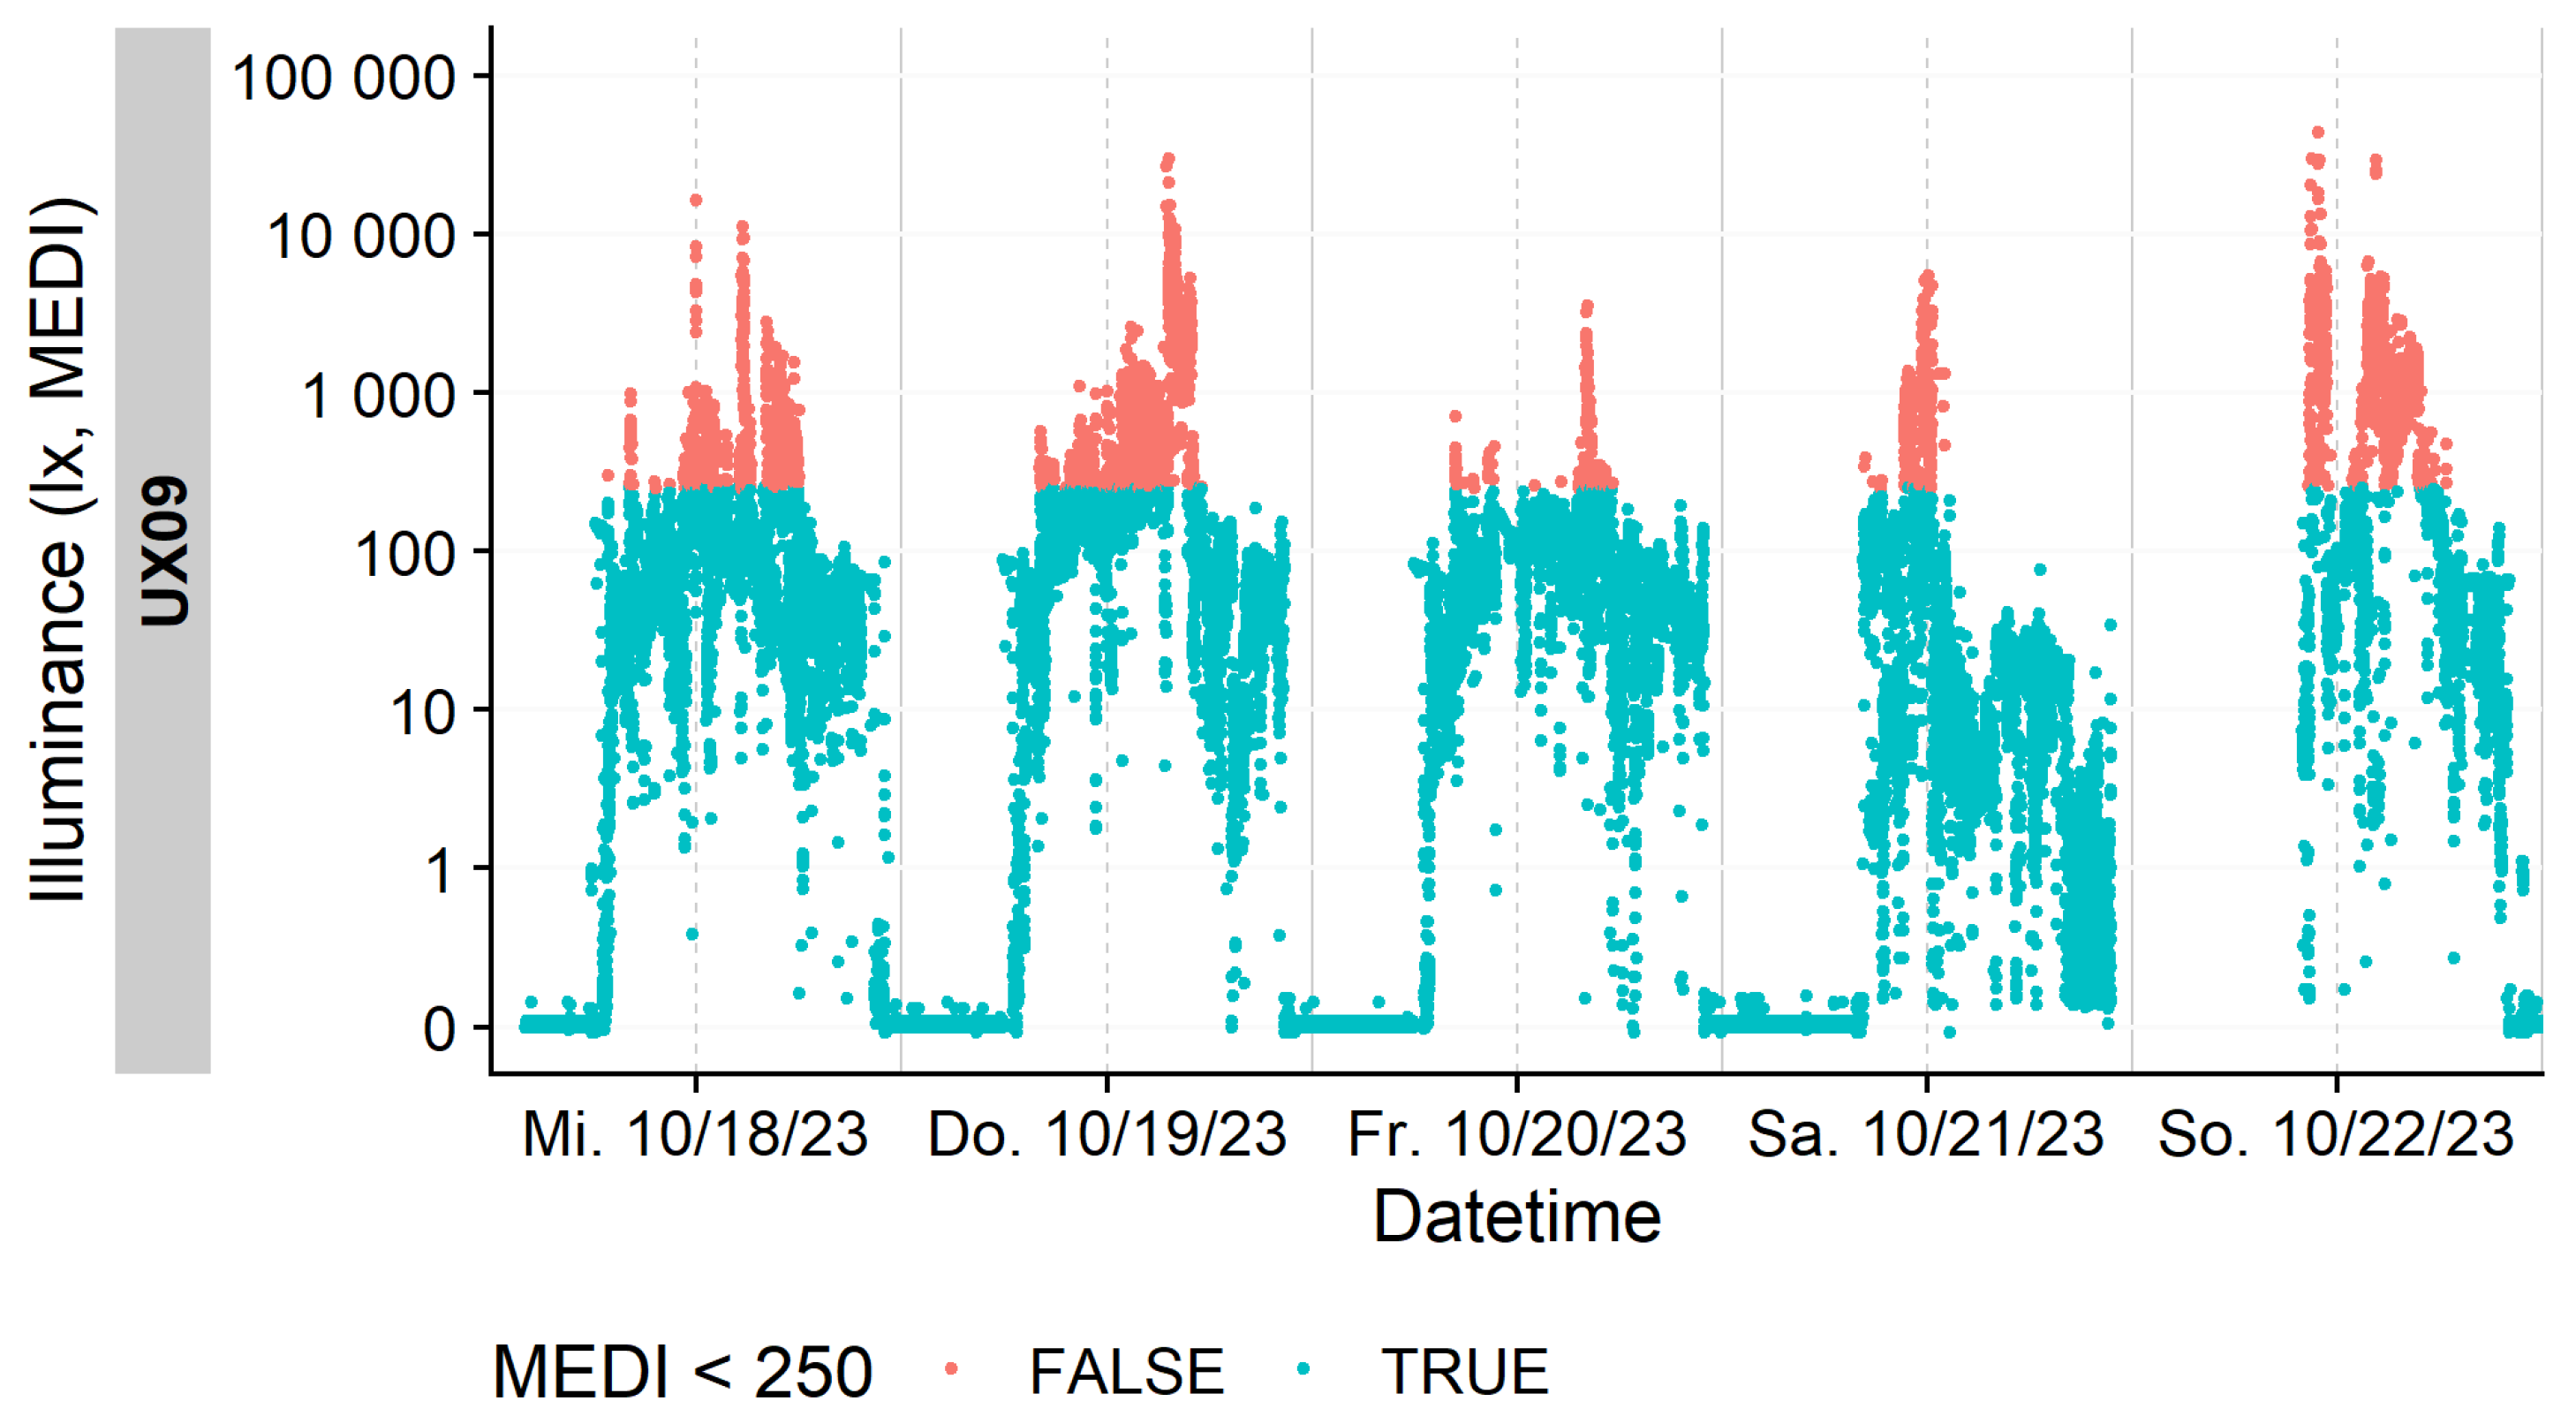
Figure 10 presents the raw individual light exposure data for a representative participant prior to the exclusion of non-wear periods. Light levels exceeding the recommended threshold of 250 lx
mEDI are highlighted in orange.
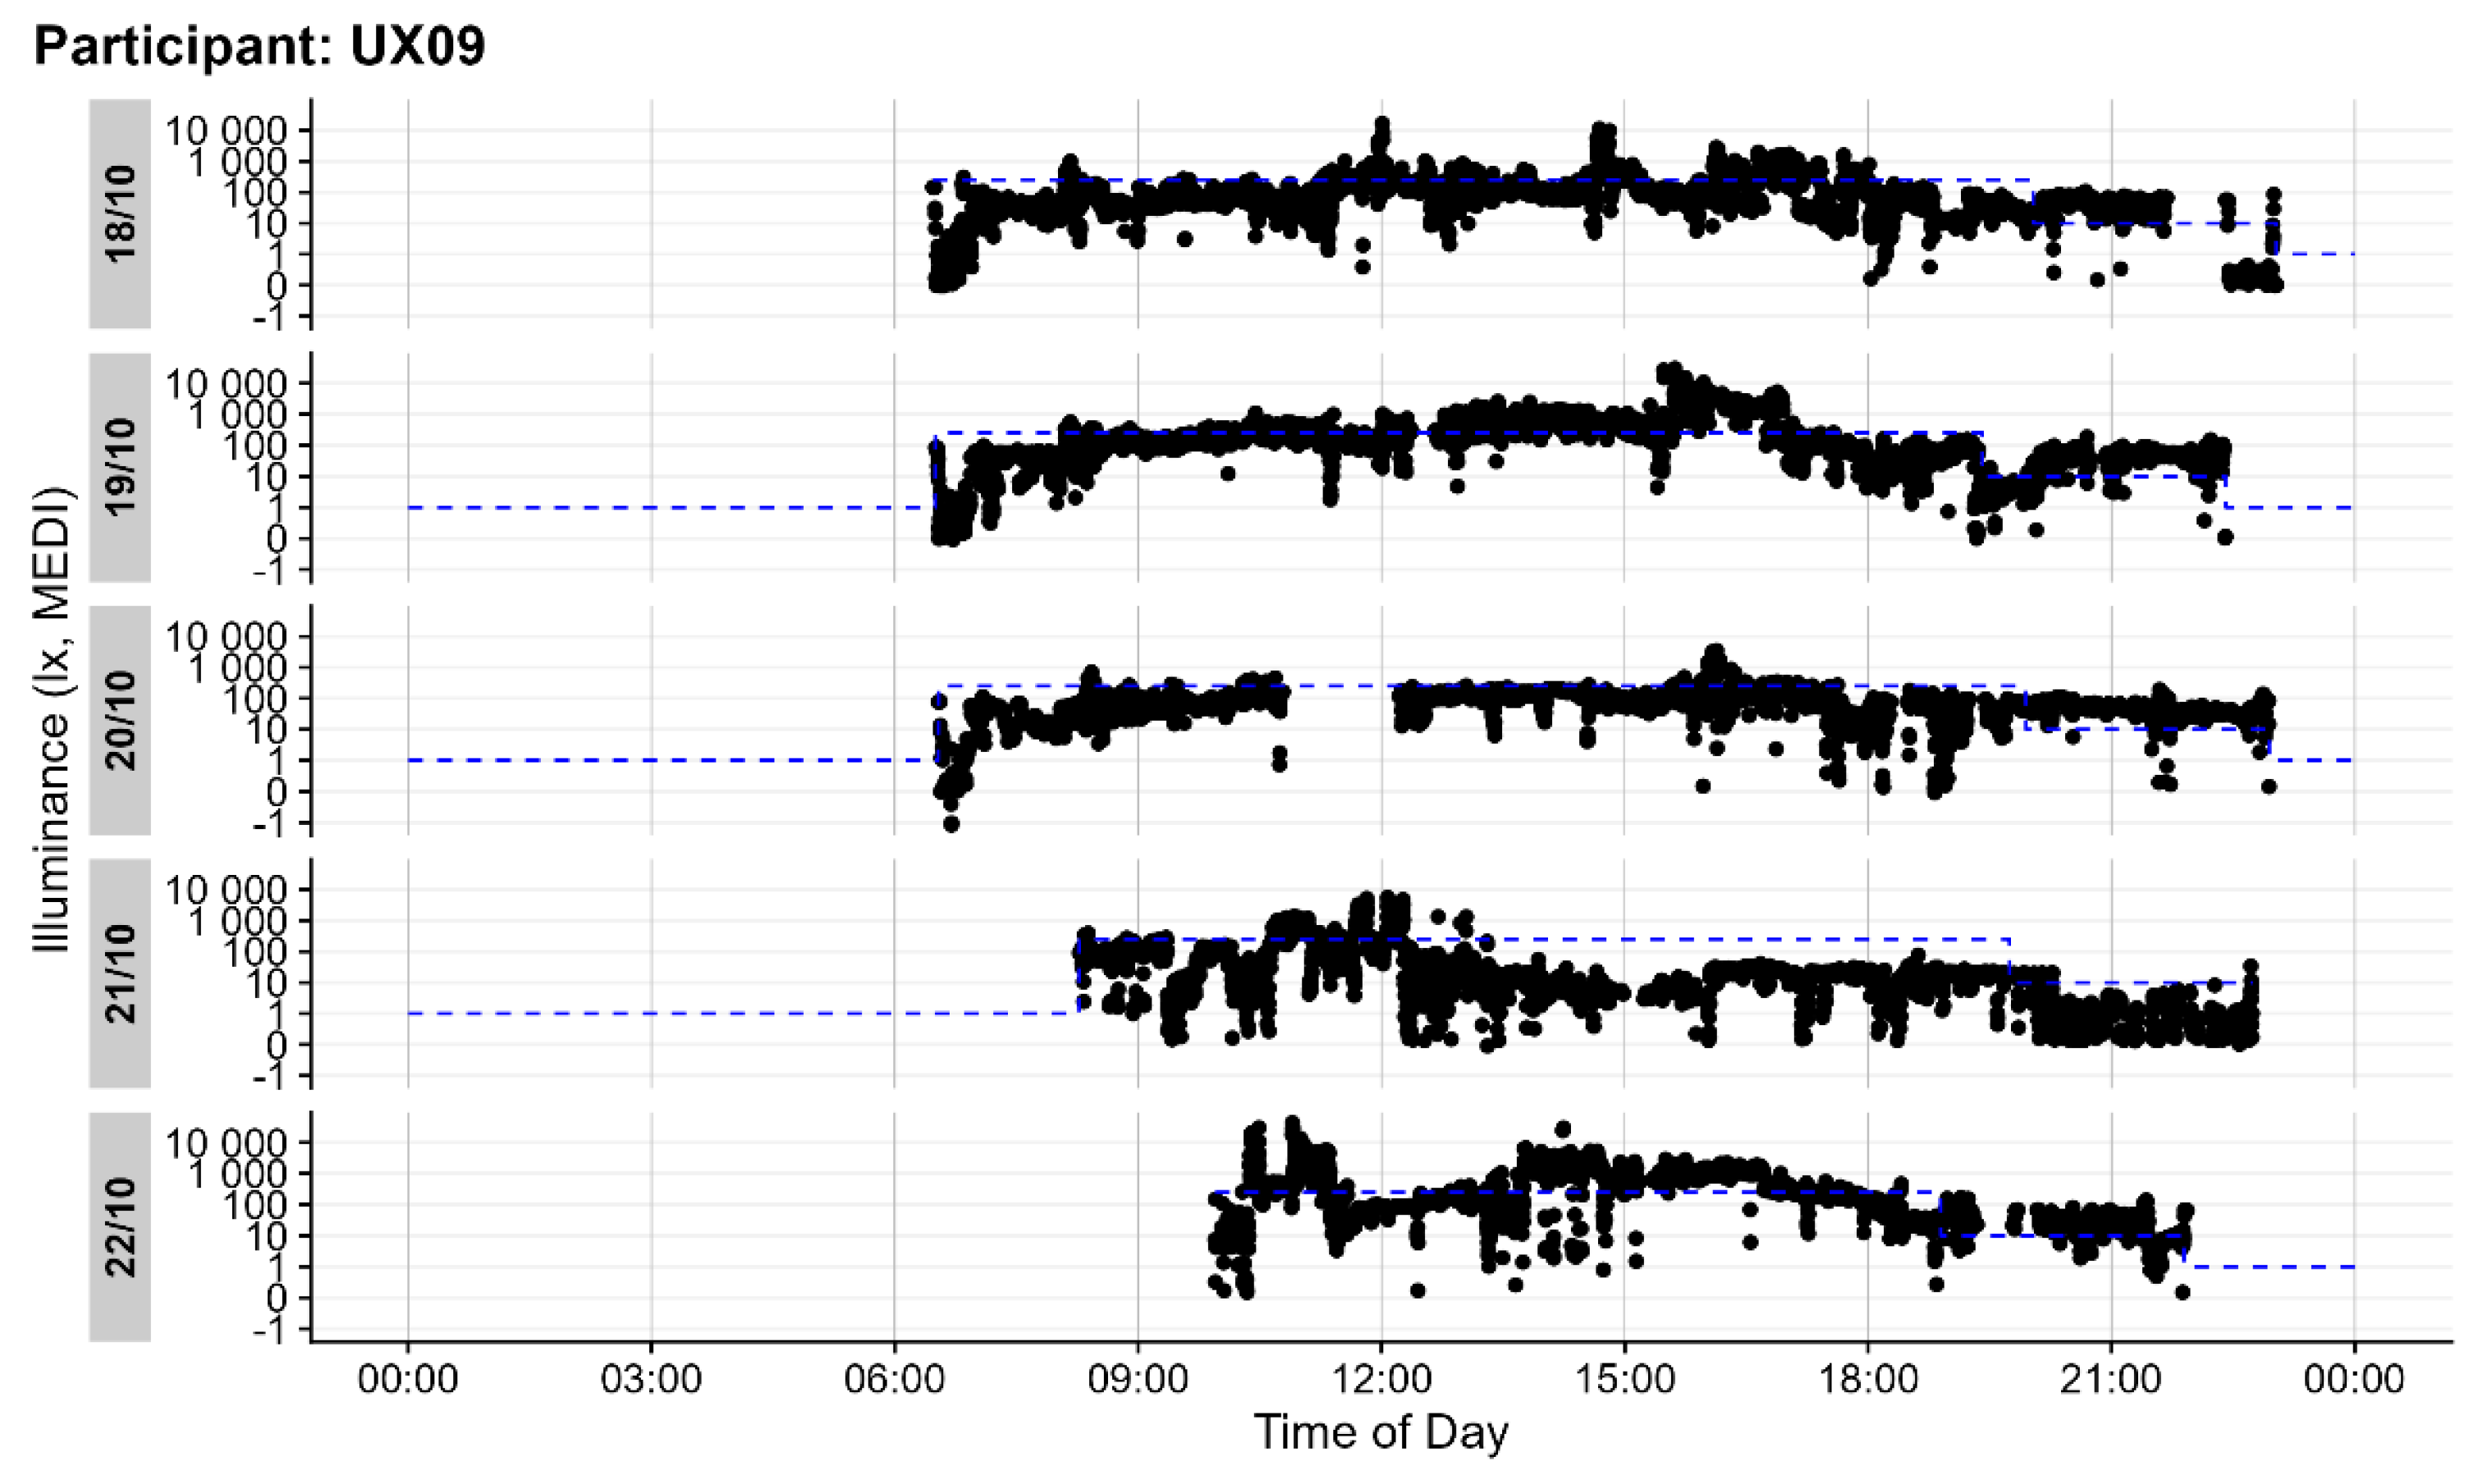
Figure 11 illustrates the individual light exposure for the same participant after data cleaning to account for non-wear periods. The analysis and visualization was performed using the LightLogR [
48] and EDAR [
49] software.
4.5. Statistics
Data were analyzed and visualized with R statistical software [
50] (Version 4.4.0) and the LightLogR [
43] (version 0.4.0) package. Inferential analysis was performed with Generalized Additive Mixed Models (GLMM) [
51,
52] through the mgcv [
52] (Version 1.9 – 1) package. Specifically, a cyclic (24-hour) smooth was fitted to the logarithmic (base 10) transformed values of melanopic EDI, with participants as random effects. To test the effect of chronotype on the daily light patterns, the five theoretical model types according to Pederson et al. [
53] were implemented and compared through Akaike’s Information Criterion (AIC), as suggested by several sources on GAM(M)s [
52,
53,
54]. Following the example of Pedersen et al., models that differ by two units or less from the lower AIC have substantial support, with the more parsimonious model to be preferred.
5. Conclusions and Recommendations
We conducted a thematic analysis of participants’ reasons for not wearing the lido light dosimeter. The primary reasons identified included attending public events, needing to recharge the battery, exposure to wet environments, discomfort with the device, and engaging in exercise. Despite these challenges, compliance remained high, with 89% of wear time during waking hours.
Recognizing that compliance is influenced by various factors beyond the device itself, user challenges can be mitigated through clear instructions, support and appropriate user guidance. Effective compliance strategies should include thorough training to educate users about the importance of consistent device use, complemented by motivational incentives, both intrinsic (e.g., contributing to scientific research) and extrinsic (e.g., financial incentives, personalized reports).
To accurately identify non-wear periods, continuous monitoring and support systems should be implemented, such as auxiliary data from actimetry or tilt sensors. These systems can promptly address problems, reinforce proper usage habits, and assist in cleaning data for non-wear periods. Additional biometric measurements, such as skin conductance, temperature or heart rate, could further detect non-wear times and improve data accuracy. While participant diaries help to contextualize the data collected, the integration of automated supplementary data can reduce the burden on participants.
An unobtrusive and innovative design could make eye-worn devices less noticeable to both, the wearer and others in public settings. Future designs should aim to minimize size and weight while improving aesthetics and avoiding a camera-like appearance to increase acceptance and compliance. Exploring alternatives to spectacle frame attachments could also make devices less obtrusive when worn near the eye. Addressing the specific challenges faced by different demographic groups, such as aesthetic concerns in young adults, can improve device usability, participant comfort and compliance. Additionally, developing adaptable fitting methods and incorporating waterproofing features for those who engage in outdoor exercise, could further enhance usability and acceptance.
Although the mean melanopic Equivalent Daylight Illuminance was nearly 300 lxmEDI, suggesting adequate light exposure during the day, the median mEDI was only 51 lxmEDI. This discrepancy indicates that, for most of the time, participants experienced significantly lower light levels. Specifically, participants were exposed to light levels above 250 lxmEDI for only 14% of their wearing time.
Supplementary Materials
The following supporting information can be downloaded at the website of this paper posted on
Preprints.org, Complete participant responses: Reasons for not wearing and additional factors related to wearing lido per participant.
Author Contributions
Conceptualization, O.S., J.S. and B.S.; methodology, O.S. and J.S.; software, O.S., R.M. and J.Z.; validation, O.S., R.M., J.S., J.Z. and B.S.; formal analysis, O.S., J.S. and J.Z.; investigation, O.S. and S.P.; resources, O.S., R.M., J.S., J.Z. and B.S.; data curation, O.S., R.M. J.S. and J.Z.; writing—original draft preparation, O.S.; writing—review and editing, O.S., R.M., J.S., J.Z. and B.S.; visualization, O.S.; supervision, O.S. and B.S.; project administration, O.S. and B.S.; funding acquisition, B.S. All authors have read and agreed to the published version of the manuscript.
Funding
This work was funded by the Velux Foundation Switzerland Project 1730. O.S. received financial support for this work by his employer, Lucerne University of Applied Sciences and Arts, Lucerne, Switzerland. J.Z. was financially supported by MeLiDos. The project (22NRM05 MeLiDos) has received funding from the European Partnership on Metrology, co-financed by the European Union’s Horizon Europe Research and Innovation Programme and by the Participating States.
Institutional Review Board Statement
The study was conducted in accordance with the Declaration of Helsinki and approved by the Institutional Review Board of Lucerne University of Applied Sciences and Arts (protocol code EK-HSLU 006 TA 23, 30.08.2024).
Informed Consent Statement
Informed consent was obtained from all subjects involved in the study.
Data Availability Statement
The raw light measurement data, along with the cleaned dataset used for analysis, will be made available on Zenodo upon acceptance of the manuscript. A DOI for the Zenodo repository will be provided.
Acknowledgments
The authors gratefully acknowledge the assistance of AI-based tools, including those provided by OpenAI’s language models, in helping to troubleshoot and improve the R code used in this study.
Conflicts of Interest
R.M., J.S., S.P., J.Z. and B.S. declare no conflicts of interest. O.S. is listed as an inventor on the following patents: (“Display system having a circadian effect on humans”, US8646939B2; “Projection system and method for projecting image content”, DE102010047207B4; “Adaptive lighting system”, US8994292B2; “Projection device and filter therefor”, WO2006013041A1; “Method for the selective adjustment of a desired brightness and/or colour of a specific spatial area, and data processing device”, WO2016092112A1). O.S. is a member of the Daylight Academy, Good Light Group and Swiss Lighting Society. O.S. has had the following commercial interests in the last two years (2022–2024) related to lighting: Investigator-initiated research grants from SBB, Skyguide, VELUX and Porsche. The funders had no role in the design of the study; in the collection, analyses, or interpretation of data; in the writing of the manuscript; or in the decision to publish the results.
References
- Knoop, M.; Stefani, O.; Bueno, B.; Matusiak, B.; Hobday, R.; Wirz-Justice, A.; Martiny, K.; Kantermann, T.; Aarts, M.P.J.; Zemmouri, N.; et al. Daylight: What Makes the Difference? Light. Res. Technol. Lond. Engl. 2001 2020, 52, 423–442. [CrossRef]
- DIN Media GmbH. DIN EN 12464-1:2021-11, Licht Und Beleuchtung_- Beleuchtung von Arbeitsstätten_- Teil_1: Arbeitsstätten in Innenräumen; Deutsche Fassung EN_12464-1:2021; [CrossRef]
- Boivin, D.B.; Duffy, J.F.; Kronauer, R.E.; Czeisler, C.A. Dose-Response Relationships for Resetting of Human Circadian Clock by Light. Nature 1996, 379, 540–542. [CrossRef]
- Khalsa, S.B.S.; Jewett, M.E.; Cajochen, C.; Czeisler, C.A. A Phase Response Curve to Single Bright Light Pulses in Human Subjects. J. Physiol. 2003, 549, 945–952. [CrossRef]
- Lewy, A.J. Effects of Light on Human Melatonin Production and the Human Circadian System. Prog. Neuropsychopharmacol. Biol. Psychiatry 1983, 7, 551–556. [CrossRef]
- St Hilaire, M.A.; Ámundadóttir, M.L.; Rahman, S.A.; Rajaratnam, S.M.W.; Rüger, M.; Brainard, G.C.; Czeisler, C.A.; Andersen, M.; Gooley, J.J.; Lockley, S.W. The Spectral Sensitivity of Human Circadian Phase Resetting and Melatonin Suppression to Light Changes Dynamically with Light Duration. Proc. Natl. Acad. Sci. 2022, 119, e2205301119. [CrossRef]
- Gubin, D.; Danilenko, K.; Stefani, O.; Kolomeichuk, S.; Markov, A.; Petrov, I.; Voronin, K.; Mezhakova, M.; Borisenkov, M.; Shigabaeva, A.; et al. Blue Light and Temperature Actigraphy Measures Predicting Metabolic Health Are Linked to Melatonin Receptor Polymorphism. Biology 2023, 13. [CrossRef]
- Ishihara, A.; Courville, A.B.; Chen, K.Y. The Complex Effects of Light on Metabolism in Humans. Nutrients 2023, 15. [CrossRef]
- Cajochen, C.; Zeitzer, J.M.; Czeisler, C.A.; Dijk, D.J. Dose-Response Relationship for Light Intensity and Ocular and Electroencephalographic Correlates of Human Alertness. Behav. Brain Res. 2000, 115, 75–83. [CrossRef]
- Chellappa, S.L.; Steiner, R.; Blattner, P.; Oelhafen, P.; Götz, T.; Cajochen, C. Non-Visual Effects of Light on Melatonin, Alertness and Cognitive Performance: Can Blue-Enriched Light Keep Us Alert? PloS One 2011, 6, e16429. [CrossRef]
- Milosavljevic, N. How Does Light Regulate Mood and Behavioral State? Clocks Sleep 2019, 1, 319–331. [CrossRef]
- Rahman, S.A.; Flynn-Evans, E.E.; Aeschbach, D.; Brainard, G.C.; Czeisler, C.A.; Lockley, S.W. Diurnal Spectral Sensitivity of the Acute Alerting Effects of Light. Sleep 2014, 37, 271–281. [CrossRef]
- Vandewalle, G.; Schwartz, S.; Grandjean, D.; Wuillaume, C.; Balteau, E.; Degueldre, C.; Schabus, M.; Phillips, C.; Luxen, A.; Dijk, D.J.; et al. Spectral Quality of Light Modulates Emotional Brain Responses in Humans. Proc. Natl. Acad. Sci. U. S. A. 2010, 107, 19549–19554. [CrossRef]
- Vandewalle, G.; Maquet, P.; Dijk, D.-J. Light as a Modulator of Cognitive Brain Function. Trends Cogn. Sci. 2009, 13, 429–438. [CrossRef]
- Zauner, J.; Plischke, H.; Stijnen, H.; Schwarz, U.T.; Strasburger, H. Influence of Common Lighting Conditions and Time-of-Day on the Effort-Related Cardiac Response. PLOS ONE 2020, 15, e0239553. [CrossRef]
- Münch, M.; Wirz-Justice, A.; Brown, S.A.; Kantermann, T.; Martiny, K.; Stefani, O.; Vetter, C.; Wright, K.P.; Wulff, K.; Skene, D.J. The Role of Daylight for Humans: Gaps in Current Knowledge. Clocks Sleep 2020, 2, 61–85. [CrossRef]
- Boubekri, M.; Cheung, I.N.; Reid, K.J.; Wang, C.-H.; Zee, P.C. Impact of Windows and Daylight Exposure on Overall Health and Sleep Quality of Office Workers: A Case-Control Pilot Study. J. Clin. Sleep Med. JCSM Off. Publ. Am. Acad. Sleep Med. 2014, 10, 603–611. [CrossRef]
- Figueiro, M.G.; Rea, M.S. Office Lighting and Personal Light Exposures in Two Seasons: Impact on Sleep and Mood. Light. Res. Technol. 2016, 48, 352–364. [CrossRef]
- Hubalek, S.; Brink, M.; Schierz, C. Office Workers’ Daily Exposure to Light and Its Influence on Sleep Quality and Mood. Light. Res. Technol. 2010, 42, 33–50. [CrossRef]
- Didikoglu, A.; Mohammadian, N.; Johnson, S.; van Tongeren, M.; Wright, P.; Casson, A.J.; Brown, T.M.; Lucas, R.J. Associations between Light Exposure and Sleep Timing and Sleepiness While Awake in a Sample of UK Adults in Everyday Life. Proc. Natl. Acad. Sci. 2023, 120, e2301608120. [CrossRef]
- Schöllhorn, I.; Stefani, O.; Blume, C.; Cajochen, C. Seasonal Variation in the Responsiveness of the Melanopsin System to Evening Light: Why We Should Report Season When Collecting Data in Human Sleep and Circadian Studies. Clocks Sleep 2023, 5, 651–666. [CrossRef]
- CIE S 026 CIE S 026/E:2018 CIE System for Metrology of Optical Radiation for ipRGC-Influenced Responses to Light. Color Res. Appl. 2019, 44, 316–316. [CrossRef]
- Hartmeyer, S.L.; Webler, F.S.; Andersen, M. Towards a Framework for Light-Dosimetry Studies: Methodological Considerations. Light. Res. Technol. Lond. Engl. 2001 2022, 55, 377–399. [CrossRef]
- Spitschan, M.; Smolders, K.; Vandendriessche, B.; Bent, B.; Bakker, J.P.; Rodriguez-Chavez, I.R.; Vetter, C. Verification, Analytical Validation and Clinical Validation (V3) of Wearable Dosimeters and Light Loggers. Digit. Health 2022, 8, 20552076221144858. [CrossRef]
- Figueiro, M.G.; Hamner, R.; Bierman, A.; Rea, M.S. Comparisons of Three Practical Field Devices Used to Measure Personal Light Exposures and Activity Levels. Light. Res. Technol. Lond. Engl. 2001 2013, 45, 421–434. [CrossRef]
- Bhandari, K.R.; Mirhajianmoghadam, H.; Ostrin, L.A. Wearable Sensors for Measurement of Viewing Behavior, Light Exposure, and Sleep. Sensors 2021, 21, 7096. [CrossRef]
- Danilenko, K.V.; Stefani, O.; Voronin, K.A.; Mezhakova, M.S.; Petrov, I.M.; Borisenkov, M.F.; Markov, A.A.; Gubin, D.G. Wearable Light-and-Motion Dataloggers for Sleep/Wake Research: A Review. Appl. Sci. 2022, 12, 11794. [CrossRef]
- Schöllhorn, I.; Stefani, O.; Lucas, R.J.; Spitschan, M.; Slawik, H.C.; Cajochen, C. Melanopic Irradiance Defines the Impact of Evening Display Light on Sleep Latency, Melatonin and Alertness. Commun. Biol. 2023, 6, 228. [CrossRef]
- Stampfli; Schrader, B.; Di Battista, C.; Häfliger, R.; Schälli, O.; Wichmann, G.; Zumbühl, C.; Blattner, P.; Cajochen, C.; Lazar, R.; et al. The Light-Dosimeter: A New Device to Help Advance Research on the Non-Visual Responses to Light. Light. Res. Technol. Lond. Engl. 2001 2023, 147715352211471. [CrossRef]
- Aarts, M.P.J.; van Duijnhoven, J.; Aries, M.B.C.; Rosemann, A.L.P. Performance of Personally Worn Dosimeters to Study Non-Image Forming Effects of Light: Assessment Methods. Build. Environ. 2017, 117, 60–72. [CrossRef]
- Balajadia, E.; Garcia, S.; Stampfli, J.; Schrader, B.; Guidolin, C.; Spitschan, M. Usability and Acceptability of a Corneal-Plane α-Opic Light Logger in a 24-h Field Trial. Digit. Biomark. 2023, 7, 139–149. [CrossRef]
- Braun, V.; Clarke, V. Using Thematic Analysis in Psychology. Qual. Res. Psychol. 2006, 3, 77–101. [CrossRef]
- Kelly, N.; Gilbert, S.B. The Wearer, the Device, and Its Use: Advances in Understanding the Social Acceptability of Wearables. Proc. Hum. Factors Ergon. Soc. Annu. Meet. 2018, 62, 1027–1031. [CrossRef]
- Kelly, N.; Gilbert, S. The WEAR Scale: Developing a Measure of the Social Acceptability of a Wearable Device. In Proceedings of the Proceedings of the 2016 CHI Conference Extended Abstracts on Human Factors in Computing Systems; Association for Computing Machinery: New York, NY, USA, 2016; pp. 2864–2871.
- Brown, T.M.; Brainard, G.C.; Cajochen, C.; Czeisler, C.A.; Hanifin, J.P.; Lockley, S.W.; Lucas, R.J.; Münch, M.; O’Hagan, J.B.; Peirson, S.N.; et al. Recommendations for Daytime, Evening, and Nighttime Indoor Light Exposure to Best Support Physiology, Sleep, and Wakefulness in Healthy Adults. PLOS Biol. 2022, 20, e3001571. [CrossRef]
- Wittmann, M.; Dinich, J.; Merrow, M.; Roenneberg, T. Social Jetlag: Misalignment of Biological and Social Time. Chronobiol. Int. 2006, 23, 497–509. [CrossRef]
- Scheuermaier, K.; Laffan, A.M.; Duffy, J.F. Light Exposure Patterns in Healthy Older and Young Adults. J. Biol. Rhythms 2010, 25, 113–122. [CrossRef]
- Guillemette, J.; Hébert, M.; Paquet, J.; Dumont, M. Natural Bright Light Exposure in the Summer and Winter in Subjects with and without Complaints of Seasonal Mood Variations. Biol. Psychiatry 1998, 44, 622–628. [CrossRef]
- Lee, E.E.; Amritwar, A.; Hong, L.E.; Mohyuddin, I.; Brown, T.; Postolache, T.T. Daily and Seasonal Variation in Light Exposure among the Old Order Amish. Int. J. Environ. Res. Public. Health 2020, 17, 4460. [CrossRef]
- Thorne, H.C.; Jones, K.H.; Peters, S.P.; Archer, S.N.; Dijk, D.-J. Daily and Seasonal Variation in the Spectral Composition of Light Exposure in Humans. Chronobiol. Int. 2009, 26, 854–866. [CrossRef]
- Horne, J.A.; Ostberg, O. A Self-Assessment Questionnaire to Determine Morningness-Eveningness in Human Circadian Rhythms. Int. J. Chronobiol. 1976, 4, 97–110.
- Kelly, N. The WEAR Scale: Development of a Measure of the Social Acceptability of a Wearable Device. Doctor of Philosophy, Iowa State University, Digital Repository: Ames, 2016, p. 9199807.
- Johannes Zauner; Steffen Hartmeyer; Manuel Spitschan Tscnlab/LightLogR: V0.4.0 2024.
- CIE JTC 8 CIE S 017/E:2020 ILV: International Lighting Vocabulary, 2nd Edition 2020.
- Brown, T.M. Melanopic Illuminance Defines the Magnitude of Human Circadian Light Responses under a Wide Range of Conditions. J. Pineal Res. 2020, 69. [CrossRef]
- Giménez, M.C.; Stefani, O.; Cajochen, C.; Lang, D.; Deuring, G.; Schlangen, L.J.M. Predicting Melatonin Suppression by Light in Humans: Unifying Photoreceptor-Based Equivalent Daylight Illuminances, Spectral Composition, Timing and Duration of Light Exposure. J. Pineal Res. 2022, 72, e12786. [CrossRef]
- Lucas, R.J.; Peirson, S.N.; Berson, D.M.; Brown, T.M.; Cooper, H.M.; Czeisler, C.A.; Figueiro, M.G.; Gamlin, P.D.; Lockley, S.W.; O’Hagan, J.B.; et al. Measuring and Using Light in the Melanopsin Age. Trends Neurosci. 2014, 37, 1–9. [CrossRef]
- Johannes Zauner; Steffen Hartmeyer; Manuel Spitschan Tscnlab/LightLogR: V0.4.0 2024.
- Marek, Reto EDAR.
- R Core Team R: A Language and Environment for Statistical Computing. MSOR Connect. 2014, 1.
- Hastie, T.; Tibshirani, R. Generalized Additive Models. Stat. Sci. 1986, 1. [CrossRef]
- Wood, S.N. Generalized Additive Models: An Introduction with R; 2nd ed.; Chapman and Hall/CRC, 2017; ISBN 978-1-315-37027-9.
- Pedersen, E.J.; Miller, D.L.; Simpson, G.L.; Ross, N. Hierarchical Generalized Additive Models in Ecology: An Introduction with Mgcv. PeerJ 2019, 7, e6876. [CrossRef]
- Simpson, G.L. Modelling Palaeoecological Time Series Using Generalised Additive Models. Front. Ecol. Evol. 2018, 6, 149. [CrossRef]
Figure 1.
Wearing times (blue bars) as a function of day of week and time of day. Hatched grey bars represent non-wear times. Total length represents recording time excluding sleep. Excluding sleep and the habitual 3 hours before going to bed, compliance was high at 92% between Wednesdays and Fridays (weekdays) during daytime. At weekends in the evening lidos were worn 82% of the recording time. The total length of bar “5 days of waking time” depicts the total recording time excluding sleep.
Figure 2.
Timeline (x-axis) of the experiment and when a lido was worn by a participant. A total of n=29 participants took part in the experiment (y-axis). Participant UX02 stopped wearing lido due to illness. As the same lido was assigned to UX02, the grey line indicates non-wear time. The lido was worn for five consecutive days afterwards from 1 November onwards. UX10 stopped wearing the lido during the fourth day because the device was out of battery and could not be charged anymore. UX07 got sick during the first scheduled wearing time and stopped wearing the device.
Figure 3.
Mean and median melanopic Equivalent Daylight Illuminance from n=29 participants wearing the lido for five consecutive days. There is a significant difference between mean values (black line) and median values (red line). The dashed line indicates the lower limit of recommended daytime light exposure, and the dotted line indicates the upper limit of recommended evening light exposure.
Figure 4.
Density plot of mEDI in lx and time in hours during daytime. The grey area depicts light levels below the recommended 250 lxmEDI. The time in hours was calculated by multiplying the number of measurements by 360, as the measurement interval was every 10 seconds.
Figure 4.
Density plot of mEDI in lx and time in hours during daytime. The grey area depicts light levels below the recommended 250 lxmEDI. The time in hours was calculated by multiplying the number of measurements by 360, as the measurement interval was every 10 seconds.
Figure 5.
Density plot of mEDI in lx and time in hours during the evening (i.e., 3 h before bedtime). The grey area depicts light levels above the recommended 10 lxmEDI. The time in hours was calculated by multiplying the number of measurements by 360, as the measurement interval was every 10 seconds.
Figure 6.
Unobstructed outdoor light measurements during the study period from 8 October to 4 December 2024 in Lucerne. As the spectral characteristics of daylight are very close to the standard illuminant D65, values can be considered as mEDI values. The dashed line indicates the lower limit of recommended daytime light exposure.
Figure 7.
Mean equivalent daylight illuminance from n=29 participants wearing the lido for five consecutive days. Moderate evening types recorded no light exposure at the eye before 7:30 am and moderate morning types did not record light exposure after midnight.
Figure 7.
Mean equivalent daylight illuminance from n=29 participants wearing the lido for five consecutive days. Moderate evening types recorded no light exposure at the eye before 7:30 am and moderate morning types did not record light exposure after midnight.
Figure 8.
Violin plot of the pick-up times in the morning (presumably wakeup times of the participants) during the week (Wednesday, Thursday and Friday) vs. the weekend.
Figure 8.
Violin plot of the pick-up times in the morning (presumably wakeup times of the participants) during the week (Wednesday, Thursday and Friday) vs. the weekend.
Figure 9.
The wearable light dosimeter “lido” attached to a pair of glasses. The white circle is the diffusor. The small grey circle on the left is an indicator light that flashes green every 10 s (0.1 Hz) when recording.
Figure 9.
The wearable light dosimeter “lido” attached to a pair of glasses. The white circle is the diffusor. The small grey circle on the left is an indicator light that flashes green every 10 s (0.1 Hz) when recording.
Figure 10.
Individual light exposure of one exemplary participant before cleaning data according to non-wear times. Depicted in orange are the light levels above the recommended 250 lxmEDI.
Figure 10.
Individual light exposure of one exemplary participant before cleaning data according to non-wear times. Depicted in orange are the light levels above the recommended 250 lxmEDI.
Figure 11.
Individual light exposure of one exemplary participant after cleaning data according to non-wear times. The y-axis depicts mEDI in lx for each of the 5 days. The x-axis depicts the time of day. The blue dotted line indicates the 250 lxmEDI level during the day and the 10 lxmEDI level 3 hours before bedtime (adjusted for individual bedtime).
Table 1.
Light characteristics at eye level of N=29 participants during 5 days in autumn in Switzerland.
Table 1.
Light characteristics at eye level of N=29 participants during 5 days in autumn in Switzerland.
| mEDI in lx |
mean |
median |
minimum |
1st quartile |
3rd quartile |
maximum |
| daytime |
356 |
67 |
0 |
20 |
165 |
93 432 |
| evening |
32 |
7 |
0 |
2 |
22 |
19 376 |
| overall |
299 |
51 |
0 |
11 |
138 |
93 432 |
Table 2.
Overview of different Likert Scales for the WEAR score used in various studies.
Table 2.
Overview of different Likert Scales for the WEAR score used in various studies.
| Options |
5-point Likert Scale |
6-point Likert Scale |
7-point Likert Scale |
| |
(current study) |
(Kelly [34,42]) |
(Balajadia et al. [31]) |
| strongly disagree |
1 |
1 |
1 |
| disagree |
2 |
2 |
2 |
| somewhat disagree |
|
3 |
3 |
| neither agree nor disagree |
3 |
|
4 |
| somewhat agree |
|
4 |
5 |
| agree |
4 |
5 |
6 |
| strongly agree |
5 |
6 |
7 |
|
Disclaimer/Publisher’s Note: The statements, opinions and data contained in all publications are solely those of the individual author(s) and contributor(s) and not of MDPI and/or the editor(s). MDPI and/or the editor(s) disclaim responsibility for any injury to people or property resulting from any ideas, methods, instructions or products referred to in the content. |
© 2024 by the authors. Licensee MDPI, Basel, Switzerland. This article is an open access article distributed under the terms and conditions of the Creative Commons Attribution (CC BY) license (http://creativecommons.org/licenses/by/4.0/).


