Preprint
Article

Development of Chitosan Scaffold Carrier Device for Absorption and Controlled Release of Iron Chloride Using In Vitro Methods of Characterization

Altmetrics

Downloads

68

Views

33

Comments

0

Submitted:

15 September 2024

Posted:

17 September 2024

You are already at the latest version

Alerts
Abstract
Chitosan spherical scaffolds, derived from the deacetylation of chitin, are natural polymers with significant potential, though challenges remain in optimizing their properties. The use of chitosan as a carrier for the controlled release of iron chloride is not yet fully established, despite iron’s critical role in various essential biological processes, including as a component of metalloenzymes and in the maintenance of life. Methods: This study aimed to develop a novel protocol for synthesing chitosan scaffolds and to characterize their properties using analytical techniques. Additionally, the release profile of iron was modeled using two primary controlled-release mathematical models. Results: The results demonstrated successful synthesis and physicochemical characterization of the chitosan sphere scaffolds. These scaffolds exhibited appropriate topography for iron loading and cellular interaction, as confirmed by SEM analysis, and contained functional groups as identified by FTIR. The scaffolds were also semi-crystalline (XRD), showed controlled degradation, and were confirmed to be non-toxic biomaterials. Furthermore, the modeling of the controlled release of iron chloride adsorbed on the scaffold surface, as well as the modeling of iron chloride specimens using the MEDUZA software, was successfully conducted. A theoretical curve was generated from the experimental dose-response data collected over time, considering variations in pH and medium concentration. Conclusions: In conclusion, a novel protocol for chitosan-based carriers was successfully developed, enabling thorough physicochemical characterization and modeling of both absorption and controlled release.
Keywords: 
Subject: Engineering  -   Bioengineering

1. Introduction

Chitosan is a polymeric amino polysaccharide derived from the deacetylation of chitin.
Despite its potential, the development of chitosan scaffolds with optimal properties and their applications remain underexplored. Traditionally, crosslinkers are used in chitosan preparations, but these substances can be toxic, leading to cell death and polymerization contraction, which must be mitigated or avoided. Additionally, chitosan scaffold to carry iron chloride effectively. This study proposes a novel protocol that combines the coagulation method with freeze-drying, avoiding cross-linking and toxic agents, for the development of chitosan spheres. The aim is to facilitate the transport and controlled release of iron chloride in a controlled pH environment.
The objective of this work was to develop a novel chitosan sphere scaffold protocol that is potentially biocompatible, low-cost, and feasible as a biomaterial for carrying iron chloride and enabling controlled release at specific pH levels [1]. Following coagulation, freeze-drying, and lyophilization without cross-linking agents, the chitosan spheres were characterized physicochemically. Tests included degradation, cytotoxicity, and controlled release experiments. The release profile and patterns of iron were modeled considering various concentrations and pH levels of the medium in which the spheres were immersed. A theoretical curve was developed to predict diffusion behavior when the carrier is placed in a finite and limited volume solution [2,3], followed by protocol adjustments and complex modifications [4,56]. The modeling was conducted using Fortran (IBM, USA) and Meduza (Informer Technologies, USA) software [6,7].
Chitosan’s versatility allows the preparation of microcapsules and beads of various shapes and sizes. Its applications extend to different parts of the human body due to its biocompatibility, biodegradability, and moldability [5,8,9,10,11,12,13,14]. The spherical shape attributed to the chitosan spheres offers lower energy for the carrier system, making it suitable for various applications, including enzyme immobilization and directed drug diffusion [16,17]. The development of this carrier could address the high costs associated with current scaffold systems, which can exceed $10,000, making them inaccessible to poorer populations. The controlled release allows for predictable and planned therapeutic dosing [18,19]. Administering drugs with controlled release involves managing three basic factors: pH and concentration of the medium, release rate, and gastric transit, which can be simulated from experimental data. The behavior of iron under varying pH and concentration conditions, as well as the release profile of the spheres in a limited volume, was simulated. The material must meet cytotoxicity and biodegradability standards. Chitosan forms complexes with various molecules, and the stability of these complexes depends on factors such as charge density, molecular weight, net charge, solvent properties, ionic strength, pH, and synthesis temperature [20,21,22,23,24]. The release rate of molecules or ions may be linked to the chemical degradation process, which can be measured by indices such as the degree of swelling (GI), degradation index (ID), and loss of water absorption, influencing the rate of drug release [25,26] in the biomedical field [27]. The development and understanding of controlled release and system modeling have been previously explored [28,29]. Some mathematical models, including the Fick equation, describe the controlled release mechanism, particularly in limited volumes [30].
This work focused on developing new chitosan scaffolds, performing appropriate physicochemical characterization using techniques such as scanning electron microscopy (SEM), analysis of the main chemical groups of chitosan by Fourier transform infrared spectroscopy (FTIR) and Raman analysis (RS), analyze the crystallinity by X-Ray Diffraction (XRD), perform the cytotoxicity test in cell culture, promote the appropriate degradation tests and measurement of the indices, model using Fortran software (IBM, United States) the finite volume analysis, and promote the estimation modeling of iron behavior with the aid of Meduza software (Informer Technologies, USA) for iron behavior estimation.

2. Materials and Methods

 Production of Chitosan Spherical Carriers (Scaffold)

Chitosan spheres were produced using an innovative protocol developed from ultrapure chitosan derived from crab shell carapace (Sigma Aldrich® Merck KGaA, Darmstadt, Germany) with a deacetylation degree (DD) of 87.7%. The synthesis process began by preparing a chitosan solution. An analytical balance was used to weigh 0.125 g of chitosan and was dissolved in 6.25 mL of 2% acetic acid (v/v) solution under constant magnetic stirring until a homogeneous gel, free of residual granules, was obtained. The gel was free of bubbles and chitin residues, contained chitosan at its maximum degree of purity.
The rheological properties of the gels were studied using a TA Instruments’ Rheometer ARG2 (Lukens, New Castle, USA) with plate-plate geometry. Initially, strain amplitude tests were conducted, followed by a frequency scan of the chitosan solution from 6.283 to 62.83 rad/s. A specific sequential structure of adapted syringes was used to ensure correct gel ejection using a controlled drip device into a 5% NaOH (1 mol L−1) solution under constant stirring. The gel beads were then neutralized in a phosphate-buffered saline (PBS) solution (~pH 7) and washed with ultrapure water obtained from a Milli-Q® device, followed by passage through a sieve sequence.
The samples were lyophilized (Terroni LT-1000, Terroni Equipamentos Científicos, Jardim Jockey Club, São Carlos, Brazil) for 2 consecutive days. After lyophilization, the pellets were stored in amber glass bottles, dried at 50°C for 5 consecutive days, and covered with parafilm. This step was crucial for maintaining the exact size of the spheres in the final process and for avoiding the need for cross-linking the polymer. Besides that, all physicochemical characterizations were conducted before the modeling tests. The protocol was adapted from the works of Benvenutti et al. (2012) and Lima et al. (2016), and further developed by Lima et al. (2013) with modifications to the reagents and procedures for sphere production [31,32,33]. Several modifications were made to refine the protocol and achieve the ideal spherical carrier with long-term stability, as illustrated in the design protocol shown in Figure 1

 Experimental-Physico–Chemical Characterization of Chitosan Carrier Beads (Spherical Scaffold)- before the Controlled Release Test

Scanning Electron Microscopy

Scanning Electron Microscopy (SEM) was utilized to examine the chitosan spheres for surface characteristics, including potential pores, surface roughness, topographic structure, and surface concavities. These features are critical for enhancing cell interaction and biocompatibility by increasing the surface area and, consequently, the contact area with the external environment.
The chitosan samples were metalized on stubs using an Emitech K550X metallizer (Emitech, Dubai, UAE) with a current of 50 mA for 180 seconds. Microstructural analyses were conducted using a Zeiss IVO MA 10 scanning electron microscope (Zeiss, San Diego, CA, USA) with operating parameters set to a working distance of 14 to 15 mm and a voltage range of 20 kV to 21.24 kV. The SEM analyses were performed at the SEM laboratory (SEM-UFF, Volta Redonda, RJ, Brazil).
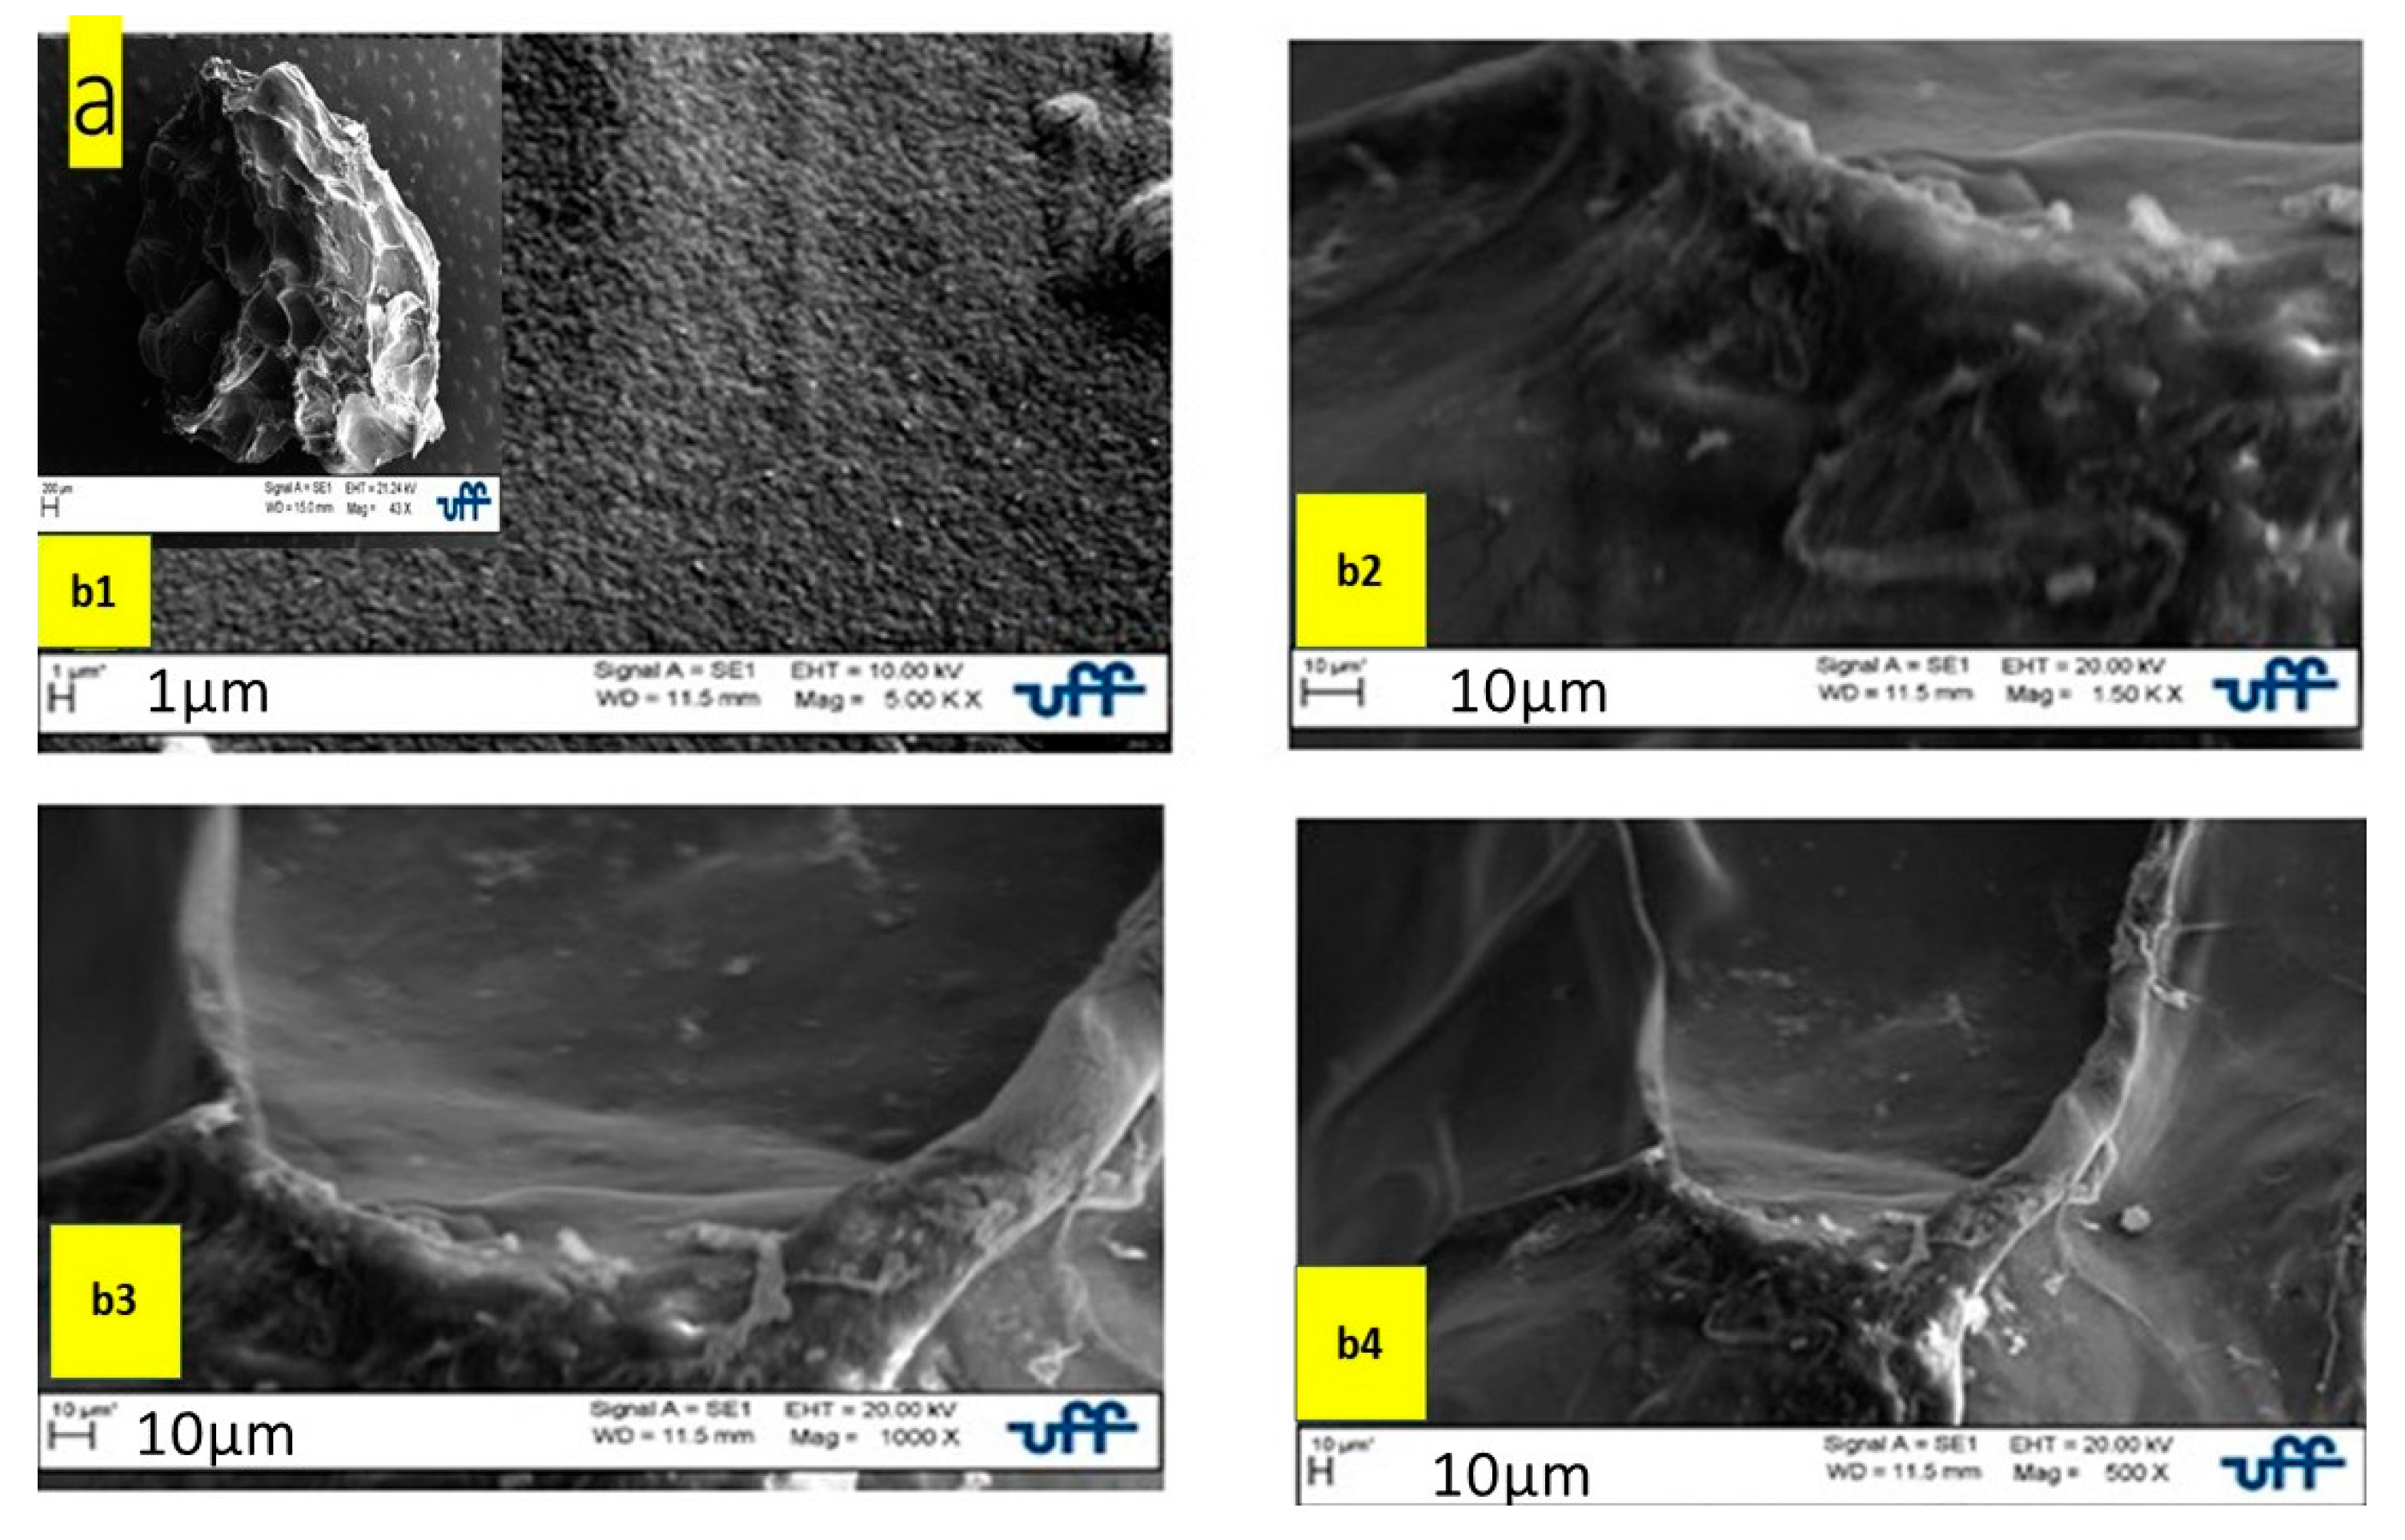
SEM micrographs were captured at various magnifications, beginning with a wide view of the entire sphere contour to identify areas of interest. Detailed imaging was performed at magnifications of 5000×, 2500×, 1500×, and 500× to capture the fine structural details of the chitosan spheres.

Fourier Transform Infrared Spectroscopy (FTIR)

The standard Fourier Transform Infrared (FTIR) spectroscopy technique is employed to identify the chemical groups present in chitosan structure, providing a fingerprint of the material under investigation. This technique analyzes the vibrational modes of different chemical groups, allowing for the determination of the chemical or structural composition of the material.
For FTIR analysis, chitosan samples were first ground into powders using an agate mortar and pestle. The powders were then stored in 1.5 mL Eppendorf tubes. The samples were prepared as KBr pellets for analysis. FTIR measurements were performed using a Perkin Elmer Spectrum 100 spectrometer (401 Congress Ave, Austin, TX 78701, USA). The analysis involved 32 scans with a resolution of 4 cm−1, and spectra were recorded over a wavenumber range from 4000 to 500 cm−1.

X-ray Diffraction Spectroscopy (XRD)

X-ray Diffraction (XRD) was employed to determine the degree of crystallinity of the chitosan samples. XRD analyses were conducted at room temperature using a Shimadzu XRD-7000 apparatus (Shimadzu Corporation, Kyoto, Japan), with copper Kα radiation (λ = 1.5418 Å), operating at 40 kV and 30 mA. The chitosan samples were analyzed over a 2θ range of 10.0 to 70.0 degrees, with a scanning rate of 2°/min.

Raman Spectroscopy (RS)

Raman spectroscopy was performed using a Witec alpha300 system (Witec, Tennessee, USA). The apparatus was equipped with a plain silicon (Si) sample supplied by Witec and operated with a laser wavelength of 785 nm, providing a maximum laser intensity output. Observations were made using a 100× magnification objective with a numerical aperture (NA) of 0.95. During operation, the pinhole diameter was set to 100 μm, with an integration time of 50 ms and a grating of 600 grooves per millimeter.
The spectral analysis focused on the 950 cm−1 region and used a Raman Edge Filter. The Raman spectra were recorded with a high peak measurement of 2000 counts (CTS) and an integration time of 1 second.

Degradation and Physical–Chemical Characterization of Chitosan (ISO 10993)

The degradation assay was planned from the samples’ insertion into a blood plasma simulator solution (SBF~7pH) that mimicked the physiological conditions at a temperature of 36°C in an isothermal bath and calibrated the parameters’ constancy from a coupled thermostat. The sample was placed in the solution at a ratio of 1 g to 10 ml. In the follow-up, time was established for the measurement of the weights in the analytical balance and the definition of the degradation parameters measured by the swelling index (GI), degradation index, and mass loss, as well as the chemical analysis of the degradation measured by thermogravimetric analysis (TGA) and differential scanning calorimetry (DSC) of the samples before and after the assay [34,37]]. In the present study, the assay was carried out under static conditions using the blood plasma simulator solution (SBF pH~7), having the extreme condition of degradation (pH 5 potassium acetate solution) as control [40]. In this way, two types of tests were performed: the extreme solution (acetate); and the blood plasma simulator solution (SBF). The scaffolds were immersed in solutions and analyzed at 7, 24, 48, 96, and 168 h35. The material was analyzed at 0 for reference and at times 1, 2, 7, 14, and 28 days for analyzing degradation over time (ISO10993-5).

Evaluation of Degradation Parameters

Static Degradation indices were evaluated using the degradation index (ID), swelling index (GI), and mass loss. Additionally, thermogravimetric analysis (TGA) and differential scanning calorimetry (DSC) were performed after each experimental period of the Static Degradation Test to assess whether the material remained intact under physiological conditions compared to extreme conditions (5% potassium acetate).
The swelling index (GI) measures the percentage change in mass of the material due to absorption of the test solution, making it a common parameter for assessing degradation. This index indicates the loss or gain of mass as a result of the material’s interaction with the test solution.

Cytotoxicity Assay of Chitosan Beads in Cell Culture

The scaffold was assayed for cytotoxicity by using the supernatant after contacting 1 g of sample per 10 ml of fetal bovine serum-free DMEM (FBS) solution followed by serial dilutions. The scaffolds were incubated for 24 h in a CO2 incubator (Thermo Fisher Scientific, Third Avenue, USA). The supernatant was then collected and taken by serial dilution and added onto the subconfluency cells preplated on multi-well plates. Cells from mouse fibroblasts balb-c3T3 obtained from ATCC were used. A total of 24,000 cells were plated in multi-well wells, incubated for 24–48 h, and the extracts were added over the cells when in the subconfluence cells stage. After incubation for 24 h, the cytotoxicity pattern was evaluated by classical parameters of cell viability evaluation: mitochondrial activity by reduction of formazan blue (MTT).
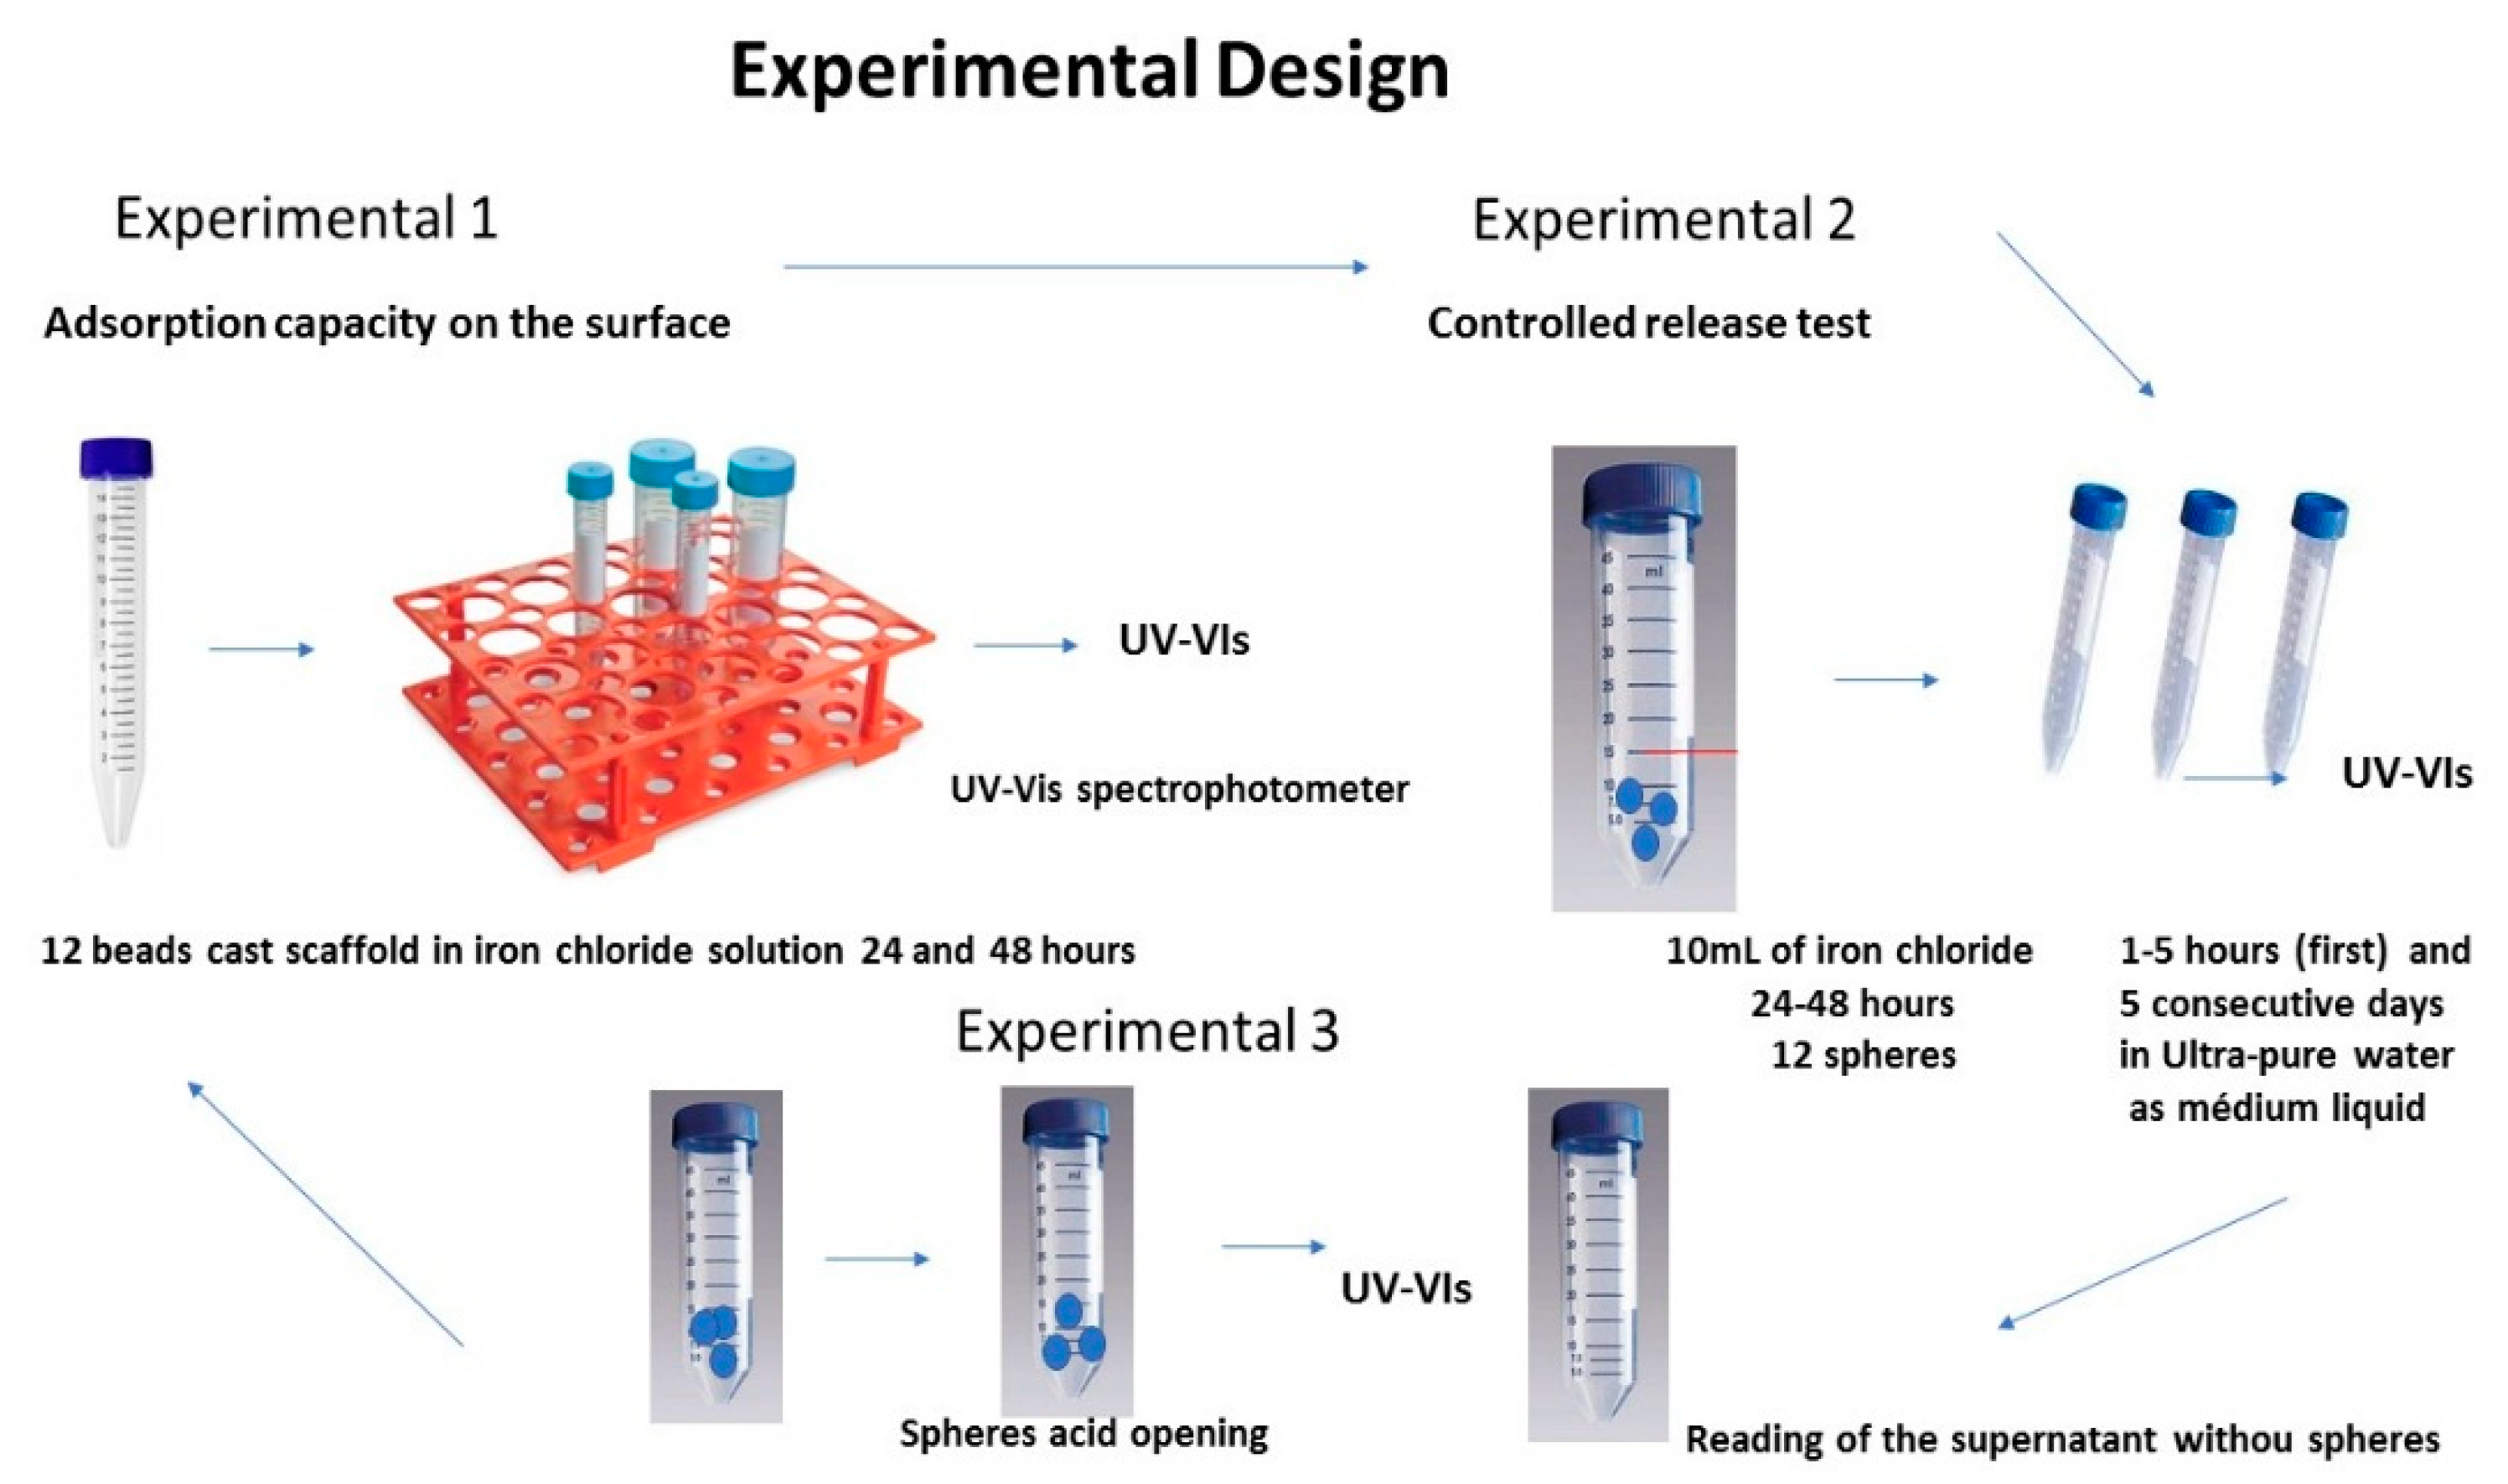
The objective was to develop a modeling design based on experimental analysis, as illustrated in Figure 2. The focus was on understanding the diffusion behavior of a solute contained within a sphere into a solution of limited volume, initially free of solute, and determining the experimental diffusion coefficient from laboratory data. Initially, the adsorption capacity of iron chloride on the surface of chitosan carriers was evaluated, alongside the phenomena of swelling and wetting of the carriers. Preliminary testing indicated that the spheres could adsorb approximately 50% of iron chloride (iron chloride III hexahydrate) (Dinâmica, Metaquímica Produtos, SC, Brazil) when incubated for 24 to 48 hours.
Following this, experimental procedures were planned and executed to assess the release of iron chloride from the chitosan carriers at various time points. In the initial phase, a test was performed to determine the degree of iron chloride absorption on the surface of the carriers. Twelve beads were incubated in 10 mL of iron chloride solution for up to 24 and 48 hours. Throughout all experimental steps, monitoring and measurement of the finite volume concentrations were conducted using a UV-Vis spectrometer (Bel Equipamentos Analíticos LTDA, Bel Engineering, Piracicaba, Brazil) with a 420 wave compression. The experimental evaluation and modeling were segmented into steps to allow for more precise modeling. Time intervals of 1 hour were defined for 5 consecutive hours, and measurements were taken daily for 5 days at consistent times each day (5-day interval checks).

 Development

The use of models to predict the release of micro-encapsulated drugs has received much attention from the medical community for providing control of the diffusional kinetics that can be modeled. The diffusion coefficient, D, can be determined according to the theory developed by Crank44 for diffusion in a scaffold with a known solute concentration for a limited and solute-free volume solution. Through the Fick Laws for diffusion and admitting nearly spheres geometry and constant diffusion coefficient, we have:
C t = D 1 r 2   r r 2 C r
where C is the concentration of the diffusive species in the circular scaffold, r is the scaffold’s radius, and D is the diffusion coefficient.
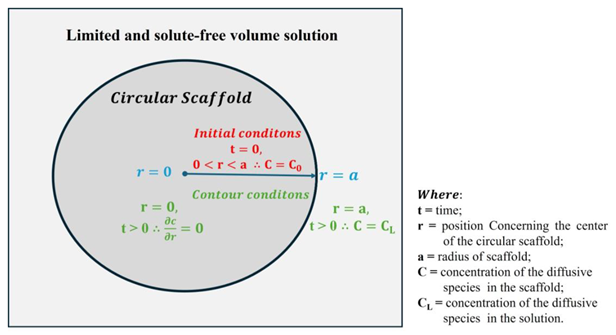
For the case of diffusion of a scaffold immersed in a solution with a limited volume, the following equations and principles apply:
Initial condition:
t = 0 e 0 < r > a, C = C0
Contour conditions
t   >   0 ,   r = 0 ,   C r = 0 ,   t > 0 ,   r = a ,   C * = C L
where t is the time, r is the position concerning the center of the circular scaffold, a is the radius of the scaffold, and CL is the concentration of the diffusive species in the solution.
The resolution of the diffusion problem is based on the analysis of unidirectional linear flow. This can be achieved through methods such as separation of variables or Laplace transforms. According to the approach described by Crank [44], the concentration of the diffusive species in the solution is given [36,37,38,39,94].
C L C L E = 1 n = 1 6 ( 1 + ) e D q n   2   t / a 2 9 + 9 + q n   2 2
where we have to:
a = the radius of the scaffold (cm)
t = the time (hours)
V = the volume of the solution (cm3)
n = number of the scaffold
CLE = substrate concentration at equilibrium
LC = concentration
qn = terms of positive root different from zero, dependent on the values of α, described in Table 1 below, where α = the relation between the volume of solution and total volume of beads defined as
= V n 4 π a 3   / 3
The experimental diffusion coefficient D of the sample can be calculated by separating variables in a sequence of algebraic operations
Being An and Bn:
A n = 6 ( 1 + ) 9 + 9 + q n   2 2   n = 1,2 , 3,4 , 5,6
B n = q n   2   t a 2   n = 1,2 , 3,4 , 5,6  
Substituting Eq. 4 and Eq. 5 into Eq. 2, we have:
C L C L E = 1 n = 1 6 A n e D B n
Developing the Eq.8
1 - C L C L E = A 1 e D B 1 + A 2 e D B 2 + A 3 e D B 3 + A 4 e D B 4 + A 5 e D B 5 + A 6 e D B 6
x = e D
y = 1 C l C L E
Substituting Eq. 10 and Eq. 11 into Eq. 9 we have:
y = A 1 x B 1 + A 2 x B 2 + A 3 x B 3 + A 4 x B 4 + A 5 x B 5 + A 6 x B 6
Applying Ln in Eq. 10 we have:
D = L n ( x )
Calculation of Sample Experimental Diffusion Coefficient
Eq. 6 to Eq. 13 calculate the diffusion coefficient from the experimental data. The root of the polynomial of Eq. 12 was obtained through the Principle of the Bisection method described in Eq. 14. The interval of application of the method was defined by analyzing the signals of Eq. 13 so that the value of the diffusion coefficient is D > 0, Eq. 15. The algorithm was implemented in the Fortran language (Annex 2), with an error stopping criterion less than 1 × 10⁻⁶.
f a f b < 0   x 0 = a + b 2  
where a and b range and x0 the root
S = x     R / 0 < x < 1
With the data in Table 2 below, the experimental diffusion coefficient was calculated. A coefficient of 8.583106 × 10⁻⁶ cm2/h was obtained.
The rate of drug release across a membrane can be expressed by the ratio dQ/dt, where D is the diffusion coefficient, S is the contact surface area between the solution and the membrane, C is the concentration difference of the drug across the membrane, and, l is the thickness of the membrane [40,60]. According to Fick’s law, this equation can be utilized to analyze the initial 60% of drug release [40].
The beneficial mathematical model was developed by Lopes et al. (2015) to achieve a specific release rate by calculating the size and shape of hydrophilic matrices. The Monte Carlo method, which utilizes a random number generator, was implemented in the C++ programming language [42]. Siepmann later expanded upon this model in 2008. Currently, various mathematical models are applied to control drug delivery systems based on matrix-controlled mechanisms. Many of these models are rooted in the diffusion concept developed by Crank and are used to simulate experimental trials [43,44,45]. So, by understanding the conditions of the medium—such as predetermined volume, pH, and the total volume of the solution before and after immersion—it is possible to predict the surface adsorption behavior and the release mechanism through diffusion. This can be achieved by calculating the controlled release coefficient using Fortran software, which is commonly employed for simulating diffusion assays [45,46].
Key parameters used in the modeling include:
A: the diameter of the sphere (1 mm)
α =3V/n4πa3: the volume of the solution producing the beads, using 6.25 mL
N: the total number of beads, which is 42.
This modeling approach, based on the diffusion coefficient obtained from experimental data and Crank’s model, allows for the prediction of the release behavior of iron chloride under different pH conditions. The behavior of iron and iron chloride in various pH environments was specifically analyzed using the MEDUZA software [47].
The experimental and theoretical modeling of the controlled release from the spheres was conducted, considering the factors involved in both practical experiments and different diffusion mechanisms. And, in summary, considering the finite element approximation we can represent the same system by the geometric form below:Preprints 118274 i001

Results

 Physical–Chemical Characterization of Chitosan Spheres

Scanning Electron Microscopy Analysis

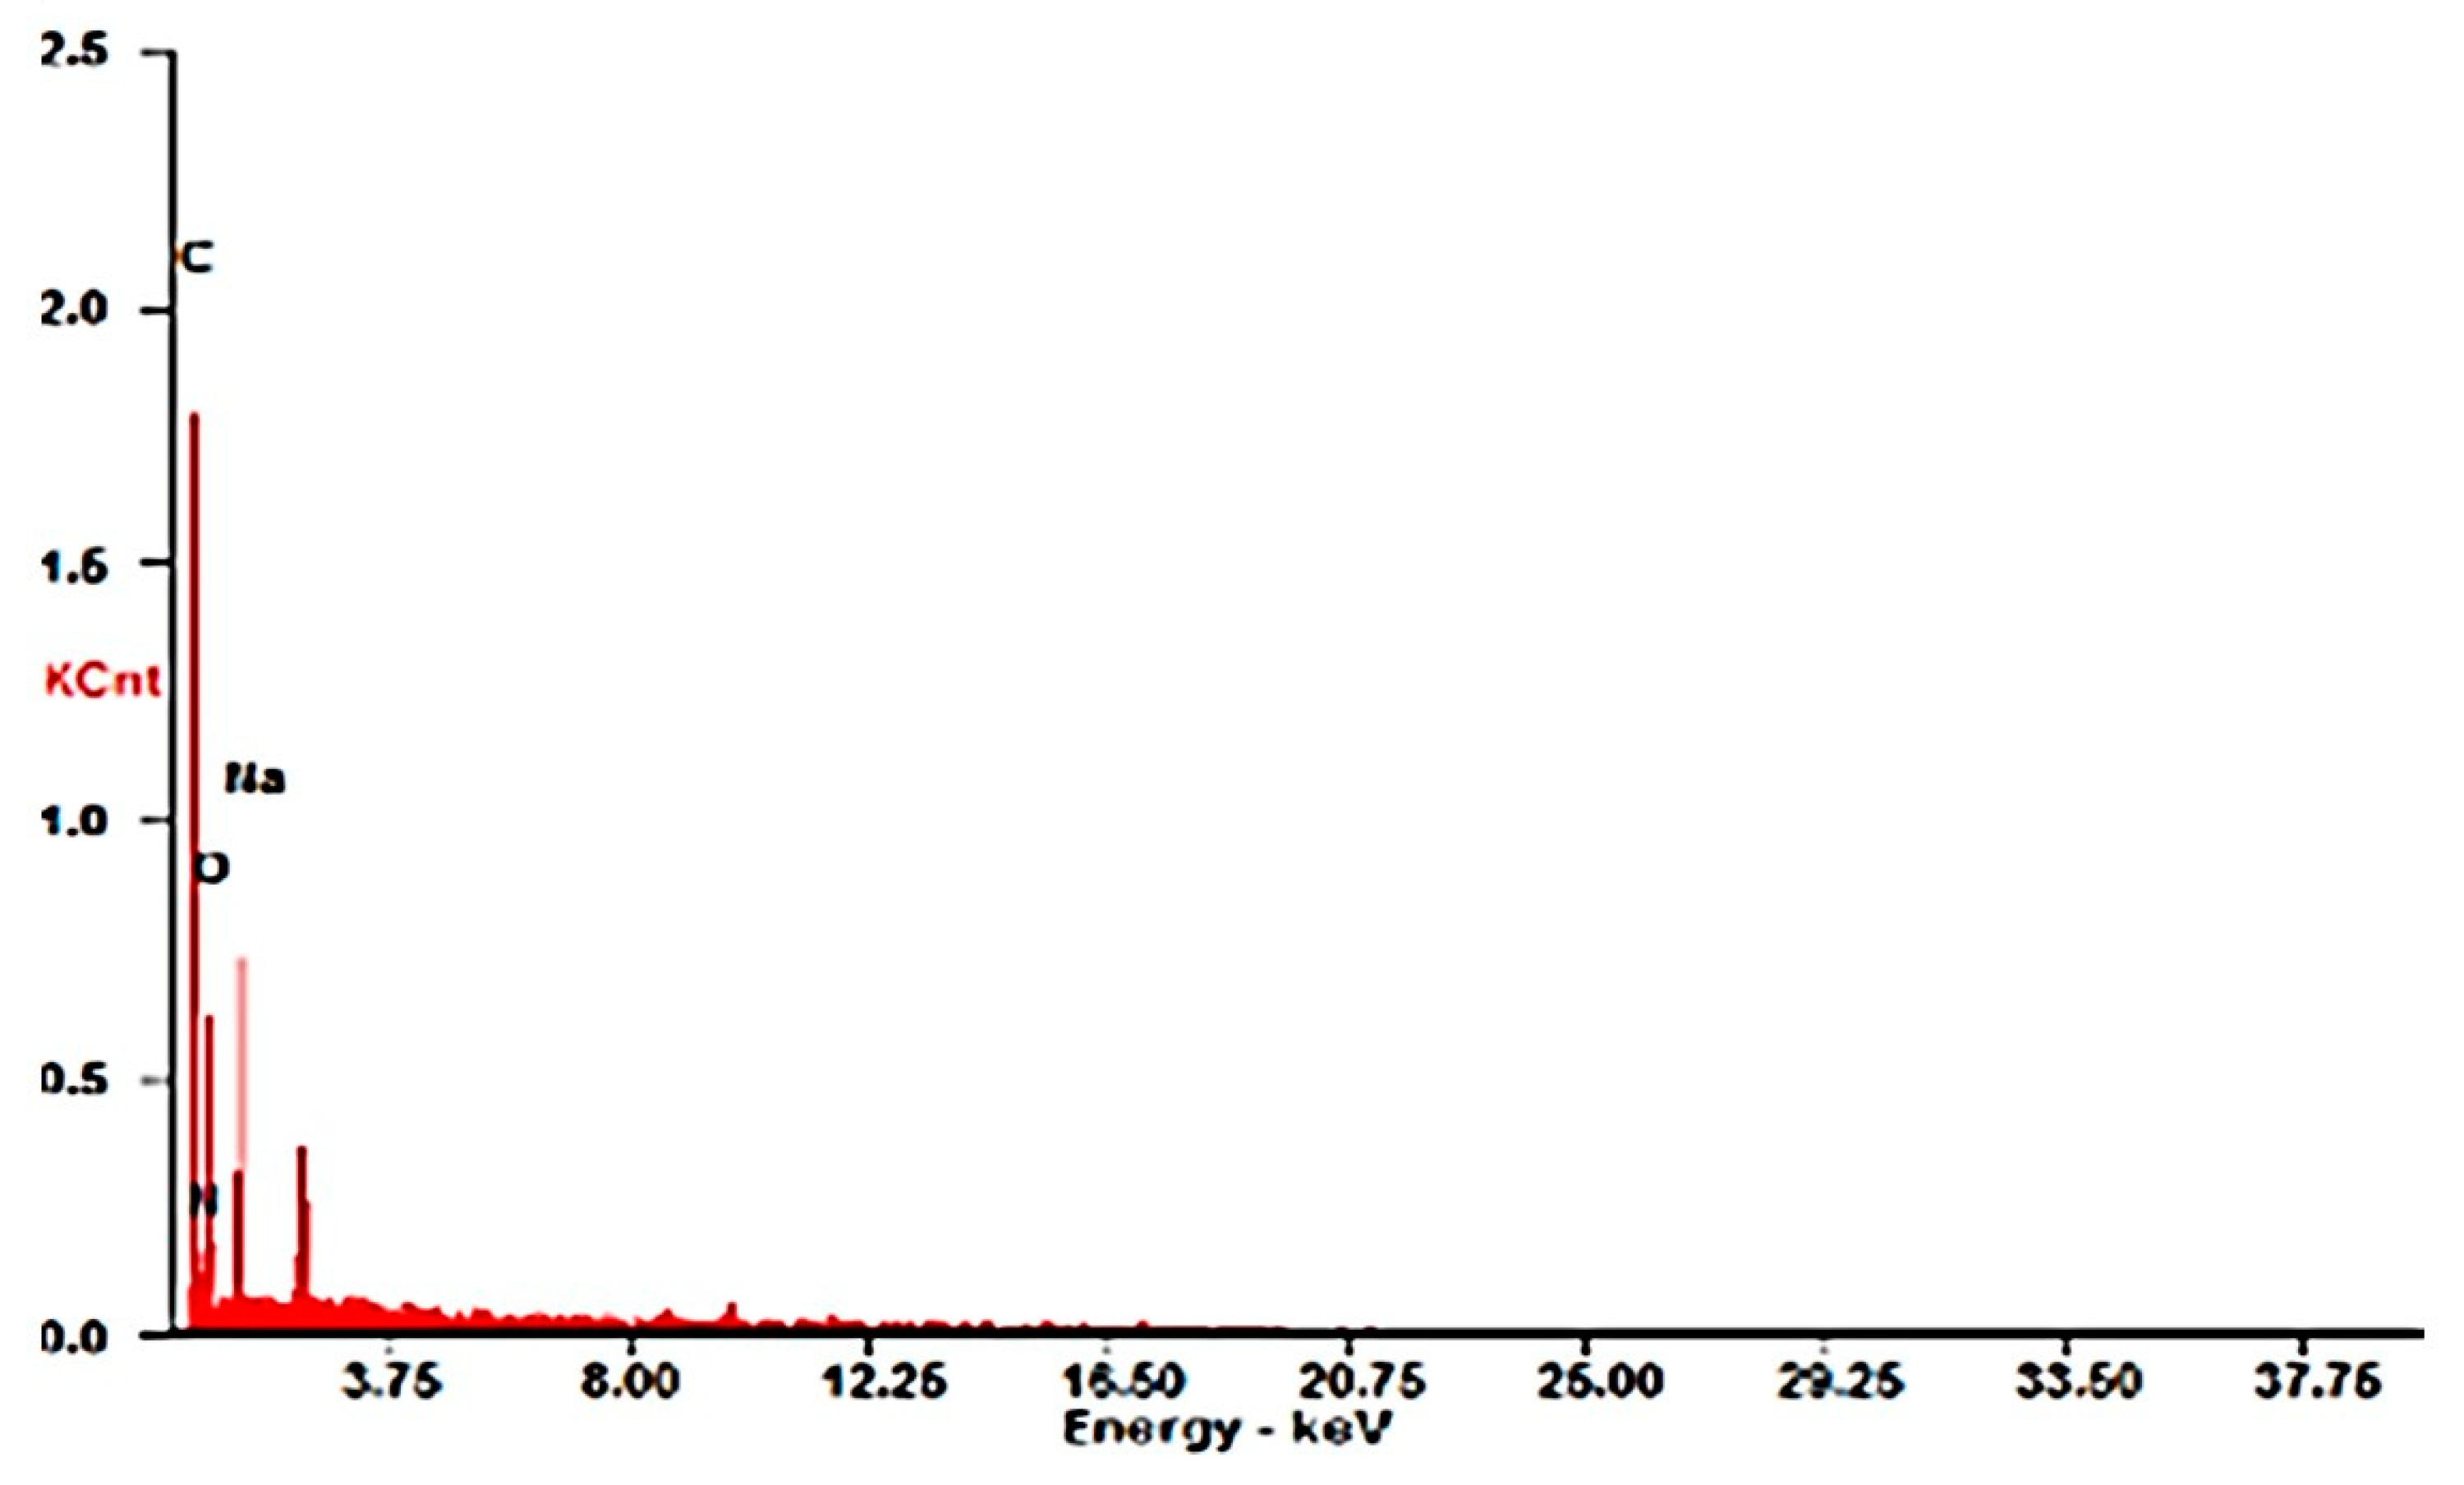
SEM analysis of the dry spheres obtained after the lyophilization and drying step was used before starting the controlled release testing steps. After lyophilization, the analysis of the spherical samples showed a relatively homogeneous surface topography, presenting some pores and surface concavities. Figure 3 shows the SEM image recording of a typical spherical sample. Figure 3 shows the SEM image recording of a typical spherical sample. Besides that, EDS analysis showed chemical element key from chitosan specimen (Figure 4) as a complement to the SEM analysis.
The EDS analyzes related to the SEM obtained from the chitosan beads\Elements-C, N, O, Na. was possible to identified the specifc elements present in chitosan structure as elements detected: C: 58.17Wt%, 65.57At%, N: 10.26Wt%, 9.92At%, O: 22.98Wt%, 19.45At%, Na: 8.59Wt%,5.06At%).

 Analysis of Fourier Transform Infrared Spectroscopy (FTIR)

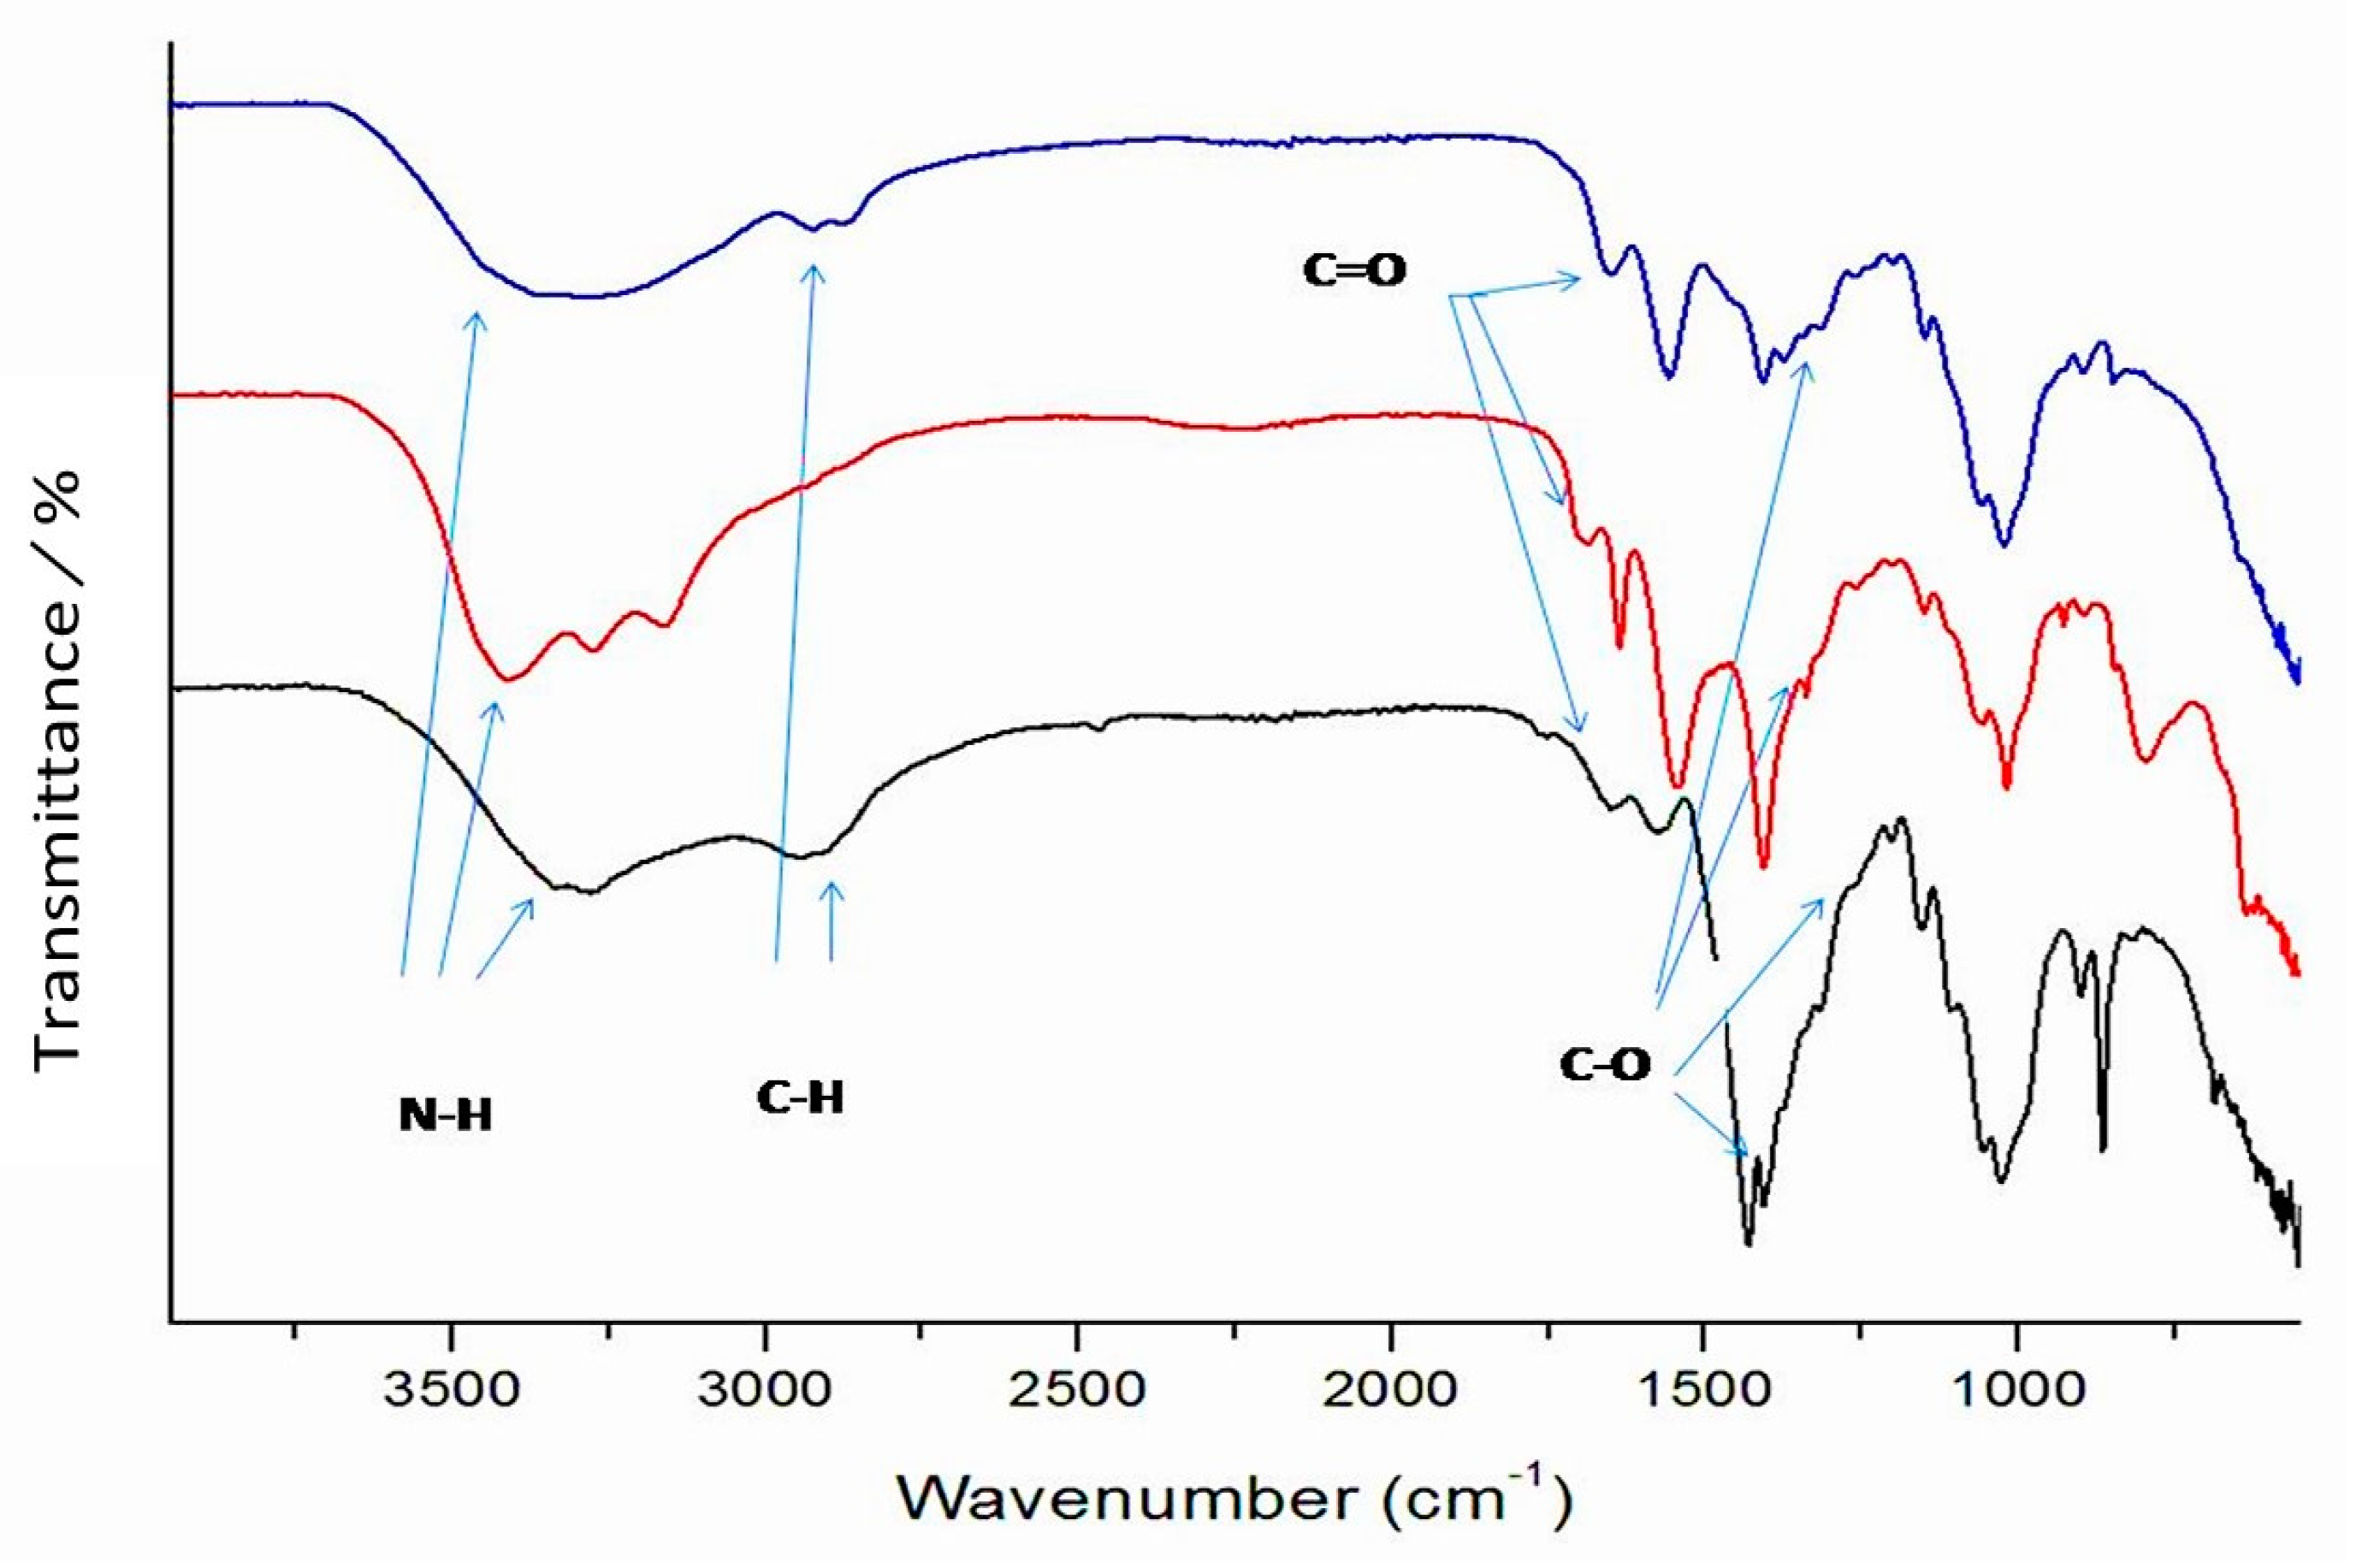
Chitosan should show bands in the regions of specific wavelengths (Tavaria, et al., 2013; Demadis, et al., 2009). Thus, it is possible to identify spectrum-specific chemical clusters. The spectrum, shown in Figure 4 below, showed that a peak appears for 3356 cm−1 associated with NH also hydrogen bonding, and OH stretching. Asymmetric CH stretch can be seen from 2871 cm−1 to 1424 cm−1 viwed in Figure 5 below.
The band in the region 1646 cm−1 refers to the grouping’s vibrational mode related to C = O. At 1571 cm−1 primary stretching of NH can be seen. The peaks 1316 cm−1, 1376 cm−1, and 1261cm−1 correspond to the bending vibrations of the primary, secondary, and tertiary CN connections. This method is so important to prove the mainly chemical groups present in chitosan. The same elements group chemical were presented in Negrea and Resende studies [50,51,52]. This technique is so specific to prove the the nature of the chitosan compound.

 X-Ray Diffraction Characterization (XRD)

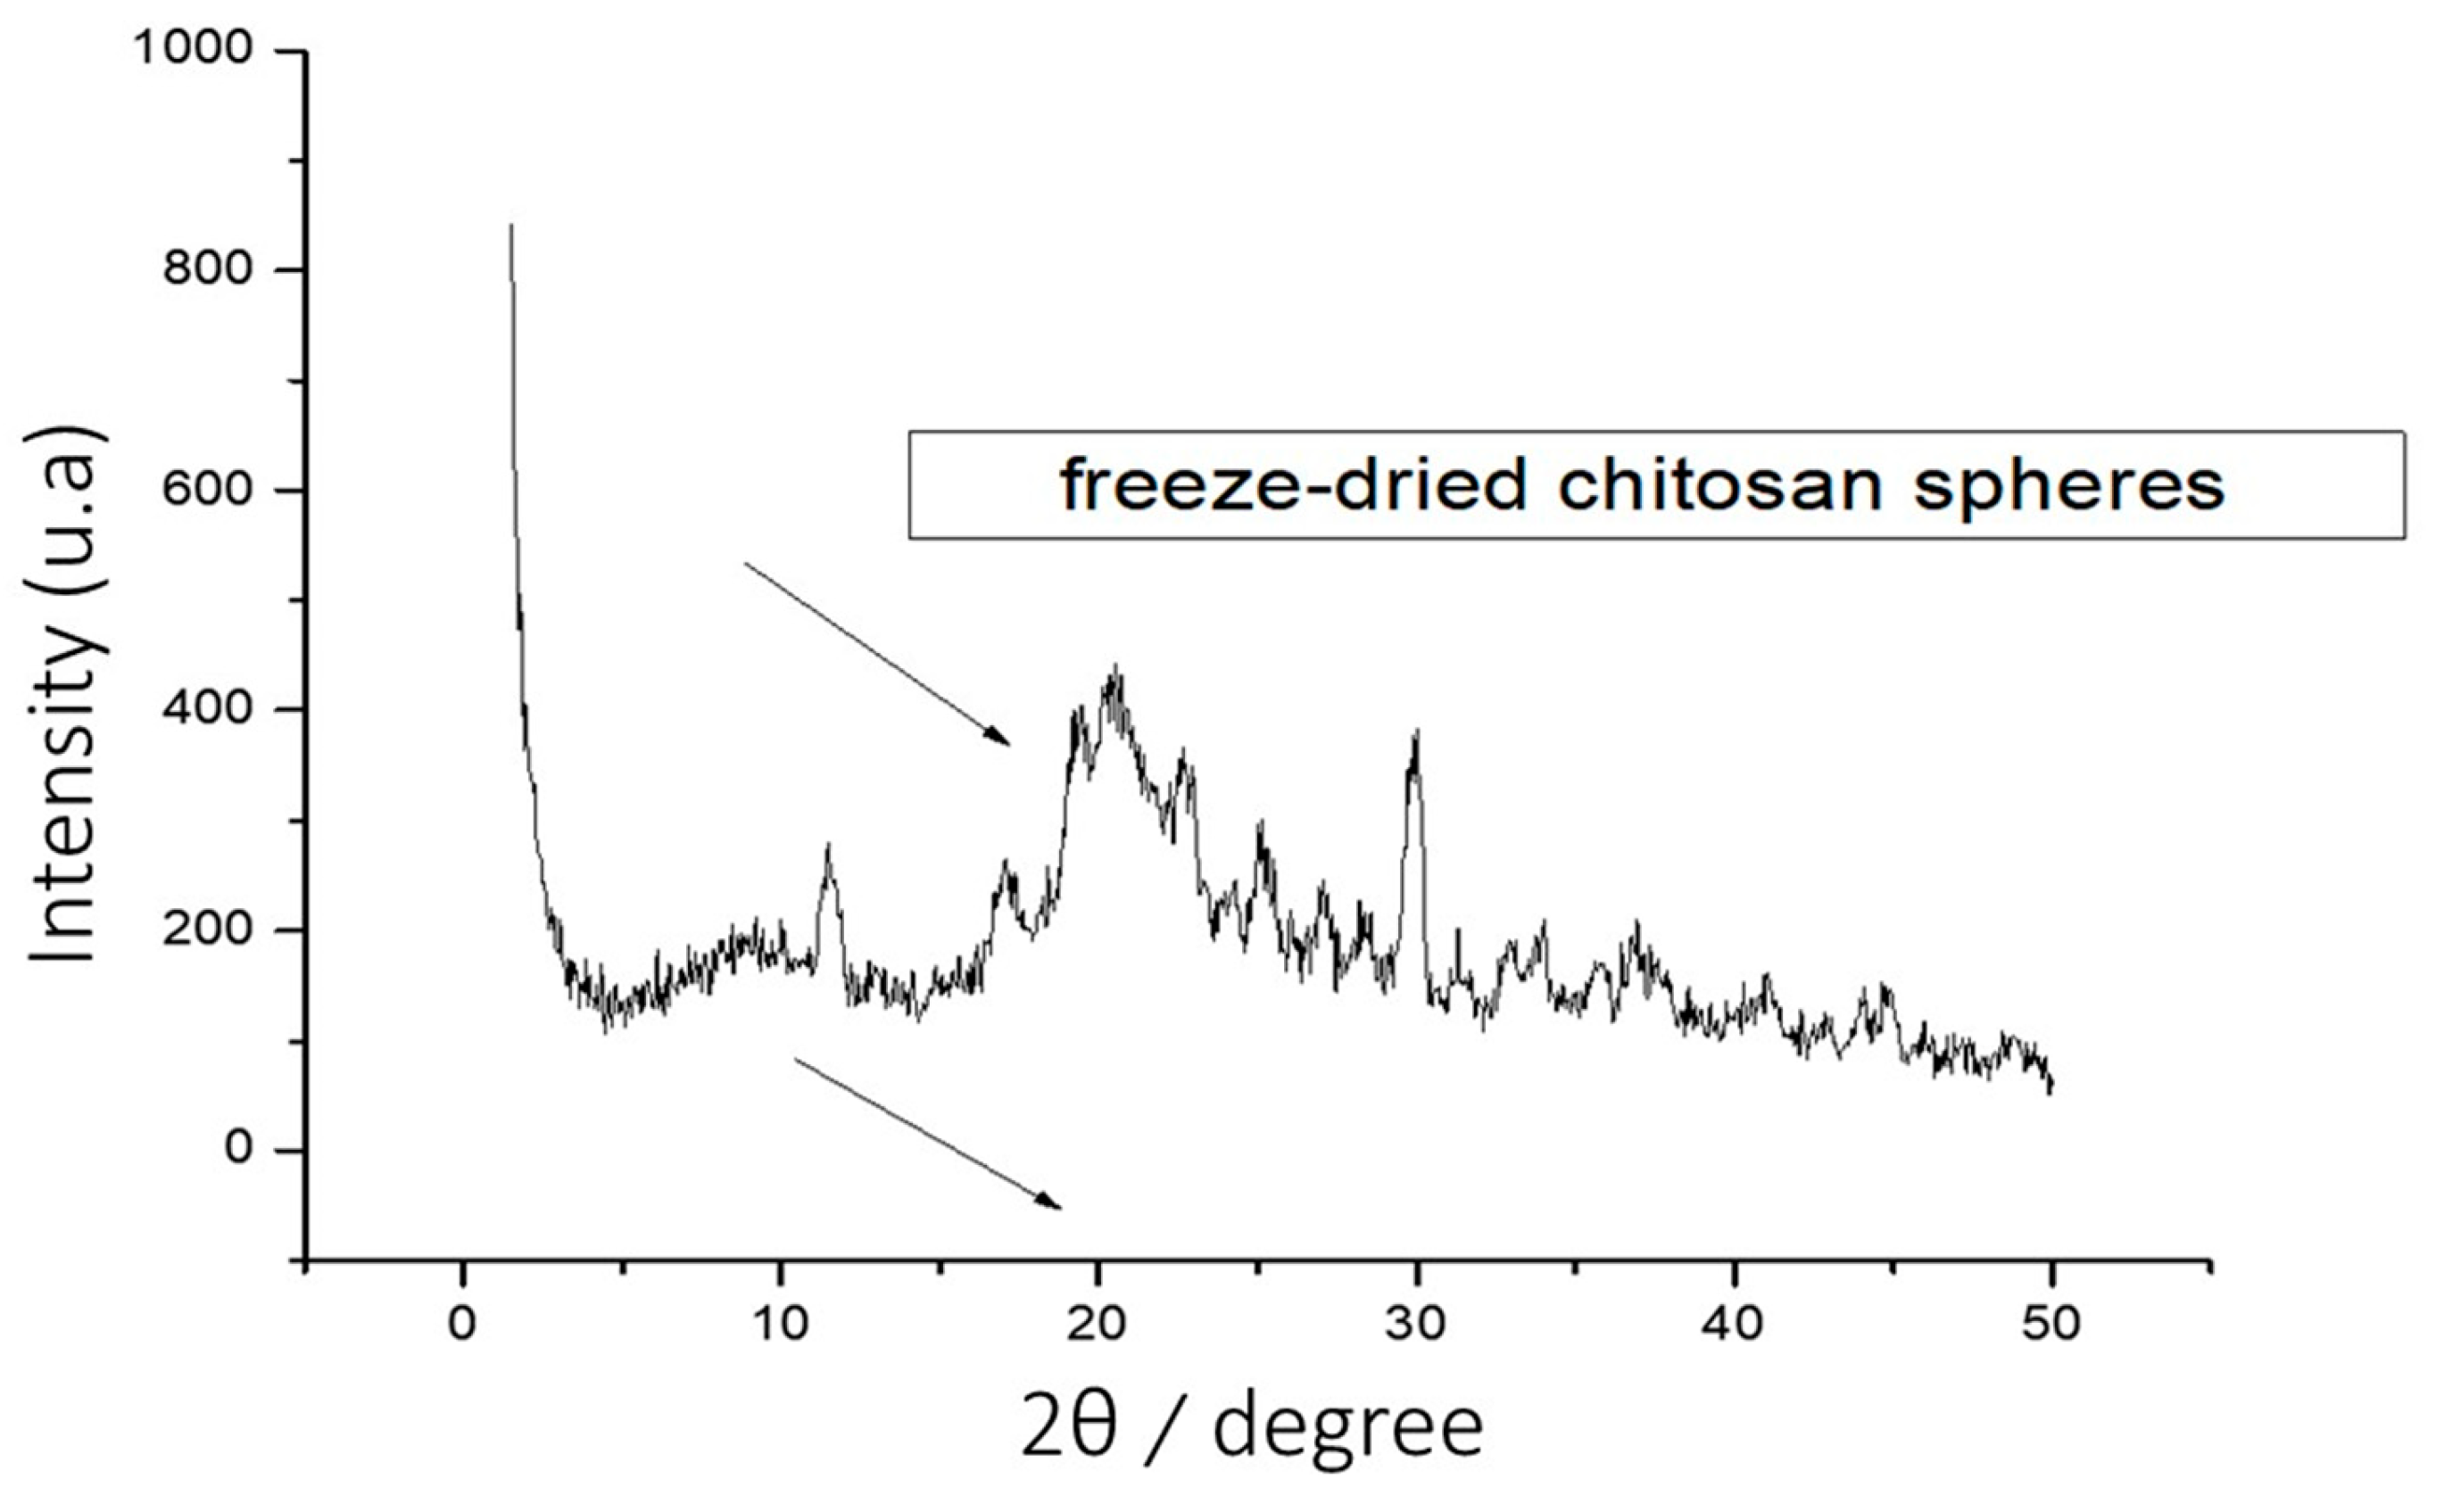
The results showed that the spectrum of the spheres obtained from the chitosan has a semi-crystalline profile, and the bands were considered to be major with an inherent peak in the 2-theta region with peak intensity, as shown in Figure 6. The literature shows the chitosan as a semi-crystalline element. So, this technique describes the identified and studied the crystal aspect. So, the same way previous studies was led by Negrea and Resende showed the crystal chitosan usind DRX analysis [50,51].

 Raman Microscopy Characterization (RS)

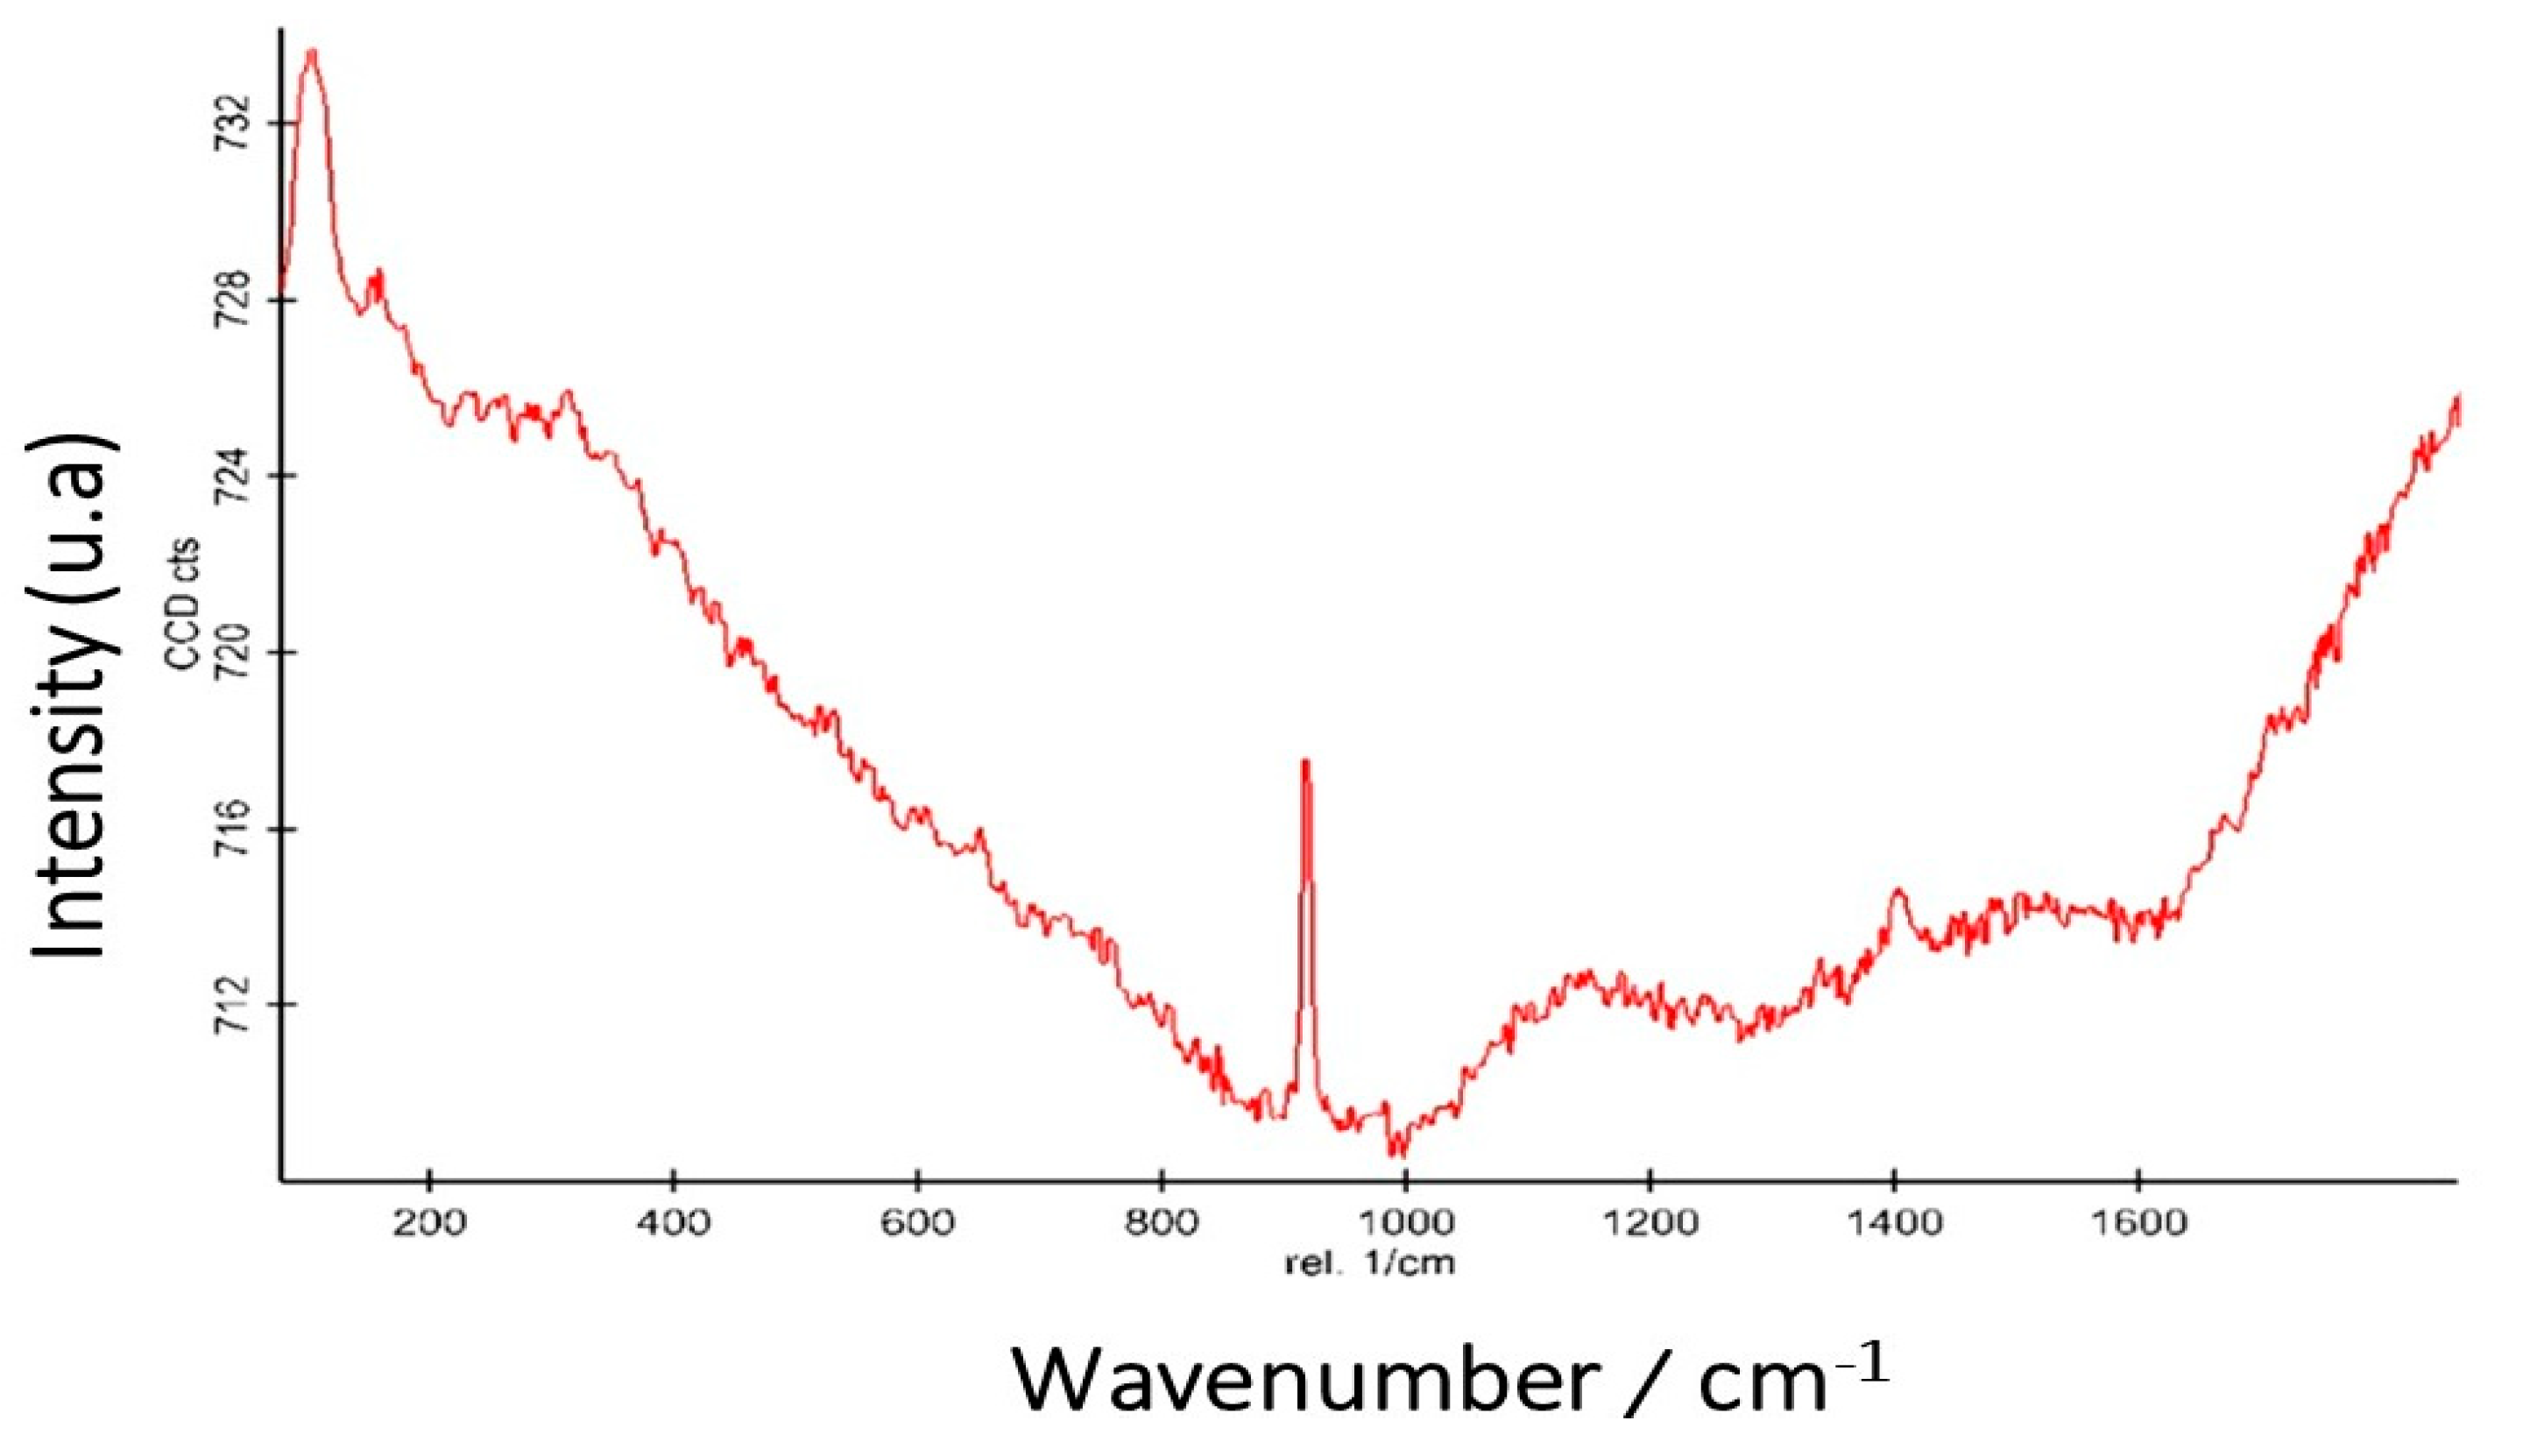
The Raman spectrum was obtained from the Wintec-focus innovations. The Raman spectra of the non-crosslinked and functionalized freeze-dried chitosan bead samples are shown in Figure 7.
The chitosan scaffold presents a Raman spectrum of little intense bands, except for the narrowband between 800 and 100 cm−1. The N = N stretch of the group appears as a mean band at 1481 cm−1.
The literature shows Raman in the same peak ranges in chitosan samples obtained by different method [52]. The identification of chitosan chemistry formulate using Raman spectra through spectrum peaks representing the chemical element has shown to be more fast method and does not require purification of the sample nor dissolution of the chitosan in any solvent [53].

 Chitosan Spheres Degradation Assay and Characterization of the Beads after the Tests

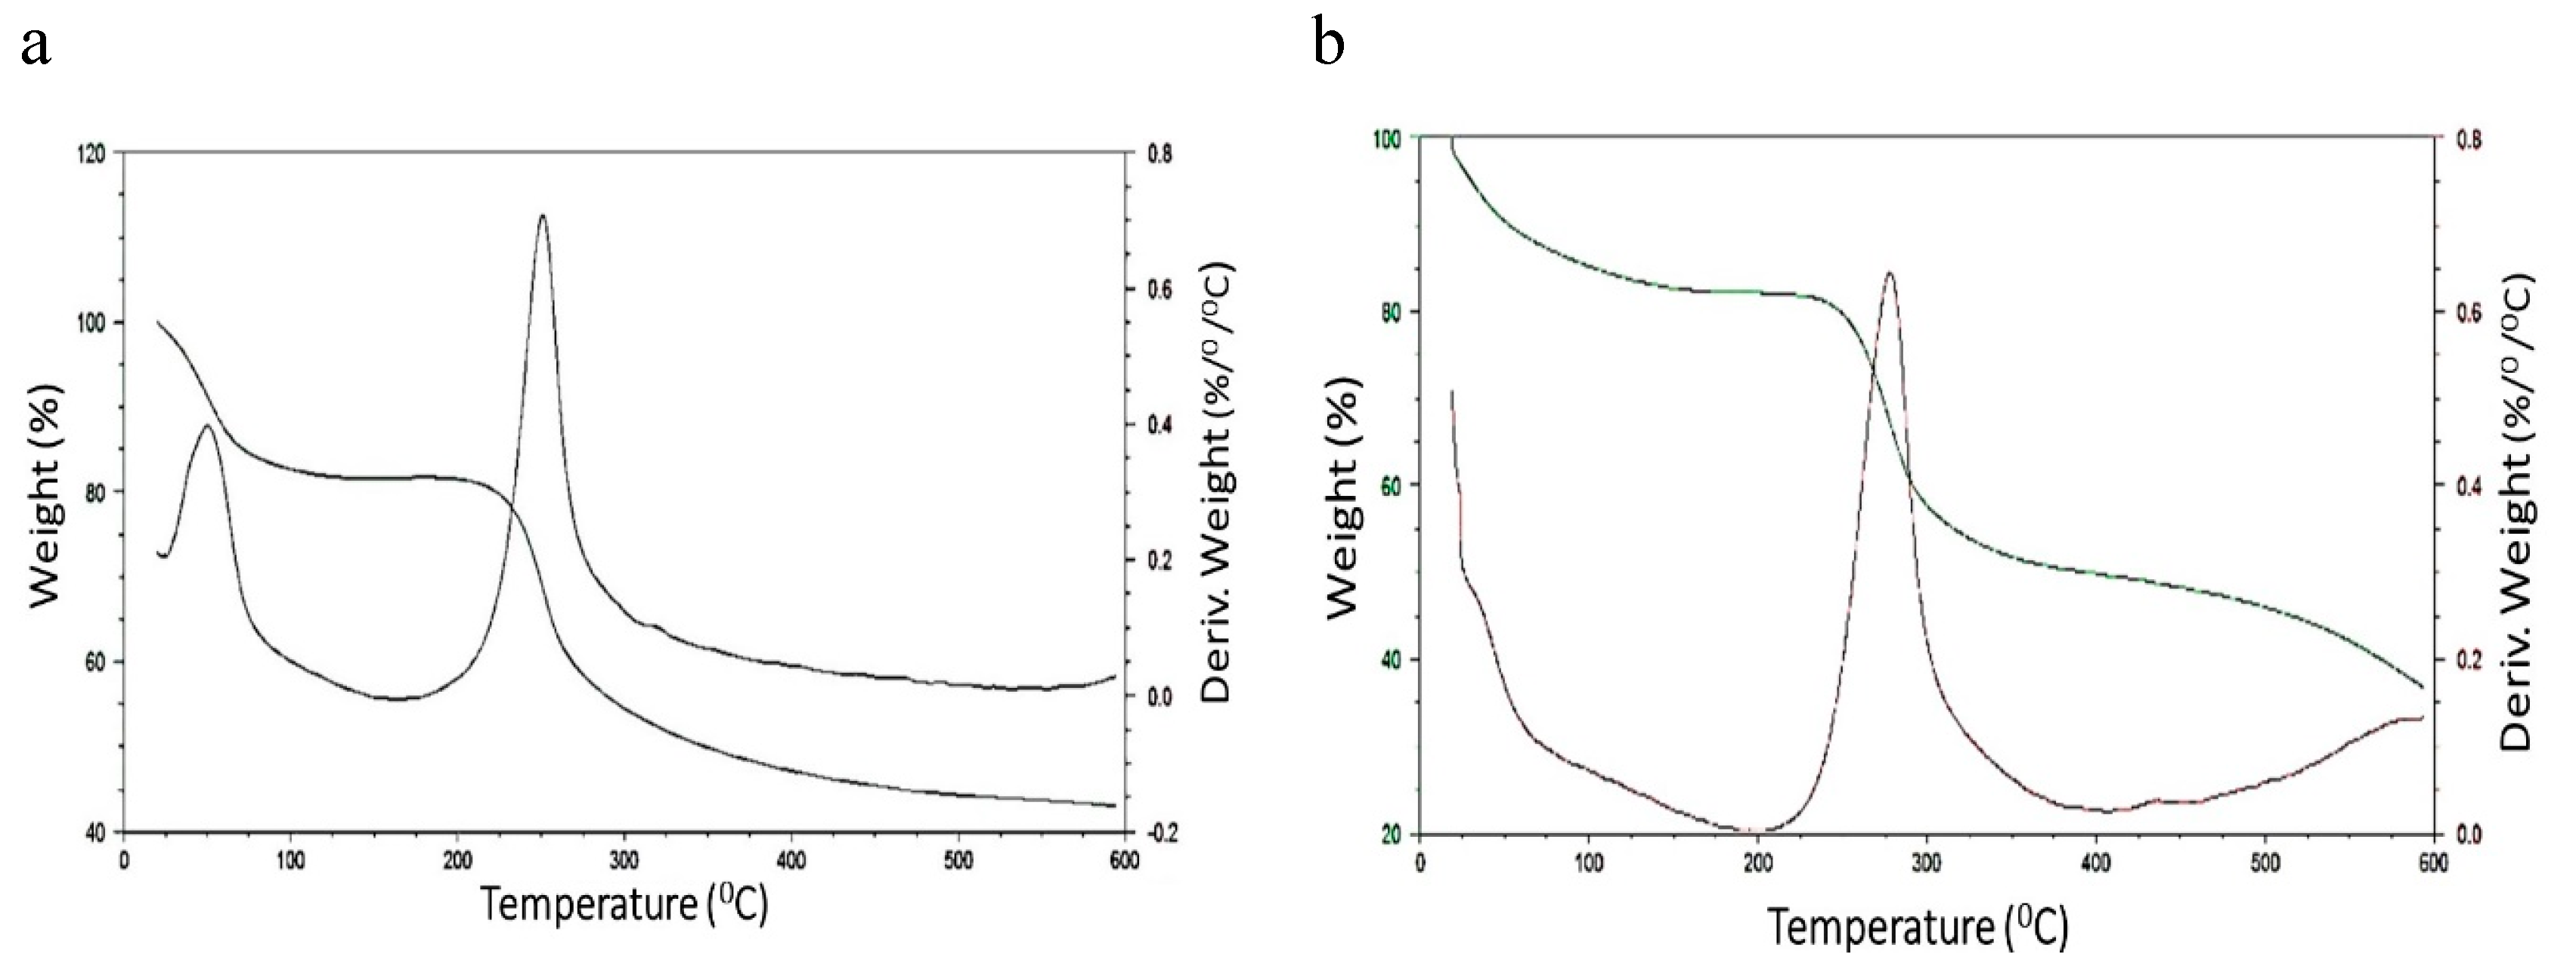
The thermogravimetric analysis was performed from the TGA analysis of the chitosan beads at time 0 (zero), as shown in Figure 8, that is, before being conducted to the degradation assay which was considered a control sample. At first, plasma body solution (SBF) as degradation solution on experiments is used. Then, after the degradation test had elapsed for a further 21 days, the TGA thermogravimetric analysis was performed after 21 days to note the effect of the degradation after the experimental test conducted in a blood plasma simulator (SBF), as shown in Figure 8.b below.
This model to estimate chitosan degradation is ideal because to promotes the union of weight loss with the investigation with their molecular degradation path followed by analyzing recorded data from mass spectrometry measurements performed at different temperature conditions. So, their corresponding thermal degradation mechanism was then established by searching for plausible transition states interconnecting the chitosan sphere aspect [53,54].

Degradation Test of Chitosan Beads in Blood Plasma Simulator (SBF)

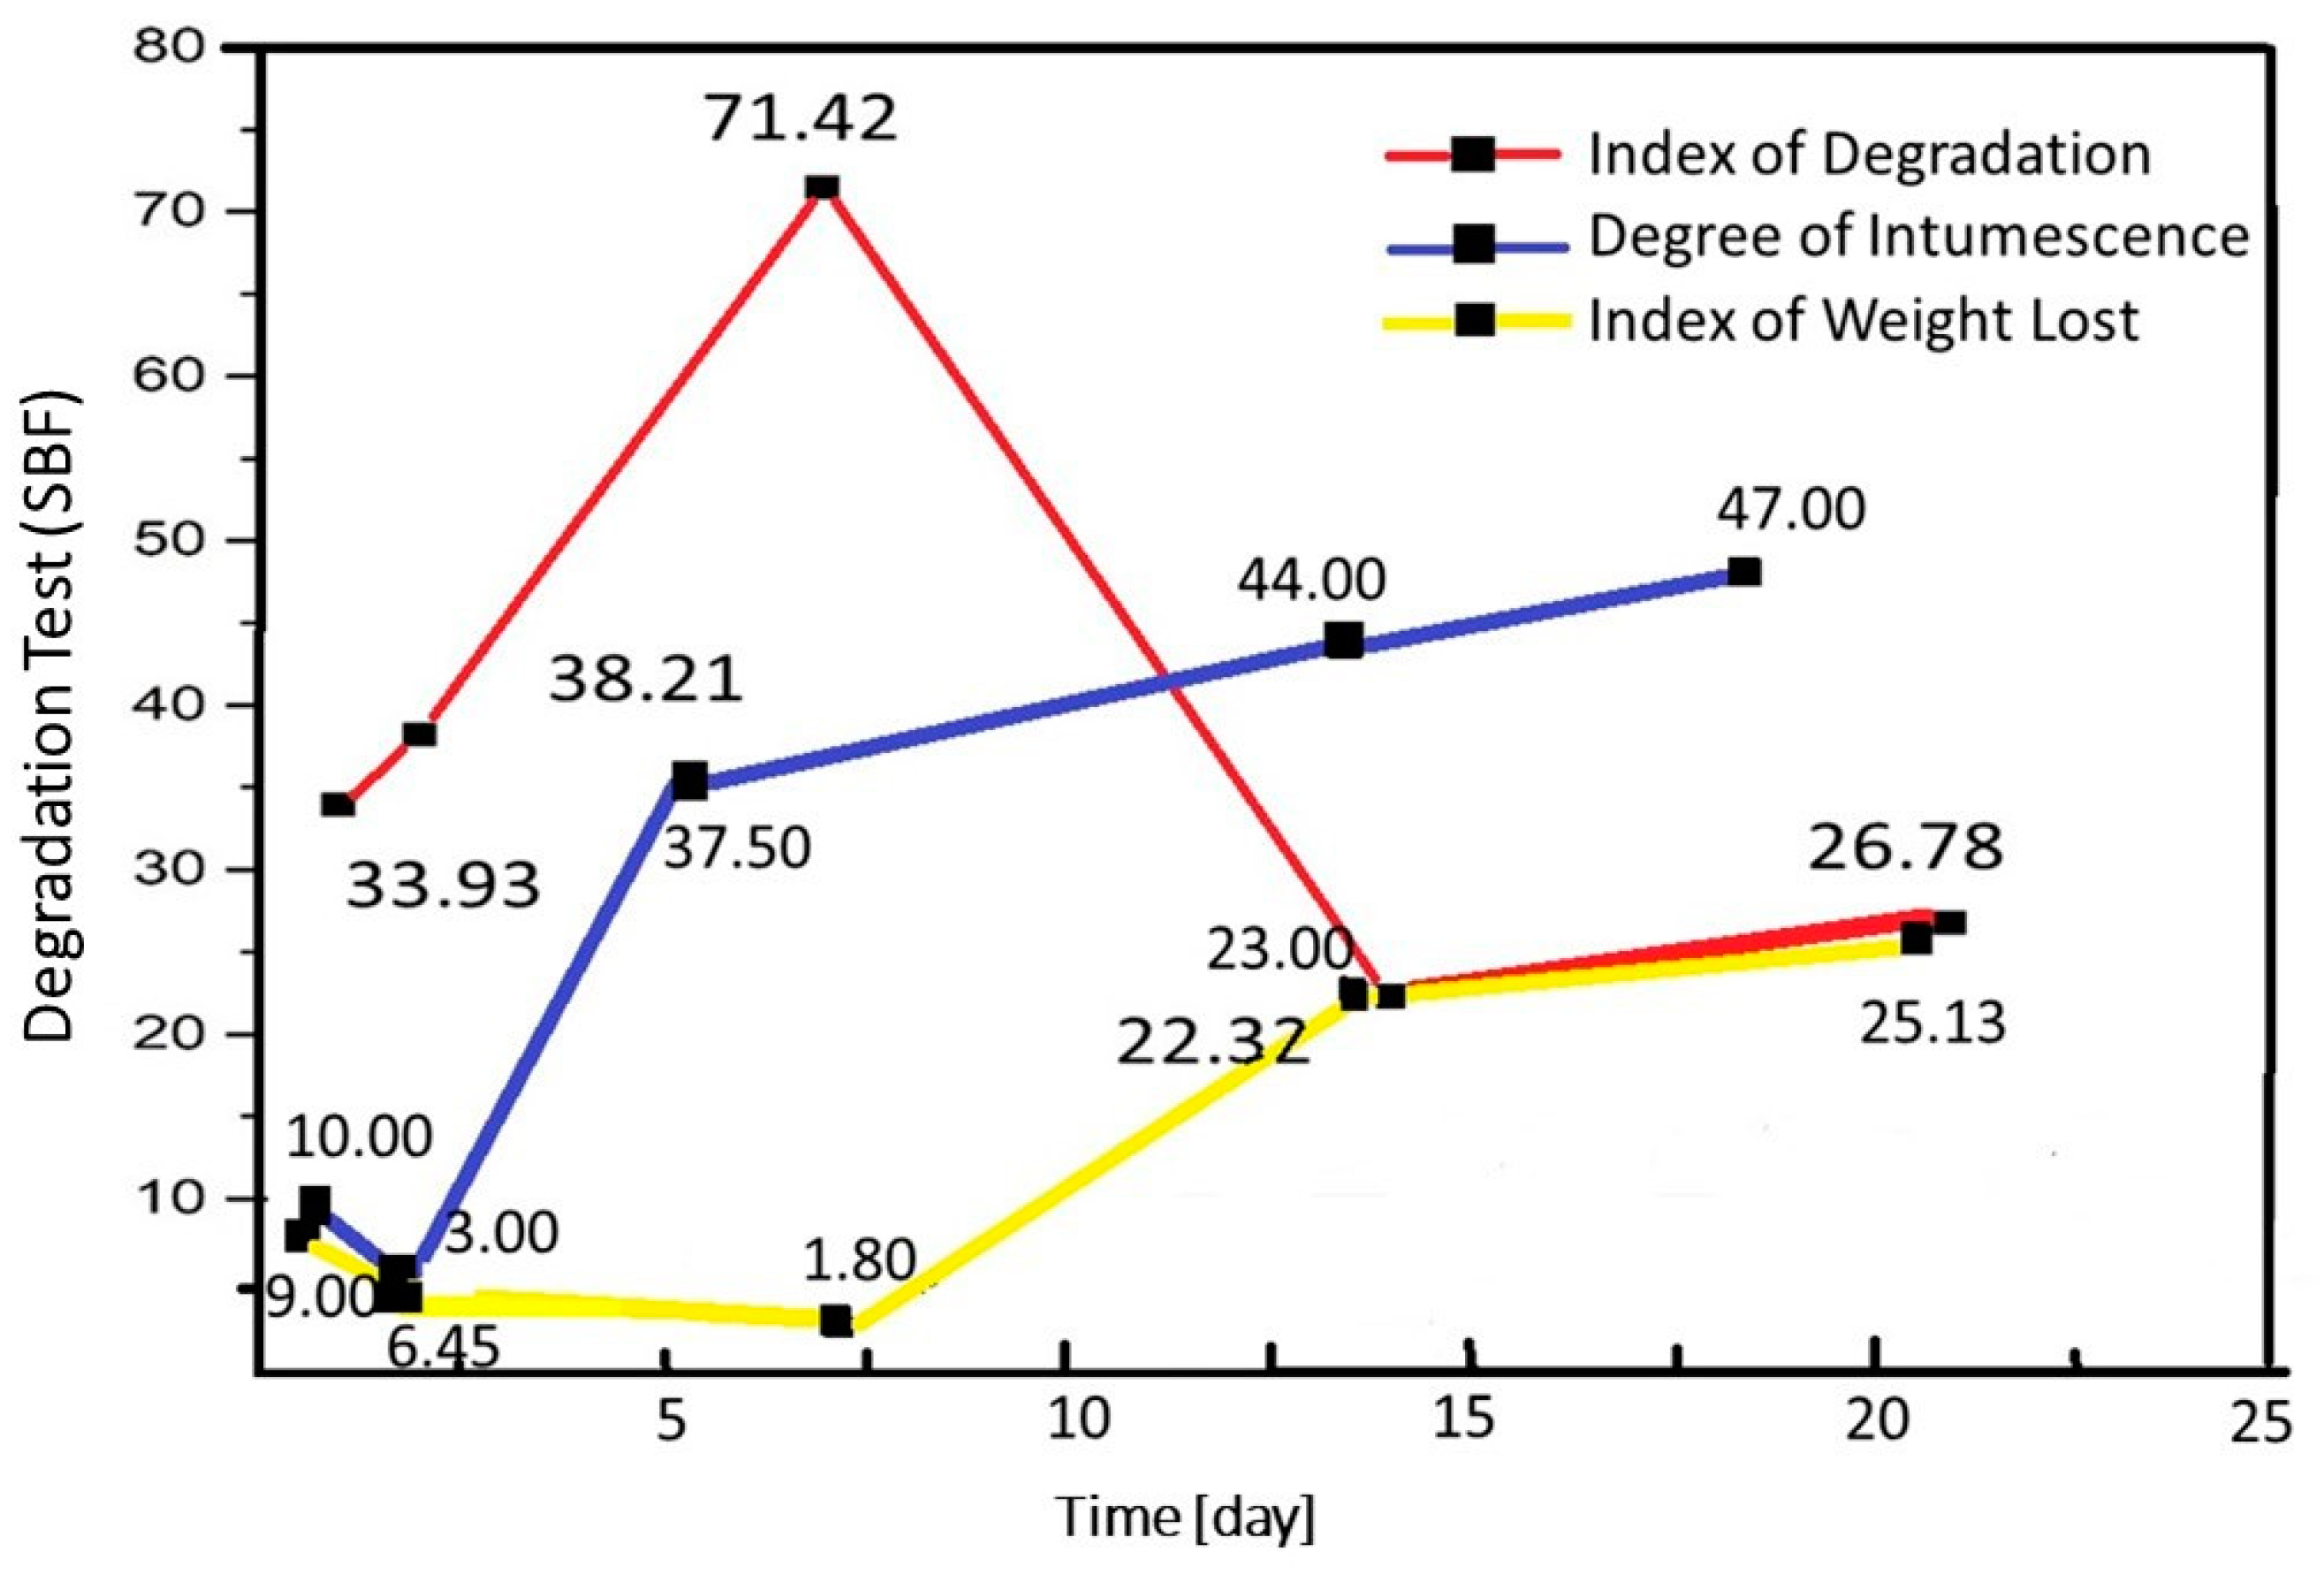
The degree of intumescence (GI) affects the sample’s ability to swell and absorb fluid. Thus, in the over time at fixed pH = 7 in the simulant solution, it was found that the chitosan spheres can absorb liquid either by the mechanism of diffusion of fluid or adsorption of molecules on its surface. It can be complemented using thermogravimetric analysis [55,65]. The degree of intumescence is shown in Figure 9. The DI measures the system’s ability from the sample to lose mass to the medium and ultimately causes degradation of the material. The DI is shown in Figure 9 too. Finally, The mass loss occurs as a profile of the percentage of the amount of mass lost over time. A linear trend represents a mass loss. The mass loss is too shown in Figure 9 below.

 Cytotoxicity Test of Chitosan Spheres in Cell Culture

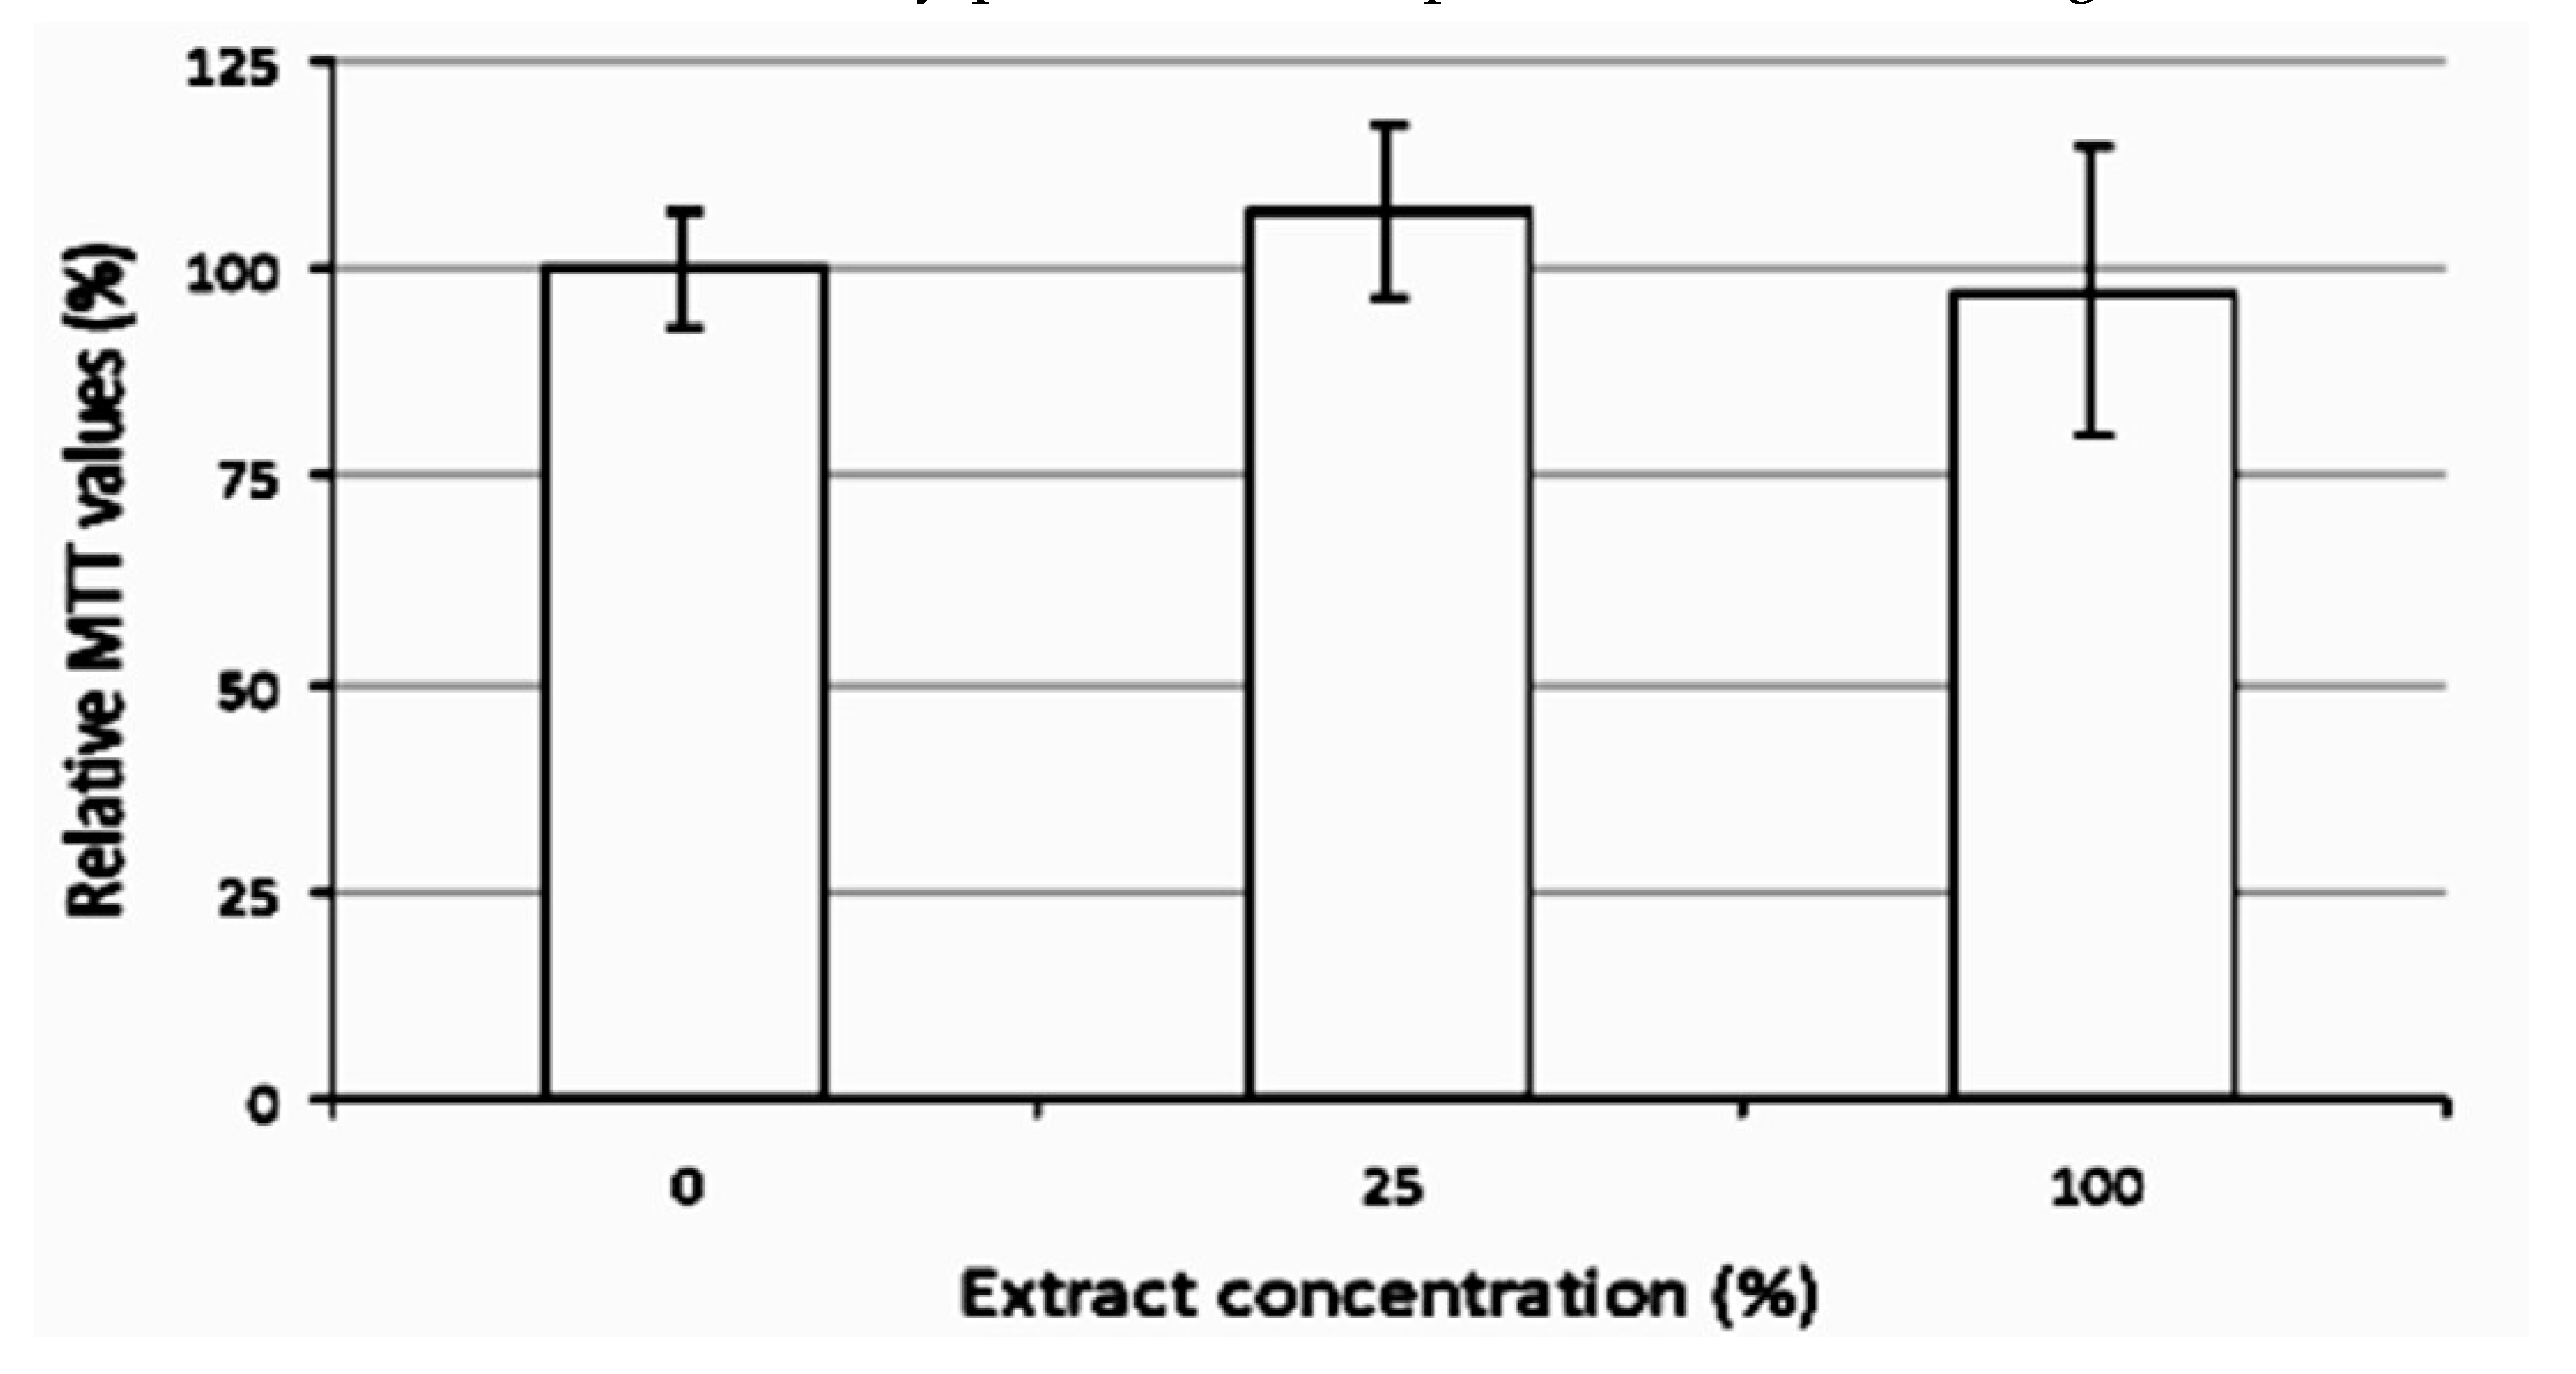
The cytotoxicity test was tested using DMEM culture medium fetal bovine serum condition when compared to the control group (pure culture of fetal bovine serum-free) was possible to guarantee that not differentiates statistic between conditional of each type of sphere when compared to each other. The chitosan obtained by process development is shown in Figure 10.

 Controlled Release Test

In the release assays, it is seen that the carrier can release the iron chloride for up to 5 h and also for 5 days following a similar and relatively constant pattern at one (1) hour intervals with an average rate of controlled release over these 5 h thus maintaining the same pattern. Besides, the same experiment was delineated in the same manner, and the release pattern after the initial incubation of 12 spheres in initial 10mL in 4 mL of iron chloride was checked for 5 consecutive days.

 Diffusion Model in Spheres with Known Solution Concentration for Solution

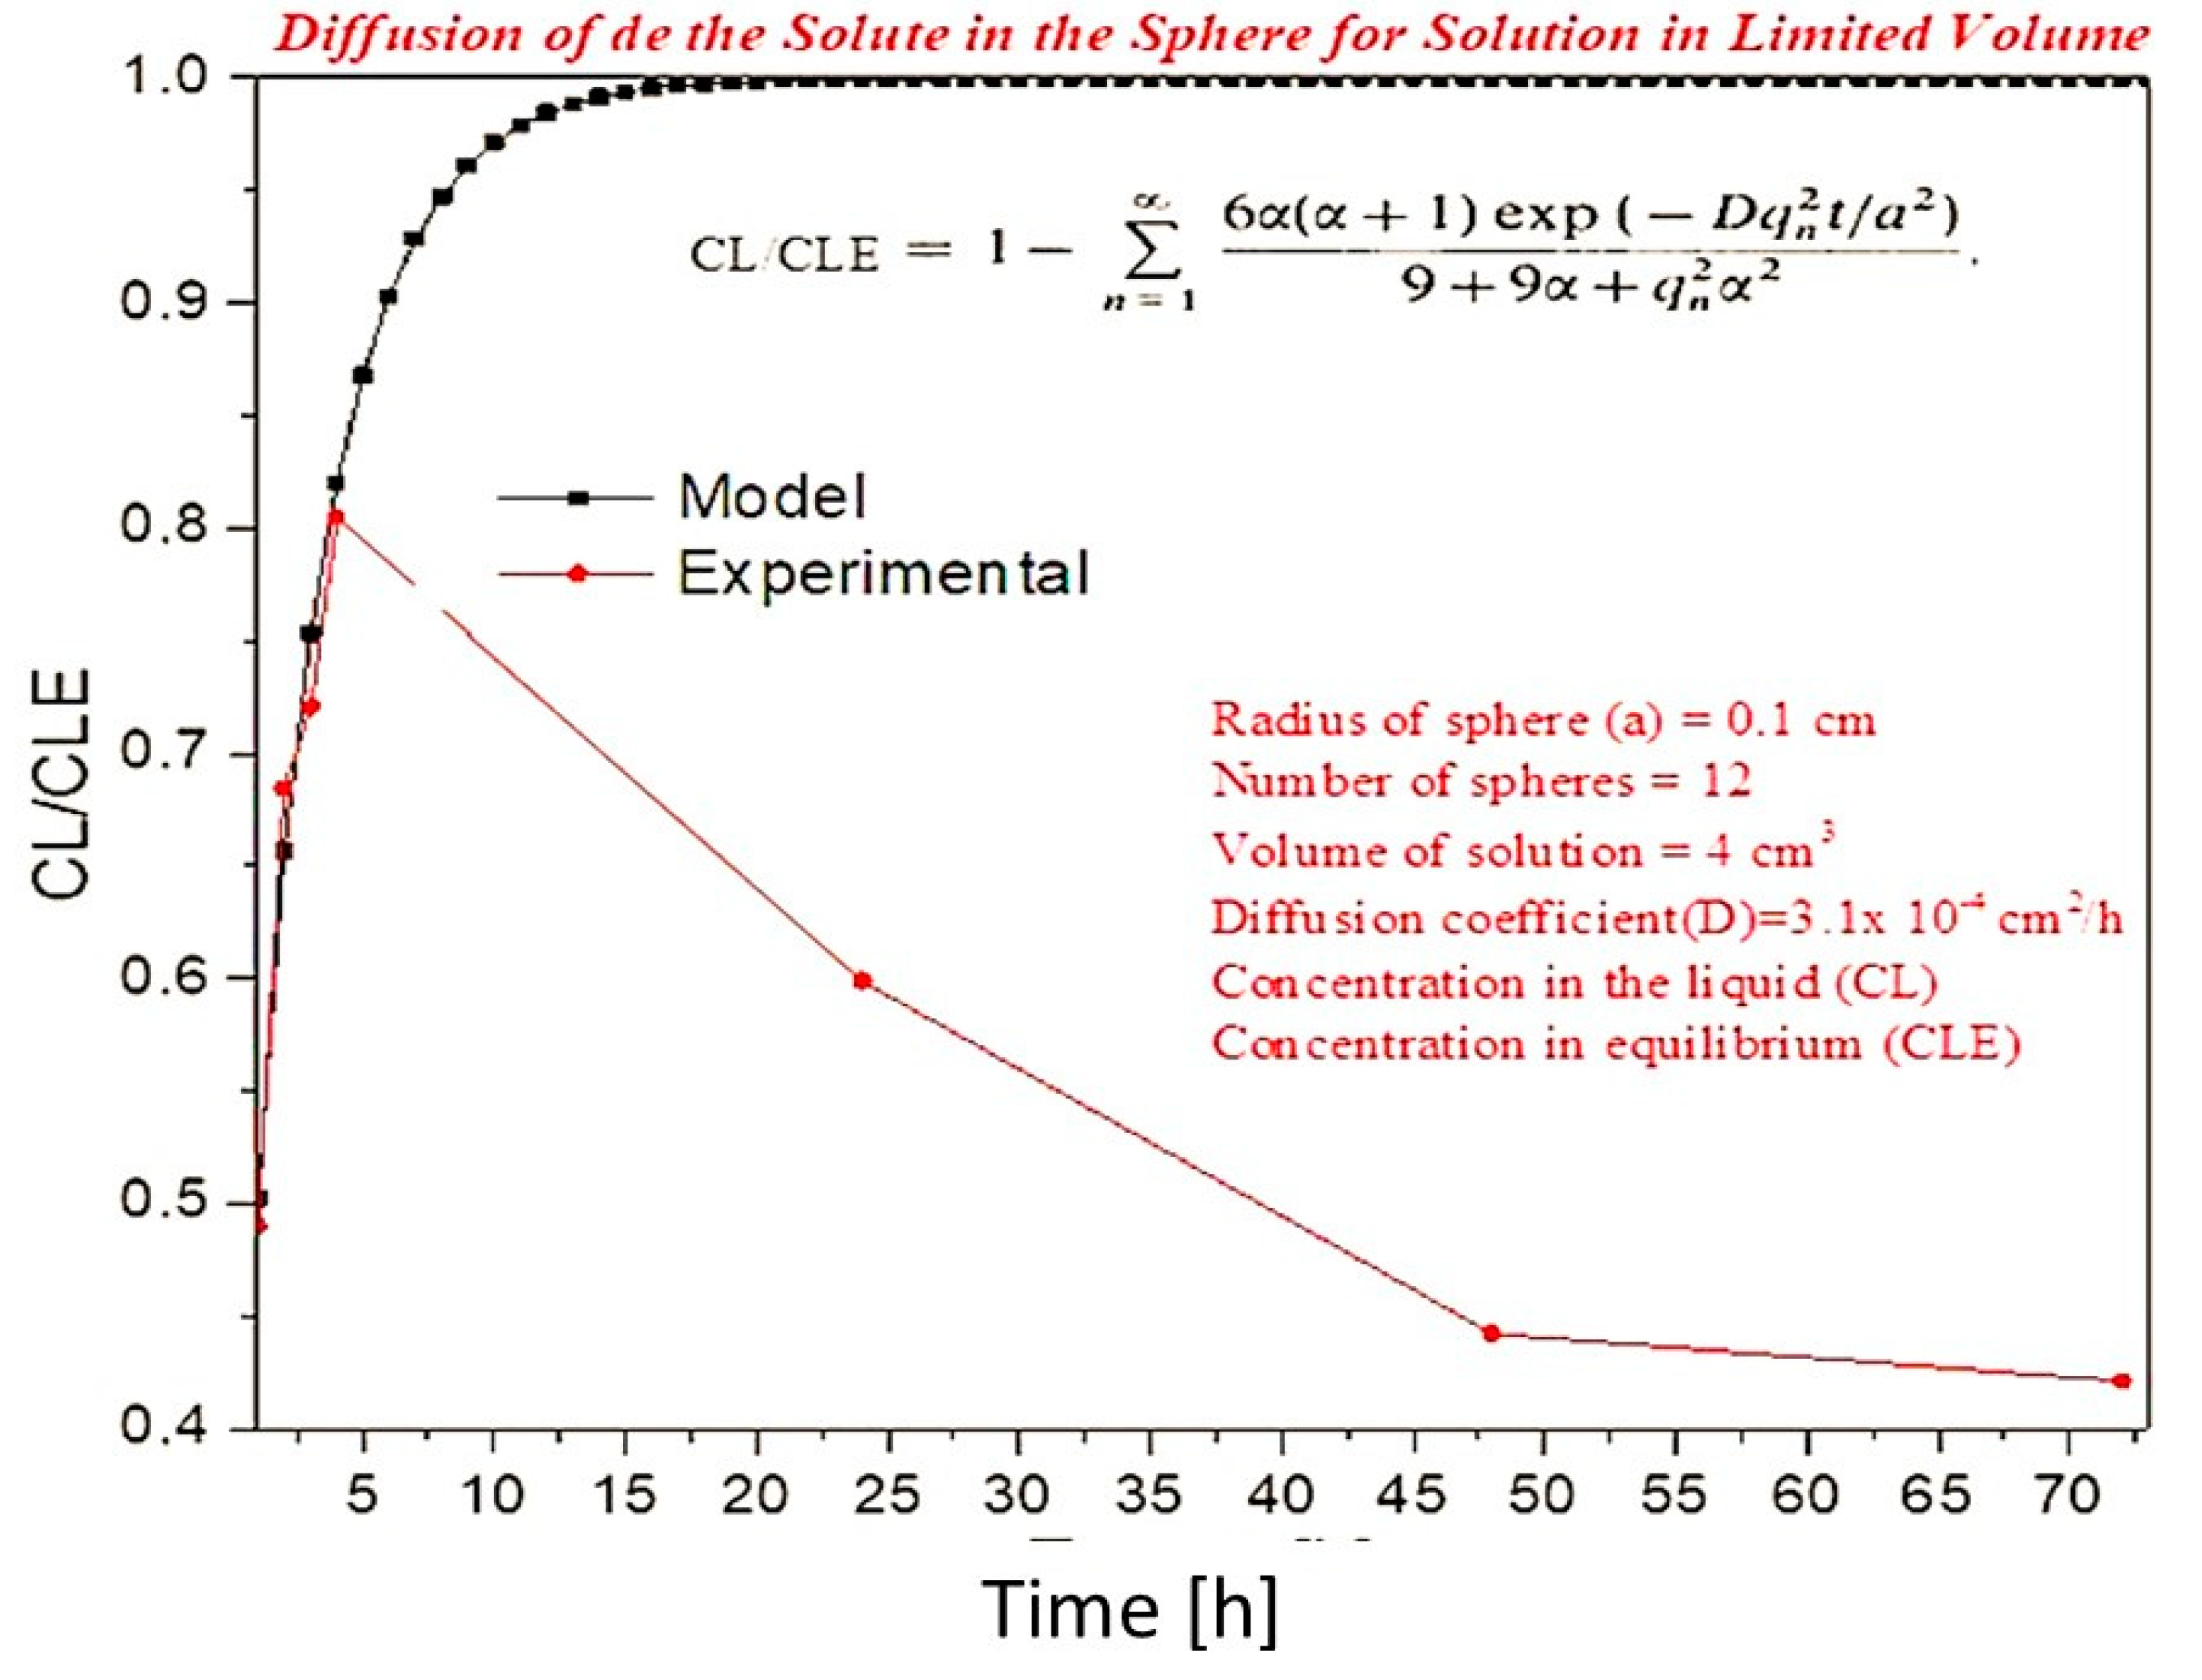
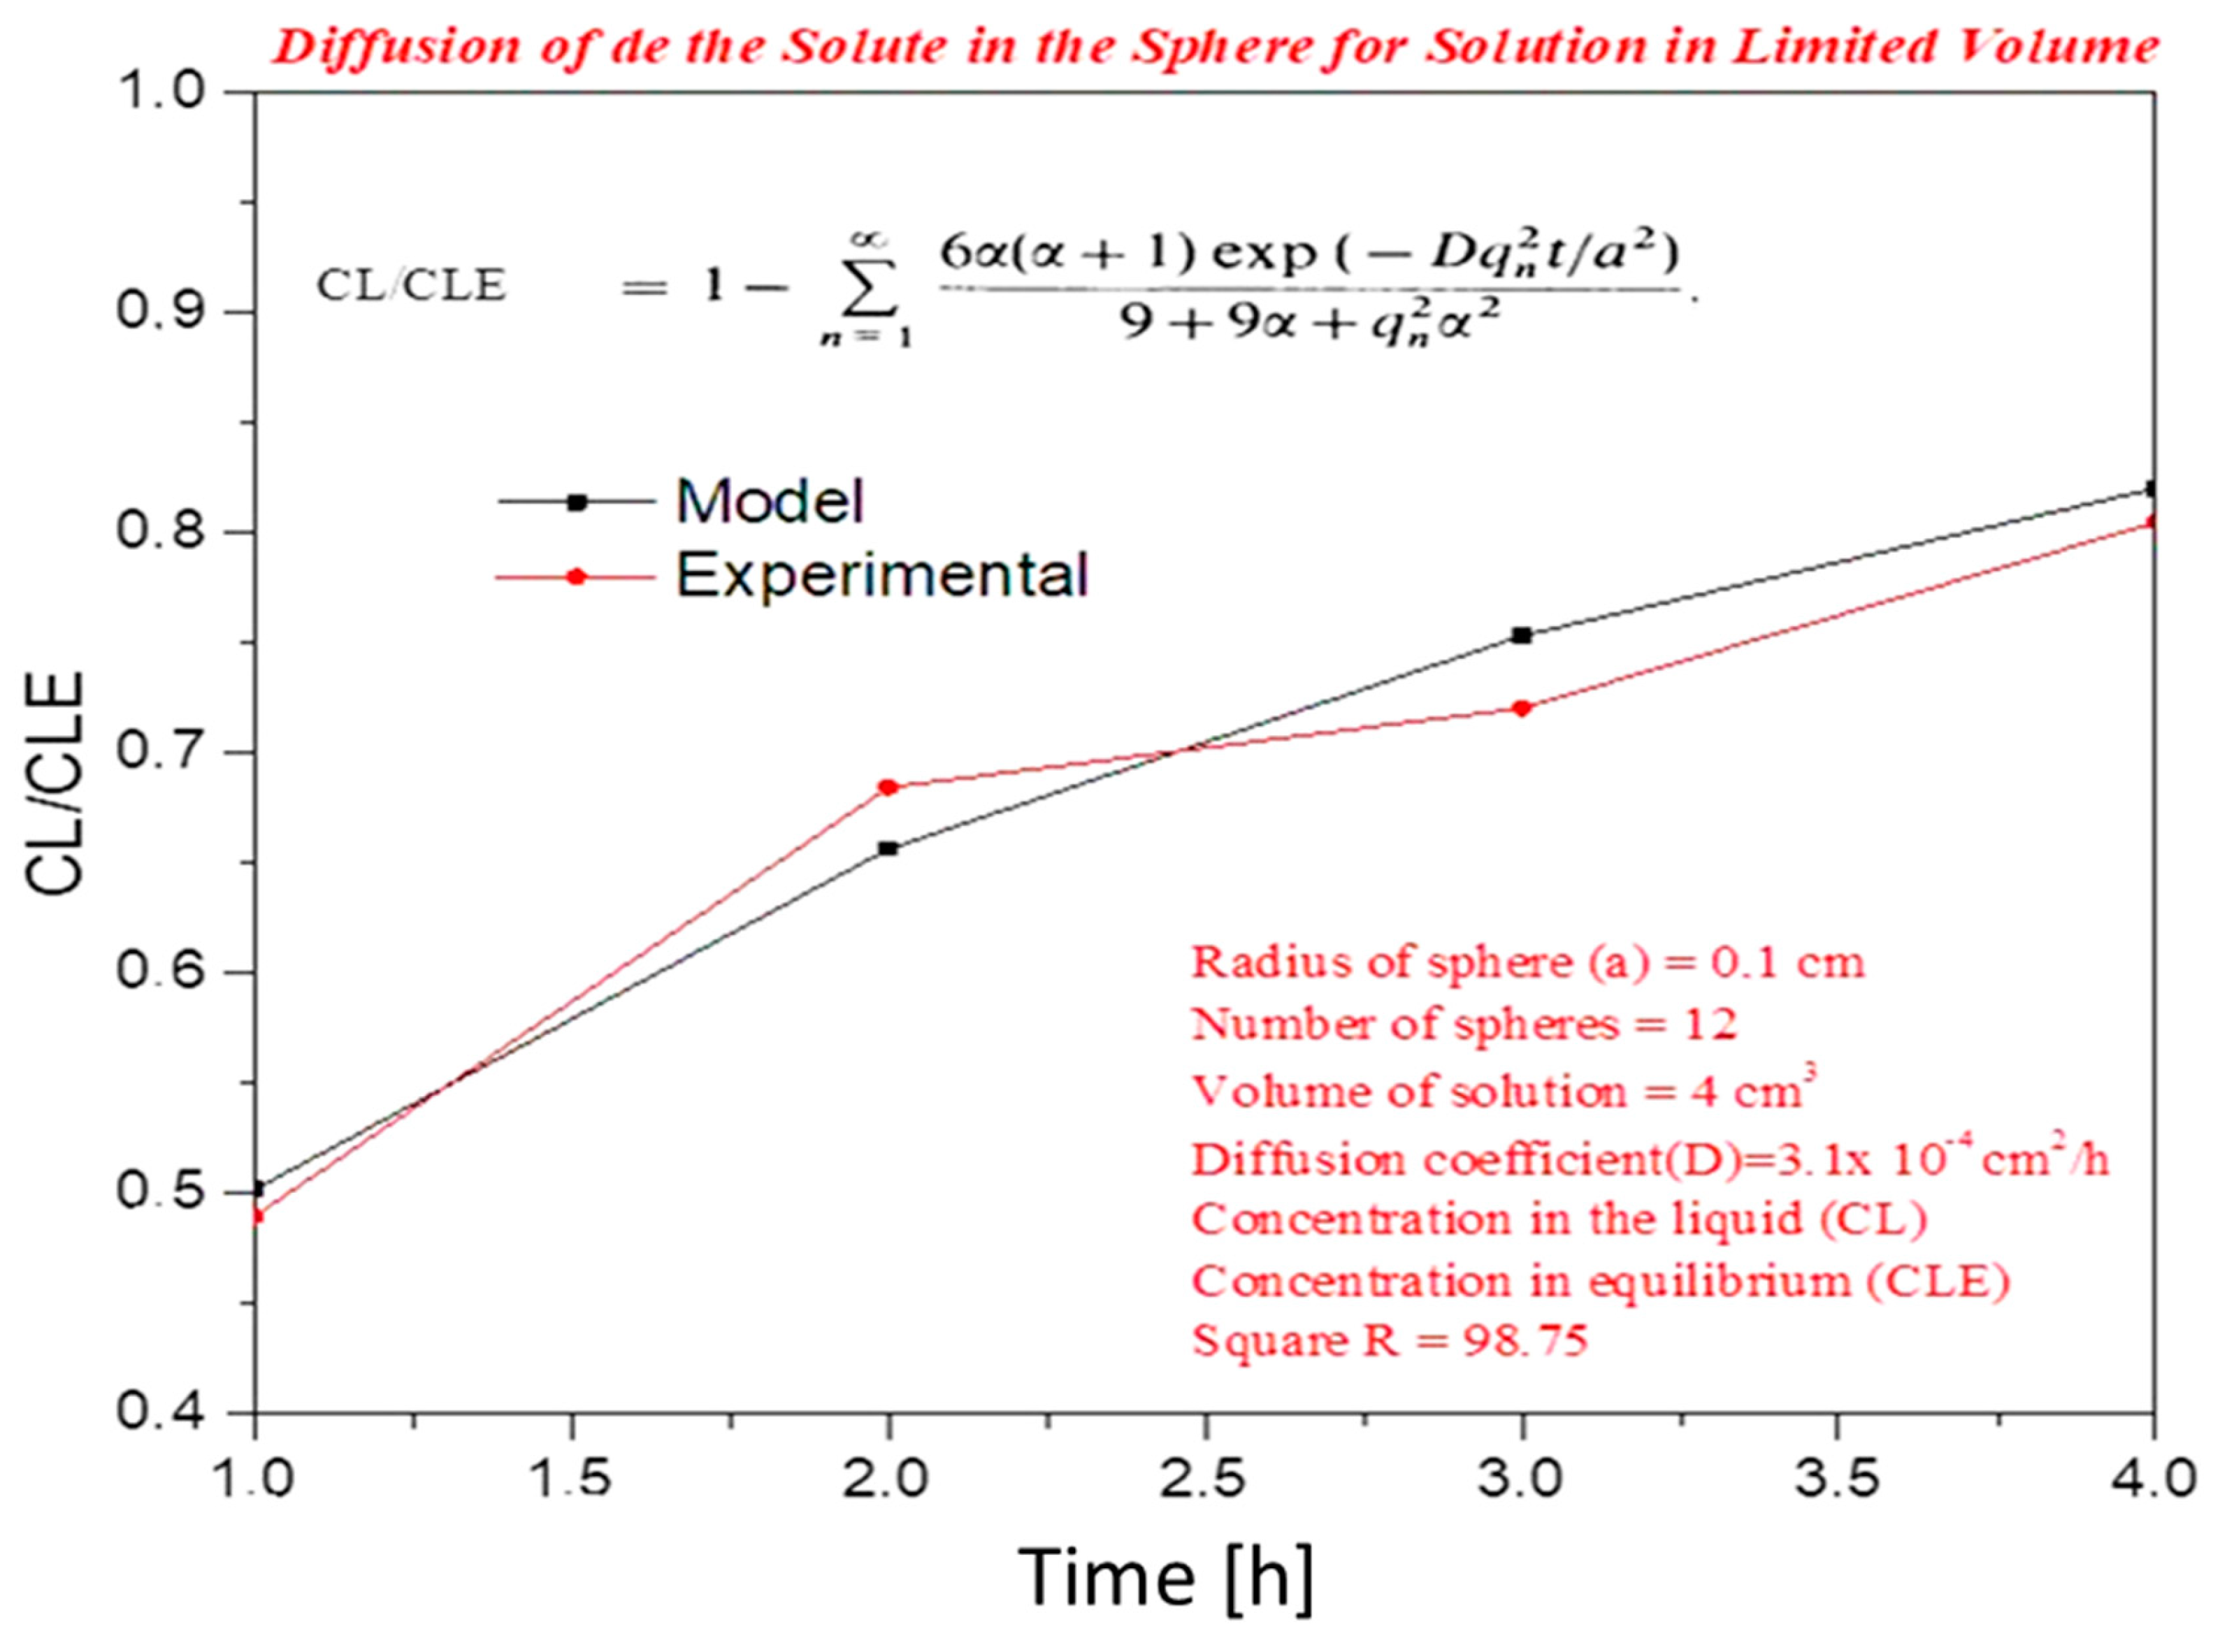
The theoretical model was implemented in the Fortran language, which had as data input the values shown in Table 3, and in Table 4 can be observed the experimental data. The model response was obtained in a text file and plotted through the Origin software, as can be verified in Figure 11 and Figure 12. The diffusion coefficient D used was 3.1 ×10⁻⁶ cm2/h obtained inversely by the least-squares method, considering the first 4 h where there were only the solute release phenomena.
The Figure 11 shows the release and absorption of the solute by the spheres, which showed a behavior with great release capacity in the first 4 h, reaching a maximum value of CL/CLE of 0.8045, which justifies a high coefficient of diffusion. After the first 4 h, the spheres began to absorb the solute, which we can observe until 72 h.
The Figure 12 shows that only the spheres’ release behavior can be observed in Figure 12, and it is concluded that the experimental comparison with the model shows a good correlation presenting a square R of 98.75.
Modeling the different iron (Fe) arrangements as a function of pH variation.
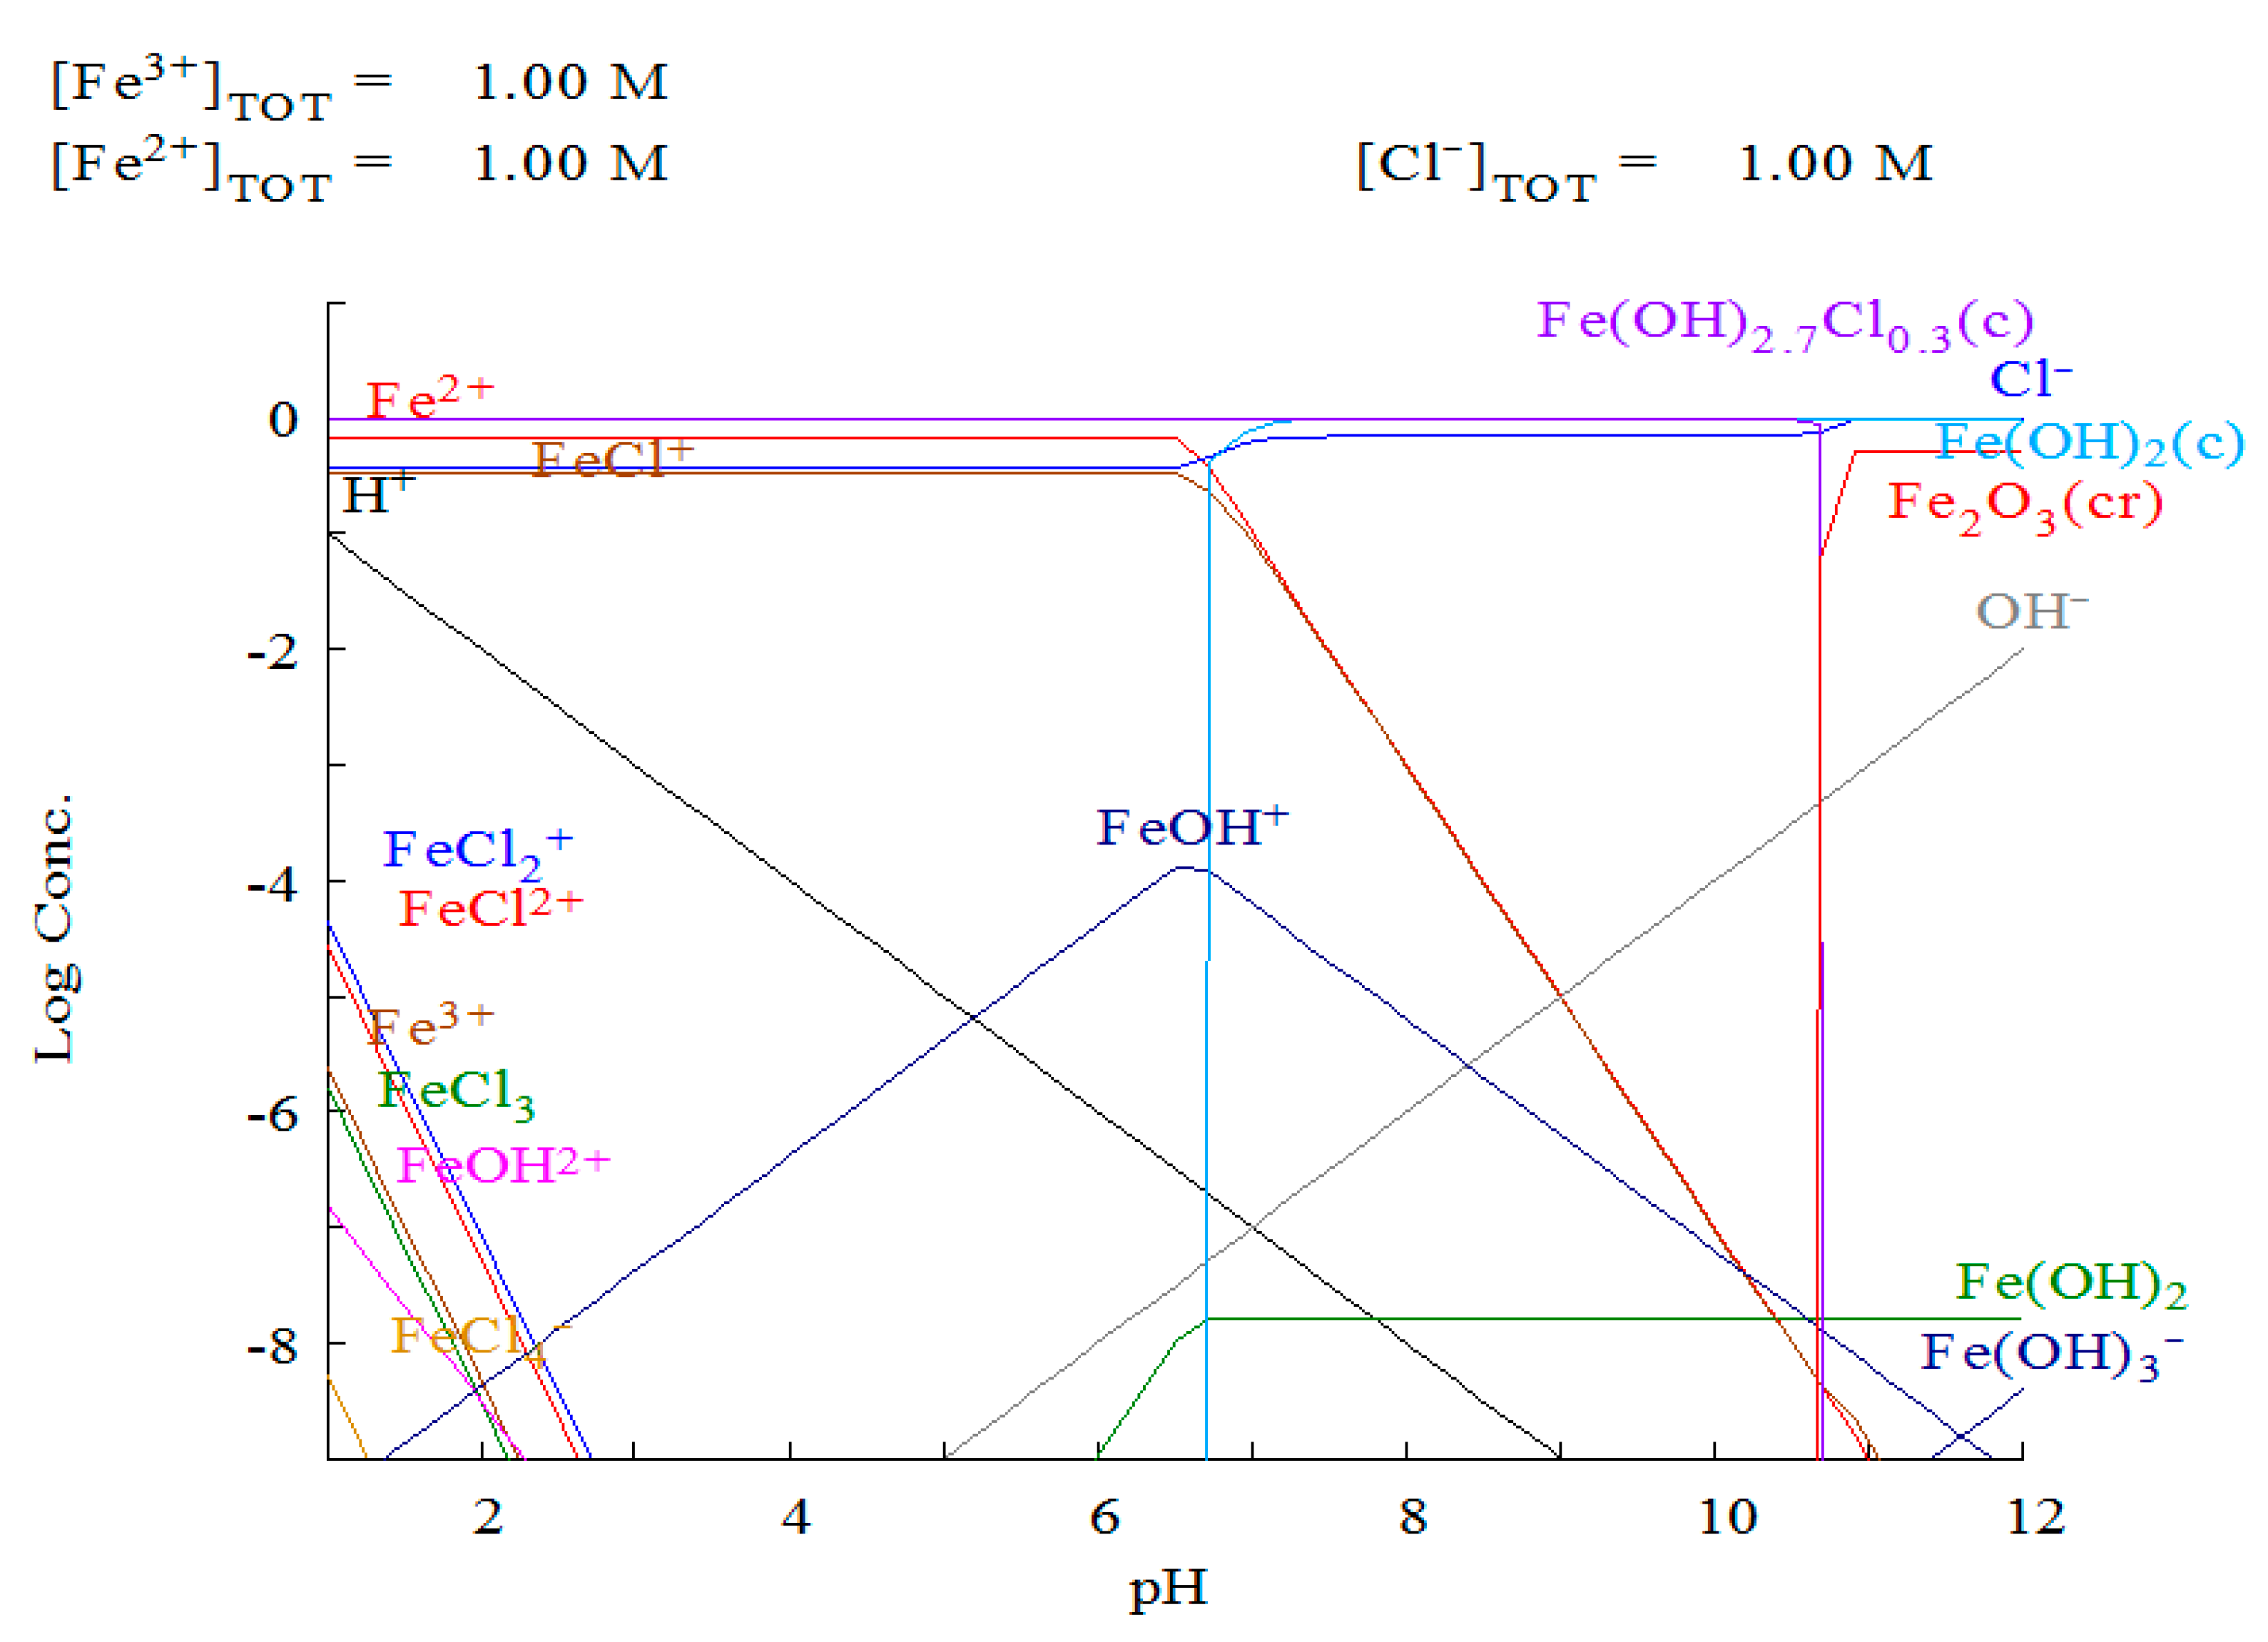
Different perspectives on the behavior of iron and its availability at different pH values were evaluated before selecting the iron chloride to be loaded onto the surface of spherical chitosan carriers [94,95] in Figure 13 below. Thus, the speciation defined by IUPAC is the occurrence of a chemical element in different forms in a system and the bioaccessibility, toxicity, and mobility of metal ions in the controlled release is directly linked to speciation. We can thus illustrate speciation through modeling using the Meduza96 software (Informer Technologies, USA).
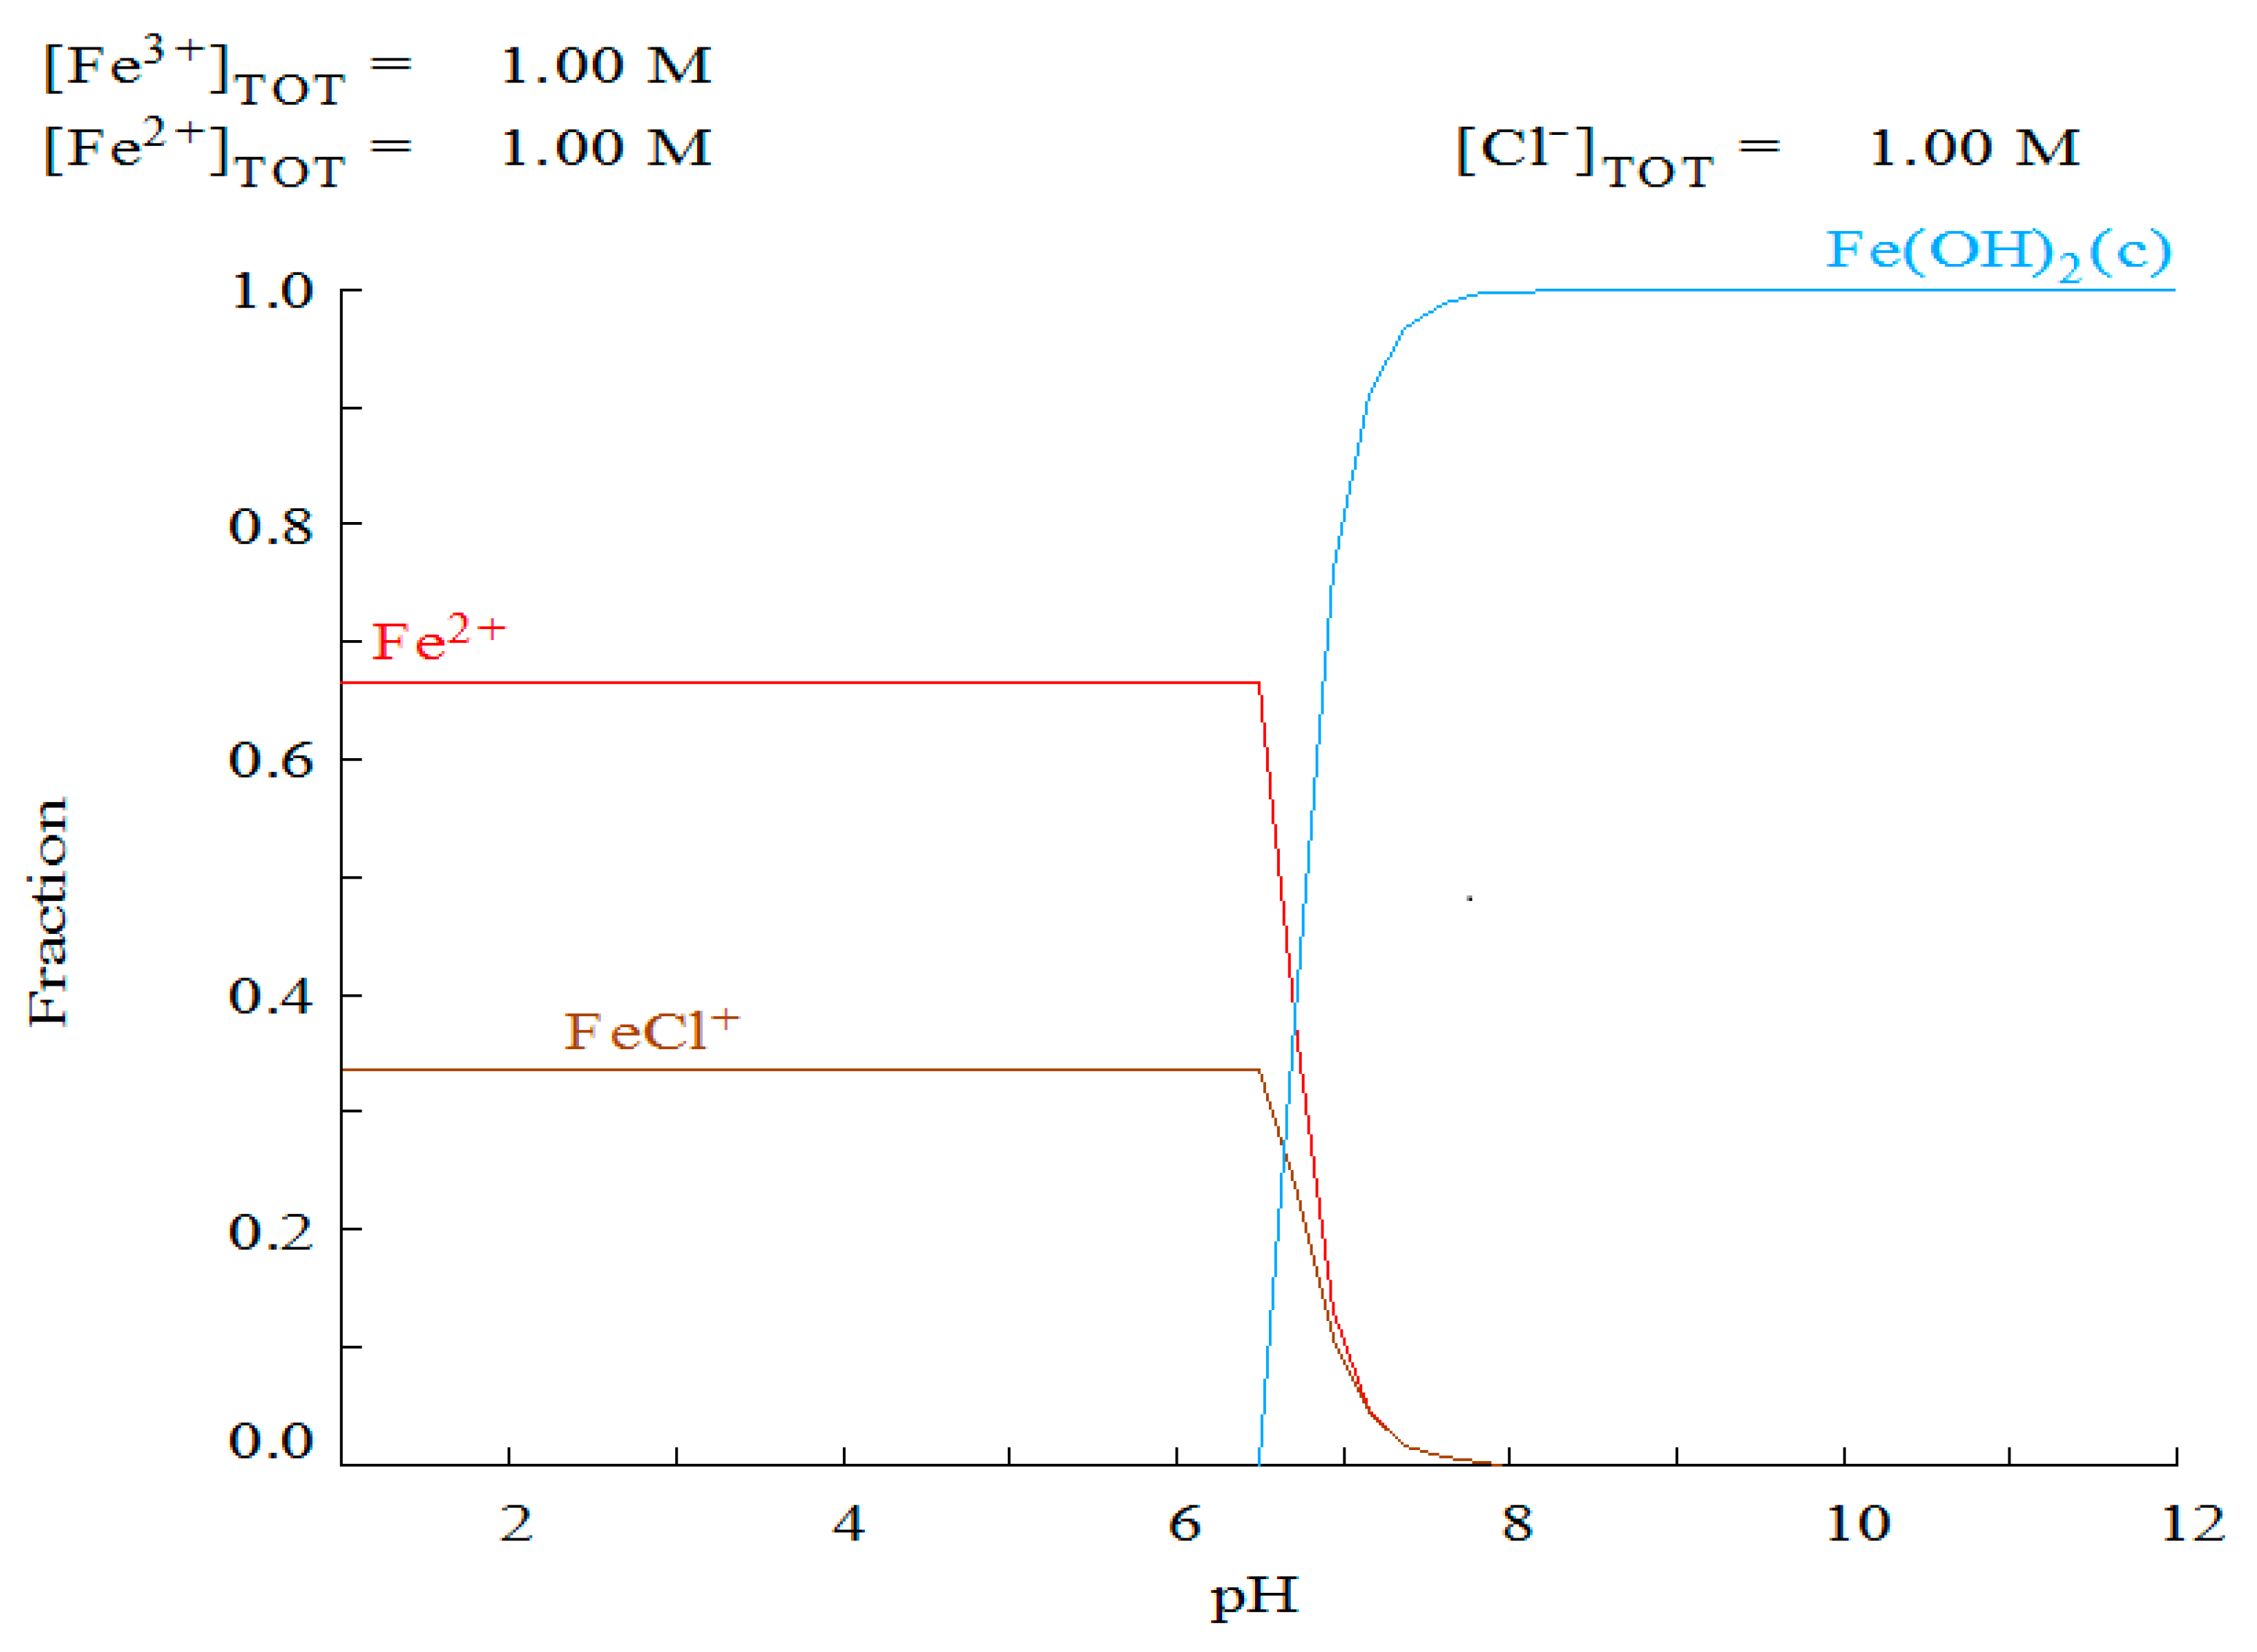
Thus, the modeling of Fe3+ and Fe2+ ion speciation is shown in Figure 13.

Discussion

Many studies with chitosan have been reported in the literature, and some of chitosan spheres but not with the same protocol design sequence or reagent parameters used, so the developed protocol for obtaining and characterizing the spheres was done after several previous experiments and tests and some tests are necessary to obtain parameters such as topography, cytotoxicity and degradation tests with simulation of different in vitro conditions were designed specifically for this work, all protocol parameters were developed in our laboratories.
The topographic surface is important in the interaction and biointeraction with cells and biological fluids of the human body. The spheroidal shape and the corrugation’s surface topography contours and irregularities present on the surface of the chitosan sphere stand out. Similar aspects were also seen by da Silva [39,77] in zinc-hydroxyapatite granules. In addition to the chitosan spheres obtained by Tavaria et al. (2013), although not subjected to the lyophilization process, they also presented the spherical shape and similar aspects Demadis (2009), although they present spheres of smaller size compared to those obtained in our work. It is important that spherical geometry reproduces minority energy systems and it is more stable as a biomaterial application. We see previously measured concavities with diameters ranging from 283 μm to 434–450 μm and with composition obtained qualitatively by EDS from the spheres in the SEM image. Moreover, the specific diameter obtained in this experiment is ideal for application in critical bone defects as a drug carrier scaffold. Ensuring that the protocol for obtaining the chitosan sphere is capable of generating a product with the key chemical groups necessary for the production of the biomaterial is very important, so analyzing the groups that act as fingerprints is necessary. So, Figure 4, can see mainly the chemical element found explicitly in the chitosan granules scaffold from FTIR analysis. Fingerprint of mainly chemical groups is important to identified. These same bands were also seen by Negrea et al. (2015) during the characterization of chitosan films. An antisymmetric stretching band was observed at 1155cm−1 C-O-C corresponding to the β-glycosidic bond (1–4), namely the saccharide structure. The elongation observed in 1067 cm−1 cyclic CO, and 899 cm−1 indicates Resende et al. (2010) that the bands are present wide due to the macromolecule and intermolecular bonds’ inherent properties interact the hydrogen. The obtained parameters were shown to be consistent and similar to those obtained by Luyen (1996) and the objective was to prove the chitosan beads by demonstrating the chemical groups that make up the chitosan chemical structure [91].
The main parameter that determines chitosan properties, besides the molecular mass and degree of deacetylation, is the polymer’s crystallinity. The chitosan has three different morphisms: non-crystalline, hydrated crystalline, and anhydrous crystalline identified by XRD. The hydrated form of chitosan reveals an acute peak at the angle 2θ = 10.4° and a peak weak at 2θ = 20°–22°. The anhydrous form is characterized by an acute main peak at 2θ = 15°, and an additional angle at 2θ = 20°, and the amorphous form has only an acute peak at 2θ = 20° [56,57,91,96].
In relation to the analysis of infrared spectroscopy, we can observe the N = N stretch of the group appears as a mean band at 1481 cm−1, also found by Martins (2016) (Souza, et al., 2015). Various deformation vibrations of polysaccharides backbones represent the Raman bands at 1462 and 1369 cm−1. The band at 1109–1200 cm−1 was attributed to the symmetric stretching vibration of glycosidic C-O-C groups [90,91,92]. So, these first analysis showed de fingerprint classical of the chitosan material structure. Besides that, complementary analysis was performed as TGA analysis.
It was necessary to evaluate the degradation test which demonstrates the behavior of the material in an inference of in vivo conditions through initial in vitro tests in SBF solution (body plasma simulation), the new TGA analysis has elapsed another analysis under the same previous TGA conditions for 21 days in the SBF solution. In this work, we use the ISO10993-5 as experimental base. The experiment degradation was performed in extreme solution potassium acetate to the promoted total dissolution of the chitosan spheres, making it impossible to evaluate the degradation test response through TGA and DSC analysis after 21 days of degradation assay using the extreme solution. Other authors contribute to using the chitosan material degradation test in SBF [97,102].
In the experimental test of SBF degradation, it was found that it did not affect the temperature of the initial band of the mass loss (around 85°C), and the degradation profile of the initial and final samples remained similar [97,102]. There were small modifications in the calorimetry difference profile (DSC) comparing the initial and final conditions. The total mass loss occurred in the range between 40 and 85°C. The analysis of thermal degradation was carried out using TGA and DSC. Degradation tests are so import to infer in vivo responses in humans from in vitro tests.
In the initial times, the material’s degree intumescence was minimal, and in the final test times (7, 14, and 21 days swelling reached higher percentages) suggest an osmose effect or weakening of polymer chain bonds over time. The Degradation Index (DI) measures the system’s ability from the sample to lose mass to the medium and ultimately causes degradation of the material. In DI the case of biomaterial, this factor is of extreme importance since the biomaterial buried in the human body must exert its action and undergo hydrolysis and degradation by the human organism to finally be replaced by human tissue instead of the critical defect. Thus, the DI affects the medium’s effect on the percentage loss of mass of the sample [95]. In Degradation (DI) tests, it was possible to verify that the maximum mass loss occurred at 7 days in SBF solution, and even though it was a biocompatible medium, the material suffered degradation and degraded over time.
The mass loss parameter occurs as a profile of the percentage of the amount of mass lost over time. A linear trend represents a mass loss. It is observed that there was a downward tendency initially to have an abrupt initial mass loss (10%) followed by a decrease; however, from day 7, this mass loss occurred in a progressive and ascending manner having its highest point occurred during 21-day assay in blood plasma simulator (SBF) similar profile was studied by Schütz et al. (2011). The in vitro assessment of mass loss contributed to the most approximate understanding of biomaterial degradation when applied to humans, and it is essential to assess the degradation parameters by means of in vitro tests. Besides that, In this case, it is important to state that the formation of complexation was not evaluated, since the release mechanism controls the data from chitosan scaffolds, which occurs mainly through weak chemical bonds and the phenomenon of adsorption and desorption of the chemical element, in this case iron, which was evaluated in UV-Vis equipment operating at a wavelength of 420.
It is interesting to evaluate the possibility of applying the sphere protocol developed in relation to previous clinical application tests such as in vitro cell culture. For this it is interesting to prepare the extract of the biomaterial properly about 24 hours before and processed in culture medium without fetal bovine serum and perform the in vitro test using standard ISO19993-5 protocol in established strains for future certification purposes. So, in the cytotoxicity assay, it was possible to determine that for the test conditions of the biomaterial diluted in DMEM culture medium without fetal bovine serum compared to the control group (pure bovine serum-free culture medium), there was no statistical difference between the conditions of each type of sphere compared to each other [45,69,70,71]. All conditions showed cellular viability for IC50, demonstrating that it was possible to predict that there was no cytotoxicity in freeze-dried chitosan beads with this experiment. According to the above graph, we can verify that there was no cytotoxicity in any condition of extract (25%) and (100%) in the lyophilized spheres without the addition of a crosslinking agent showing that this sphere presents a very great potential for future use as a cellular framework for regeneration and bone repair in tissue engineering. It is known that similar studies have also been found by (Lima et al., 2011) [70,71,72,73]. However, this cytotoxicity index may vary depending on the use or not of the crosslinker. In our work, as we did not use crosslinking agents, it was found that the process proposed to obtain the chitosan spheres did not affect the noncytotoxicity of the chitosan sphere and the spherical framework was then considered as not cytotoxicity, so viability.

 Degradation

The experiments with the chitosan spheres degradation showed that the release of these microspheres in iron chloride medium initially followed a linear tendency and with a relatively constant profile in the different times of 5 h and also in the 5 consecutive days, which corroborates the literature in the capacity of the carrier obtained being able to absorb and release molecules into the medium in a limited volume (The spheres had 40% of iron chloride incorporated). The model proposed in this paper correlates the calculations from the release products to a limited volume [74,75,76]. The freeze-dried porous chitosan microspheres were chosen to be the basis of the experiments. It shows a lower burst effect in the UV-Vis measurement intervals in the initial times, besides maintaining the standard throughout the tests, higher desorption and absorption capacity than conventional carriers [76].
The literature shows that non-lyophilized chitosan carriers exhibit chitosan forms with two major disadvantages: acidic solubility, which makes it difficult to recover, and low surface area, which limits access to unexposed adsorption sites (amino groups), decreasing speed and adsorption capacity [77]. These properties cancel out further processing steps, including lyophilization of the beads, thereby maintaining the beads’ shape and size without loss to the medium solution.
The great importance in the therapeutic application as drug release in these systems is the longer the drug stays in the bloodstream – increasing its effectiveness compared to the administration of these drugs, without a carrier; however, this application for the moment has only prospects of local application, and if possible in critical defects (those that alone do not heal on their own). Besides, these carriers’ development has demonstrated some advantages, such as reducing systemic toxicity, safer administration, and vectorization to the desired sites. Thus, chitosan can function as a guideline, thus ensuring controlled release at specific sites for longer at its site of action [78,79].
The results showed a release pattern representing the spherical chitosan carriers’ release pattern when using the iron chloride applied to the Crank method. Similar results and graph profile were found in some studies using carriers, including the study of Tavares et al. (2015) [80]. Other carriers also had their controlled release modeled by the Crank method as described [78,94]. Being chitosan, the second natural source for use as carriers most abundant alongside cellulose, a natural amino polysaccharide, non-toxic, biocompatible, antibacterial, and biodegradable has led to significant research in biomedical and pharmaceutical applications such as drug administration, tissues, and wound healing dressings [82].
According to previous experiments, it has been found that it is an ideal material for controlled release. The primary amine group in chitosan is responsible for its various properties, such as cationic nature, controlled drug release, mucoadhesion, in situ gelations, and antimicrobial. Thus, various forms of chitosan materials, such as spheres, films, microspheres, nanoparticles, nanofibers, hydrogels, and nanocomposites, as a drug delivery device and attempted to report the vast literature available on chitosan-based materials in drug delivery applications Lopes (2005). As a hydrophilic matrix system with good pharmaceutical application properties [84] chitosan-based nanomaterials also emerge as promising carriers of therapeutic agents for drug release due to good biocompatibility, biodegradability, and low toxicity and can be prepared by the mini-emulsion, chemical or ionic gelation, coacervation/precipitation, and spray drying methods. As alternatives to these traditional manufacturing methods, self-organizing chitosan carrier nanomaterials also emerge as an alternative route or association with traditional routes in that they present significant advantages and have received increasing scientific attention in recent years [85,86].
The spherical shape chosen was given for 2 reasons: it describes a system of lower energy. Also, it mimics structures of similarities of size and organization when instituted the batch size range similar to structures that follow patterns of organization similar to structures organized with functions, and particular properties can be obtained without complicated further steps of processing or modification. The direct procurement aspect of chitosan carriers directly interferes with drug administration applications of different agents [86,87,88].
About the modeling itself, we used the diffusion coefficient to obtain the classical spherical shape of the scaffold obtained and consider as calculation the diffusion coefficient the following parameter.
In some studies, these parameters can be modified as a work in which the diffusion of cowpea beans is considered a spheroid. There is another way of evaluating the diffusion coefficient according to the drying temperature, and also temperature variations as analyzed using the Arrhenius model described below; however, in our case, we consider fixed temperature and pH as it occurs in the environment of the cavity oral, where A is the constant (m2 s−1); E is the activation energy (J mol−1); R is the universal gas constant (8.314 J mol−1 K−1), and T is the absolute temperature K. In our experiment, the diffusion coefficient was considered the supernatant medium, the continuous flow and also the release sequence in the obtained medium by UV-vis spectrophotometry, and we do not vary the temperature since we consider the human body temperature to be fixed in which the real condition is not variable [89]. In this way, the article also predicts that the effective diffusion coefficient of a sample when in liquid media should also be considered the calculation of the factors of moisture coefficient and use of the adjustment of the mathematical model of diffusion also considering the medium of diffusion in the form and liquid diffusion is the main factor that governs the movement of water among other phenomena [89,90]. Thus, for the described experimental data of the drying of cowpea beans, there was also the need to adjust using the second law of Fick, considering the geometric shape of the product as spherical, disregarding the volumetric shrinkage of the grains and considering the contour condition of known water content on the grain surface. The chitosan sphere is very stable and does not require adjustments in the calculation during modeling.
The criterion made iron as iron chloride as the carrier of choice used for feasibility, cost, and ease of using iron chloride as the iron component carrier with the first resource. It is known that iron still as nanoparticles or at nanoscale iron has its capacity for improved adsorption, so when using iron chloride molecules in the molecular form we approach this advantage due to the increase of surface area and active sites. Nanoparticulate iron has a range of applications in situ, and its great capacity to reduce and stabilize different types of ions gives this material enormous flexibility in its use [91,92,93]. According to Fu et al. (2014), numerous articles published in recent years have investigated water remediation technology using iron nanoparticles, exploring different aspects of science and technology in this field for many applications.
About the selected models when used to represent the experiment, we have seen that mathematical model already existent in the literature are applied to simulate the release of active principles contained in polymeric microcapsules of the matrix type in a solvent: application of the 2nd. Fick’s law from the diffusion coefficient (D) can be determined according to the theory developed by Crank for diffusion and those used, we can also mention the linear driving force model, the Monolithic Solution model, and other semi-empirical models. It is known that the first Law of Fick does not cover the phenomena of interaction between components, contradiction, osmotic effects, effects of pressure or stress, and or fields of force; in the end, it should be stated that Fick’s law is adequate to describe simple diffusion in a binary mixture and was quite useful. The second law of Fick is usually used for diffusion in solids or liquids at steady-state and for an equimolar state of counter-diffusion in gases [93,94,95] that Equation below is similar to the equation for the conduction of heat, and the following equation is obtained from the Fourier law. Many physical situations have already been solved analytically based on Fick’s law [95].
Mathematical modeling of the release of the active principle and its predictability of release is an area that tends to steadily increase its studies due to the academic and industrial importance with enormous potential for the future. Due to significant advances in information technology, in situ optimization of new drug delivery systems can significantly improve the accuracy and ease of its application. The use of mathematical and computational tools should be routinely used to improve the design of new pharmaceutical forms [96].
Thus, the speciation defined by IUPAC is the occurrence of a chemical element in different forms in a system and the bioaccessibility, toxicity, and mobility of metal ions in the controlled release is directly linked to speciation. We can thus illustrate speciation through modeling using the Meduza software (Informer Technologies, USA) [97,98,99].
The simplest mechanism of action in the modeling application involves attempting to simulate the diffusion condition, especially in a liquid medium, infinite volume. Thus, it is assumed from the principle of diffusion where the second law of thermodynamics will flow from a region of greater concentration to the one of lower concentration of a particular chemical species. This chemical species is called a solute. The regions containing the solute may harbor different chemical species, which are referred to as the solvent. In this environment, the phenomenon of mass transfer occurs. The scaffold of chitosan as the carrier was shown to be simple and versatile in the application as versatile adsorbents for the removal of anionic and cationic species in aqueous medium, especially when iron chloride as a carrier [96,97].
Iron is a non-toxic metal and can be found in the divalent (Fe (II)) and trivalent (Fe (III)) forms. Iron species present in aqueous environments depend on pH and redox potential97. Iron speciation under varying pH and potential redox conditions shows the distribution of inorganic Fe (III) species as a function of pH [101].
Figure 15 above shows the modeling of the ions of the agent carried by the scaffold (iron chloride) present in an aqueous solution and based on the nature of the chemical used (iron and its variations). The conditions of the iron ions arranged to be transported inside the chitosan sphere were modeled according to the pH variation with the MEDUSA software’s aid. According to Owens et al. (2016), information about the nature and extent of the adsorbent in suspension and the system’s physico–chemical properties are considered relevant, with pH values being the main parameter to be fixed. In this way, the adsorption and sorption of ions are better understood through the molecular standard’s isotherms at different pH scales. It is possible to observe in Figure 15 different forms of ferrous chlorides and ferrous ions at pH values below 4. However, at pH values close to 7, the concentration of Fe2+ indicates the formation of Fe(OH)2. For the use of iron chloride as a carrier source, the feasibility, cost, future application, and biocompatibility of this component were evaluated; however, it is important to say that iron behavior varies directly depending on the variation in pH by Owens et al. (2016). The ideal is to define the optimum pH and model iron’s behavior under different pH values (Figure 13).
It is known that Fe (II) is one of the most important oxidation states and forms many complexes, the main one with hemoglobin and iron replacement is important even in cases of blood anemia (Shubham). Iron in the diet is absorbed in its ferrous form (FeII) in the duodenum and transported to enterocytes by the divalent metal transporter (DMT1). In regions of neutral and alkaline pH, the reduction potential of iron in an aqueous solution favors the oxidation state of Fe3+, and the acid pH values favor the oxidation state of Fe2+. However, Fe (II) requires the presence of a reducing agent to become Fe3+. In general, Fe (III) is adsorbed by a cation exchange process and can form complexes when in the presence of water that can be available by absorption e desorption. The formation of iron chloride is favorable in acidic conditions, and its formation does not promote macro-structural changes on the surface of the chitosan granules, as observed in the experiments; thus, Figure 14 shows the fraction of the Fe2+ and Fe3+ species as a function of the pH values.
Iron species present in aqueous environments depend on pH and redox potential [100]. Iron speciation under varying pH and potential redox conditions show the distribution of inorganic Fe (III) species as a function of pH [101,102]. The conditions of the iron ions arranged to be transported inside the chitosan sphere were modeled according to the pH variation with the MEDUSA software’s aid99,100. So it is important that pH values being the main parameter to be fixed. In this way, the adsorption and sorption of ions are better understood through the molecular standard’s isotherms at different pH scales. So, thus, the modeling of iron chloride by the meduza software can predict different behaviors depending on the pH, which helps in planning the development of the spherical chitosan scaffold, as well as in the proportion and specimen of iron chlorine to be used depending on the pH of the region. to be applied [103,104,105,106,107].

4. Conclusions

This work made possible the development of the synthesis of a new protocol chitosan carrier, maintaining all the characteristics and properties inherent to chitosan as initial raw material, being confirmed by the physico–chemical analysis and analysis of the parameters: favorable topography by cell spreading (SEM, semi-quantitative analysis), identification of functionally chemical groups (FTIR and Raman), and degree of crystallinity and semi-crystalline polymer (XRD). It was possible to predict the controlled degradation of the material by the classical tests of degradation and analysis of the degree of swelling, ID, and loss of mass. The spherical chitosan carrier biomaterial is noncytotoxic from the cytotoxicity assay’s cell death parameter that evaluates mitochondrial activity (MTT assay). Analysis of iron release in the form of iron chloride and adjustments of specific parameters, it was possible to make the interrelationship of experimental data with classic simulations adsorption and release on the surface of iron chloride obtaining a response between the experimental part delineated and interrelated with the simulation models used from the Fortran and Meduza software and with that try to predict the release response from an unpublished trial and simulation leading to reagent savings, time, and cost of spherical chitosan no reticulated. Experimental predictability helps plan other similar assays by modifying fixed model parameters and thereby obtaining a standard-type profile for these types of assays, including spherical chitosan scaffold.

Acknowledgments

The author thanks FAPERJ by Pós Doc senior financing Process number: 203.409/2023 - SEl-260003/016585/2023 and CAPES and CNPq for the financial support and the Metallurgical and Materials Engineering Programs at UFF (Volta Redonda) and COPPE\UFRJ for the support and analysis of the characterization. The authors declare no conflict of interest.

Author Contributions

Ingrid Russoni de Lima - Insight of themme the paper and design, elaboration and preparation of the synthesis. Selection, effective participation and forwarding the all samples for preparing to the physical-chemical characterizations in all analyses used in this article, performed all the analysis of SEM, FTIR and cytotoxicity and degradation test and helped and participated actively in all analyses of the article. Assessment with the all synthesis experiments in the paper, wrote and drafting the outline of the entire article, as well as selected and insertion of the main bibliographic references. Márcio Teodoro Fernandes-- contributed with articles, references, and design of the degradation modeling essay. Bonifácio Oliveira Fialho- contributed with chitosan spheres degradation tests, FTIR analysis, and TGA analysis. Charle Correia da Silva: contributed in the experiments conducting the synthesis. Leonardo Martins da Silva- contributed with iron simulation analysis. Cristiane Xavier Resende- performed performed tests to obtain chitosan from the crab shell, defined the commercial brand of the chitosan used, and helped in the design and elaboration of the experimental design of the article, in addition, contributed with some reagents used in the experiments. Gláucio Soares da Fonseca - he provided practical assistance and support during all article process, as well as the SEM laboratory in the analysis of metallization and secondary electrons in the SEM and financial support, and corrected the entire outline of the initial and final article. Renata Antoum Simão- perfomed the interpretation and assessment Raman and, in addition helped in advising on several points in the progress of the article. José Adilson de Castro- laboratory supervisor. Contributed with the experimental structure available in order to carry out all the steps and synthesis routes, as well as checking the steps. Assessment with the synthesis experiments and financial support. Marcos Flavio de Campos supervision, final writing, editing.

Funding

FAPERJ, CAPES, CNPQ.

Acknowledgments

The author thanks FAPERJ by Pós Doc senior financing Process number: 203.409/2023 - 832 SEl-260003/016585/2023 and CAPES and CNPq for the financial support and the 833 Metallurgical and Materials Engineering Programs at UFF (Volta Redonda) and 834 COPPE\UFRJ for the support and analysis of the characterization. The authors declare 835 no conflict of interest.

Conflicts of Interest

Declare conflicts of interest or state “The authors declare no conflicts of interest.

References

  1. Oryan, SS.; Sahvie, S. Effectiveness of chitosan scaffold in skin, bone and cartilage healing. International Journal of Biological Macromolecules 2017, 06, 1003–1011. [Google Scholar] [CrossRef]
  2. Lima, PC.; Gazoni, I. ; Carvalho, AMG. ; Bresolin, D.; Cavalheiro, D.; Oliveira, D.; Rigo, E. β-galactosidase from Kluyveromyces lactis in genipin-activated chitosan: An investigation on immobilization, stability, and application in diluted UHT milk. 2021, 1, 129050. [Google Scholar] [CrossRef]
  3. Levengood, SL.; Zhang, M. Chitosan-based scaffolds for bone tissue engineering. Jornal of Material Chemistry B, 2014, 2, 3161–3184. [Google Scholar] [CrossRef]
  4. Lima, PA.; Resende, CX.; Soares, GG.; Anselme, K.; Almeida, LE. ; Preparation, characterization and biological test of 3D-scaffolds based on chitosan fibroin and hydroxyapatite for bone tissue engineering. Materials Science & Engineering, Biomimetic Materials. Sensors and Systems, 2013, 33, 3389–3395. [Google Scholar] [CrossRef]
  5. Aswathy, Fw. Chitosan stabilized platinum nanoparticles: Synthesis, characterization and cytotoxic impacts on human breast cancer cells. Materials chemistry and Physics. [CrossRef]
  6. Onichimowski, D.; Bedzkowska, A.; Ziólkowski, H.; Jaroszewski, J.; Borys, M.; Czuczwar, M.; Wiczling, P. Population pharmacokinetics off standard-dose meropenem in critically ill patients on continuous renal replacement therapy: a prospective observational trial. Pharmacological reports.
  7. Pennesi, C.; Totti, C.; Beolchini, F. Removal of Vanadium (III) and Molybdenum (V) from wastewater using possidônia oceânica (tracheophyta) biomass. Plos One 2013, 25. [Google Scholar] [CrossRef]
  8. Duque, MA.; Tiozon, RN.; Espana, N. Chitosan from Portunus Pelagicus in the synthesis of reduced gold nanoparticle as potential carrier for the delivery of erythropoietin. Ed. bioRxiv 2018. [CrossRef]
  9. Varun, TK.; Senani, S.; Jayapal, N.; Chikkerur, J.; Roy, S.; Tekulapally, VB. Extraction of chitosan and its oligomers from shrimp shell waste, their characterization and antimicrobial effect. Veterinary World 2017, 10, 170–175 1014202/vetworld2017170. [Google Scholar] [CrossRef]
  10. Zokhrab, ST. The bonding nature of the chemical interaction between trypsin and chitosan based carriers in immobilization process depends n entrapped method: A review. International Journal of Biological Macromolecules 2021, 183, 1676–1696. [Google Scholar] [CrossRef]
  11. Aranaz, I.; Acosta, N.; Civera, C.; Elorza, B.; Mingo, J. et. al. Cosmetics and Cosmeceutical Applications of Chitin, Chitosan and their derivatives. Polymers 2018, 10, 213. [Google Scholar] [CrossRef]
  12. Guilherme, CC.; Coiffard, L. ; Applications for marine resources in cosmetics. Cosmetics, 2017, 4, 35. [Google Scholar] [CrossRef]
  13. Uppala, L. A. Review on active ingredients from marine sources used in cosmetics. SOJ. Pharmacy & Pharmaceutical Sciences 2015, 2. [Google Scholar]
  14. Ghaffarian, R.; Herrero, EP.; Hyuntaek, D. Chitosan-alginate microcapsules provide gastric protection and intestinal release of icam-1targeting nanocarriers, enabling gi targeting in vivo. Advanced Function Material, 2016, 26, 3382–3393 101002/adfm201600084. [Google Scholar] [CrossRef]
  15. Lenka, S.; Marián, Z.; Maria, C. In vitro liberation of indomethacin from chitosan gels containing microemulsion in different dissolution mediums. Journal of Pharmaceutical Sciences, Pharmaceutics, Drug and Pharmaceutical technology,.
  16. Zhi-Xiang, T.; Wen-Da, O. ; The role of chitosan in promoting the catalytic activity of bismuth ferrite as peroxymonosulfate activator for antibiotics removal, International Journal of Biological Macromolecules, 2024, 277, 3.
  17. Higashi, V. ; Theodoro, JDP.; Pereira, ER.; Theodoro, OS. Congresso Técnico Científico da Engenharia e da Agronomia CONTECC. Uso de coagulantes químico (cloreto) e orgânico no tratamento de águas provenientes de sistema lêntico, Foz do Iguaçu - PR 29 de agosto a 1 de setembro, 2016.
  18. Bernkop-Schnürch, A.; Dünnhaupt, S. Chitosan-based drug delivery systems. European Journal of Pharmaceutics and Biopharmaceutics. [CrossRef]
  19. Bezerra, A; Silva, V. Sistemas de liberação controlada: Mecanismos e aplicações. Revista Saúde e Meio Ambiente – RESMA, Três Lagoas, 2016, 3, 1–12, ISSN: 2447. [Google Scholar]
  20. Lisboa, CD.; Silva, LD.; Matos, GC. Investigação da administração de medicamentos por cateteres em terapia intensiva, 2014, 23, 573-80. [CrossRef]
  21. El Mehdi; Mouad, E. ; Badreddine, R. Review of current trends in chitosan based controlled and slow-release fertilizer: From green chemistry to circular economy. International Journal of Biological Macromolecules, 2024. [CrossRef]
  22. Nygaard, JN.; Strand, SP.; Varum, KM. Review chitosan: Gels and interfacial properties. Polymers. [CrossRef]
  23. Luo, Y.; Wang, Q. ; Recent development of chitosan-based polyelectrolyte complexes with natural polysaccharides for drug delivery. International Journal of Biological Macromolecules. [CrossRef]
  24. Sæther, HV.; Holme, HK.; Maurstad, G.; Smidsrød, O.; Stokke, BT. Polyelectrolyte complex formation using alginate and chitosan. Carbohydrate Polymers. [CrossRef]
  25. Filho, MSG.; Modelagem da liberação controlada de fármacos através de modelos em rede, Faculdade UnB Planaltina Licenciatura em Ciências Naturais da Universidade de Brasília-UnB, Dezembro-2013.
  26. Anirudhan, TS.; Parvathy, J. Design of biopolymeric architecture with thiolated chitosan-poly (lactic acid) blend\methionine modified clay for the controlled release of amoxicillin. Polymer-Plastics Technology and Engineering 2014, 53, 1339–1343. [Google Scholar] [CrossRef]
  27. Chen, CY.; Chien, Y, Chung. Antibacterial effect of water-soluble chitosan on representative dental pathogens Streptococcus mutans and Lactobacilli brevis. Journal Applied oral science 2012, 20, 620–627 PMID:23329243, PMCID:PMC3881855. [Google Scholar] [CrossRef] [PubMed] [PubMed Central]
  28. Ferreira, JGJ. ; Flores, VG.; Marco, MR., Fraga, BB., Zorzo, RR., Morais, PF., Eds.; Morisso, FDP, Diazepam nanocasules as na alternative for sleep induction: Development study and toxicity assessment. Food and Chemical Toxicology, 2024, V.192, 114962. [Google Scholar] [CrossRef]
  29. Ferraz, LRM. Desenvolvimento e avaliação da liberação in vitro de drug delivery system em pH-dependente à base de benznidazol e ZIF-8 visando a obtenção de uma terapia alternativa. Tese de Doutorado do programa de Pós-Graduação em Ciências farmacêuticas da Universidade Federal de Pernambuco, 2017.
  30. Neto, BPC. Micropartículas com quitosana estruturadas com aerosil: Estabilidade, adsorção, encapsulação e liberação de substâncias ativas. Tese de Doutorado apresentado ao programa de Engenharia Química da Universidade federal do rio Grande do Norte, 2014.
  31. Benvenutti, T. Avaliação da eletrodiálise no tratamento de efluentes de processos de eletrodeposição de níquel., Dissertação de mestrado em Engenharia do Programa de Pós-Graduação em engenharia de Minas, Metalúrgica e de Materiais, PPGE3M, 2012.
  32. Lima, IR.; Costa, AM.; Bastos, IN.; Granjeiro, JM.; Soares, GA. Development and characterization of 5% mol Zn bioceramic in granular form, Material Research 2006, 9, 399-103. [CrossRef]
  33. Lima, PA.; Resende, CX.; Soares, GD.; Anselme, K.; Almeida, LE. Preparation, characterization and biological test of 3D-scaffolds based on chitosan, fibroin and hydroxyapatite for bone tissue engineering. Materials Science and Engineering 2013, 33, 3389–95. [Google Scholar] [CrossRef]
  34. Bezerra, A; Silva, V; Sistemas de liberação controlada: Mecanismos e aplicações. Revista Saúde e Meio Ambiente – RESMA, Três Lagoas. 2016, 3, 1–12 ISSN: 2447.
  35. Lima, IR.; Alves, GG.; Campaneli, AP.; Gasparoto, TH. ; Junior, ESR.; Sena, LA. Understanding the impact of divalent cation substitution on hydroxyapatite: An in vitro multiparametric study on biocompatibility*. Journal of Biomedical Materials Research Part A. [CrossRef]
  36. Crank. The Mathematics of diffusion by J. Crank Brunel University Uxbridge second edition, Clarendon press Oxford. 1975, University Press, Ely House, London. ISBN 0 19 853344 6.
  37. Tanaka, H.; Matsumura, M.; Veliky, IA. Diffusion characteristics of substrates in Ca-alginate gel beads. Biotechnology and Bioengineeering. [CrossRef]
  38. Nunes Nunes, AR. Liberação controlada de curcumina ancorada em sílica hexagonal mesoporosa. Dissertação apresentada ao Instituto de Química da Universidade de Brasília como exigência parcial para obtenção do título de Mestre em Química do Instituto de Química da Universidade de Brasília -UnB, 2013.
  39. Silva*, MC.; Fideles, TB.; Fook, MVL. Esferas de quitosana e quitosana/curcumina pelo método de gelificação ionotrópica: influência da incorporação do fármaco, Revista de acesso livre no site www.ufcg.edu.br. Revista Eletrônica de Materiais e Processos 2, 1809; -28. [Google Scholar]
  40. Siepmann, J.; Siepmann, F. Mathematical Modeling of drug delivery. International Journal of Pharmaceutics.
  41. Lopes, CM.; Lobo, JMS. ; Costa, P. Modified release of drug delivery systems: hydrophilic polymers. Revista Brasileira de Ciências farmacêuticas; 2005, 41, 143–154. [Google Scholar] [CrossRef]
  42. Hopfenberg, HB. Controlled release from erodible slabs, cylinders, and spheres, Department of Chemical Engineering, North Carolina State University. Controlled Release Polymeric Formulations, Copyright. American Chemical Society, 2: 3. [CrossRef]
  43. Aparicio, G.; Garrido, Q.; Garrido, L. Diffusion of small molecules in a chitosan\water gel determined by proton localized NMR spectroscopy. Journal Colloid Interface Science. [CrossRef]
  44. Valadão, ICR. ; Silva, AJ.; Castro, JA Ritter, E. Simulação computacional da difusão molecular de poluentes líquidos de aterros em solos organo argilos- Aterro Metropolitano de Gramacho. Revista estudos tecnológicos 2006, 2, 55–64, ISSN 1808. [Google Scholar]
  45. Chandy, DL. ; Mooradian, Rao, G. H. R. Journal of Applied Polymer Science, 2143. [Google Scholar]
  46. Lima, HA.; Lia, F, MV. ; Preparation and Characterization of Chitosan-Insulin-Tripolyphosphate Membrane for Controlled Drug Release: Effect of Cross Linking Agent. JBNB 2014, 5, 211–219. [Google Scholar] [CrossRef]
  47. Da Silva, ARPS. ; Macedo, T.; Coletta, D. J. Feldman, S., Pereira, M. M., Synthesis, characterization and cytotoxicity of Chitosan/Polyvinyl Alcohol/Bioactive Glass hybrid scaffolds obtained by lyophilization. Revista Matéria 2016, 21, 964–973 ISSN 1517. [Google Scholar] [CrossRef]
  48. Tavaria, FK.; Costa, EM.; Pina-Vaz, I.; Carvalho, M.F.; Pintad, M.M. 2013; 29. [CrossRef]
  49. Demadis, KD.; Pachis, K.; Ketsetzi, A. Stathoulopoulou. Advances in Colloid and Interface Science. [CrossRef]
  50. Negrea, P.; Caunib, A.; Sarac, I.; Butnariu, M. The study of infrared spectrum of chitin and chitosan extract as potential sources of biomass. Digest Journal of Nanomaterials and biostructures 2015, 10, 1129. [Google Scholar]
  51. Resende, CX, Desenvolvimento a base de dupla camada de Quitosana para a reconstrução tecidual. Tese de Doutorado COPPE-Universidade Federal do Rio de Janeiro. Rio de Janeiro. Brasil, 2010.
  52. Puente, C.; Sánchez-Domínguez, M. ; Brosseau, C L.; López, I. Silver-chitosan and gold-chitosan substrates for surface-enhanced Raman Spectroscopy (SERS): Effect of nanoparticle morphology on SERS performance. Materials Chemistry and Physics 2021, 260: 124107, 2021. [Google Scholar] [CrossRef]
  53. Zajac, A.; Hanuza, J.; Wandas, M.; Dyminska, L. Determination of N-acetylation degree in chitosan using Raman spectroscopy. Spectrochimica Acta Part A: Molecular and Biomolecular Spectroscopy. [CrossRef]
  54. Castrejón-Flores, J L.; Reyna-Luna, J.; Flores-Martinez, Y M.; García-Ventura, M I.; Zamudio-Medina, A.; Franco-Pérez, M. Characterizing the thermal degradation mechanism of two bisphosphoramidates by TGA, DSC, mass spectrometry and first-principle theoretical protocols. Journal of Molecular Structure, 1287.
  55. Luyen, DV, Huong, DM. Chitin and derivatives. In: J.C. Salamone (Ed.), Polymeric Materials Encyclopedia. 1996, 2:1208-1217.
  56. Cruz, J B. ; Catão, CDS. Synthesis and characterization of chitosan scaffolds with antineoplastic agent. Matéria 2016, 21, 129–140 ISSN 1517. [Google Scholar] [CrossRef]
  57. Kumar, S.; Kumari, M.; Mallick, A.; Swain, BS.; Sobral, AJFN. ; Dutta, P.K. Preparation and characterization of microporousnanocomposites for biomedical applications. K. Preparation and characterization of microporousnanocomposites for biomedical applications. Asian Chitian Journal 2015, 26–28. [Google Scholar]
  58. Souza, NLGD. ; Salles, TF.; Brandão, HM.; Edwards, HGM.; Oliveira, LFC. Synthesis, Vibration spectroscopic and thermal properties of oxocarbon cross-linked chitosan. Journal of the Brazilian Chemical Society 2015, 26, 1247–1256. [Google Scholar] [CrossRef]
  59. Jameela, SR.; Misra, A.; Javakrishnan, A. Cross-linked chitosan microspheres as carriers for prolonged delivery of macromolecular drugs. Journal of Biomaterials Science Polymer Edition. [CrossRef]
  60. Silva. Santa catarina. 2015.
  61. Miculescu, F.; Maidaniuc, A.; Miculescu, M.; Batalu, ND.; Ciocoiu, C.; Voicu, SI.; Stan, GE.; Thakur, VK. Synthesis and characterization of jellified composites from bovine bone-derived hydroxyapatite and starch as precursors for robocasting. ACS Omega 2018, 3, 1338–1349. [Google Scholar] [CrossRef]
  62. Santana, IL. ; Gonçalves, L, M. ; Ribeiro, JJS, Filho.; JRM., Júnior, AAC. Thermal behavior of direct resin composites: glass transition temperature and initial degradation analyses, Revista Odonto Ciência. 2011, 26, 50–55 http://wwwscielobr/pdf/roc/v26n1/a12v26n1pdf. [Google Scholar]
  63. Thürmer, MB.; Diehl, CE.; Brum, FJB. ; Santos, LA. Preparation and characterization of hydrogels with potential for use as biomaterials. Materials Research, 2014, 17, 109–113. [Google Scholar] [CrossRef]
  64. Elbanna, AE.; Carlson, J M. . Dynamics of polymer molecules with sacrificial bond and hidden length systems: Towards a physically-based mesoscopic constitutive law. Mechanics and Physics of Soft Materials. 2013, 8, 56118. [Google Scholar] [CrossRef] [PubMed]
  65. Yuhang, C. ; Zhou, S, Li, Q. Mathematical modeling of degradation for bulk-erosive polymers: Applications in tissue engineering scaffolds and drug delivery systems. Acta Biomaterialia. 1140. [Google Scholar] [CrossRef]
  66. Gualandi, C.; Soccio, M.; Saino, E.; Visai, L. Easily synthesized novel biodegradable copolyesters with adjustable properties for biomedical applications. Soft Matter V. 2012, 8, 5466–5476. [Google Scholar] [CrossRef]
  67. Li, G.; Huang, J.; Chen, T.; Wang, X.; Zhang, H.; Chen, Q. Insight into the interaction between chitosan and bovine serum albumin. Carbohydrate Polymers. [CrossRef]
  68. Schütz, CA.; Juillerat-Jeanneret, J.; Käuper, P.; Wandrey, C. Cell Response to the exposure to chitosan–TPP//alginate nanogels. Biomacromolecules. 2011, 12, 4153–4161. [Google Scholar] [CrossRef] [PubMed]
  69. Chang, Y.; Chang, Y.; Liu, RH.; Chen, C.; Lee, I.; Yang, N. Resveratrol can be stable in a medium containing fetal bovine serum with pyruvate but shortens the lifespan of human fibroblastic Hs68 cells. Oxidative Medicine and Cellular Longevity, 2371. [Google Scholar] [CrossRef]
  70. Júnior, ADC.; Vieira, FP.; Melo, VJ.; Lopes, MTP.; Silveira, JN.; Ramaldes, GA.; Garnier-Suillerot, A.; Pereira-Maia, EC.; Oliveira, MC. Preparation and cytotoxicity of cisplatin-containing liposomes. Brazilian Journal of Medical and Biological Research. 2007, 40, 1149–1157. [Google Scholar] [CrossRef]
  71. Lima, IR.; Alves, GG.; Soriano, CA.; Campaneli, AP. ; Gasparoto, T H. Understanding the impact of divalent cation substitution on hydroxyapatite: an in vitro multiparametric study on biocompatibility. Journal Biomedical Materials Research. 3: 98A, 2011. [Google Scholar] [CrossRef]
  72. Pessoa, P.; Neto, L.; Almeida, S.; Farias, F.; Vieira, L. R.; Medeiros, L.; Boligon, A. Polyphenol composition, antioxidant activity and cytotoxicity of seeds from two underexploited wild licania species: L. rigida and L. tomentosa. Molecules, 2: 21, 1755. [Google Scholar] [CrossRef]
  73. Faria, DM.; Dourado Júnior, SM.; Nascimento, JPLD. ; Nunes, EDS.; Marques, RP.; Rossino, LS.; and Moreto, JA.; Development and evaluation of a controlled release system of TBH herbicide using alginate microparticles. Materials Research. 2017, 20, 225–235. [Google Scholar] [CrossRef]
  74. Douglas, KL.; Tabrizian, M. Effect of experimental parameters on the formation of alginate-chitosan nanoparticles and evaluation of their potential application as DNA carrier. Journal of Biomaterials Science. Polymer Edition. 2005, 16(1), 43–56. [Google Scholar] [CrossRef] [PubMed]
  75. Torres, MA.; Beppu, MM.; Santana, CC. Characterization of chemically modified chitosan microspheres as adsorbents using standard Proteins (bovine serum albumin and lysozyme). Brazilian Journal of Chemical Engineering. 2007, 24, . 325–336. [Google Scholar] [CrossRef]
  76. Wan Ngah, WS. ; Endud, CS; Mayanar, R. Reactive and Functional Polymers, 1: 50.
  77. Dias, FS.; Queiroz, DC.; Nascimento, RF.; Lima, M. B. Um sistema simples para preparação de microesferas de quitosana. Quím. Nova. 2008, 31, 160–163. [Google Scholar] [CrossRef]
  78. Schnürch, AB,; Dünnhaupt, SS. Chitosan-based drug delivery systems. European Journal of Pharmaceutics and Biopharmacetics. 2012, 81, 463–469. [Google Scholar] [CrossRef]
  79. Pereira, FAR. Quitosana e seus compósitos como adsorventes e sistemas de liberação controlada de fármacos.[tese]. Universidade Federal da Paraíba em Química Inorgânica.2014.
  80. Tavares, JK. Modelagem da liberação controlada de princípios ativos (betacaroteno e lidocaína) de microcápsulas. Tese submetida ao Programa de Pós-Graduação em Engenharia Química da Universidade Federal de Santa Catarina, 2015.
  81. Maciel, VBV. Complexos dos polieletrólitos quitosana e pectina para obtenção de sistemas carreadores de compostos bioativos. Tese apresentada à Faculdade de Engenharia Química da Universidade Estadual de Campinas como parte dos requisitos exigidos para obtenção do título de Doutor em Engenharia Química da Universidade Estadual de Campinas, 2015.
  82. Alj, A,; Ahmed, S. A review on chitosan and its nanocomposites in drug delivery. International Journal of Biological macromolecules. [CrossRef]
  83. Lopes, CM. ; Lobo, JMS.; Costa, P. Formas farmacêuticas de liberação modificada: polímeros hidrofílicos.
  84. Abdelakder, H.; Siti, A.; Abdullah, N. Chitosan potential aspects for drug delivery and pharmaceutical applications using microencapsulation techniques. Applied Engineering and Sciences. 2017, 14–15. [Google Scholar]
  85. Yang, Y.; Wang, S.; Wang, Y.; Wang, Q.; Chen, M. Advances in self-assembled chitosan nanomaterials for drug delivery. Biotechnology Advances. 2014, 32, 1301–1316. [Google Scholar] [CrossRef]
  86. Dobrovolskaya, IP.; Yudin, VE.; Popryadukhin, PV.; Morganti, P. Effect of chitin nanofibrils on electrospinning of chitosan-based composite nanofibers. Carbohydrate Polymers, 2: 194. [CrossRef]
  87. Leite, MV. Microcápsulas de alginato-quitosana contendo nanopartículas magnéticas para liberação controlada de progesterona, Melina Vasconcelos Leite. Universidade Estadual do Norte Fluminense Darcy Ribeiro, UENF, Campos dos Goytacazes, 2014.
  88. Morais, SJS. ; Devilla, IA.; Ferreira, DA.; Teixeira, IR. Modelagem matemática das curvas de secagem e coeficiente de difusão de grãos de feijão-caupi (Vignaunguiculata (L.) walp. Mathematical modeling of the drying curves and diffusion coefficient of cowpea grains (Vigna unguiculata (L.) Walp. Revista Ciência Agronômica. 2013, 44, 455–463, ISSN 1806. [Google Scholar]
  89. Kashani-Nejad, MA.; Mortazavi, A.; Safekordi, AG. Thin-layer drying characteristics and modeling of pistachio nuts. Journal of Food Engineering.
  90. Üzüm, C.; Shahwan, T.; Eroglu, AE.; Lieberwirth, I.; Scott, TB.; Hallan, KR. Application of zero-valent iron nanoparticles for the removal of aqueous Co2+ ions under various experimental conditions. Chemical Engineering Journal. 2008, 144, 213–220. [Google Scholar] [CrossRef]
  91. Silva. LA. Síntese e caracterização de nanopartículas de hematita e de ferro zerovalente sintetizadas a partir de cloreto férrico, [tese], Doutorado do Programa de Engenharia Química da Universidade de Santa Catarina, 2015.
  92. Fu, F.; Dinysiou, DD.; Liu, H. The use of zero-valent iron for groundwater remediation and wastewater treatment: A review. Journal of Hazardous Materials, 1: 267. [CrossRef]
  93. Bird, RB.; Stewart, WE.; Lightfoot, EN. Transport Phenomena. John Wiley & Sons, 2007.
  94. Crank, J. The Mathematics of Diffusion. University Brunel Uxbridge Clarendon Press, 1975. [Google Scholar]
  95. Siepmann, J.; Siepmann, F. Modeling of diffusion controlled drug delivery. Journal of Controlled Release. 2012, 161(2), 351–362. [Google Scholar] [CrossRef] [PubMed]
  96. Bryszewska, M. A.; Cobos, L.T.; Gallego, E.; Villalba, M.; Rivera, D. ; Laure. ; D, Saa.; D. L. T. Gianotti, A., In vitro bioaccessibility and bioavailability of iron from breads fortified with microencapsulated iron. LWT-Food Science and Technology. 2019, 99, 431–437. [Google Scholar]
  97. Cian, RE,; Proano, JL. ; Salgado, PR.; Mauri, NA.; Drago, SR. High iron bioaccessibility from co-microencapsulated iron\ascorbic acid using chelating polypeptides from brewers spent grain protein as wall material. LWT-Food Science and Technology, 2021, 50, 72–78. [Google Scholar]
  98. Moreira, FR, Moreira, JC.
  99. Sharma, VM.; Chopra, R.; Ghosh, I.; Ganesan, K. Quantitative target display: a method to screen yeast mutants conferring quantitative phenotypes by ‘mutant DNA fingerprints’. Nucleic Acids Research. 2001, 29, e86. [Google Scholar] [CrossRef]
  100. Silva, GC. Mecanismo de acumulação de ferro e arsênio em biomassa vegetal fibrosa, Dissertação de Mestrado apresentado à Universidade Federal de Minas como dissertação de mestrado “Mecanismo de acumulação de ferro e arsênio em biomassa vegetal fibrosa, 2008.
  101. Altaner, B. arXiv:1410.3983v1 [cond-mat.stat-mech] 15 October, 2014.
  102. Owens, GJ.; Singh, RK.; Foroutan, F.; Alqaysi, M. Sol-gelbased materials for biomedical applications. Progress in Materials Science. 2016, 77, 1–79. [Google Scholar] [CrossRef]
  103. Shubham, K.; Anukiruthika, T.; Sayantani, D.; Kashyap, AV.; Moses, J.A. Iron deficiency anemia: A comprehensive review on iron absorption, bioavailability, and emerging food fortification approaches. Trendes in Food Science and Technology 2020, 99, 58–75. [Google Scholar] [CrossRef]
  104. Grotto, H ZW. Metabolismo do ferro: uma revisão sobre os principais mecanismos envolvidos em sua homeostase. Revista Brasileira de Hematologia e Hemoterapia, 2008, 30, 390–397.
  105. Zhang, D.; Wan, H.; Zhao, R.; Zhang, Yu. Eudragit S100 coated iron oxide-chiotsan nanocomposites for colon targeting of 5-aminosalicylic acid ameliorate ulcerative colitis by improving intestinal barrier function and inhibiting NLRP3 inflammasome. International Immunopharmacology. 2024, V. 139, 112661. [Google Scholar] [CrossRef]
  106. GrottoGrotto, HZW. Fisiologia e metabolismo do ferro. Revista Brasileira de Hematologia e Hemoterapia. 2010, 32:8-17. 2010, 32, 8–17.
  107. Rathor, G.; Chopra, N.; Adhikari, T. International Journal of Chemical Studies. 2017, 5, 282-285.
Figure 1. Design protocol of new spherical chitosan without reticulate agents.
Preprints 118274 g001
Figure 2. Experimental design of the analytical part before modeling, authors.
Preprints 118274 g002
Figure 3. Imagens scanning electron microscopy (SEM) of chitosan spheres obtained by freeze-drying. (a) Chitosan sphere (left), (b) detail of Figure 2(a), showing the presence of concavity, contours, and irregularities on the surface that represent concavity mesopore. On the sequence of images from the left, their photo enhancements of 5000×(b1), 1500×(b2), 1000x(b3)and 500×(b4).
Preprints 118274 g003
Figure 4. EDS obtained from chitosan beads (EDS).
Preprints 118274 g004
Figure 5. FTIR spectra: Spectra obtained by Fourier transform spectroscopy (FTIR) of freeze-dried and dried spherical samples without adding any additive (control). First low-up spectrum (lyophilized beads without additives), medium spectrum, cross-linked, and top–top spectrum (unprocessed) chitosan before processing and selecting the best protocol defined.
Preprints 118274 g005
Figure 6. Diffractogram of spheres obtained by the coagulation method and freeze-dried.
Preprints 118274 g006
Figure 7. Raman spectroscopy of the chitosan beads after processing and lyophilization.
Preprints 118274 g007
Figure 8. a. Thermogravimetric analysis by TGA (control). Figure 8.b. Thermogravimetric analysis of the scaffold by TGA after 21 days of degradation test in SBF (Blood Plasma Simulator).
Preprints 118274 g008
Figure 9. Degradation Test in SBF: Blue barr\Column graph showing the Degree of Intumescence (GI) for the chitosan bead degradation assays in plasma simulant solution (SBF). Red bar\ Column graph showing the degradation index (DI) for the chitosan spheres degradation assays in plasma simulant solution (SBF). Yellow bar\ Representing the mass loss in the assay of degradation of chitosan beads in blood plasma simulating solution over time in days.
Preprints 118274 g009
Figure 10. Column plot depicting the MTT cytotoxicity assay for lyophilized and non-crosslinked beads. The percentages represent the indirect contact test of the exposed granules in 24 h of DMEM (pure extract (100%) and the concentration of 25% in comparison with the control group (0%), demonstrating that for both conditions, there was no cytotoxicity. Error bars represent 95% CI.
Preprints 118274 g010
Figure 11. Scatter model of the solute diffusion model of the sphere for a limited volume solution with theoretical and experimental data of the CL/CLE relation as a function of time up to 72 h.
Preprints 118274 g011
Figure 12. Graph of the diffusion model of the solute of the sphere for limited volume solution with theoretical data and experimental of the CL/CLE ratio in function of the time until 4 h.
Preprints 118274 g012
Figure 13. Modeling of ionic speciation of Fe3 + and Fe2 + ions (Medusa software).
Preprints 118274 g013
Figure 14. Fe arrangement in the formation of iron chloride in the fraction of Fe2+ and Fe3+ under different pH conditions (software Medusa).
Preprints 118274 g014
Table 1. Terms (qn) of equation 4 (Eq.4) depend on values of the ratio between solution volume and total ball volume (α ) [44,94].
α q1 q2 q3 q4 q5 q6
3.1416 6.2832 9.4248 12.5664 15.7080 18.8496
9.0000 3.2410 6,3353 9.4599 12.5928 15.7292 18.8671
4.0000 3.3485 6.3979 9.5029 12.6254 15.7554 18.8891
2.3333 3.4650 6.4736 9.5567 12.6668 15.7888 18.9172
1.5000 3.5909 6.5665 9.6255 12.7205 15.8326 18.9541
1.0000 3.7264 6.6814 9.7156 12.7928 15.8924 19.0048
Table 2. Data entry of the theoretical model of the concentration variation in the solution as a function of time.
*Description Symbol Value Unit
Scaffold radius a 0.1 cm
Volume of solution V 10 cm3
Number of scaffold n 5 ---
Tests time t 130 hours
Infinite concentration in solution CLE CLE 1 Mol
Concentration in time solution CL 0.79644876 Mol
The starting point for applying the algorithm a 0 ---
The Final point for the application of the algorithm b 1 ---
Sphere radius a 0.1 cm
Volume of solution V 10 cm3
Number of spheres n 5 ---
Tests time t 130 hours
Infinite concentration in solution CLE CLE 1 Mol
Concentration in time solution CL 0.79644876 Mol
Starting point for applying the algorithm a 0 ---
Final point for application of algorithm b 1 ---
* Greek symbols: α (alpha)\ ∂ (partial derivative)\ π (pi).
Table 3. Input of the theoretical model of the concentration variation in the solution as a function of time.
Description Symbol Value Unity
Ray Sphere a 0.1 cm
Solution Volume V 4 cm3
Number of Spheres n 12 ---
Table 4. Data entry of the theoretical model of variation of concentration in the solution as a function of time.
Time [h] Concentration in the LiquidCL[mol] Concentration in BalanceCLE [mol] CL/CLE
1 0.04912 0.10000 0.4912
2 0.06843 0.10000 0.6843
3 0.07204 0.10000 0.7204
4 0.08045 0.10000 0.8045
24 0.05987 0.10000 0.5987
48 0.04421 0.10000 0.4421
72 0.04211 0.10000 0.4211
Disclaimer/Publisher’s Note: The statements, opinions and data contained in all publications are solely those of the individual author(s) and contributor(s) and not of MDPI and/or the editor(s). MDPI and/or the editor(s) disclaim responsibility for any injury to people or property resulting from any ideas, methods, instructions or products referred to in the content.
Copyright: This open access article is published under a Creative Commons CC BY 4.0 license, which permit the free download, distribution, and reuse, provided that the author and preprint are cited in any reuse.
Prerpints.org logo

Preprints.org is a free preprint server supported by MDPI in Basel, Switzerland.

Subscribe

© 2024 MDPI (Basel, Switzerland) unless otherwise stated