Preprint
Article

Effect of Surface Roughness on the Electrochemical Behavior and Corrosion Resistance of TiTaNbZrAg Alloy with Different Amount of Tantalum in Bulk Composition

Altmetrics

Downloads

61

Views

30

Comments

0

A peer-reviewed article of this preprint also exists.

Submitted:

16 September 2024

Posted:

18 September 2024

You are already at the latest version

Alerts
Abstract
The corrosion behavior of the TiTaNbZrAg alloys with different amounts of Tantalum (0 %, 10 % and 20%) and with distinct surface topography (smooth and rough) was investigated in phosphate buffer solution (PBS) for long-time immersion (1000 hours). The corrosion resistance was studied by Open circuit potential (OCP), potentiodynamic polarization (PP) and electrochemical impedance spectroscopy (EIS). From the potentiodynamic investigations, it was observed that all types of samples show good corrosion resistance (i.e. Rcorr < 10µm y-1) and may be used successfully for medical applications. However, the samples with smooth surface and with a certain amount of Ta (10 % and 20%) exhibit the best corrosion performance (Rcorr < 1µm y-1). As regard the samples with rough surface, the results evidenced that they show lower corrosion resistance (1< Rcorr < 3 µm y-1), suggesting that the Ta presence not necessary brings about a very good corrosion protection. Actually, the synergetic effect of both the presence of Ta and surface roughness plays an important role in corrosion behavior. Based on literature reports, we assume that the good corrosion resistance results from the good stability of the film, formed mainly from Ta2O5 and TiO2, formed on the alloy surface during immersion in PBS.
Keywords: 
Subject: Chemistry and Materials Science  -   Biomaterials

1. Introduction

Titanium based alloys are frequently used in the medical field due to their excellent corrosion performance, high biocompatibility, long-term functionality and relatively low Young’s modulus [1-3].
In the last years, much effort was put into obtaining new titanium alloys for biomaterials applications with a Young’s modulus closer to the human bone. In this regard, a new group of titanium alloys that contents nontoxic β -phase stabilizers (Ta, Nb, Zr) has been developed [4,5]. It is well known that the presence of moderate amount of tantalum (i.e., 10 - 20%) in the titanium-based alloys composition significantly decreases the Young’s modulus up to 60-80 GPa. However, due to the fact that the tantalum has a high melting point (> 3000°C) and great affinity for oxygen, alloys with inhomogeneous structure are formed and consequently their use for medical applications is very limited [6]. In order to solve these issues, two other alloying elements (i.e., Nb and Zr) are added in titanium-based alloys, conferring hence a fine, homogenous microstructure, and a slightly slower of the Young ‘s modulus (below 60 GPa) of the alloy [7, 8].
Another important aspect which should not be disregarded is the biocompatibility of these alloys. A high biocompatibility facilitates the adhesion of the osteoblasts in biofluids and improves the osseointegration process of the implants [9]. Their biocompatibility relay on their structural (e.g., surface roughness, wettability, surface free energy, surface morphology), mechanical (e.g., microhardness) and chemical properties [10]. For instance, the best cellular adhesion [11,12] was noticed on the implant surface which shows moderate hydrophilicity (i.e., about 60 Degree) and a reasonable roughness. In order to obtain reasonable roughnesses of the implant surface several methods of surface treatment (chemical treatment, sandblasting, mechanical grinding) were employed [13,14]. Besides, the protective properties against corrosion processes of these alloys in different biofluids should be taken into account for using them as biomaterials.
In literature was reported a high corrosion performance for titanium- based alloys with different amounts of Ta in composition and with polished surface obtained by different technologies (cast, forging, arc-melting, etc.) [15,16] in several biofluids (e.g., Ringer’s or Hank’s solutions, artificial saliva or phosphate buffer solution (PBS)) for long-term immersion [2,17,18]. In spite of the fact that both the amount of Ta and surface roughness play an important role in corrosion resistance of these alloys, scarce literature data were devoted to an ample study to the influence of both the amount of tantalum in the alloy composition and surface roughness on the corrosion behavior of these titanium- based alloys in different biofluids.
In this view, the corrosion behavior of as-cast TixTa9Nb8Zr2Ag alloys with different amount of Ta (0%, 10% and 20%) and different surface roughness was studied by several electrochemical methods (i.e., Open Circuit Potential (OCP), Potentiodynamic Polarization (PP) and Electrochemical Impedance Spectroscopy (EIS)) for long-period of immersion (i.e., 1000 hours) in PBS at 37°C. The evolution over time of the corrosion parameters (Corrosion potential (Ecor), Corrosion rate (Rcor) and Polarization resistance (Rp)) was analyzed during the immersion period. The influence of chemical composition and surface roughness on the protective properties against corrosion attack of these alloys is en detail discussed. In the present study the PBS was used as simulated biofluid because its pH (7.4) is similar to that one of human blood and nontoxic to living cells [6]. Moreover, as phosphate ions from PBS are easily absorbed on the TiO2 layer formed on the Ti-based alloys which leads to an increase of the film thickness and slowdown of the corrosion process [19], its use for corrosion tests is also suited. The textural characterization of the surface alloys (morphology and roughness) was analyzed before and after immersion in PBS by AFM, and the roughness parameters were estimated for all samples.

2. Materials and Methods

2.1. Materials and Methods

The purpose of this study is to develop three cast titanium base alloys without tantalum and with two different concentrations of tantalum: Ti9Nb8Zr2Ag, Ti20Ta9Nb8Zr2Ag and Ti10Ta9Nb8Zr2Ag. The melting of the materials was carried out in an inert atmosphere of argon in the vacuum arc melting facility model ABD MRF 900 (RAV). Decontamination of the work environment was carried out by creating a vacuum (10-6 bar) provided by the installation with an advanced vacuum pump. The large differences in the melting temperatures of the constituent elements (Ti-1668°C, Nb-2477°C, Zr-1855°C, Ag-960°C, Ta-3017°C) were considered, which required the performance of several nine remelting to obtain a proper homogenization. Ingots with dimensions of d=10 mm and L=140–160 mm were obtained. More details about the design of these alloys were presented in our previous study [20,21]. From as-cast ingots were cut the cylindrical specimens with 10 mm diameter and 10 mm height. The cutting was carried out on an automatic machine with coolant, equipped with a cutting disc (Aka-Cut Ti20) especially for titanium alloys with a hardness of 100-350HV. Three samples were cut for each composition. The grinding and polishing of the samples were carried out on an automatic machine brand METCON Forcipol-forcimat 1V, using a four-step preparation kit brand AKASEL, which includes grinding discs, polishing, and polishing emulsions, that ensures a polish up to 0.2 μm. Each composition had the purpose of obtaining two granulations, namely A=0.25 µm (smooth) and B=6µm (rough). The chemical composition of the obtained alloys is presented in Table 1.

2.2. Textural Characterization

Atomic force microscopy (AFM) measurements were made using the XE-100 microscope from Park Systems. All AFM scans were performed in non-contact mode with NCHR sharp tips from Nanosensors™, with a tip radius of less than 8 nm, 125 μm mean length, 30 μm mean width, ∼42 N/m spring constant and ∼330 kHz resonance frequency. The two-dimensional (2D) AFM images were recorded at two scales, namely (5 μm × 5 μm) and (2 μm × 2 μm), and processed with the Image Processing Program (XEI – v.1.8.0, Park Systems) for display purposes (1st order tilt correction) and roughness evaluation. Enhanced Color™ - AFM images (EC-AFM) are presented based on the change of a pixel position relative to its neighbors. Below the 2D EC-AFM images, arbitrary lines (line-scans collected along the X-scan direction) are displayed for each scanned sample, showing nanometric details of each investigated surface. The root-mean square roughness (Rq) is the standard deviation of the height value in the image and the peak-to-valley parameter (Rpv) represents the height difference between the lowest and the highest points in the surface.

2.3. Surface wettability

The surface wettability of the samples was characterized by contact angle (θ) measurements and subsequent calculation of surface free energy (SFE). The contact angles were collected with Drop Shape Analysis System model DSA1 (FM40 Easy Drop) from KRÜSS GmbH Hamburg, Germany. The samples were put on a plane moveable table and each drop of deionized water with a volume of 3 μL were dispense from a micro-syringe with stainless steel needle (outer diameter = 0.5 mm) at room temperature. Measurements were done in static regime using Young-Laplace method (Sessile Drop Fitting). For each sample, the contact angle was calculated by averaging over 8 measurements on different drops.
Surface free energy of a solid was calculated from the equation of state proposed by Neuman. Starting with the equation of Young:
σ s = σ s l + σ l cos θ
in which the symbol σl is the surface tension of the liquid and σs is attributed to the surface free energy of the solid. The symbol σsl represents the interfacial tension between liquid and solid and θ is the contact angle (angle between σl and σsl). Variable σsl are unknown and Neuman proposed the equation [22]:
σ s l = σ l + σ s 2 σ l σ s e β ( σ l σ s ) 2
The value 0.0001247 for the constant β was determined empirically.
The next step was to insert the equation of Neuman in Young’s equation and the new equation allows the calculation of the surface free energy of the solid with mention that the interactions affecting the interfacial tension (disperse part and polar part of the surface tension) are neglected:
cos θ = 1 + σ s σ l e β ( σ l σ s ) 2

2.4. Electrochemical Characterization

The electrochemical tests were performed in a typical three-electrode cell. The measurements were carried out by means of the Ag/AgCl reference electrode, a platinum (Pt) counter electrode, and the samples as working electrodes using a Gamry Potentiostat/Galvanostat/ZRA model Reference 600 equipped with Echem Analyst™ software. The samples were degreased with ethanol, washed with deionized water, and then dried in air. A PBS solution with a neutral pH of approximately 7.4 at 37°C was used as an electrolyte to simulate the behavior of the materials in a human biological environment. The composition of the PBS solution was: Na2PO4-1.78g/L; KH2PO4 -0.24g/L; NaCl-8g/L; KCl-0.2g/L. All reagents used in this study were analytical grade.
Long-term monitoring of open-circuit potential (OCP) was performed according to the static immersion method [23] in PBS solution at 37ºC for 1000 hours of immersion. Electrochemical impedance spectroscopy (EIS) measurements were carried out at the OCP using an AC amplitude of 10 mV in the frequency range from 106 Hz to 0.01 Hz and a ZView specialized software was used to fit the EIS data. To evaluate the corrosion behavior of these alloys in PBS solution the potentiodynamic polarization was accomplished in the potential range from – 0.3 V vs. OCP to 2.5 V vs. Ag/AgCl, with a scan rate of 2.5 mVs-1 and the corrosion parameters (corrosion potential, corrosion current and corrosion rate) were calculated from Tafel extrapolation using Echem Analyst™ software. In order to prove reproducibility of the measurements, three specimens for each type of alloy were tested.

3. Results and Discussion

3.1. Surface Roughness and Wettability

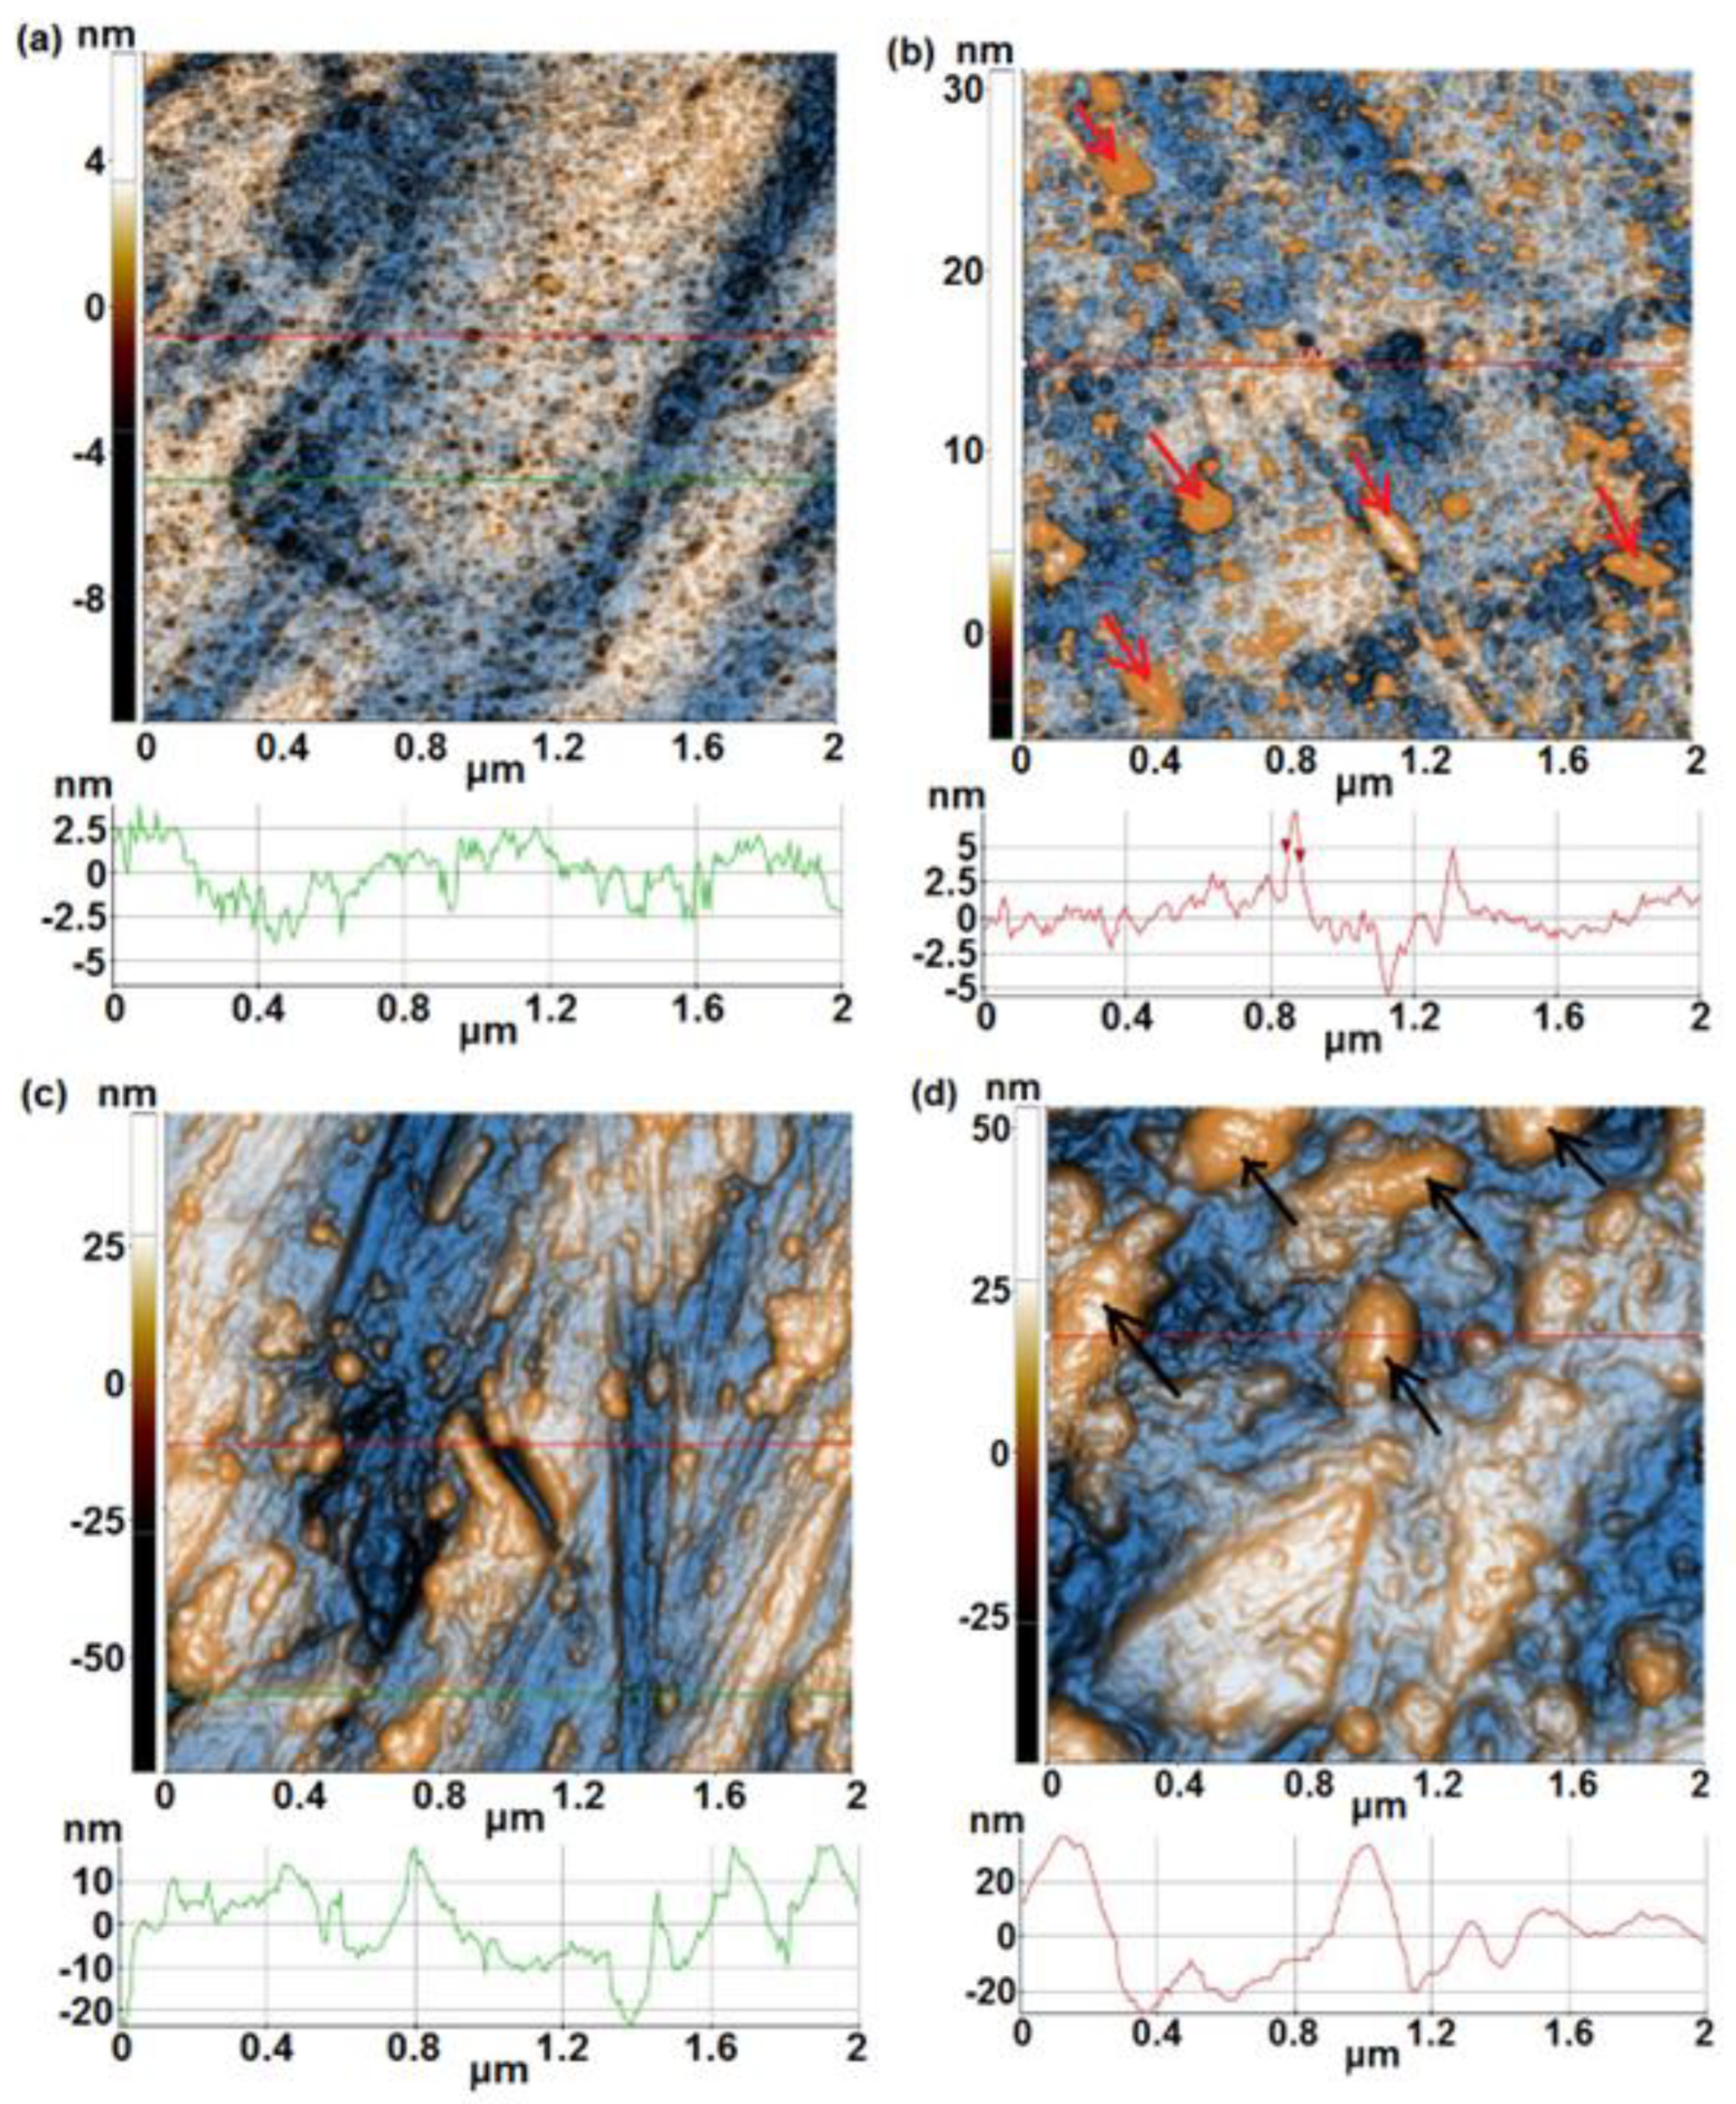
AFM technique was used to investigate the textural properties of the samples (morphology and roughness). Figure 1(a) shows the topography of the 1A sample (Ti20Ta9Nb8Zr2Ag) after polishing, based on a 2D AFM image scanned at the scale of (2µm x 2µm). The sample is very flat, as suggested by the line scan, plotted below the corresponding image, with a difference height level (height irregularities) of ~ 8 nm (from -6 to +2 nm). Random superficial pores, no deeper than 4-6 nm, are present on the scanned area, visible as dark-blue spots. The root mean square roughness (Rq) is 1.1 nm, while the peak-to-valley parameter (Rpv) is 19.0 nm. After immersion for 1000 h in PBS solution (Figure 1b), the 1A sample exhibits some random small deposits (indicated by orange arrows in Figure 1b), probably nucleated from the solution (small crystal salts). The roughness parameters are not much changed after immersion experiment, as the Rq equals 1.7 nm, while Rpv was ~19.4 nm. The surface profile (line-scan) of 1A sample after immersion (Figure 1b) exhibits a slightly smoother profile (fewer sharp peaks) in comparison with the polished surface (Figure 1a), but with the same surface difference height level of ~ 8 nm (from -4 to + 4 nm). Sample 1B, representing the unpolished, raw, Ti20Ta9Nb8Zr2Ag alloy, appears more compact (without pores) and contains some massive materials agglomerations, tens of nm in height (Figure 1c – AFM image and corresponding line-scan). That makes the sample very rough, with Rq of 31.3 nm and Rpv of 220.5 – the highest values in the series of Ti20Ta9Nb8Zr2Ag alloys (as a small observation, the upper part of the sample is less corrugated (with roughness parameter a few times lower). After immersion of 1B sample for 1000 h in PBS, it can be presumed that part of the surface irregularities is filled with the passive film (see the white arrows in Figure 1d) and the surface appears to be less corrugated – Figure 1d, as the corresponding line-scan decreases to ~16 nm (from -6 to 10 nm). Their roughness parameters are much decreased in comparison with sample 1B before immersion, as Rq equals 8.24 nm, and Rpv ~79.9 nm.
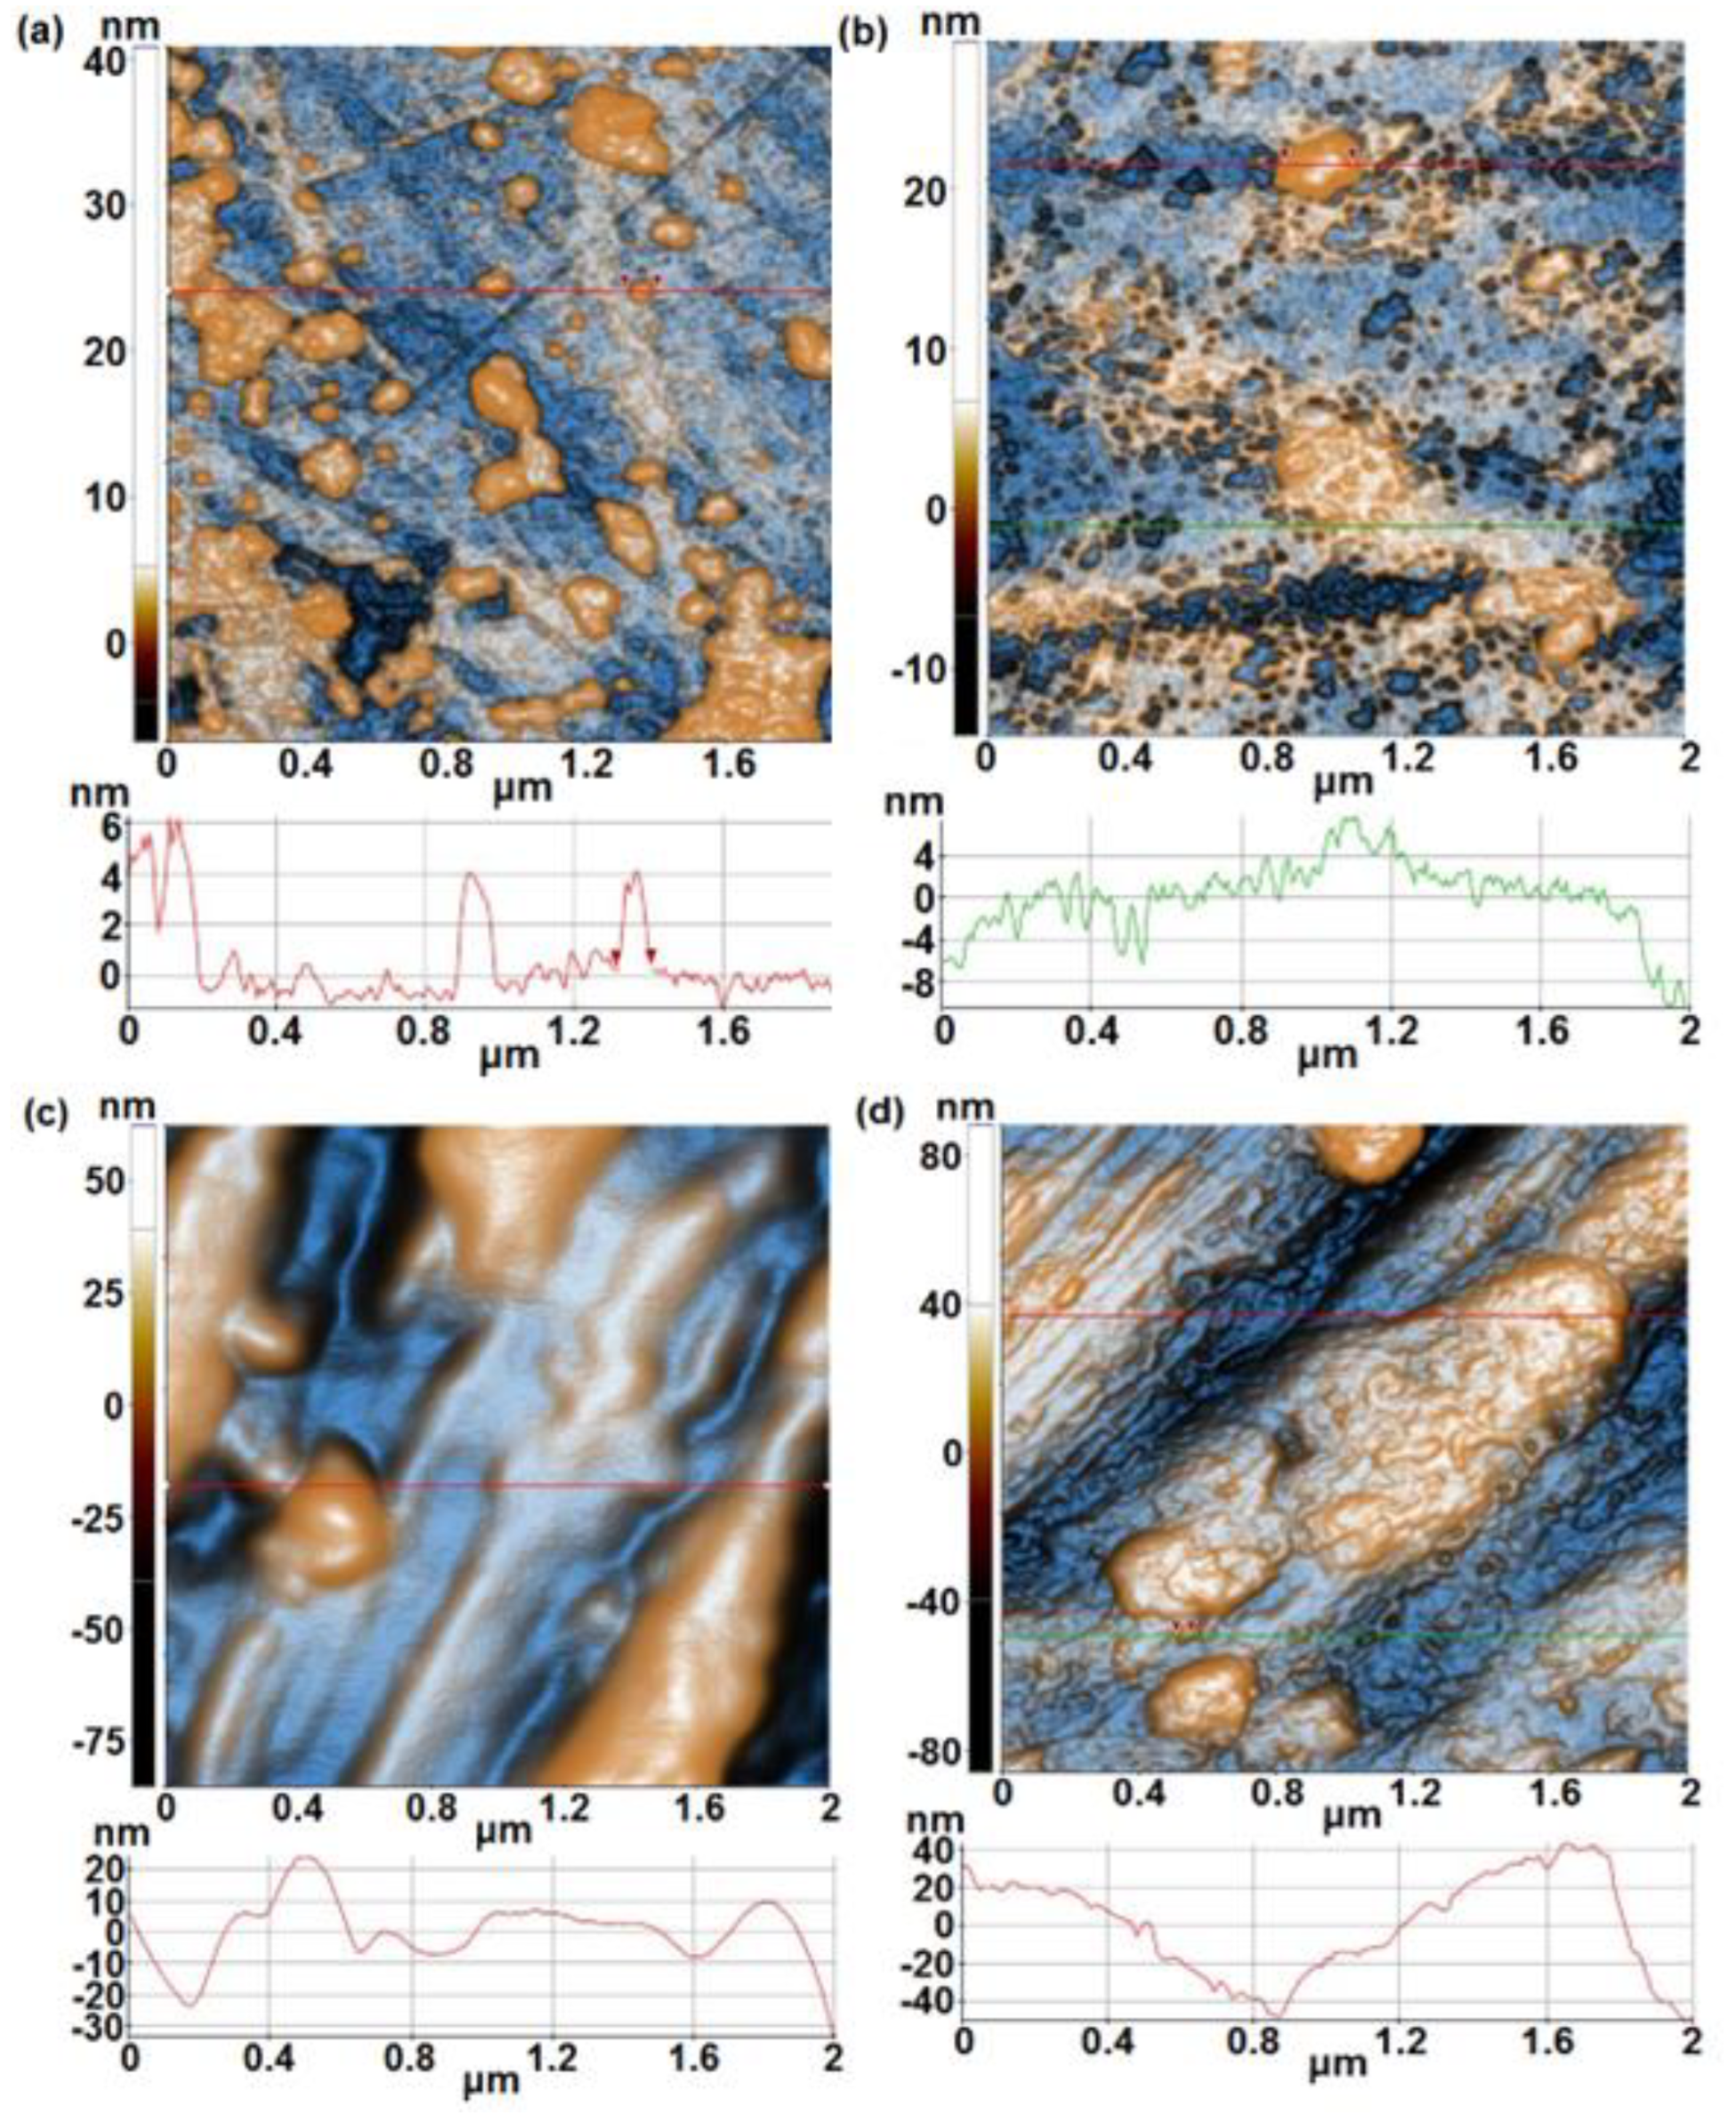
Sample 3A (Figure 2a), from Ti10Ta9Nb8Zr2Ag series of alloys, and sample 1A (from Ti20Ta9Nb8Zr2Ag series of alloys) are similar from the morphological point of view with the difference that the superficial pores (see the dark spots in the AFM image) present on sample 3A are smaller in diameter and depth. Sample 3A is also very flat (Rq~1.8 nm, Rpv ~18.3 nm) as suggested by the line scan with a surface height difference of ~ 6.5 nm (from -4.0 to + 2.5 nm). After immersion in PBS, sample 3A becomes covered by different globular shaped particles (Figure 2b), separated small (few tens of nm in diameter) and agglomerated (hundreds of nm – indicated in Figure 2b by red arrows), most probably firstly attached from PBS solution and then adsorbed, part of them covering the previously observed superficial pores of sample 3A. Consequently, due to the presence of these particles, the roughness parameters slightly increased after immersion experiment, as Rq equals 2.10 nm, and Rpv ~37.0 nm. Sample 3B, before immersion (Figure 2c) shows some ditches formed most probably during cutting (mechanical processing), a few tens of nm deep, and random material clusters with disordered shapes, leading to the following roughness parameters: Rq of 13.9 nm, and Rpv ~120.1 nm. The line scan plotted in Figure 2c for sample 3B exhibits a vertical height level of ~ 30 nm (from –20 to +10 nm). Following immersion in PBS, sample 3B (Figure 2d) shows a less groove, as the corresponding line-scan display a lower number of hills and valleys, but massive absorbed clusters of species from PBS solution (hundreds of nm in diameter).
It is probable that the passive film formed on the surface, as well as the adsorbed species from the solution, fill a part of the surface irregularities, as the corresponding roughness parameters decreases to Rq ~ 13.49 nm, and Rpv ~101.1 nm.
Figure 3 display the AFM images of the alloy samples without Ta in composition (samples 5A and 5B), before and after immersion in PBS solution. Figure 3a shows the surface of sample 5A before immersion, consisting in smooth areas and random distributed particles, separated (around 100 nm in diameter) or gathered. The sample is relatively flat, as suggested by the corresponding line-scan, with a z-height of ~ 7 nm (from -1 nm to +6 nm). Sample 5A is characterized by a RMS roughness of 2.4 nm and a peak-to-valley parameter of 47.6 nm (over an area of 2 x 2 µm2Figure 3a). After immersion of 1000 h in PBS solution, the surface acquires an aspect suggesting morphology like corrosion (see the shape of the line-scan in Figure 3b), due to the appearance of shallow pits (few nm deep). After immersion, sample 5A is characterized by a RMS roughness of 3.4 nm and a peak-to-valley parameter of 43.4 nm. In contrast, sample 5B displays a compact shape, with large grooves (wrinkles) leading to high values of the roughness parameters: RMS roughness of 20.0 nm and a peak-to-valley parameter of 147.5 nm. Following immersion of 1000 h in PBS solution, the morphology is changed suggesting the adhesion of some particles from PBS solution (forming a coating-like) and some small, random shallow pits (see also the small dents along the line-scan in Figure 3d), leading to RMS roughness of 20.3 nm and a peak-to-valley parameter of 173.9 nm.
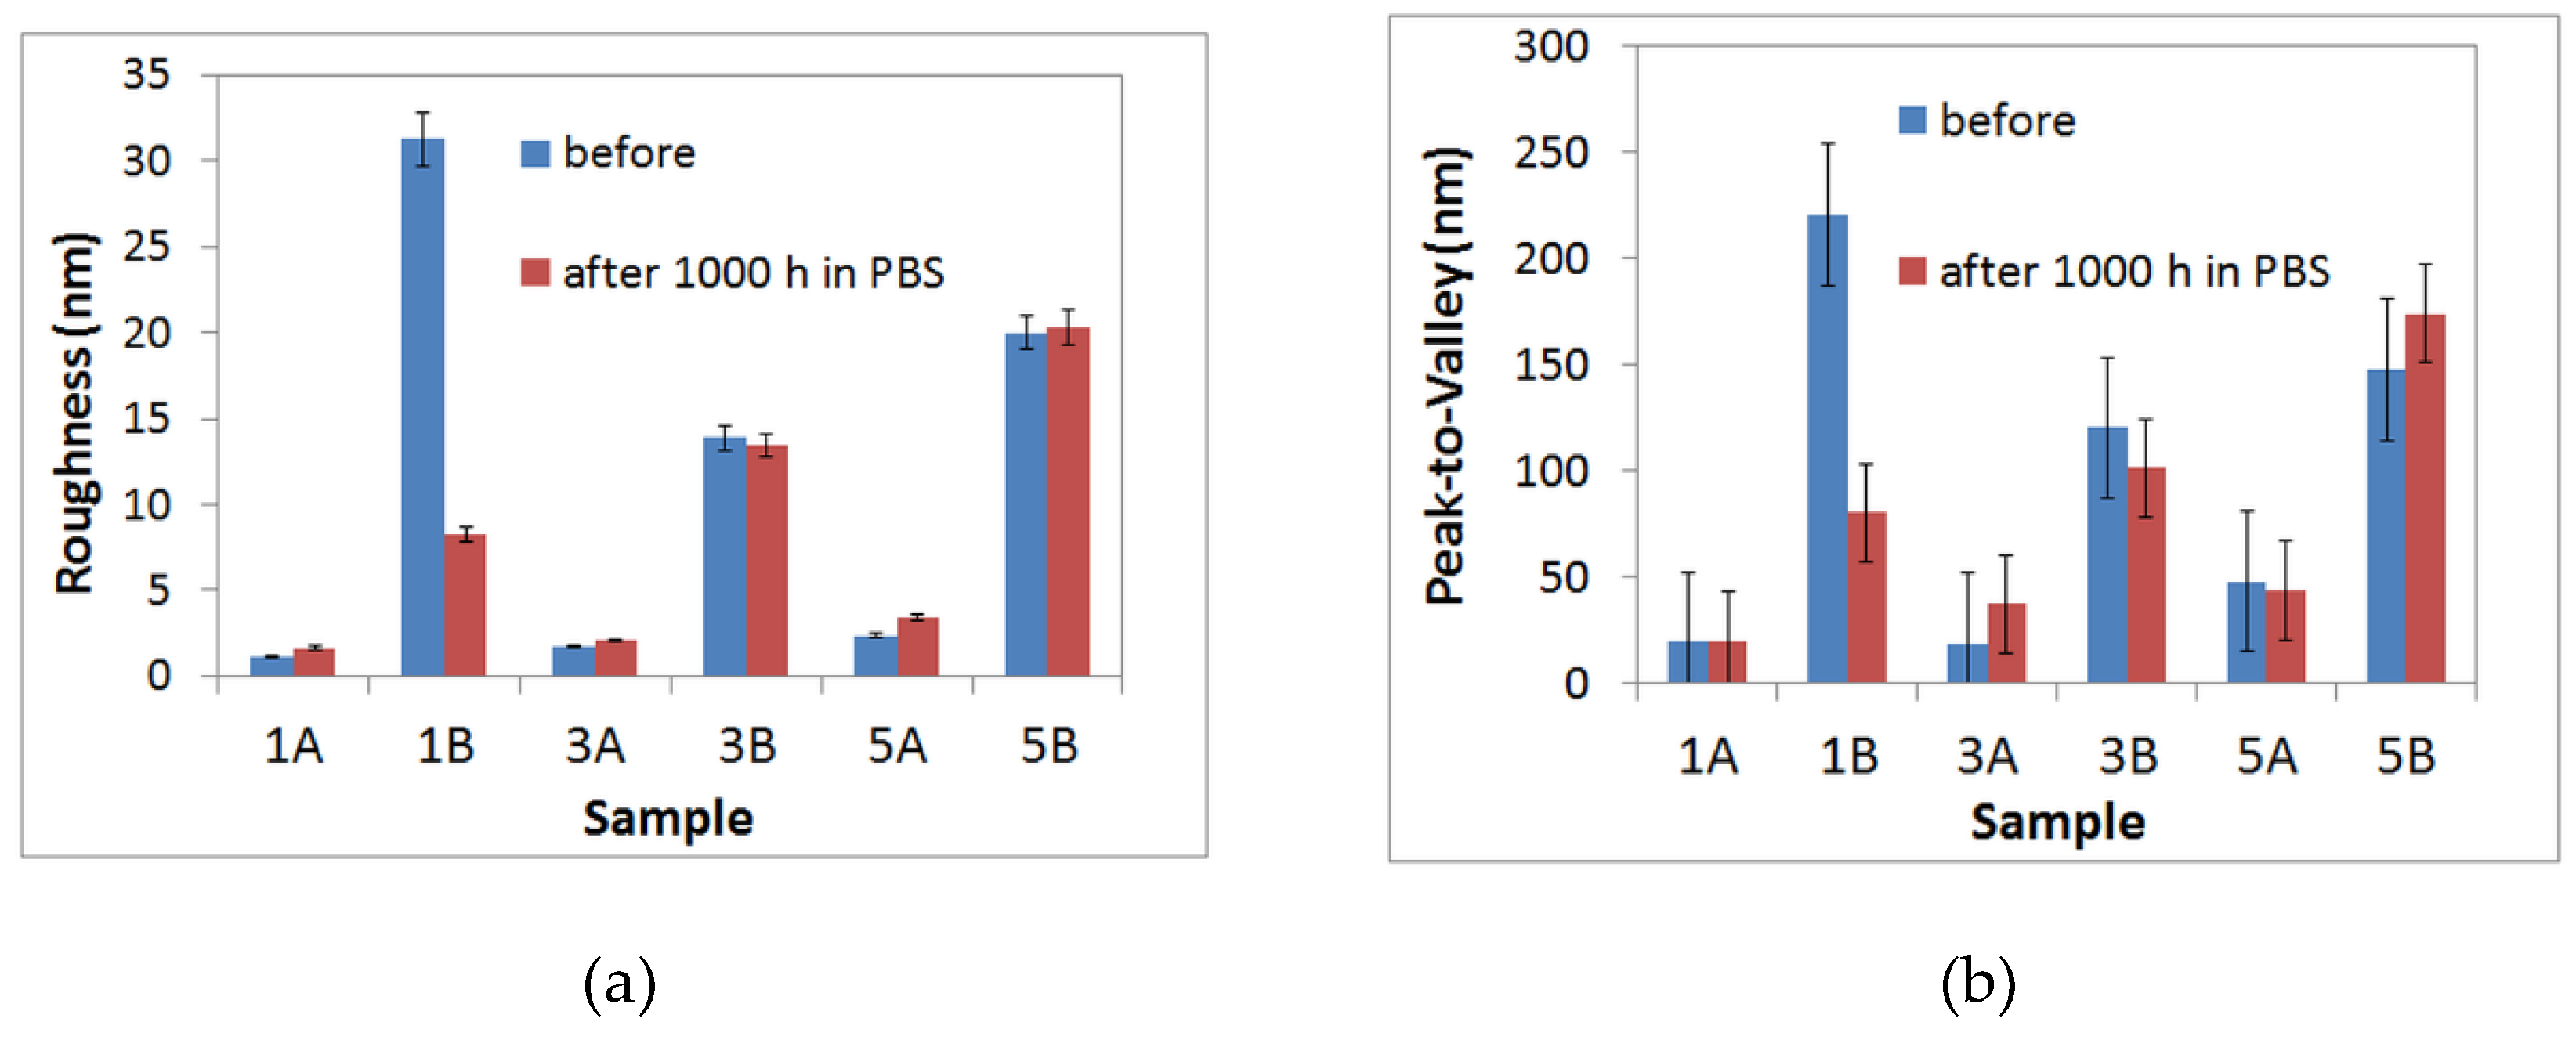
Figure 4 summarizes the roughness parameters (RMS roughness (a) and Peak-to-Valley (b)), highlighting that the pair 1A/3A is much smoother (less corrugated) than the pair 1B/3B. It can be also noted that following immersion, the roughness of the pair 1A/3A slightly increases, while in the case of 1B/3B, an opposite effect can be observed. The pair 5A/5B is similar in roughness behavior with the 1A/3A, suggesting a small increase in corrugation after PBS immersion, as suggested by RMS roughness variation.
These results highlight the influence of the surface roughness on the formation of a passive layer which contains phosphate compounds and acts as a barrier layer against corrosion processes that occur at the alloy/electrolyte interface.
The surface wettability of metallic biomaterials is an important parameter in affecting the biological reactions (i.e., protein adsorption and cell adhesion), which can be investigated by contact angle measurement [24]. It is well known that hydrophilic surfaces have better cell adhesion than hydrophobic ones. The contact angles measurements performed with distilled water on all sample’s surfaces are illustrated in Table 2. For all samples, with tantalum in chemical composition, the contact angle highlights the hydrophilic behavior of the surface after mechanical polishing (i.e the contact angle is smaller than 90º). It is well known that the presence of Ta in the chemical composition of the alloys might impact the surface wettability because Ta presents more hydrophilicity than Ti [25]. The hydrophilic character of the alloys surface is preserved for all samples, even after 1000 hours of immersion in PBS solution. At the samples without Ta in chemical composition (samples 5A and 5B), an almost hydrophobic surface can be observed with a contact angle value of 86.2±4.12 (5A sample) and 82.5±1.49 (5B sample). After 1000 hours of immersion in PBS, the contact angle values decrease, the sample 5B with rough surface showing the lowest value of 67.3±5.49.
The contact angle values illustrated in Table 2 suggest the hydrophilic character of the surface of all samples after 1000 hours of immersion in PBS. Furthermore, a decrease up to 18 degrees of contact angle values is noticed for 1B and 3A samples suggesting higher hydrophilicity of the surfaces. These low values of contact angles (i.e., 49.9±4.73 for 3A and 54.4±3.51 for 1B samples) could be due to the different topography of the surfaces (1B has larger roughness than 1A), as well as to the presence of a more hydrophilic group (-OH) on the surface. Nevertheless, for 3B sample a different behavior was observed after long time immersion when an increase of contact angle value was noticed, from 66.7±2.65 to 73.4±4.19 degrees. According to literature reports [11,12] the chemistry of the surface is the main issue that generate a better wettability of the surface, whilst a relatively smooth surface, which prevents the condensation of water droplets and surface wettability, causes an increase of contact angles. Moreover, it is known that oxidized titanium surfaces show a high wettability with increasing roughness [26]. The results presented in Table 2 for all samples exhibited hydrophilic surfaces that promote the interactions with biofluids, cells and tissue, and give rise to better biocompatibility [27].
Another factor that influences the surface wettability is the surface free energy (SFE) of the solid-liquid interface. When the contact angle is measurement on a surface, the water’s tendency to bond is determined by the SFE of the surface that makes contact with water [6]. The surface free energy (SFE) of the alloys increases with the decrease of contact angle surface making it more hydrophilic [6,7,12]. The SFE and the contact angle are irreversible related. Table 2 summaries the surface free energy of all samples estimated before and after immersion in PBS. There are not significant differences in SFE values for smooth and rough surfaces. After immersion, the SFE values of the samples increase because of the contact angles decrease, as well as, considering the changes in the chemistry of the surface brought by the formation of an oxide layer on the surface [6,12].
Concerning the relation between corrosion resistance and SFE, some studies pointed out that the alloys with low SFE exhibit high corrosion resistance [28]. In this view, one may assume that our samples show comparable corrosion resistance because, as wettability investigations show, they exhibit close SFE values (see Table 2).

3.2. Electrochemical Characterization

The electrochemical evaluation of the samples, without and with two Ta concentration in chemical composition and different grade of roughness was performed for long-term (1000 hours) immersion in PBS solution at 37ºC, in order to highlight the effect of the roughness surface and the Ta amount on corrosion resistance of these alloys. The main electrochemical parameters (Eoc, Ecor, Rcor, Rp) that are considered in this evaluation were estimated from the potential measurements in open circuit (OCP), the electrochemical impedance spectra (EIS), the potentiodynamic polarization curves and Tafel extrapolation

3.2.1. Long-Term Monitoring of the Open Circuit

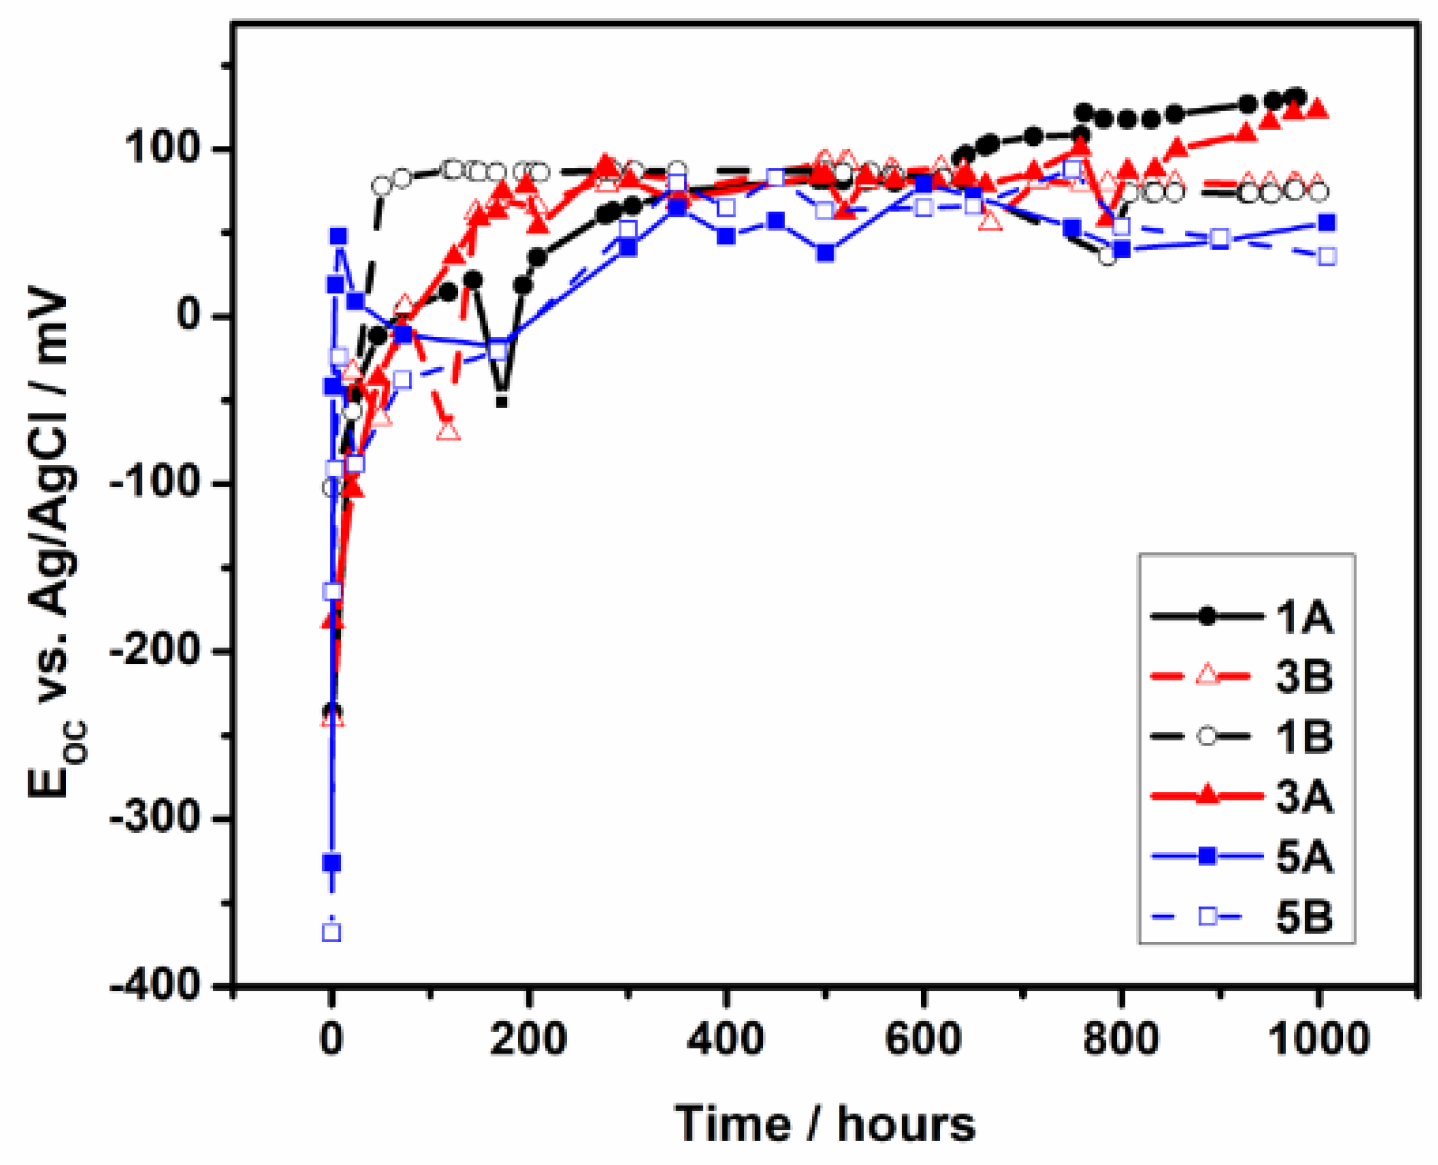
Figure 5 illustrates the evolution of the open circuit potentials, Eoc of all samples in PBS at 37°C for 1000 hours of immersion.
During the first 100 hours of immersion, the Eoc values of all samples increase sharply and achieve to be steady with the extending immersion time. Between 100 and 200 hours of immersion a slow decrease of Eoc for all samples is evidenced. This behavior could be due to an activation of the surfaces because of dissolution of the native oxide film grown of the surface. No more differences between the Eoc values of samples 1A, 3A and 5A were observed, all samples have been close behavior throughout the immersion period with a slow increase of Eoc for 1A sample after 600 hours of immersion. All three samples keep their Eoc values between +50 and +100 mV vs. Ag/AgCl suggesting that on surface a passive film was formed. As regarded the influence of the roughness surface on the Eoc values, all three samples with rough surface (1B, 3B and 5B) revealed similar behavior, Eoc accomplish to be steady with the extending immersion time, suggesting the enhancement of the stability of the passive films formed on the surface. Eoc values are distributed between -150 mV and +150 mV vs. Ag/AgCl for 1A, 3A and 5A polished samples, and between -250 mV and + 75 mV vs. Ag/AgCl for 1B, 3B and 5B rough samples. All Eoc values are placed in the passive potential range for titanium and tantalum on the Pourbaix diagrams [29]. Some fluctuations of Eoc values noticed during period of immersion could be due to the adsorption or /and dissolution processes that are occurring at the interface: the adsorption of phosphate ions on the samples surface, followed by the partial dissolution of the complexes formed with the components of film grown on surface, is a possible answer. As literature reports [30], the passive film could be a balanced state of the formation and dissolution in a natural long-time immersion test.
After 1000 hours of immersion, the stabilized Eoc values of all samples correspond to the presence of a passive film on the surface, that provides protective properties against corrosion in PBS.

3.2.3. Long-Term Corrosion Evaluation

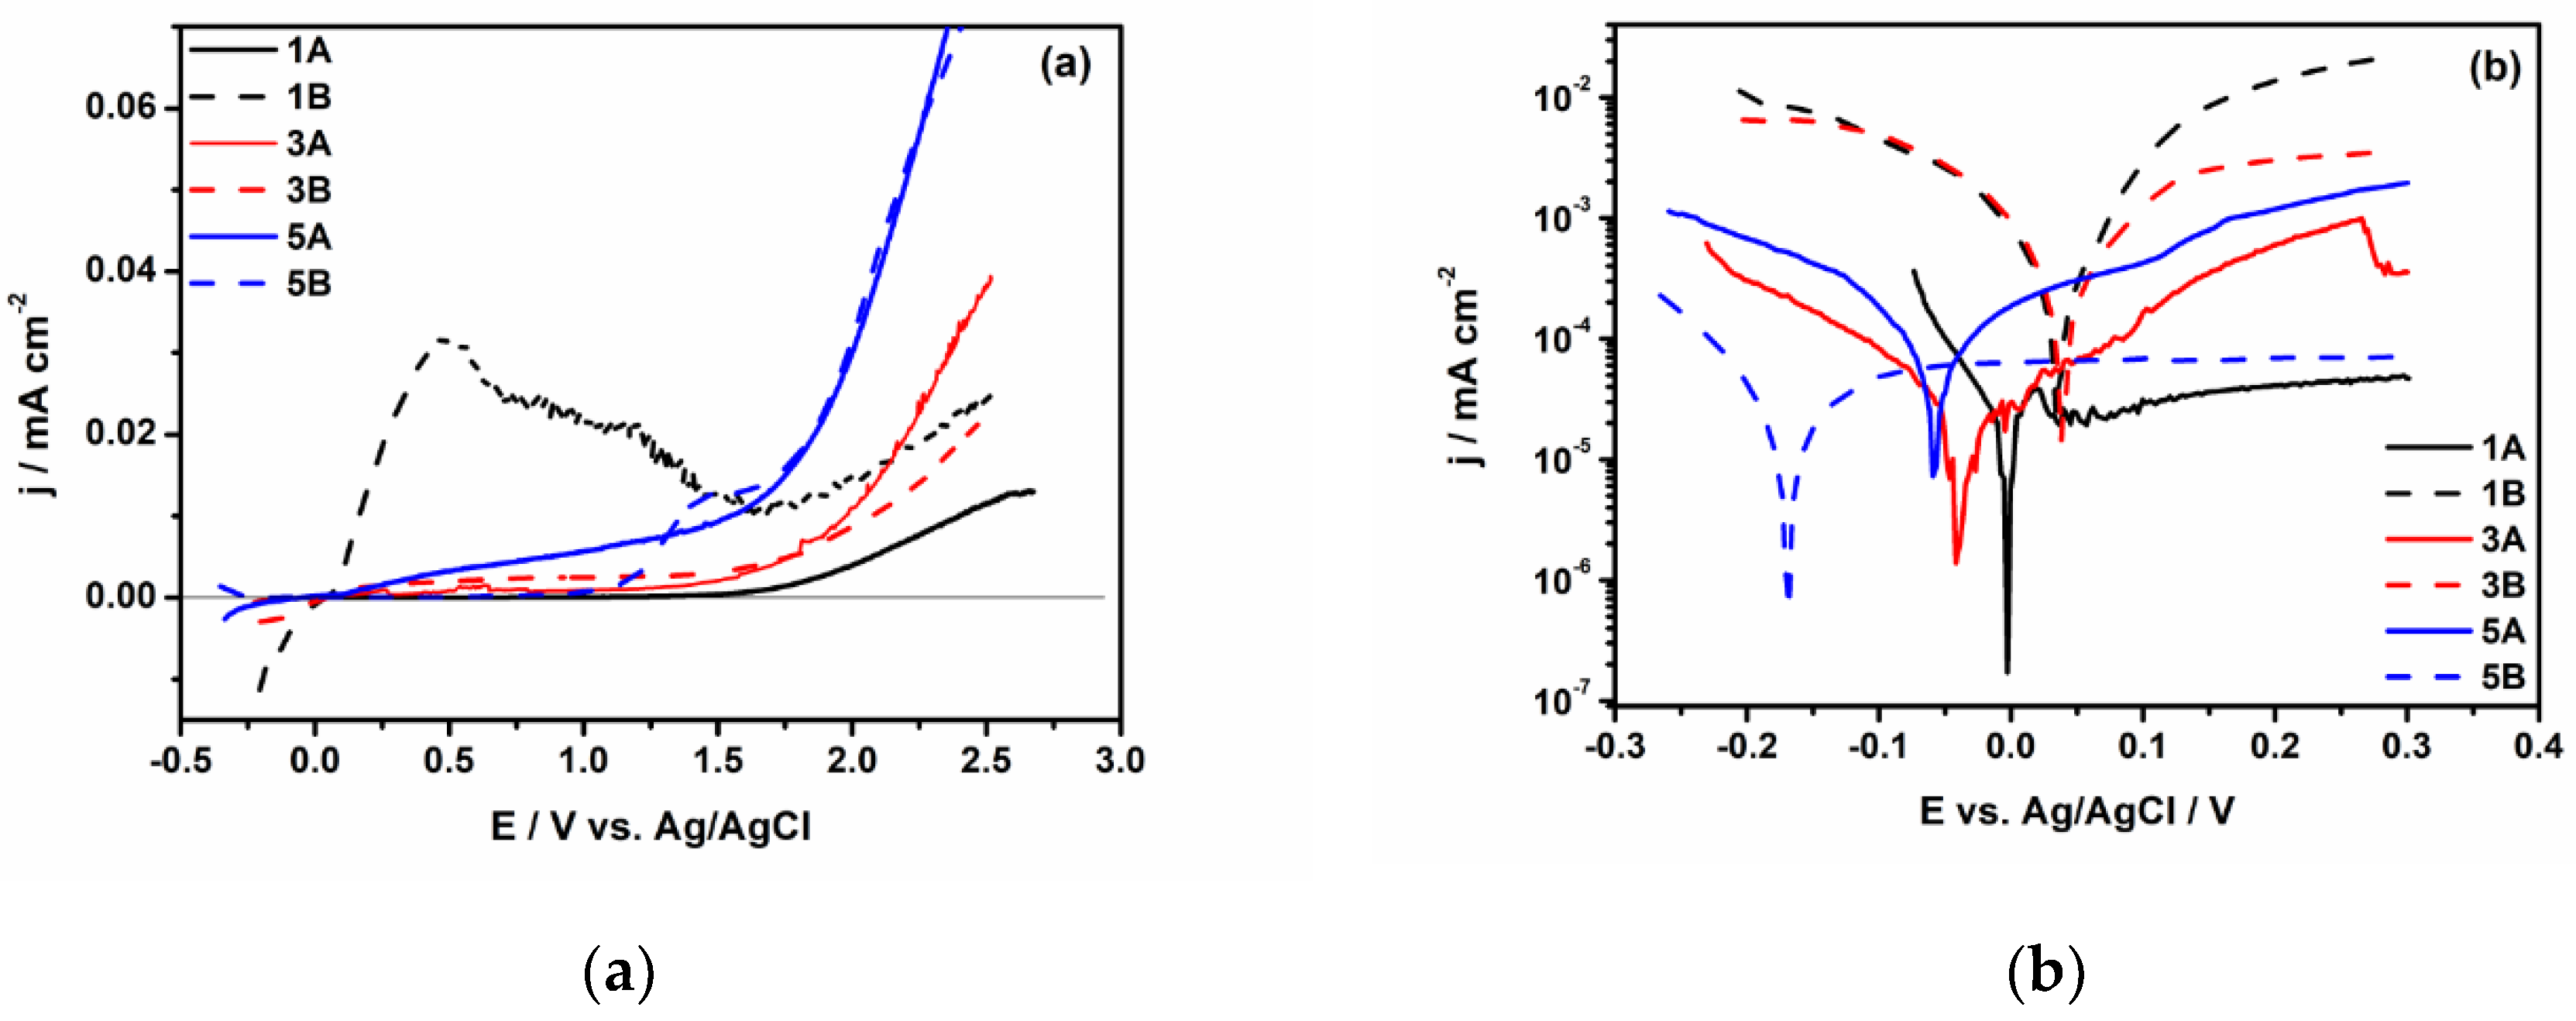
Figure 6a and 6b show the polarization and Tafel curves performed after 1000 hours of immersion in PBS solution for all studied samples (1A, 3A, 5A and 1B, 3B, 5B).
As potentiodynamic curves depict (Figure 6a), the alloys with Ta amount in composition (1A and 3A samples), present low values of current density on a large region of potential, from 0.0 V to 2.5 V vs. Ag/AgCl, suggesting the passive character of the film grown on surface during long-time immersion. Furthermore, up to 2.5 V no breakdown or pitting are occurred for these samples. For alloy without Ta content in composition (5A sample) a slightly increase of current density is clearly visible in Figure 6a, as well as, a diminution of the passivation range, up to 1.55 V vs. Ag/AgCl, suggesting low protective properties of the passive film grown on the 5A sample’s surface. Besides, it is interesting to note the different behavior of 1B sample, where a rapid increase of the current density up to 30 µA cm-2 on the anodic polarization curve is observed. This response is due to a transpassive process that occurs on the surface of 1B sample probably due to the presence of numerous defects onto the surface that led to the formation of a defective passive layer [13].
Figure 6b illustrates the Tafel curves recorded after 1000 hours of immersion in PBS. It is clearly evidenced from Tafel curves that the Ecorr value for all samples moves towards a more positive direction, especially for samples with rough surface and Ta amount in composition, that are in good agreement with the OCP evolution. This behavior reveals a passive character of the surface samples in PBS solution. Additionally, the main electrochemical parameters, corrosion potential (Ecor), corrosion current density (jcor), corrosion rate (Rcor) and polarization resistance (Rp) were estimated by Tafel extrapolation and are presented in Table 3.
For 1B and 3B samples a more positive values of corrosion potential (Ecor) were noticed over time, revealing a passive film formation, whereas for 1A, 3A, 5A and 5B samples a negative value of Ecor was observed. Because no significant differences in Ecor values are noted at 1A, 3A and 5A samples no reliable information about of corrosion behavior might be obtained from this corrosion parameter.
Linear anodic polarization curves recorded for all sample and illustrated in Figure 6a highlight a significant difference between sample 1B and the others sample regarding the luck of passivation. An important increase of the corrosion current density is also observed for 1B sample (i.e., 107 ± 0.15 nA cm-2 compared with 17.2 ± 0.02 nA cm-2 for the sample 1A with same chemical composition but other surface roughness) hinting that the film formed on 1B surface is not very stable or not continuous ones. After 1000 hours of immersion for samples 1A and 3A the lowest values of icor were estimated (i.e., 17.2 ± 0.02 nA cm-2 and 53 ± 0.11 nA cm-2), suggesting a high corrosion resistance in PBS solution. Additionally, a large potential range (> 2.0 V) where the current density is a passive one (j < 10 µA cm-2) is observed for 1A and 3A samples, as well as, low values of the corrosion rate (Rcorr < 1 µm y-1) indicates that the protective film formed on the surface of these samples remain stable over time. A slightly decrease of corrosion rate (between 1.35 ± 0.1 and 3.01 ± 0.25 µm y-1) and a small depletion of the passive potential range for all samples with rough surface (1B, 3B, 5B) were noticed after 1000 hours of immersion in PBS. Consistent with corrosion parameters estimated after 1000 hours of immersion in PBS, the best corrosion performances are point out by 1A and 3A samples.
According to Standard resistance classes [31], the Ti20Ta9Nb8Zr2Ag and Ti10Ta9Nb8Zr2Ag alloys with smooth surfaces (1A and 3A samples) are perfectly stable materials revealing the best corrosion performance for long time immersion in PBS (corrosion rate < 1 µm y-1), whilst the alloys without Ta amount in composition and all samples with rough surface are placed in very stable resistance classes materials (1.35 ± 0.1 µm y-1 < corrosion rate < 3.01 ± 0.25 µm y-1).
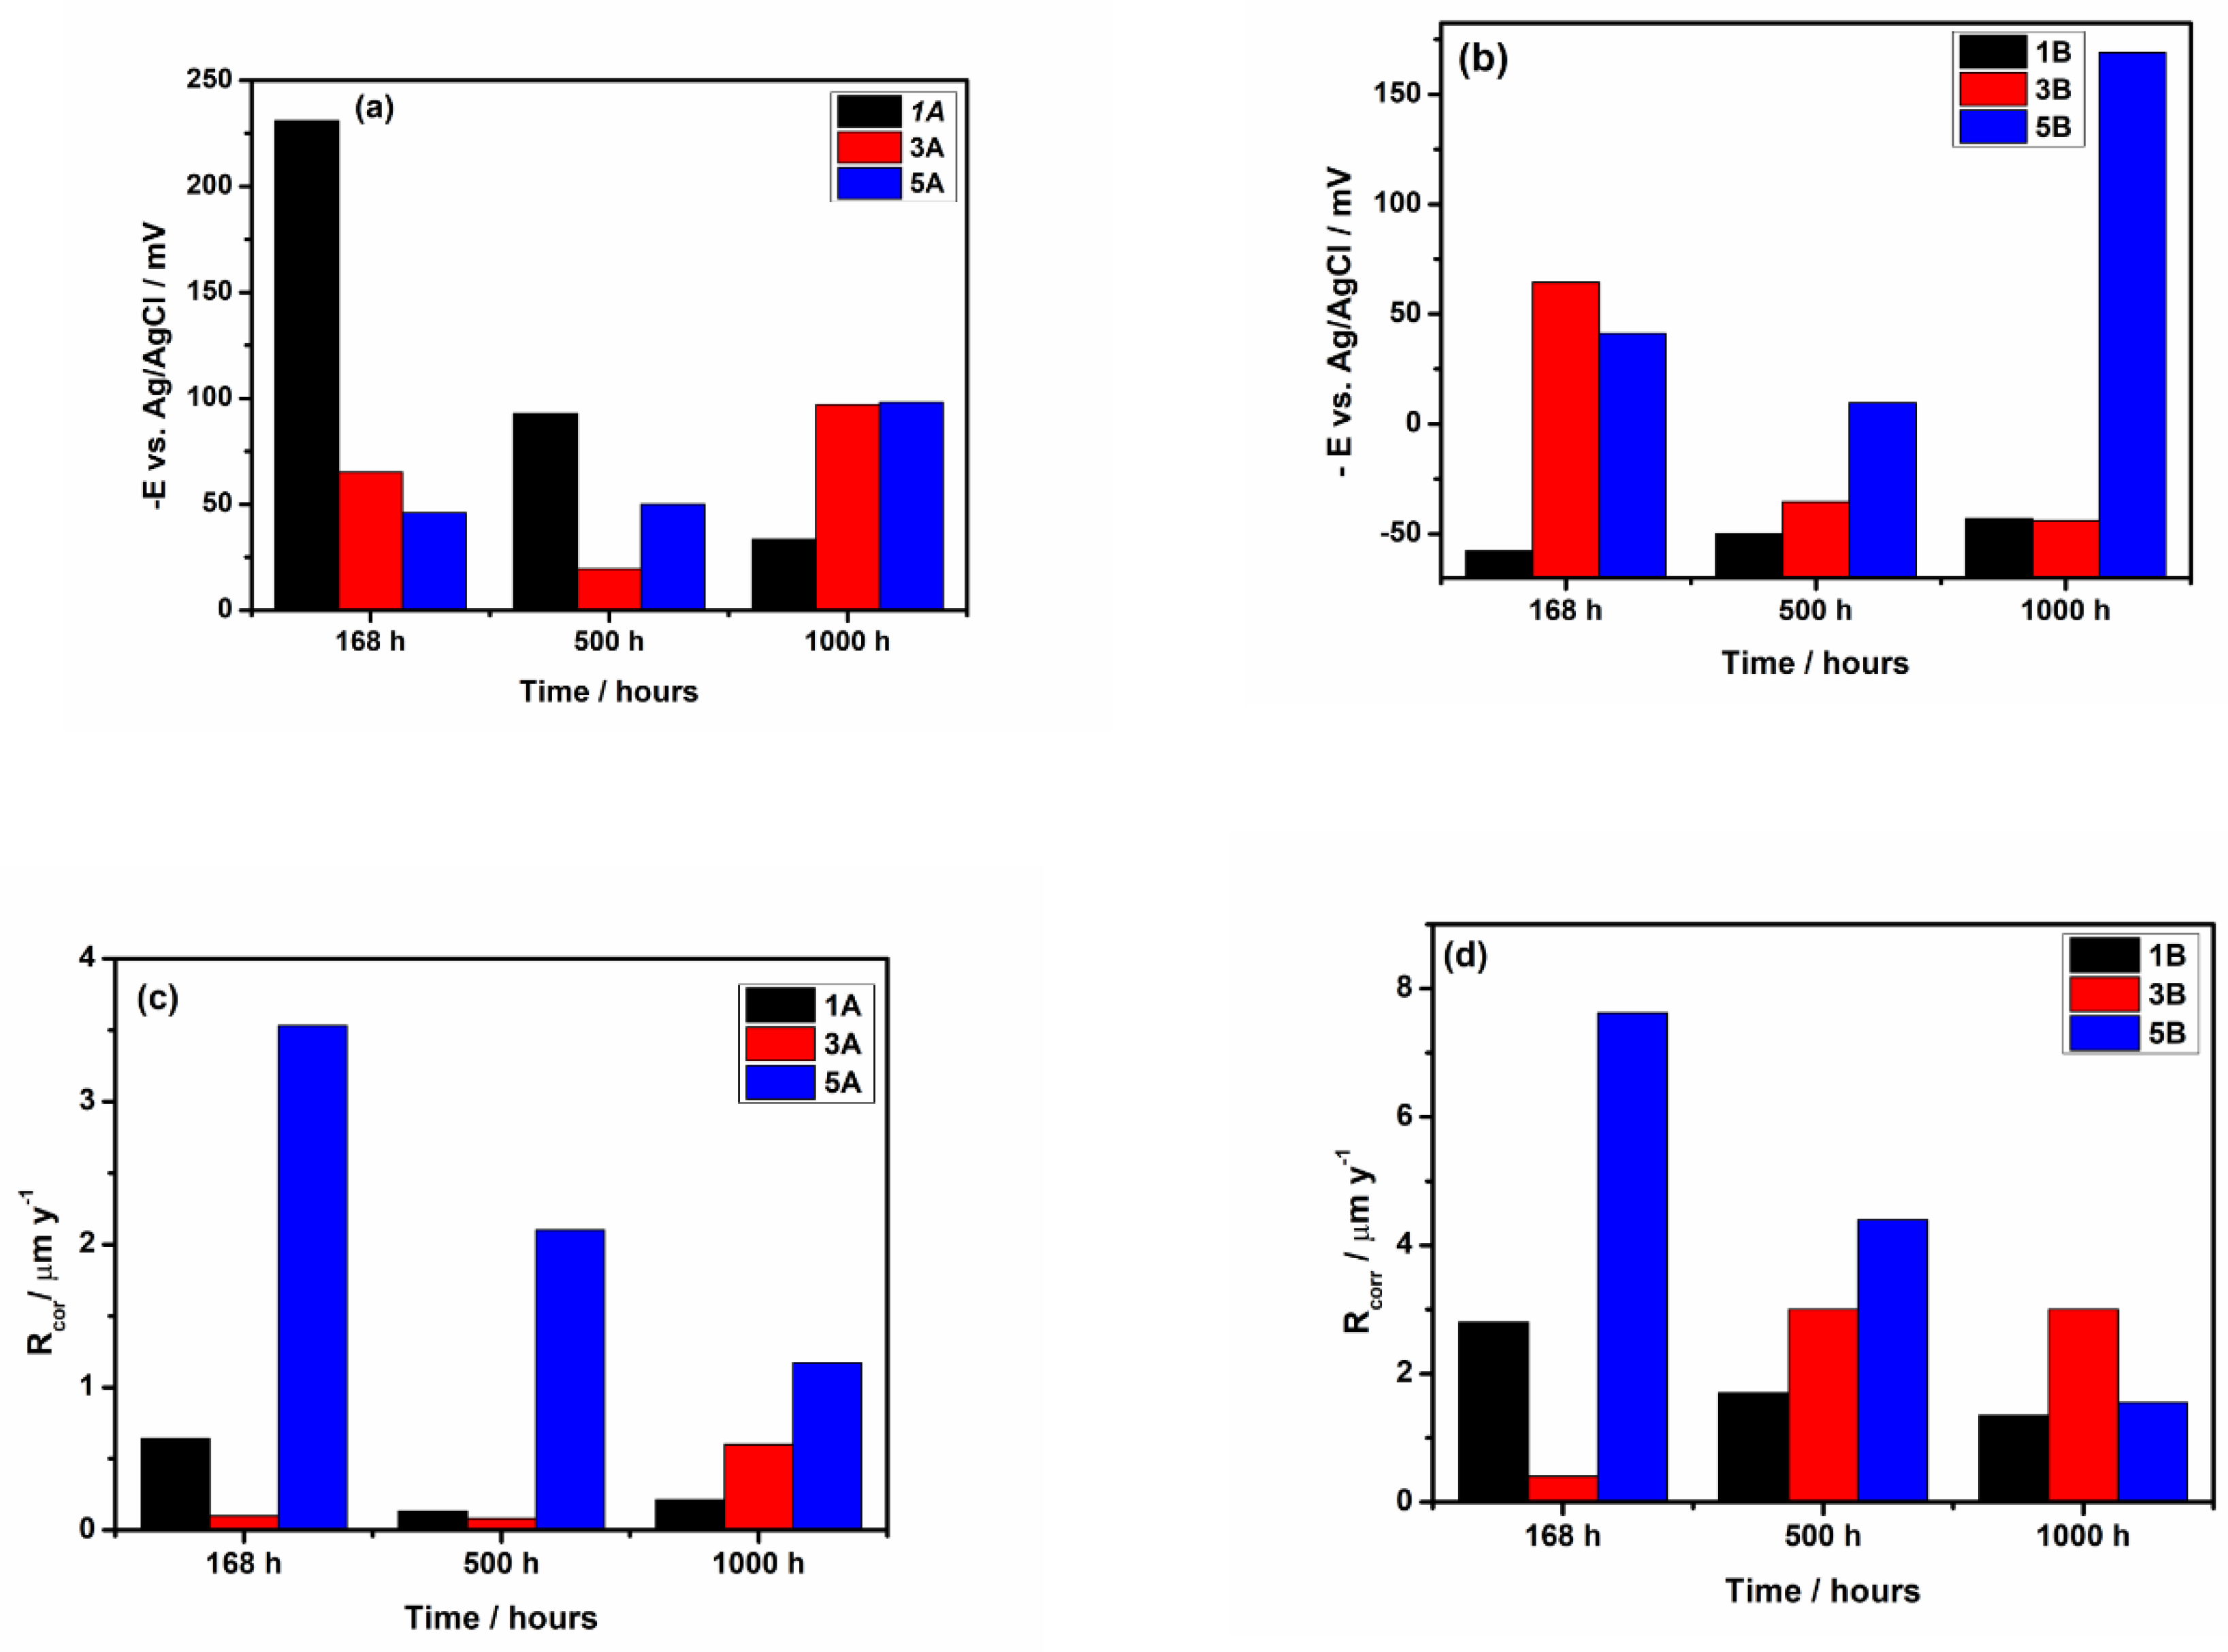
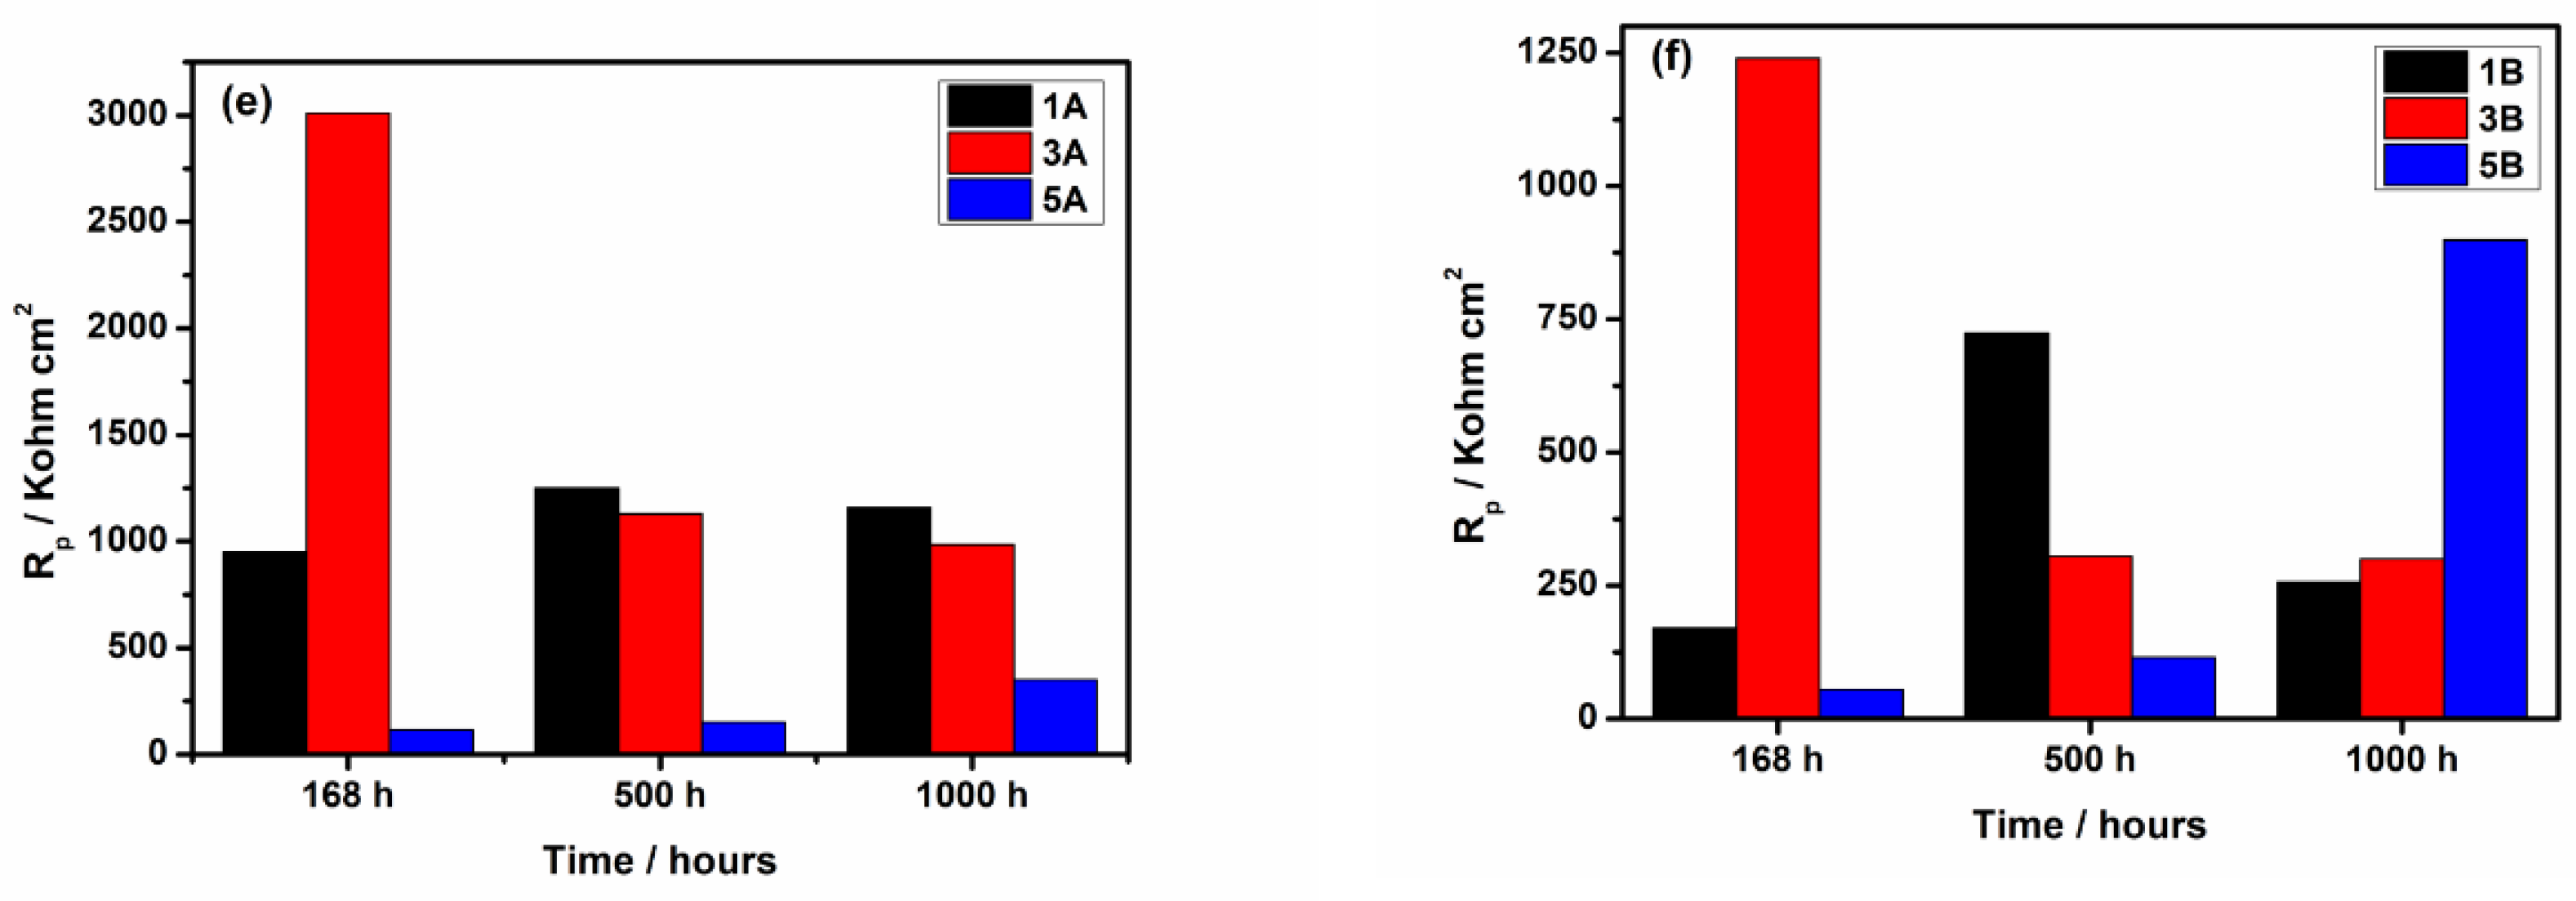
The long-time evolution of the electrochemical parameters (Ecorr, Rcorr, Rp), which are important to prove the corrosion performance of the studied Ti-Ta alloys in PBS at 37°C, is illustrated in Figure 7. A comparison between the samples with smooth (1A, 3A and 5A) and rough surface (1B, 3B and 5B) is also highlighted.
Firstly, it is observed that after short time immersion, 168 hours, the Ecorr of the samples with smooth surface (1A, 3A) is more negative than that of the samples with rough surface (1B, 3B), but over time Ecorr tends to increase towards less negative values (Figure 7a). These results are rather surprising as it is well known that a smooth surface improve the corrosion performance of the materials [32]. A different behavior is observed for the samples 5A and 5B, without Ta amount in composition, both samples revealing negative values of Ecorr throughout the immersion period (Figure 7b). Long-time evolution is unfavorable for the samples 5A and 5B, the corrosion potential became slightly more active, the current density increases probably generated by the dissolution-repassivation processes at the interface between the samples and PBS [33]. Moreover, adsorption of the PO43- ions on the samples surface acting on a barrier layer between samples surface and PBS, lead to increase in the film thickness. According to literature report [18,34], the process of adsorption of phosphate ions is a fast one, but the surface became saturated after long time immersion in the solution. This fact could be an important process that causes the changes of the corrosion parameters of the studied alloys during the immersion period.
Secondly, the corrosion rate (Rcorr) and polarization resistance (Rp) should be analyzed together because both parameters are undoubtedly associated with the corrosion resistance of the alloys.
As Figure 7c and 7d illustrate, the corrosion rates of 1A and 5A samples slowly decrease, whilst of 3A sample shows a minor increase. It is noticed that 3A sample shows the highest Rp value after 168 hours of immersion, indicating that a native passive film is formed on the surface, but over time (1000 hours), a significant decrease of Rp with a small increase of Rcorr (from 0.1 to 0.6 µm y-1) is observed. Polarization resistance Rp, that characterizes the passive film resistance, exhibits higher values for 1A, 3A and 5A samples in comparison with 1B, 3B and 5B samples as shown the histograms depicted in Figure 7e and 7f. The corrosion rate (Rcorr) values of 1B, 3B and 5B samples, estimated by Tafel extrapolation are from 2 to 4 times higher than that of 1A, 3A and 5A samples, and are in line with the noticeably decrease of Rp values. These significant increase of Rcorr for the samples with rough surface can be explained by a large surface development on 1B, 3B and 5B samples in comparison with smooth ones (1A, 3A and 5A), given that an irregular surface rough, it is more susceptible to oxidation, and the film formed will be easier deteriorated by aggressive biofluids, originating the corrosion process [32,35]. Moreover, some depassivation zones can be appeared on the samples with rough surfaces, because of the presence of numerous defects on the surface, that lead to the formation of a defective passive film [13,36]. This assumption is in accordance with the AFM analysis that exhibits morphological changes of the samples with rough surface, revealing large grooves leading to high values of the roughness parameters (5B sample) and many irregularities due to the adsorbed species on the surface (1B and 3B samples).
In conclusion all samples exhibit good corrosion protection in PBS for long time immersion. The best corrosion resistance was observed for the samples with smooth surface and with 10 % or 20 % Ta. For the samples with or no Ta in their composition and with a certain roughness a lower corrosion performance was noticed. These results appear to attest that only the presence of Ta in alloy composition, which should bring about a good stability of the film [37], not necessary improve the protective properties of the passive film. Actually, both the presence of Ta in alloy composition and a smooth surface provides good corrosion performance of these alloys. This behavior most probably resides from the presence of mainly Ta2O5 and TiO2 in the film composition and from a lower accessibility of the fluid to alloy surface [3, 17, 37].
It is well known that at a rough surface a higher contact surface/fluid occurs, yielding most probably to a surface more susceptible to corrosion attack. These results are supported by EIS investigations, which revealed that the alloys with smooth surface and a certain amount of Ta (1A and 3A samples) have the high resistance of the film (i.e., R2 is 5.673 MΩ cm2 and 3.480 MΩ cm2 for 1A and 3A samples).

3.2.2. Electrochemical Impedance Spectroscopy

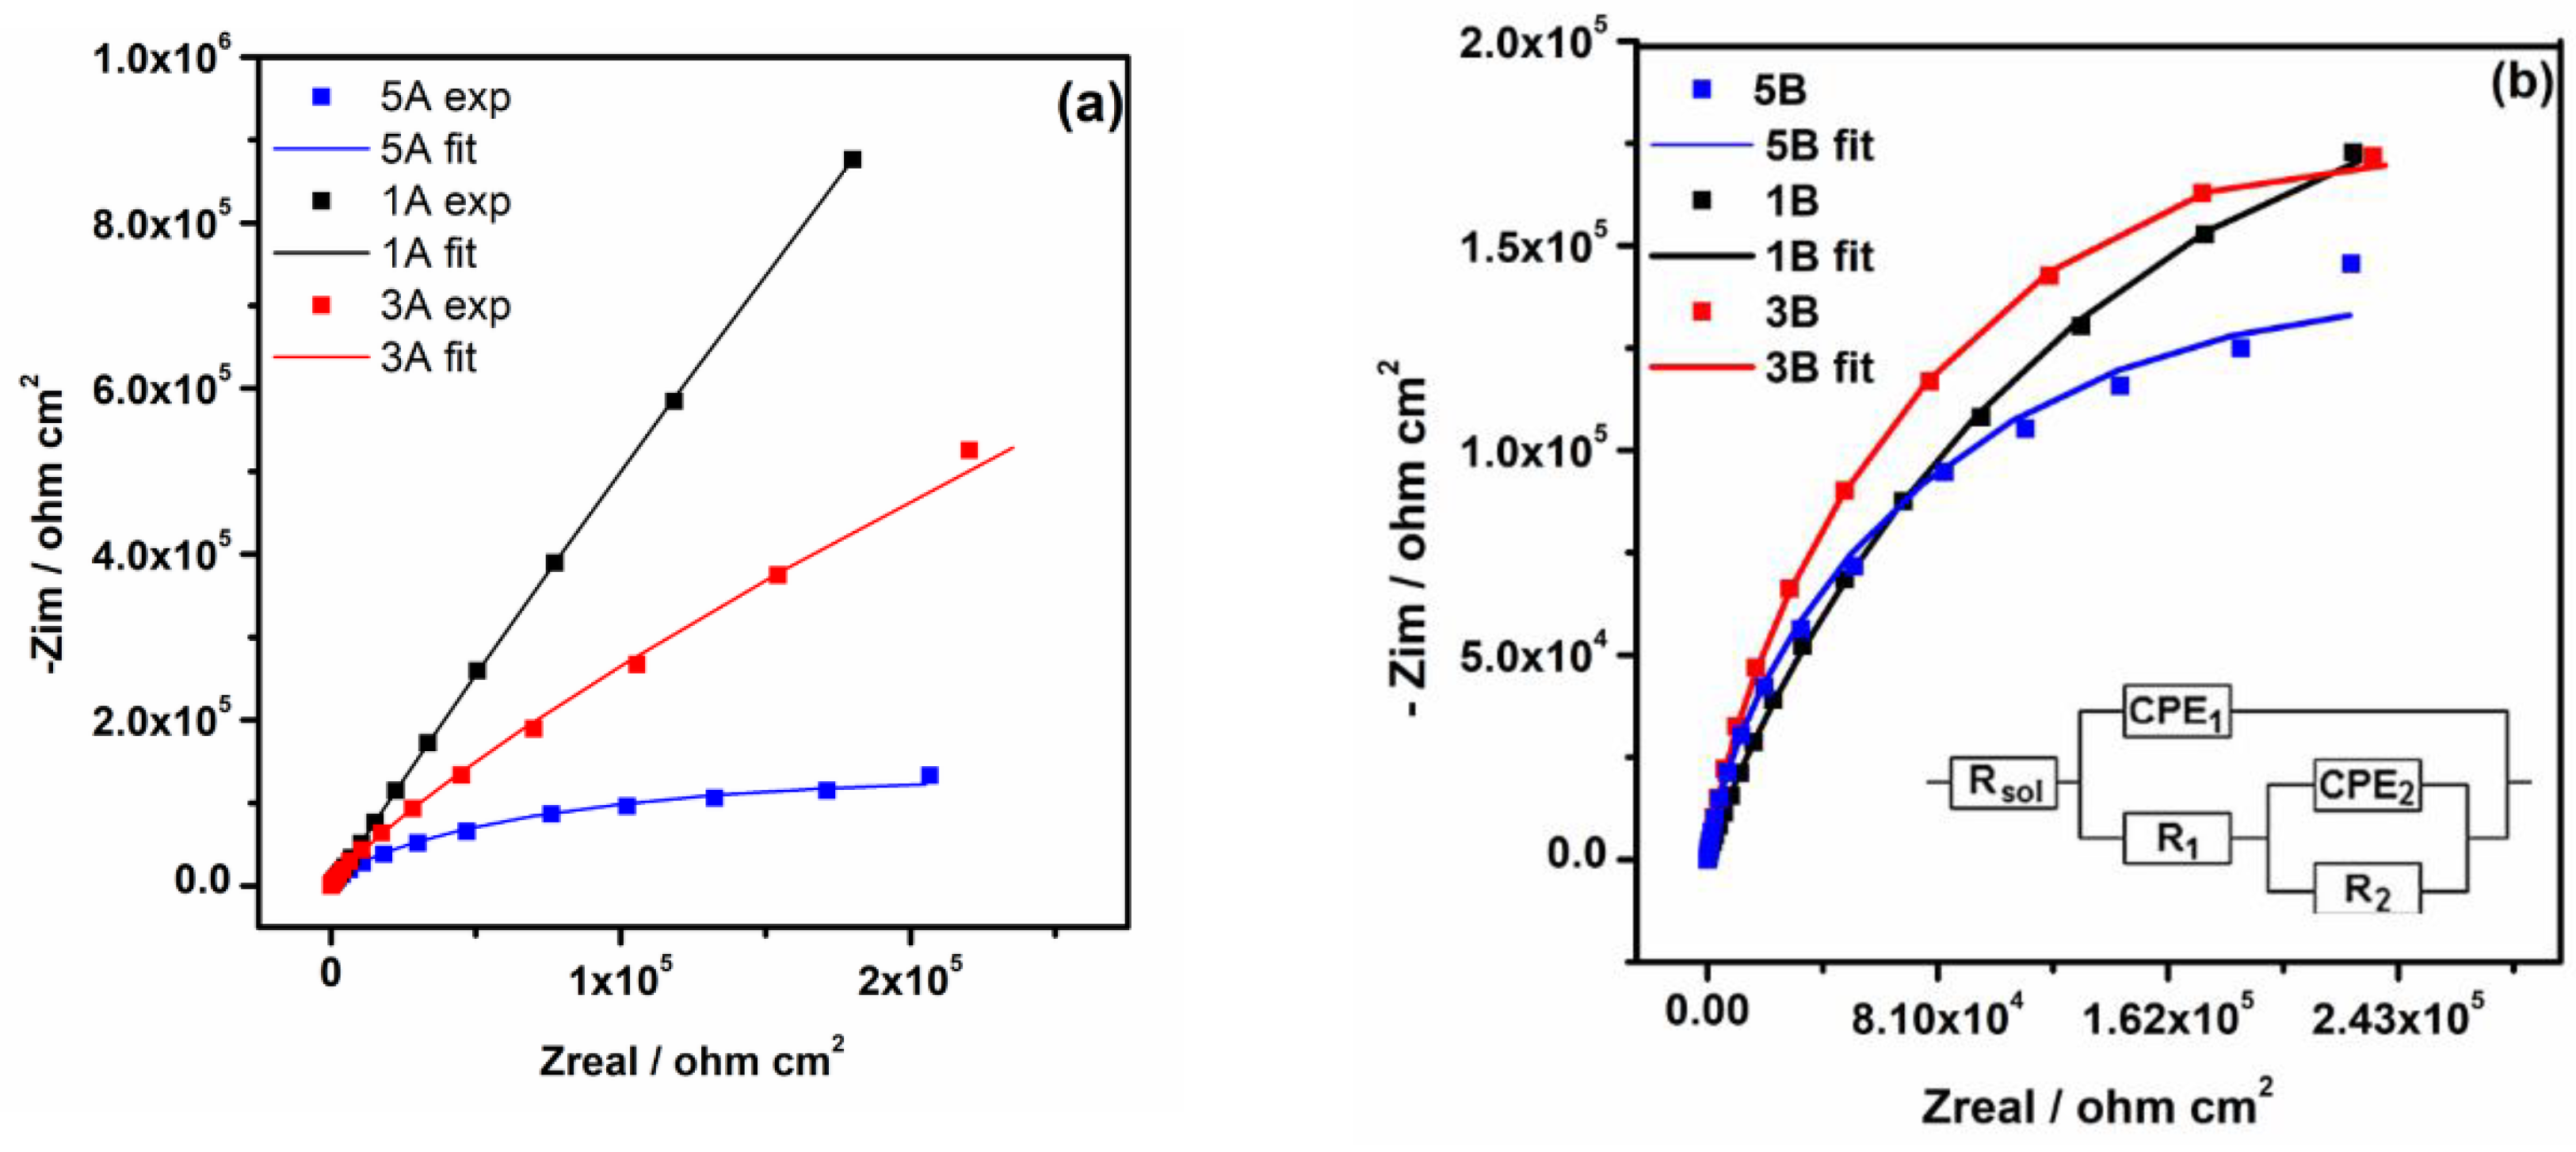
In order to evidence the changes at the passive film / electrolyte interface upon exposure of all samples to PBS solution, the EIS investigations were performed simultaneously with open circuit potential monitorization. The EIS data recorded after 1000 hours of immersion are represented in Nyquist plots (Figure 8). A single capacitive arc characterized by a large, depressed semicircle is observed in Nyquist plots for 1A and 3A samples, suggesting a similar passivation mechanism. As concern the Nyquist plot for 5A sample a decreasing of the diameter of the semicircle is noticed (Figure 8a), indicating a different passivation process. Literature reports have shown that a larger capacitive loop diameter is related to the dielectric properties of the oxide film formed on the metal surfaces and corresponds to higher corrosion resistance [38, 39]. From the Nyquist plots recorded for all samples, it was evidenced that the shape of these plots’ changes from a linear one for 1A and 3A samples to an arc shape for the others ones (Figure 8b), suggesting that at samples 1A and 3A a mass transfer of chemical species from PBS to the samples occurs [40].
To further analyze the corrosion behavior of all samples in PBS solution, the EIS results are fitted using an electric equivalent circuit (EEC) with two-time constants correspond to an inner thin layer, so-called barrier layer, and an outer layer. The inner barrier layer determines the corrosion resistance of the alloys, whilst the outer layer has an important effect on the osseointegration [41]. In this EEC, depicted in inset Figure 8b, Rs, R1 and R2 represent the electrolyte resistance, the resistance of outer layer, and the resistance of the inner layer, respectively. The CPE is a constant phase element, which consists of a capacitance (C) and a deviation parameter n, that describes the deviation of the ideal capacitive behavior of the passive film, attributed to the roughness and the defects on the surface samples. CPE1 and CPE2 are described as capacitances of the outer and the inner layer.
We consider that, in our case the parameter which gives insights about the corrosion performance of these samples is the resistance of the inner layer (Rinner) because it represents the resistance of the passive layer formed on alloy surface [6].
From the fitted results, one may estimate that the R2 of all samples with smooth surface are of order of MΩ cm2, pointing that the passive film formed on these types of surface has good corrosion resistance. However, the resistance of the inner layer of 1A sample, i.e., 5.673 MΩ cm2, is 1.6 times higher than that of 3A sample, i.e., 3.480 MΩ cm2, and 5.7 times higher than that of 5A sample, i.e., 1.001 MΩ cm2, suggesting that the passive protective film formed on 1A and 3A samples has remarkable protective properties.
In contrast, a non-negligible decrease of the resistance of the inner layer (R2) is observed for the samples with rough surface, i.e., 437 kΩ cm2, 449 kΩ cm2 and 446 kΩ cm2 for 1B, 3B and 5B samples, respectively. A possible explanation for this decrease could be due to a large contact surface/fluid at the samples with rough surface which hence could yield to a lower corrosion resistance [32].
In conclusion, one may consider that the samples with a certain amount of Ta in their composition and with a smooth surface exhibit a higher impedance associated to a lower susceptibility to corrosion in PBS solution after long time immersion. These EIS results are in good agreement with OCP evolution and potentiodynamic.

5. Conclusions

This study investigated the influence of surface roughness and of certain amount of tantalum on the corrosion performance of the TiTa9Nb8Zr2Ag alloys after long-term immersion in PBS at 37°C, and the results obtained are summarized as follows:
  • From AFM investigations before immersion, it was noticed that 1A, 3A and 5A samples show a smooth surface whereas 1B, 3B and 5B samples show a rough surface. After immersion, a similar trend is observed, in spite of the fact that at 1B sample an important decrease of surface roughness is evidenced.
  • The moderate values of the contact angles were observed for the all samples (i.e., from 49.1° to 70° for 1A, 3A and 5A samples, and from 54.3° to 73.4° for 1B, 3B and 5B samples), suggesting the hydrophilic character of the surface of all samples which is expected to have a beneficial effect on the osseointegration process.
  • The electrochemical tests performed, after 1000 hours of immersion in PBS, revealed that 1A and 3A samples have very good corrosion performance, i.e., 0.21 < Rcorr < 0.6 µm y-1, pointing out that from corrosion point of view they are perfect stable materials. However, the other samples (5A, 1B, 3B and 5B) might be considered very stable materials because a small corrosion rate is noticed (1.35 < Rcorr < 3.01 µm y-1). Based on OCP evolution, this excellent corrosion behavior observed at 1A and 3A samples results from the formation of a stable passive film with remarkable protective properties. Actually, the synergetic effect of the presence of tantalum in alloys composition and of a smooth surface are responsible for the outstanding corrosion resistance of 1A and 3A samples. These findings are supported by the evolution over time of the corrosion parameters estimated for these samples.
As a final remark, these studies attest clearly that Ti20Ta9Nb8Zr2Ag and Ti10Ta9Nb8Zr2Ag alloys with smooth surface might be successfully used from corrosion point of view for medical applications.

Author Contributions

Conceptualization, A.B. and M.M.; methodology, G.D., M.A. and M.E.M; software, C.D. and E.I.N.; validation, M. M., L.P. and A.B.; formal analysis, C.V.; investigation, G.D., A.M., M.E.M.; data curation, M.A.; writing—original draft preparation, M.M.; writing—review and editing, M.M. and L.P.; visualization, C.D. and E.I.N.; supervision, M.M. All authors have read and agreed to the published version of the manuscript.

Funding

This study was performed within the framework of the Electrochemical preparation and characterization of active materials with predetermined features research topic of the Institute of Physical Chemistry -Ilie Murgulescu. This research received no external funding.

Institutional Review Board Statement

Not applicable.

Informed Consent Statement

Not applicable.

Data Availability Statement

The data presented in this study are available on request from the corresponding author.

Conflicts of Interest

The authors declare no conflicts of interest.

References

  1. Sotniazuk, A; Kuczyńska-Zemla.; Kwaśniak, P.; Thomas, M.; Garbacz, H. Corrosion behavior of Ti-29Nb-13Ta-4.6Zr and commercially pure Ti under simulated inflammatory conditions-comparative effect of grain refinement and non-toxic β phase stabilizers. Electrochim. Acta. [CrossRef]
  2. Vasilescu, C.; Drob, S.I.; Calderon Moreno, J.M.; Osiceanu, P.; Popa, M.; Vasilescu, E. ; Marcu, M; Drob, P. Long-term corrosion resistance of new Ti-Ta-Zr alloy in simulated physiological fluids by electrochemical and surface analysis methods. Corros. Sci, 93. [CrossRef]
  3. Popa, M.; Calderon Moreno, J. M; Vasilescu, C; Drob, S.I; Neacsu, E.I.; Coer, A.; Hmeljak, J.; Zerjav, G.; Milošev, I. Structural Analysis, Electrochemical Behavior, and Biocompatibility of Novel Quaternary Titanium Alloy with near β Structure. Metall. Mater. Trans. A. 3130. [Google Scholar] [CrossRef]
  4. Niinomi, M.; Nakai, M.; Hieda, J. Development of new metallic alloys for biomaterials applications. Acta Biomater, 3888. [Google Scholar]
  5. Gupta, S. K.; Gugulothu, S. B.; Ivanov, E.; Suwas, S.; Chatterjee, K. Additive manufacturing of a low modulus biomedical Ti–Nb–Ta–Zr alloy by directed energy deposition. Bioprinting 2024, 41, e00349. [Google Scholar] [CrossRef]
  6. Thampi, A.; Ramanathan, S. Corrosion behavior of anodized Ti-Ta binary surface alloys in various physiological fluids for implant applications. Corros. Sci. 2023, 219, 111233. [Google Scholar] [CrossRef]
  7. Li, Z.; Lai, W.; Wang, B.; Tong, X.; You, D.; Li, W.; Wang, X. A novel Ti42.5Zr42.5Nb5Ta10 multi-principal element alloy with excellent properties for biomedical applications. Intermetallics, 1077. [Google Scholar] [CrossRef]
  8. Hawajreh, G. Al.; Gonzalez, G.; Romero-Resendiz, L.; Vidilli, A.; Otani, L.B.; Amigo, V. Effect of the Ti/Ta ratio on the feasibility of porous Ti25+x-Nb25-Zr25-Ta25-x (X = 0, 5, and 10) alloys for biomedical applications. J. Mater. Res. Technol. 2024, 24, 4364. [Google Scholar] [CrossRef]
  9. Anselme, K. Osteoblast adhesion on biomaterials. Biomaterials 2020, 21, 667–681. [Google Scholar] [CrossRef]
  10. Hallab, N.; Bundy, K.; O’Connor, K.; Clark, R.; Moses, R. Cell adhesion to biomaterials: correlation between surface charge, surface roughness, adsorbed protein and cell morphology. J. Long-Term Eff. Med. Implants. 1995, 53, 209–231. [Google Scholar] [PubMed]
  11. Ponsonnet, L.; Reybier, K.; Jaffrezic, N.; Comte, V.; Lagneau, C.; Lissac, M.; Martelet, C. Relationship between surface properties (roughness, wettability) of titanium and titanium alloys and cell behavior. Mater. Scie. Eng. C. 2003, 23, 551–560. [Google Scholar] [CrossRef]
  12. Yan, Y.; Chibowski, E. , Szcześ, A. Surface properties of Ti-6Al-4V alloy part I: Surface roughness and apparent surface free energy. Mater. Sci. Eng. C. 2017, 70, 207–215. [Google Scholar] [CrossRef]
  13. Ogawa, E.S.; Matos, A.O.; Beline, T.; Marques, I.S.V.; Mathew, M.T.; Rangel, N.C. Cruz; Mesquita, M.F.; Consani, R.X.; Barao, V.A.R. Surface-treated commercially pure titanium for biomedical applications: Electrochemical, structural, mechanical and chemical characterizations. Mater. Sci. Eng. C. 2016, 65, 251–261. [Google Scholar] [CrossRef] [PubMed]
  14. Sittig, C.; Textor, M.; Spencer, N. D.; Wieland, M.; Vallotton, P.-H. Surface characterization of implant materials c.p. Ti, Ti-6Al-7Nb and Ti-6Al-4V with different pretreatments. J. Mater. Sci.: Mater. Med. 1999, 10, 35–46. [Google Scholar] [CrossRef]
  15. Abd-Elaziem, W.; Darwish, M.A.; Hamadad, A.; Daoush, W.M. Titanium-Based alloys and composites for orthopedic implants Applications: A comprehensive review. Mater. Des. 2024, 241, 112850. [Google Scholar] [CrossRef]
  16. Bao, X.; Juma, T.; Li, X.; Ding, J.; Liu, X.; Liu, S.; Li, J.; Cao, Y.; Zhang, T. β duplex phase Ti–Zr–Nb–Ag alloys with impressive mechanical properties, excellent antibacterial and good biocompatibility. J. Mater. Res. Technol. 2022, 19, 5008–5016. [Google Scholar] [CrossRef]
  17. Vasilescu, C.; Osiceanu, P.; Calderon Moreno, J.M.; Drob, S.I.; Preda, S.; Popa, M.; Dan, I.; Marcu, M.; Prodana, M.; Popovici, I.A.; Ionita, D.; Vasilescu, E. Microstructure, surface characterization and long-term stability of new quaternary Ti-Zr-Ta-Ag alloy for implant use. Mater. Sci. Eng. C. 2017, 71, 322–334. [Google Scholar] [CrossRef] [PubMed]
  18. Banu, A.; Preda, L.; Marcu, M.; Dinca, L.L.; Maxim, M.E.; Dobri, G. Electrochemical behavior of SLM Ti-6Al-4V alloy after long time of immersion in lactic acid environment. Met. Mater. Trans. A, 2022, 53, 2060–2070. [Google Scholar] [CrossRef]
  19. Radovanovic, M.B.; Tasic, Ž. Z.; Simonovic ́, A.T.; Petrovic ́ Mihajlovic, M.B.; Antonijević, M.M. Corrosion Behavior of Titanium in Simulated Body Solutions with the Addition of Biomolecules. ACS Omega 2020, 5, 12768–12776. [Google Scholar] [CrossRef] [PubMed]
  20. Dobri, G.; Berceanu, A.; Paraschiv, A.; Geanta, V.; Ciuca, S.; Banu, A. The effect of tantalum content on microstructure and Vickers hardness of TiNbZrTaAg alloy. U.P.B. 85, 2023; 85. [Google Scholar]
  21. Dobri, G.; Banu, A.; Donath, C.; Marcu, M. The Influence of the Tantalum Content on the Main Properties of the TixTa9Nb8Zr2Ag Alloy. Metals 2023, 13, 1294. [Google Scholar] [CrossRef]
  22. Li, D.; Neumann, A. W. Equation of State for Interfacial Tensions of Solid-Liquid Systems, Adv. Colloid Interface Sci. 1992, 39, 299–345. [Google Scholar] [CrossRef]
  23. ISO 10271/2001-Dental Metallic Materials-Corrosion Test Methods. ISO: Geneva, Switzerland, 2001.
  24. Volger, E. A. Water and the acute biological response to surfaces. J. Biomater. Sci. Polym. Ed. 1999, (10), 1015–1045. [Google Scholar] [CrossRef]
  25. Adamek, G.; Kozlowski, M.; Junka, A.; Siwak, P.; Jakubowicz, J. Preparation and Properties of Bulk and Porous Ti-Ta-Ag Biomedical Alloys. Materials 2022, 15, 4332. [Google Scholar] [CrossRef] [PubMed]
  26. Ozdemir, Z.; Basim, G.B. Effect of chemical mechanical polishing on surface nature of titanium implants FT-IR and wettability data of titanium implants surface after chemical mechanical polishing implementation. Data Brief 2017, 10, 20–25. [Google Scholar] [CrossRef]
  27. Vasilescu, C.; Drob, S.I.; Osiceanu, P.; Calderon-Moreno, J.M.; Predoana, M.; Ionita, D.; Demetrescu, I.; Marcu, M.; Popovici, I.A.; Vasilescu, E. Microstructure, Surface characterization and electrochemical behavior of new Ti-Zr-Ta-Ag alloy in simulated human electrolyte. Metall. Mater. Trans. A. /: 513-523, 1007. [Google Scholar] [CrossRef]
  28. dos Santos Monteiro, E.; de Souza Soares, M.F.; Fernandes Nunes, L.; Carvalho Santana, A.I. ; de Biasi,S.R.; Nelson Elias, C. Comparison of the wettability and corrosion resistance of two biomedical Ti alloys free of toxic elements with those of the commercial ASTM F136 (Ti-6Al-4V) alloy. J. Mater. Research Tech, 1632. [Google Scholar] [CrossRef]
  29. Pourbaix, M. Atlas of Electrochemical Equilibria in Aqueous Solutions, 2nd Ed. H: National Association of Corrosion, 1974. [Google Scholar]
  30. Cui, Y.-W.; Chen, L-Y. ; Chu, Y.-H.; Zhang, L.; Li, R.; Lu, S.; Wang, L.; Zhang, L.-C. Metastable pitting corrosion behavior and characteristics of passive film of laser powder bed fusion produced Ti–6Al–4V in NaCl solutions with different concentrations. Corros. Sci. 2023, 215, 111017. [Google Scholar] [CrossRef]
  31. ISO 8044/2020; Corrosion of metals and alloys — Basic terms and definitions. ISO: Geneva, Switzerland, 2020.
  32. Burnat, B.; Walkowiak-Przybylo, M.; Blaszczyk, T.; Klimek, L. Corrosion behaviour of polished and sandblasted titanium alloys in PBS solution. Acta Bioeng. Biomech. 2013, 15, 87–95. [Google Scholar] [CrossRef] [PubMed]
  33. Tamilselvi, S.; Rajendran, N. In vitro corrosion behaviour of Ti-5Al-2Nb-1Ta alloy in Hank’s solution. Mater. Corros. 2007, 58, 285–289. [Google Scholar] [CrossRef]
  34. Frauchiger, T.; Taborelli, M.; Aronsson, B.-O.; Descouts, P. Ion adsorption on titanium surfaces exposed to a physiological solution. Appl. Surf. Sci. 1999, 143, 67–77. [Google Scholar] [CrossRef]
  35. Szesz, E.M.; de Souza, G.B.; de Lima, G.G.; da Silva, B.A.; Kuromoto, N.K.; Lepienski, C.M. Improved tribo-mechanical behavior of CaP-containing TiO2 layers produced on titanium by shot blasting and micro-arc oxidation. J. Mater. Sci.: Mater. Med. 2014, 25, 2265–2275. [Google Scholar] [CrossRef] [PubMed]
  36. Liu, M. ; Zhu, J-N.; Popovich, V.A.; Borisov, E.; Mol, J.M.C.; Gonzalez-Garcia, Y. Passive film formation and corrosion resistance of laser-powder bed fusion fabricated NiTi shape memory alloys. J. Mater. Res. Technol. 2991. [Google Scholar] [CrossRef]
  37. Sotniczuk, A.; Gilbert, J.L.; Liu, Y.; Matczuk, M.; Chrominski, W.; Kalita, D.; Pisarek, M.; Gerbacz, H. Corrosion resistance of β-phase titanium alloys under simulated inflammatory conditions: Exploring the relevance of biocompatible alloying elements. Corros. Sci. 2023, 220, 111271. [Google Scholar] [CrossRef]
  38. Feng, H.; Dai, J.; Li, H.-B.; Jiang, Z.-H.; Qu, J.-D.; Zhao, Y.; Zhang, S.-C.; Zhang, T. Sn microalloying enhances corrosion resistance of stainless steel by accelerating heterogeneous nucleation of passive film. Corros. Sci. 2022, 201, 10279. [Google Scholar] [CrossRef]
  39. Gudic, S.; Vrsalović, L.; Kvrgić, D.; Nagode, A. Electrochemical Behaviour of Ti and Ti-6Al-4V Alloy in Phosphate Buffered Saline Solution. Materials 2021, 14, 7495. [Google Scholar] [CrossRef]
  40. Vergara-Hernández, H.J.; Olmos, L.; Solorio, V.M.; Bouvard, D.; Villalobos-Brito, J.; Chávez, J.; Jimenez, O. Powder Metallurgy Fabrication and Characterization of Ti6Al4V/xCu Alloys for Biomedical Applications. Metals 2023, 13(5), 888. [Google Scholar] [CrossRef]
  41. Kumar, P.; Mahobia, G.S.; Mandal, S.; Singh, V.; Chattopadhyay, K. Enhanced corrosion resistance of the surface modified Ti-13Nb-13Zr alloy by ultrasonic shot peening. Corros. Sci. 2021, 189, 09597. [Google Scholar] [CrossRef]
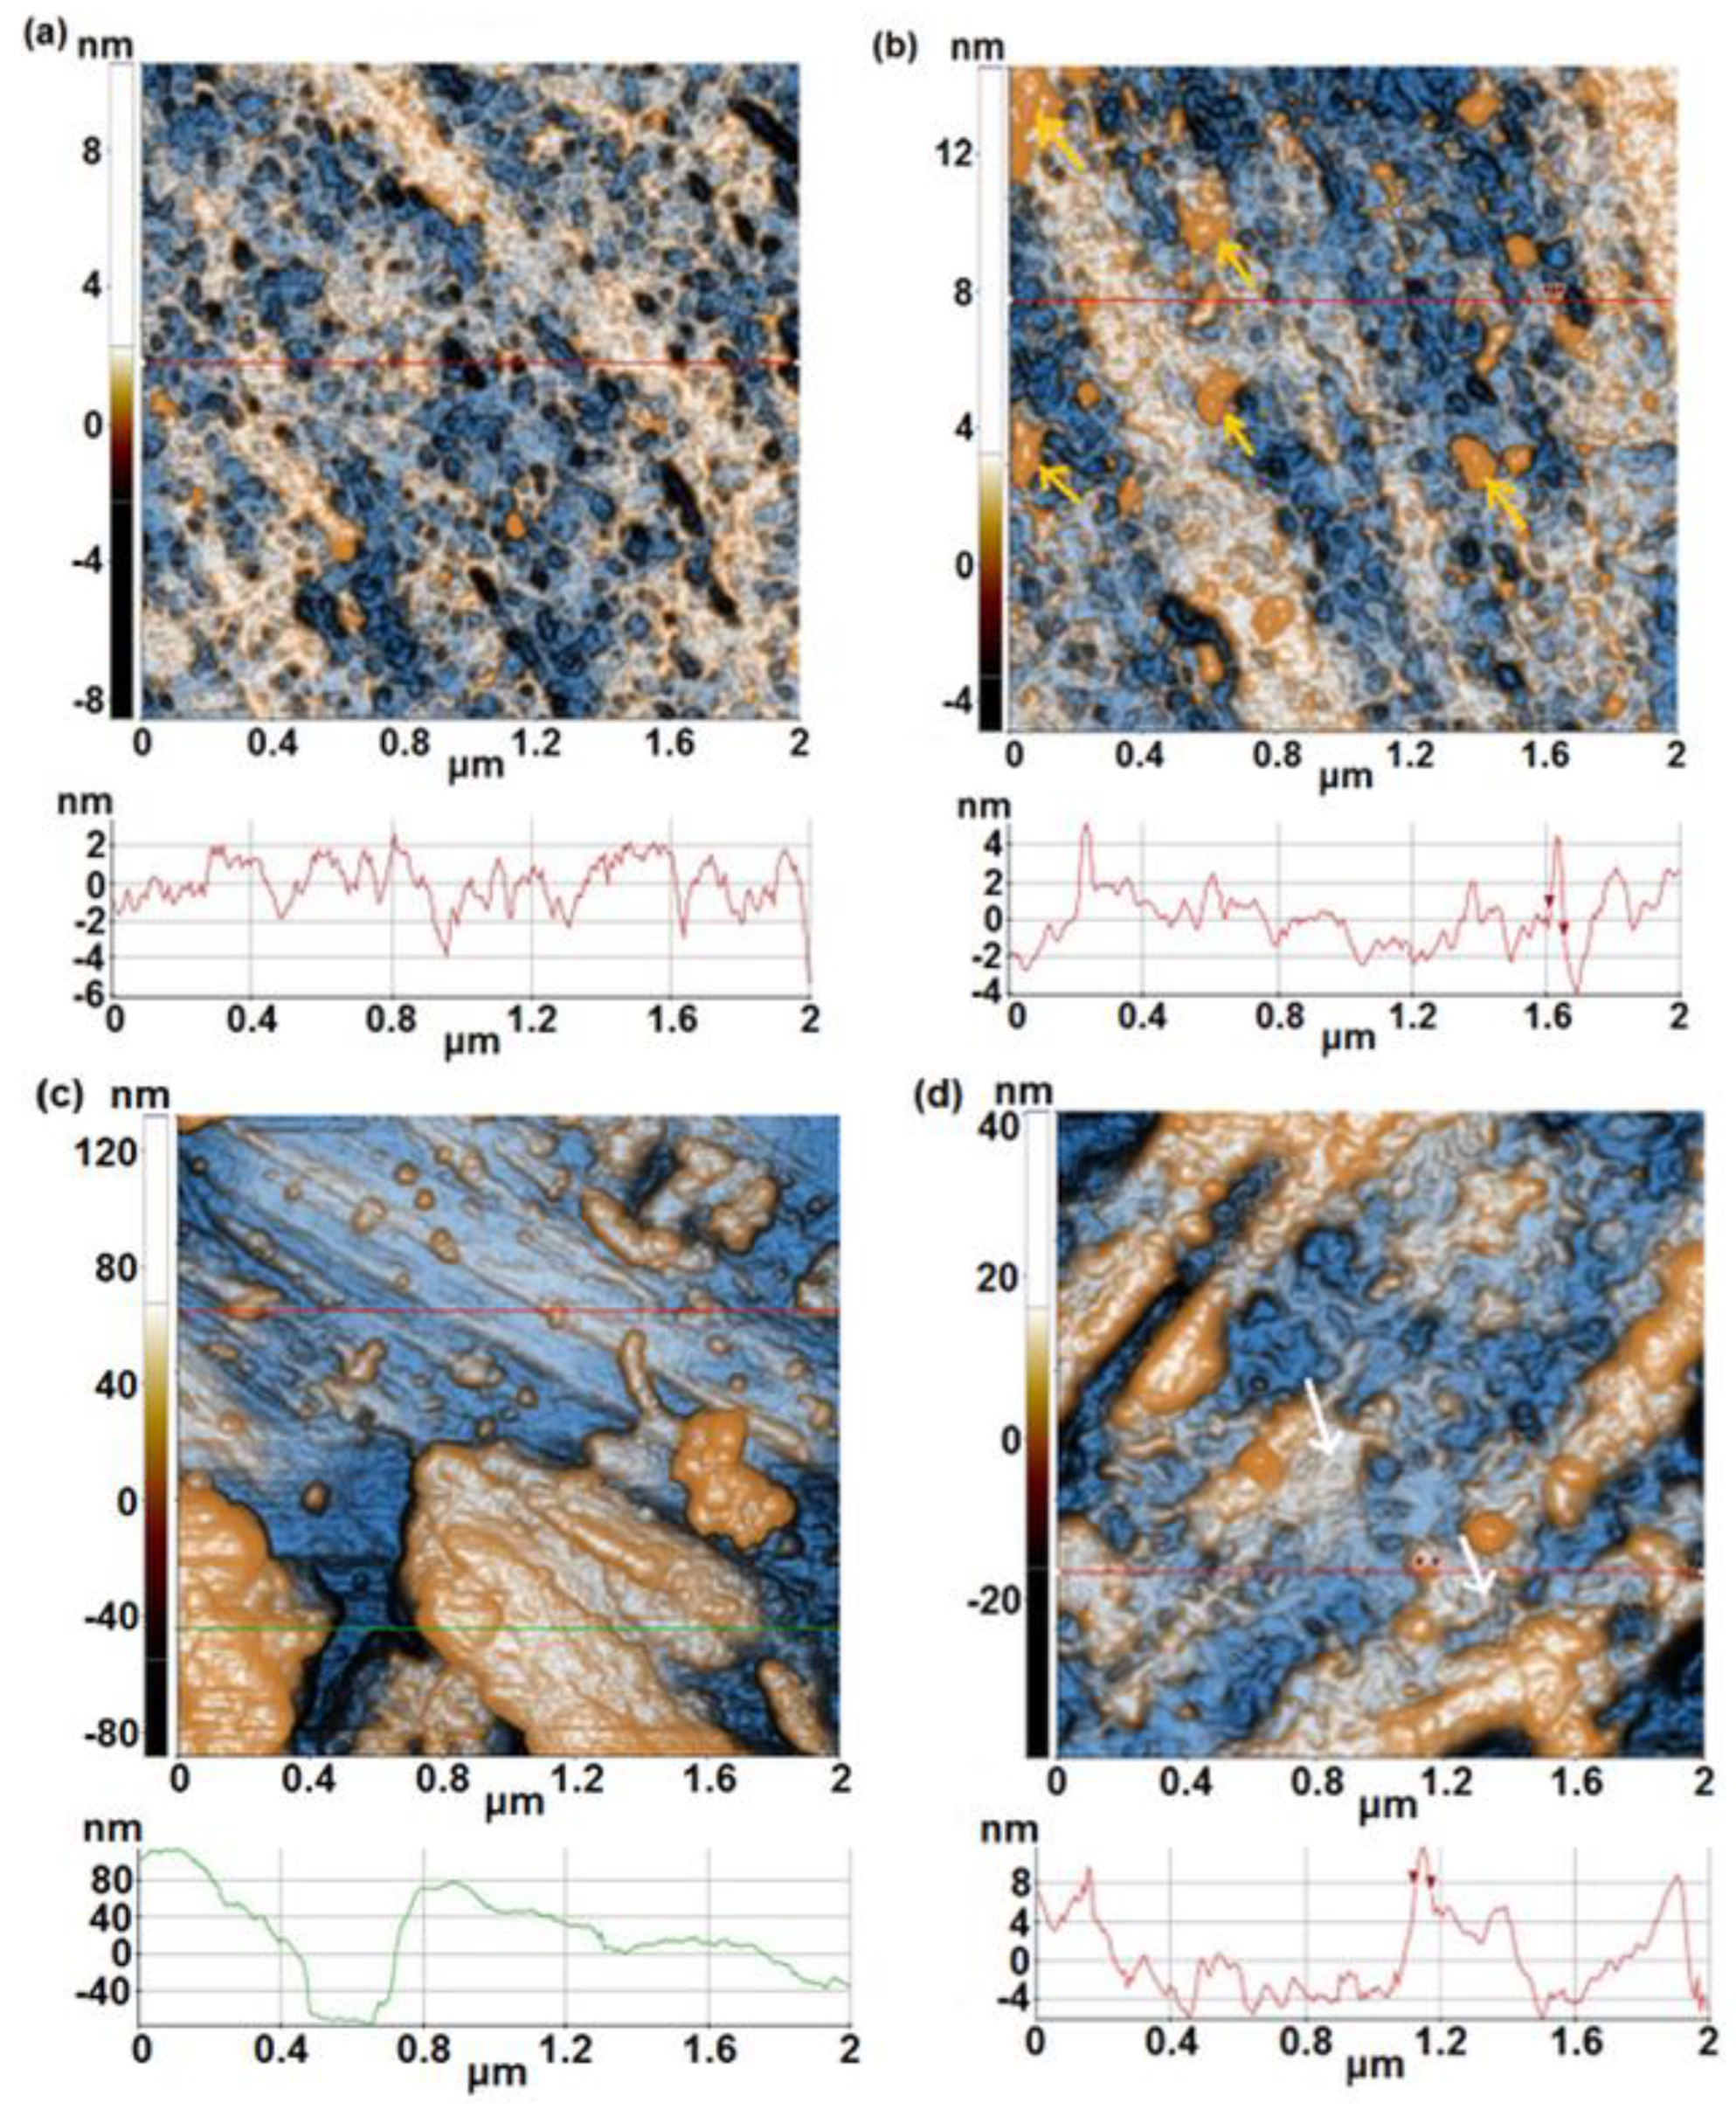
Figure 1. 2D enhanced-contrast AFM images (topography) recorded at the scale of (2µm x 2µm) for the sample 1A (polished) (first row), before (a) and after 1000 h immersion in PBS solution (b); 2D (enhanced-contrast) AFM images (topography) recorded at the scale of (2µm x 2µm) for the sample 1B (raw, unpolished) (second row), before (c) and after 1000 h immersion in PBS solution (d). Random line-scans (surface profiles) characteristic for each sample are plotted below each AFM image.
Preprints 118361 g001
Figure 2. 2D (enhanced-contrast) AFM images (topography) recorded at the scale of (2µm x 2µm) for the sample 3A (first row), before (a) and after 1000 h immersion in PBS solution (b); 2D (enhanced-contrast) AFM images (topography) recorded at the scale of (2µm x 2µm) for sample 3B (second row), before (c) and after 1000 h immersion in PBS solution (d). Random line-scans (surface profiles) characteristic for each sample are plotted below each AFM image.
Preprints 118361 g002
Figure 3. 2D (enhanced-contrast) AFM images (topography) recorded at the scale of (2µm x 2µm) for the sample 5A (first row), before (a) and after 1000 h immersion in PBS solution (b); 2D (enhanced-contrast) AFM images (topography) recorded at the scale of (2µm x 2µm) for sample 5B (second row), before (c) and after 1000 h immersion in PBS solution (d). Random line-scans (surface profiles) characteristic for each sample are plotted below each AFM image.
Preprints 118361 g003
Figure 4. Corrugation parameters: RMS roughness (a) and Peak-to-Valley (b) for the samples in initial stage (before) and after 1000 h immersion in PBS.
Preprints 118361 g004
Figure 5. OCP evolution of 1A, 3A, 5A, 1B, 3B and 5B samples in PBS solution during 1000 hours of immersion at 37ºC.
Preprints 118361 g005
Figure 6. The potentiodynamic (a) and Tafel curves (b) of 1A, 3A, 5A, 1B, 3B and 5B samples after 1000 h of immersion in PBS solution at 37ºC.
Preprints 118361 g006
Figure 7. Long time evolution of corrosion potential (a) and (b), corrosion rate (c) and (d) and polarization resistance (e) and (f) of all samples in PBS solution at 37°C.
Preprints 118361 g007aPreprints 118361 g007b
Figure 8. Nyquist plots of 1A, 3A, 5A samples (a), 1B, 3B and 5B (b) samples after 1000 hours of immersion in PBS at 37°C. In set: Electric equivalent circuit.
Preprints 118361 g008
Table 1. Nominal chemical composition (% wt.) of the main components of the tested alloys.
Alloy Sample % Ti % Ta % Nb % Zr % Ag Surface
Ti20Ta9Nb8Zr2Ag 1A Balance 20.02±0.64 9.01±0.16 7.88±0.17 1.92±0.08 smooth
Ti20Ta9Nb8Zr2Ag 1B Balance 20.02±0.64 9.01±0.16 7.88±0.17 1.92±0.08 rough
Ti10Ta9Nb8Zr2Ag 3A Balance 8.94±0.36 10.20±0.68 7.95±0.28 1.91±0.09 smooth
Ti10Ta9Nb8Zr2Ag 3B Balance 8.94±0.36 10.20±0.68 7.95±0.28 1.91±0.09 rough
Ti9Nb8Zr2Ag 5A Balance 0.0 9.22±0.41 8.28±0.19 1.86±0.16 smooth
Ti9Nb8Zr2Ag 5B Balance 0.0 9.22±0.41 8.28±0.19 1.86±0.16 rough
Table 2. The contact angle and surface free energy (SFE) values performed before and after1000 hours of immersion in PBS solution at 37°C.
Sample θ [ o ]
(Before
immersion)
θ [ o ]
(After
immersion)
SFE [mN/m]
(Before
immersion)
SFE [mN/m]
(After
immersion)
1A 74.3±2.09 62.6±3.65 38.68±0.89 45.87±2.21
1B 71.6±1.52 54.3±2.82 40.35±0.94 50.84±1.66
3A 67.2±0.48 49.1±3.95 43.07±0.29 53.93±2.27
3B 66.7±2.65 73.4±4.19 43.37±1.62 39.24±0.26
5A 86.2±4.22 70.8±4.12 31.27±2.63 40.85±2.54
5B 82.5±2.49 67.3±5.49 33.58±1.55 43.00±3.37
Table 3. Corrosion parameters of TixTa9Nb8Zr2Ag alloys after 1000 hours of immersion in PBS at 37°C.
Sample Ecor,
mV
Jcor,
nA cm-2
Rcor,
µm y-1
Rp,
kΩ cm2
Δ Epass,
V
1A -33 ± 1 17.2 ± 0.02 0.21± 0.01 1160 ± 2.5 2.4 ± 0.05
1B 43 ± 2 107 ± 0.15 1.35 ± 0.1 257 ± 1.0 -
3A -97 ± 5 53 ± 0.11 0.6 ± 0.05 456 ± 1.5 2.05 ± 0.02
3B 44 ± 2 228 ± 0.24 3.01 ± 0.25 305 ± 1.5 2.04 ± 0.02
5A -98 ± 5 134 ± 0.18 2.1± 0.2 151 ± 1.0 1.65 ± 0.01
5B -169 ± 5 68.6 ± 0.15 1.55 ± 0.1 899 ± 2.0 1.62 ± 0.01
Disclaimer/Publisher’s Note: The statements, opinions and data contained in all publications are solely those of the individual author(s) and contributor(s) and not of MDPI and/or the editor(s). MDPI and/or the editor(s) disclaim responsibility for any injury to people or property resulting from any ideas, methods, instructions or products referred to in the content.
Copyright: This open access article is published under a Creative Commons CC BY 4.0 license, which permit the free download, distribution, and reuse, provided that the author and preprint are cited in any reuse.
Prerpints.org logo

Preprints.org is a free preprint server supported by MDPI in Basel, Switzerland.

Subscribe

© 2024 MDPI (Basel, Switzerland) unless otherwise stated