1. Introduction
Stroke represents a significant global health challenge, affecting over 15 million individuals each year. The World Health Organization highlighted stroke as the second leading cause of mortality in 2016 [
1]. Furthermore, stroke is the third most common cause of disability as it induces widespread disabilities with lasting impairments in two-thirds of stroke survivors [
2]. Such disabilities severely diminish life quality and hinder everyday activities (e.g., eating, walking, dressing, and object manipulation). Effective recovery necessitates timely rehabilitation within 24–48 hours post-stroke [
3,
4], and precise physiological assessment tools are indispensable in this process. Rehabilitation strategies must focus on safety to avert muscle atrophy, fiber length reduction, and increased tendon compliance [
5].
Recent advancements in rehabilitation have introduced various technologies, including robot-assisted systems, virtual reality (VR), and electrical stimulation interventions [
6,
7,
8]. Notably, VR represents a digitally controlled environment that has gained popularity in stroke rehabilitation due to its ability to create engaging and meaningful therapeutic settings. VR-based rehabilitation offers several advantages over traditional methods, such as enabling the practice of real-world tasks and enhancing patient adherence. Various commercial VR systems, including Kinect Xbox One, equipped with advanced infrared sensors and cameras, have been successfully adapted for stroke rehabilitation. These systems provide accurate 3D body movement tracking without the need for extra equipment, making them a promising tool for upper limb rehabilitation [
9,
10,
11,
12,
13,
17,
18]. Despite these advancements, conventional rehabilitation methods remain tedious and time-consuming, often leading to poor patient adherence. Even modern approaches, such as VR and robot-assisted rehabilitation, face challenges in terms of complexity and cost, limiting their broader application. Game-based VR rehabilitation has shown promise in overcoming these limitations by providing the required exercise intensity through structured and engaging activities [
14,
15]. However, many existing systems utilize random games and functional movements that may not be ideally suited for specific rehabilitation goals [
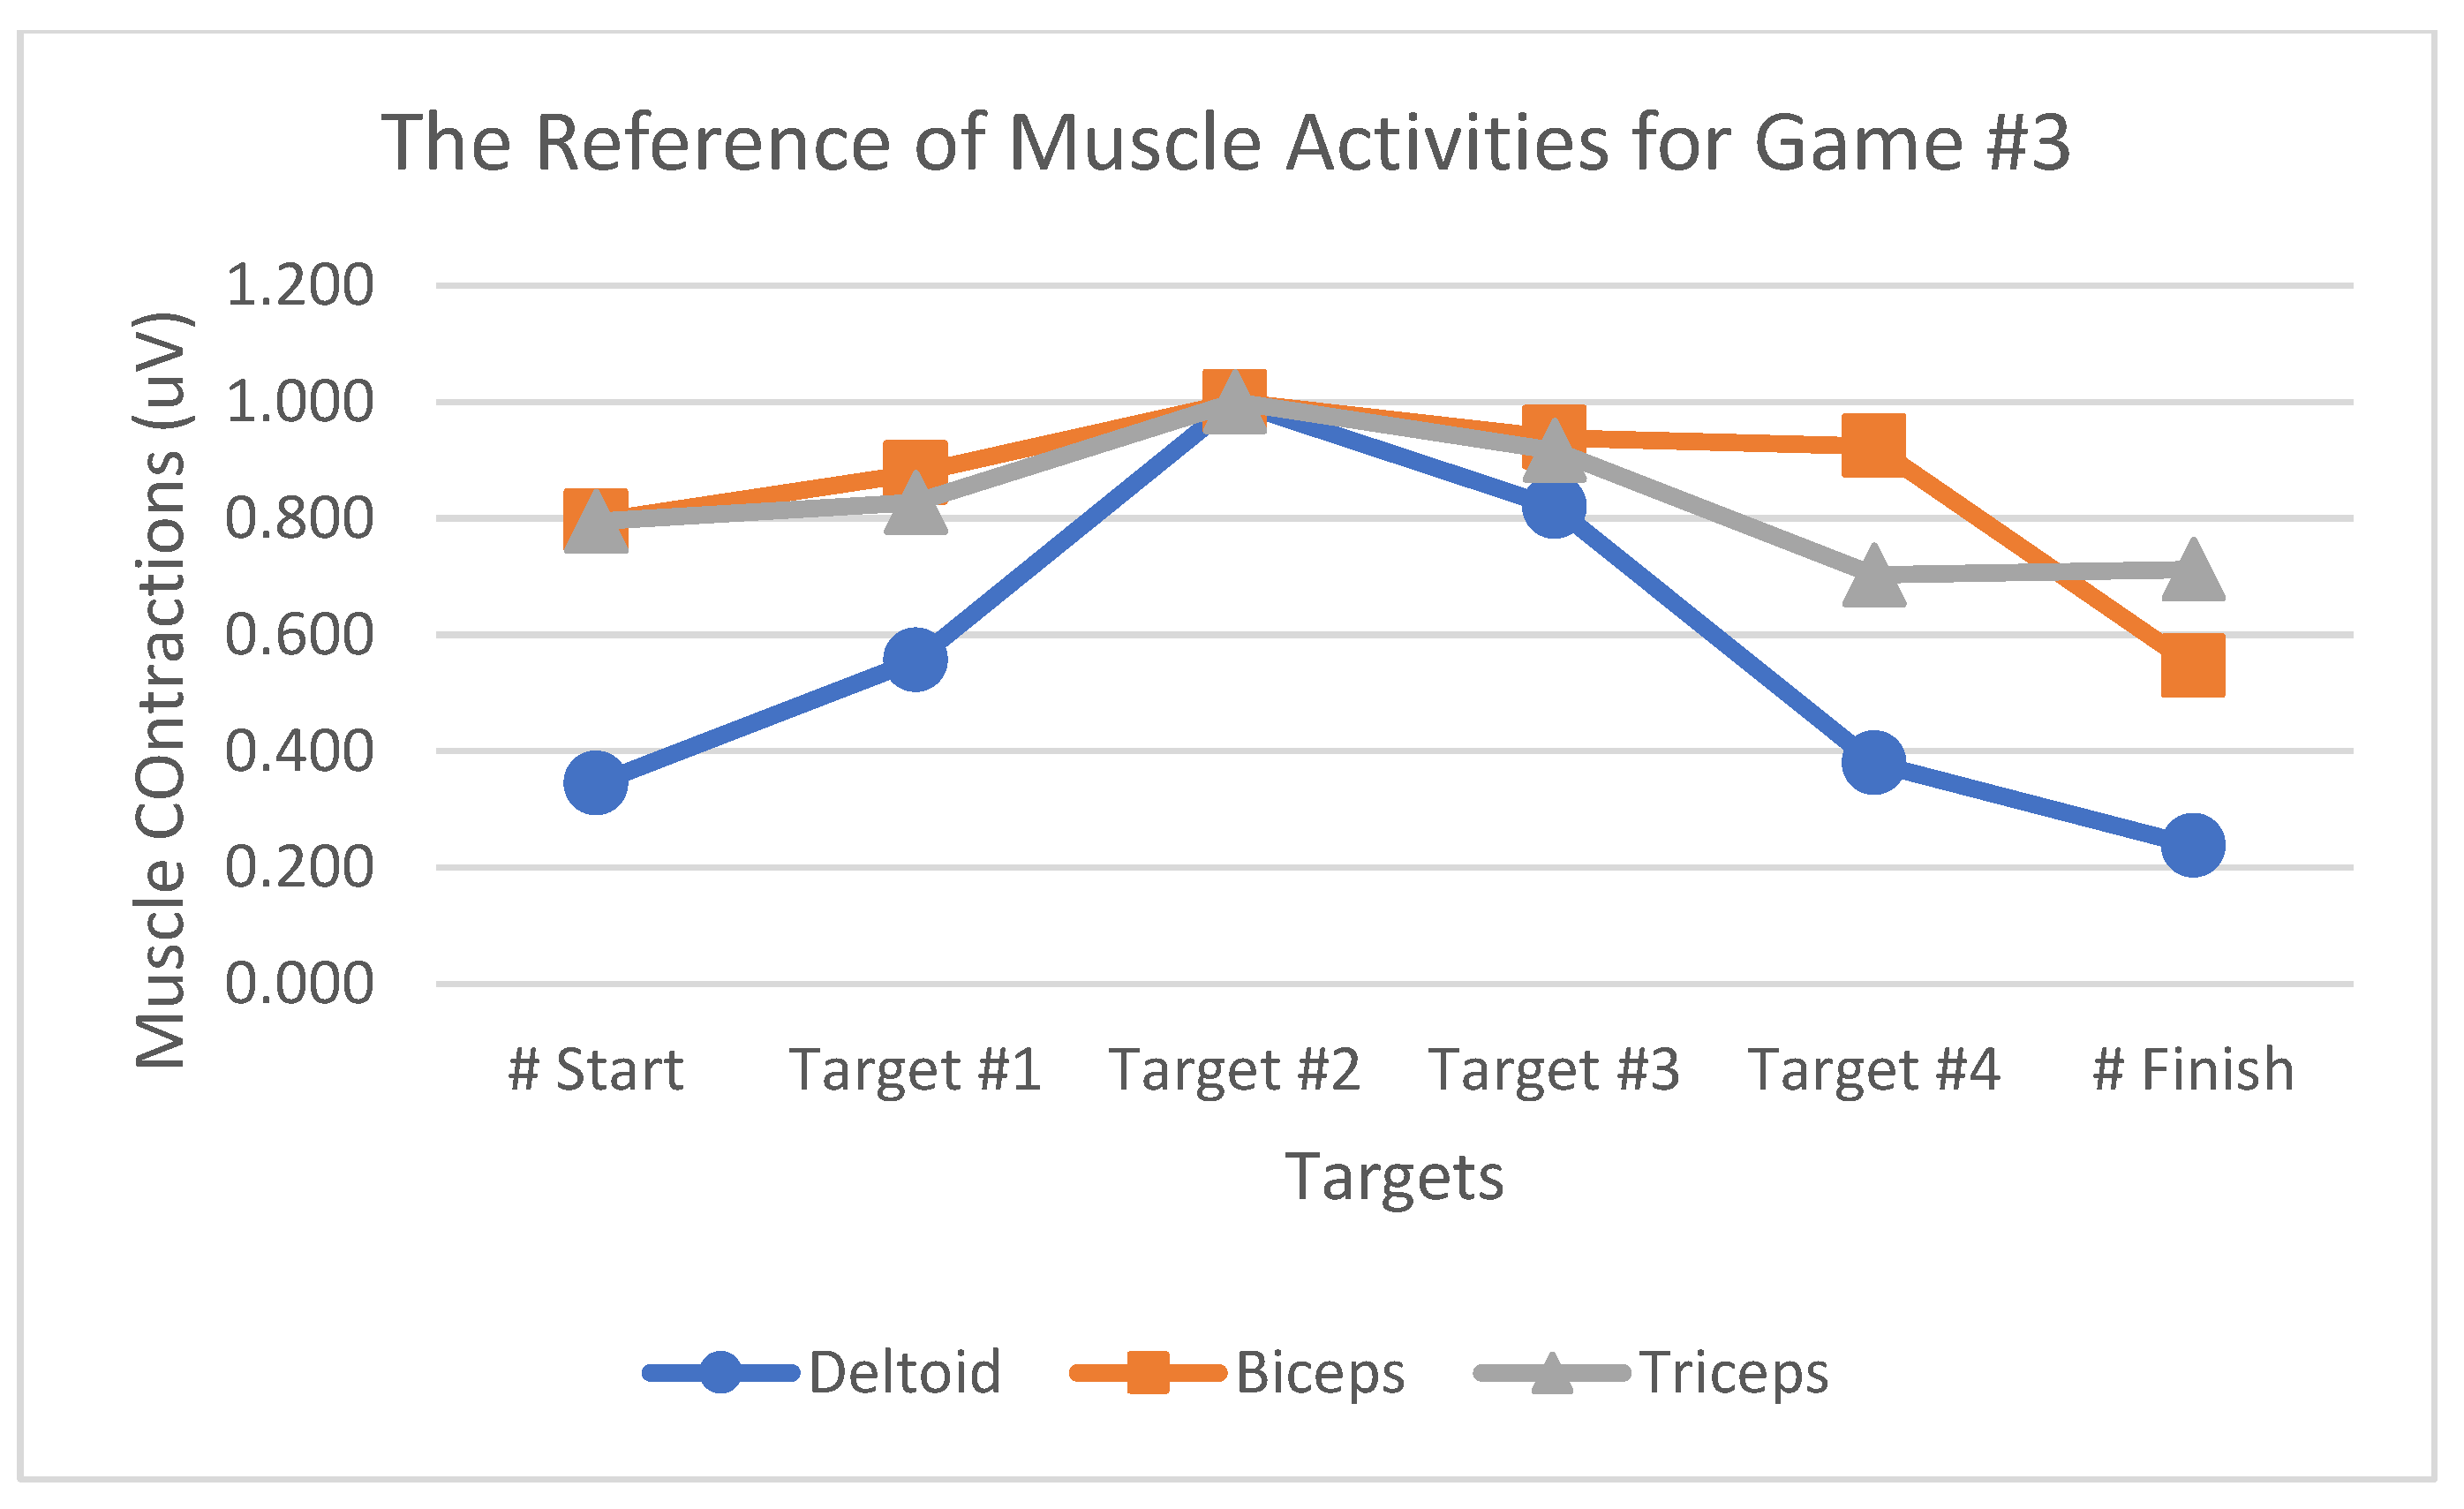
16].
This study aims to address these challenges by exploring the integration of electromyography (EMG) monitoring within a non-immersive VR-based rehabilitation system. The rationale for focusing on Activities of Daily Living (ADLs) in this context is their direct relevance to the essential tasks that stroke survivors must relearn to regain independence. Additionally, the choice of specific muscles for monitoring was guided by their critical role in executing these daily activities, making them key targets for rehabilitation. EMG is a valuable tool in this regard, as it allows for the detection and recording of muscle activity during therapeutic exercises. The methodology for EMG signal processing in this study includes normalization and noise filtering, ensuring that the data obtained is accurate and reliable. By applying windowing and peak-to-peak detection methods, we aim to identify muscle contractions during upper limb movements within the VR games, thereby providing real-time feedback on patient progress. The non-immersive VR environment was developed using the UNITY game engine, selected for its accessibility and cost-effectiveness, as it does not require specialized hardware such as head-mounted displays. The Kinect sensor was employed for motion capture, offering precise tracking of upper limb movements to facilitate the design of structured rehabilitation exercises. A pre-experiment was conducted to determine the optimal distance between the Kinect sensor and participants, establishing 150 cm as the ideal distance for minimizing deviation [
19,
20].
This study explores the potential of combining EMG monitoring with non-immersive VR-based rehabilitation to enhance upper limb recovery post-stroke. By focusing on carefully designed movement sequences and leveraging affordable technology, this approach aims to provide a novel and effective solution that addresses the limitations of traditional rehabilitation methods while promoting patient engagement and motivation.
2. Materials and Methods
2.1. VR Environment
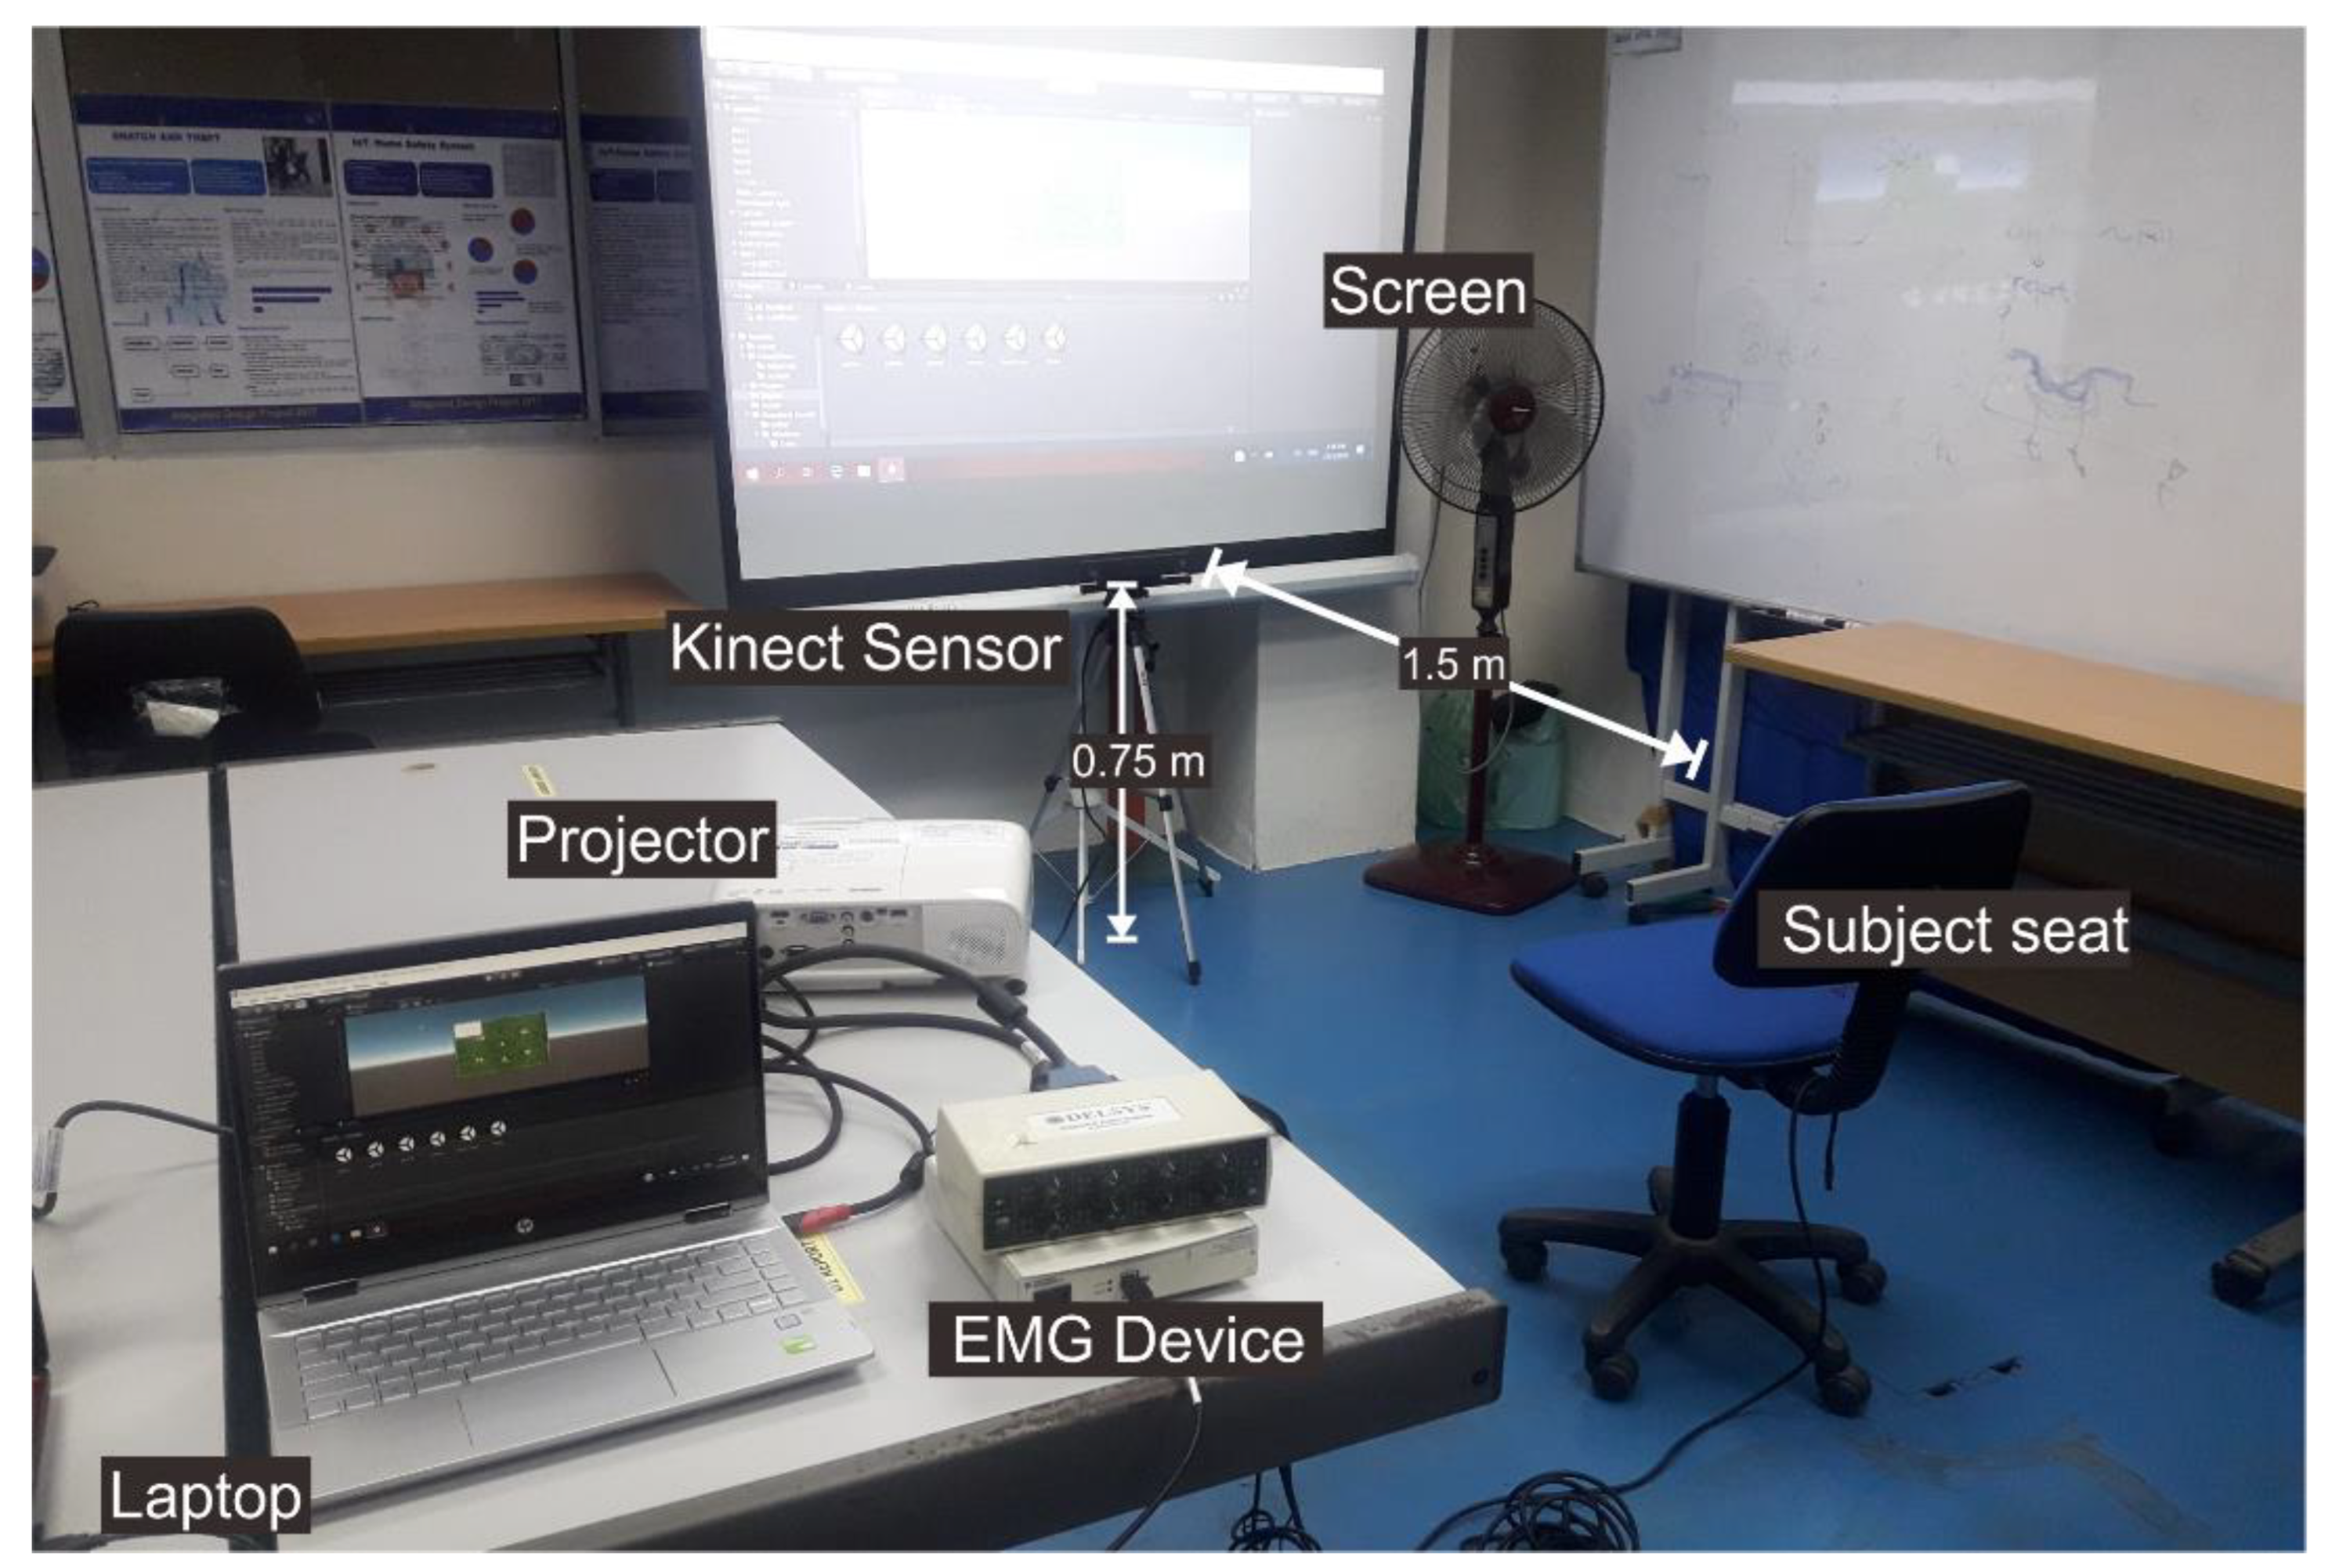
The upper limb movement sequence-related VR games were designed using the UNITY game engine software and applying the nonimmersive VR method. Upon the nonimmersive VR advantages, the graphics performance does not have to reach the highest level, no specialized hardware is required (e.g., a head-mounted display (HMD)), it is low cost, and could be used for various applications. A Kinect sensor refers to a motion sensor capable of detecting the movements of the human body [
21]. Usually, this sensor replaces the game controller. The VR game is displayed in a wide range of views using a projector to enhance the immersion experience. The audio system provides sound feedback to the user, including both the relaxation audio and the sound created by the VR game. A pre-experiment was performed to explore the best distance between the Kinect sensor and the participant, yielding 150 cm as the optimal distance, which results in small deviation values [
22,
23].
Figure 1 presents the established VR environment.
2.2. Design Movement Sequence
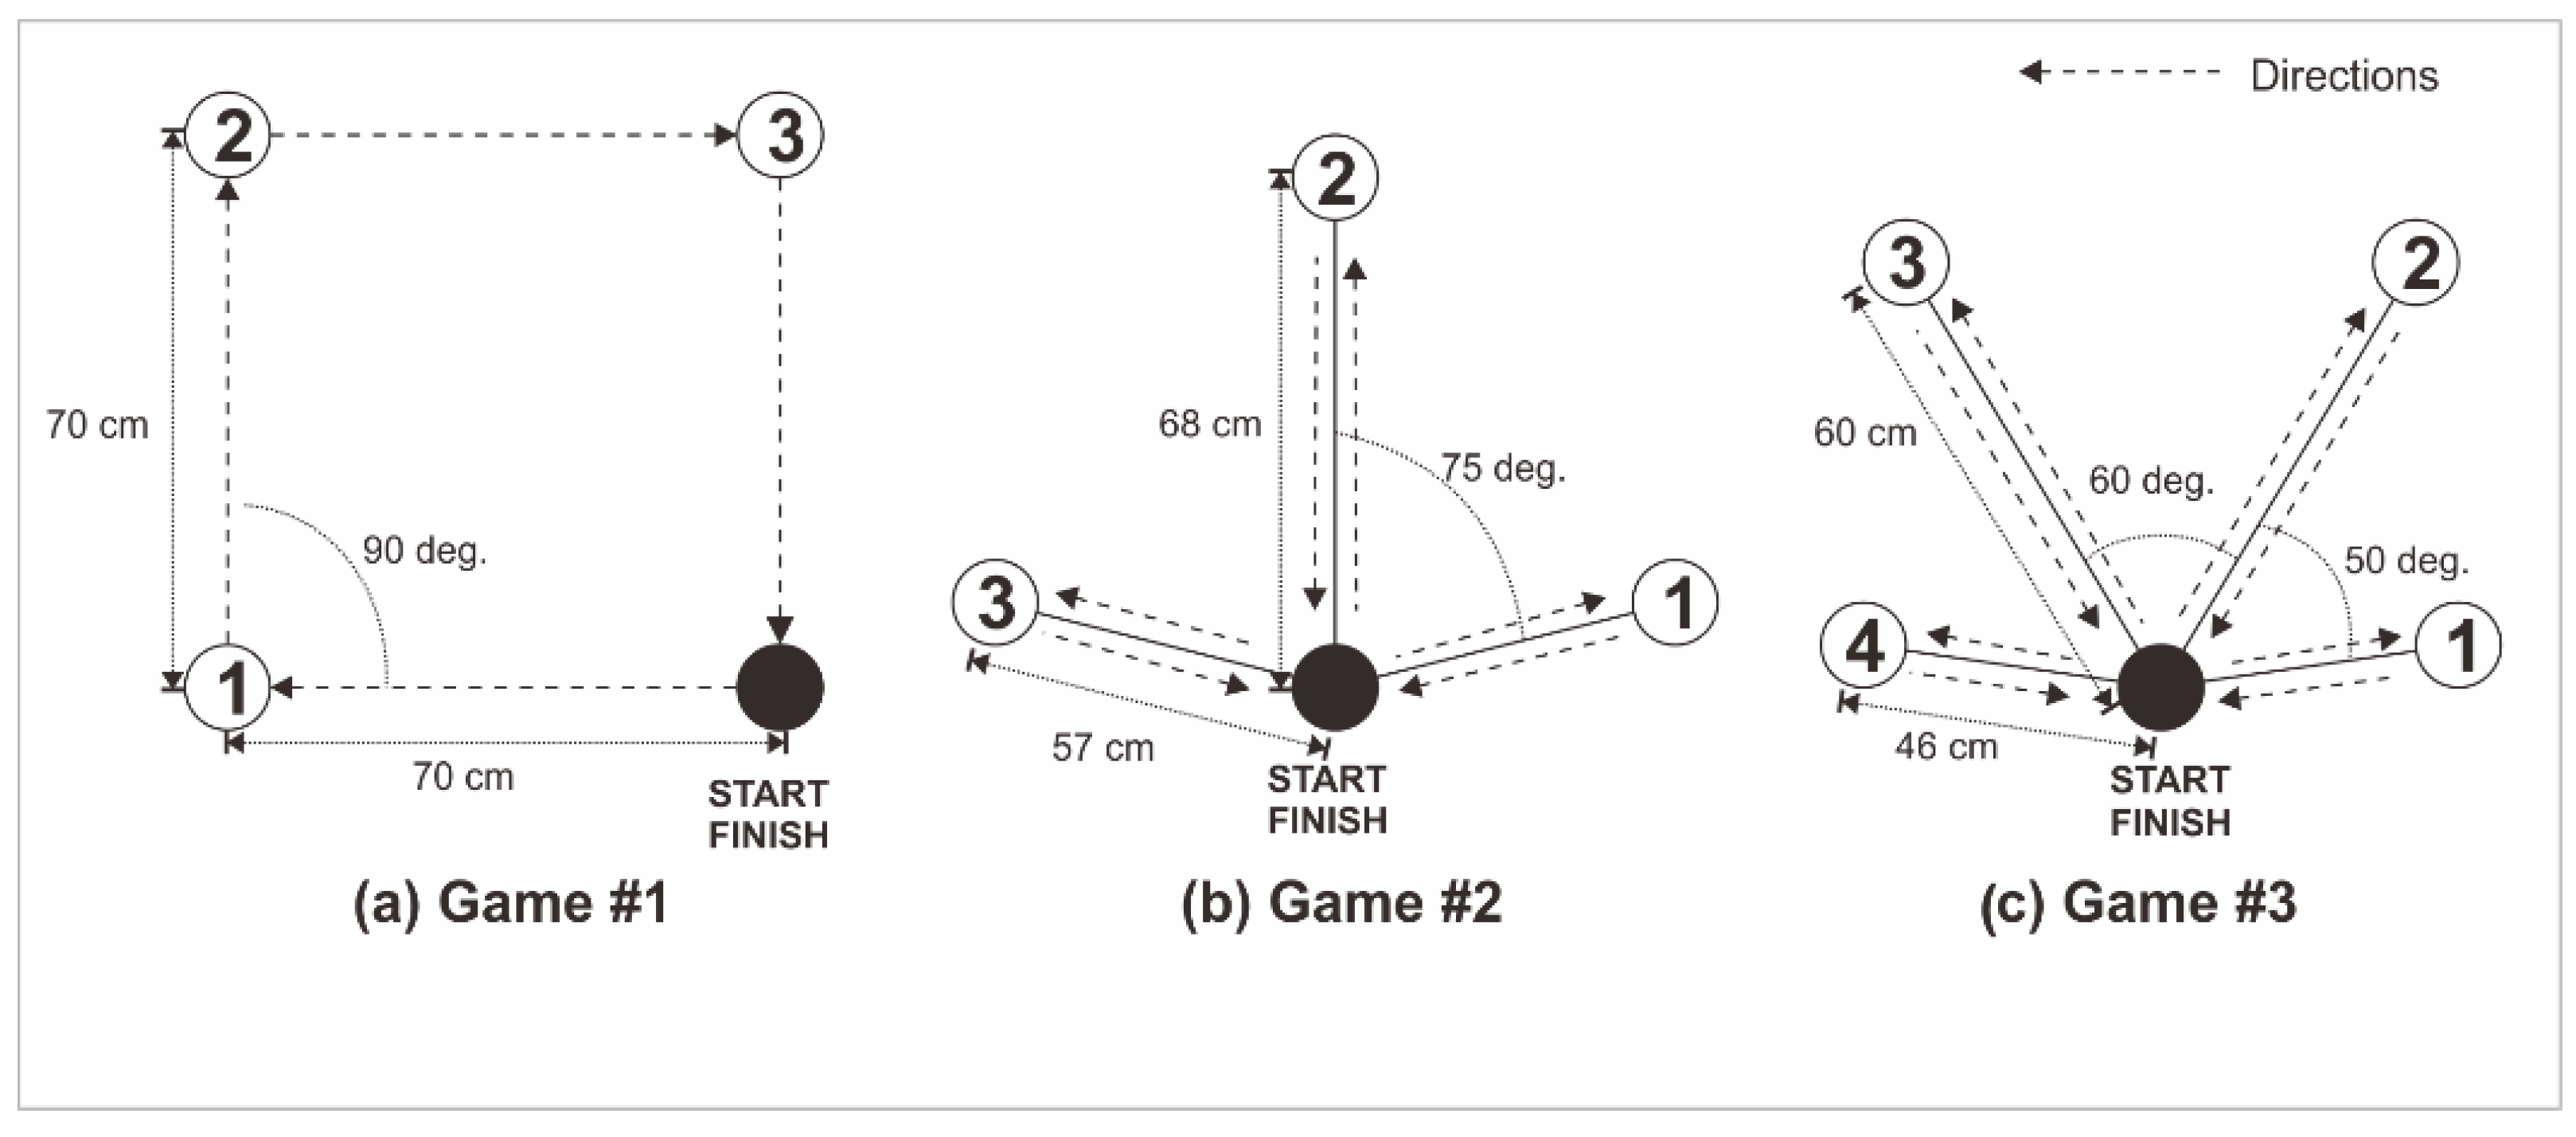
We designed and selected three movement sequences, including one square shape and two reaching target movements.
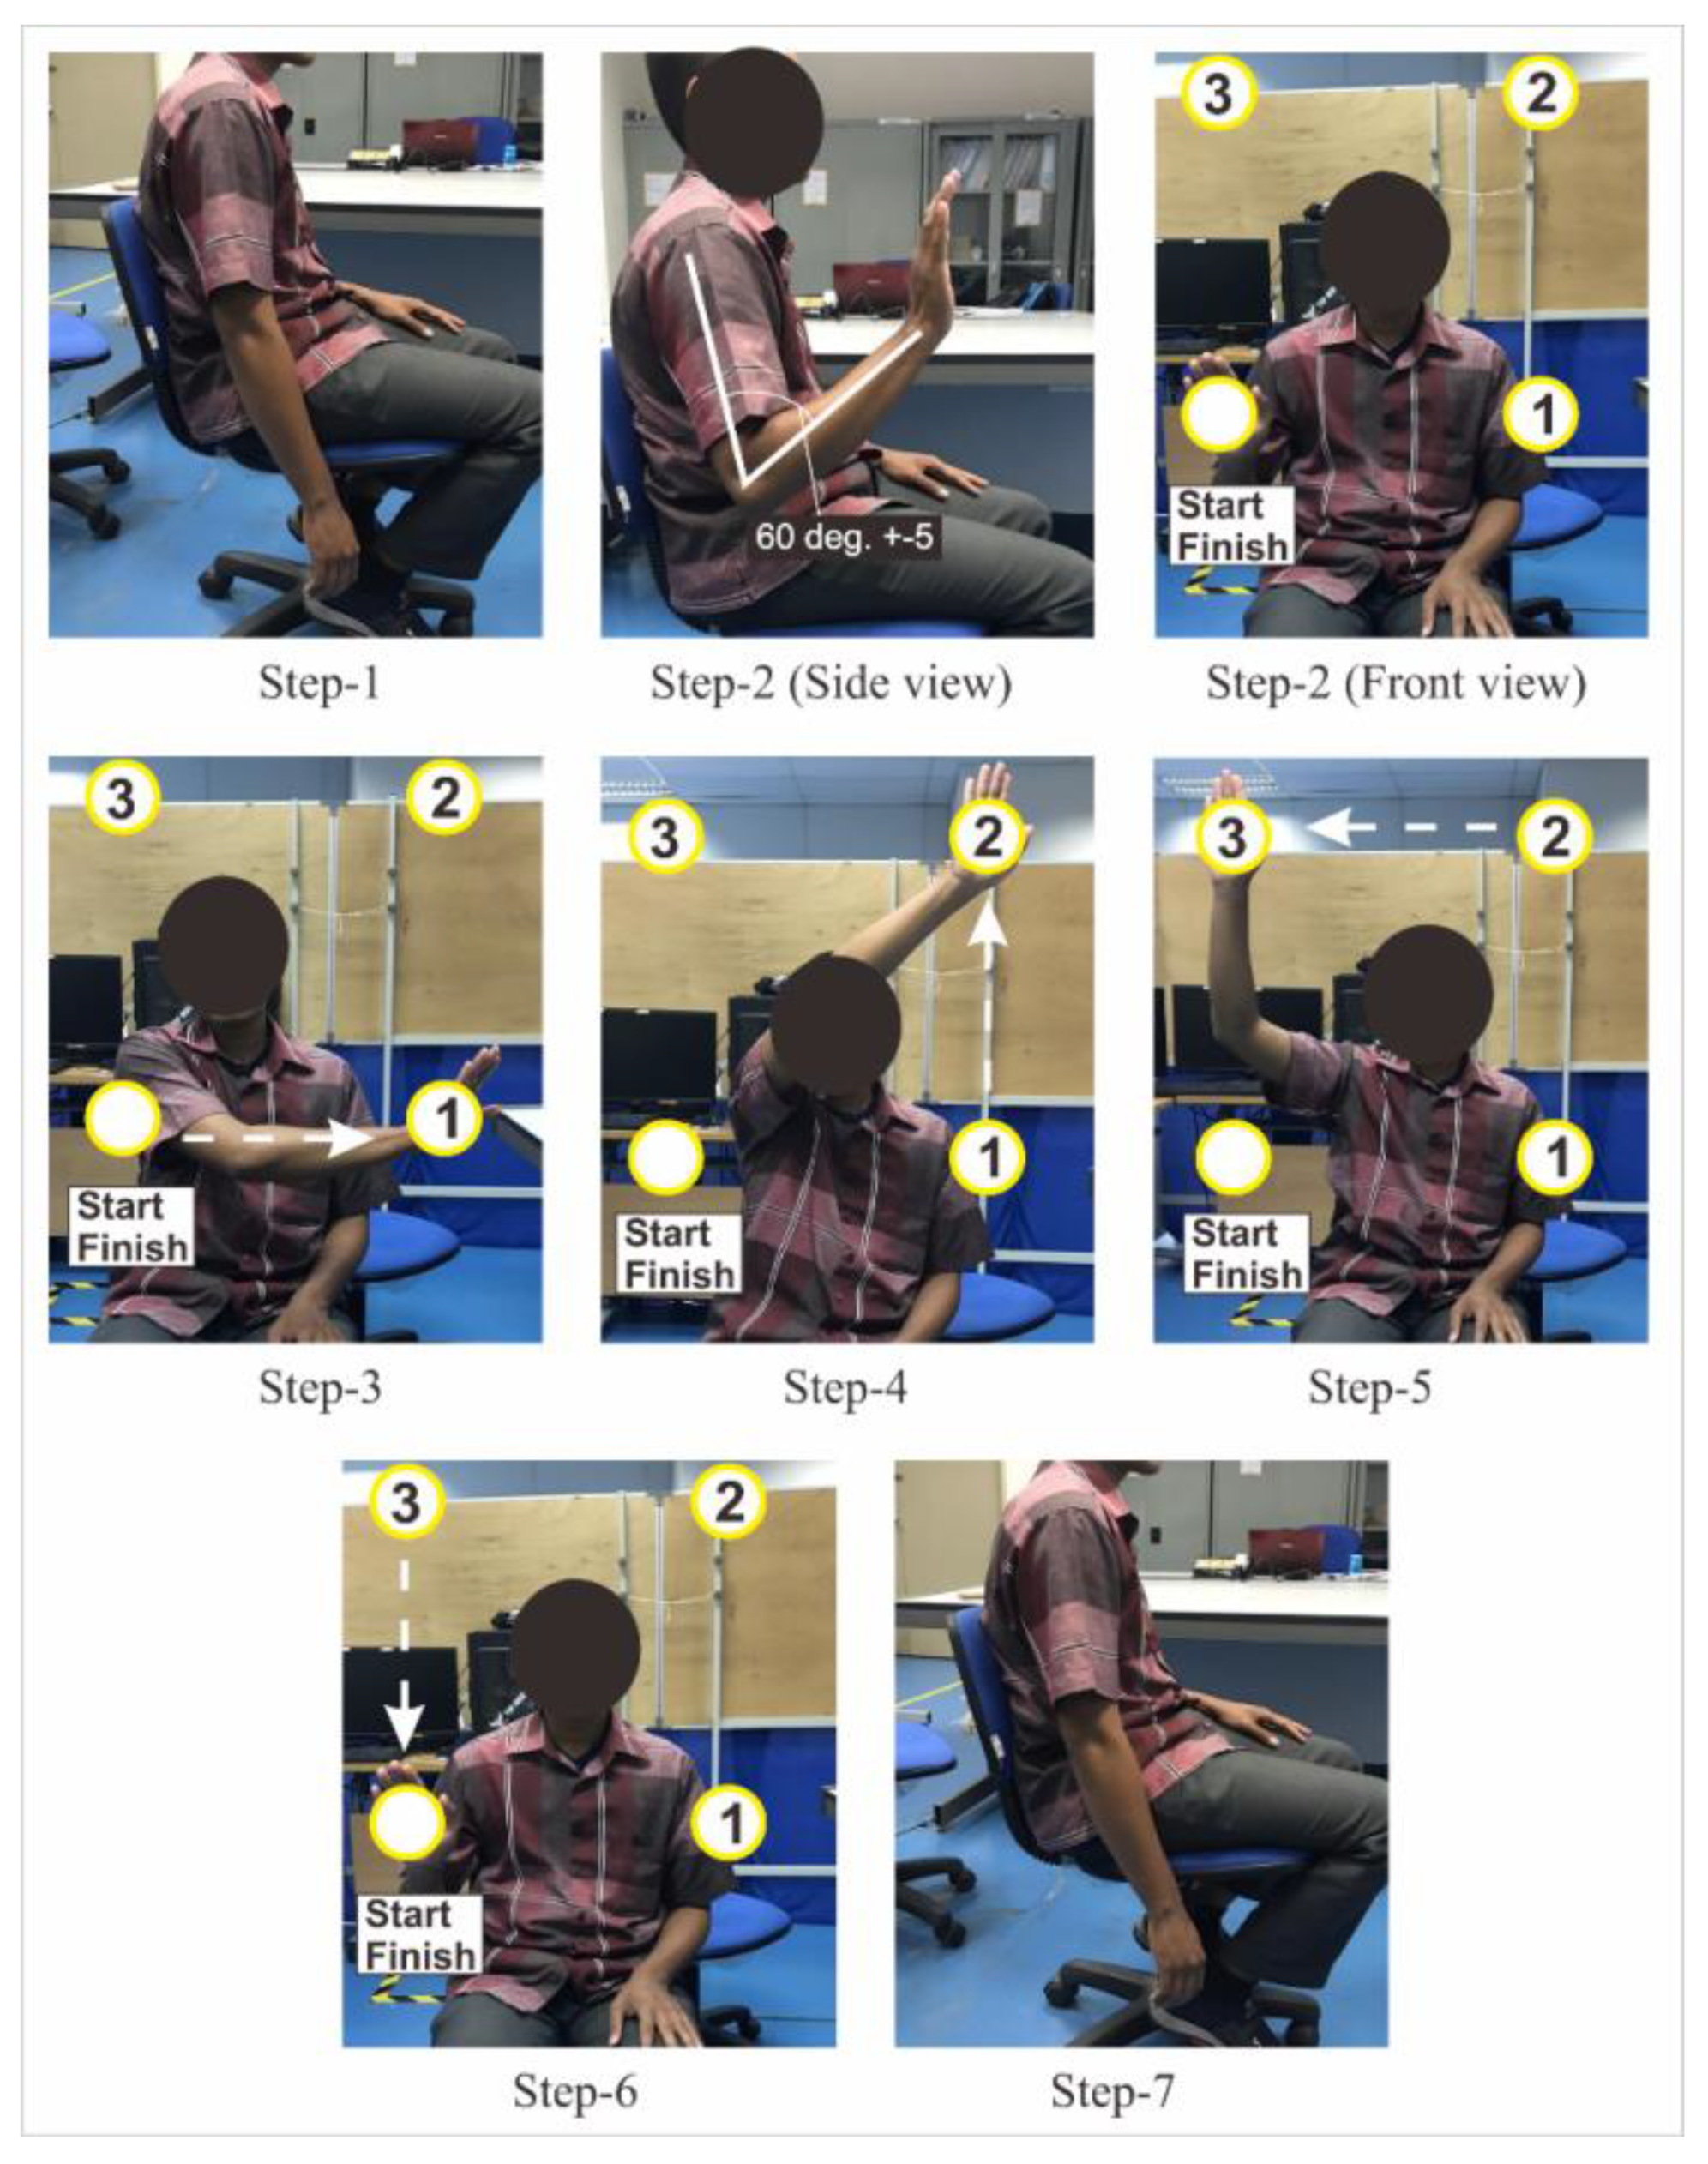
Figure 2 summarizes the movement sequence design for the square shape and reaching target movements. Game #1 was based on a square shape movement (
Figure 3), which was adapted from the geometrical shape movement, and comprised four target movements. Movements from the starting point to target #1 and from target #2 to target #3 were horizontal. Conversely, movements from target #1 to target #2 and target #3 to final point were vertical. The distance between all target points was 70 cm. Before starting and after finishing the movement, the arm was kept in a relaxing position for 5 seconds.
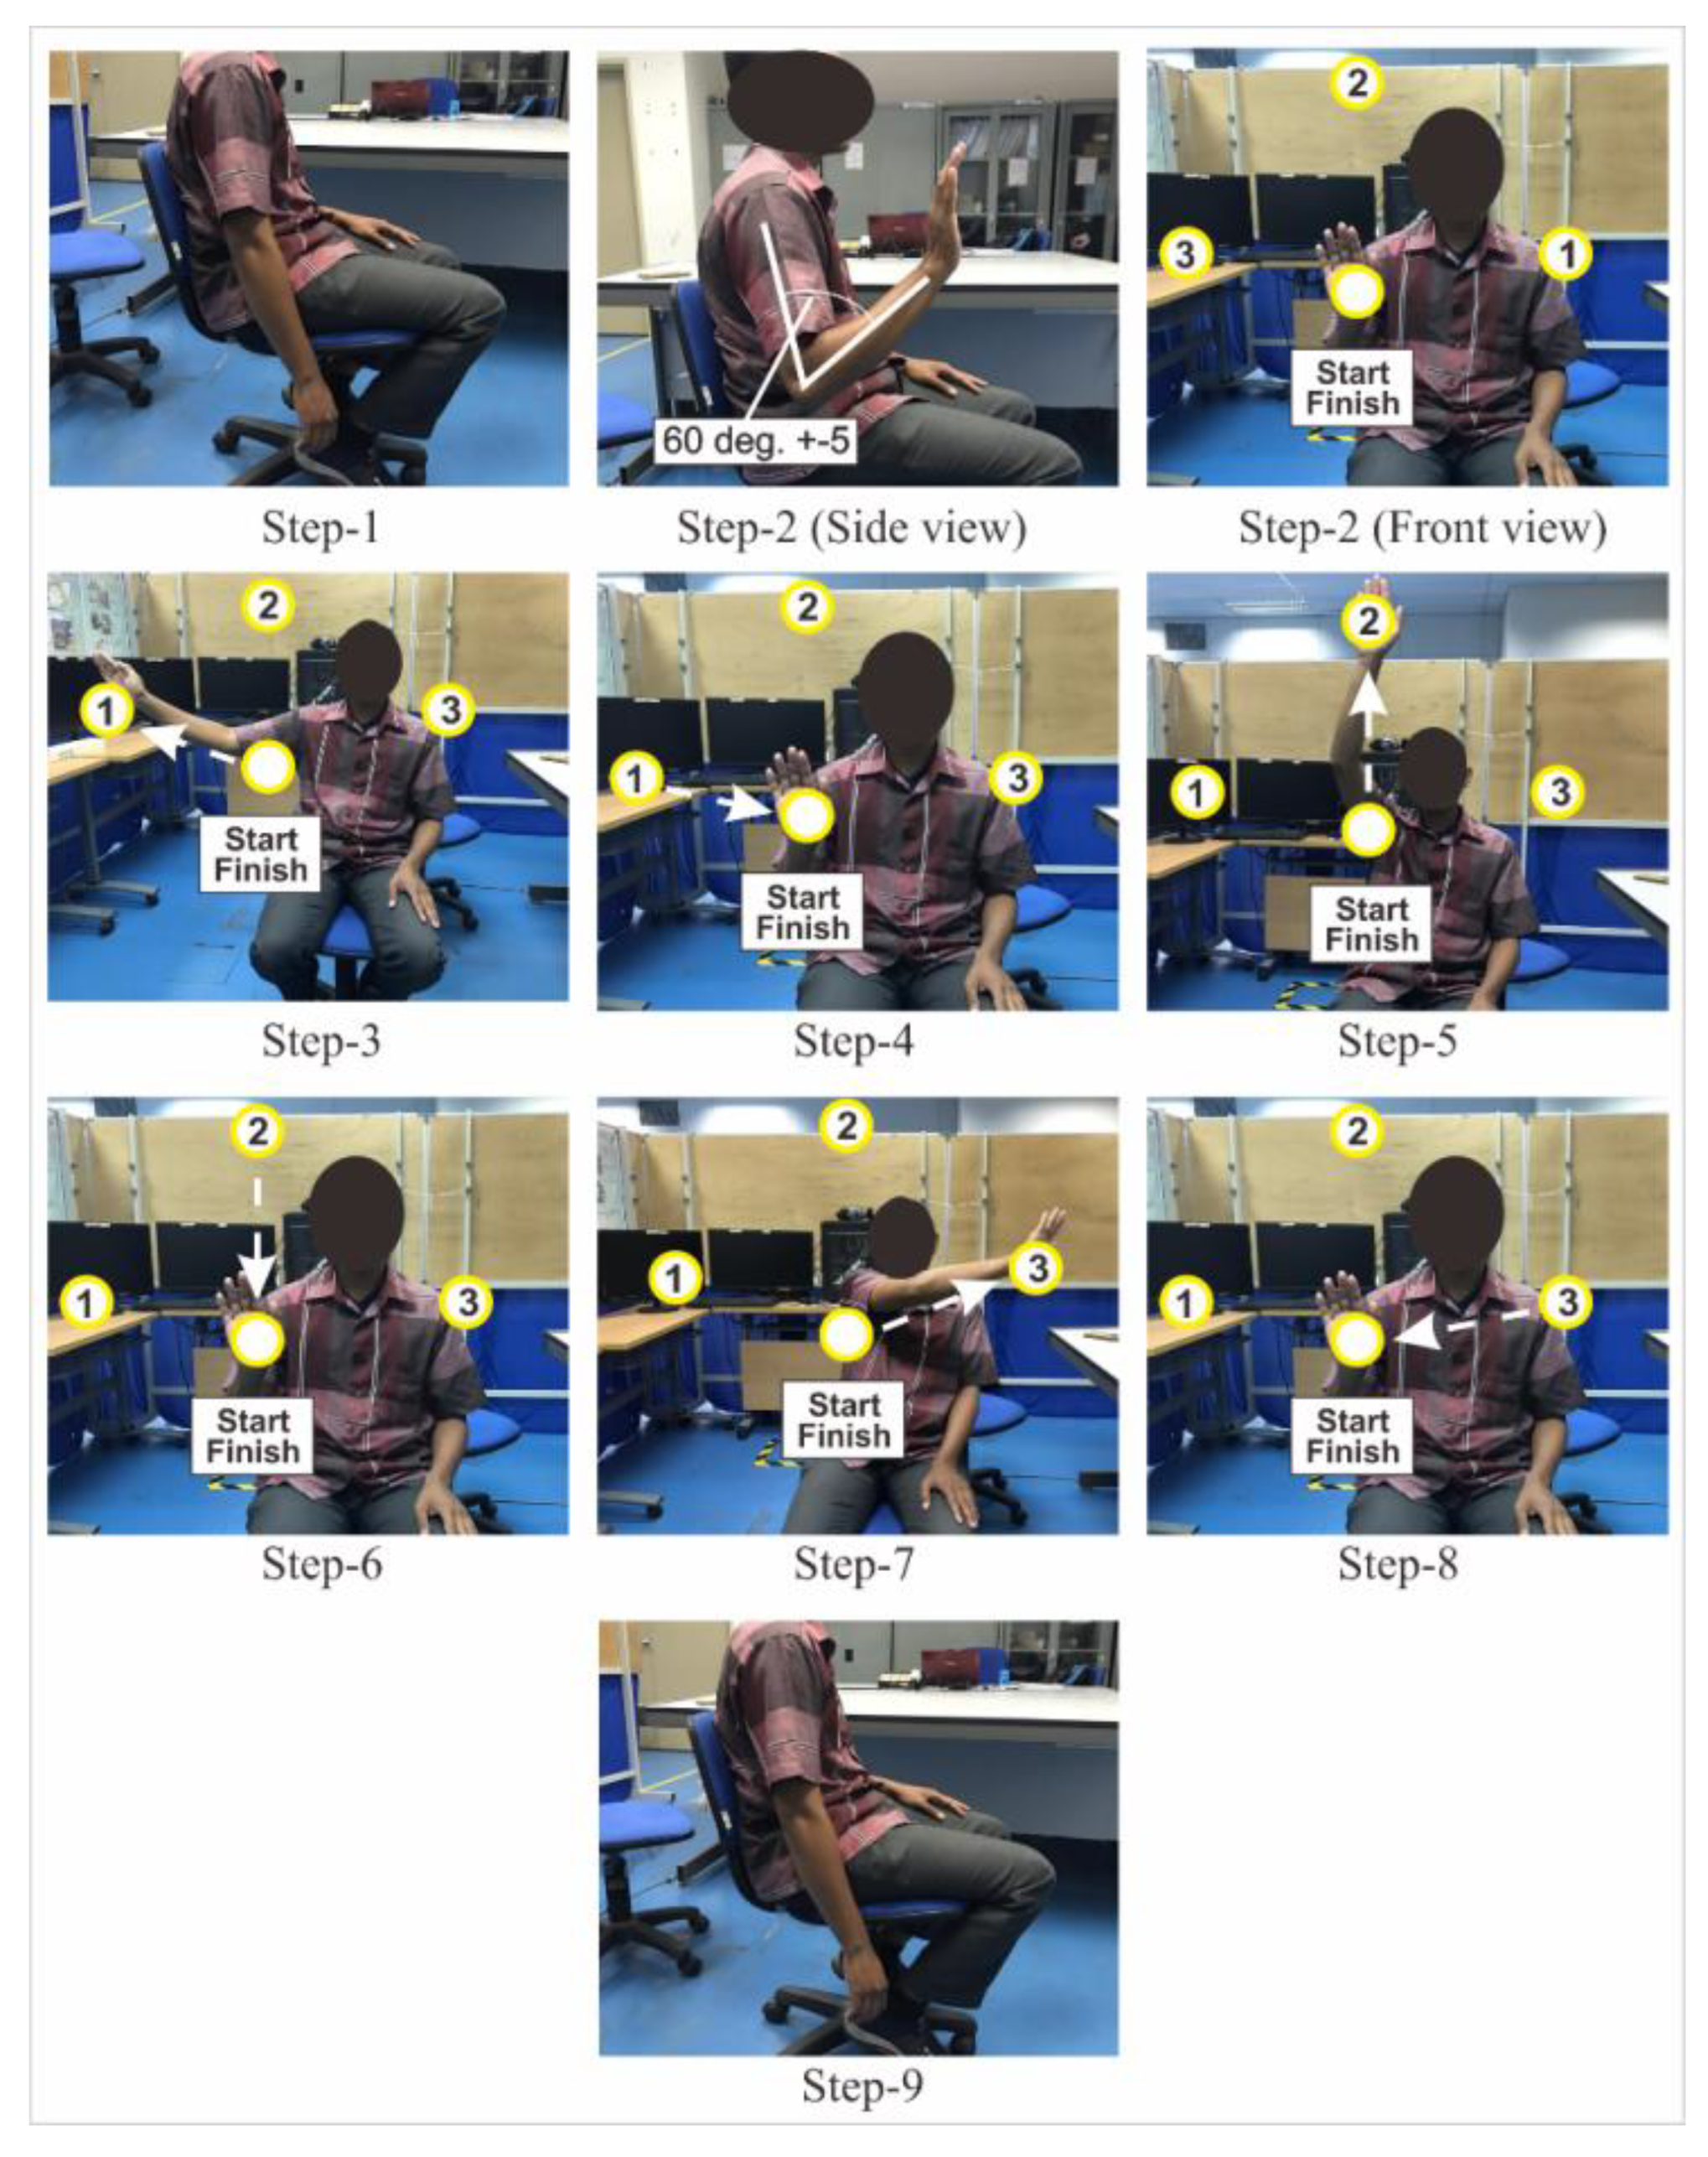
Game #2 involved movements for reaching three targets (
Figure 4), adapted from daily activity movements to reach objects on the rack. In Game #2, there were nine-step movements. Before starting and after finishing the movement, the arm was kept in a relaxing position for 5 seconds. From start to targets points 1 and 3, the first target position was on the right side of the start point at a distance of 57 ±3 cm. The line track angle was 75 ± 5 degrees from the vertical line to target 2. The second target position was on the top of the start point at a distance of 68 ± 3 cm. The third target position mirrored the first. This game comprised three movements (Movements #1–3): reaching the first, second, and third targets, respectively.
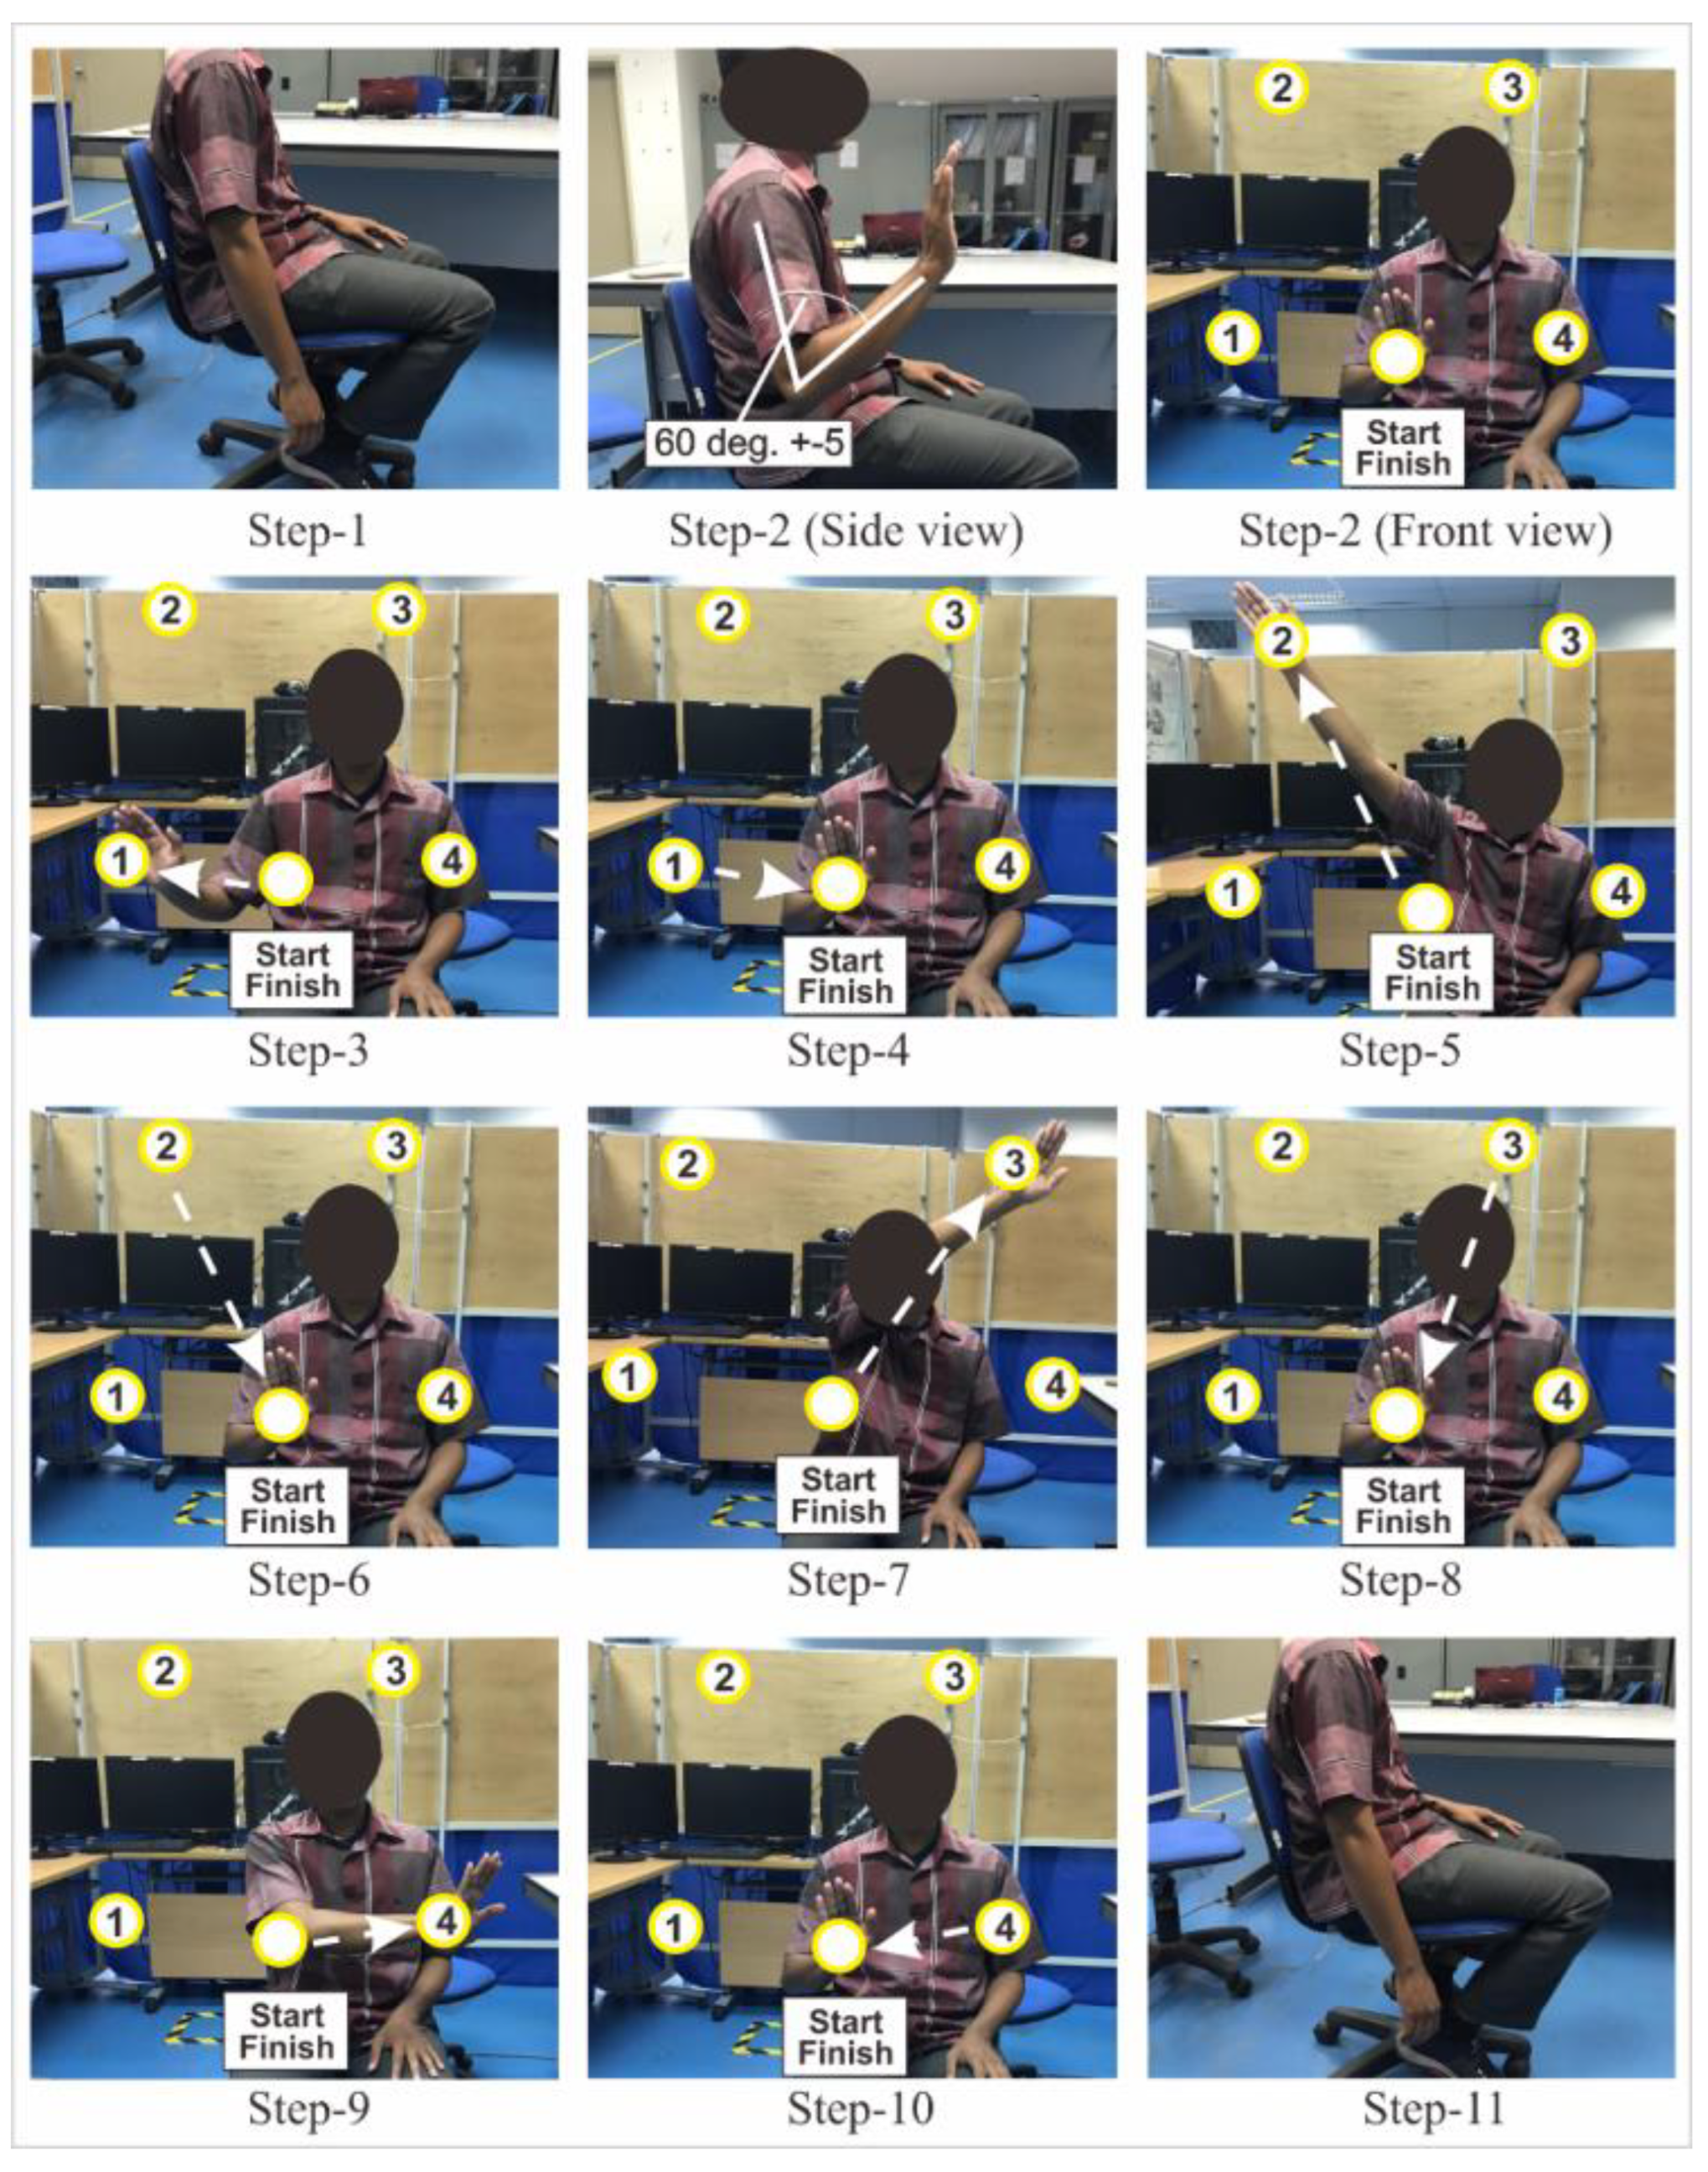
Game #3 consisted of reaching four targets (
Figure 5), adapted from daily activity movements to reach objects on the rack. In steps 1 and 11, the arm relaxes position within 5 seconds duration start and finish. From step 2, the first target position was on the right side of the start point at a distance of 46 ± 3 cm. The line track angle was 80 ± 5 degrees from the vertical line. The second target position was on the right side of the start point at a distance of 60 ±3 cm. The line track angle was 30 ± 5 degrees from the vertical line. The third and fourth target positions mirrored the second and first, respectively. These game movements have undergone prior testing with previously described outcomes [
23]. VR Game-Based Rehabilitation incorporation is a response to the traditional rehabilitation method constraints. This study focused on advancing post-stroke rehabilitation through interactive game development and enrichment.
2.3. EMG Sensor Processing and Analysis
EMG is an electrodiagnostic medical approach for detecting and recording muscle activity. Every contractile muscle displays an electric potential that could be recorded from neighboring skin areas. The signals could be used to detect medical abnormalities and activation levels or to analyze human or animal movement biomechanics.
In our study, we analyzed three muscles, i.e., the deltoid, biceps, and triceps. The electrode position for the deltoid muscle is at one finger width distal and anterior to the acromion. Before the electrode placements, the skin of the participants had to be cleaned using an alcohol pad to reduce any skin resistance and prevent transducer noise. We performed the electrode placement and skin preparation steps according to the guidelines of surface EMG for the noninvasive assessment of muscles (SENIAM) [
24]. In this study, we specifically monitored the EMG activity of the anterior deltoid muscle. The anterior deltoid was selected due to its crucial role in shoulder flexion and its significant involvement in upper limb movements, which are essential for many Activities of Daily Living (ADLs), such as reaching and lifting. While the focus was on the shoulder's anterior deltoid, future studies could benefit from including additional muscles such as the trapezius and pectoralis major, which also play vital roles in shoulder and upper limb function. Monitoring these muscles could provide a more comprehensive assessment of shoulder rehabilitation and movement dynamics.
We acquired the EMG signals from the deltoid, biceps, and triceps simultaneously using the Delsys Bagnoli EMG 8-channel system, consisting of several parts such as the main amplifier from Delsys Bagnoli-8 channel PM-B05, input module for Delsys Bagnoli-8 channel PM-B05, DE 2.1 Single Differential Surface EMG sensor as shown in
Figure 6. The DE 2.1 EMG Sensor subtracts EMG potentials detected at two distinct locations on the surface of the skin directly above an active muscle. The EMG potentials are always measured with respect to the electric potential of a neutral site located away from the EMG muscle source. This potential is detected by the Reference Electrode. The sensor is designed using a parallel bar contact geometry to ensure signal stability, repeatability between recordings, and optimal frequency content representation. This versatile sensor is well-suited for most EMG applications and is ideal for both large and small muscles [
25].
The Delsys Bagnoli EMG main amplifier operates within a response channel range of 20 ± 5 Hz to 450 ± 50 Hz and offers three gain options: 100, 1k, and 10k. For this study, we utilized the NI USB-6251 from National Instruments as the input/output device to interface the EMG main amplifier with the personal computer. The EMG signal acquisition was managed using EMGworks software, configured with a signal sampling rate of 2 kHz.
The initial stage of EMG signal processing involved pre-processing, performed using MATLAB for signal noise removal, feature extraction, and analysis. This pre-processing is crucial for eliminating noise from the signal. Initially, negative signal values were removed through full-wave rectification, followed by the application of a 5th-order Butterworth band-pass filter to capture the EMG signal envelope. EMG signals were collected at a 2 kHz sampling rate and passed through a 10–500 Hz band-pass filter. The 5th-order Butterworth filter with a 10 Hz cutoff frequency was selected to produce a flatter envelope signal [
26], thereby preserving the muscle activity information contained within the raw EMG signal. A higher cutoff frequency would increase oscillations, while a lower cutoff might flatten the signal excessively, leading to potential information loss.
Although a 50 Hz notch filter is typically used to eliminate powerline interference in EMG signals, it was not applied in this study due to the specific equipment and environmental conditions. The Delsys Bagnoli EMG system is equipped with high-quality shielding and grounding, which effectively minimizes such noise artifacts, making the notch filter less necessary. Additionally, the band-pass filtering range of 10–500 Hz used during preprocessing was sufficient to attenuate most noise without introducing the distortions that can sometimes occur with notch filtering. However, in future studies, the inclusion of a 50 Hz notch filter could be considered to further enhance signal clarity, particularly in environments with higher levels of electrical interference.
In signal processing, feature extraction is particularly important to achieve better classification performance in pattern recognition. Two features from the time domain were extracted, i.e., the root mean square (RMS) and mean absolute value (MAV). One feature was extracted from the statistical information, i.e., the amount of movement (AoM) [
24]. The RMS was modeled as the amplitude-modulated Gaussian random process with an RMS related to the constant force and nonfatiguing contraction. It relates to standard deviation and could be calculated as follows:
The MAV is similar to the average rectified value. It could be calculated using the moving average of full-wave rectified EMG (i.e., by taking the average of the surface EMG signal absolute value), providing an easy way to detect muscle contraction levels and a popular feature in myoelectric control applications, defined as follows:
The AoM is one of the best features to represent muscle activity. Hence, its calculation is based on that from the muscle envelopes and could be described as follows:
Where,
N = EMG signal length
Xi = EMG signal in segment i.
i = Time
Normalization was undertaken to analyze the EMG signal, allowing for comparing certain muscle activities on different days. The normalization was calculated by dividing the feature extraction value during the VR game by the reference value. The reference value was calculated by averaging the maximum value from all feature extractions and trials. Equation (4) presents the normalization calculation.
In our study, normalization was performed relative to the Maximum Voluntary Contraction (MVC) or the maximum value achieved by the muscles during task execution. Specifically, feature extraction values were normalized by dividing them by the reference value, which is the average of the maximum values recorded across all trials. This approach ensures that the EMG signals are scaled relative to peak muscle activation, facilitating a more accurate comparison of muscle activity levels.
During the presentation of results, EMG signals were expressed in microvolts (µV). This indicates that the signals were not normalized to a 0 to 1 scale. Instead, we presented the signals in their original units to retain the physiological relevance and magnitude of muscle activity. While normalization to a 0 to 1 scale can be useful for certain comparative analyses, particularly when comparing different individuals or sessions, presenting data in microvolts allows for a direct interpretation of muscle activation levels in terms of their absolute values. This is crucial for understanding the actual amplitude of muscle contractions and correlating EMG data with the physical intensity of the muscle activities performed during the VR games. Although normalization relative to MVC helps in comparing muscle activity across different sessions and individuals, maintaining the original units of microvolts provides a clear depiction of muscle activity levels and facilitates interpretation in the context of muscle contraction strength and performance evaluation.
Of the 15 participants, 5 were selected for the testing and 10 served as references. The performance evaluation for VR game rehabilitation was muscle contraction-based at a certain movement. We used the cosine similarity value between the testing and reference for performance evaluation in each season. Equation (5) presents the cosine similarity calculation between testing and the reference. The cosine similarity value in Session #1 was compared with Session #2 and that in Session #2 with Session #3.
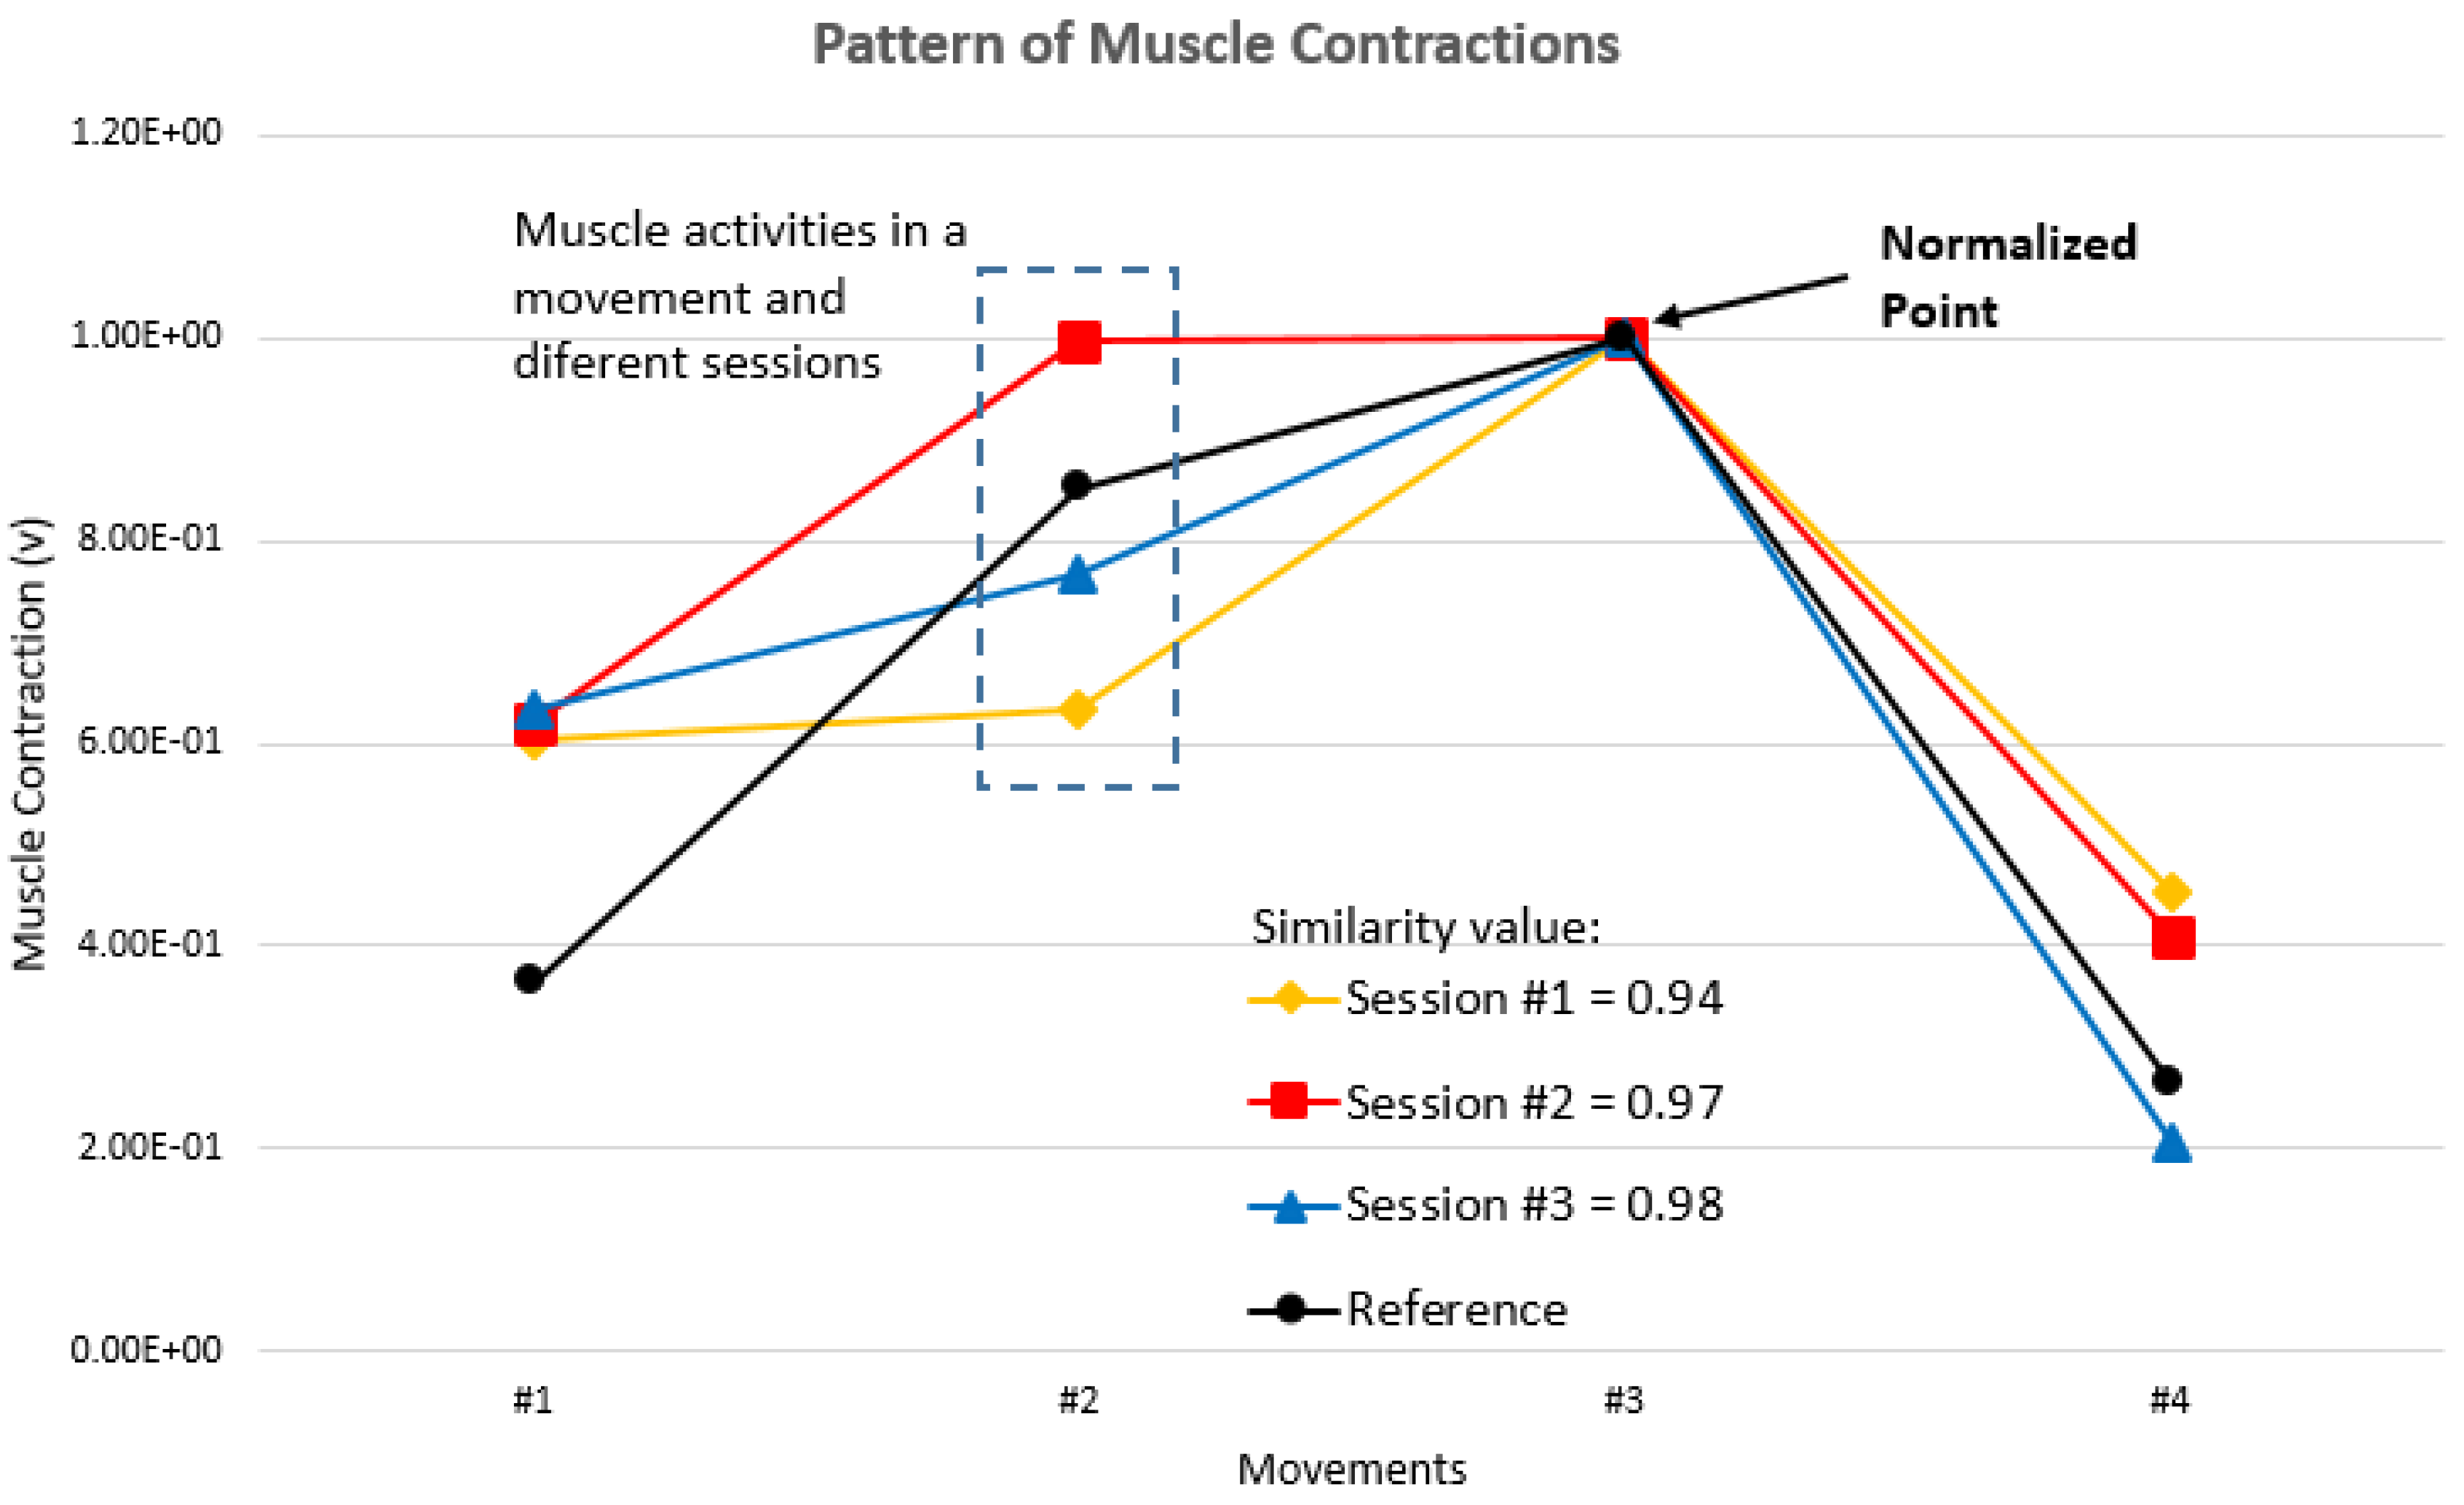
Muscle contraction improvement is indicated by increasing cosine similarity values. If the muscle contraction pattern is equal to the reference pattern, then the cosine similarity value is “1.” If the pattern of muscle contractions shifts from the reference pattern, then the cosine similarity value is “<1” (
Figure 7). The decreasing cosine similarity value indicates muscle activity deterioration, as shown in Session #1 with a cosine similarity value of 0.94.
2.4. Experiment Preparation and Setup
Consistent with the approach of this study, a cohort of 15 healthy participants would actively participate in the data collection phase. The study specifically focused on monitoring three distinct muscles: the deltoid, biceps, and triceps. Therefore, we used surface EMG to track muscle activity, while the Kinect sensor would be employed for hand movement monitoring. We meticulously selected the participants based on well-defined criteria, which required individuals to be healthy with right-handed dominance in their daily activities, aged between 20–30 years, and devoid of any hand injuries. Among the participants, eight and seven were males and females, respectively, with an average age of 24 years. Our study primarily included healthy participants. However, it is crucial to acknowledge that post-stroke patients might exhibit varying EMG signal patterns owing to factors such as muscle weakness or spasticity. In the future, based on this study, we will attempt to bridge this gap by exploring how VR games could contribute to upper limb stroke rehabilitation, specifically by analyzing muscle activities using EMG signal patterns. the results of this study indicate the potential of VR-based rehabilitation games in facilitating post-stroke upper limb recovery with a focus on factors such as muscle engagement, target distances, and rehabilitation criteria integrated into a game design. Accordingly, future research will include patients with stroke, which will allow for a deeper understanding of immersive multiplanar movements and their therapeutic implications. We hope our study can contribute to advancing our knowledge of VR-based stroke rehabilitation, particularly in optimizing upper limb movement sequences to enhance therapeutic engagement and facilitate recovery. To deepen our understanding of movement sequence efficacy and muscle conditions during stretching, post-stroke patient muscle activity assessment would be valuable.
Before playing VR games, the participants performed fundamental movements involving abduction-adduction of the shoulder and flexion-extension of the elbow to test the EMG device and electrode positions as well as to determine the baseline and contraction signal of the selected muscle. Every participant was included in the data collection for three sessions, three games, and five trials. The total game time was 15 minutes, with 5 minutes of resting. The rest time was a period given to the participants to prevent muscle fatigue. Before playing the games, every participant was briefed on the game rules. EMG sensors, particularly those using surface EMG instead of needle EMG, are considered safe. Prior to conducting any experiments, technicians and researchers involved in this study underwent comprehensive training that was provided by Delsys, the EMG sensor manufacturer, to ensure their proficiency in handling the equipment. All procedures outlined in the guidelines and standard operating procedures were strictly adhered to, covering several aspects including electrode application, obtaining consent from and communication with the participants, maintaining cleanliness and sterility in the work environment, addressing ethical considerations, and ensuring proper researcher training. The participants were also briefed on the rules of the experimental game. Each participant was provided with manual operating procedures as well as information about post-stroke rehabilitation and how to participate in the game. Trained technicians and researchers applied the EMG sensors to the participants’ muscles. Furthermore, participants had to provide signed consent forms before participating in the experiment.
3. Results
3.1. The Upper Limb Movement Sequence
B We developed the rehabilitation game in this study based on an upper limb movement sequence consisting of easy, gradual, and easy movements.
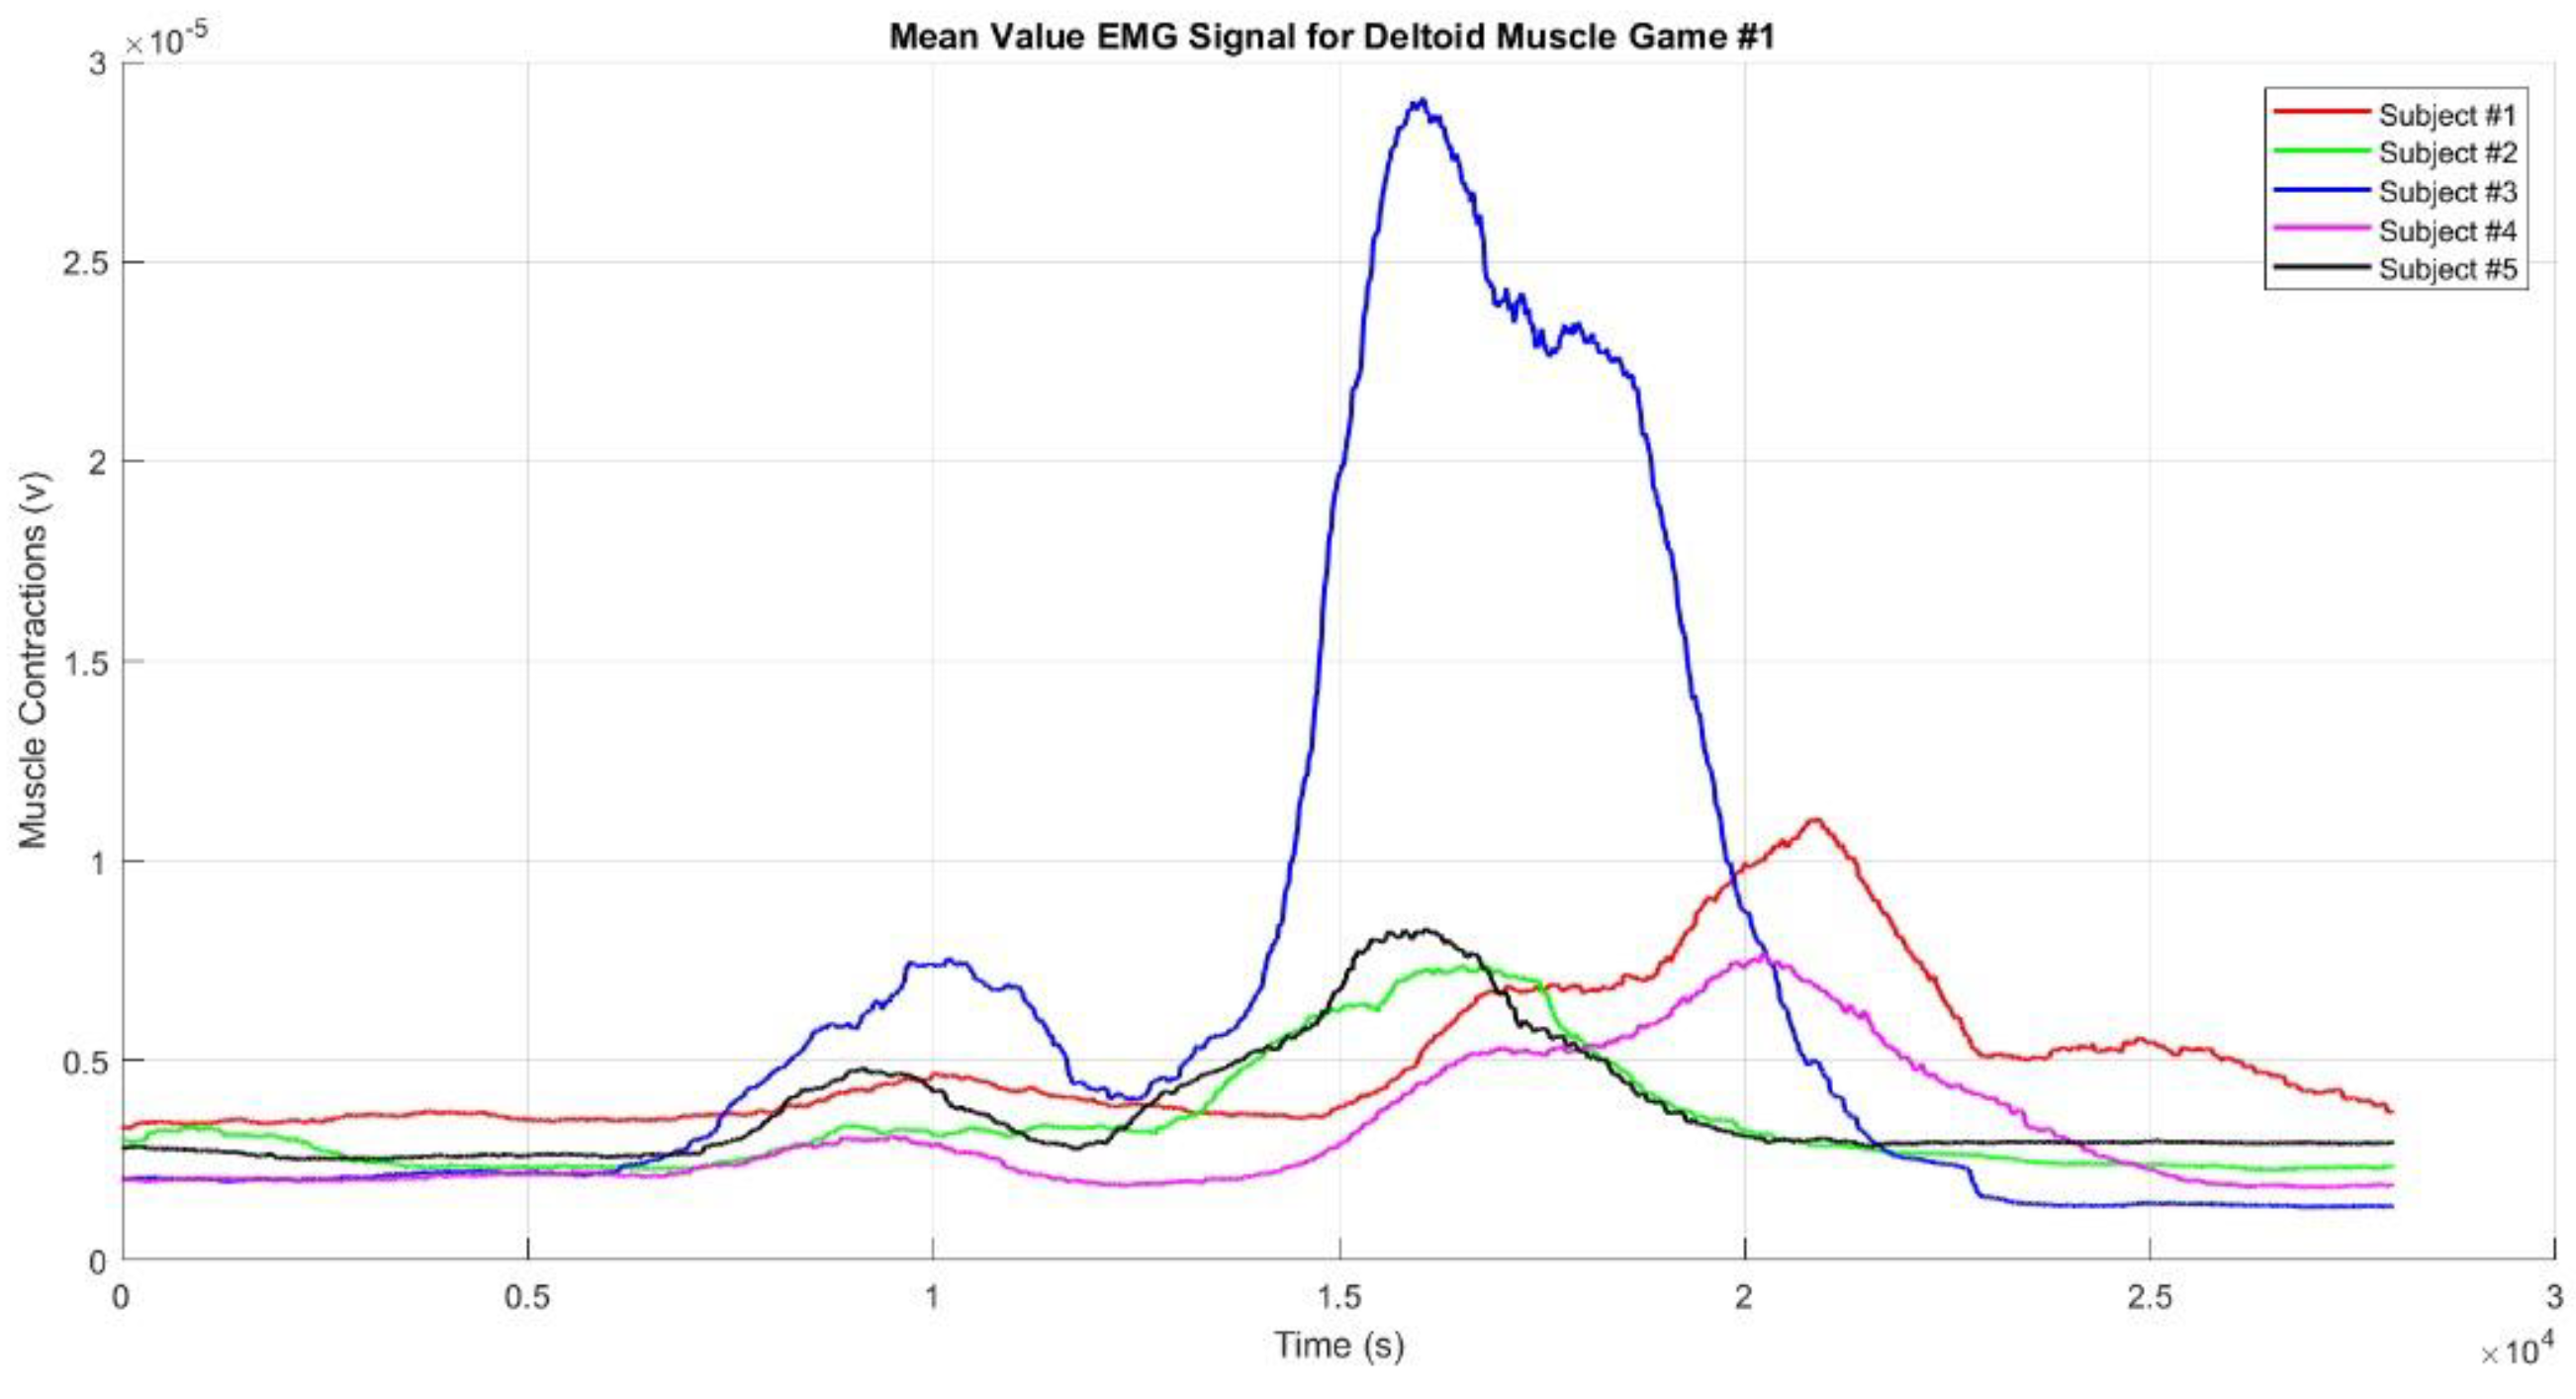
Figure 8 shows the mean EMG envelope signal from the deltoid muscles during the upper limb movements in Game #1 for Participants #1 to #5. Based on the graph of muscle contractions filtered using the standard deviation, Subject #3 exhibited higher muscle contractions than the other subjects. This indicates a period of intense muscle activity for Subject #3, likely corresponding to one or more movements during the game. In Game #1, there are four interconnected movements, resulting in the graph showing only two to three distinct muscle contractions, with the fourth contraction being obscured by the others.
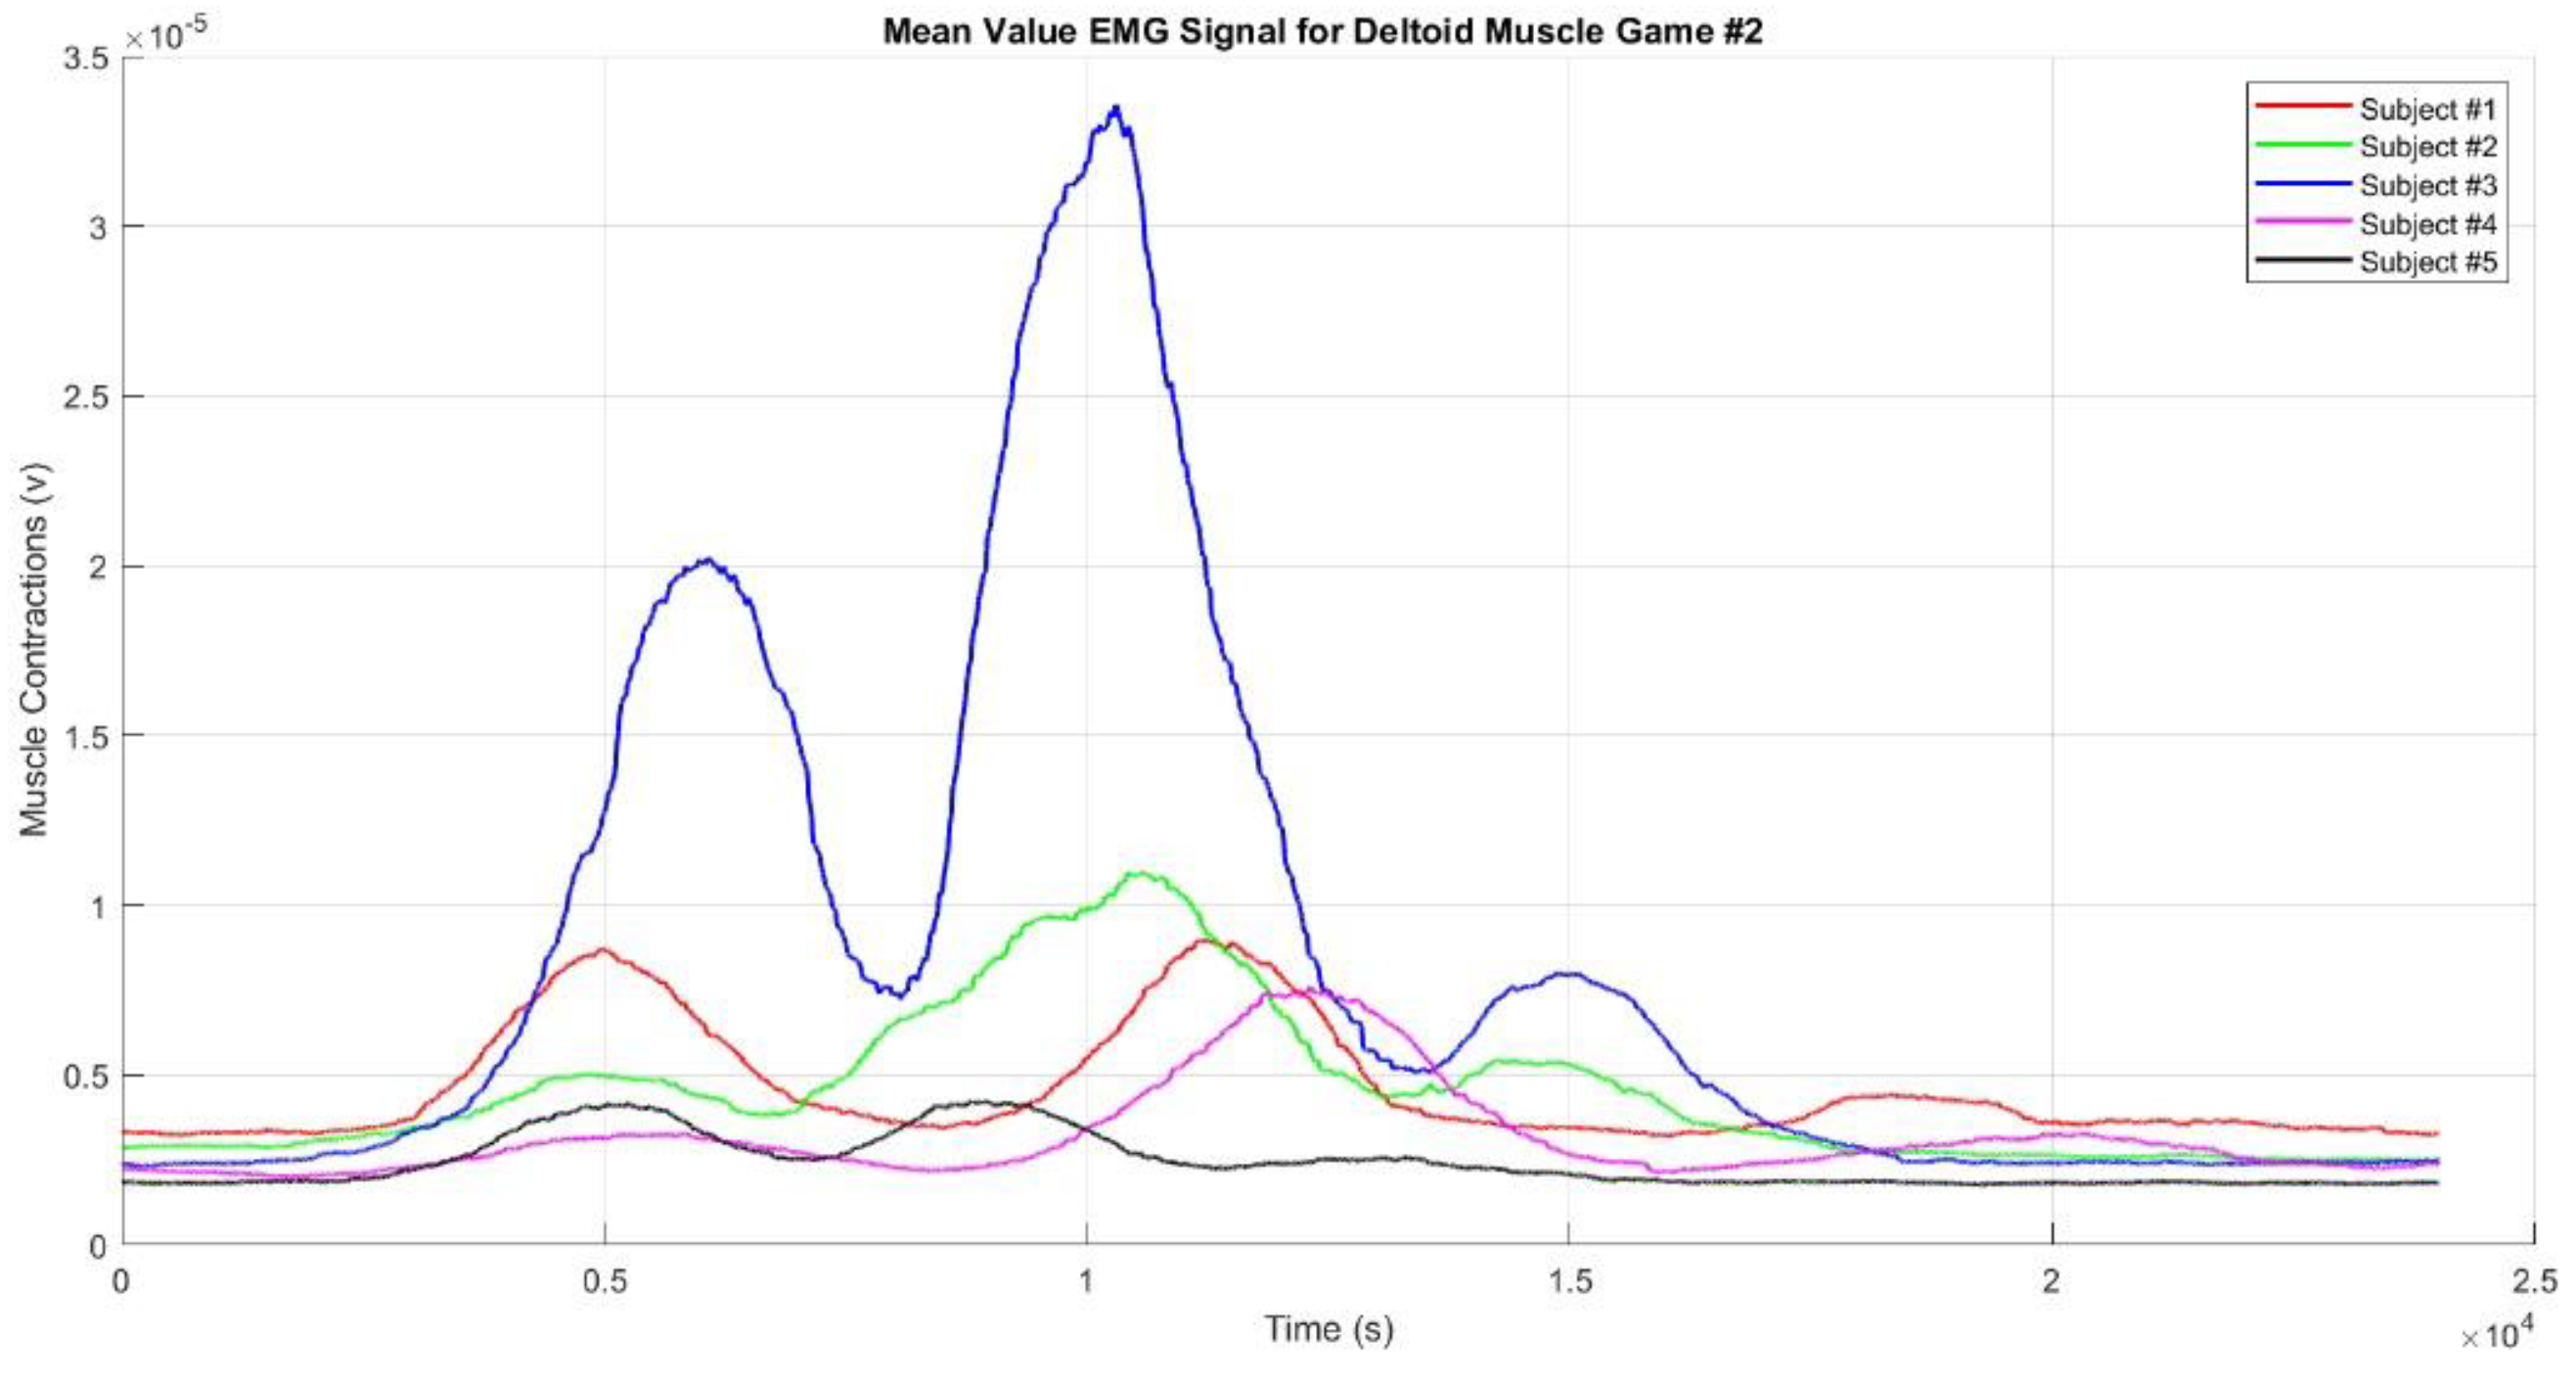
Figure 9 presents the mean EMG envelope signal from the deltoid muscle during Game #2 for Participants #1 to #5. Similarly, in Game #2, the muscle contraction pattern is almost identical to that of Game #1, with Subject #3 again displaying higher muscle contractions than the other subjects. Game #2 involves three movements targeting three different points, leading to three distinct muscle contractions. The first contraction occurs when the hand reaches Target #1, the second when it reaches Target #2, and the third when it reaches Target #3. The second contraction is the strongest, while the third is weaker than the first, likely because Target #3 is located on the left side of the subject’s body. Subject #5 exhibited the smallest contractions, which may be due to improper placement of the EMG sensor electrodes or genuinely weak muscle contractions. Additionally, the contractions were weaker when the hand moved toward Target #1 and the Finish point than when it moved toward Targets #2 and #3. The square-shaped movement sequence reflects the condition of muscle activity during the game.
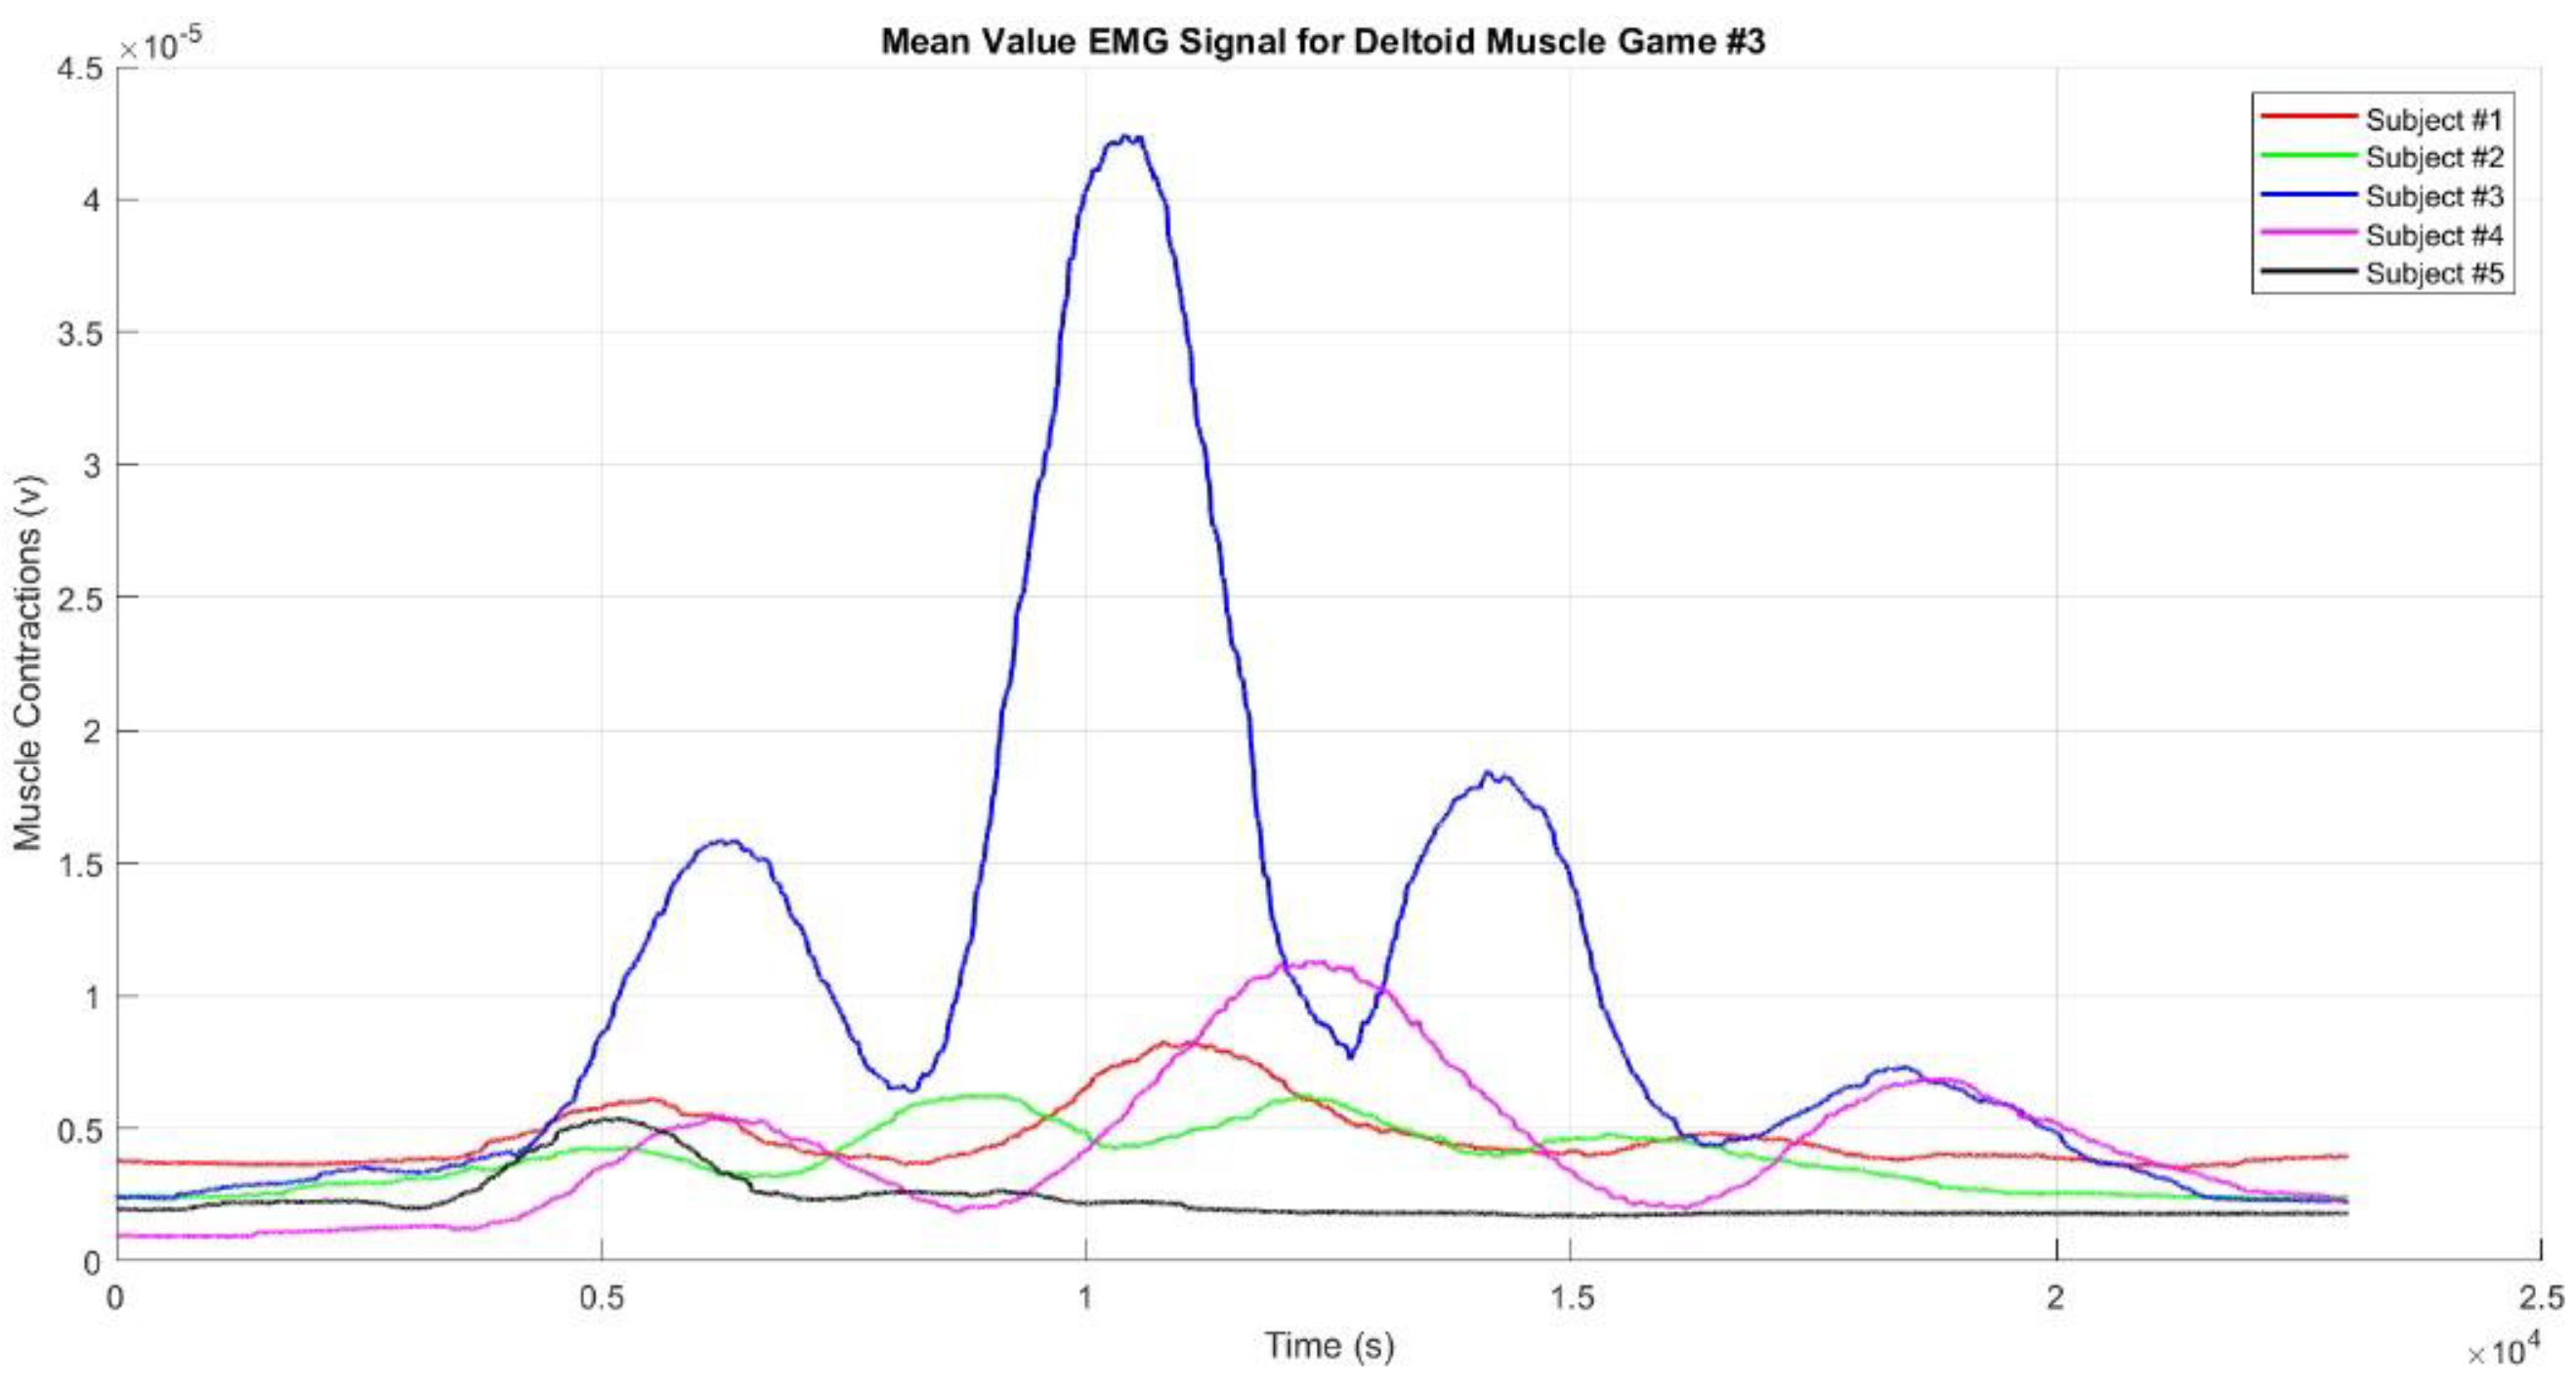
Regarding deltoid muscle activity during Game #3,
Figure 10 shows the mean EMG envelope signal. In Game #3, there are four muscle contractions: the first occurs when the hand reaches Target #1, the second when it reaches Target #2, the third when it reaches Target #3, and the fourth when it reaches Target #4. The second contraction is the strongest, while the fourth is the weakest, possibly because Target #4 is closer and located on the left side of the subject’s body. The muscle activity sequence in Game #3 can be interpreted as "weak - strong - medium-weak" contractions. Across all three games, Subject #3 consistently showed the strongest muscle contractions, likely due to greater muscle mass compared to the other subjects. Conversely, Subject #5 consistently showed the weakest muscle contractions, which could be attributed to improper sensor placement, smaller muscle mass, or the presence of fat tissue covering the muscle.
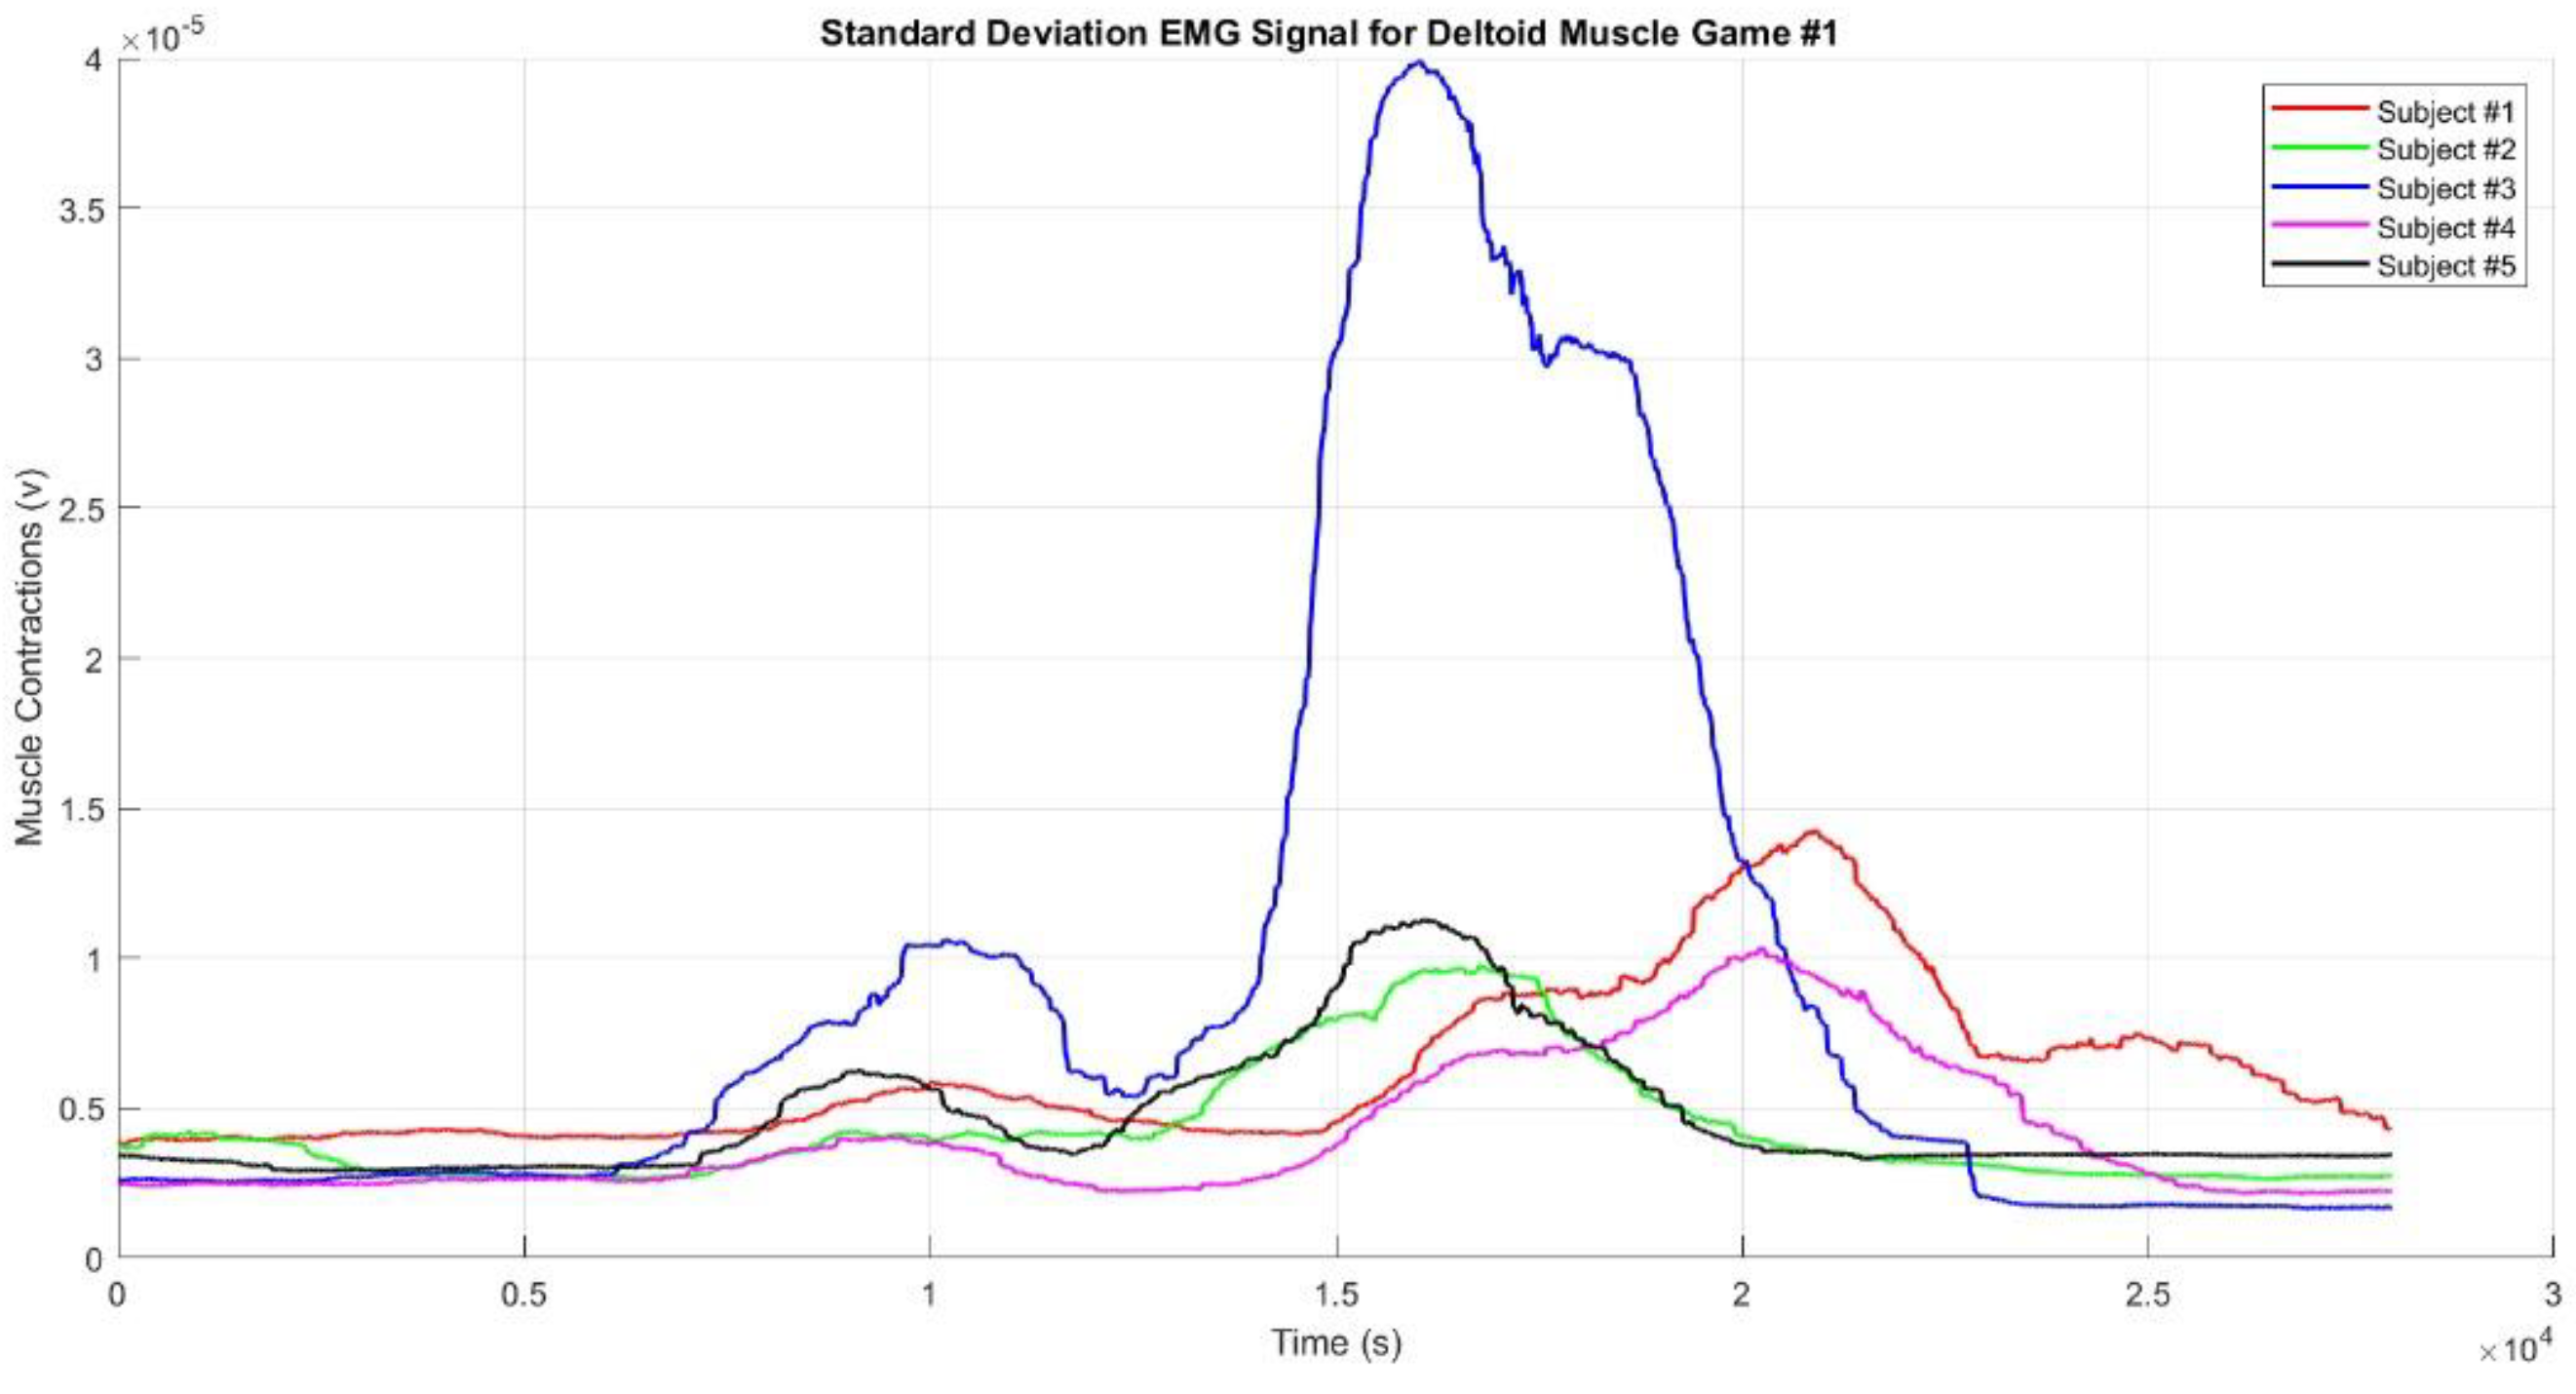
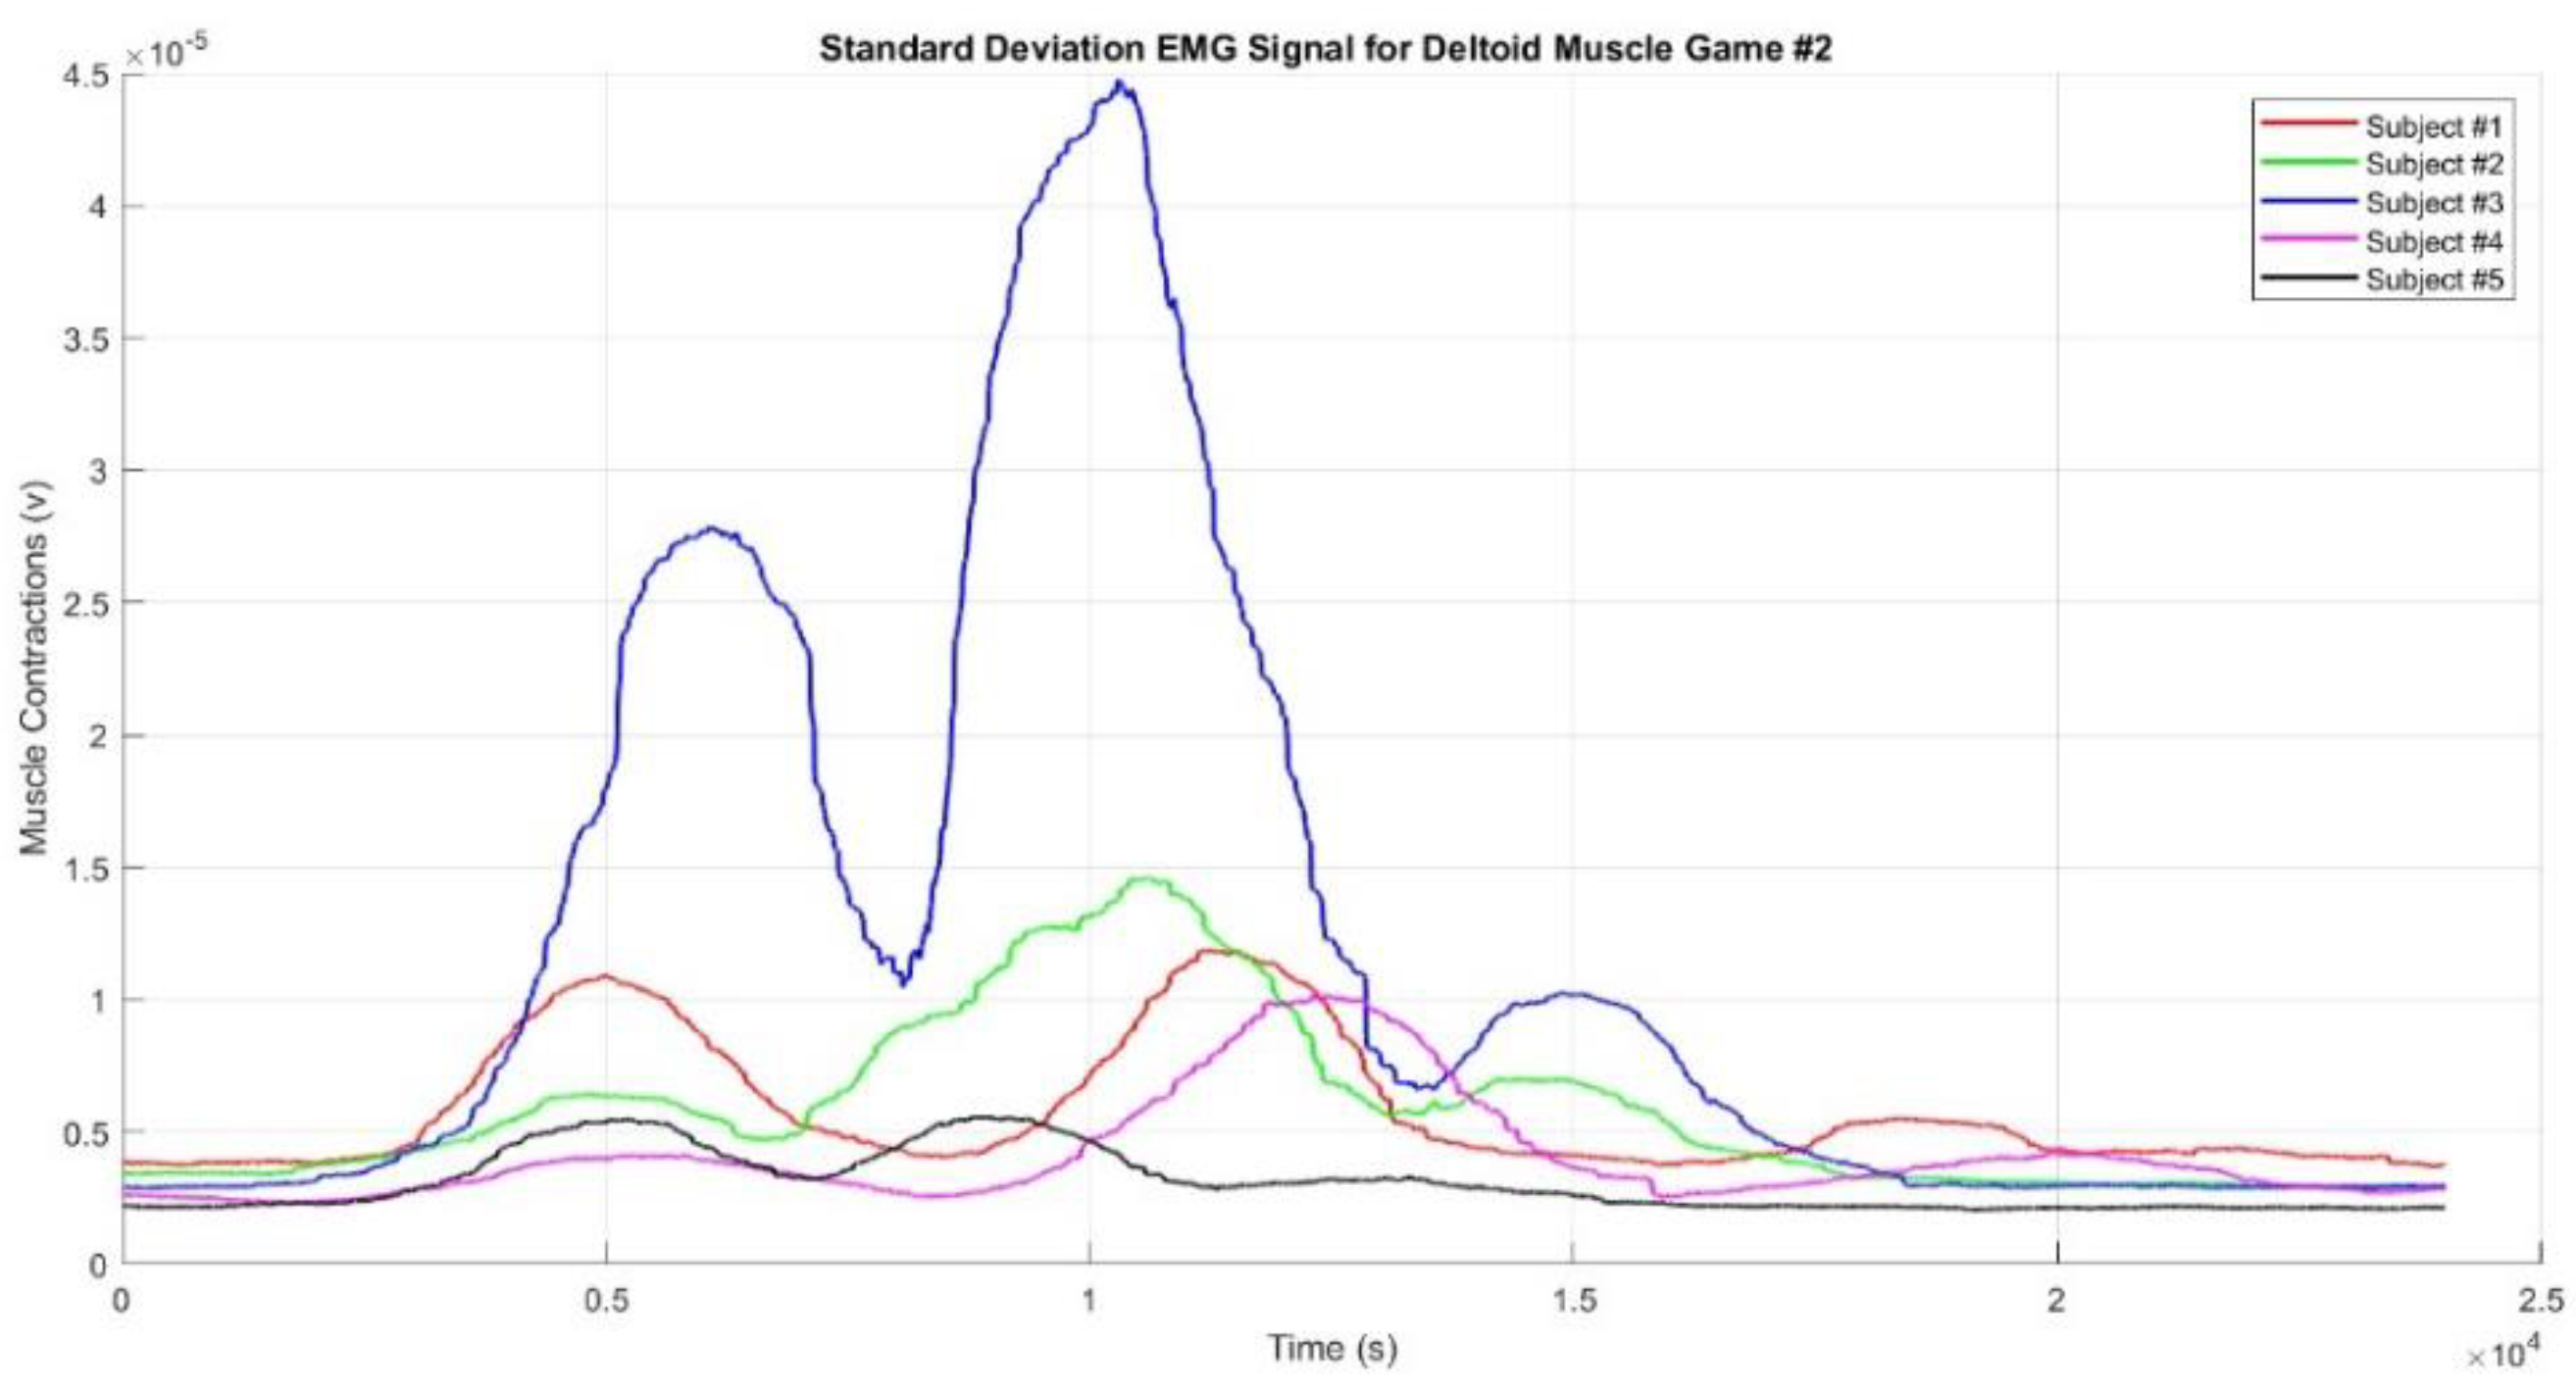
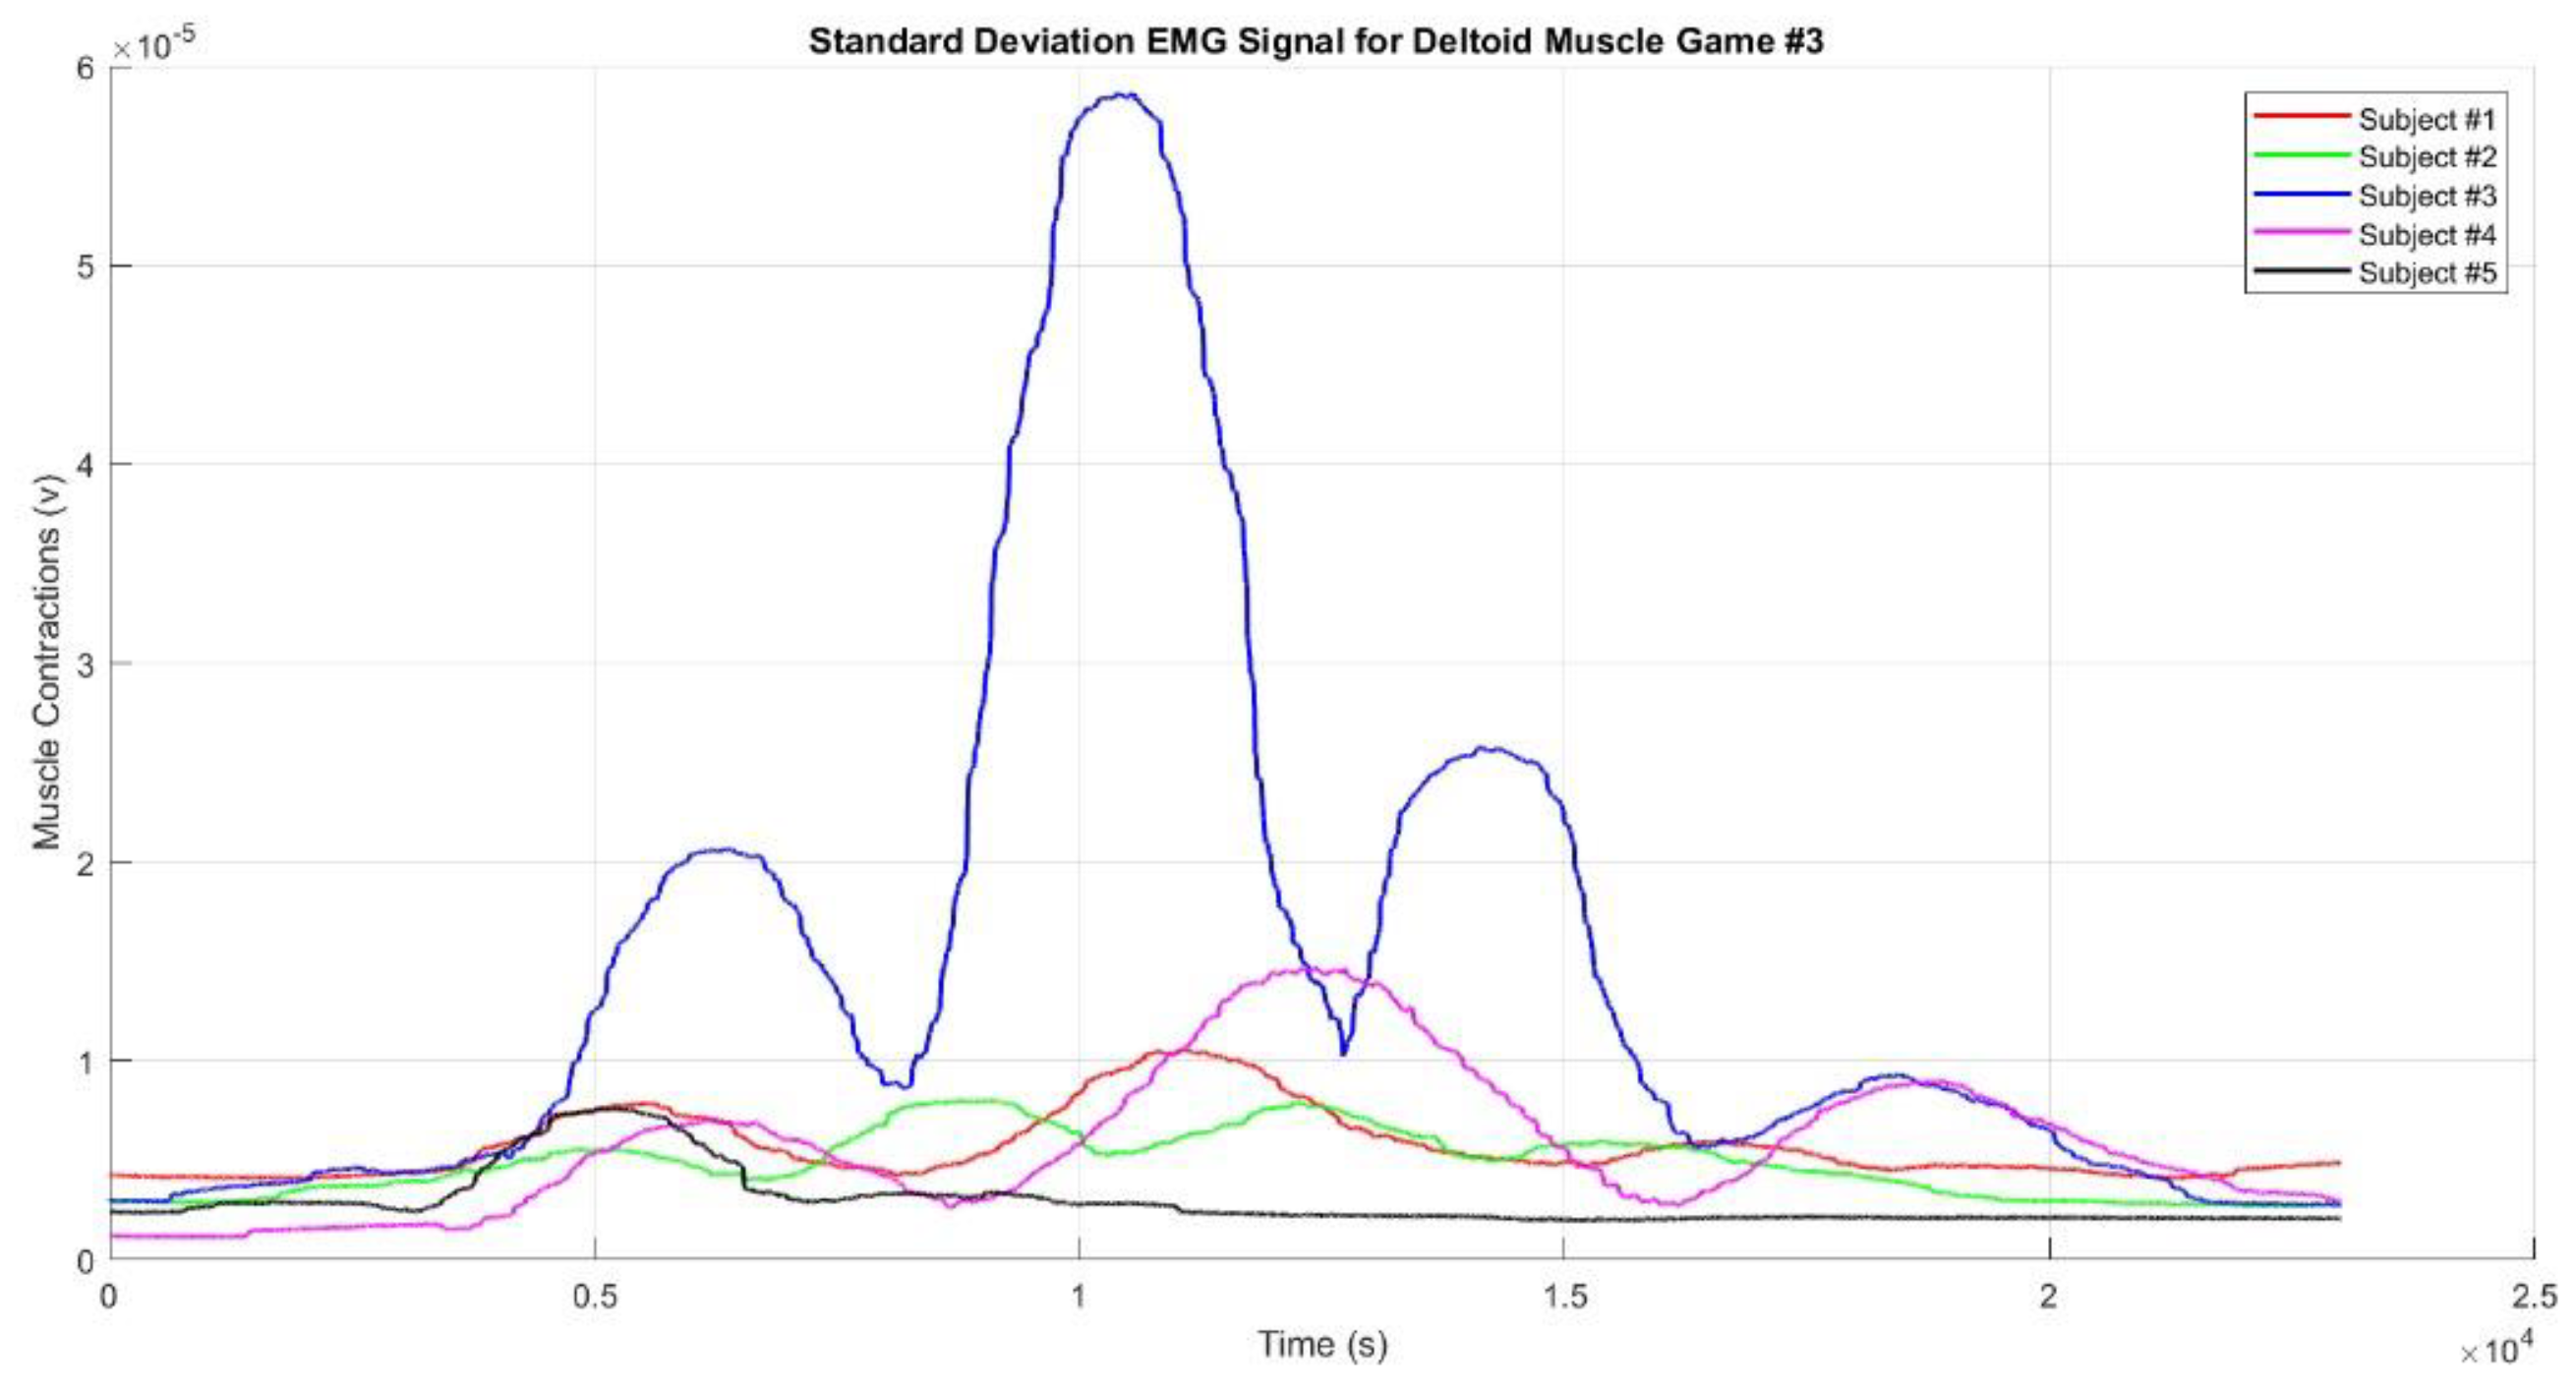
Figure 11,
Figure 12 and
Figure 13 show the standard deviation EMG envelope signals for the deltoid muscle in Game #1, Game #2, and Game #3, respectively. These results align with the mean values presented earlier (
Figure 8,
Figure 9 and
Figure 10), but the graphs appear smoother. The muscle contractions observed in each game demonstrate that the designed games accurately represent the intended movement sequences. All figures highlight that when the hand reached the top target, the muscles produced stronger contractions compared to when the hand reached the right or left targets. Additionally, when the targets were farther from the participant's body, the muscles produced stronger contractions. This phenomenon was confirmed when the participants reached Target #2 in Game #2 and Targets #2 and #3 in Game #3.
Our results revealed that within the realm of VR-based upper limb movement sequence rehabilitation, facilitated by motion sequence Games #1–3, the EMG envelope signals distinctly illustrated discernible muscle contraction patterns aligned with the prescribed movement sequences embedded in the VR games. Notably, upper limb rehabilitation, particularly through using motion sequence Games #2 and #3, demonstrated enhancements in achieving target movements. The evident EMG envelope signal contractions indicate that repetitive rehabilitation exercises have yielded a modest yet perceptible improvement both in motor skills and muscle functionality among the participants, confirming stroke rehabilitation efficiency. To substantiate the efficacy of these VR-based upper limb rehabilitation games, we rigorously tested three distinct game patterns, each based on the aforementioned motion sequence patterns, and then subjected the resulting EMG signals to further analysis.
3.2. Muscle Activity Analysis
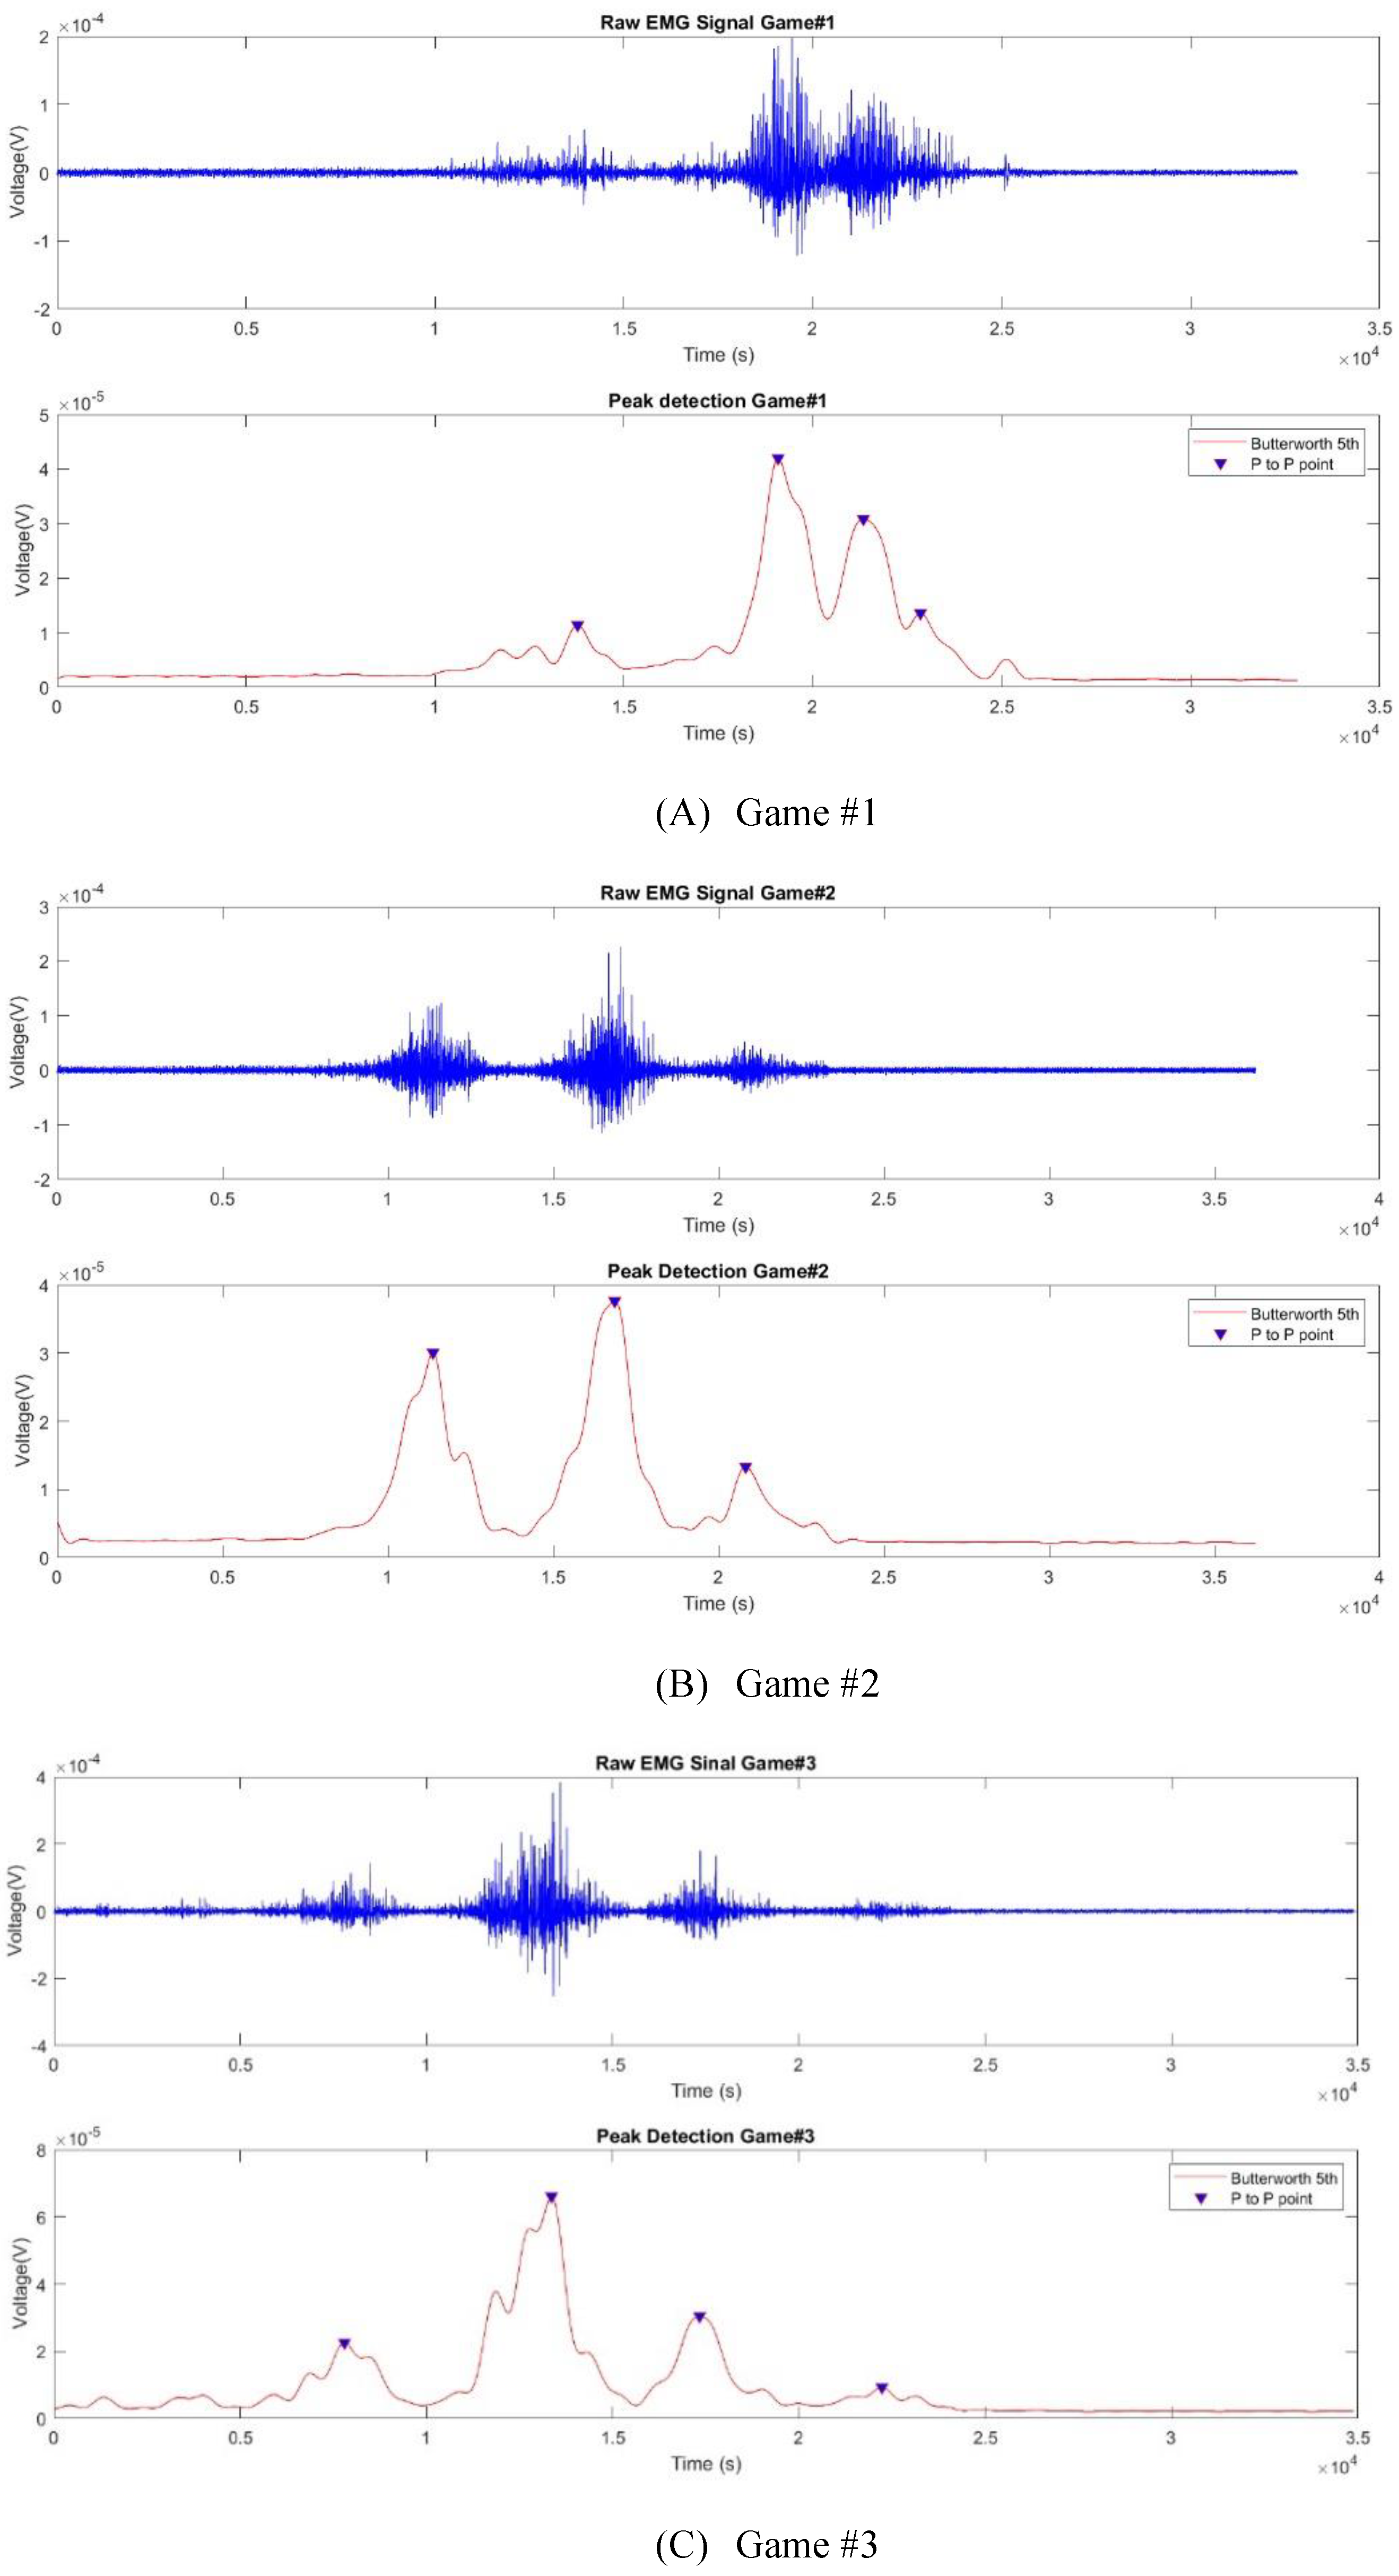
Figure 14 presents the raw EMG signal and the deltoid muscle-related peak detection results for representing (A) Game #1, (B) Game #2, and (C) Game #3. We detected four, three, and four peaks in Games #1–3, respectively. The detected peak numbers were the same in each game as those of the muscle contractions or tasks in the game indicated in the movement sequence activities. Our results successfully confirm that the signal could be anticipated to detect muscle contractions during upper limb movement sequences. We used three feature extraction (RMS, MAV, and AoM) to present the muscle activities while reaching targets from the start to finish positions. Based on the table and bar graph, we compared features and movements in each muscle to select an appropriate feature to represent muscle activity while playing VR games.
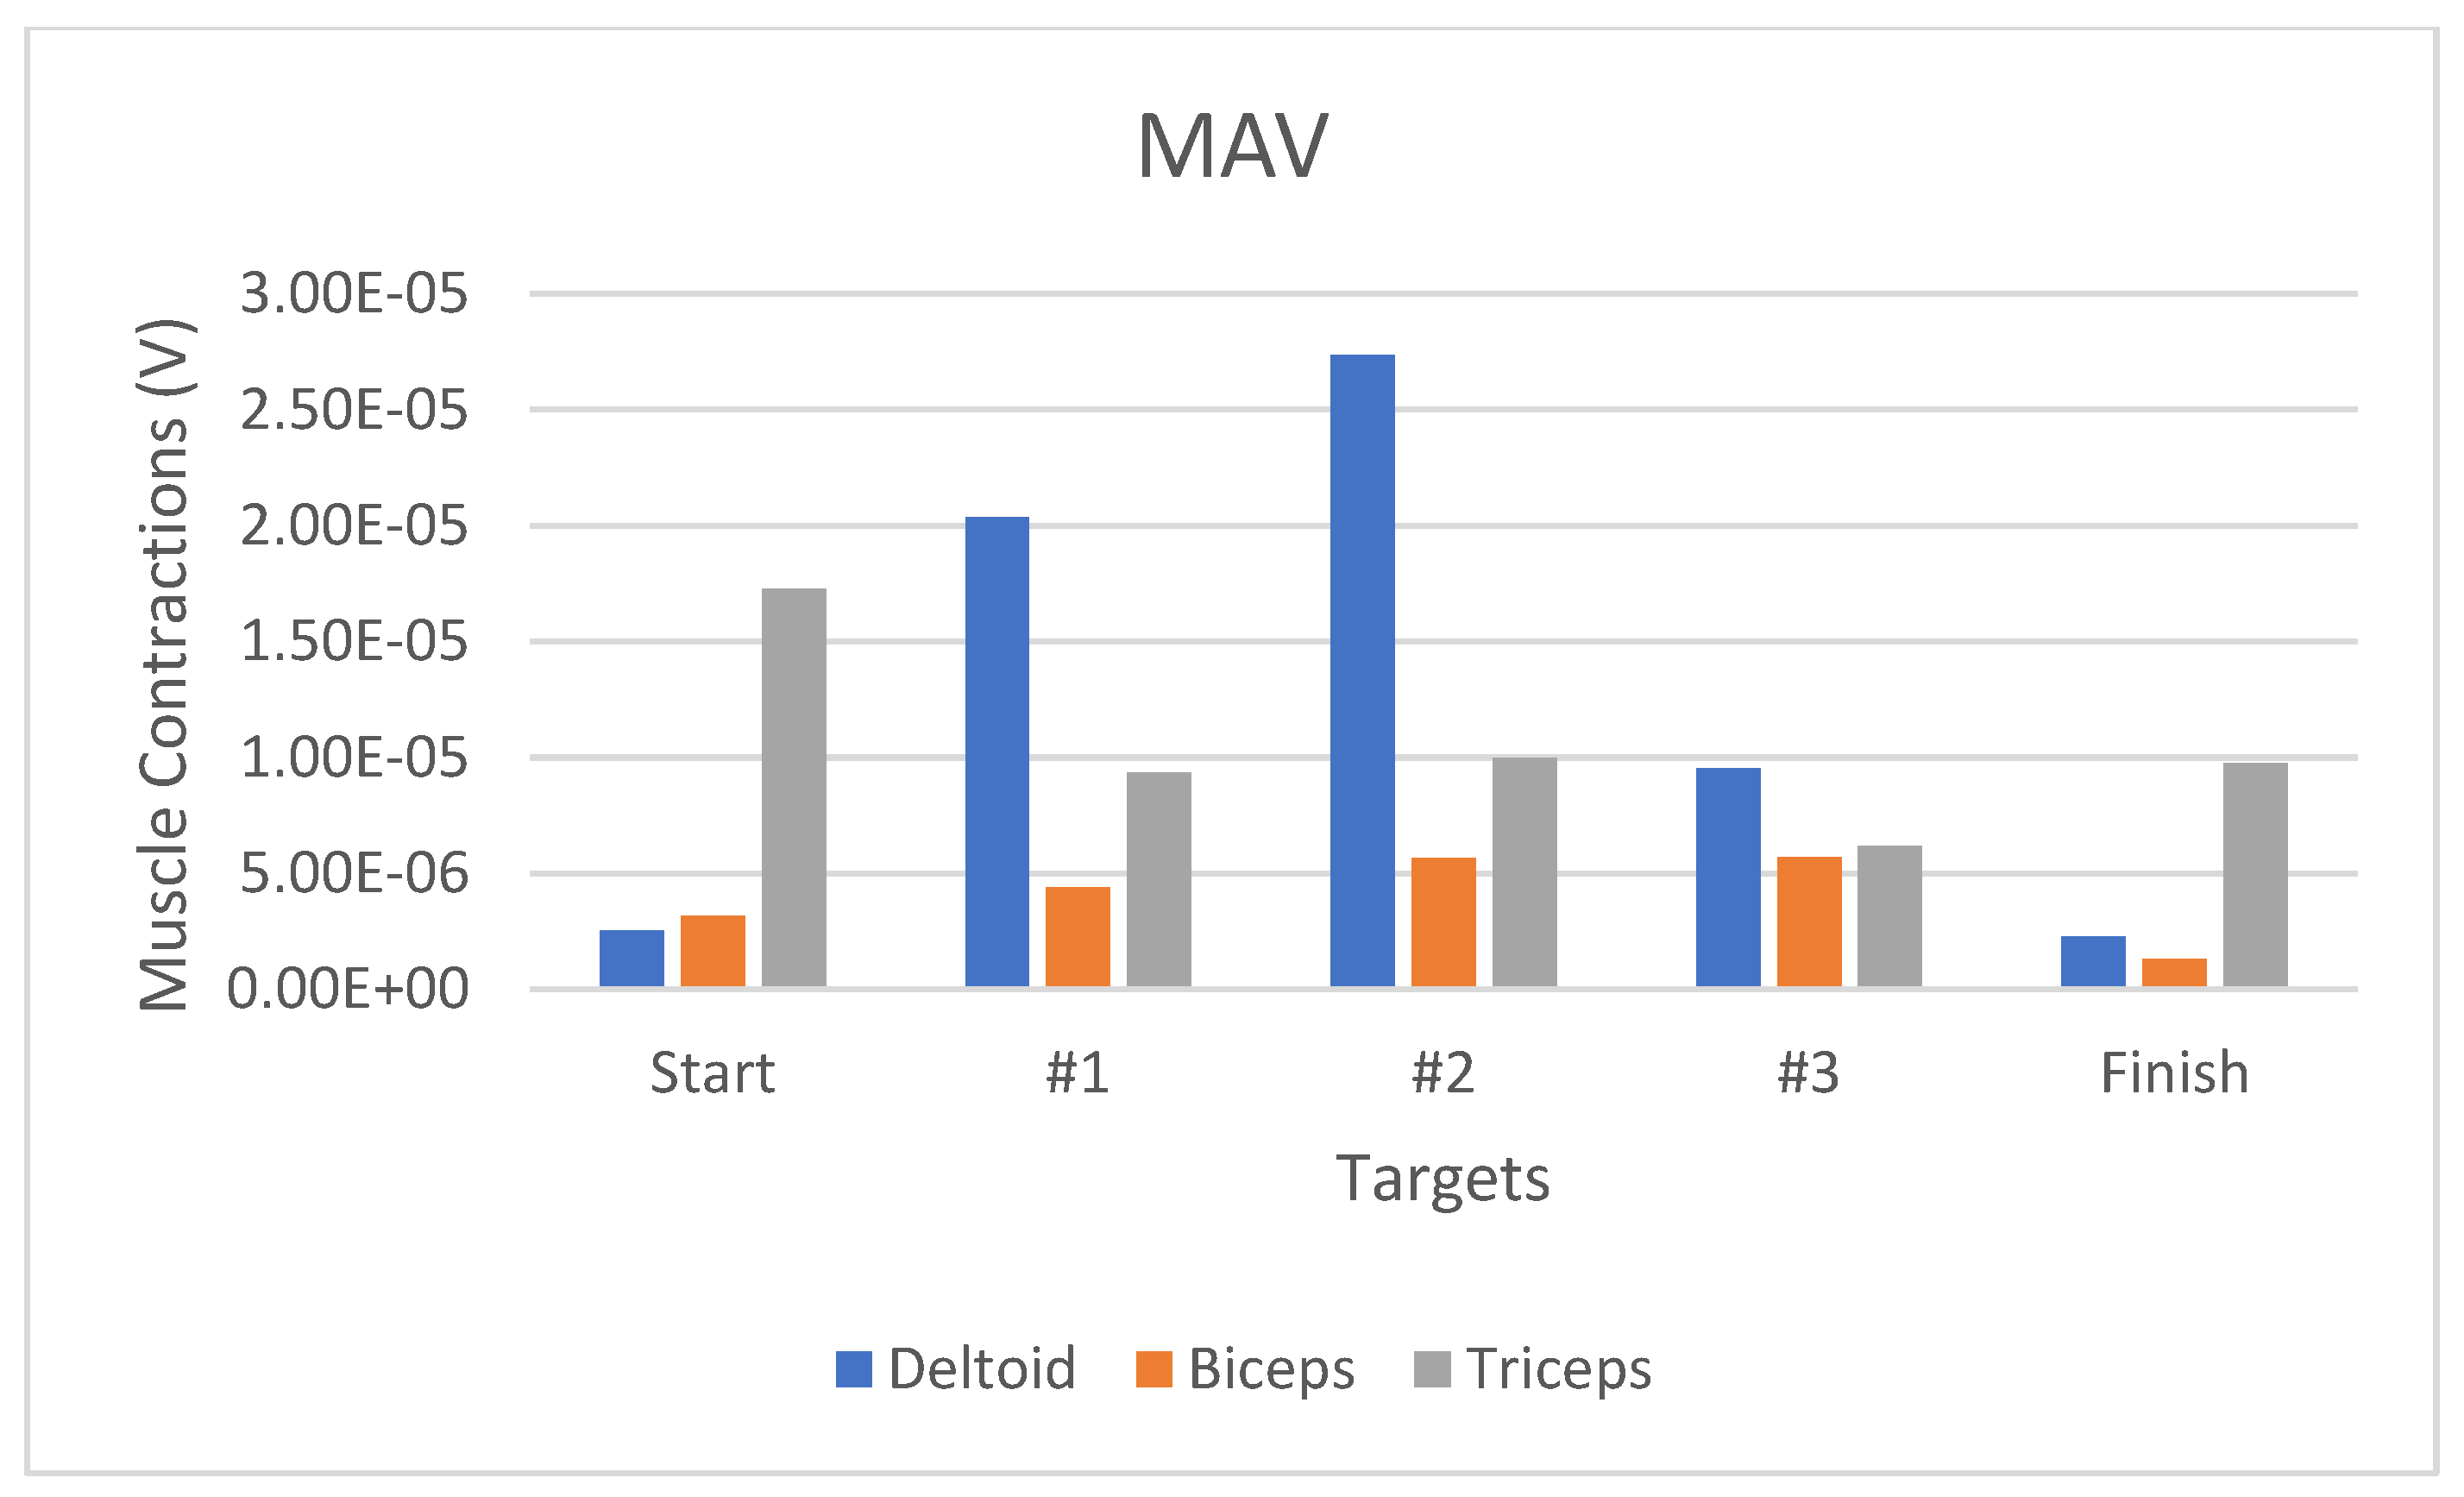
Figure 15 displays the muscle activity RMS bar graph when completing Game #2. The deltoid muscle underwent significant activity changes, especially when moving from the start position (3.12 µV) to Target #1 (27.97 µV), indicating a significant increase in the activities by 797.74% (
Figure 15). In addition, concerning the muscle activity for the MAV feature, the changes in the deltoid muscle contraction were 17.82 µV or had increased by 707.8% (
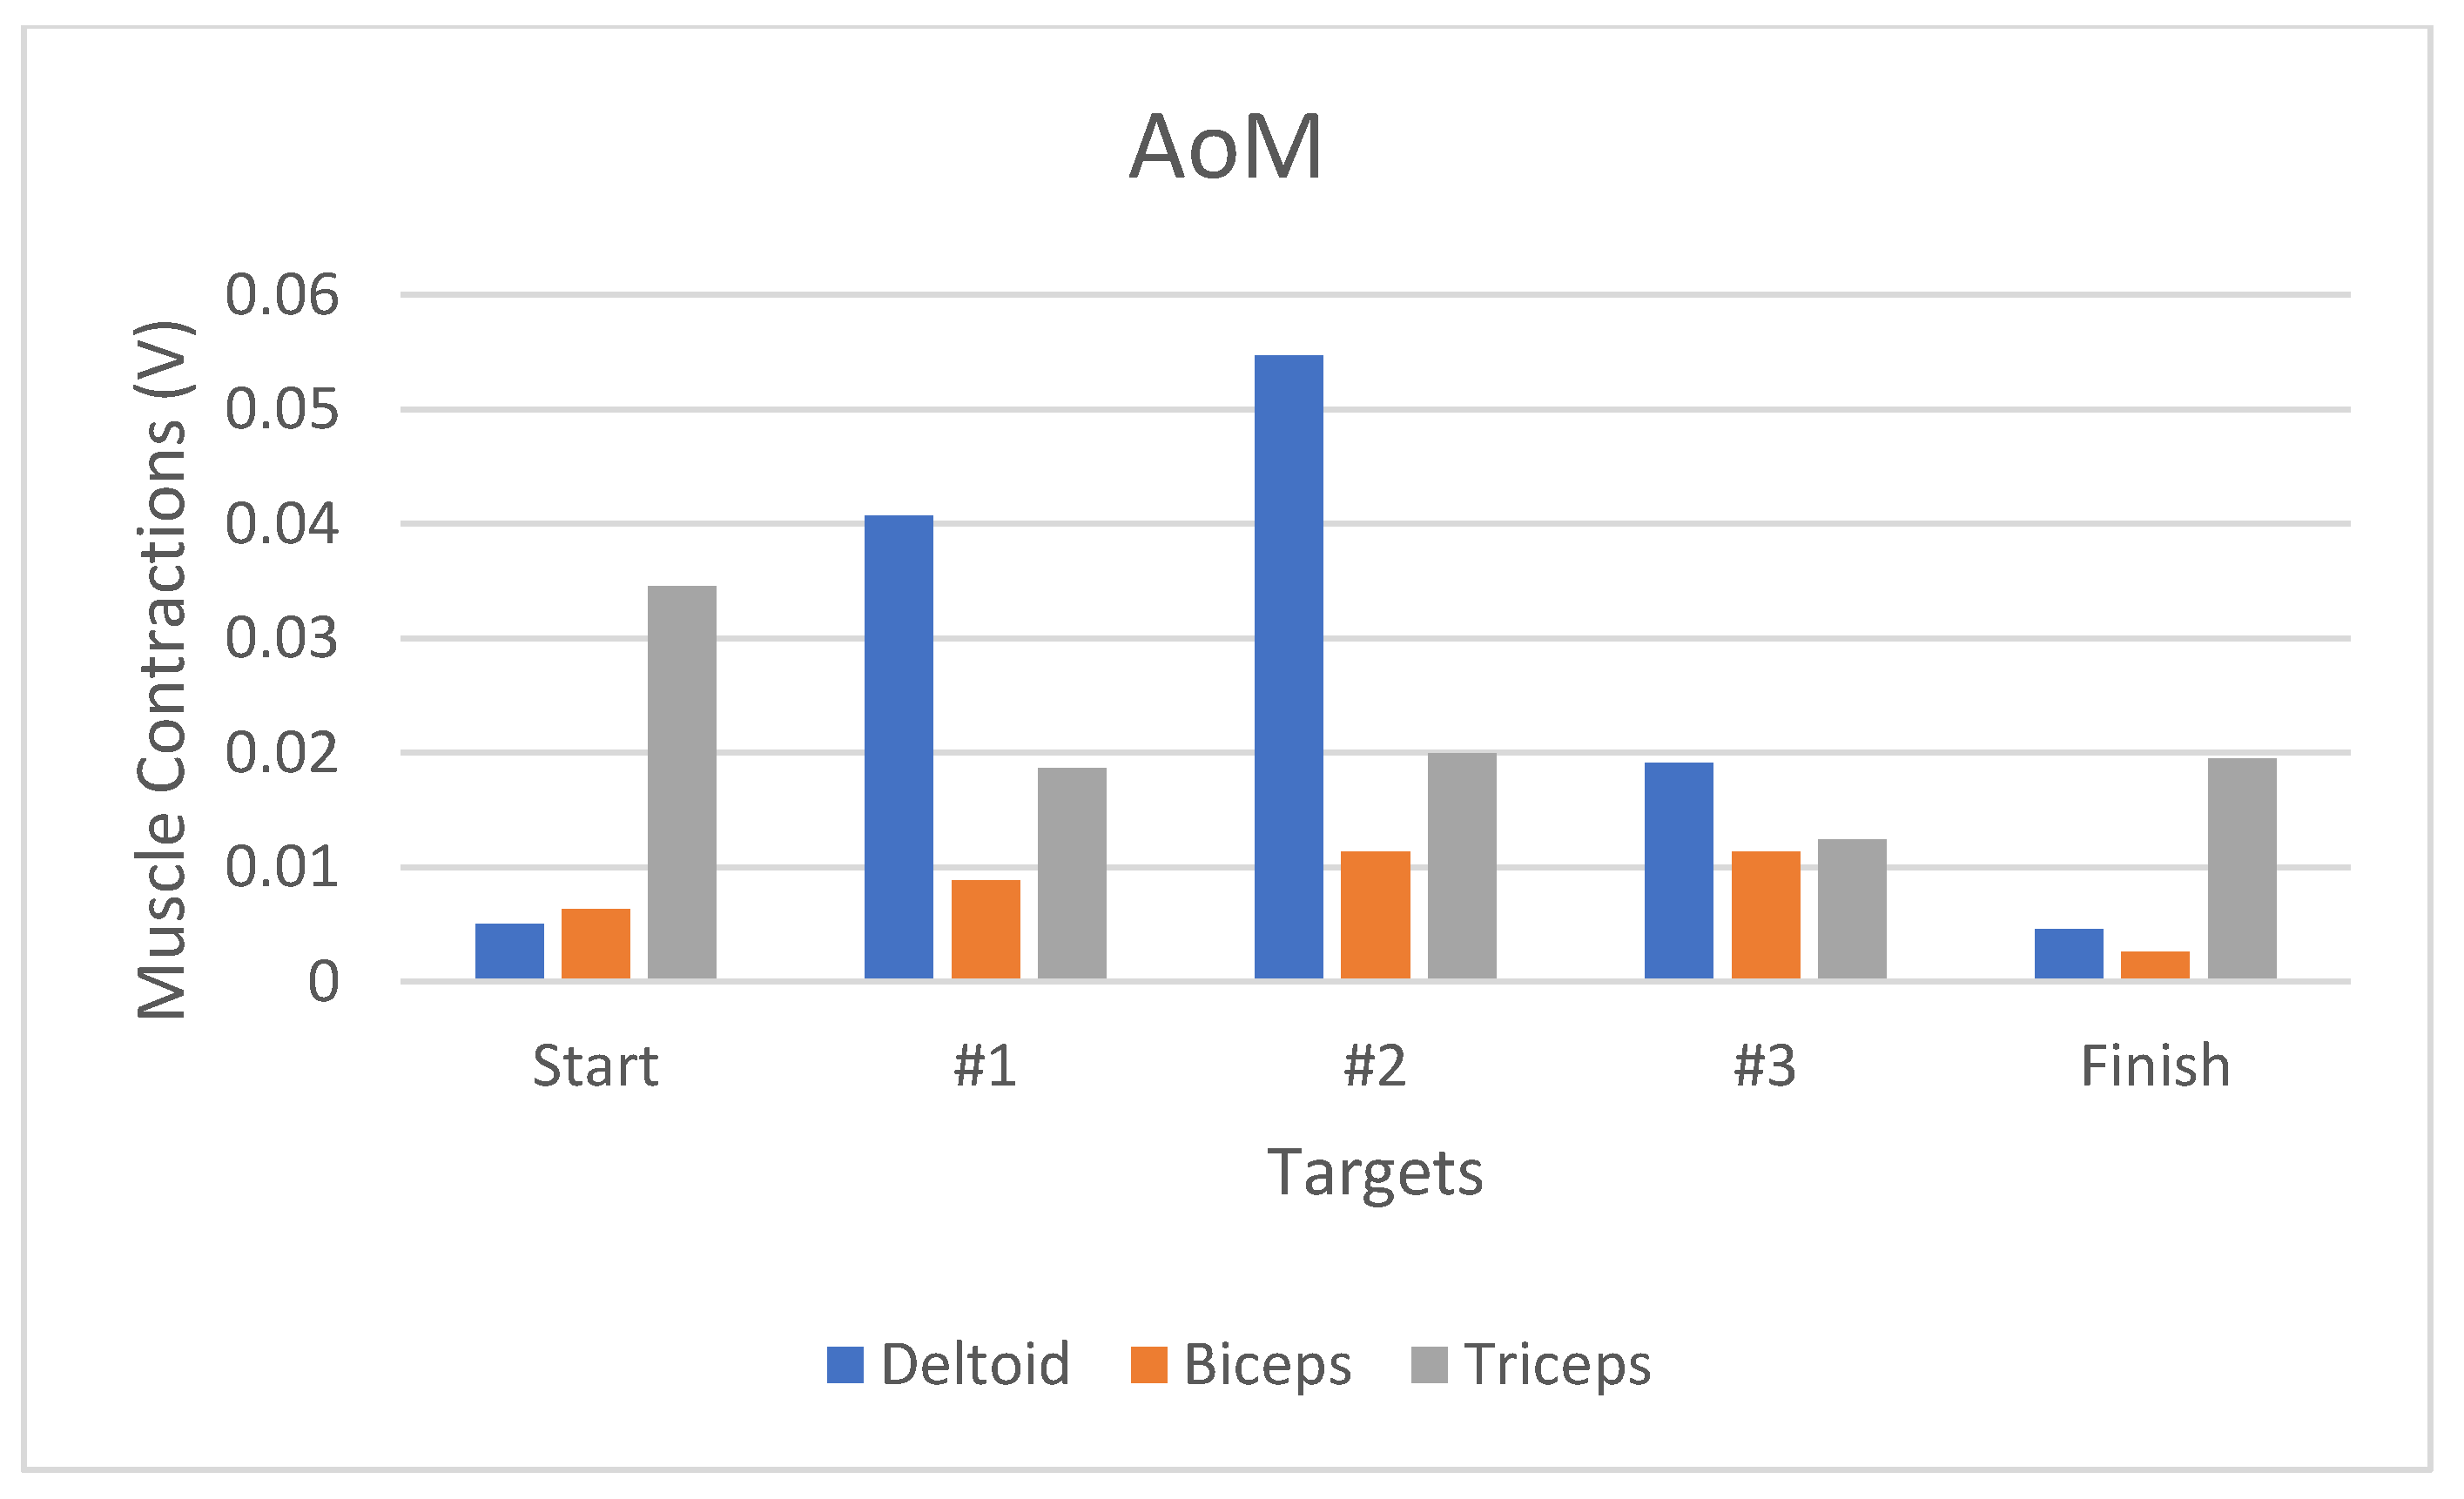
Figure 16). Moreover, the AoM-represented deltoid muscle contraction-related changes increased by 708.2% (
Figure 17).
The deltoid muscle contraction-related RMS-represented changes between the start–Target #1, Target #2–#3, and Target #3–finish positions were higher than those of MAV and AoM.
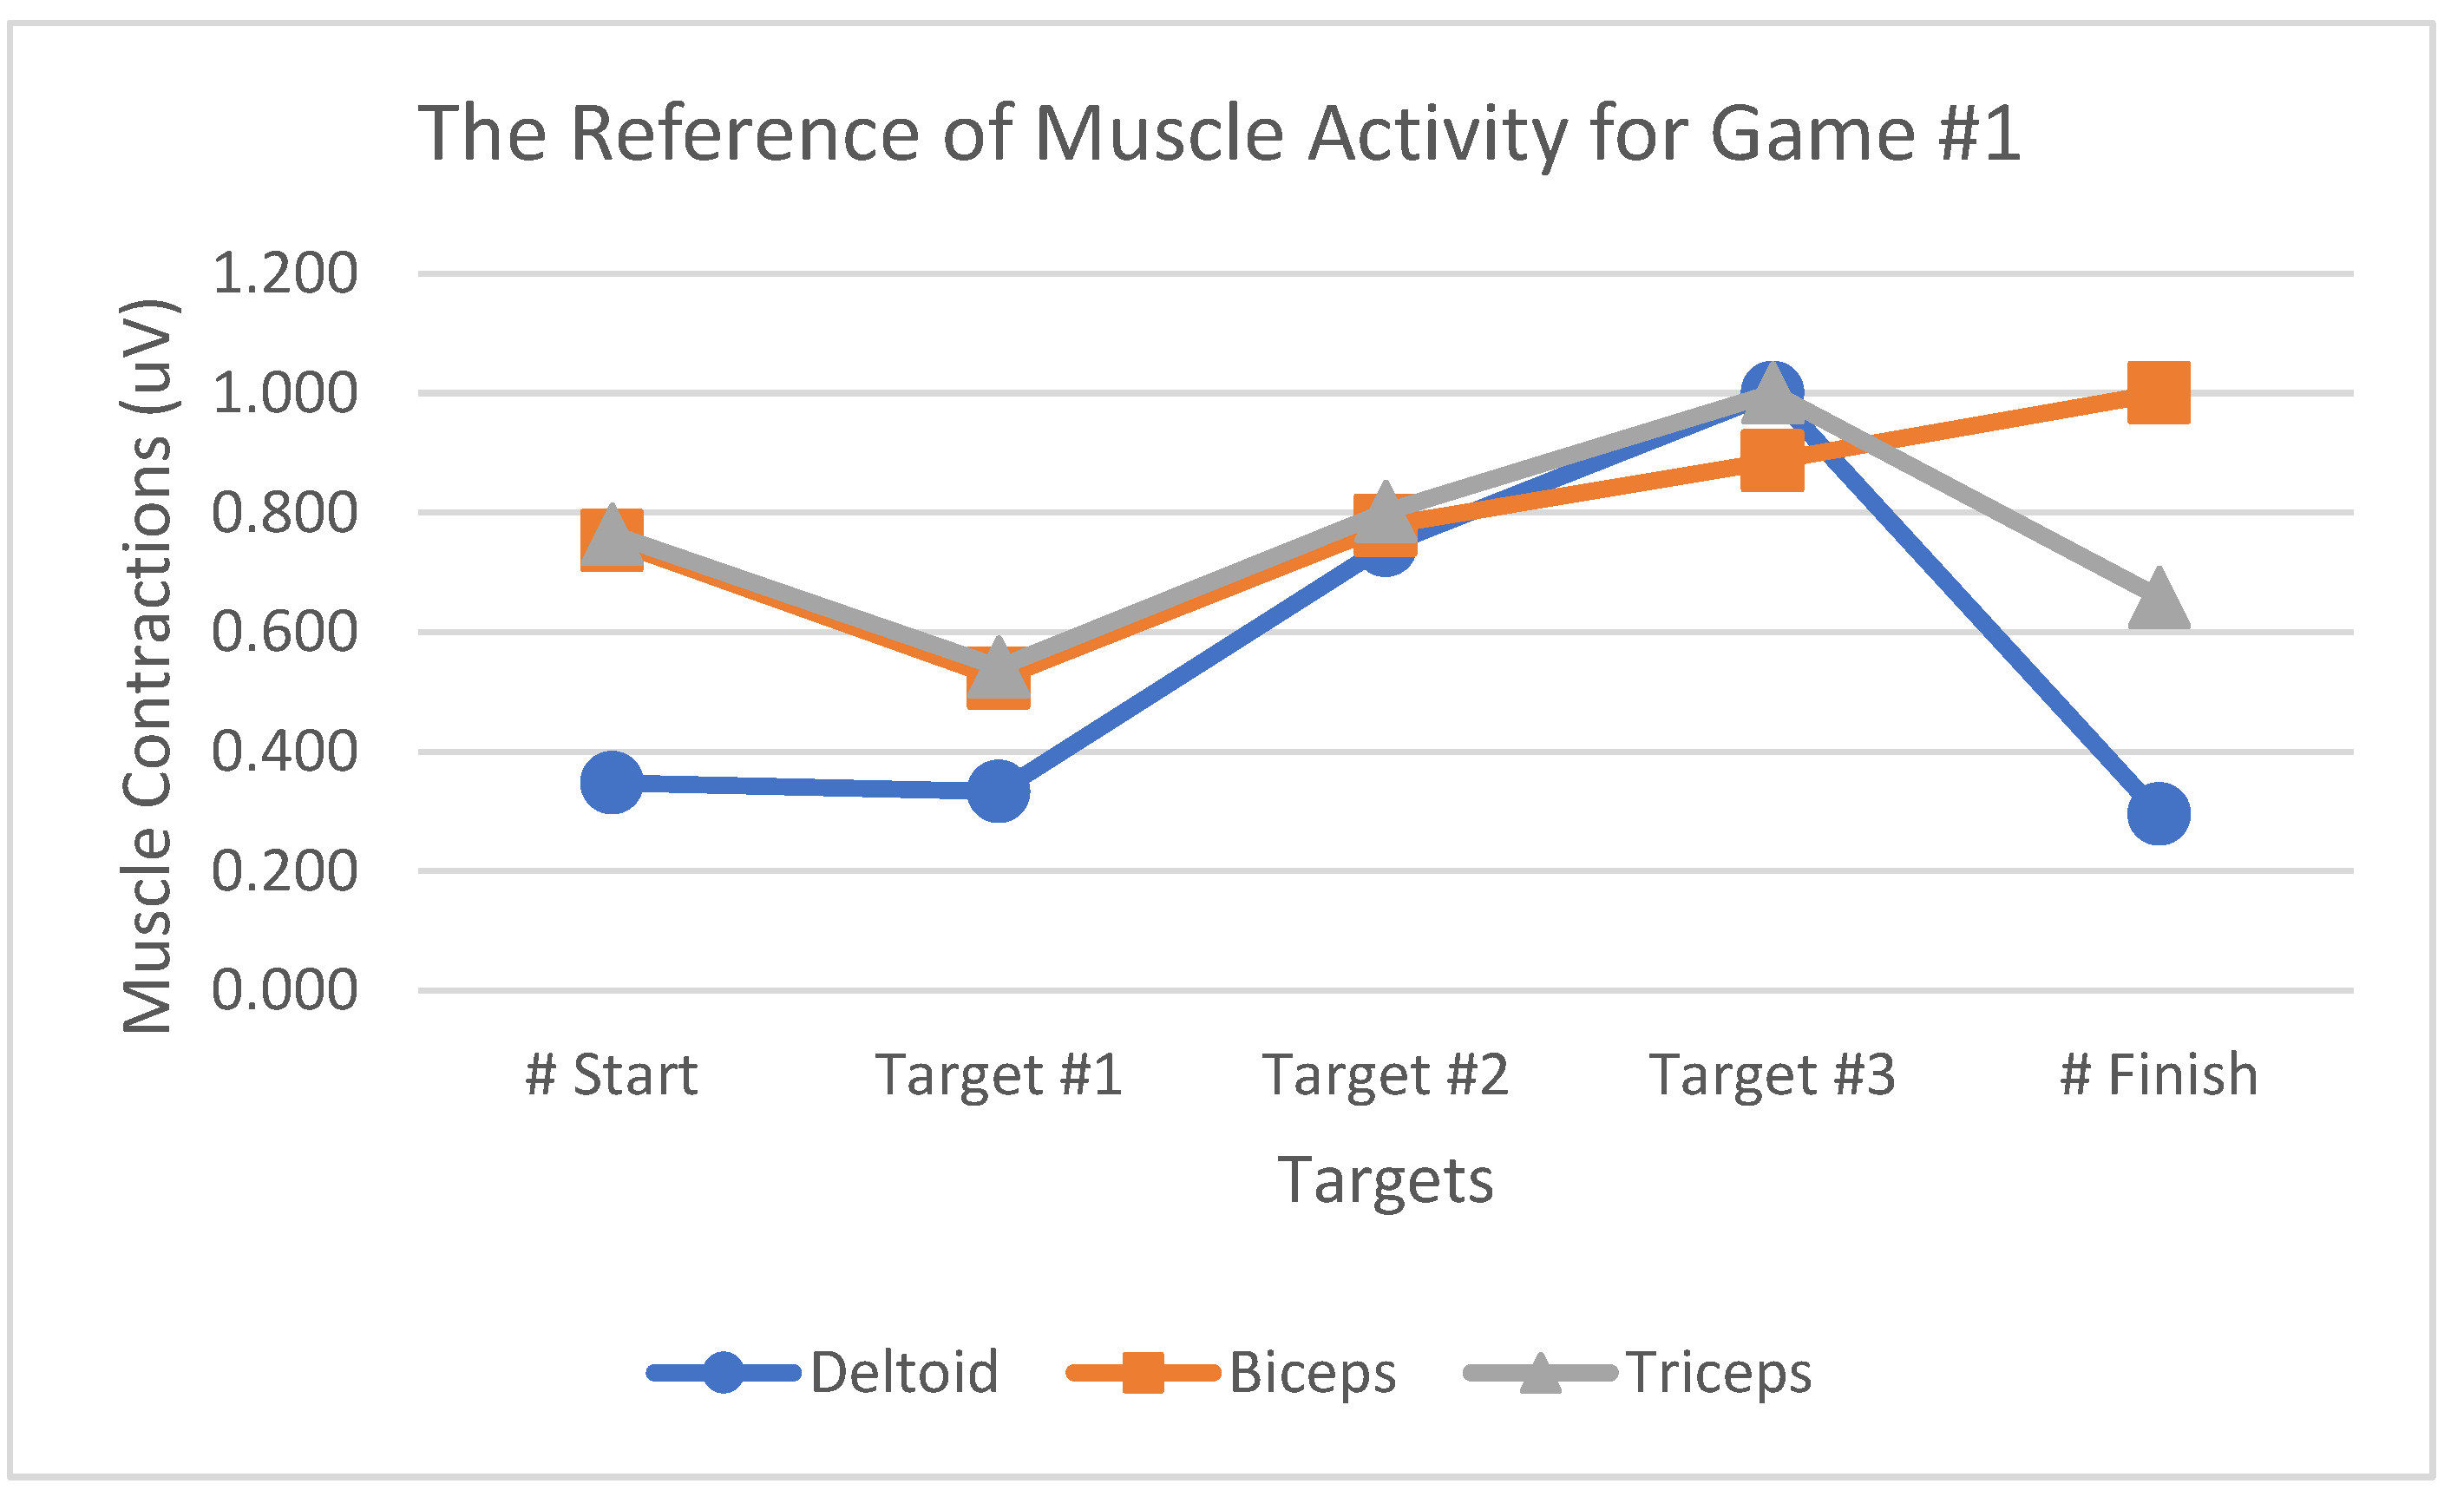
Table 1 summarizes the muscle activity value changes for Game#2. The MAV and RMS values exhibit the same percentages as both were obtained using the same calculation method by summing up the absolute muscle contraction values. The value of RMS, which reflected the root of the muscle contraction values, was the most suitable way to present changes in muscle activities during the game because it reflected a high percentage of changes between each movement in the games. The bar graph indicates that RMS, MAV, and AoM could represent deltoid, biceps, and triceps muscle activities while playing the games. However, the RMS was the most suitable to highlight muscle activity-related changes during the game since it represents a fairly high percentage of changes between each movement in the games. The effectiveness evaluation was performed by comparing the testing and reference values, the latter denoting the average muscle contraction value when playing a game obtained from ten selected participants. The selected participants were based on the muscle contractions of the deltoid muscle during playing the game. The testing value was that of muscle contractions that would be used to evaluate the VR games, obtained from those five other participants who were not included among the above-mentioned reference participants. In this analysis, we tested a total of five participants (i.e., two males and three females) and analyzed the muscle activity reference patterns from each game (
Figure 18,
Figure 19 and
Figure 20). The muscle contraction patterns produced by the selected participants were clear with a sequence as shown in the results. The reference participants comprised three females and seven males with right-hand dominance in their daily activities.
The muscle activation analyses indicated a decreasing muscle contraction value when the hand of the participant reached the Finish position. The muscle contraction value produced at that moment was that when reaching the start position. The reduced muscle contractions in these games could be caused by muscle fatigue. Muscle force production involves a sequence of events, extending from cortical excitation to motor unit activation to excitation-contraction coupling, ultimately leading to muscle activation, which could affect muscle fatigue.
We used cosine similarity to evaluate the rehabilitation exercise efficacy of the games by comparing the testing and reference values. The cosine similarity value ranged between 0 and 1 if the two vectors with the same coordinates displayed a cosine similarity of 1. Cosine similarity in muscle activity is used to analyze muscle improvements during rehabilitation. If the cosine similarity value approaches 1, then the muscle activity during rehabilitation approaches the desired muscle pattern.
Table 2 presents the cosine similarity values from the Game #1 deltoid, biceps, and triceps muscles for Sessions #1–3, indicating that all the participants’ deltoid muscle activity improved to the desired muscle pattern during rehabilitation in Game #1. Regarding biceps muscle activity, four participants exhibited improvements in muscle activity, approaching the desired muscle pattern in Game #1, whereas one participant did not. The cosine similarity value of Participant #4 reduced, indicating no improvement, which also resulted in reduced muscle activity, although the cosine similarity value increased by 0.153 from Session #1 to Session #2. The triceps muscle activity improved in participants #2 and #5, whereas three participants showed no improvement. The EMG data indicated movement-related improvement toward the desired muscle pattern based on the RMS value, which reflected the root of the muscle contraction values; this was the most suitable way to represent muscle activity-related changes and range of motion during the game.
Table 3 represents the cosine similarity value from the Game #2 deltoid, biceps, and triceps muscles for each session. All participants exhibited improved deltoid and biceps muscle activities, but only two of them displayed triceps-related improvements. Related to the deltoid muscle, the highest and lowest increase could be observed in Participants #5 and #4, respectively. All the participants demonstrated biceps-related improvements, with Participant #1 exhibiting both the highest and the lowest increase. Participants #3 and #4 displayed improvement in triceps-related values.
Table 4 summarizes the cosine similarity values from the Game #3 deltoid, biceps, and triceps muscles for each session. Four participants displayed deltoid muscle activity-related improvements. For the biceps and triceps, two and three participants have shown improvement, respectively. Participants #5 and #4 presented the most s and least significant improvement in the deltoid muscle, respectively. For the biceps muscle, two participants improved and three did not. For the triceps muscle, Participants #1, #3, and #4 showed an improvement but Participants #2 and #5 did not.
The analyses of Games #1–3 showed that the deltoid, biceps, and triceps exhibited percentage improvements of 93%, 73%, and 47%, respectively. The deltoid muscle activity yielded a higher percentage as it was more dominant in the movement, similar to shoulder abduction and adduction. Based on the analysis, these games are suitable for shoulder motor and deltoid muscle treatments. Finally, based on the results biceps and triceps muscles, these games are not suitable for treating both muscles.
4. Discussion
In this study, we developed a rehabilitation game based on the upper limb movement sequence that included easy and gradual movements.
Figure 8 illustrates the envelope signal from the deltoid, biceps, and triceps muscles during upper limb movements for Participant #1. Notably, deltoid muscle contractions were more pronounced than those of the biceps and triceps, reflecting shoulder abduction and adduction movements. However, the biceps and triceps muscle contractions were less obvious due to the absence of elbow flexion and extension movements during upper limb movements. Subsequent muscle activity analysis during Games #1, #2, and #3 provided insights into the different characteristic muscle contraction patterns associated with different game sequences.
Figure 8,
Figure 9,
Figure 10,
Figure 11,
Figure 12 and
Figure 13 present raw EMG mean value and standard deviation for the signals and
Figure 14 presents the deltoid muscle-related peak detection results for Games #1–3. Notably, different game sequences resulted in distinct muscle contraction patterns, with variations observed in peak numbers and muscle activity levels. In addition, feature extraction techniques (RMS, MAV, and AoM) were applied to assess changes in muscle activity during the game, with RMS being identified as the most suitable method for capturing muscle activity-related changes.
Table 1 summarizes the changes in muscle activity for Game #2, indicating significant increases in muscle activity as participants progressed through the game.
Our interpretation of the muscle contraction pattern indicated that the designed games effectively represented upper limb movement sequences, as evidenced by the discernible muscle contraction patterns observed during the game. Notably, stronger muscle contractions could be observed when participants reached targets located farther away, suggesting a relationship between target distance and muscle engagement. Furthermore, the consistent muscle contraction patterns observed across participants indicated the reliability of the rehabilitation games in eliciting targeted muscle activities. We applied a cosine similarity analysis-based evaluation of the changes in muscle activity to evaluate the efficacy of the rehabilitation games in promoting the desired muscle activity patterns.
Table 2,
Table 3 and
Table 4 present the cosine similarity values for the deltoid, biceps, and triceps muscles during Games #1–3, indicating varied degrees of muscle activity improvement among the participants. Deltoid muscles exhibited the highest percentage of improvement, followed by the biceps and triceps muscles, suggesting that the games are particularly effective for shoulder motor and deltoid muscle treatments. Our overall results demonstrate the potential of VR-based rehabilitation games in promoting targeted muscle activities during upper limb movement sequences. By leveraging motion sequence gameplay and EMG signal analysis, our study provides valuable insights into VR-based rehabilitation efficacy in post-stroke patients. These results pave the way for further research aimed at optimizing game design and tailoring rehabilitation interventions for individual patient needs.
This study aimed to investigate a dedicated upper limb movement sequence for post-stroke rehabilitation, focusing on the "easy - gradual - easy" activity progression. The designed games were analyzed for deltoid muscle engagement, demonstrating adherence to the prescribed movement sequence criteria and supporting their suitability for upper limb stroke rehabilitation. Various factors, including subject-to-target distance, reachable area, and rehabilitation criteria, were considered during game design. Utilizing a nonimmersive approach in VR game development facilitated low computational demands, minimal equipment prerequisites, and seamless installation, employing Kinect Xbox One and the UNITY game engine. The examination of VR game rehabilitation showcased their intriguing and safe potential for stroke patient rehabilitation.
Peak-to-peak detection using a 20% threshold enabled muscle contraction peak extraction, facilitating muscle contraction detection during upper limb movement sequences. Three feature extractions (RMS, MAV, and AoM) effectively represented muscle contractions during gameplay, with RMS emerging as the most suitable metric for discerning muscle activity changes. The observed consistent changes in RMS values across repetitive interventions suggest efficient modulation of muscle activity, indicating potential motor function and muscle strength improvement, particularly in the deltoid and biceps. These findings underscore RMS’s usefulness as a quantifiable muscle contraction measure in upper limb rehabilitation, contributing to the stroke rehabilitation field.
The effectiveness of MAV and AoM in monitoring muscle activity during VR-based rehabilitation games was also demonstrated, offering quantitative and qualitative insights into muscle contractions. The dynamic interplay between these metrics provides a comprehensive understanding of muscle activity changes, enhancing rehabilitation progress assessment. Cosine similarity emerged as a robust performance improvement indicator, demonstrating enhanced game performance and motor function recovery among stroke survivors engaged in repetitive interventions. The gradual rise in cosine similarity values underscored progressive muscle contraction improvement, offering valuable insights into post-stroke rehabilitation optimization.
5. Conclusions
This study introduced a novel rehabilitation system that incorporates virtual reality (VR) to facilitate upper limb movement exercises, particularly targeting post-stroke rehabilitation. By engaging participants in VR games designed with specific movement sequences, we were able to record and analyze electromyography (EMG) signals, revealing distinct muscle activity patterns in key muscle groups such as the deltoid, biceps, and triceps. Our analysis indicated that each movement pattern elicited unique improvements in muscle activity, with the deltoid muscle showing the highest levels of engagement, particularly during shoulder abduction and adduction movements. The effectiveness of feature extraction techniques, notably root mean square (RMS) values, in capturing these muscle activity changes was also demonstrated. This suggests RMS as a valuable metric for monitoring and quantifying muscle contractions during rehabilitation exercises. The results further highlight the potential of VR-based rehabilitation games in enhancing motivation and engagement among patients, contributing to better rehabilitation outcomes. The immersive VR environment not only provides an engaging platform for patients but also facilitates consistent and reliable muscle activity patterns across different participants. This consistency underscores the system's potential effectiveness in promoting targeted muscle activities and facilitating motor function recovery.
Future research should focus on identifying the most effective movement patterns to optimize muscle activity and address specific muscle conditions during rehabilitation exercises. Enhancing game functionality by incorporating more challenging levels and comprehensive hand rehabilitation exercises will be essential to ensure holistic recovery and functional improvement in stroke survivors. By integrating these elements, future studies can advance the field of VR-based stroke rehabilitation, ultimately improving overall patient well-being and recovery. In our study, we did not perform statistical analyses to compare the Root Mean Square (RMS), Mean Absolute Value (MAV), and Angle of Movement (AoM) values of the three muscles to quantify the p-values. We recognize that such statistical comparisons could provide valuable insights into the differences and relationships between these metrics across the studied muscles. To address this, we plan to conduct statistical analyses, including tests such as ANOVA or paired t-tests, to compare RMS, MAV, and AoM values among the muscles. The results of these analyses will be reported in future work, offering a more comprehensive understanding of the relationships between muscle metrics and their impact on the study's outcomes.
Author Contributions
Conceptualization, Z. Ibrahim and B.N. Cahyadi; methodology, Z. Ibrahim. and B.N. Cahyadi; software, B.N. Cahyadi; validation, Z. Ibrahim; formal analysis, Z. Ibrahim and B.N. Cahyadi; investigation, B.N. Cahyadi; resources, Z. Ibrahim and A. Aziz; data curation, B.N. Cahyadi; writing—original draft preparation, Z. Ibrahim; writing—review and editing, Z. Ibrahim; funding acquisition, Z. Ibrahim and A. Shamil. All authors have read and agreed to the published version of the manuscript.
Funding
The authors gratefully acknowledge the financial support provided for this research project by the Internal Research Grant (IRG), No.: UTB/GSR/2/2022(19) from Universiti Teknologi Brunei.
Data Availability Statement
The data that support the findings of this study are available from the corresponding author upon reasonable request.
Acknowledgments
The authors wish to express their heartfelt appreciation to Universiti Teknologi Brunei (UTB) for their generous provision of facilities and equipment crucial to the success of this project. Our deep gratitude also goes out to the University Malaysia Perlis, especially Ir. Dr. Wan Khairulnizam for their invaluable contributions, as this research was undertaken as part of a master’s degree student project.
Conflicts of Interest
The authors declare no conflicts of interest.
References
- World Health Organization, “The top 10 causes of death,” 24 May 2018. [Online]. Available: https://www.who.int/news-room/fact-sheets/detail/the-top-10-causes-of-death.
- W. Johnson, O. Onuma, M. Owolabi and S. Sachdev, “Stroke: A global response is needed,” Bulletin of the World Health Organization, vol. 94, no. 9, pp. 634-634A, 2016.
- S. K. L. Nguyen and M. Ha, “Elderly stroke rehabilitation: Overcoming the complications and its associated challenges,” Current Gerontology and Geriatrics Research, vol. 2018, no. 9853837, pp. 1-9, 2018.
- Mayo Clinic, “Stroke rehabilitation: What to expect as you recover,” 24 May 2017. [Online]. Available: http://www.mayoclinic.org/stroke-rehabilitation/art-20045172.
- V. Gray, C. L. Rice and S. J. Garland, “Factors that influence muscle weakness following stroke and their clinical implications: A critical review,” Physiotherapy Canada. Physiotherapie Canada, vol. 64, no. 4, pp. 415-426, 2012. [CrossRef]
- M. Trombetta, P. P. Bazzanello Henrique, M. R. Brum, E. L. Colussi, A. C. B. De Marchi and R. Rieder, “Motion Rehab AVE 3D: A VR-based exergame for post-stroke rehabilitation,” Computer Methods and Programs in Biomedicine, vol. 151, pp. 15-20, 2017. [CrossRef]
- M. Kultu, C. T. Freeman, E. Hallewell, A.-M. Hughes and D. S. Laila, "Upper-limb stroke rehabilitation using electrode-array based functional electrical stimulation with sensing and control innovations," 2016. [CrossRef]
- S. H. Lee, J. Y. Lee, M. Y. Kim, Y. J. Jeon, S. Kim and J. H. Shin, “Virtual reality rehabilitation with functional electrical stimulation improves upper extremity function in patients with chronic stroke: A pilot randomized controlled study,” Archives of Physical Medicine and Rehabilitation, vol. 99, no. 8, pp. 1447-1453.e1, 2018. [CrossRef]
- R. R. Serrezuela, E. M. Reyes, R. S. Zamora and A. A. S. Leon, “Perspective Chapter: Classification of grasping gestures for robotic hand prostheses using deep neural networks,” In Human-Robot Interaction-Perspectives and Applications. IntechOpen. 2023.
- R. R. Serrezuela, M. T. Quezada, M. H. Zayas, A. M. Pedrón, D. M. Hermosilla and R. S Zamora, “Robotic therapy for the hemiplegic shoulder pain: a pilot study,” Journal of Neuroengineering and Rehabilitation, vol. 17, no. 1, pp. 1-12, 2020. [CrossRef]
- M. Á. T. Cardozo, R. R. Serrezuela, J. L. A. Trujillo, R. S. Zamora and E. M. Reyes, “Design and implementation of a robotic hand prosthesis under the tensegrity approach for transradial amputees,” ARPN Journal of Engineering and Applied Sciences, vol. 16, no. 4, pp. 503-508, 2021.
- I. Zunaidi, S. K. Hamizan, A. Azlan, M. Maziri, R. Shamil, H. Z. Malai, “Design and Development of an Advanced Upper Limb Rehabilitation Robot for Post-Stroke Rehabilitation,” 6th International Conference on Applied Computational Intelligence in Information Systems: Intelligent and Resilient Digital Innovations for Sustainable Living, ACIIS IEEE 2023.
- I. Zunaidi, R. Nagarajan, M. Rizon, D. Hazry, D. Ruslizam, C. O. Azlin, “Electromyography Signal Based for Intelligent Prosthesis Design,” 4th Kuala Lumpur International Conference on Biomedical Engineering 2008, 01/2008: pages 187-190.
- Z. Zhang, Q. Fang and X. Gu, “Objective assessment of upper limb mobility for post-stroke rehabilitation,” IEEE Transactions on Bio-Medical Engineering, vol. 63, no. 4, pp. 859-868, 2016. [CrossRef]
- S. C. Yeh, S. H. Lee, J. C. Wang, S. Chen, Y. T. Chen, Y. Y. Yang, H. R. Chen, and Y. P. Hung, “Virtual reality for post-stroke shoulder-arm motor rehabilitation: Training system & assessment method," 2012 IEEE 14th International Conference on e-Health Networking, Applications and Services (Healthcom), 10-13 Oct. 2012 .
- M. Kultu, C. Freeman, A.-M. Hughes and M. Spraggs, “A home-based FES system for upper-limb stroke rehabilitation with iterative,” The International Federations of Automation Control (IFAC), vol. 50, no. 1, pp. 12089-12094, 2017.
- M. H. Lee, J. S. Ryu, and W. H. Kim, "A Virtual Reality-Based Exercise Program for Improving Postural Control in Chronic Stroke Survivors: A Randomized, Controlled Study," Journal of Physical Therapy Science, vol. 28, no. 6, pp. 2183–2186, 2016.
- L. M. Pinho, M. E. Amorim, A. d. S. Sousa, and A. S. D. Alves, "Upper Limb Motion Analysis Using Kinect V2: A Case Study in Stroke Patients," Studies in Health Technology and Informatics, vol. 269, pp. 25-31, 2020. [CrossRef]
- M. A. Rahman, P. K. Das, and A. K. Roy, "A Motion Capture-Based System for Evaluating Upper Limb Motor Function in Post-Stroke Rehabilitation," Journal of Biomechanical Engineering, vol. 142, no. 4, pp. 041002-041011, 2020. [CrossRef]
- Z. Zhang, G. Zhou, J. Yin, S. Yang, and Y. Wang, "Development of a Real-Time Motion Capture and EMG-Based Upper Limb Rehabilitation System Using Kinect and Wearable Sensors," IEEE Access, vol. 8, pp. 18694–18703, 2020. [CrossRef]
- M. Pedraza-Hueso, S. Martín-Calzón, F. J. Díaz-Pernas and M. Martínez-Zarzuela, “Rehabilitation using Kinect-based game and virtual reality,” Procedia Computer Science, vol. 75, pp. 161-168, 2015. [CrossRef]
- N. Nazmi, M. A. A. Rahman, S. I. Yamamoto, S. A. Ahmad, H. Zamzuri and S. A. Mazlan, “A review of classification technique of EMG signal during isometric and isotonic contractions,” Journal of Sensors, vol. 16, no. 8, pp. 1-28, 2016. [CrossRef]
- C. B. Noor, W. Khairunizam, S. Diny Syarifah, I. Zunaidi, L. H. Ling, A. B. Shahriman, M. R. Zuradzman and W. A. Mustafa, “Arm games for virtual reality based post-stroke rehabilitation,” Intelligent manufacturing and mechatronics, vols. 01/2020, pp. 91-101.
- H. J. Hermens, Merletti and B. Freriks, “European Recommendations for Surface Electromyography,” Torino, Italy: Roessingh Research and Development, 1999.
- DELSYS INC., “Bagnoli EMG System User Manual,” Boston. United States: DELSYS INC., 2003.
- W. M. Laaghari, M. U. Baloch, M. A. Mengal and S. J. Shah, “Performance analysis of analog butterworth low pass filter as compared to Chebyshev Type-I filter, Chebyshev Type-II filter and elliptical filter,” Circuit and System, vol. 5, no. 9, pp. 209-216, 2014.
Figure 1.
The VR environment for upper limb recovery setup.
Figure 1.
The VR environment for upper limb recovery setup.
Figure 2.
The Upper limb movement sequence design (a) Game #1, (b) Game #2, and (c) Game #3.
Figure 2.
The Upper limb movement sequence design (a) Game #1, (b) Game #2, and (c) Game #3.
Figure 3.
The motion photo for the Game #1 movement steps.
Figure 3.
The motion photo for the Game #1 movement steps.
Figure 4.
The motion photo of the Game #2 movement steps.
Figure 4.
The motion photo of the Game #2 movement steps.
Figure 5.
The motion photo of the Game #3 movement steps.
Figure 5.
The motion photo of the Game #3 movement steps.
Figure 6.
DE 2.1 Single Differential Surface EMG Sensor. The surface EMG signal is the result of the potential difference between V1 and V2 on the skin surface [
25].
Figure 6.
DE 2.1 Single Differential Surface EMG Sensor. The surface EMG signal is the result of the potential difference between V1 and V2 on the skin surface [
25].
Figure 7.
The muscle contraction patterns for each session with the normalized point.
Figure 7.
The muscle contraction patterns for each session with the normalized point.
Figure 8.
The Mean Value EMG Envelope Signal for Deltoid Muscle from Game #1.
Figure 8.
The Mean Value EMG Envelope Signal for Deltoid Muscle from Game #1.
Figure 9.
The Mean Value EMG Envelope Signal for Deltoid Muscle from Game #2.
Figure 9.
The Mean Value EMG Envelope Signal for Deltoid Muscle from Game #2.
Figure 10.
The Mean Value EMG Envelope Signal for Deltoid Muscle from Game #3.
Figure 10.
The Mean Value EMG Envelope Signal for Deltoid Muscle from Game #3.
Figure 11.
The Standard Deviation EMG Envelope Signal for Deltoid Muscle from Game#1.
Figure 11.
The Standard Deviation EMG Envelope Signal for Deltoid Muscle from Game#1.
Figure 12.
The Standard Deviation EMG Envelope Signal for Deltoid Muscle from Game#2.
Figure 12.
The Standard Deviation EMG Envelope Signal for Deltoid Muscle from Game#2.
Figure 13.
The Standard Deviation EMG Envelope Signal for Deltoid Muscle for Game#3.
Figure 13.
The Standard Deviation EMG Envelope Signal for Deltoid Muscle for Game#3.
Figure 14.
The graph for (A), (B), and (C) of the raw EMG signal and filtered the peak detection results.
Figure 14.
The graph for (A), (B), and (C) of the raw EMG signal and filtered the peak detection results.
Figure 15.
Muscle activity value using RMS for the Deltoid, Biceps, and Triceps.
Figure 15.
Muscle activity value using RMS for the Deltoid, Biceps, and Triceps.
Figure 16.
Muscle activity value using MAV for the Deltoid, Biceps, and Triceps.
Figure 16.
Muscle activity value using MAV for the Deltoid, Biceps, and Triceps.
Figure 17.
Muscle activity value using AoM for the Deltoid, Biceps, and Triceps.
Figure 17.
Muscle activity value using AoM for the Deltoid, Biceps, and Triceps.
Figure 18.
Muscle activity reference patterns for Game #1.
Figure 18.
Muscle activity reference patterns for Game #1.
Figure 19.
Muscle activity reference patterns for Game #2.
Figure 19.
Muscle activity reference patterns for Game #2.
Figure 20.
Muscle activity reference patterns for Game #3.
Figure 20.
Muscle activity reference patterns for Game #3.
Table 1.
Muscle activity changes for Game #2 for the Deltoid, Biceps and Triceps.
Table 1.
Muscle activity changes for Game #2 for the Deltoid, Biceps and Triceps.
| Muscle |
Feature Extractions |
Muscle Activity Changes (%) |
| #Start - #1 |
#1 - #2 |
#2 - #3 |
#3 - #Finish |
| Deltoid |
RMS |
797.74 |
33.26 |
66.28 |
78.99 |
| MAV |
707.80 |
34.42 |
65.15 |
76.20 |
| AoM |
708.20 |
34.42 |
65.15 |
76.20 |
| Biceps |
RMS |
37.30 |
29.64 |
0.83 |
76.56 |
| MAV |
38.55 |
28.77 |
0.29 |
76.88 |
| AoM |
38.62 |
28.77 |
0.29 |
76.88 |
| Triceps |
RMS |
66.01 |
0.73 |
29.46 |
198.18 |
| MAV |
45.99 |
7.04 |
38.01 |
57.33 |
| AoM |
45.96 |
7.04 |
38.01 |
57.33 |
Table 2.
Cosine similarity for Game #1 for the Deltoid, Biceps, and Triceps mapping with participants.
Table 2.
Cosine similarity for Game #1 for the Deltoid, Biceps, and Triceps mapping with participants.
| Participant |
Muscle |
Cosine Similarity Game #1 |
| Session 1 |
Session 2 |
Session 3 |
| #1 |
Deltoid |
0.958 |
0.981 |
0.984 |
| Biceps |
0.843 |
0.861 |
0.919 |
| Triceps |
0.996 |
0.987 |
0.990 |
| #2 |
Deltoid |
0.910 |
0.956 |
0.981 |
| Biceps |
0.948 |
0.977 |
0.981 |
| Triceps |
0.911 |
0.913 |
0.964 |
| #3 |
Deltoid |
0.949 |
0.954 |
0.974 |
| Biceps |
0.799 |
0.843 |
0.899 |
| Triceps |
0.947 |
0.890 |
0.912 |
| #4 |
Deltoid |
0.986 |
0.990 |
0.995 |
| Biceps |
0.838 |
0.991 |
0.961 |
| Triceps |
0.975 |
0.919 |
0.933 |
| #5 |
Deltoid |
0.964 |
0.976 |
0.977 |
| Biceps |
0.908 |
0.973 |
0.974 |
| Triceps |
0.979 |
0.983 |
0.984 |
Table 3.
Cosine similarity for Game #2 for the Deltoid, Biceps, and Triceps mapping with participants.
Table 3.
Cosine similarity for Game #2 for the Deltoid, Biceps, and Triceps mapping with participants.
| Participant |
Muscle |
Cosine similarity for Game #2 |
| Session 1 |
Session 2 |
Session 3 |
| #1 |
Deltoid |
0.987 |
0.991 |
0.997 |
| Biceps |
0.961 |
0.992 |
0.995 |
| Triceps |
0.996 |
0.995 |
0.983 |
| #2 |
Deltoid |
0.963 |
0.986 |
0.993 |
| Biceps |
0.977 |
0.993 |
0.997 |
| Triceps |
0.993 |
0.946 |
0.992 |
| #3 |
Deltoid |
0.964 |
0.975 |
0.987 |
| Biceps |
0.967 |
0.975 |
0.984 |
| Triceps |
0.895 |
0.899 |
0.931 |
| #4 |
Deltoid |
0.981 |
0.992 |
0.993 |
| Biceps |
0.985 |
0.989 |
0.999 |
| Triceps |
0.917 |
0.959 |
0.968 |
| #5 |
Deltoid |
0.941 |
0.984 |
0.991 |
| Biceps |
0.971 |
0.984 |
0.994 |
| Triceps |
0.996 |
0.999 |
0.998 |
Table 4.
Cosine similarity for Game #3 for the Deltoid, Biceps, and Triceps mapping with participants.
Table 4.
Cosine similarity for Game #3 for the Deltoid, Biceps, and Triceps mapping with participants.
| Participant |
Muscle |
Cosine similarity for Game #3 |
| Session 1 |
Session 2 |
Session 3 |
| #1 |
Deltoid |
0.941 |
0.974 |
0.974 |
| Biceps |
0.891 |
0.930 |
0.980 |
| Triceps |
0.975 |
0.982 |
0.993 |
| #2 |
Deltoid |
0.955 |
0.968 |
0.995 |
| Biceps |
0.983 |
0.994 |
0.993 |
| Triceps |
0.995 |
0.954 |
0.979 |
| #3 |
Deltoid |
0.938 |
0.966 |
0.991 |
| Biceps |
0.973 |
0.981 |
0.907 |
| Triceps |
0.922 |
0.926 |
0.964 |
| #4 |
Deltoid |
0.957 |
0.961 |
0.965 |
| Biceps |
0.945 |
0.953 |
0.983 |
| Triceps |
0.887 |
0.961 |
0.974 |
| #5 |
Deltoid |
0.905 |
0.969 |
0.982 |
| Biceps |
0.964 |
0.962 |
0.969 |
| Triceps |
0.989 |
0.995 |
0.989 |
|
Disclaimer/Publisher’s Note: The statements, opinions and data contained in all publications are solely those of the individual author(s) and contributor(s) and not of MDPI and/or the editor(s). MDPI and/or the editor(s) disclaim responsibility for any injury to people or property resulting from any ideas, methods, instructions or products referred to in the content. |
© 2024 by the authors. Licensee MDPI, Basel, Switzerland. This article is an open access article distributed under the terms and conditions of the Creative Commons Attribution (CC BY) license (http://creativecommons.org/licenses/by/4.0/).
