1. Introduction
Also known by its other name, additive manufacturing (AM) or 3D printing, is a technique used to create products by layering layers of material in the shape that is imagined using a 3D model. The material is melted and then hardened into the appropriate shape to pack the layers. This procedure is an alternative to more established and typical subtractive manufacturing processes, which involve removing material from a whole solid structure by rotating or milling the material until the object takes on its final shape [
1,
2]. In addition, metallic materials now make up a sizable fraction of 3D printing materials. This is because 3D printing can manufacture hard metals that are challenging to construct using conventional removal procedures [
3,
4,
5]. While there are several processing processes available for additive manufacturing (AM) of metallic components, the Powder Bed Fusion (PBF) method is one of the most often employed in the industry. Using a rake mechanism, this production process distributes the metal powder uniformly over the work surface, often resulting in layer heights between 20 and 200 μm. After that, the metal is subjected to an energy source, such as a laser or electron beam, which scans the bed and sinters the powder into the required shape. The power source’s energy density (E), which is mostly influenced by the laser power (P) and scanning speed (v), may have a substantial effect on the printed components’ formation behavior, surface quality, porosity, as-printed microstructure, and mechanical characteristics.
Hao et al. in their research on the influence of process parameters analyzed laser power (50-450W) and laser scanning velocity (1000-280mm/s) impact on the mechanical properties of 316 L stainless steel. They concluded that higher laser power, combined with high scanning speed, is required to achieve better specimen formability [
6]. According to Kaschel et al., laser power had a direct influence on part dimensional accuracy and a more homogeneous as well as improved surface finish was attained by the printed specimens of Ti64 using higher laser power [
7]. In another study carried out by Kaya et al., they concluded that optimum production parameters (laser power 80W, Laser scan velocity 1125 mm/s) achieved 99.99 % relative density, 1050 ultimate tensile stress, and 13.8% elongation [
8]. A similar study carried out by Liu et al. highlighted the highest relative density of 99.1 % without obvious pores and balling phenomenon were obtained at 350 W laser power and a laser scanning velocity of 275 mm/s [
9]. Hukpati et al. established a strong impact of printing parameters on the mechanical properties of 316 L stainless steel specimens, revealing that a laser scan velocity of 750 mm/s resulted in the lowest porosity [
10]. Also, Parneeth et al. in their research on process parameter’s influence on mechanical properties of AlSi10Mg using selective laser melting concluded that laser power and laser scan velocity are key parameters affecting hardness and surface roughness [
11].
2. Material and Methods
In this research, we intend to examine the influence of process parameters, mainly the laser scan speed and power on the tensile properties and impact strength of the additive-manufactured steel specimens of 1.2709 and 1.4542.
2.1. Material
2.1.1. Steel 1.2709
To make steel 1.2709 / MS1, iron is mixed with carbon and other components. Tooling grade maraging steel with extremely high strength is called Tool Steel 1.2709. Heat treatment leads to the formation of intermetallic phases and precipitates, which permit its good characteristics. The characteristics allow for successful usage in various applications, such as cold and hot working [
12].
2.1.2. Steel 1.4542
A structurally hardened martensitic stainless steel with a hardness of around 48 HRC and strong corrosion resistance is alloy 1.4542. One of the most well-liked and widely utilized stainless chromium-nickel alloy steels with a copper addition is 1.4542 steel. Its strong qualities, such as hardness, are preserved while it exhibits great corrosion resistance. Steel can function between -29 °C and 343 °C while maintaining comparatively acceptable properties. Furthermore, this grade’s materials have comparatively excellent ductility [
13,
14].
2.2. 3D Printing of the Tool Steel Specimens
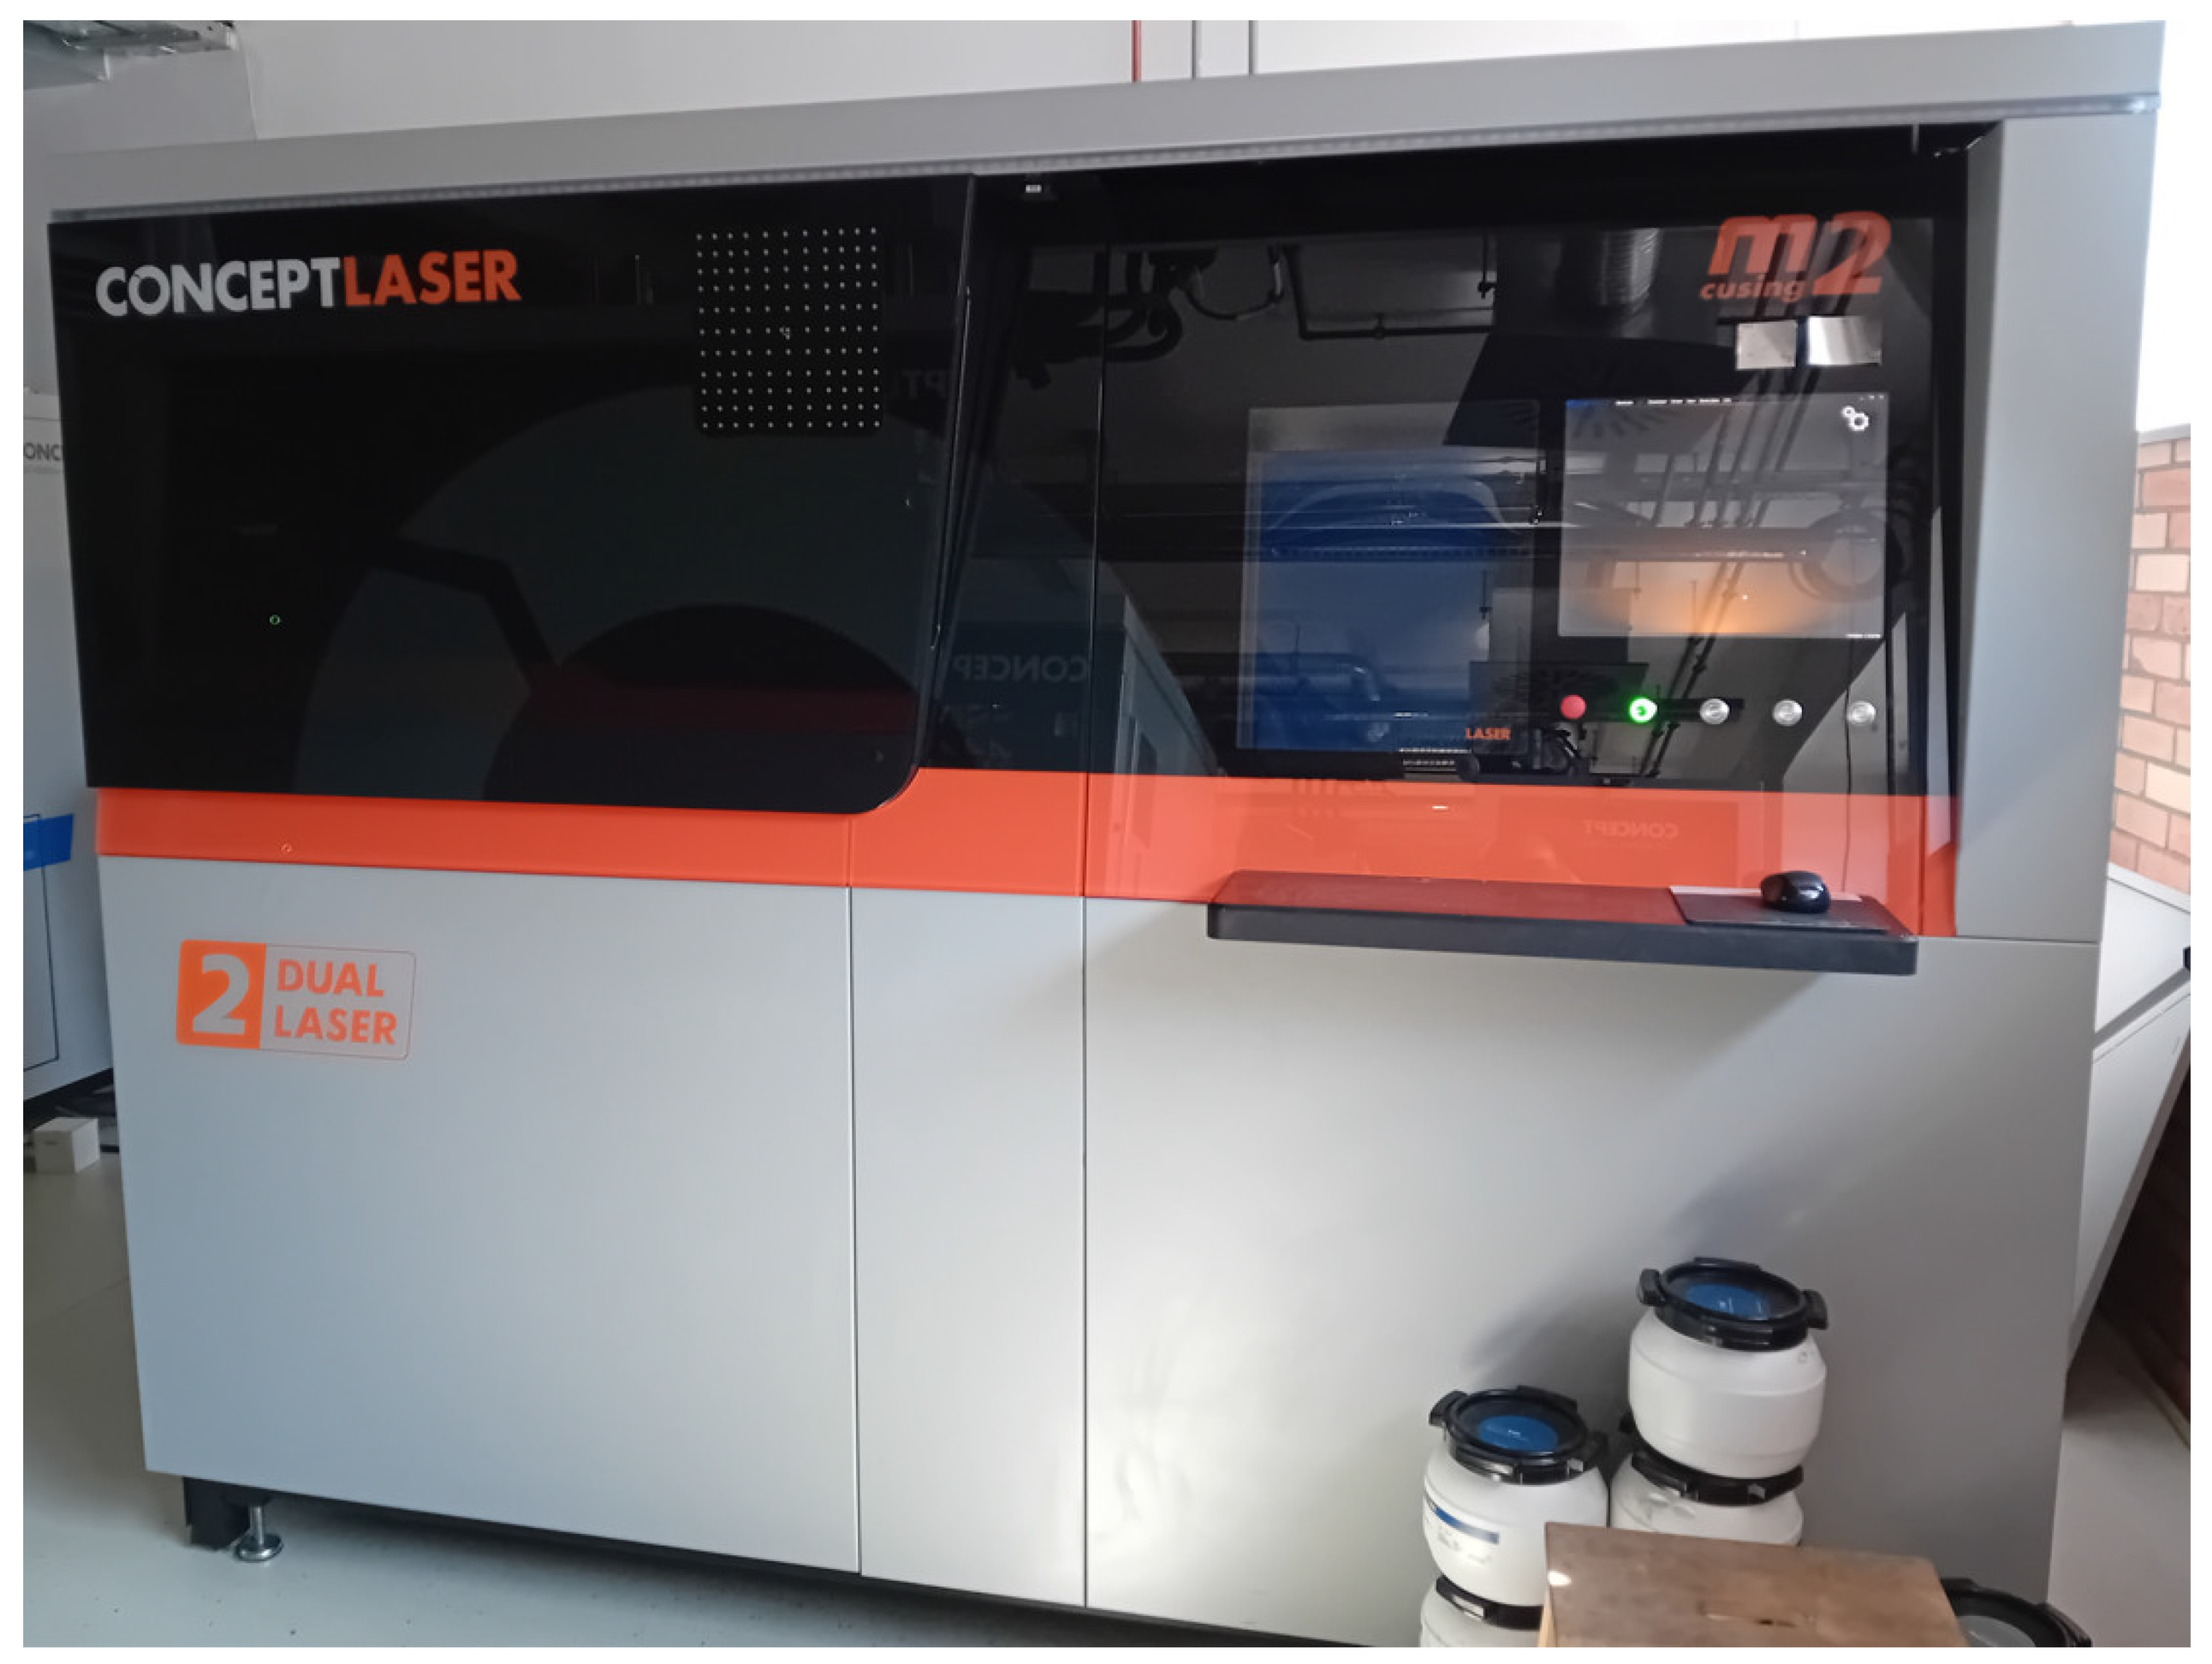
To print the steel specimens, powder bed fusion was utilized. We used GE concept laser M2 machines for the selective laser melting process. The build volume of the 3d printer was 245x245x280 mm.
Figure 1 shows the powder bed fusion printer used for printing the specimens of steel 1.2709 and 1.4542.
2.3. Printing Parameters of the Tool Steel Specimens
The specimens of steel 1.2709 and 1.4542 were printed in the two sets as mentioned in
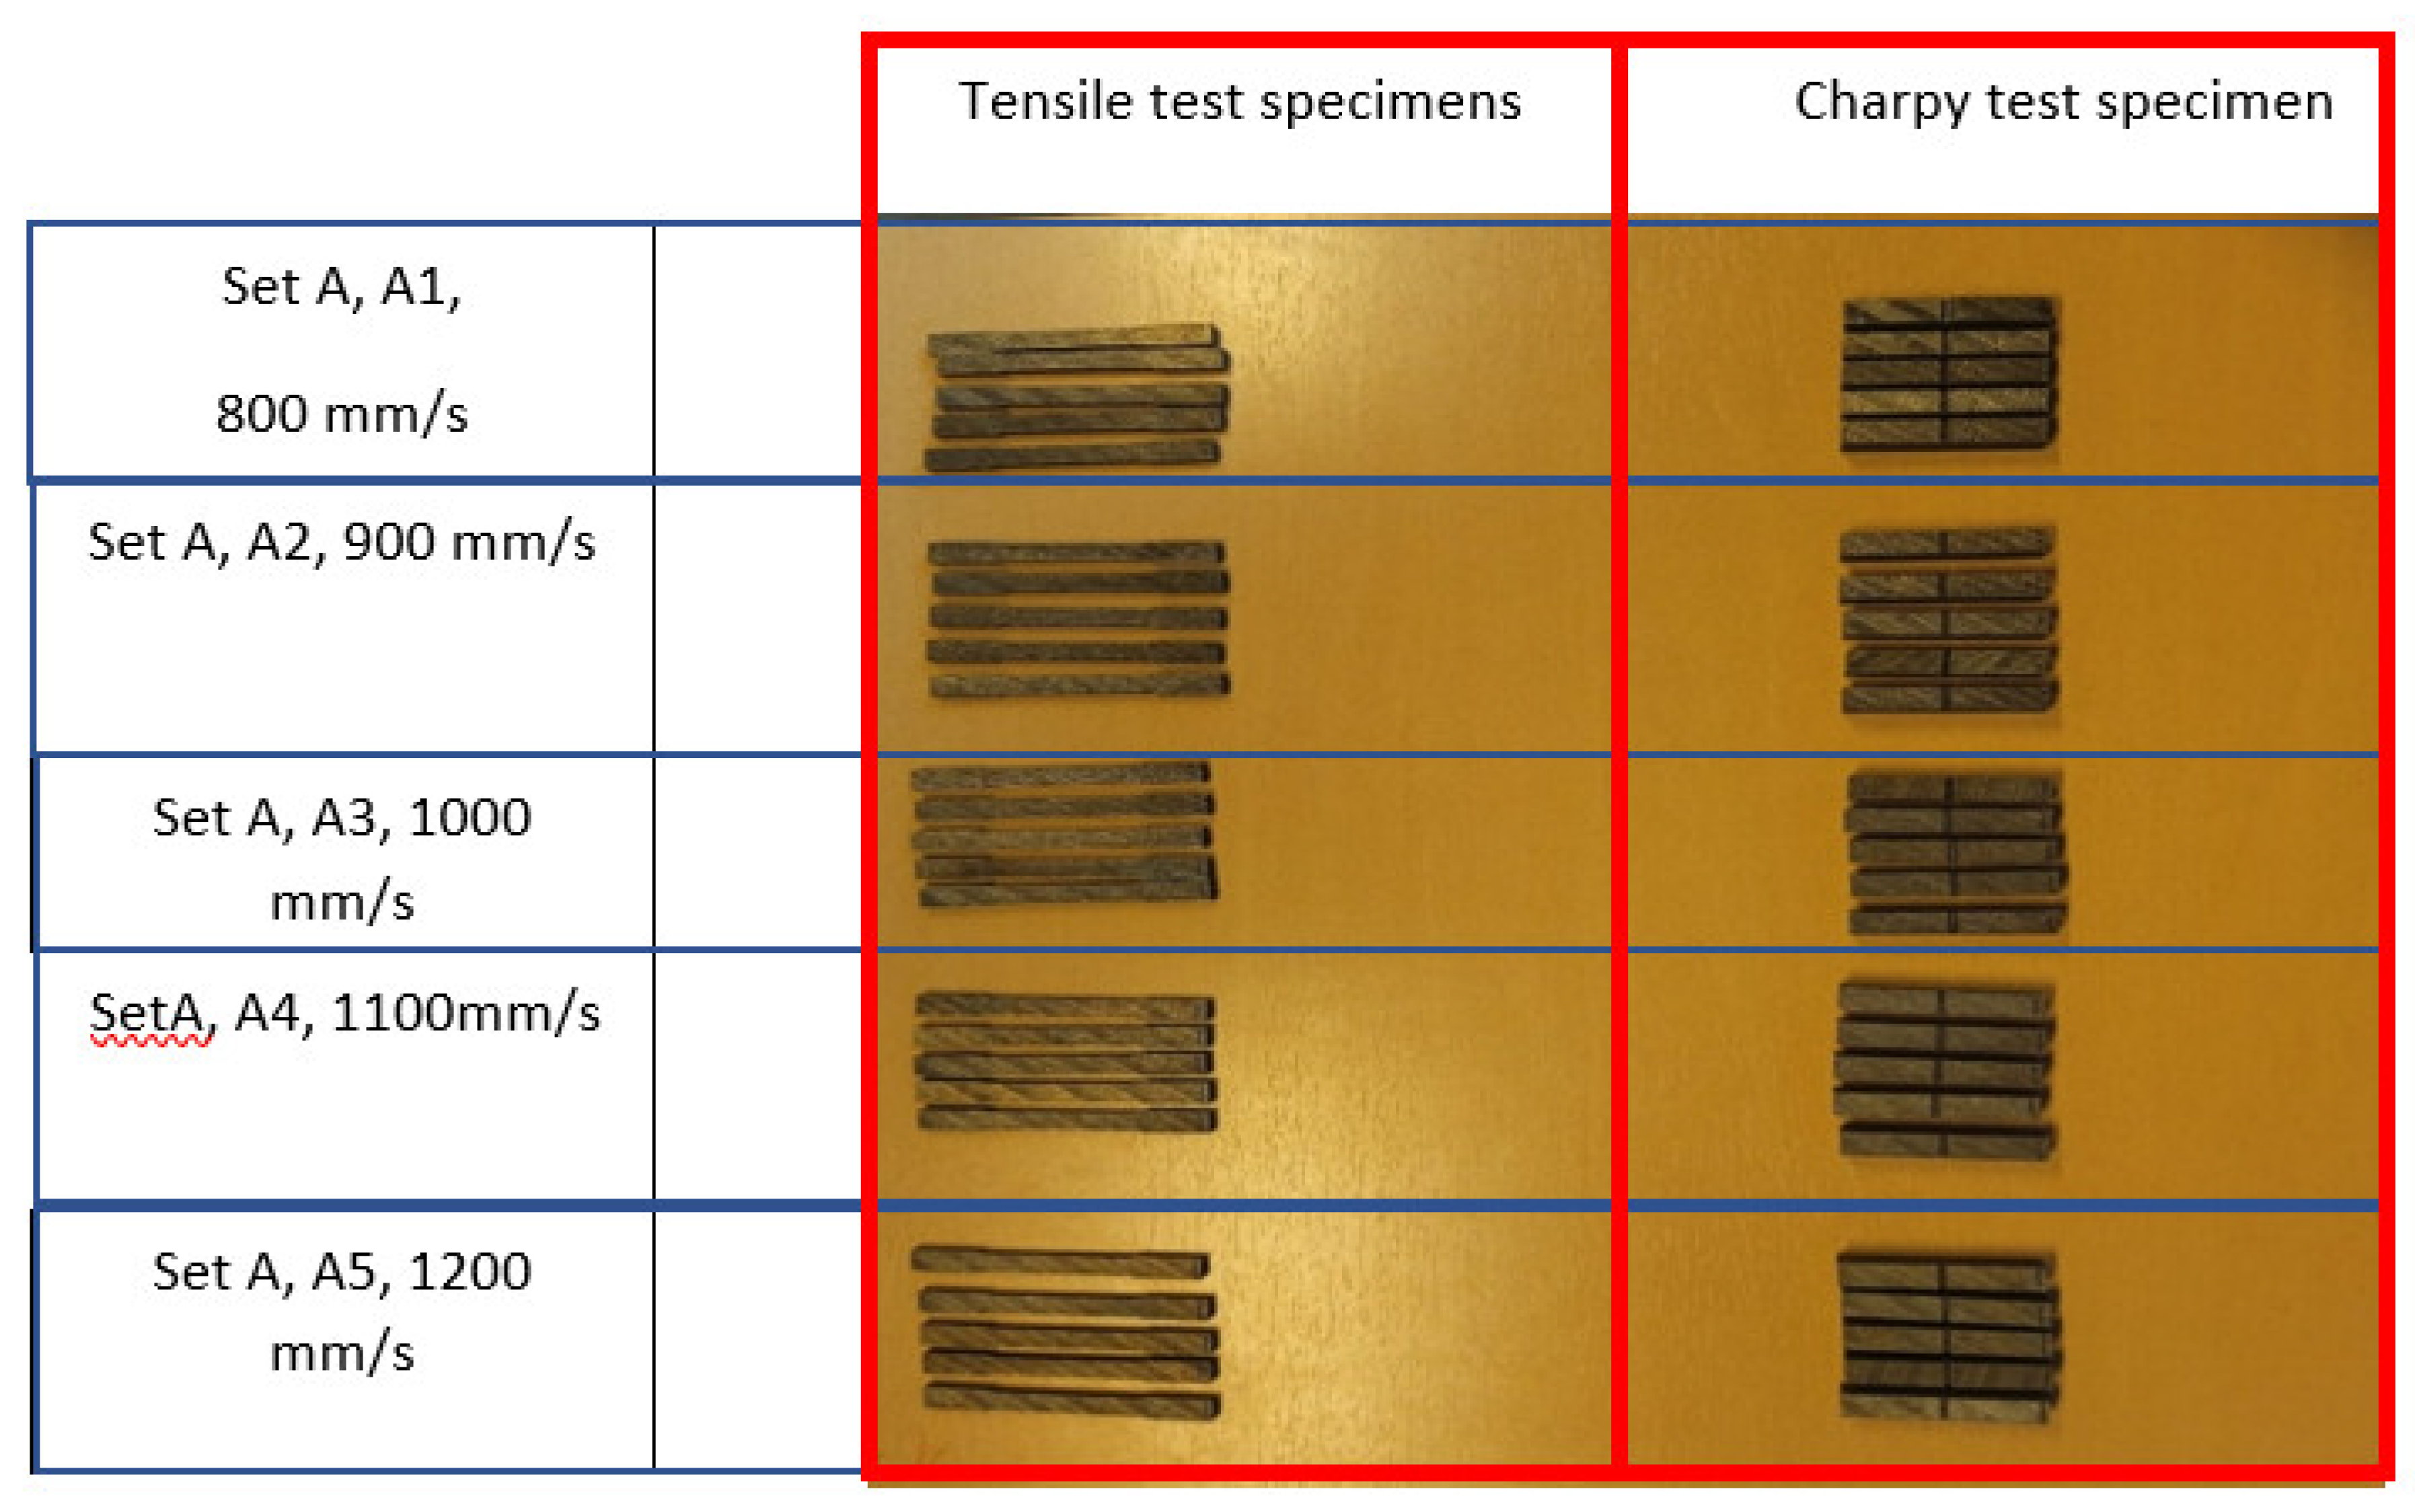
Table 1. In the Set A of specimens, the laser power was constant at 300W and the laser scanning speed varied from 800mm/s to 1200mm/s. For each setting of laser scan speed, five specimens were printed, and twenty-five specimens were printed in total for Set A (including twenty-five specimens for both the tensile test and Charpy test, a total of fifty specimens). In Set B of the specimens, the laser scanning speed was constant at 950 mm/s, and laser power was varied from 200 W to 400 W. For each setting of laser power, five specimens were printed and twenty-five specimens were printed in total for Set B (including twenty-five specimens for both the tensile test and Charpy test, a total of fifty specimens).
Figure 2 showcases the set A specimens of the steel 1.2709 printed at a constant laser power of 300W and a varying laser scanning speed ranging from 800mm/s to 1200mm/s.
2.4. Specimen Dimension
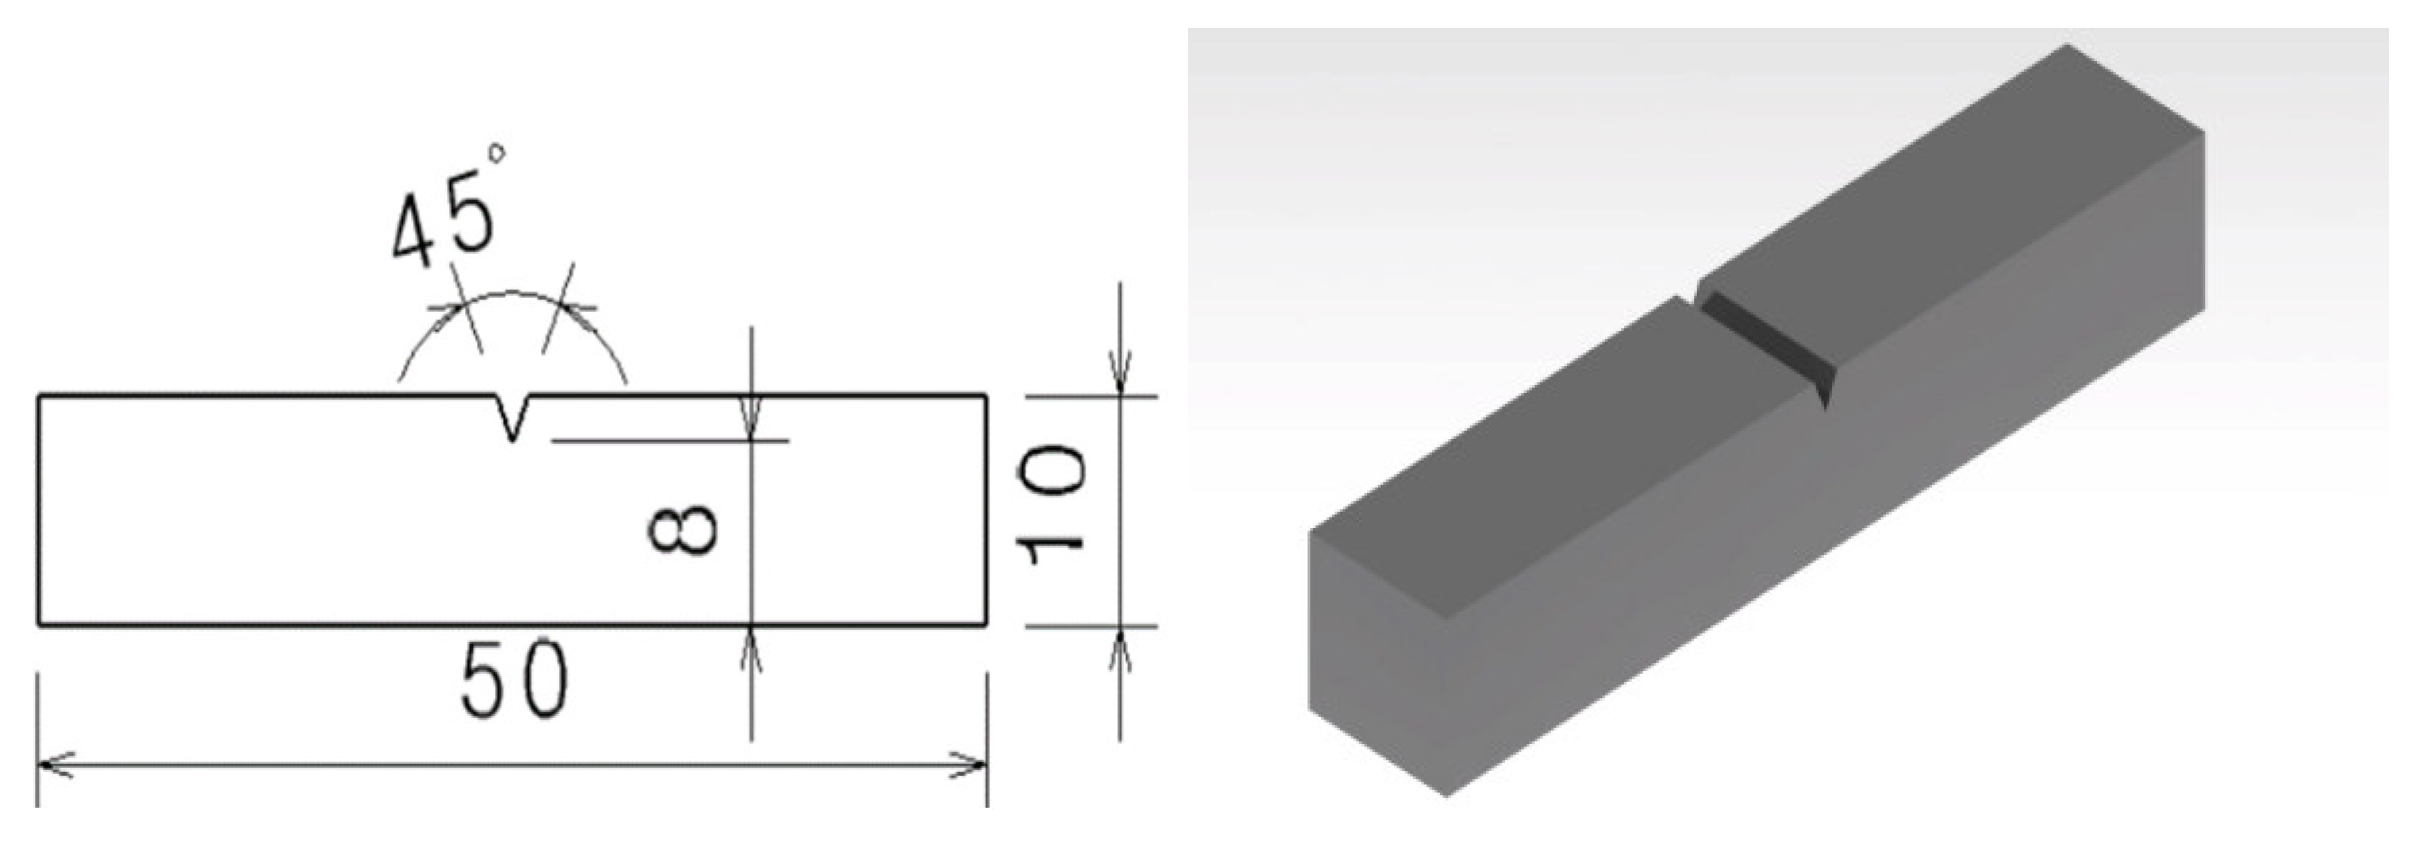
The sample specimens were printed in accordance with the manufacturer’s recommendation for the raw material. The dimensions and sizes are shown in
Figure 3 and
Figure 4 below. We printed the specimens in the regular dog bone size for the tensile tests, and for the Charpy tests, we printed the specimens in the regular bar sizes.
2.5. Testing Methods
The specimens were subjected to the Tensile test and Charpy test to examine the tensile properties and for evaluation of impact strength to understand the effect of laser power and laser scanning speed on the 3d printed specimens of steel 1.2709 and 1.4542.
2.5.1. Tensile Test
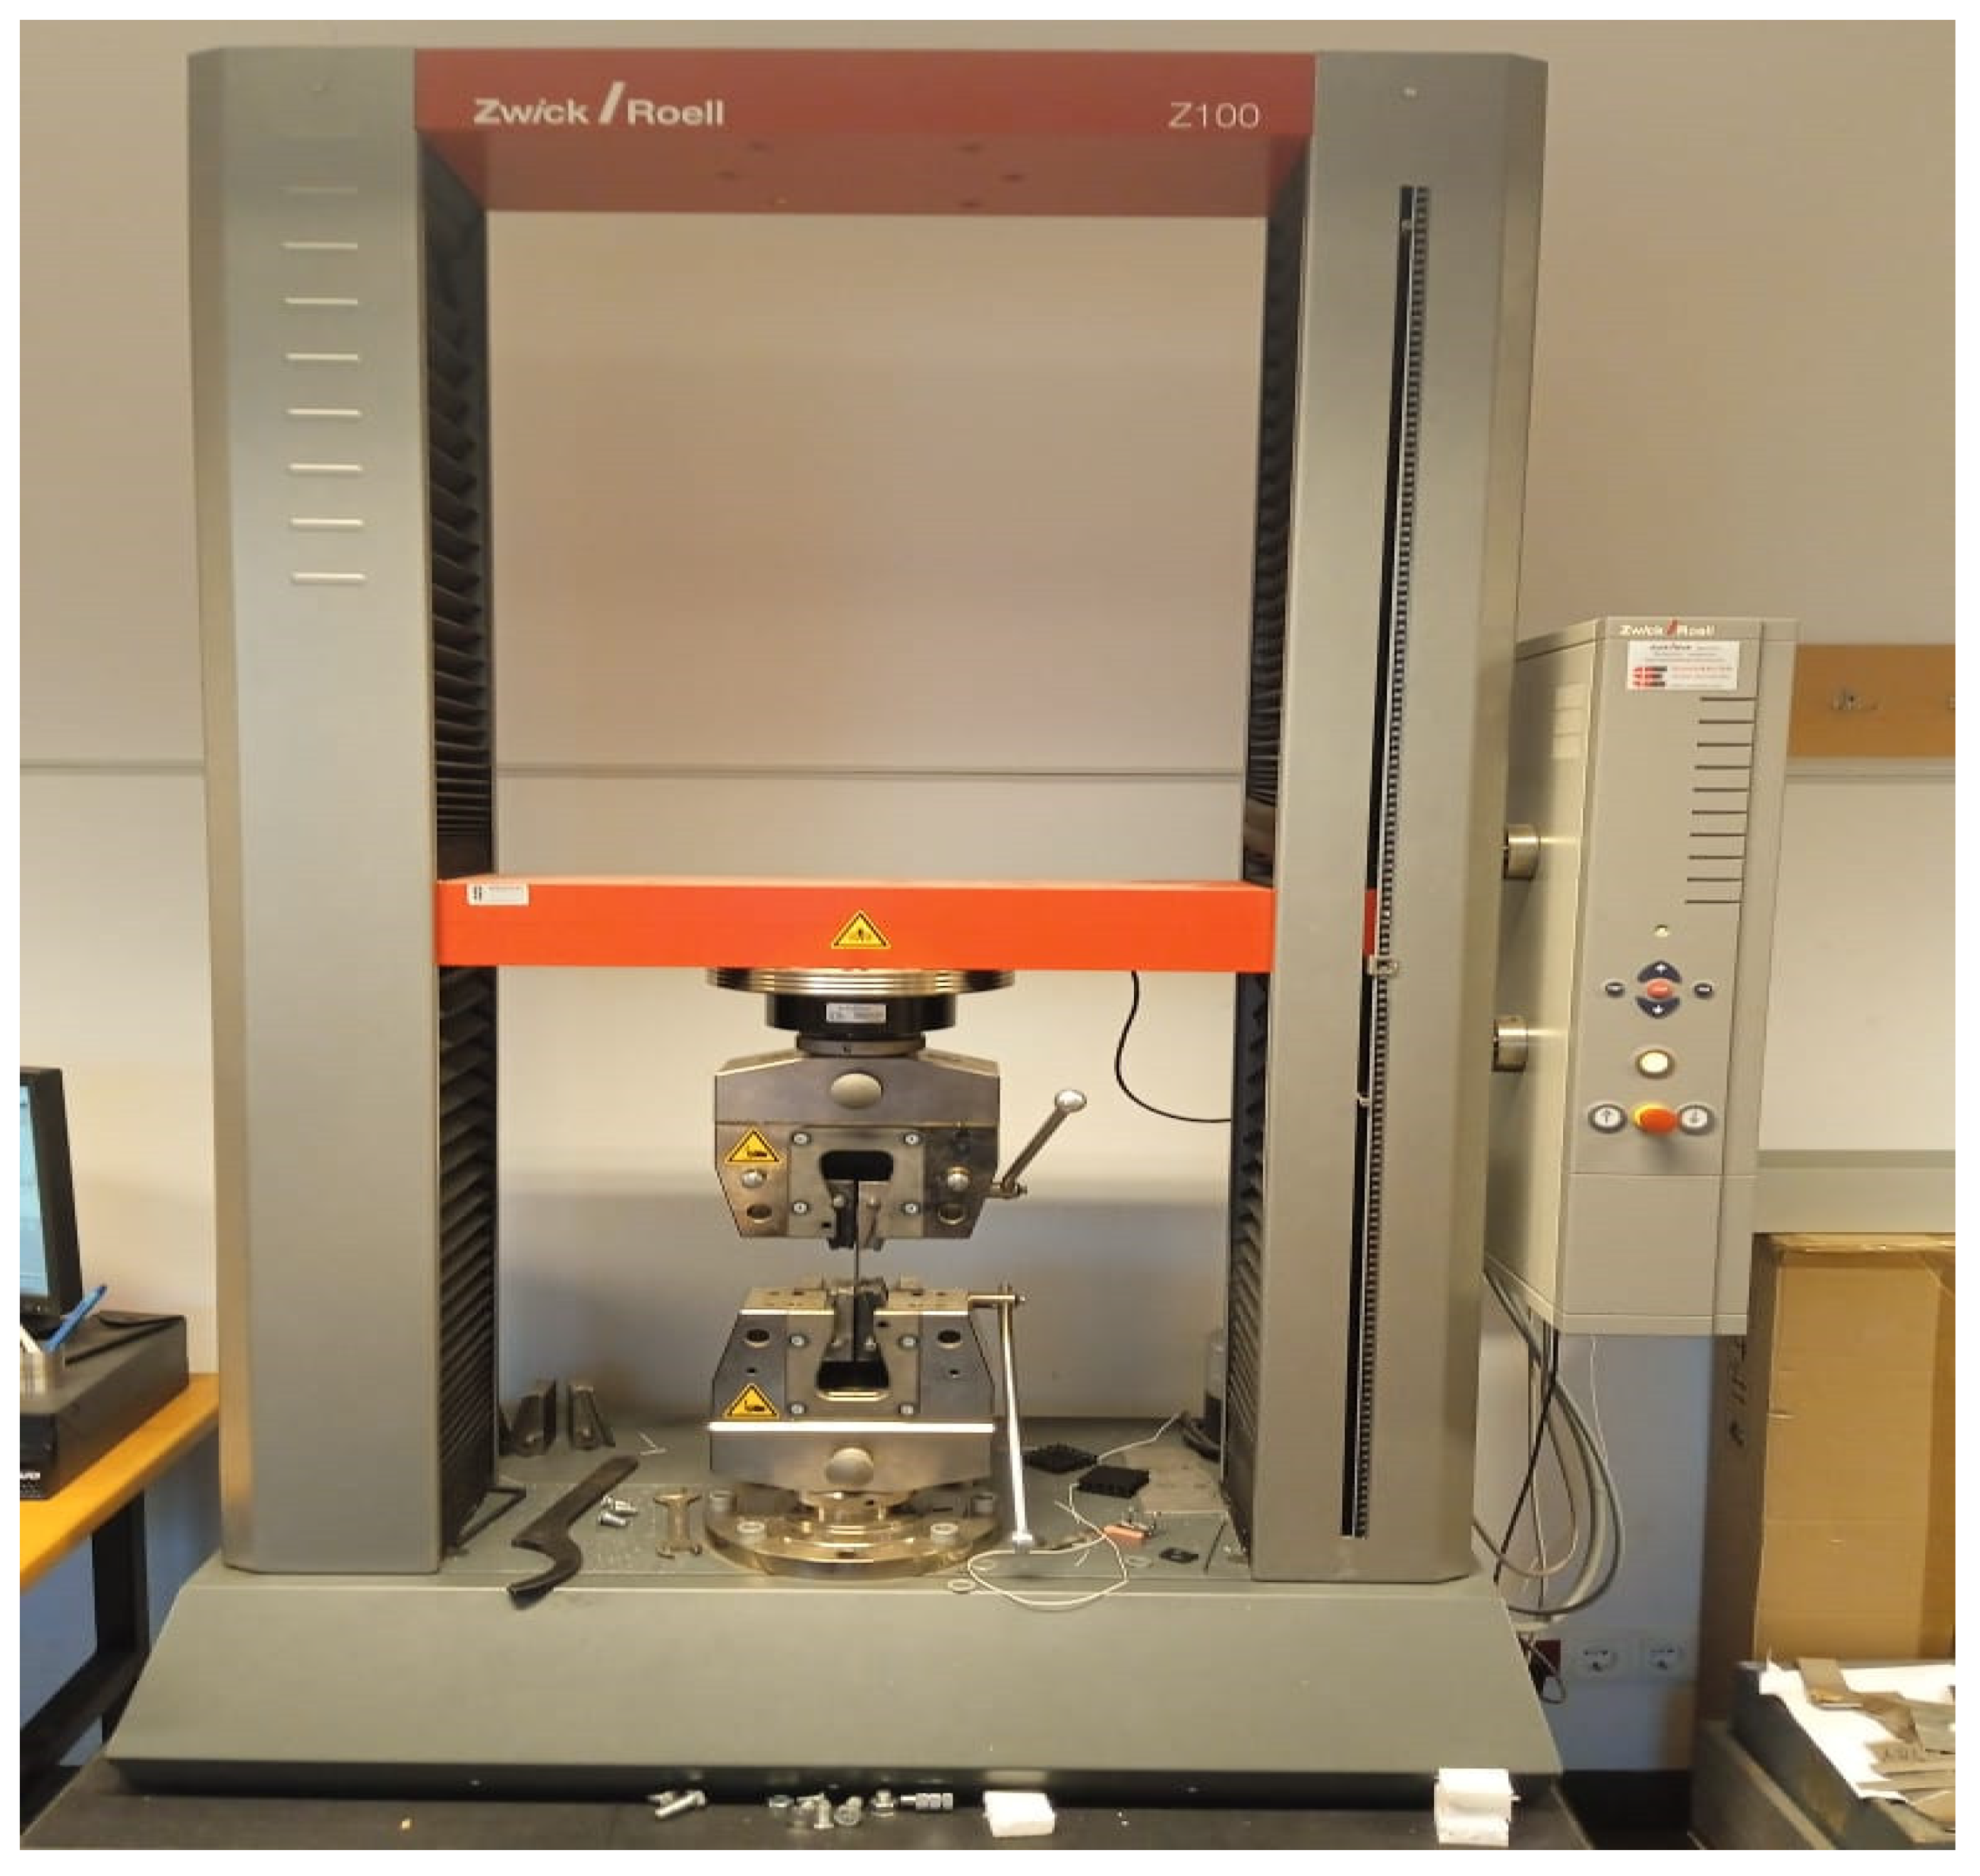
To conduct tensile tests, a Zwick Roell tensile testing machine with a capacity of 100 KN was utilized. The speed of the tensile test used was 0.5 mm/s, however, the speed of the tensile test till the yield point reached was 0.0025 1/s. The tensile test standard used was MSZEN 6892-1, this is the Hungarian and the European standard for the tensile test.
Figure 5 shows the tensile testing machine setup.
2.5.2. Charpy Test
Charpy tests were carried out on steel specimens to determine the amount of energy needed to rupture the specimens in joules [J]. The maximum limit of the Charpy test set was 100 Joules. The Charpy test standard used during the testing was MSZ EN 10045-1.
3. Results
3.1. Charpy Test and Maximum Stress (Ultimate Tensile Stress, UTS) Test Results for Steel 1.2709 and 1.4542 at Varying Laser Power and Constant Laser Scanning Speed of 950 mm/s
The
Table 2, shows the impact strength and UTS values for both 1.2709 and 1.4542 steels at constant laser scan velocity and varying laser power:
(a) For 1.2709 steel highest impact strength was attained at 350W, also we can see that the standard deviation was very high at 300W. A trend can be seen that increasing laser power somehow increases deviation, thereby leading to more uncertainty.
(b) UTS (maximum stress) of steel 1.2709, the highest value was recorded at 250W, which establishes that an increase in the laser power somehow decreases the maximum stress for this material. From 200W to 300W, the changes are very small and after that, the value decreases and the power effect is negative. A very high deviation was observed at 350W. So, we can affirm that this material is sensitive to higher laser power.
(c) The impact strength of steel 1.4542 steel, showed very little change with increasing laser power, with the highest impact strength of 68.6J attained at 350W. Deviation increased slowly with increasing laser power. Above 300W, the deviation increased to a higher level.
(d) Steel 1.4542, after careful observation shows that increasing laser power somehow decreases the UTS (max stress), thereby increasing the deviation almost ten times between 200W and 400W. Steel 1.4542 is more sensitive to higher laser power when compared to steel 1.2709.
3.2. Charpy Test and Maximum Stress (Ultimate Tensile Stress, UTS) Test Results for Steel 1.2709 and 1.4542 at Varying Laser Scan Velocity and Constant Laser Power of 300 W
Table 3 depicts the impact strength average values and UTS average values for steel 1.2709 and 1.4542 at constant laser power and varying laser scan velocity.
(a) 1.2709 steel shows a clear decline in impact strength with increasing laser scan velocity.
(b) The increasing laser scan velocity had no effect on the UTS (maximum stress) for 1.2709 steel. The uncertainty also increased with increasing laser scan velocity, thus making this material sensitive to increasing laser scan velocity.
(c) 1.4542 steel impact strength somehow remained unchanged with varying and increasing laser scan velocity. The deviation also remained almost constant throughout.
(d) UTS (maximum stress) of 1.4542 steel also remained almost constant with slight change in the values.
4. Summary
The following graphical curves are drawn by taking into account all five values of the specimens obtained at particular values of laser power and laser scan velocity. This graphical analysis gives more clarity on the impact of laser power and laser scan velocity, as we are taking every recorded value into account, rather than going for the average values unlike we did in the result section. In this section, we also calculate the safe and optimum values of laser power and laser scan velocity for both 1.2709 and 1.4542 steel.
4.1. Impact Strength vs. Laser Power
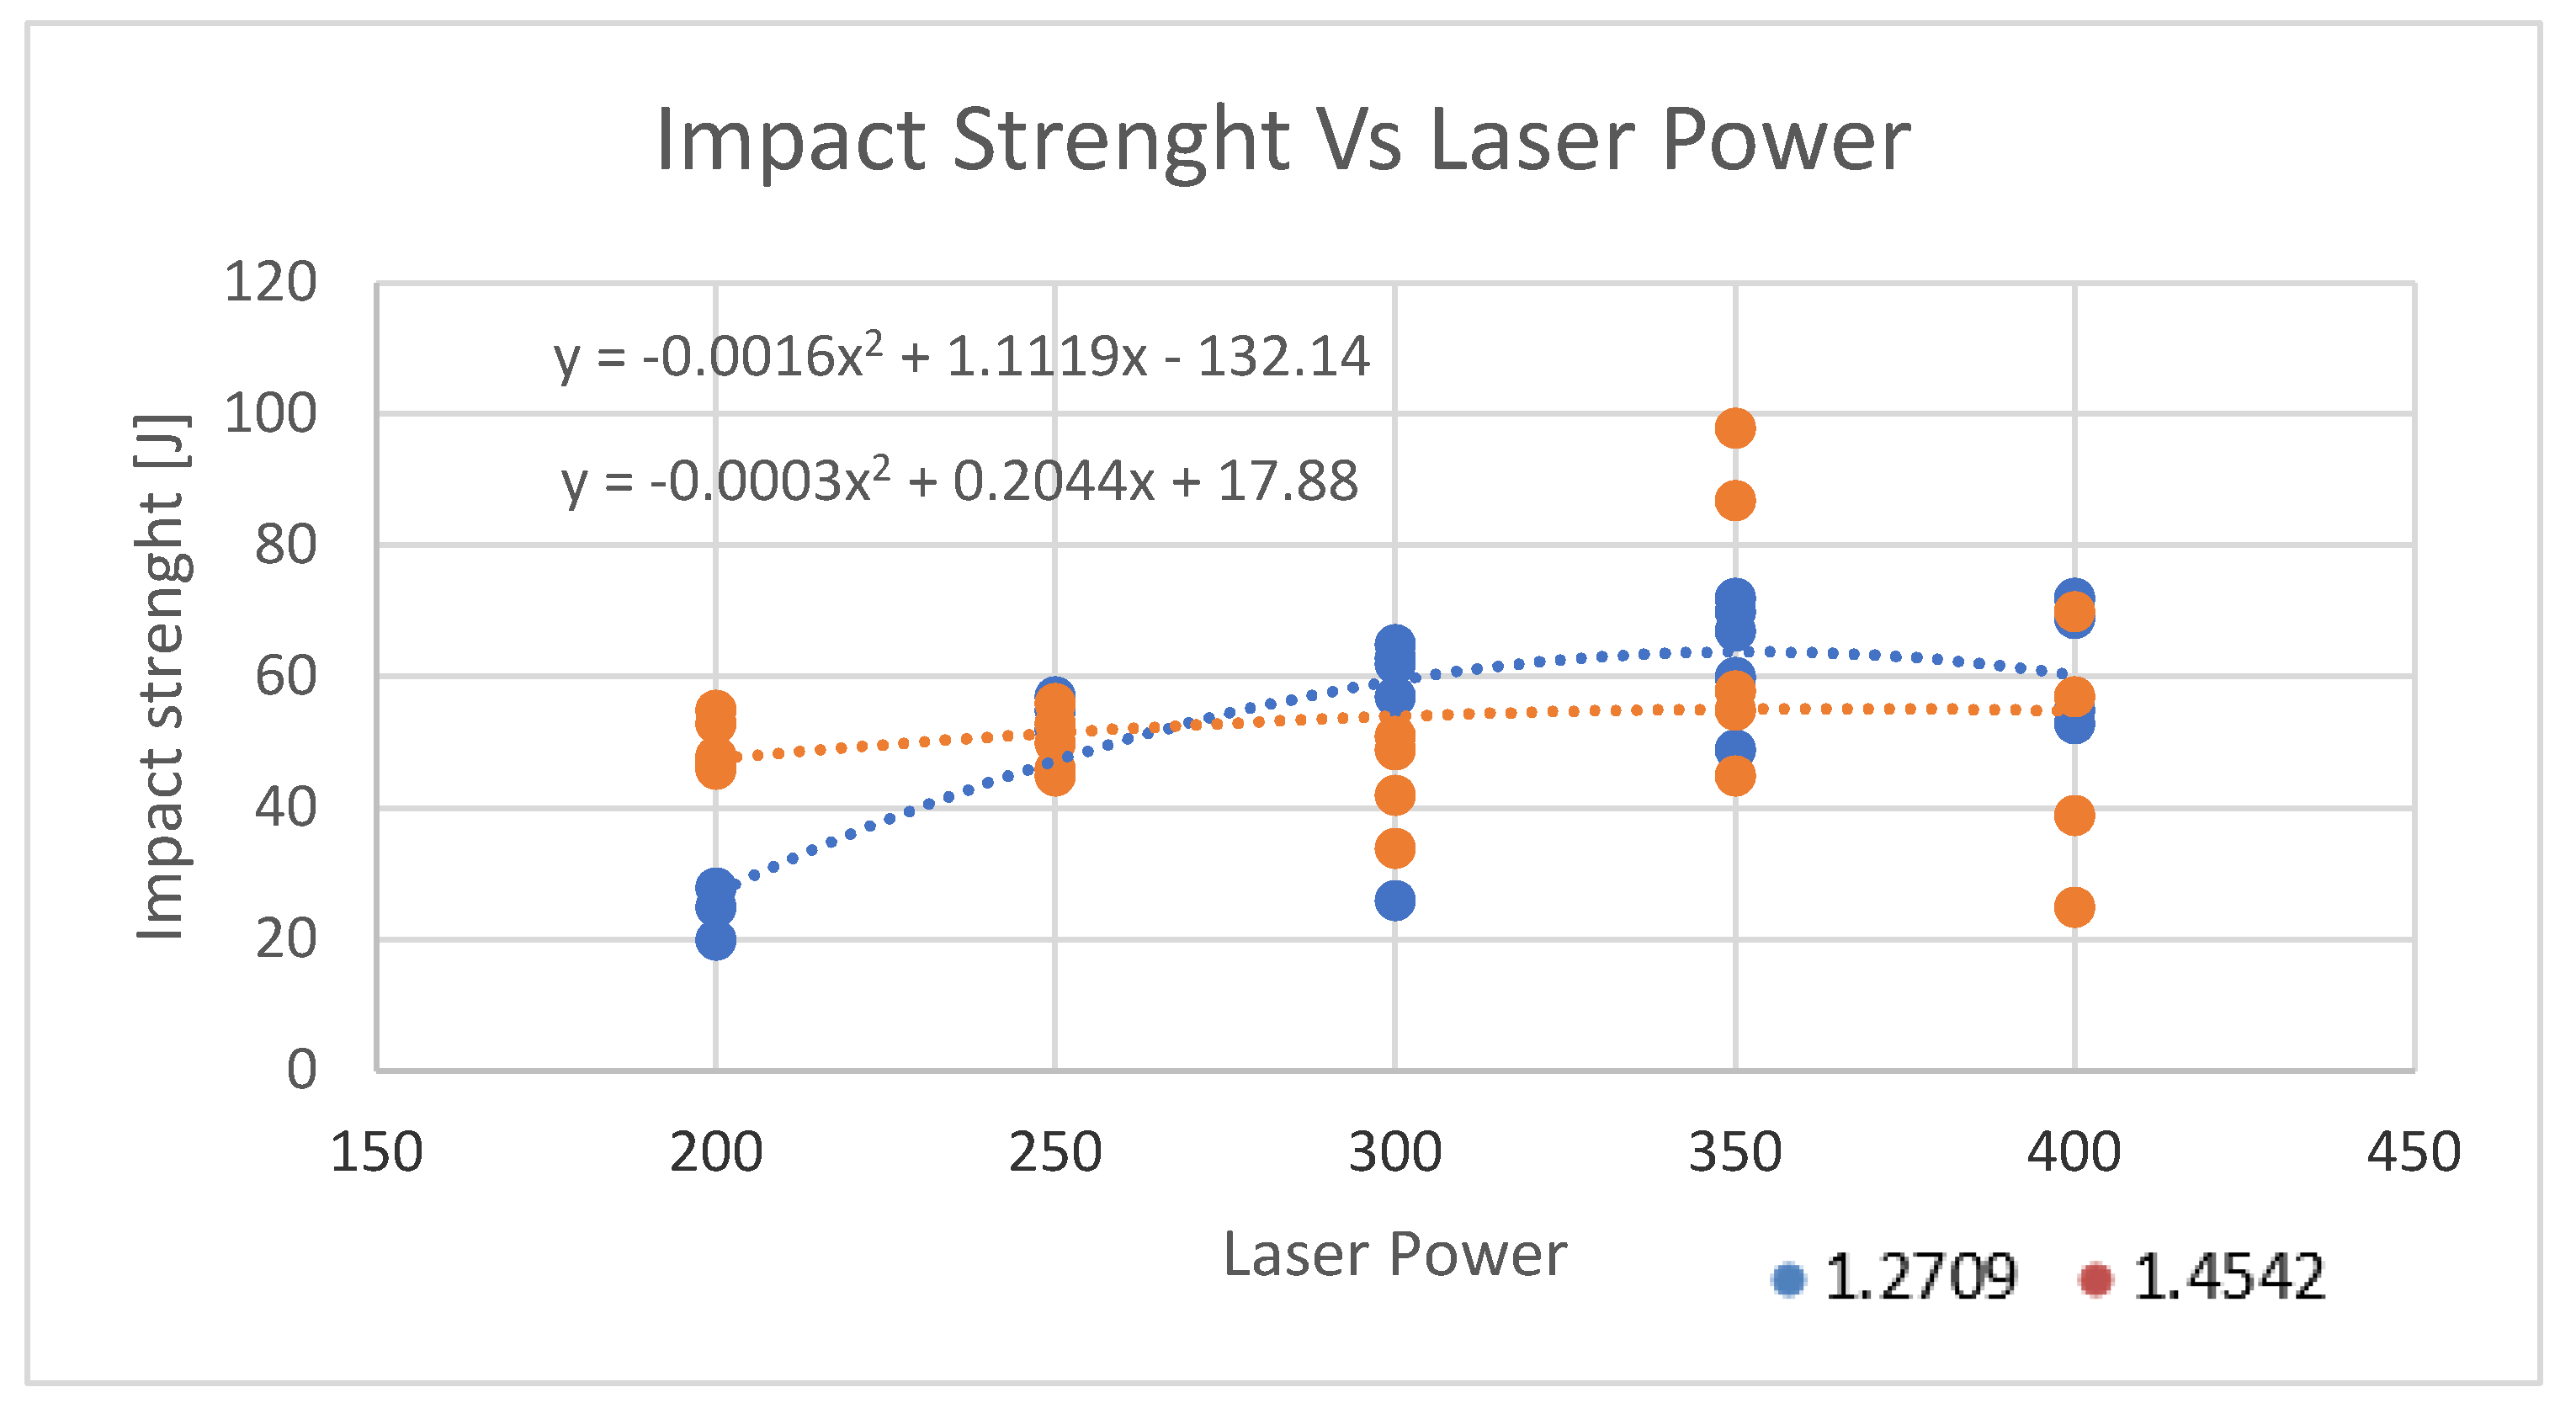
In
Figure 6, for material 1.2709, there is an increase in the impact strength with an increasing laser power as the trend line shows in the figure. Upon solving the first “E” equation of second order for this material, by calculating the derivation of the equation with respect to the x function we get the value of x as 347. So, we can conclude that 347W is the optimum and safe laser power for this material.
For the material 1.4542, there is a little increase in impact strength with increasing laser power. Solving second equation “E” of the second order by taking the derivative with respect to the x function, we get the value of x as 340. Laser power of 340W is safe and the optimum laser power for this material.
4.2. Maximum Stress (Ultimate Tensile Stress) Vs. Laser Power
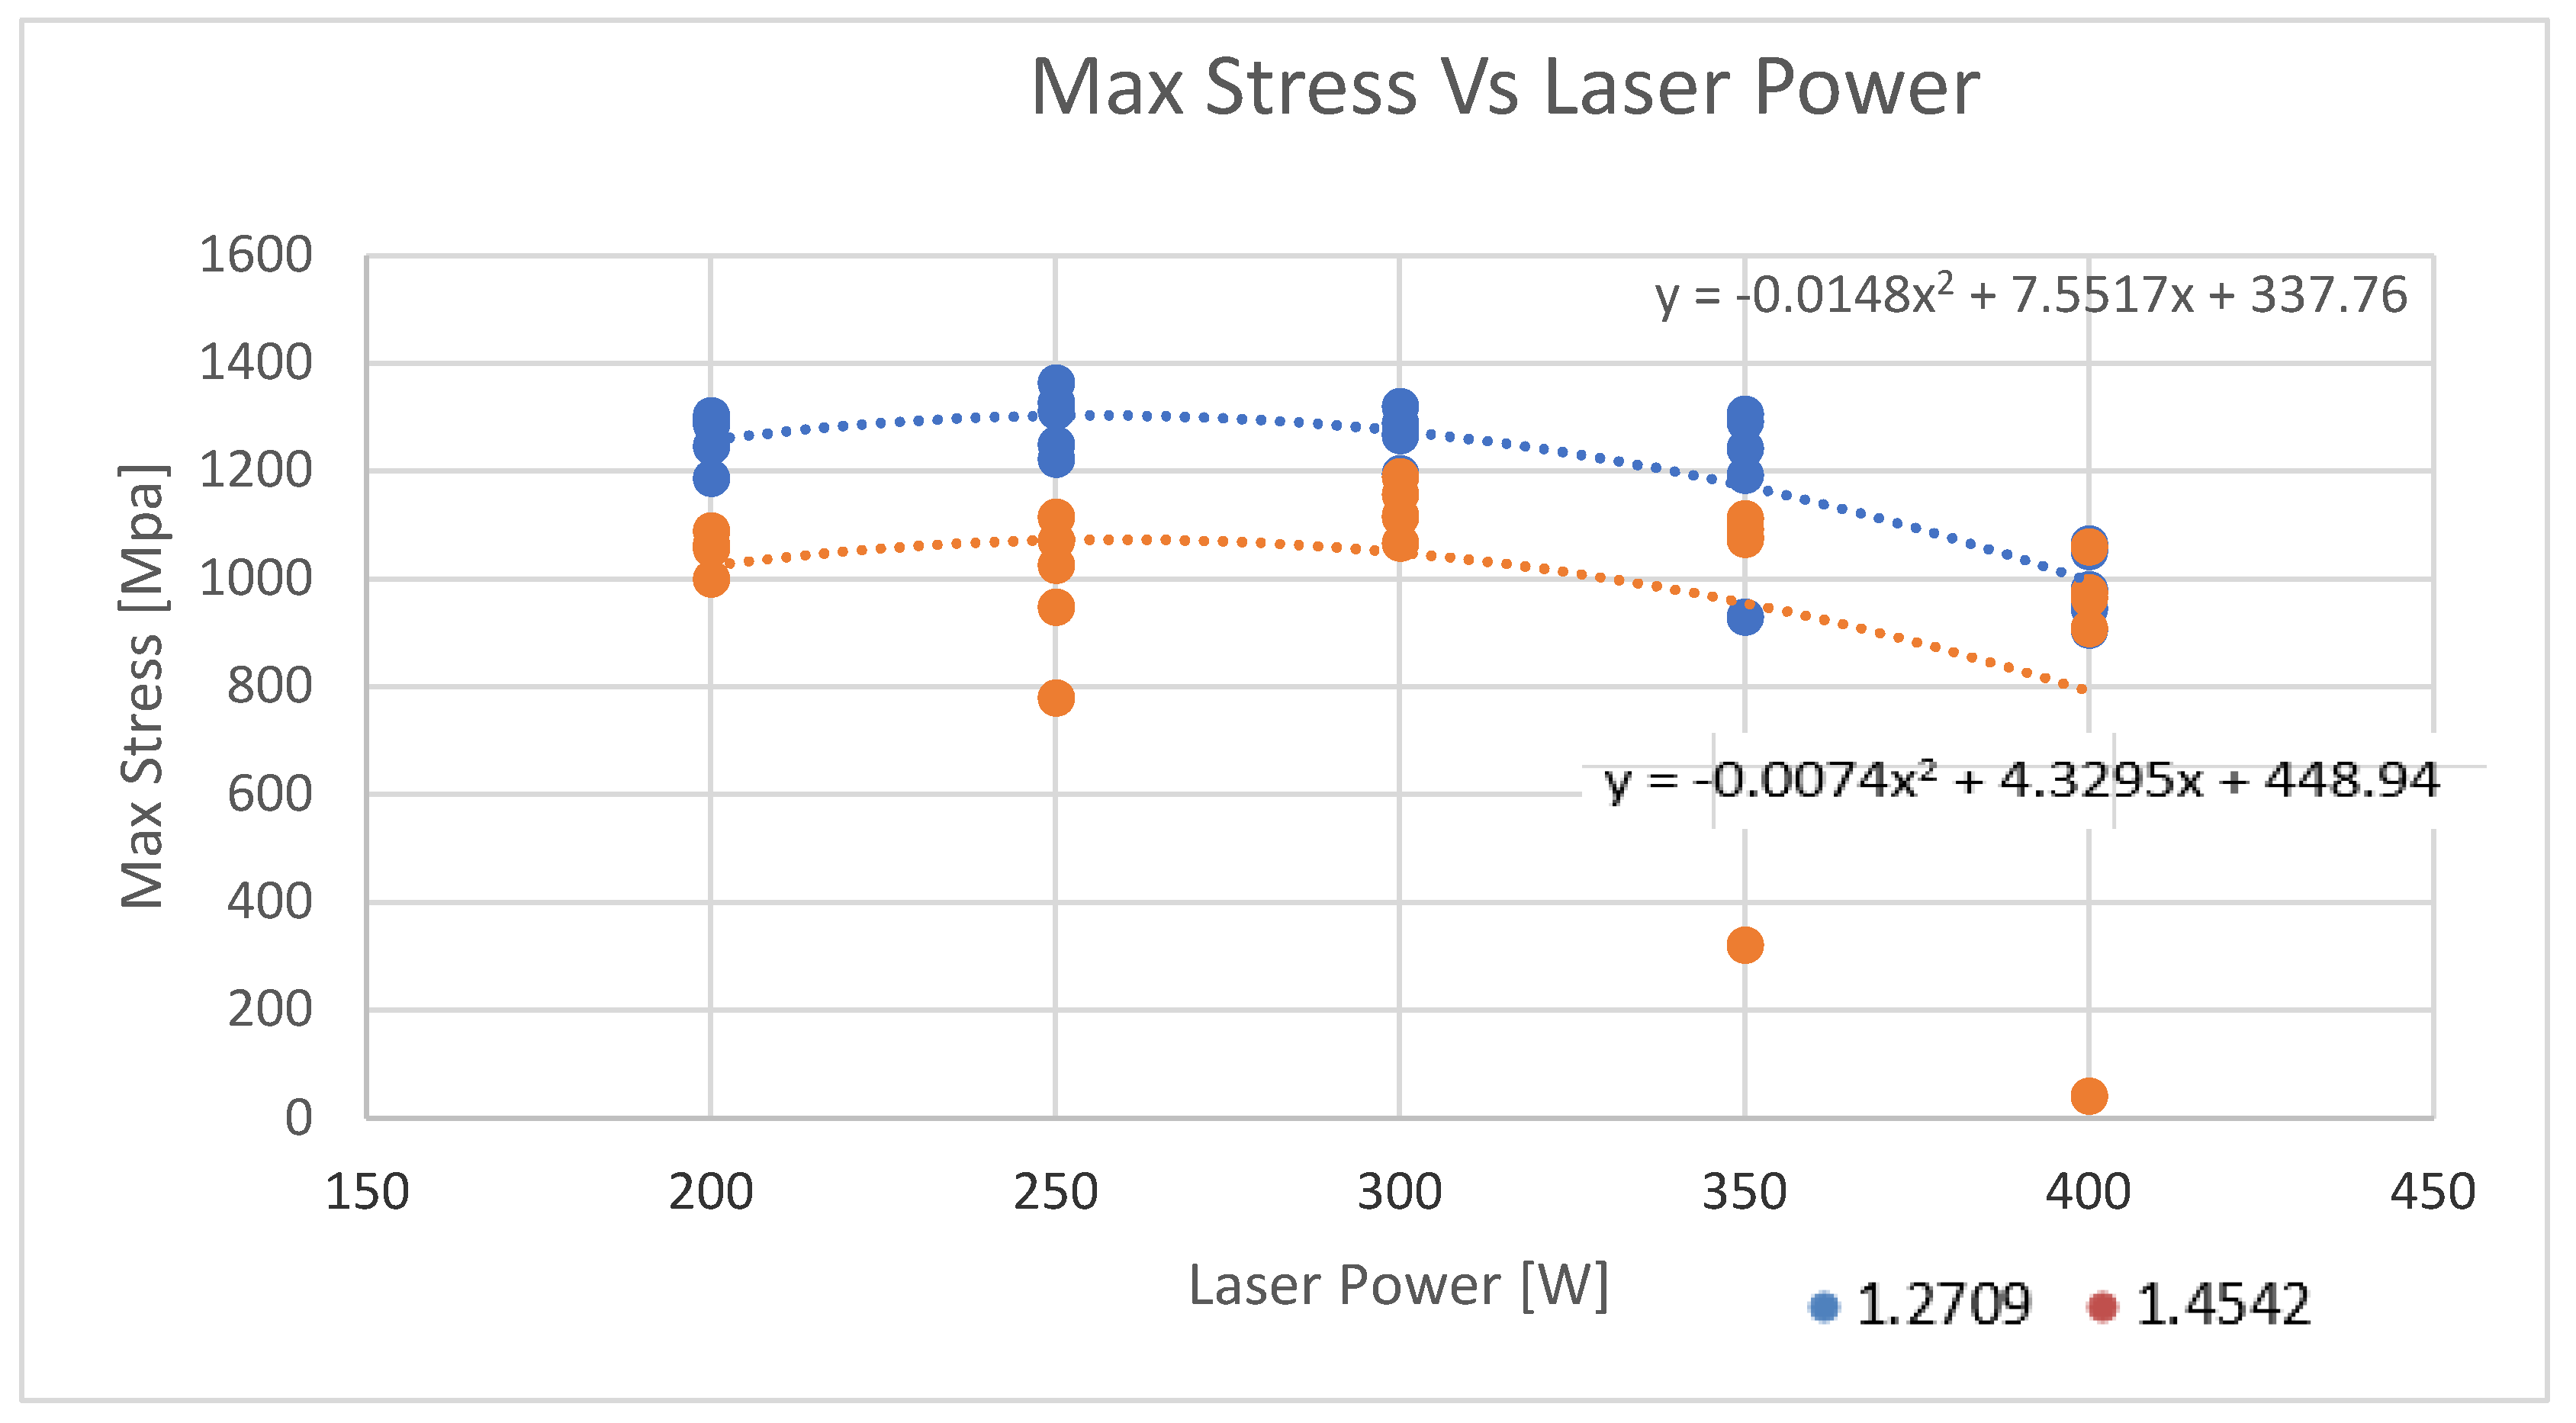
From
Figure 7, for material 1.2709, the trend line clearly shows that ultimate tensile stress (UTS or maximum stress) decreases with increasing laser power. Solving the first “E” equation of the second order by taking the derivative with respect to the x function we get x as 255. 255W is the safe and optimum laser power value for this material in this studied range.
Concerning Material 1.4542, the trend line shows there is a little increase in the UTS (maximum stress) first with respect to the increasing laser power. However, after that, it exhibits a decline in the UTS. Furthermore, by solving of second “E” equation of second order by taking the derivative with respect to the x function we get the value of x as 292W, which is the optimum and safe value of laser power for this material.
In
Figure 7 we see an additional huge decline in the UTS values of 1.4542 steel after crossing the 350W laser power. It can be further stated that using laser power beyond 350W creates defects in the printing of the specimens. For the calculation of safe and optimum laser power, we removed the two values of UTS for 1.4542 material (almost reaching zero), as it is not possible. This manifests that using the laser power beyond 350W leads to the wrong printing of the specimens. Therefore, it consolidates that the optimum value of laser power for UTS should be between the range of 255W and 292W.
4.3. Impact Strength Vs. Laser Scan Velocity
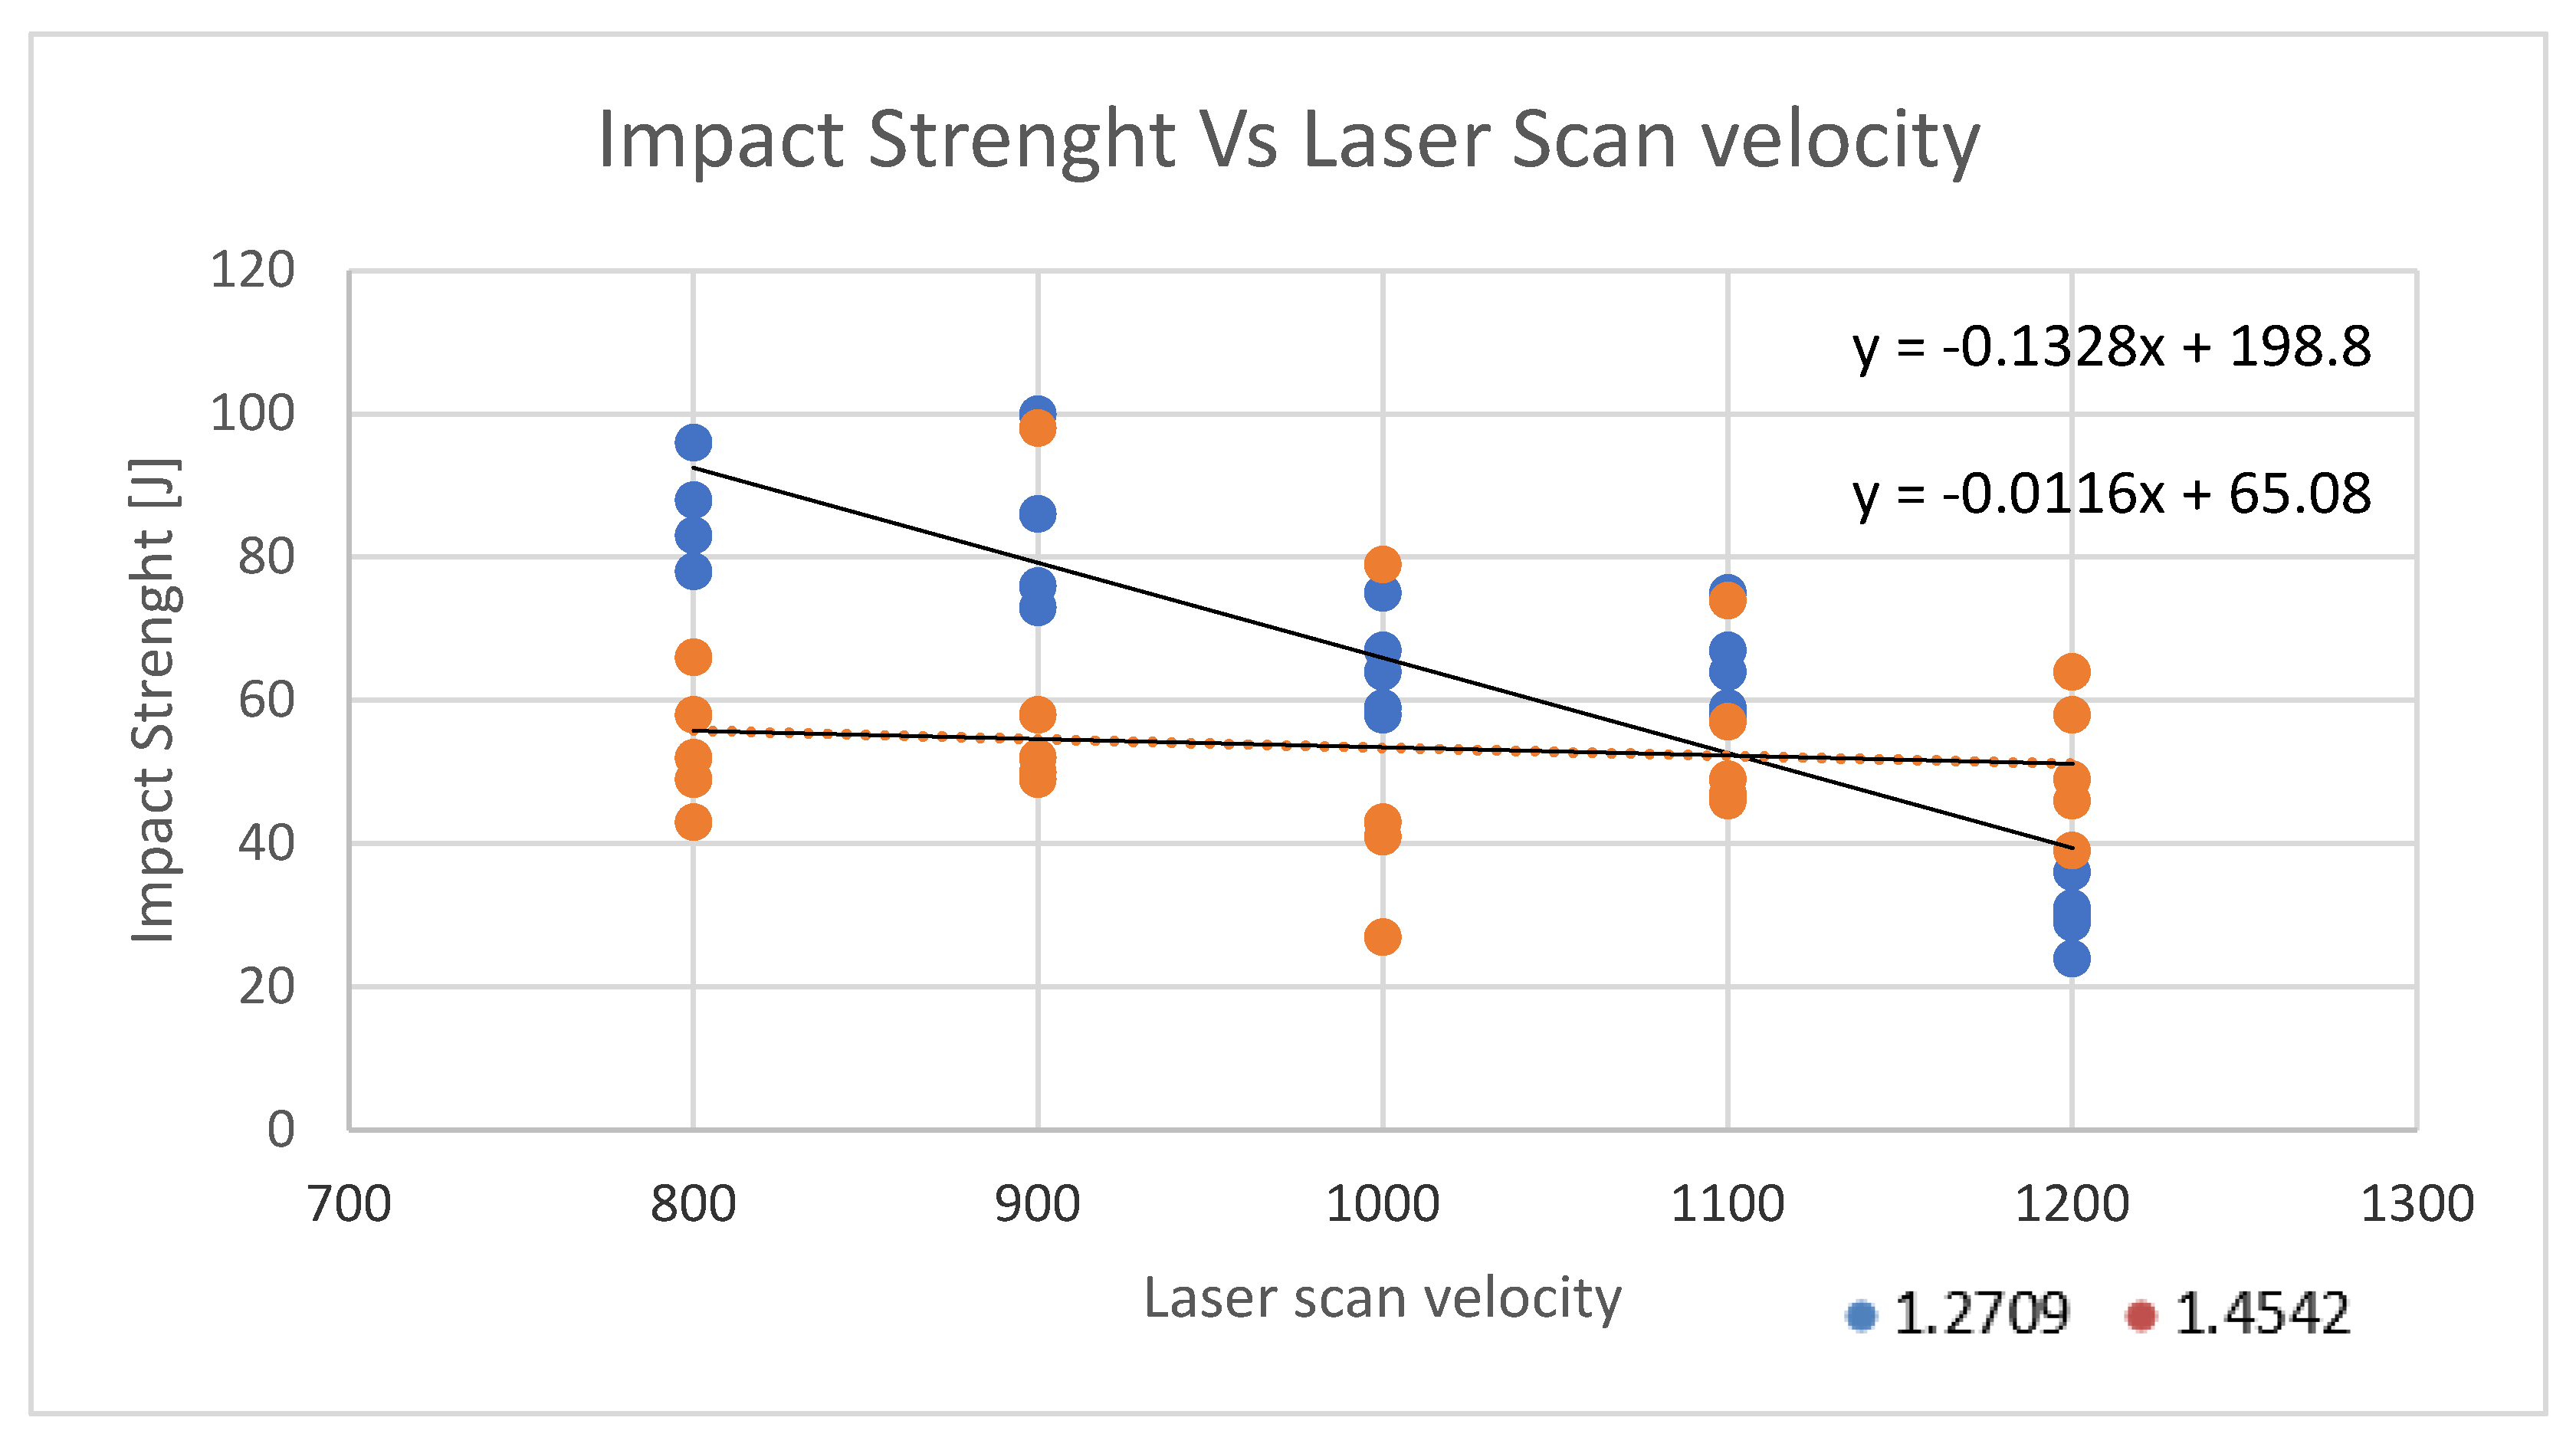
In
Figure 8,1.2709 steel trend line shows a sharp decline in impact strength with increasing laser scan velocity. So here we take the lowest value of laser scan velocity (that is 800 mm/s) as the safe and optimum value for this steel.
1.4542 steel trendline is almost constant reflecting that increasing laser scan velocity almost has no effect on the impact strength.
4.4. Maximum Stress (UTS) Vs. Laser Scan Velocity
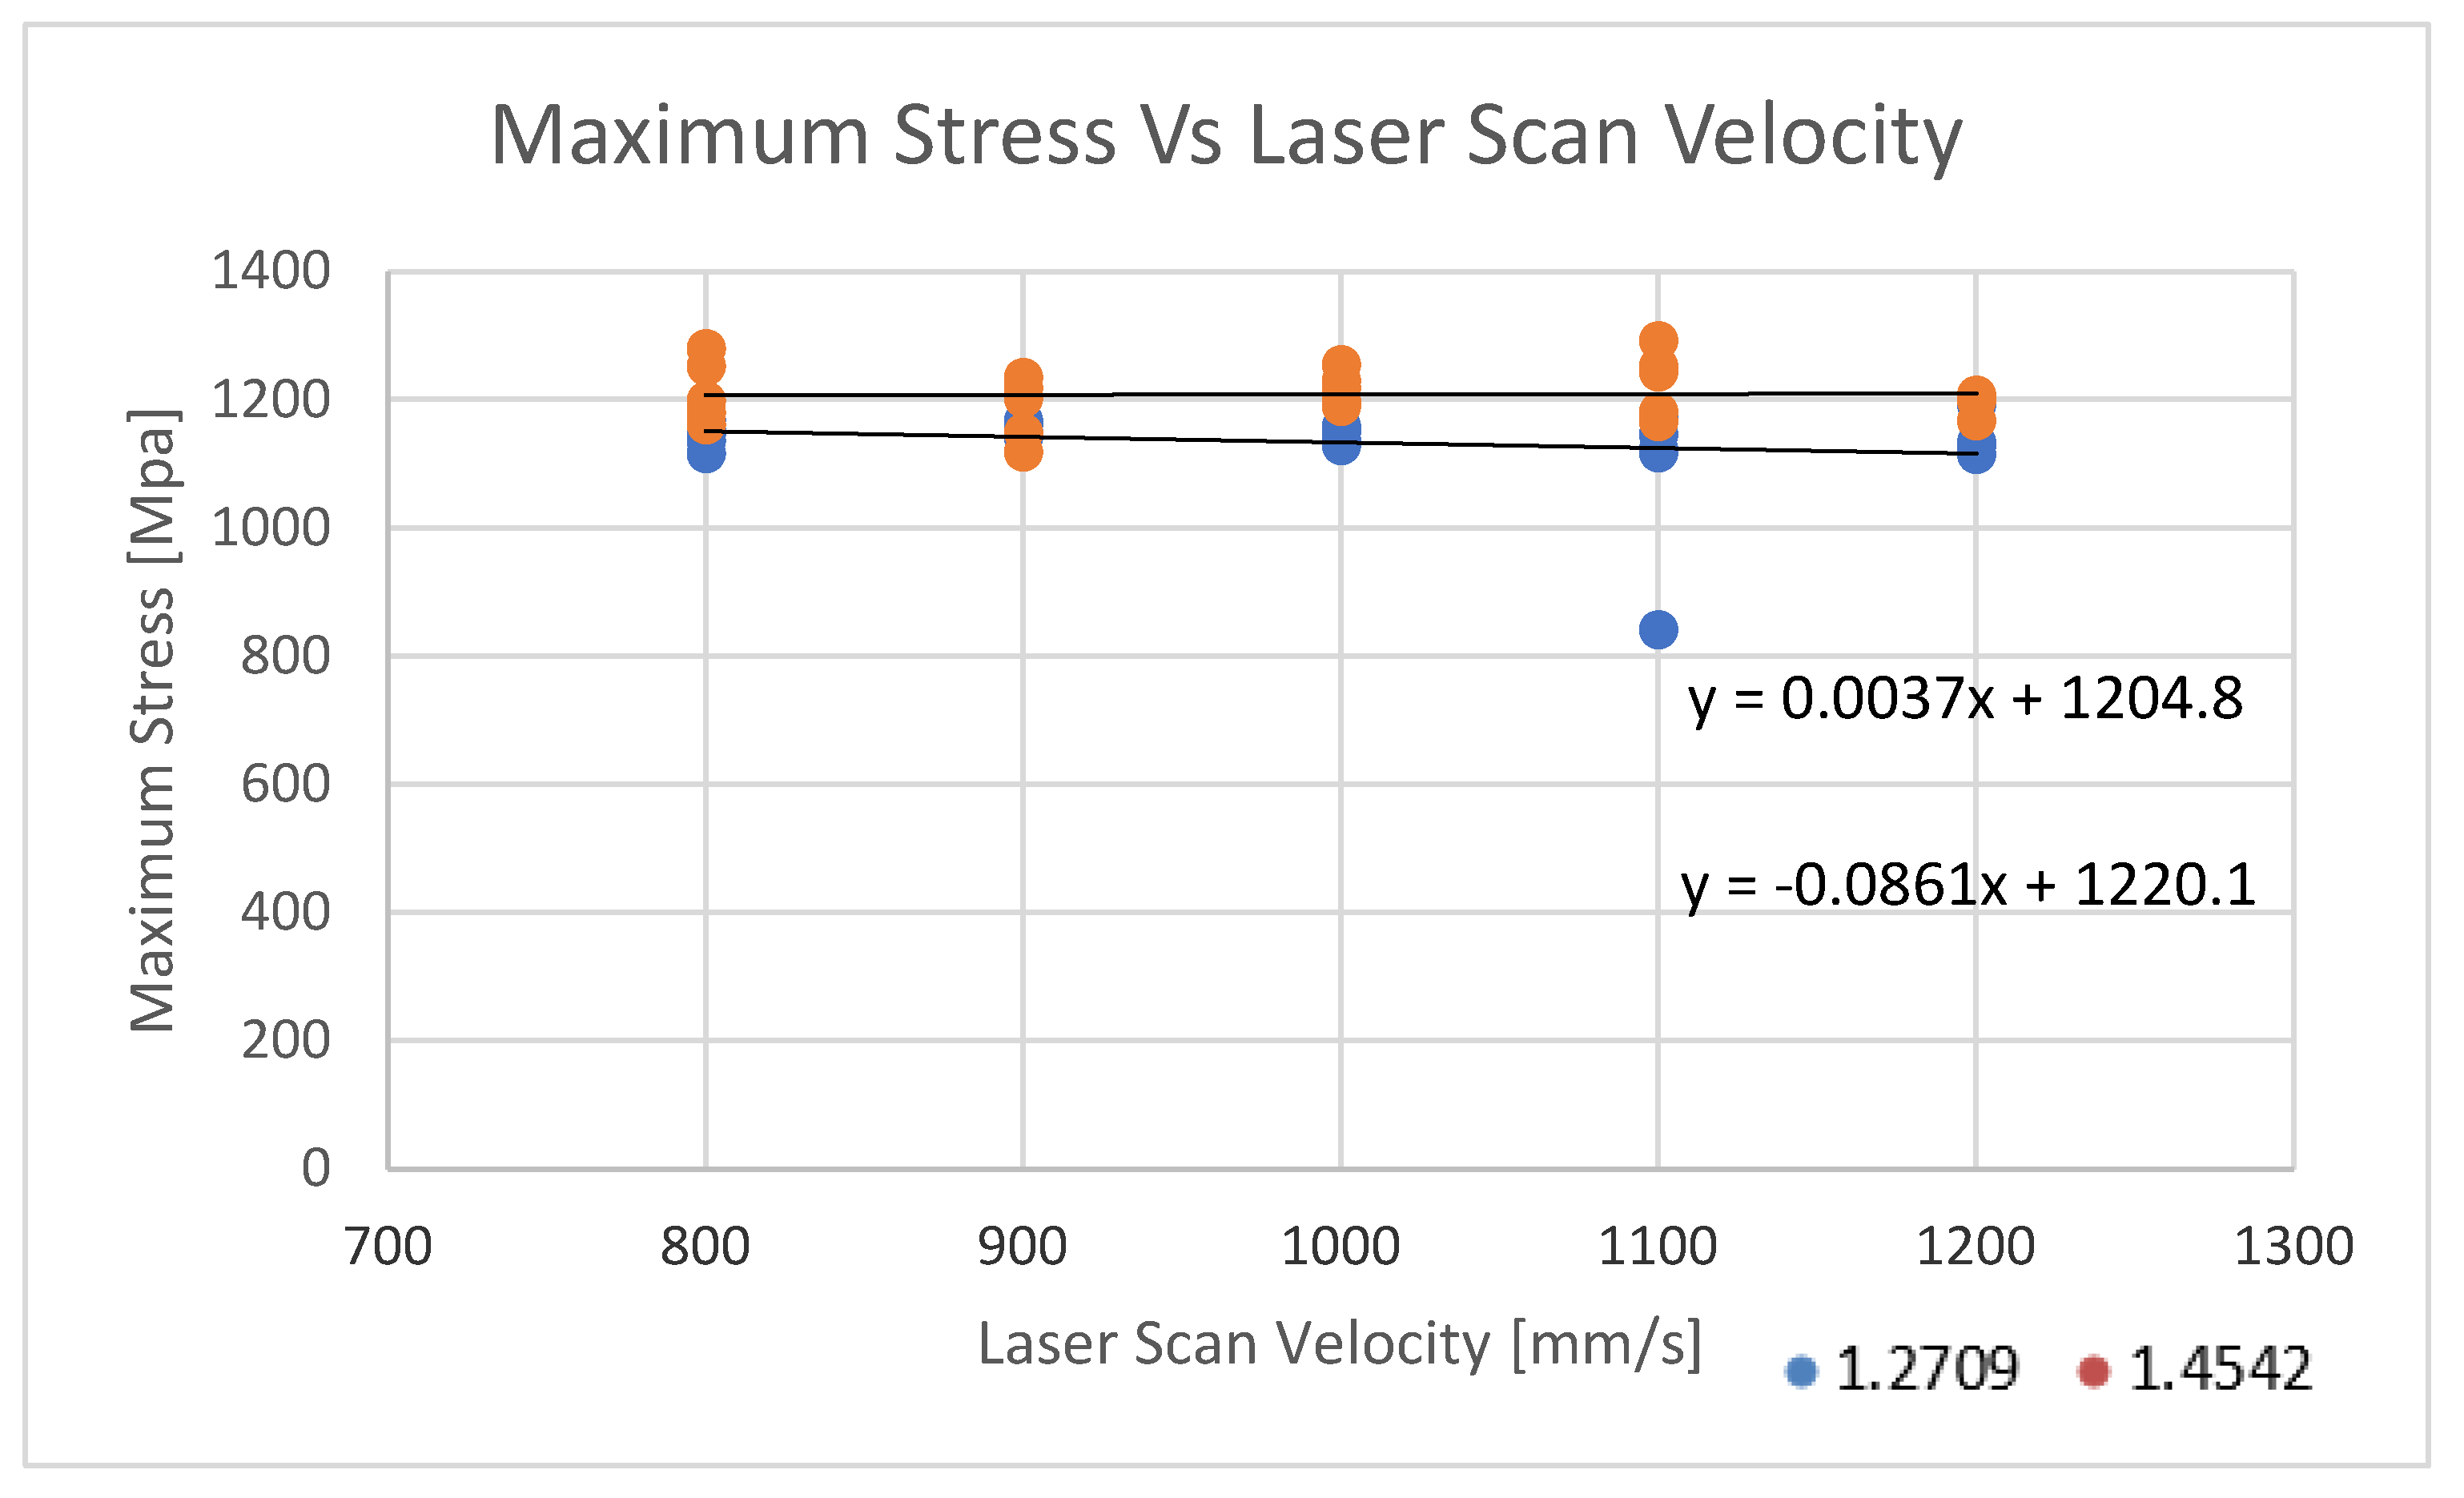
In
Figure 9, concerning both the steels (1.2709 and 1.4542), the increasing laser scan velocity does not affect the maximum stress (UTS).
5. Conclusion
Laser power as a process parameter has crucially affected the impact strength of 1.2709 material as a directly proportional function. Laser power of 347W is safe and optimum for this material (1.2709 steel) for impact strength in the examined range. Increasing laser power showed a slower increase in impact strength values for 1.4542 steel. 340 W laser power is the optimum laser power for the impact strength of 1.4542 steel. The optimum laser power range for the impact strength of both steels lies between 340W and 347W. Laser power had a declining effect on the maximum stress values of both steels. For maximum stress concerning both materials, the optimum laser power lies between the range of 255W (for 1.2709 steel) and 292W (for 1.4542 steel). An increase in laser scan velocity adversely affected the impact strength of 1.2709 steel. The optimum laser scan velocity for impact strength of 1.2709 steel is 800 mm/s. The laser scan velocity did not affect the impact strength of 1.4542 steel. Also, it is important to highlight that laser scan velocity showed no impact on the maximum stress of both the steels (1.2709 and 1.4542).
Table 4 and
Table 5 below reflect the impact of laser power and laser scan velocity on the Charpy test and the tensile test conducted on both steels.
Author Contributions
Varun Vashist: Investigation, Conceptualization, Writing – review & editing, Validation. Dr. Oldal Istvan: Conceptualization, Writing – review & editing, Supervision. Rawabe Fatima Faidallah: Investigation, Writing – review & editing. Dr Zoltan Szakal: Investigation, Writing – review & editing, Validation.
Funding
This research did not receive any specific grant from funding agencies in the public, commercial, or not-for-profit sectors.
Acknowledgments
We are thankful to TCT company, Budapest for their continued support in this research work. Additionally, we extend our deep gratitude to Mr. Akos Tottosi of the TCT group for his extended support, as without him this research work would otherwise have been very difficult to carry out.
Conflicts of Interest
The authors declare that they have no known competing financial interests or personal relationships that could have appeared to influence the work reported in this paper.
References
- S. Cooke, K. Ahmadi, S. Willerth, R. Herring, Metal additive manufacturing: technology, metallurgy and modeling, J. Manuf. Process. 57 (2020) 978–1003. [CrossRef]
- T. Abdullah, N. Zaman Khan, Experimental Study on Mechanical Behaviour of Additively Manufactured 17-4PH Stainless Steel, 2021.
- Wohlers T. Tracking global growth in industrial-scale additive manufacturing, 3D Print. Addit Manuf 2014; 1:2e3.
- Kassym K, Perveen A. Atomization processes of metal powders for 3D printing. Mater Today Proc 2020; 26:1727e33.
- Ma G, Li Z. Printable properties of cementitious material containing copper tailings for extrusion-based 3D printing. Construct Build Mater 2018; 162:613e27.
- Hao Liang, Wang Wanlin, Zeng Jie, et al. Effect of scanning speed and laser power on formability, microstructure, and quality of 316L stainless steel prepared by selective laser melting. Journal of Material Research and Technology 2023; 25: 3189 -3199.
- Kaschel FR, Celikin M, Dowling DP. Effects of laser power on geometry, microstructure, and mechanical properties of printed Ti-6Al-4V parts. Journal of Materials Processing Tech. 278 (2020) 116539.
- Kaya Gürkan, Yıldız Fatih, Korkmaz Ismail Hakkı, et al. Effects of process parameters on selective laser melting of Ti6Al4V-ELI alloy and parameter optimization via response surface method. Materials Science & Engineering A 885 (2023) 145581. [CrossRef]
- Liu Kai, Gu Dongdong, Guo Meng, et al. Effects of processing parameters on densification behavior, microstructure evolution, and mechanical properties of W–Ti alloy fabricated by laser powder bed fusion.
- Hukpati Kenneth, Eliasu Ali, Tetteh Francis, et al. Effect of printing parameters on the structure and high strain rate deformation behavior of additively manufactured 316L stainless steel. Materials Science & Engineering A 853 (2022) 143710.
- Praneeth Jammula, Venkatesh Sriram, Krishna L Sivarama. Process parameters influence on mechanical properties of AlSi10Mg by SLM. Materials Today Proceedings. [CrossRef]
- Availablefrom:https://www.eos.info/05-datasheet-images/Assets_MDS_Metal/EOS_ToolSteel_1.2709/Material_DataSheet_EOS_ToolSteel_1.2709_Premium_en_2020.pdf, [last accessed 07/22/2024].
- Available from: Specification Sheet: Alloy 17-4PH (stainless. eu) [last accessed 08/10/2024].
- Available from: 1.4542 (17-4PH®), S17400 | Datasheet | METALCOR [Last accessed 07/29/2024].
|
Disclaimer/Publisher’s Note: The statements, opinions and data contained in all publications are solely those of the individual author(s) and contributor(s) and not of MDPI and/or the editor(s). MDPI and/or the editor(s) disclaim responsibility for any injury to people or property resulting from any ideas, methods, instructions or products referred to in the content. |
© 2024 by the authors. Licensee MDPI, Basel, Switzerland. This article is an open access article distributed under the terms and conditions of the Creative Commons Attribution (CC BY) license (http://creativecommons.org/licenses/by/4.0/).
