1. Introduction
The treatment of bio-waste is currently a complex and often discussed issue, as many of the producers of bio-waste do not know how they should handle it properly. In the Czech Republic, in recent years, the annual production of waste from catering facilities has been around 15,000 tons of reported waste. However, the reality can be estimated at up to 60 - 75 thousand tons per year. The reason for this difference is due to the unreported activities of waste producers. Currently, we are allowed to treat catering and food preparation waste in several ways, e.g. by composting or using the method of anaerobic digestion. According to the Waste Act, any producer of such waste must hand over the waste to an authorized company, which will process it according to the available options. This waste must be disposed of as quickly as possible, placed in sealable containers that are easy to clean and disinfect and made of materials that allow for sanitation. Another criterion is that the container must be sufficiently labelled to make it clear that it is intended for these purposes. In some cases, disposable plastic containers are also used. For reasons of practicality and speed of disposal, waste was fed to livestock or crushed with a kitchen shredder and flushed down the drain in the past. Both options are now banned [
1].
Catering waste belongs to the group of bio-waste, which is the abbreviated name for biodegradable waste. These are the wastes that are capable of aerobic or anaerobic decomposition. According to Regulation (EC) No. 1774/2002 of the Parliament and of the Council, catering waste can be defined as 'all food waste, including used table oil, originating from restaurants, catering establishments and kitchens, including central kitchens' [
2]. Food leftovers from catering establishments are classified in Group 20 (municipal waste) and specifically in Group 20 01 08 - Biodegradable waste from kitchens and catering establishments.
In canteens and catering establishments, especially those that only heat and serve ready-to-eat products, food leftovers represent the largest part of the waste. How to deal with waste such as plastic, paper or glass is a well-known fact. However, how to properly manage waste such as food scraps is not so clear-cut anymore. Act No. 185/2001 Sb. on Waste and Amendment of Some Other Acts [
3] has introduced a very strong instrument for reducing the amount of biodegradable waste going to landfill, and the law implies that material recovery always takes precedence over other uses, such as energy recovery. Waste for which no recovery has been found can be disposed of. Landfilling is then the last method of waste disposal. In the case of anaerobic co-digestion with biogas production, this is a material-energy recovery of biowaste, and it is not always clear in advance whether the method is preferable to material recovery in the form of compost for a given biowaste.
Anaerobic digestion process can take place under thermophilic, mesophilic or psychrophilic conditions. The typical temperature range of psychrophilic digestion is up to 20°C [
4]. In the anaerobic system, each new batch of substrate is first dissolved and hydrolyzed, while neither organic acids nor hydrogen are produced to a greater extent. In the second phase, the hydrolysis products are acidified, releasing CO2 and hydrogen. These changes will most noticeably affect the values of the VFA/TIC parameter and the concentrations of H2 in liquid and gas. In the next phase - acetogenesis, higher acids are broken down to acetic acid, and CO2 and H2 are produced again. A steady state occurs only in case of sufficiently intense methanogenesis, during which both acetic acid and H
2 and CO
2 are consumed [
5,
6].
The initial steps of the pathway remain the same in thermophilic, mesophilic and psychrophilic digestion; however, with the operating temperature, other active groups of microorganisms appear in the process. The digestion process consists of events that convert organic compounds into more stable compounds with simultaneous release of biogas, which is a mixture of mostly methane and carbon dioxide. The bacterial hydrolysis breaks down complex insoluble organic matter consisting of carbohydrates, proteins, lipids, and fats. The products are soluble compounds such as simple sugars, amino acids, and fatty acids. This is mediated by various hydrolytic bacteria including members of
Bacteroides,
Clostridium,
Streptococcus, which can produce extra cellular enzymes involved in the degradation and solubilization of complex molecules. In the next phase of acidogenesis, acid-producing bacteria belonging to the genera
Bacillus,
Lactobacillus and Serratia spp further degrade the soluble substrates into intermediate products. They consist mainly of heavy fatty acids (VFA) and lower acids such as acetic acid, propionic acid, butyric as well as other short-chain fatty acids, alcohols, H
2 and CO
2. The resulting VFAs and alcohols are further converted into acetic acid, carbon dioxide and hydrogen by acetogenic bacteria during the acetogenesis. Acetate-producing bacteria, including bacteria of the genera
Synthrophomonas and
Synthrobacter, are responsible for the conversion of the acid phase to acetogenesis and generate acetate, CO
2, protons and H
2 as the main precursors of methanogenesis. Evidence exists that
Clostridium thermoaceticum may also reduce protons and, hence, produce H
2 under certain conditions. Thus proton-reducing acetogens may also utilize the acetyl CoA pathway for CO
2 reduction. In the final step, methanogenic archaea, for example
Methanosaeta spp., they use the products obtained from the previous steps (acetate, CO
2 or methylated compounds) as a substrate for the production of methane-rich biogas [
4,
7,
8].
The fermentation of food leftovers was dealt with by the team of the Austrian engineering office of Ing. Friedrich Bauer GmbH, which realized one of the largest model plants for the fermentation of food leftovers and expired food. Here, after collection and sanitation of food scraps and expired food, the material was anaerobically fermented at mesophilic conditions. With an annual feedstock volume of more than 9,000 tons, approximately 1.8 million cubic meters of biogas was obtained. In one year, the plant produced around 3.8 GWh of electricity and 4.7 GWh of heat. The facility's annual own heat energy demand is about 130 MWh, which is used for substrate sanitization, heating the fermenters and the operating areas, as well as for hot water for the waste container washing plant. Excess heat is used for drying the digestate for further use as fertilizer. The economy of the whole plant is due to the high degree of conversion of organic matter during the fermentation process (70-75% in the first stage and 90-97% in both stages) [
9]. Food waste in the United States also includes unconsumed food and food preparation residues from residences, commercial establishments such as restaurants, institutional sources such as school cafeterias, and industrial sources such as factory cafeterias. For the most part, food waste is disposed of in landfills. In this study, they used thermophilic anaerobic digestion. The biogas yield from food waste was calculated to be 465.4 m
3 of biogas per dry ton. The average CH
4 and CO
2 contents measured were 73% (v/v) and 27%, respectively. Thus, based on the 73% methane content and 37.3 MJ/m
3 energy content, an average energy content of 27.2 MJ/m
3 can be estimated for biogas produced from food waste. The results of the anaerobic digestion tests showed that the food waste had an average methane yield of 435 ml/g VS after 28 days of digestion at 50 ± 2 °C. About 80% of the methane yield was obtained after the first 10 days of digestion, giving a methane yield of 348 ml/g VS. Methane accounted for 73% of the biogas produced. In conclusion, food waste was a highly desirable feedstock for anaerobic digestion. [
10]
The city of Ostrava in the eastern part of the Czech Republic will also start to use leftover food from Ostrava schools and will start to collect this material and use it for biogas production. The waste from the canteens will not end up in landfill, but will be used to produce biogas or fertiliser, which will be facilitated by OZO Ostrava company [
11].
The aim of the article is to evaluate the usefulness of measuring the concentration of dissolved hydrogen in an anaerobic fermenter with the aim of maintaining the stability of the anaerobic process. We would like to verify whether the dissolved hydrogen concentration correlates with the VFA/TIC ratio, which is a commonly used parameter to assess the stability of the anaerobic process. Dissolved hydrogen monitoring could be a useful tool for monitoring and controlling the anaerobic fermentation process, especially when it comes to maintaining stable conditions for the proper functioning of the anaerobic plant. In a study [
12], they addressed the monitoring of dissolved hydrogen concentration, as it is known to be closely related to VFA accumulation. direct measurement of hydrogen in the liquid phase and trace reduction gas analyzer. In this study, a new approach for dissolved hydrogen monitoring including liquid hydrogen transfer through a Teflon membrane and gas-phase detection using a Pd metal oxide semiconductor (Pd-MOS) sensor was investigated.
Process failures result in financial losses due to reduced biogas yield as well as increased personnel deployment and process adjustment costs. Research activities in the field of AD process disorders have focused primarily on the development of strategies to prevent disorders. Several abiotic factors have been identified that can serve as early warning indicators, including total or individual volatile fatty acid (VFA) concentration and hydrogen concentration [
13].
The concentration of hydrogen affects the degradation of many organic compounds and may be a sensitive guide to the metabolic state of biomass degrading wastes to methane. The use of the concentration of hydrogen in the biogas as a process control index should therefore be evaluated in the industrial context. The results demonstrate that during the operation of the digester the hydrogen concentration in biogas remained fairly constant but following three out of four volumetric shock loads the hydrogen levels rose rapidly before recovering to normal levels within a day. Hydrogen is produced at many stages, and by many bacterial species, during anaerobic digestion and is then consumed by the carbon dioxide-reducing methanogenic bacteria. The capacity of the methanogenic bacteria to remove hydrogen is normally far from being saturated. Increased hydrogen levels inhibit the degradation of volatile fatty acids such as propionic and butyric and can also inhibit acetoclastic methanogenesis by
Methanosarcina spp. Consequently, in the extreme, accumulation of hydrogen leads to an increase in volatile fatty acid concentrations and acidification within the digester. Measurement of hydrogen levels is therefore appropriate in the development of a process control strategy in anaerobic digestion [
14].
3. Results and Discussion
3.1. Process Parameters
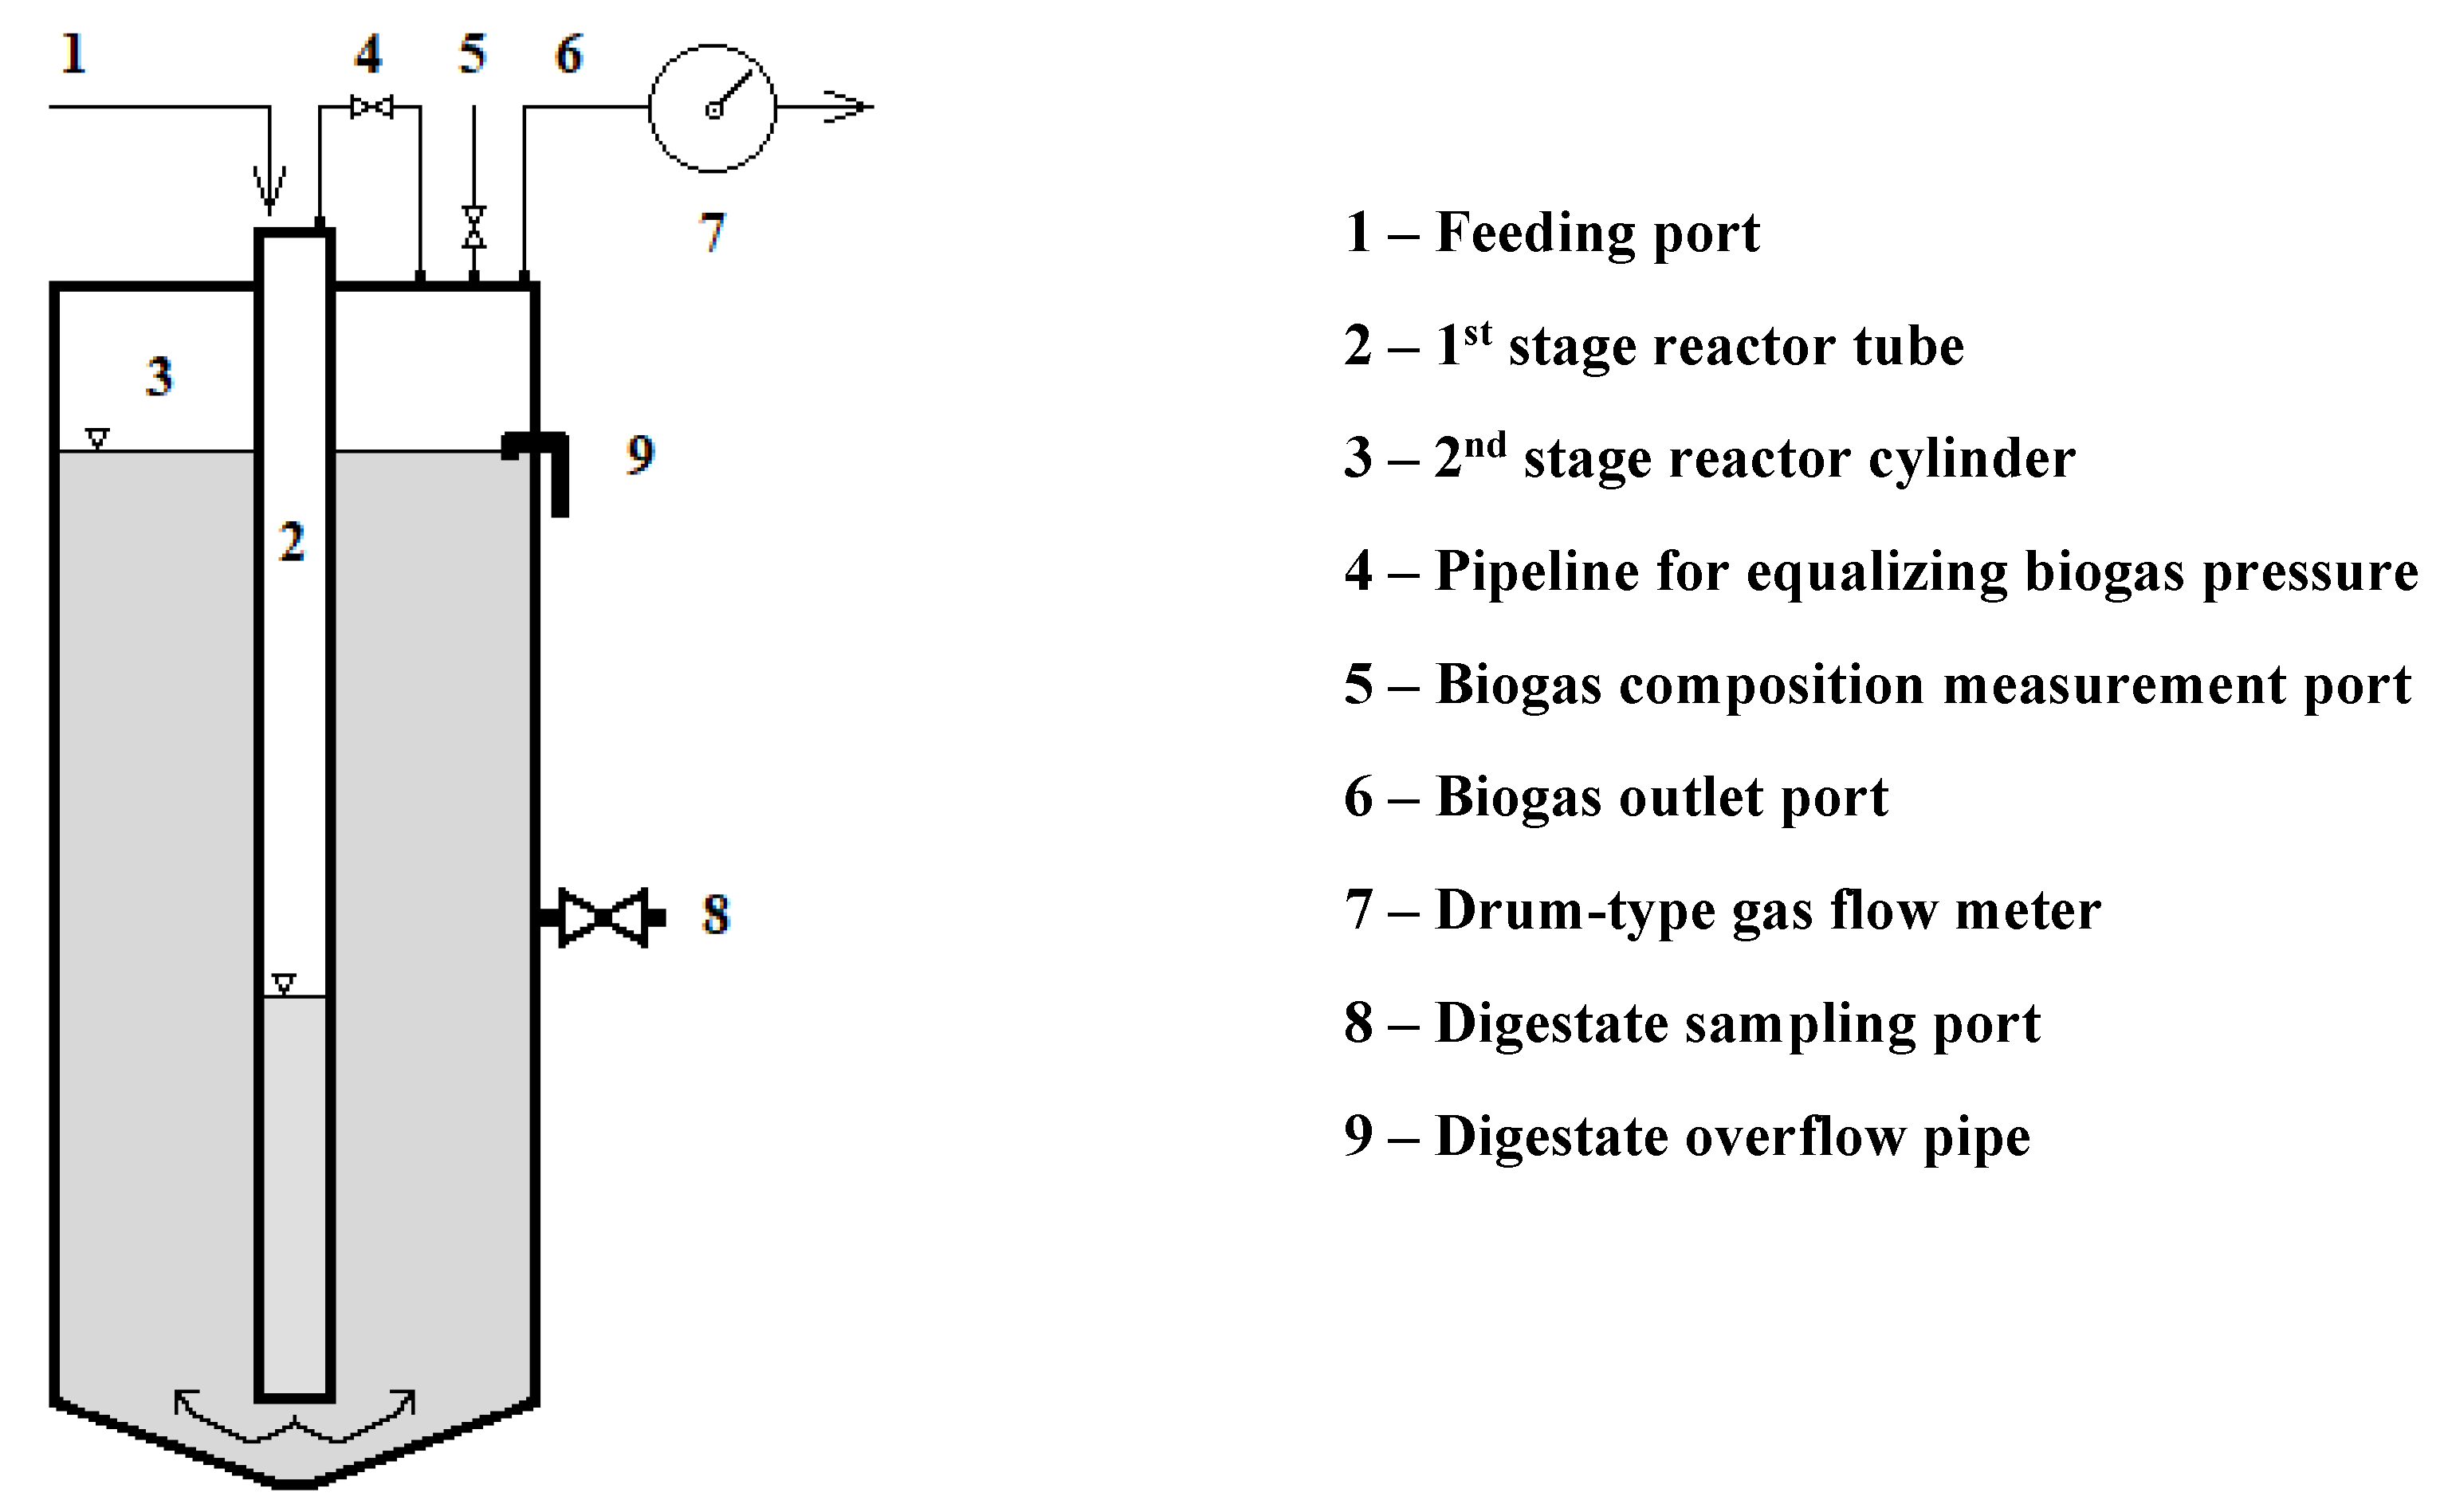
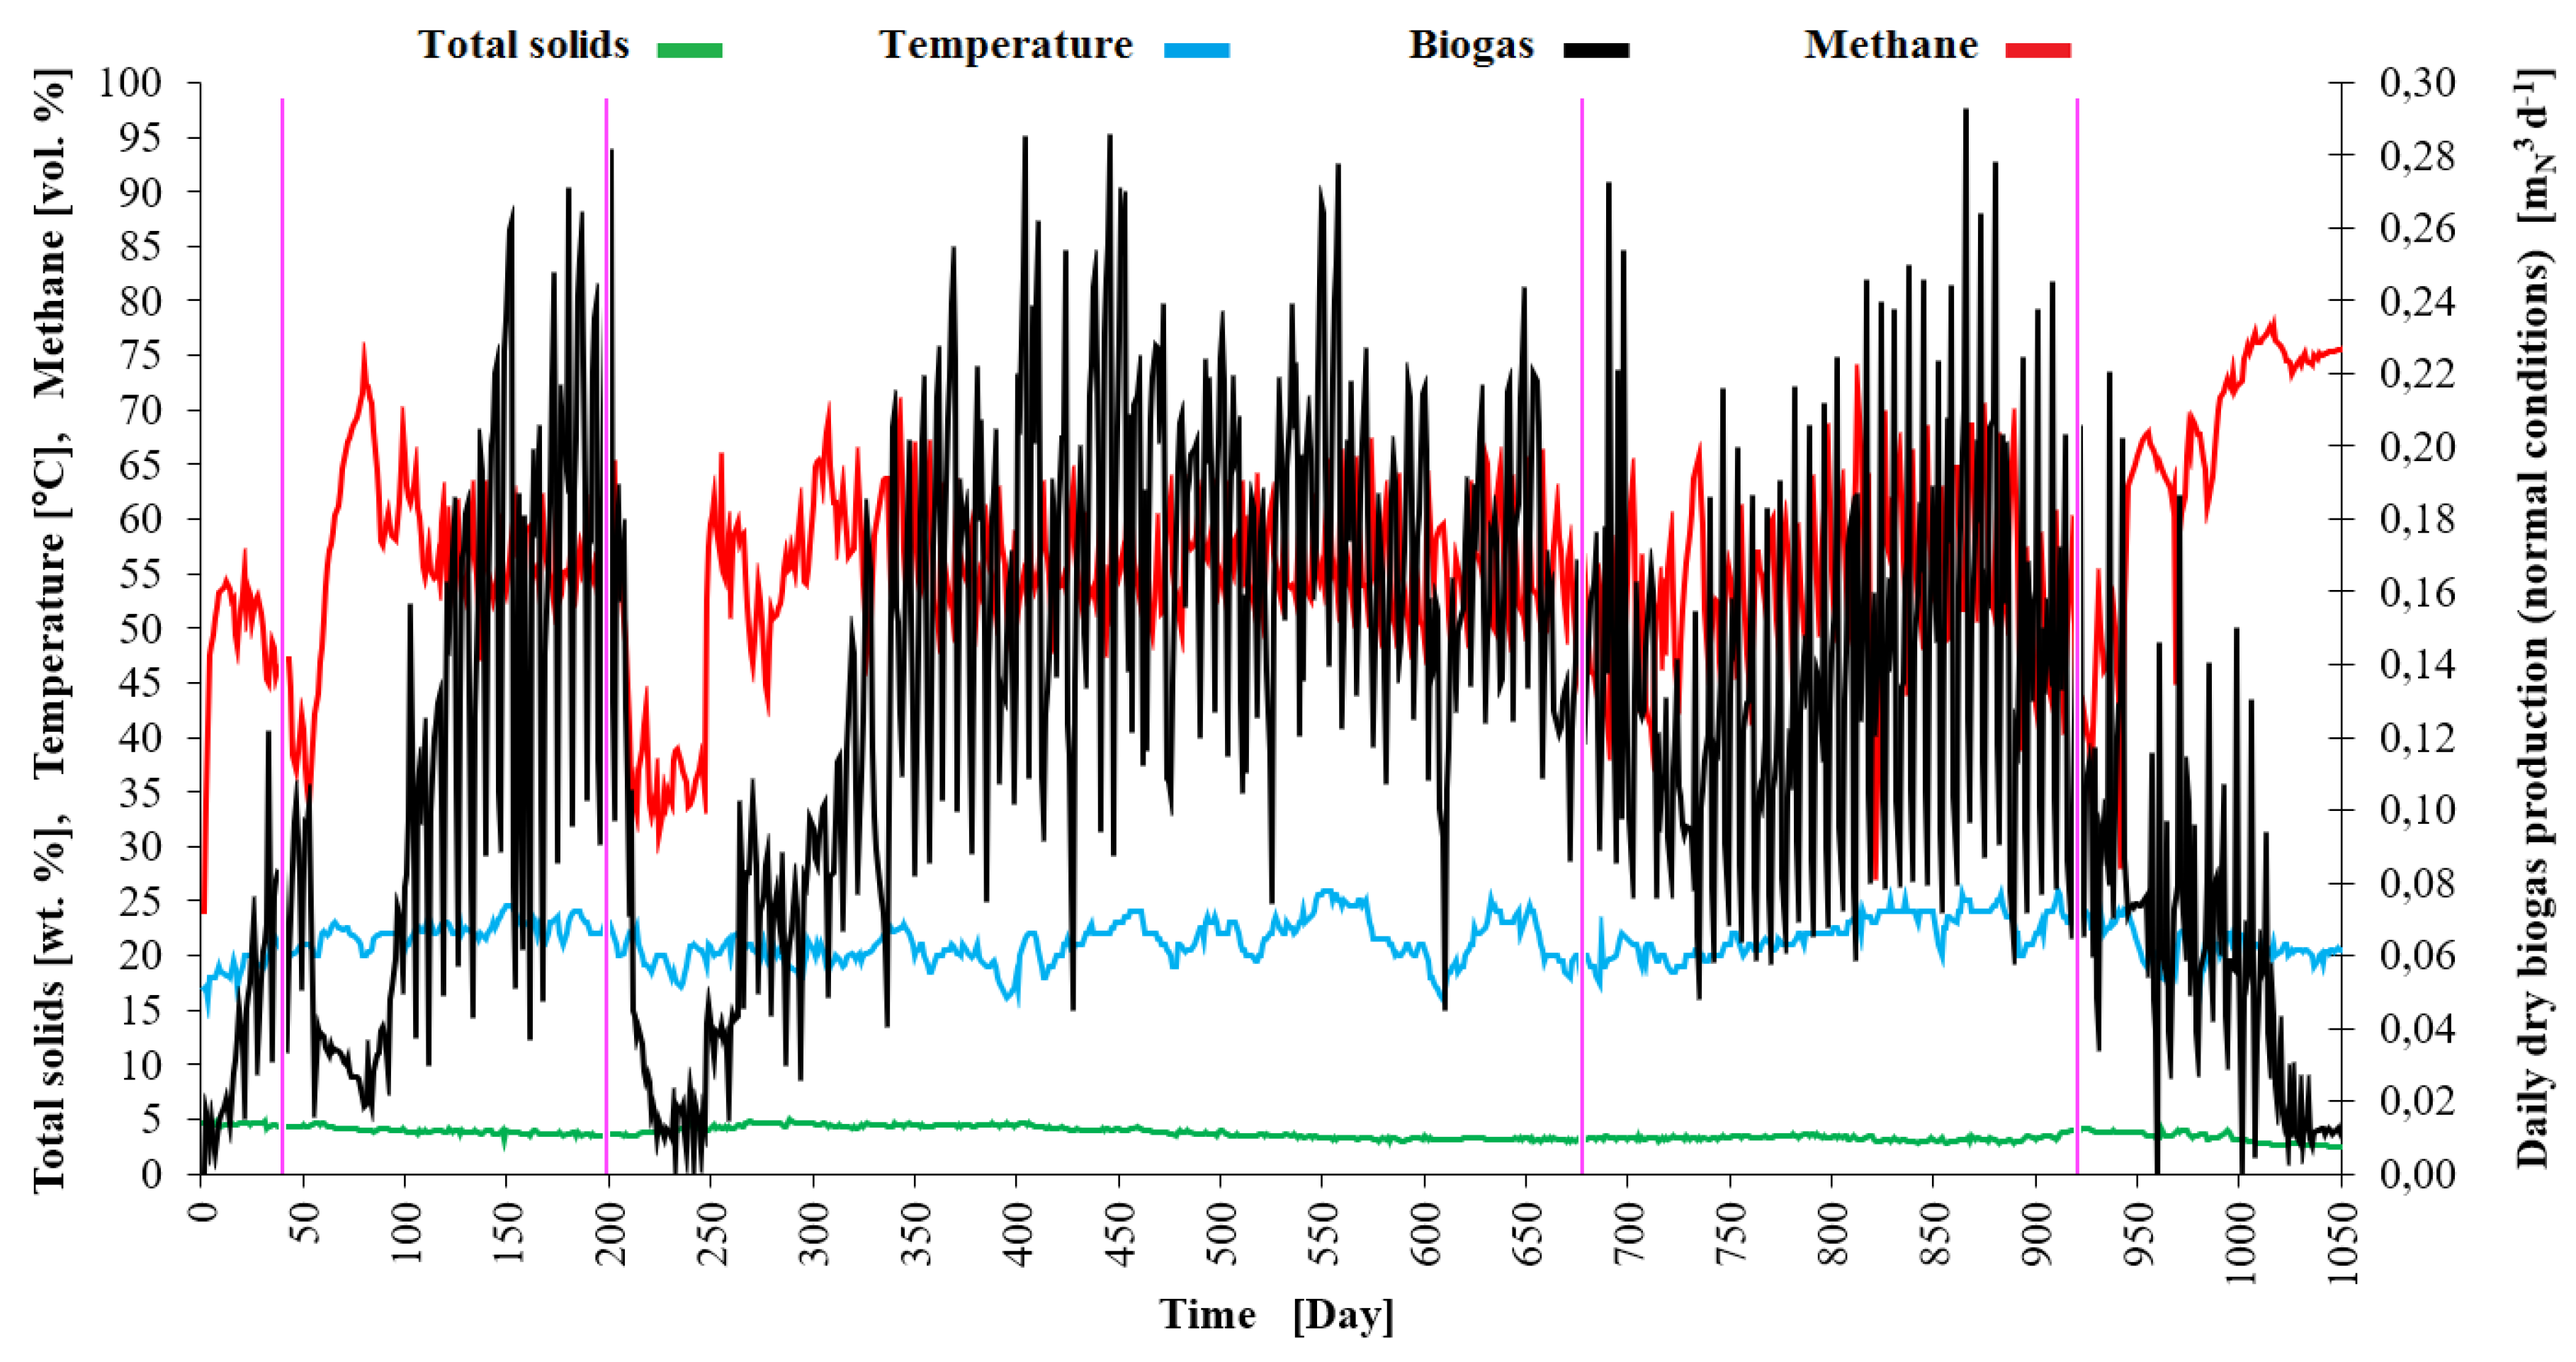
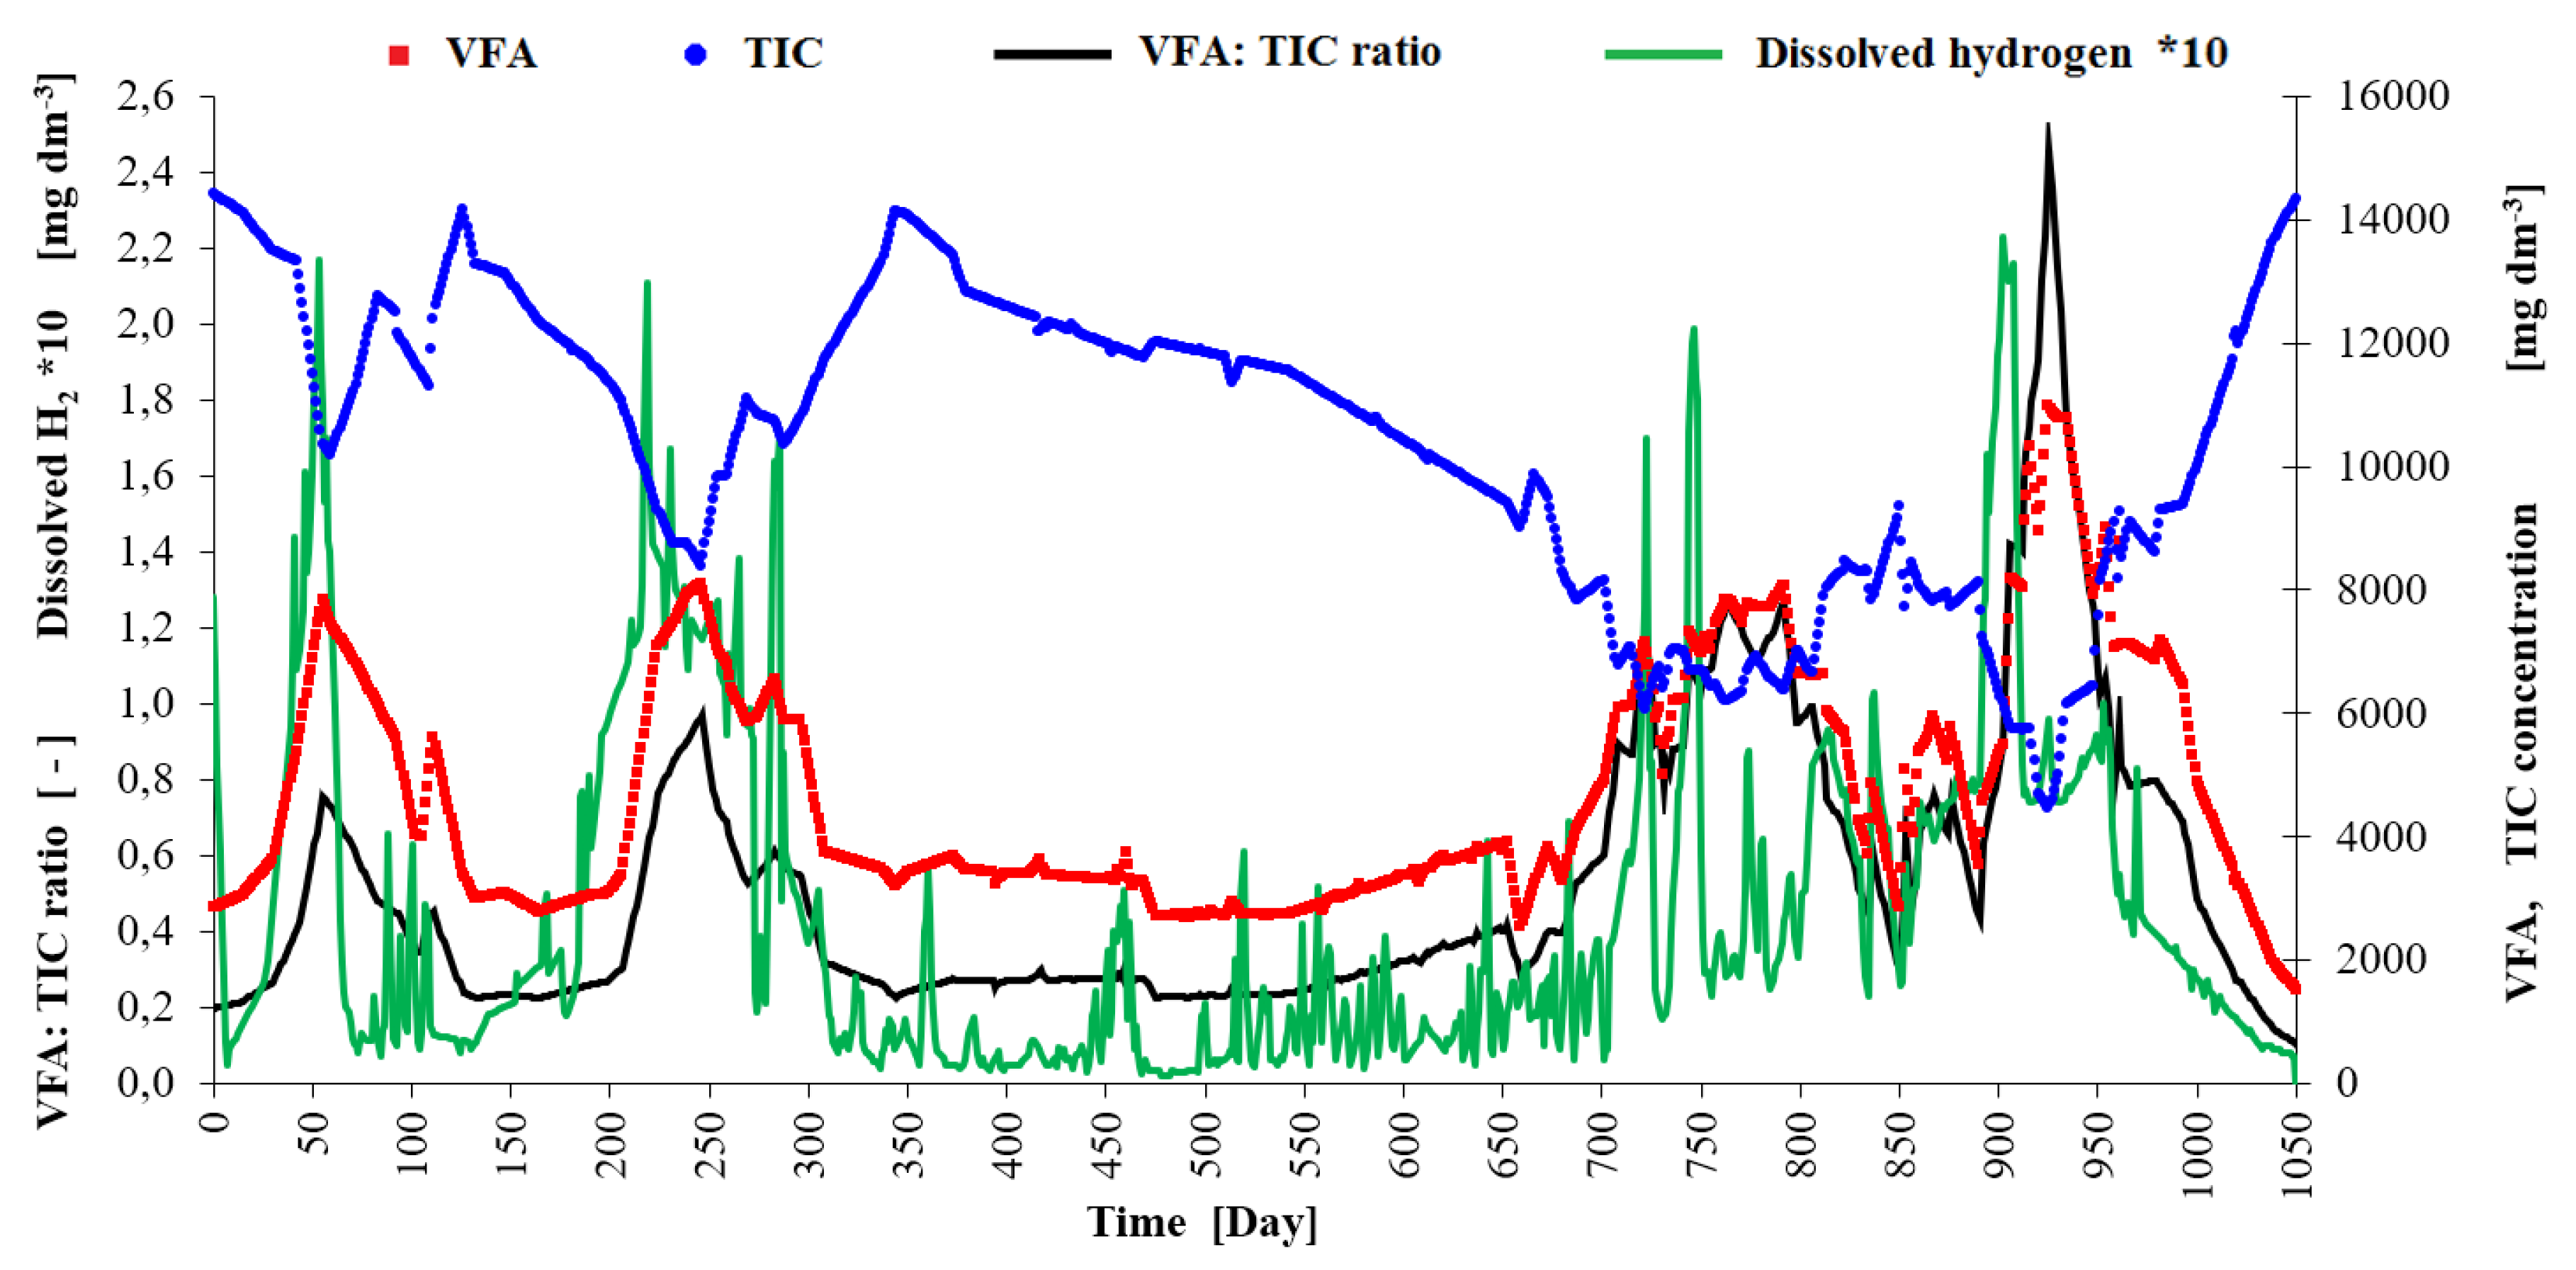
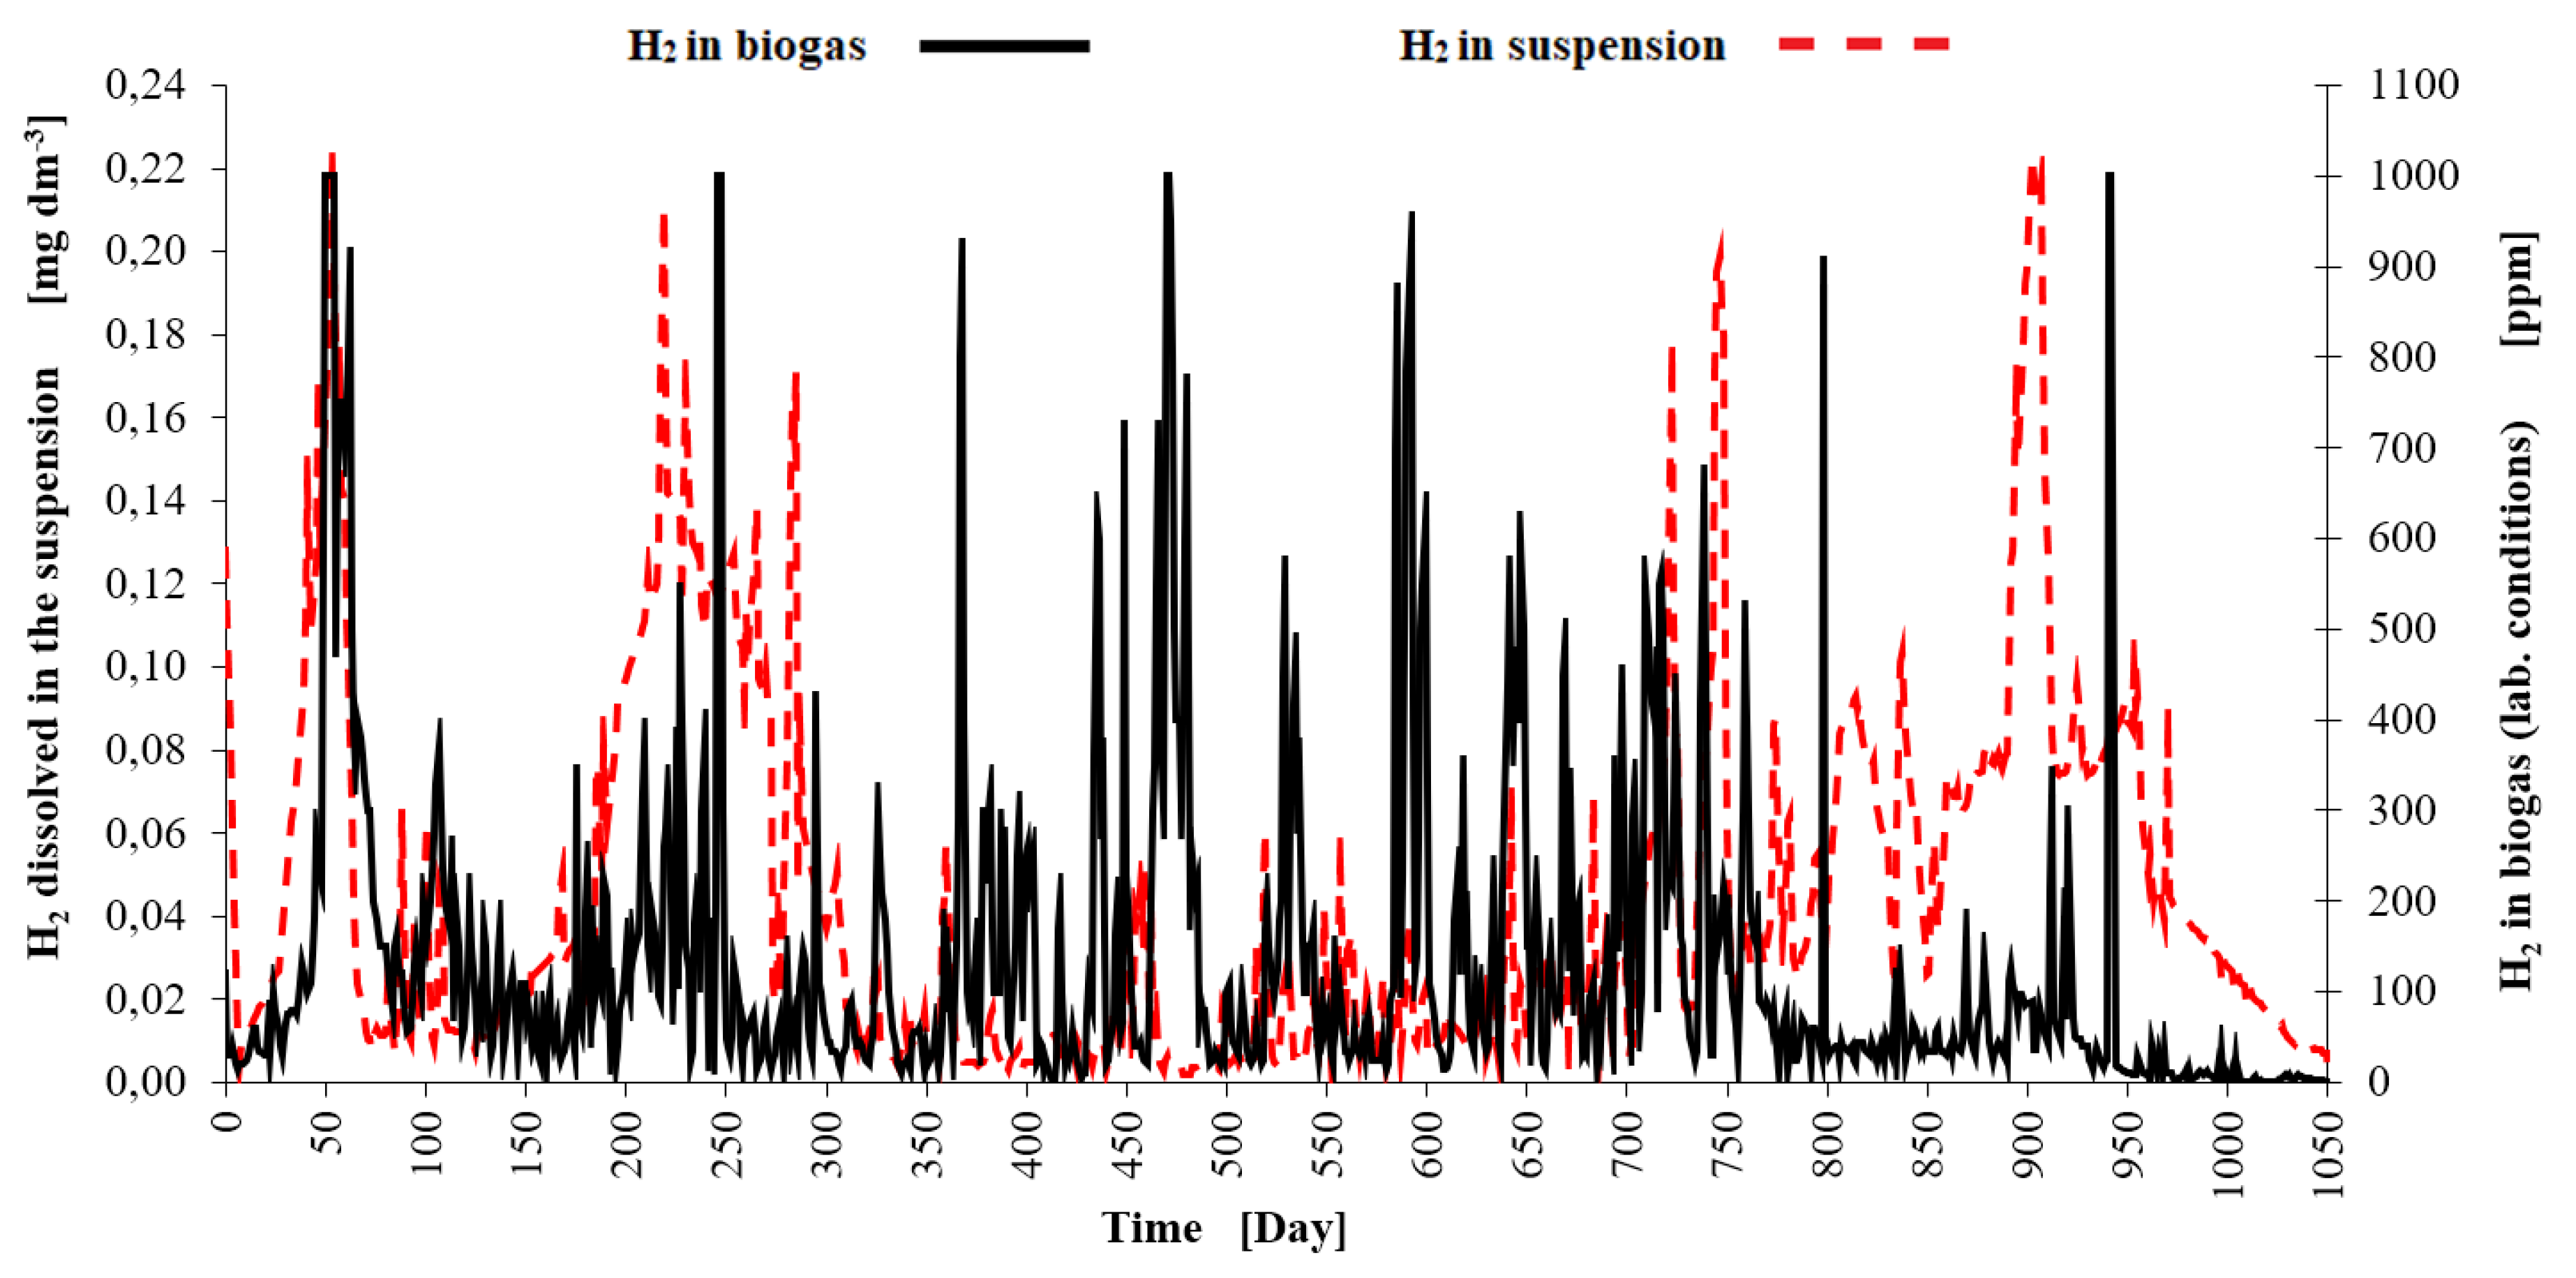
During the 1050 days of the experiment (see
Figure 3), the average total solids content of the food leftovers dosed (pH 3.4-5.9) was 15.59 wt. %. At an average specific gravity of 1068 kg m
-3, the organic content was 93.15 wt.%. At an average organic loading rate (OLR) of 15.45 kg
VS m
-3 d
-1 the 1
st stage worked with an average theoretical retention time (THRT) of 12 days. The 2
nd stage worked at OLR of 0.657 kg
VS m
-3 d
-1 with THRT of 210 days. The reactor as a whole produced 0.123 Nm
3 d
-1 biogas and 0.069 Nm
3 d
-1 methane, respectively. The average biogas production per unit mass of wet substrate reached 0.070 Nm
3 kg
-1. The CH
4 production per unit mass of total solids input averaged 0.250 Nm
3 kg
TS-1 and per unit mass of volatile solids input averaged 0.268 Nm
3 kg
VS-1. The volatile solids content of the suspension was reduced to 2.40 wt. %, i.e. 84 %, by the process. The average values of the measured and calculated experimental parameters are given in
Table 2 and graphically represented in
Figure 3,
Figure 4 and
Figure 5.
The curve of daily biogas production in
Figure 3 shows that four overload crisis periods occurred during the digestion experiment. The first overload started around the day 30 when the OLR for the 2
nd stage increased to 1.2 kg
VS m
-3 d
-1 and the corresponding THRT shortened under 140 days. Between days 50-100 the VFA concentration increased (see
Figure 4) and the VFA/ TIC ratio was in the interval of lower stability (0.4-0.6). There was high peak of hydrogen in mixed biogas in this period (see
Figure 5). This peat was limited by the analyser limit (1000 ppm H
2). The peak of hydrogen concentration dissolved in the 2
nd stage slurry (see
Figure 4 and 5) did not precede the peak of H
2 in gas or the peat of VFA much. Feeding had to be decreased and a few doses of substrate had to be omitted. After that the digestion process relatively stabilized and biogas and methane production efficiency increased.
The second overload has occurred between the day 200 and 300 when the OLR for the 2nd stage was increased over 2.0 kgVS m-3 d-1 and the corresponding THRT shortened under 80 days. The VFA concentration increased to similar level like in the first overload period (approx. 8000 mg dm-3) and the maximum of VFA/ TIC ratio was 1.0. Highest peak of hydrogen in mixed biogas did not occur soon and was overtaken by the peak of dissolved hydrogen (maximum of 0.21 mg dm-3). This overload period was best signalized by the dissolved hydrogen measurement. During a stable process in the 2nd reaction stage in days 400-600 the concentration of dissolved hydrogen measured by the AMT MS 08 instrument was 0.005 – 0.05 mg dm-3.
The third period of overload has occurred between the day 680 and 800 when the OLR for the 2
nd stage was increased over 1.3 kg
VS m
-3 d
-1 but some doses corresponded to loads of up to 2.5 kg
VS m
-3 d
-1. The VFA concentration increased once more to approx. 8000 mg dm
-3 and the maximum of VFA/ TIC ratio was 1.3. Almost all the peaks of hydrogen concentration in mixed biogas were lower (see
Figure 5) than these peaks in the period of relative process stability with high methane yield (see days 400-600). The rise of dissolved hydrogen concentration was almost continuous (to the maximum of 0.20 mg dm
-3) but there were no high peaks at the beginning of overload period that would strongly suggest overloading. This time the better alarm parameter seemed to be the VFA/ TIC ratio.
The last overload period started around the day 920. The OLR for the 2nd stage reached 1.8 kgVS m-3 d-1 in some doses and the corresponding THRT was around 135 days. The VFA concentration went to the extreme (11000 mg dm-3) and the VFA/ TIC peak reached 2.5. The only strong peak of hydrogen concentration in mixed biogas come in the day 941 when the VFA/TIC ration was already on the decline. Strong peak of dissolved hydrogen preceded the peaks of VFA a VFA/TIC by 23 days and had the power to draw attention to the problem. But the dissolved hydrogen concentration was increased from 0.01 mg dm-3 to 0.08 mg dm-3 long before this overload and yet at this time (days 800-850) the reactor reached one of the highest biogas productions with a stable CH4 content of around 60 vol. %.
The H2S content in mixed biogas increased from 500 ppm over 1000 ppm every time the H2 content in gas had high peak and this could apparently also cause cross-interference when measuring hydrogen in the liquid and gas phase. The AMT Analysenmesstechnik GmbH stated that their AMT MS 08 instrument has very low interference with H2S, but sensor poisoning cannot be ruled out during a long-term use in digestate. The only very high peak of H2S (3800 ppm) occurred during the days 330-375. That time the measured content of hydrogen in liquid and gas phase was generally low, VFA/ TIC ratio was stable under 0.3 and methane production was increasing quickly so the proces was in good balance and inhibition of methanogenesis from H2S probably did not have a significant effect. pH value in the 2nd stage varied in the range 6.4-8.2 and visibly correlated with the course of VFA concentration but the relationship between the change in pH value and the change in biogas or methane production was not clear.
3.2. Hydrogen Concentration Correlation
The correlation analysis between VFA/ TIC and the variables H
2 dissolved in suspension and H
2 in biogas was conducted using both Pearson and Spearman correlation coefficients to comprehensively assess the relationships.
Figure 6 depicts the results of the cross-correlation analysis which investigates the temporal relationships between VFA/ TIC values and both hydrogen concentrations in suspension and biogas at various lags using both Pearson and Spearman correlation methods. Firstly, no time lag between the correlated parameters was used. The Pearson correlation coefficients for H
2 in suspension and VFA/ TIC, as well as H
2 in biogas and VFA/ TIC, were 0.508 and 0.021, respectively. These values suggest a moderate positive linear relationship between H
2 in suspension and VFA/ TIC, while the correlation between H
2 in biogas and VFA/ TIC appears to be weak. On the other hand, the Spearman correlation coefficients for H
2 in suspension and VFA/ TIC, as well as H
2 in biogas and VFA/ TIC, were notably higher at 0.660 and 0.061, respectively. This indicates a stronger monotonic relationship, emphasizing that although the correlation is not strictly linear, there exists a consistent trend in the variables changing together. The discrepancy between the Pearson and Spearman coefficients underscores the importance of considering different aspects of the relationship, as Spearman correlation is less sensitive to outliers and captures nonlinear associations. These results collectively provide a nuanced understanding of the associations between VFA/ TIC and the variables H
2 in suspension and H
2 in biogas, shedding light on both linear and monotonic aspects of their relationships.
Our hypothesis was that after introducing a time lag between the measured data of VFA/TIC versus H2 in gas or VFA/TIC versus H2 in suspension, a stronger correlation would be revealed. Time lag of 0 to 13 days was tested.
Both Pearson and Spearman coefficients between H2 in suspension and VFA/ TIC show positive relationships across all lags. The Spearman coefficients consistently exceed the Pearson coefficients, emphasizing a stronger monotonic association. The correlations tend to increase slightly with increasing lags. For hydrogen in biogas the Spearman coefficients consistently surpass the Pearson coefficients, however the coefficients values are near-zero, thus the relationship is very weak/non-existent. These results collectively suggest a delayed but persistent positive correlation between hydrogen levels (mainly for hydrogen in suspension) and VFA/ TIC, with the Spearman method capturing the overall stronger and more consistent relationship. The increasing trend in correlation with lags suggests a temporal connection between H2 in suspension and the VFA/ TIC ratio in the dataset. While hydrogen production by acidification reactions can in principle be very rapid, especially after hydrolysis of sugars, the decomposition or consumption of acids is highly dependent on the type of acid. For example, propionic acid decomposes very slowly. Consequently, there must be a period when the VFA or VFA/ TIC parameter will not correlate with the concentration of dissolved H2. When individual limiting acid concentrations are exceeded, methanogenic microorganisms are reduced or inhibited, resulting in a further increase in hydrogen concentration.
3.3. Results of BMP Tests
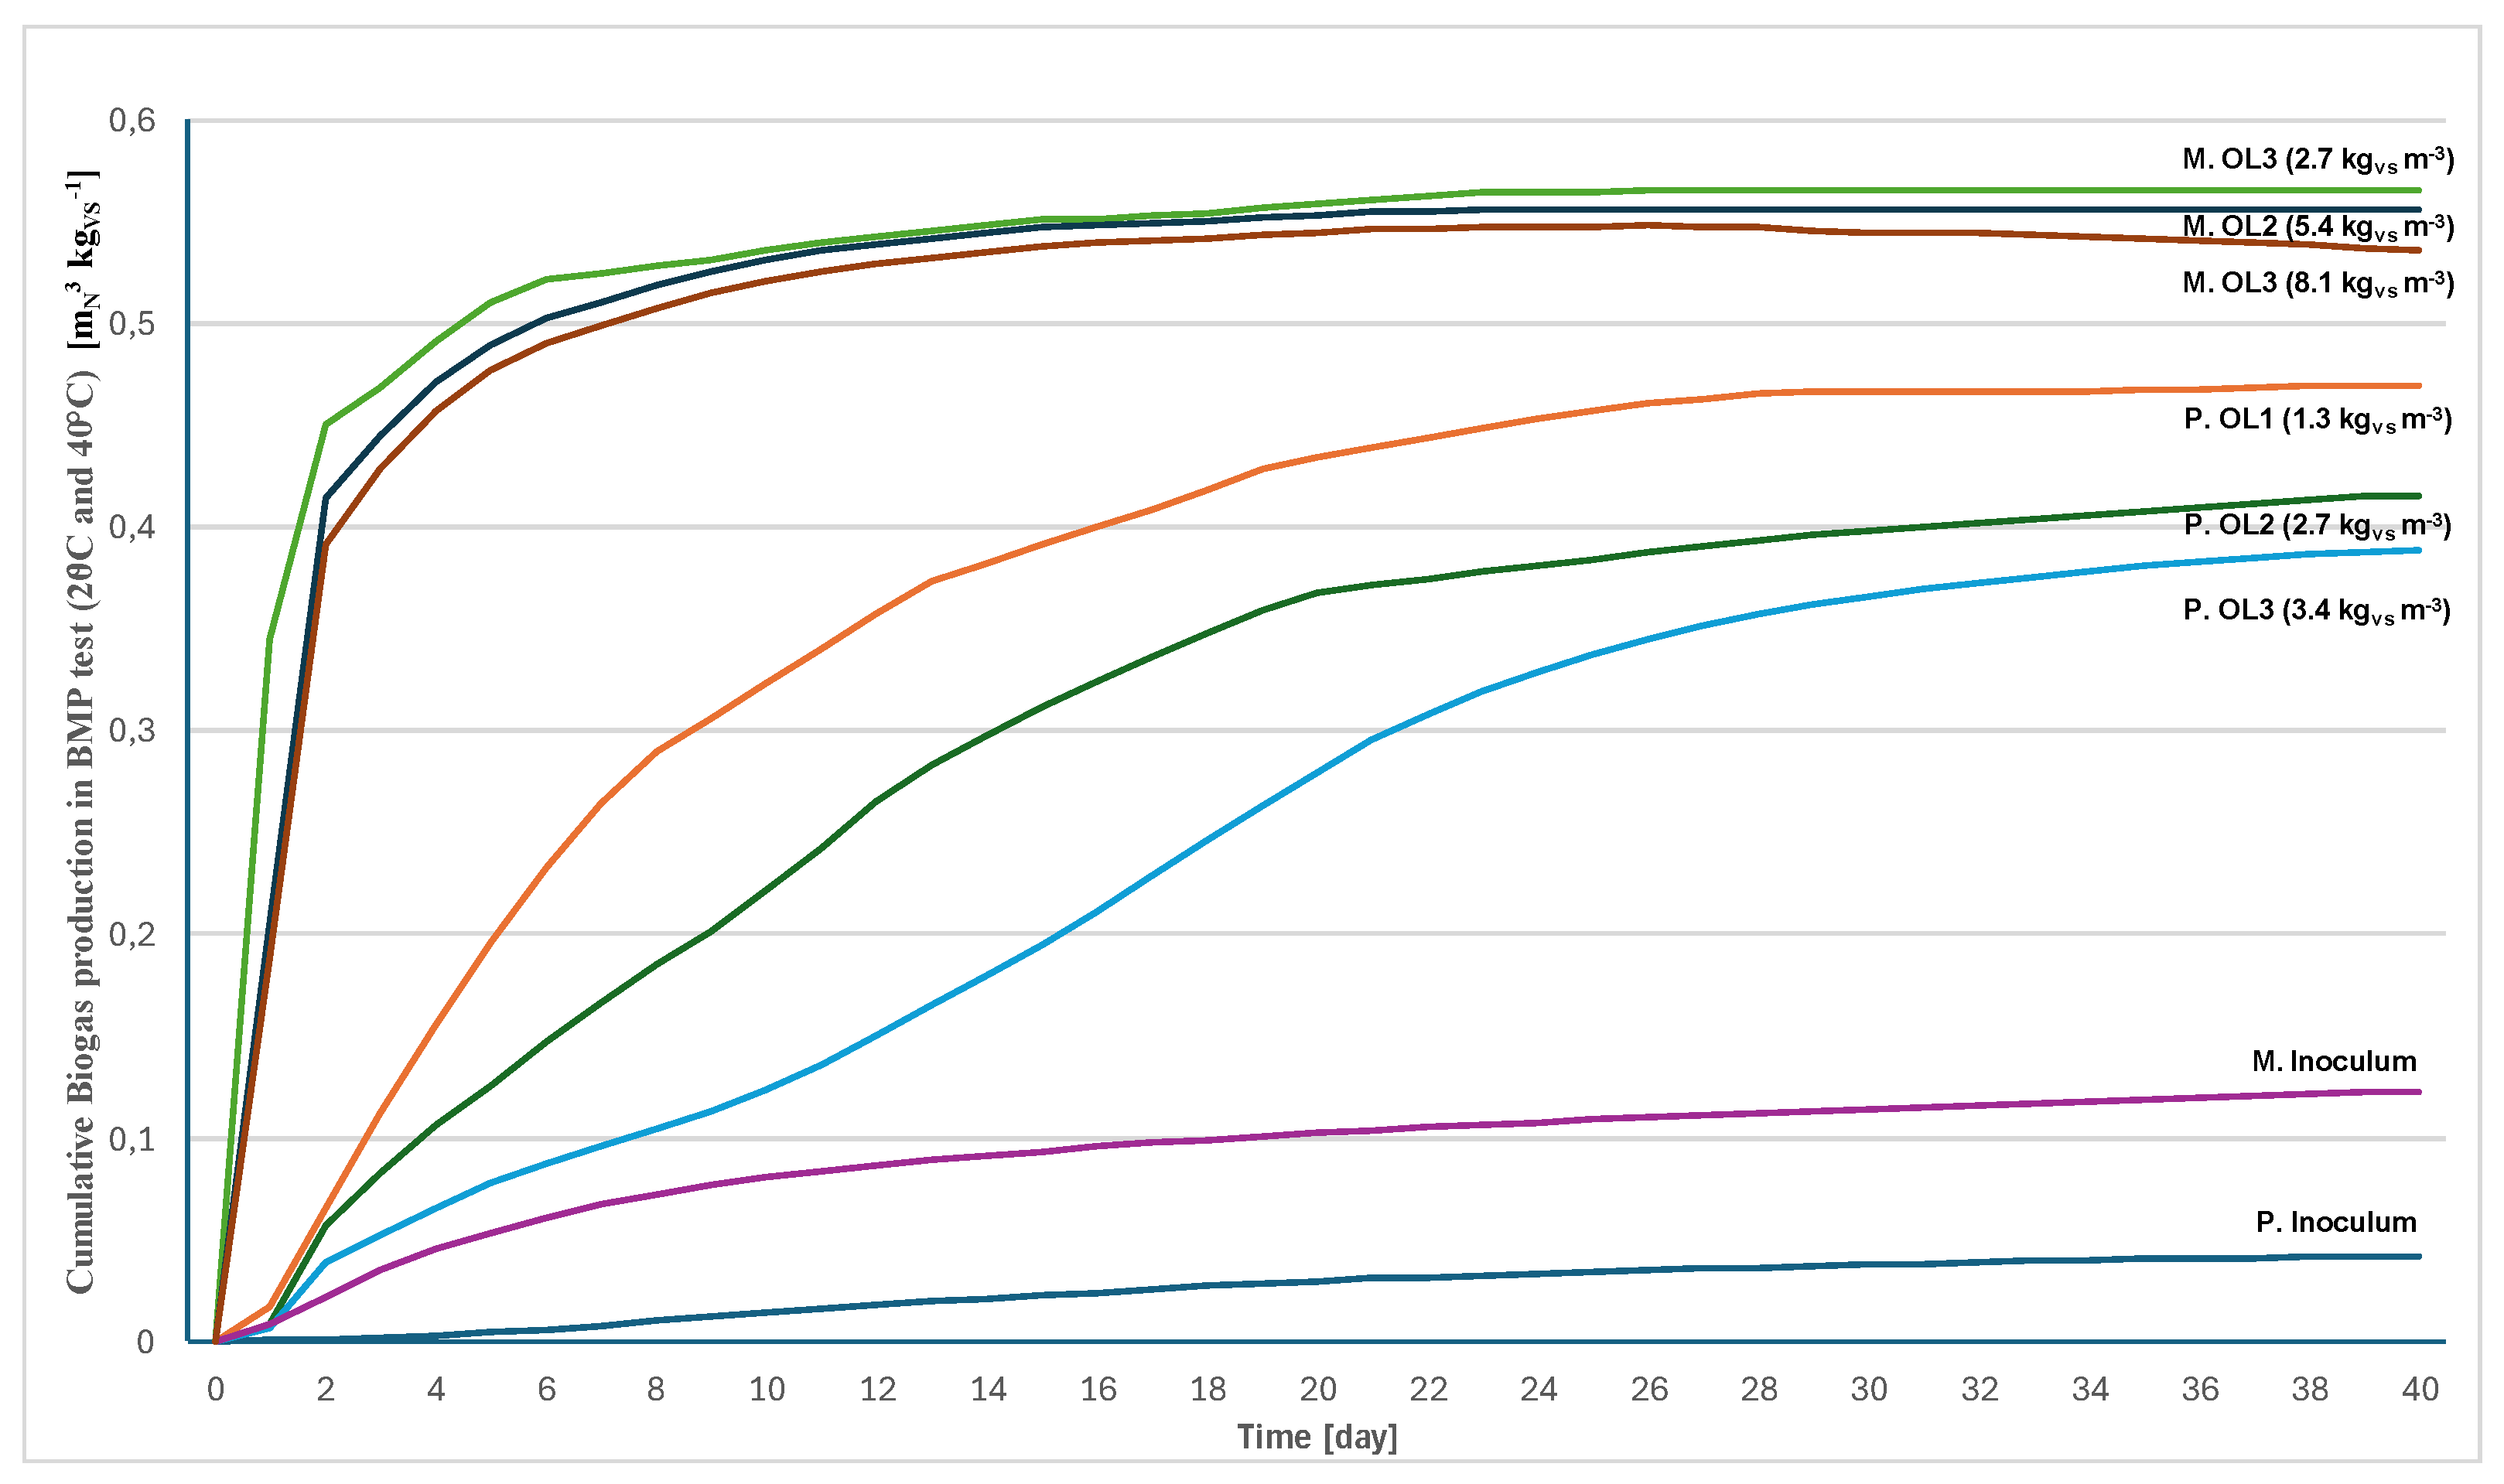
The results of both BMP (batch) tests are summarized in the graph in
Figure 7 and in the
Table 4.
In accordance with general knowledge, both biogas and methane production decreased with increasing load at both temperatures. An infinitesimal load could theoretically give a gas yield of 100%. Psychrophilic conditions made it possible to obtain 74% and 70% of the methane obtainable under mesophilic conditions, respectively, at a load of 2.7 kg and 5.4 kgVS m-3.
The food waste was subjected to a single-phase mesophilic and a two-phase psychrophilic anaerobic digestion to identify the effect of the two-phase process and validate the efficiency of psychrophilic technology in converting food waste. Both digestion methods proved to be exceptionally effective in converting most of the biodegradable material in food waste into biogas. The single-phase mesophilic CSTR reactor demonstrated high performance in methane production. A relatively high concentration of H2S does not significantly affect the performance of the mesophilic reactor, provided that no other inhibitory or synergistic effects occur. On the other hand, the high amount of H2S produced during the process startup appears to be responsible for the increased risk of acidification in the early stages of operation of the psychrophilic two-phase reactor. The system achieves stable digestion and balanced operation within a relatively short period. Despite the limiting effect of low operating temperature, biogas production is not low due to the high hydraulic retention time (HRT) characterizing the two-phase process. Two-phase digestion, even under psychrophilic conditions, is significantly efficient in ensuring a high proportion of volatile organic compounds contained in food waste. The low-temperature two-phase system is much more energy-efficient for processing food waste than the single-phase mesophilic process. Therefore, a two-phase anaerobic digester operating under psychrophilic conditions could be an economically viable option for effectively processing food waste. [
23].
The fact that the psychrophilic process is more suited to a lower load is also evidenced by the lower CH4 content in the biogas (56-58% by volume) versus 60-62% by volume in the mesophile. Psychrophilic hydrolysis and acidogenesis are fast enough to easily overwhelm methanogenesis.
Even at the highest load, the psychrophilic biogas production and CH4 content in the batch test were slightly higher than when using the two-stage bioreactor, but this was apparently mainly due to periods of deliberate overloading of the reactor. It can be said that the data from the batch test and from the reactor agree.
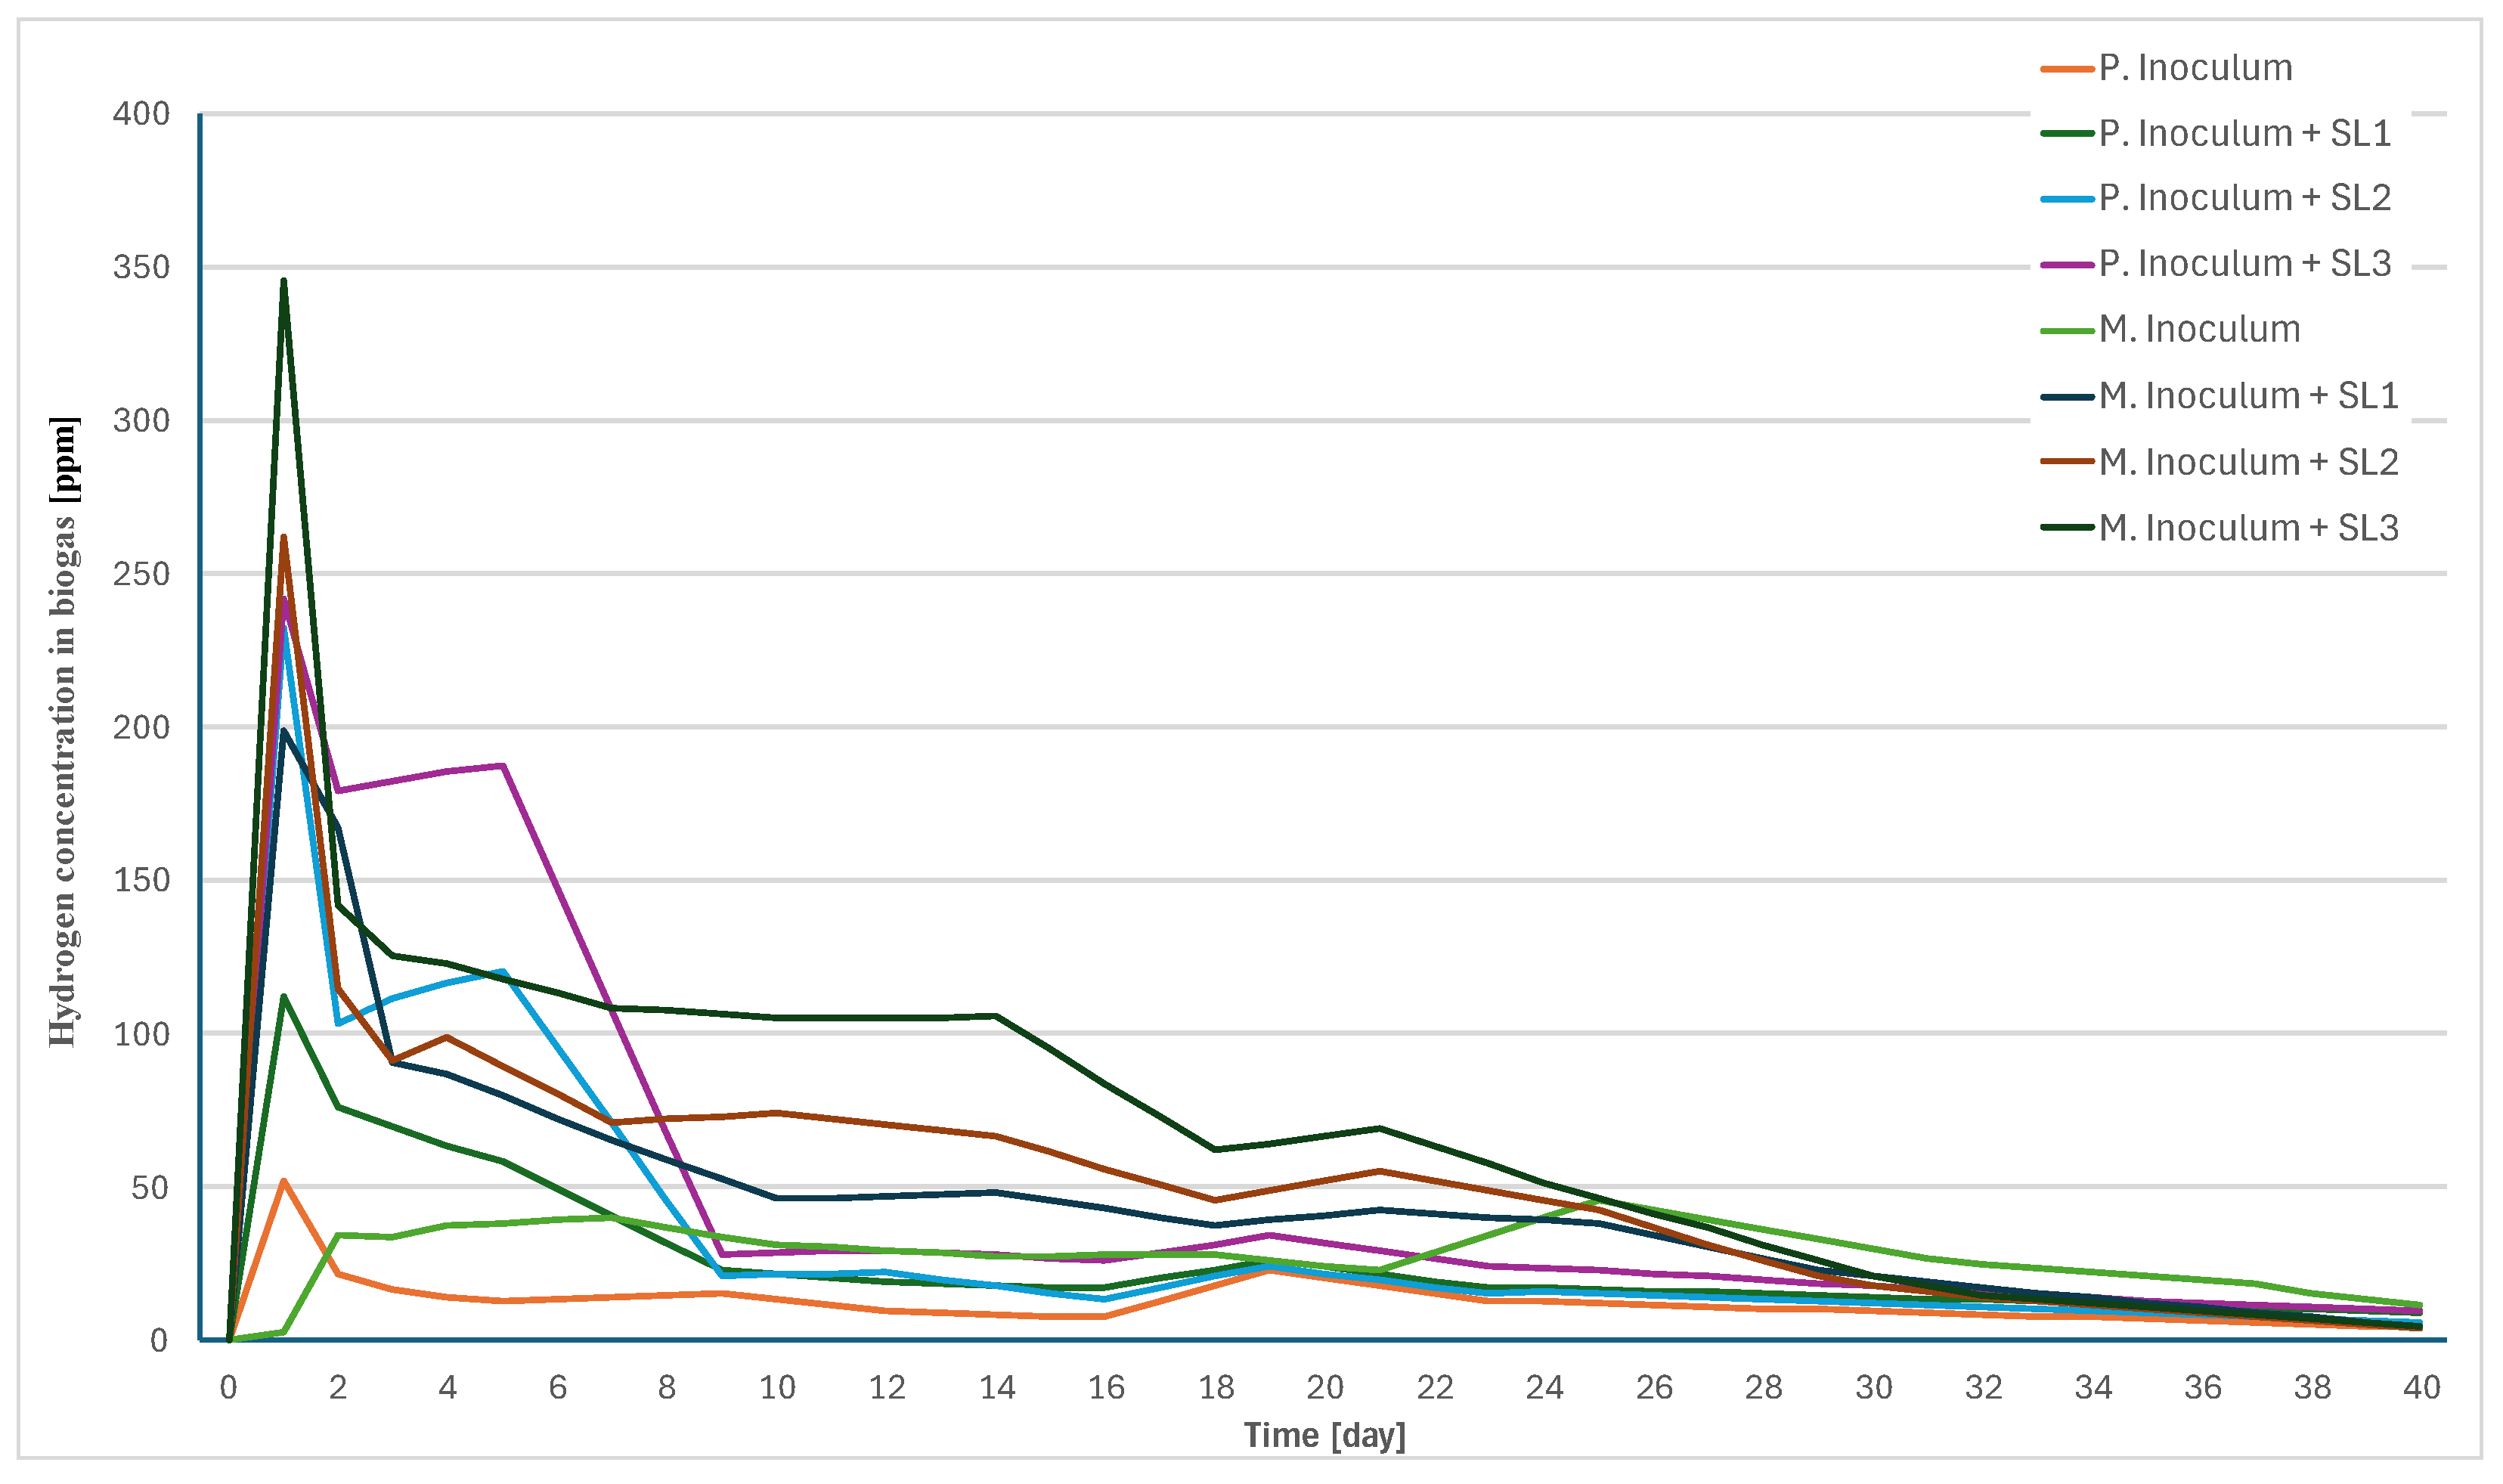
Measurements of the concentration of dissolved hydrogen from the rest of the meals in the psychrophilic conditions of the BMP test showed the production of high peaks only in the first two days of the experiment. This was followed by a significant drop in hydrogen production. At the end of the experiment, production was practically zero. Changes in the concentration of soluble hydrogen are shown in
Figure 8.
From the available literature, it has been verified that after the processing of food leftovers or expired food, the gas yield can be described as follows, see
Table 4. The production of both biogas and methane in the two-stage reactor under discussion does not deviate from the known limits.
Table 4.
Biogas yield in the anaerobic processing of food leftovers.
Table 4.
Biogas yield in the anaerobic processing of food leftovers.
| Substrate |
Total solids
(TS) |
Volatile solids
(VS) |
Biogas yield |
CH4 content |
Source |
| |
% |
% |
Nm3 kg-1
fresh matter |
Nm3 kgVS-1
|
vol. % |
|
| Food residues and expired food |
9 - 37 |
80 - 98 |
0,050 - 0,480 |
0,200 – 0,500 |
45 - 65 |
[24,25] |
| Food residues |
23 |
86 |
0,100 |
0,220 |
n.a. |
[24,25] |
| Food leftovers |
15,59 |
93,65 |
0,0698 |
0,597 |
55,9 |
This study |
| |
|
|
|
|
|
|

